Embed Size (px)
Citation preview

RSC Advances
PAPER
Ope
n A
cces
s A
rtic
le. P
ublis
hed
on 0
1 A
pril
2020
. Dow
nloa
ded
on 4
/5/2
022
8:15
:45
AM
. T
his
artic
le is
lice
nsed
und
er a
Cre
ativ
e C
omm
ons
Attr
ibut
ion-
Non
Com
mer
cial
3.0
Unp
orte
d L
icen
ce.
View Article OnlineView Journal | View Issue
Release kinetics
aDepartment of Chemical Engineering, Univ
Iskandar 32610, Perak, MalaysiabCentre for Contaminant Control and Utiliz
Management, Universiti Teknologi PETRON
Malaysia. E-mail: [email protected] for Biofuel and Biochemical Research
Universiti Teknologi PETRONAS, 32610 Ban
† Electronic supplementary informa10.1039/d0ra01215g
Cite this: RSC Adv., 2020, 10, 13174
Received 8th February 2020Accepted 4th March 2020
DOI: 10.1039/d0ra01215g
rsc.li/rsc-advances
13174 | RSC Adv., 2020, 10, 13174–13
study and anti-corrosionbehaviour of a pH-responsive ionic liquid-loadedhalloysite nanotube-doped epoxy coating†
Jen Yang Yap,a Sarini Mat Yaakob,a Nurul Ekmi Rabat, *b
Muhammad Rashid Shamsuddin c and Zakaria Manb
This study focuses on the release kinetics of inhibitor-loaded nanocontainers and the anti-corrosive
properties of epoxy coatings doped and undoped with the nanocontainers. In this work, 1-butyl-3-
methylimidazolium chloride [Bmim][Cl] was loaded into halloysite nanotubes (HNTs), and the loaded
HNTs were encapsulated with polyethyleneimine (PEI)/polyacrylic acid (PAA) and
poly(diallyldimethylammonium chloride) (PDADMAC)/polyacrylic acid (PAA) to allow controlled release
upon pH stimuli. The polyelectrolyte layer deposition was characterized using zeta potential analysis, and
the release profiles were evaluated in neutral, acidic, and alkaline media. The release kinetics was studied
and found to conform to the Ritger–Peppas and Korsmeyer–Peppas model, and the results proved that
the combination of weak polyelectrolytes (PEI and PAA) provided a good response for up to 50% release
of [Bmim][Cl] in acidic and alkaline media after 72 hours. The loaded HNTs encapsulated with the PEI/
PAA combination were incorporated into an epoxy coating matrix and applied on an X52 steel substrate.
The corrosion resistance of the coated and uncoated substrates was evaluated using electrochemical
impedance spectroscopy (EIS) after immersion in a 3.5 wt% NaCl solution up to 72 hours. An artificial
defect was created on the coating prior to immersion to evaluate the active corrosion inhibition ability.
The coating doped with the smart pH-responsive halloysite nanotubes showed promising results in
corrosion protectiveness even after 72 hours of exposure to a salt solution through EIS and SEM.
Introduction
Protective coatings are generally applied on metallic substratesto prevent direct exposure to weathering and attack from acids,bases, and particulates, which cause corrosion and lead toeconomic loss. These coatings, however, are susceptible tovarious degradation processes; this results in coating failure,where defects in the coatings allow the propagation of corrosionagents on the surface of the metallic structure.1 In practice, thisdamage, especially micron-size cracking, can be challenging todetect and in most cases, repair is almost impossible.2 Inindustrial applications, corrosion inhibitors are applied directlyin the coating matrix to help suppress the corrosion rate, thusprolonging the service life of the coating. However, the directaddition of corrosion inhibitors results in several drawbacks:
ersiti Teknologi PETRONAS, Bandar Seri
ation (CencoU), Institute of Contaminant
AS, Bandar Seri Iskandar, 32610, Perak,
.my
(CBBR), Institute for Sustainable Living,
dar Seri Iskandar, Perak, Malaysia
tion (ESI) available. See DOI:
184
free inhibitors may react with the elements in the coatings,resulting in coating matrix disruption;3 the inhibitors aresusceptible to losses due to washing, which reduces the func-tionality of the corrosion inhibitors; microporous coatings,which allow the corrosion agents to diffuse through, arepotential threats to the environment. One way to prevent thesedrawbacks is by incorporating self-healing ability into a coatingvia the intercalation or encapsulation of a corrosion inhibitor ina micro/nano-scaled container.4
Technological advancement has led to the discovery of manytypes of nanomaterials (nanotubes, nanoribbons, etc.), whichcan act as miniature reactors for chemical interactions, such asCO2 reduction5–7 and CO2 oxidation;8,9 they are efficient nano-containers2,10,11 and present the possibility of surface modi-cation (PEMs,12,13 graing,14 etc.) owing to their large availablesurface areas. Many types of nanocontainers have been exploredby researchers to encapsulate inhibitors, such as carbonnanotubes,15 halloysite nanotubes,4,16 polymeric capsules,17,18
and layered double hydroxides.19 Among these, halloysitenanotubes are one of the most cost-effective because they arefound naturally, inexpensive, and highly abundant nano-structures with a unique hollow lumen structure that is capableof high loading capacity.20 Halloysite nanotubes possessa unique multilayer structure with a chemical formula of
This journal is © The Royal Society of Chemistry 2020
Paper RSC Advances
Ope
n A
cces
s A
rtic
le. P
ublis
hed
on 0
1 A
pril
2020
. Dow
nloa
ded
on 4
/5/2
022
8:15
:45
AM
. T
his
artic
le is
lice
nsed
und
er a
Cre
ativ
e C
omm
ons
Attr
ibut
ion-
Non
Com
mer
cial
3.0
Unp
orte
d L
icen
ce.
View Article Online
Al2Si2O5(OH)4, where the silica layer is on the exterior and thealumina layer is on the interior. Due to the different composi-tions of the exterior and interior of the tubular structure, hal-loysite possesses different surface charges, where the exterior(silica) is negatively charged and the interior (alumina) ispositively charged. With this unique property, HNTs can beloaded with various types of functional compounds possessingdissimilar charges and has been proved to provide prolongedrelease of material. Abdullayev and his coworkers successfullyloaded an azole-type corrosion inhibitor into halloysite nano-tubes; the HNTs were capable of prolonging release up to 20 to50 hours.21 Loading of a functional compound into HNTseffectively avoids direct interaction of the functional compoundwith the coating matrix and external environment while main-taining the coating continuity due to the small size of theHNTs.11
An ionic liquid is a molten salt typically composed entirely ofions that exist in a liquid state below 100 �C.22 It is generallyconsidered to be a green solvent due to advantages such as non-ammable nature, low vapor pressure, and excellent stabilityover a wide range of temperatures; thus, it an excellent corro-sion inhibitor to be used in extreme corrosion conditions.23 Ahighlight of ionic liquid is that it is a “designable” material,where the chemistry of the cation and anion can be altered toachieve desirable properties. Among the family of ionic liquids,imidazolium compounds have been proved to be effectivemixed-type corrosion inhibitors for mild steel due to the pres-ence of –C]N– groups.24 The anion counterpart of imidazoliumILs serves as an electron donating group which transfers itselectrons to the empty d orbitals of iron in mild steel viachemisorption. On the other hand, the positively charged imi-dazolium structure will be attracted towards the negativelycharged steel surface via electrostatic interaction, resulting inphysisorption and formation of a protective monolayer.24,25 Dueto this interaction, imidazolium-based ILs are highly suitablefor inhibition of corrosion in mild steel.26 However, while theionic liquid is considered to be an effective corrosion inhibitor,it has only been explored to be mixed in chemical processstreams such as acidizing treatment and completion uid in theoil and gas industry, acid cleaning, acid descaling, acid etching,and acid pickling.27 Applying these techniques allows the usageof a lower grade of steel and improves cost-effectiveness. Directaddition of ionic liquid can cause undesirable changes tocoating properties; in the case of epoxy resin, the ionic liquidacts as a latent hardener or curing agent, resulting in loss ofcorrosion inhibition functionality.28,29 Loading of ionic liquidsinto nanocontainers unlocks the possibility to incorporate theminto coating formulations, providing active corrosion protec-tion, enhanced mechanical properties, and increased servicelife of the coating.
The release of the loaded corrosion inhibitor can bedesigned based on a desired stimulus, and the release rate canbe tuned accordingly with the modication of PEMs, thusachieving smart release with prolonged storage capability.Polyelectrolyte multilayers (PEMs) with dened characteristicsand tuneable properties can be fabricated via the layer-by-layer(LBL) technique. The LBL technique enables the self-assembled
This journal is © The Royal Society of Chemistry 2020
sequential build-up of polymeric layers via deposition ofcharged polymers alternating between cationic and anioniconto a charged substrate. The deposition through electrostaticattraction can be applied with a wide variety of building blocks,allowing the incorporation of a broad range of functionalunits.30 PEMs have been constructed that possess distinctiveproperties based on their individual polyelectrolytes,30,31
molecular weight,32 salt concentration,33,34 and pH.35 It has alsobeen reported that the ultimate properties of PEMs are highlydependent on the outermost assembled layer.36 PEMs fabri-cated via the LBL technique can be engineered to respond tovarious stimuli, such as pH level, humidity, temperature, andconductivity.37 Incorporation of pH-responsive PEMs enablesthe corrosion inhibitor to be contained without deteriorationand release when triggered by local changes in pH at thecathodic and anodic areas of corrosion initiation. Yu et al.proved that the deposition of polyelectrolyte layers on HNTsloaded with 2-mercaptobenthiazole can result in morecontrolled and sustained release.11
In this research, an imidazolium-based ionic liquid wasloaded into HNTs. 1-Butyl-3-methylimidazolium chloride[Bmim][Cl] was used because it has been proven to be aneffective mixed-type corrosion inhibitor.38 Surface encapsula-tion of the loaded HNTs with polyethyleneimine (PEI), poly-diallyldimethylammonium chloride (PDADMAC), andpolyacrylic acid (PAA) via the LBL technique was conducted toachieve smart release upon pH stimulus. The release was ana-lysed in neutral, acidic, and alkaline mediums to observe theeffects of pH on the release prole. Finally, the corrosion inhi-bition of the synthesized smart pH-responsive halloysite nano-tubes was evaluated aer they were incorporated in an epoxymatrix and coated on a steel substrate.
ExperimentalMaterials
Halloysite nanotubes (HNTs) with a molecular weight of 294.19were purchased from Sigma Aldrich. The corrosion inhibitor(CI) used was 1-butyl-3-methylimidazolium chloride [[Bmim][Cl]] 98% from Acros Organic. Hydrochloric acid, 37%, andsodium hydroxide ACS reagent pellets, $97%, were obtainedfrom Sigma Aldrich. Polyethylenimine (PEI) with Mw � 25 000by LS and an averageMn� 10 000 by GPC, polyacrylic acid (PAA)with average Mw � 1800, and poly(diallyldimethylammoniumchloride) (PDADMAC, 35 wt%) in H2O with Mw < 100 000 werepurchased from Sigma Aldrich and were used as surfaceencapsulation materials for the HNTs. The coating materialsused were Epolam 2015 resin (bisphenol-A-epichlorohydrin, MV< 700) and Epolam 2014 hardener. All materials were usedwithout further purication.
Loading of [Bmim][Cl] into HNTs
As shown in Scheme 1, 1-butyl-3-methylimidazolium chloride[Bmim][Cl] solution was prepared by a adding minimal amountof water to [Bmim][Cl] (1 : 12 in wt%) to create a saturatedsolution. Halloysite nanotubes (HNTs) were added to the
RSC Adv., 2020, 10, 13174–13184 | 13175

Scheme 1 Schematic of (a and b) the loading process of [Bmim][Cl] into the HNTs and (c–e) polyelectrolyte deposition via the LBL technique.
RSC Advances Paper
Ope
n A
cces
s A
rtic
le. P
ublis
hed
on 0
1 A
pril
2020
. Dow
nloa
ded
on 4
/5/2
022
8:15
:45
AM
. T
his
artic
le is
lice
nsed
und
er a
Cre
ativ
e C
omm
ons
Attr
ibut
ion-
Non
Com
mer
cial
3.0
Unp
orte
d L
icen
ce.
View Article Online
solution and subjected to sonication for 30 minutes. The solu-tion was transferred to a vacuum jar to be subjected to vacuumconditions for 6 hours. The solution was reverted to atmo-spheric pressure aer every hour up to 6 cycles. Finally, themixture was centrifuged at 5000 rpm for 5minutes, washed withwater and dried in an oven at 50 �C.
Characterization of HNT–[Bmim][Cl]
The surface morphology and inner lumen of the halloysitenanotubes (HNTs) were analyzed via eld emission scanningelectron microscope (FESEM 55VP, Zeiss supra) and trans-mission electron microscope (Zeiss Libra 200). Structural anal-ysis of HNT was conrmed using Fourier transform infrared(FTIR) spectroscopy (Spectrum One, PerkinElmer). The loadingefficiency of the corrosion inhibitor in the HNTs was charac-terized using a thermogravimetric analyzer (TGA) from 0 �C to600 �C at 10 �C min�1 under nitrogen atmosphere (STA 6000from PerkinElmer).
Surface encapsulation of HNT–[Bmim][Cl]
Polyethyleneimine (PEI), polydiallyldimethylammonium chlo-ride (PDADMAC) and polyacrylic acid (PAA) solutions wereprepared at 5 mg ml�1 concentration in 0.5 M aqueous NaCl.HNT–[Bmim][Cl] was mixed with a polycation, either PEI orPDADMAC solution, and the incubation time was 10 minutes.Each mixture was then subjected to centrifugation at 3000 rpmto separate the nanoparticles from the polyelectrolyte solution.The resulting nanoparticles were washed with water to removethe unreacted polyelectrolyte molecules. The process wasrepeated with PAA for subsequent layer deposition.
Release kinetics study
The release kinetics of HNT–[Bmim][Cl] was measured via UV-Vis spectroscopy (UV-1800 Shimadzu Scientic Instruments).25 mg of sample were suspended in 100 ml of water adjusted toa pH value of 4.0, 7.0, or 10 using 1 M HCl and NaOH. Thesuspension of water and HNT–[Bmim][Cl] was constantly stir-red with a magnetic stirrer at 360 rpm to achieve equilibrium ofthe mixture. 2 ml of the suspension was collected at several
13176 | RSC Adv., 2020, 10, 13174–13184
intervals up to 72 hours and replaced with the same volume ofdistilled solution. The collected samples were analyzed by UV-Vis spectroscopy by monitoring the absorption peak at211 nm to determine the amount of [Bmim][Cl] released.Finally, the samples were subjected to sonication for 30minutesto achieve total release of the loaded content and weremeasured.
The release proles of all the samples were tted using theRitger–Peppas and Korsmeyer–Peppas model (power law)39 witha modication of the initial drug release (burst effect) proposedby Kim and Fassihi:40
f1 ¼ Mi
MN
¼ Ktn þ b (1)
where f1 represents the released amount of loaded content, MN
represents the amount of loaded content at equilibrium, Mi
represents the released amount of loaded content at time t, andK represents the release rate constant, taking into considerationthe structural modication; the geometrical characteristic nrepresents the exponent of release, indicating the releasemechanism, and b represents the burst effect.
Corrosion studies
Preparation of substrates for corrosion tests. X52 mild steelswere used for electrochemical impedance spectroscopy (EIS).Epoxy-moulded rectangular steel samples with a single sidesurface area of 6 cm2 were prepared. Prior to the conductingtests, surface nishing was performed on the steel samples bymechanical grinding with silicon carbide (SiC) paper withgrades of 80, 100, 320, 600 and 1000 to ensure even surfaces andlack of corrosion products. The steel samples were then rinsedwith water, degreased with acetone and nally air-dried. Epoxyresin and hardener were mixed in 100 : 32 ratios, stirred welland subjected to vacuum conditions for up to 30 minutes toeliminate bubbles prior to coating the steel surface. 3 differentsamples were prepared: bare steel (referred to as BS), steelcoated with epoxy (referred to as SE) and steel coated with epoxywith the addition of 5 wt% HNT–[Bmim][Cl] (PEI, PAA) selectedfrom the release kinetics study (referred to as SH).
This journal is © The Royal Society of Chemistry 2020

Fig. 2 TGA analysis of blank HNTs, [Bmim][Cl] and HNT–[Bmim][Cl].
Paper RSC Advances
Ope
n A
cces
s A
rtic
le. P
ublis
hed
on 0
1 A
pril
2020
. Dow
nloa
ded
on 4
/5/2
022
8:15
:45
AM
. T
his
artic
le is
lice
nsed
und
er a
Cre
ativ
e C
omm
ons
Attr
ibut
ion-
Non
Com
mer
cial
3.0
Unp
orte
d L
icen
ce.
View Article Online
Electrochemical impedance spectroscopy (EIS). The corro-sion mitigation performance was evaluated using electro-chemical impedance spectroscopy (EIS) (WonaTech WEIS510).The test was conducted over a frequency range of 100 kHz to0.01 Hz using an AC signal of 10 mV amplitude in a conven-tional three-electrode electrochemical cell which includeda counter electrode made of graphite, a reference electrode ofAg/AgCl with saturated KCl aqueous solution, and the steelsample as the working electrode. Prior to the initiation of theEIS test, an articial defect with a length of 0.5 cm was createdon the SE and SH samples with a cutter. The test was performedat room temperature, and EIS readings were obtained aer 1,24, and 72 hours of immersion in 3.5 wt% NaCl solution.Scanning electron microscope (SEM) (ZEISS EVO LS15) andenergy dispersive X-ray spectroscopy (EDS) analysis were con-ducted on the SE and SH samples before and aer immersion insalt solution at the articial defect area to observe changes.
Results and discussionBlank HNTs characterization
The structural morphology and transmission electron micros-copy (TEM) images of the blank HNTs are shown in Fig. 1. TheHNTs are composed of bilayers of aluminosilicates witha tubular structure. The outer diameters of the HNTs rangedfrom 60 to 112 nm, the inner diameters ranged from 15 to18 nm and the lengths ranged from 393.7 to 814.3 nm. Thediameter of the HNTs was in the overall diameter range sug-gested by Abdullayev and Lvov,10 which varies between 50 and200 nm, the inner diameter was within the suggested lumensize range of 10–50 nm, and the length was slightly shorter thanthe suggested overall length range of 0.5–2 microns.
Loading efficiency of [Bmim][Cl] into the HNTs
HNTs possess surface charges; therefore, water with a highdielectric constant can stabilize the solution and aid the loadingof charged molecules onto the HNTs.20 Slight zzling of bubblescould be observed immediately aer the solution was subjectedto vacuum conditions, which indicates that the air trappedwithin the HNTs was evacuated. The solution was subjected toseveral cycles of changes in pressure from vacuum conditionsback to atmospheric pressure to ensure that the solution entersthe HNTs and partial crystallization of the [Bmim][Cl] can takeplace.10 The thermogravimetry analysis (TGA) results of theblank HNTs, [Bmim][Cl], and HNT–[Bmim][Cl] were obtainedand are shown in Fig. 2. From the gure, it can be identied that
Fig. 1 FESEM and TEM images of the blank HNTs.
This journal is © The Royal Society of Chemistry 2020
decomposition of the blank HNTs occurred around 400 �C to550 �C. The decomposition of [Bmim][Cl], on the other hand,occurred between 231.25 �C and 321.85 �C; this was proved inref. 41 to begin at 240.3 �C and end at around 317.4 �C. Theinitial drop of pure [Bmim][Cl] from 0 �C to 100 �C may be dueto evaporation of water, mainly due to the hygroscopic nature of[Bmim][Cl], which tends to absorb moisture from thesurrounding environment. From the results of HNT–[Bmim][Cl], the presence of the rst drop which occurred at around25 �C to 100 �C indicated weight loss due to water content. Thesecond drop may be due to the decomposition of [Bmim][Cl],which occurred in the range of 231.25–321.85 �C. The loadingefficiency obtained was 13.40%. The loading efficiency of[Bmim][Cl] was slightly lower compared to the loading of ben-zotriazole as reported by Yi He and her coworkers, which was22.6%;16 however, it falls within the range described by Abdul-layev and Lvov.10
Chemical structure conrmation
The FTIR spectra of the three different samples, includingHNTs, [Bmim][Cl], and HNT–[Bmim][Cl], are illustrated inFig. 3. In the FTIR spectrum of the HNTs, peaks at 3696.29 cm�1
Fig. 3 FTIR spectra of the HNTs, [Bmim][Cl], and HNT–[Bmim][Cl].
RSC Adv., 2020, 10, 13174–13184 | 13177

RSC Advances Paper
Ope
n A
cces
s A
rtic
le. P
ublis
hed
on 0
1 A
pril
2020
. Dow
nloa
ded
on 4
/5/2
022
8:15
:45
AM
. T
his
artic
le is
lice
nsed
und
er a
Cre
ativ
e C
omm
ons
Attr
ibut
ion-
Non
Com
mer
cial
3.0
Unp
orte
d L
icen
ce.
View Article Online
and 3618.93 cm�1, which signify hydroxyl vibration, were clearlyobserved. The asymmetrical stretch vibration absorption of Si–O–Si can be attributed to the presence of a peak at1017.90 cm�1.42 The peak at 909.85 cm�1 accounts for the Al–OH bending band. In terms of the [Bmim][Cl] FTIR spectrum,the peaks at 2965.47 cm�1 and 2870.20 cm�1 represent thealiphatic asymmetric and symmetric C–H stretching of themethyl group.41 A small but broad characteristic peak around3300 to 3500 cm�1 may be related to the formation ofa quaternary amine salt with chlorine. The peak at 1562.02 cm�1
indicates C]C stretching. Peaks ranging from 628.52 to1562.02 cm�1 represent the stretching of C–C and C–N bonds.Aer loading [Bmim][Cl] into the HNTs, all the characteristicpeaks of blank HNTs, such as 3696.29 cm�1, 3618.93 cm�1 and1017.90 cm�1, and the characteristic peaks of [Bmim][Cl], suchas 2965.47 cm�1, 2870.20 cm�1 and 3300 to 3500 cm�1, can beseen clearly. This phenomenon conrms the existence of bothHNTs and [Bmim][Cl], and the loading process occurred viaphysical diffusion without involving chemical bonding.
Conrmation of surface encapsulation
The polyelectrolyte multilayer encapsulation was performedusing the layer-by-layer (LBL) electrostatic assembly technique.Hence, to conrm the deposition of layers, zeta potential anal-ysis was performed because this technique allows determina-tion of electrical charges on the surface, enabling themonitoring of stepwise growth of the PEMs.43 Table 1 depictsthe zeta potentials of blank HNTs and HNTs aer deposition oftwo weak polyelectrolyte layers (polyethyleneimine/polyacrylicacid) and strong/weak polyelectrolyte layers (poly-diallyldimethylammonium chloride/polyacrylic acid). The hal-loysite nanotubes possessed an initial charge of �32.4 mV. InPEM formation, the deposition of polyelectrolyte will alwaysresult in neutralization of the surface charge of the outermostlayer, while the overcompensation of charge becomes thedriving force for subsequent deposition of the alternatingpolyelectrolyte.30,44 The zeta potential reversed to �11.39 mVaer deposition of the second PAA layer. These zeta potentialvalues were similar to results reported by Abdullayev and hiscoworkers, who observed a range from +15 to 32 mV for the rstlayer of PEI deposition but a slightly lower range for the PAAlayer of around �15 to �30 mV.12 Aer deposition of the strongpolycation PDADMAC onto the HNTs, it was observed that theinitial surface charge of the HNTs of �32.46 mV was reversedand reached 33.30 mV. Further deposition of a PAA layerreversed the charge to �15.56 mV. All these results showed
Table 1 Zeta potentials of layer-by-layer deposition on the HNTs
Sample Zeta potential (mV)
Blank HNTs �32.47HNT–[Bmim][Cl] (PEI) +28.93HNT–[Bmim][Cl] (PEI, PAA) �11.39HNT–[Bmim][Cl] (PDA) +33.30HNT–[Bmim][Cl] (PDA, PAA) �15.57
13178 | RSC Adv., 2020, 10, 13174–13184
successful deposition of the polyelectrolyte layer for neutrali-zation and that overcompensation of the surface chargeoccurred aer each layer deposition, as indicated by the positiveand negative zeta potential values.
Release prole of [Bmim][Cl]
The release proles of [Bmim][Cl] in acidic (pH 4), neutral (pH7) and alkaline (pH 10) mediums from unencapsulated HNT–[Bmim][Cl] are displayed in Fig. 4. From (Fig. 4), it can beobserved that the initial release of 50–55% occurred within therst 10 minutes for all three mediums. Xing et al. reported thesame situation, where complete release occurred withinseconds due to the fast dissolution of loaded content stored onthe surface and within the HNTs.31,45. Aer 72 hours, the ulti-mate release of all three mediums was achieved between 80%and 90% in neutral (86.50%), pH 4 (83.18%) and pH 10 (89.59%)mediums. The ultimate release of [Bmim][Cl] in alkalinemedium is slightly higher compared to the other two mediums;this is mainly because the surface charges of the exterior arenegatively charged above pH 1.5, while the interior has a posi-tive charge of up to pH 8.5.10 When exposed to alkaline medium,an abundance of OH� ion neutralizes the interior surfacecharge, which can affect the release rate of the [Bmim][Cl]adsorbed on the surface of the HNTs. This phenomenon,however, increases the release only slightly compared to neutralmedium and acidic medium, mainly due to the small andnegligible amount of [Bmim][Cl] that remained adsorbed on theinterior surface of the HNTs aer 72 hours.
In this research, planar thin lms are assumed because theHNTs possess openings at both ends of the tubes, while theradial surface is impenetrable. The Ritger–Peppas and Kors-meyer–Peppas model adequately describes the mass transportphenomena of a porous polymer system containing activecompounds. In this research, the polyelectrolyte layer formsa hydrophilic slab; exposure of the PEMs to water causes severalchanges, including changes in mobility and relaxation ofmacromolecular chains, leading to changes in the shape andsize of the pore distribution.
Fig. 4 The release profile of [Bmim][Cl] from unencapsulated HNT–[Bmim][Cl] subjected to neutral, acidic and alkaline medium for up to72 hours (black squares represent neutral medium, red trianglesrepresent pH 4medium, and blue diamonds represent pH 10medium).
This journal is © The Royal Society of Chemistry 2020

Table 2 Parameters of the curves fitted with the Ritger–Peppas andKorsmeyer–Peppasmodel (power law), where n represents the releaseexponent (release mechanism) and k represents the release rateconstant
Sample Exposed medium n k R2
HNT–[Bmim][Cl] Neutral 0.74 1.39 0.9863HNT–[Bmim][Cl] pH 4 0.61 2.15 0.9718HNT–[Bmim][Cl] pH 10 0.78 1.24 0.9827HNT–[Bmim][Cl] (PEI) Neutral 0.42 6.01 0.9463HNT–[Bmim][Cl] (PEI) pH 4 0.64 5.72 0.9956HNT–[Bmim][Cl] (PEI) pH 10 0.34 5.09 0.9481HNT–[Bmim][Cl] (PEI, PAA) Neutral 0.57 1.28 0.9572HNT–[Bmim][Cl] (PEI, PAA) pH 4 0.42 6.23 0.9290HNT–[Bmim][Cl] (PEI, PAA) pH 10 0.48 5.95 0.9895HNT–[Bmim][Cl] (PDA) Neutral 0.52 3.89 0.9901HNT–[Bmim][Cl] (PDA) pH 4 0.43 4.15 0.9767HNT–[Bmim][Cl] (PDA) pH 10 0.43 5.97 0.9787HNT–[Bmim][Cl] (PDA, PAA) Neutral 1.06 0.18 0.9940HNT–[Bmim][Cl] (PDA, PAA) pH 4 0.44 1.94 0.9527HNT–[Bmim][Cl] (PDA, PAA) pH 10 0.48 1.54 0.9596
Paper RSC Advances
Ope
n A
cces
s A
rtic
le. P
ublis
hed
on 0
1 A
pril
2020
. Dow
nloa
ded
on 4
/5/2
022
8:15
:45
AM
. T
his
artic
le is
lice
nsed
und
er a
Cre
ativ
e C
omm
ons
Attr
ibut
ion-
Non
Com
mer
cial
3.0
Unp
orte
d L
icen
ce.
View Article Online
The tted curves and the corresponding parameters aredisplayed in Fig. 5 and Table 2. The release of [Bmim][Cl] with n< 0.5 indicates that the release was controlled by its low diffu-sivity in the polyelectrolyte layer as the inner content swells.From Table 2, most of the samples fall within this category,mainly because the encapsulation restricted the release of[Bmim][Cl]. The release exponent of n ¼ 0.5 indicates Fickiandiffusion (Case I), where the release of inner content is governedby diffusion across the concentration gradient. The releaseexponent within the range of 0.5 < n < 1 indicates that therelease of [Bmim][Cl] is controlled by the viscoelasticity of therelaxation of polyelectrolyte layers during solvent penetration,causing the anomalous time-dependent effect. Lastly, n ¼ 1indicates that the release follows zero-order kinetics, in whichthe [Bmim][Cl] was released at a constant rate.
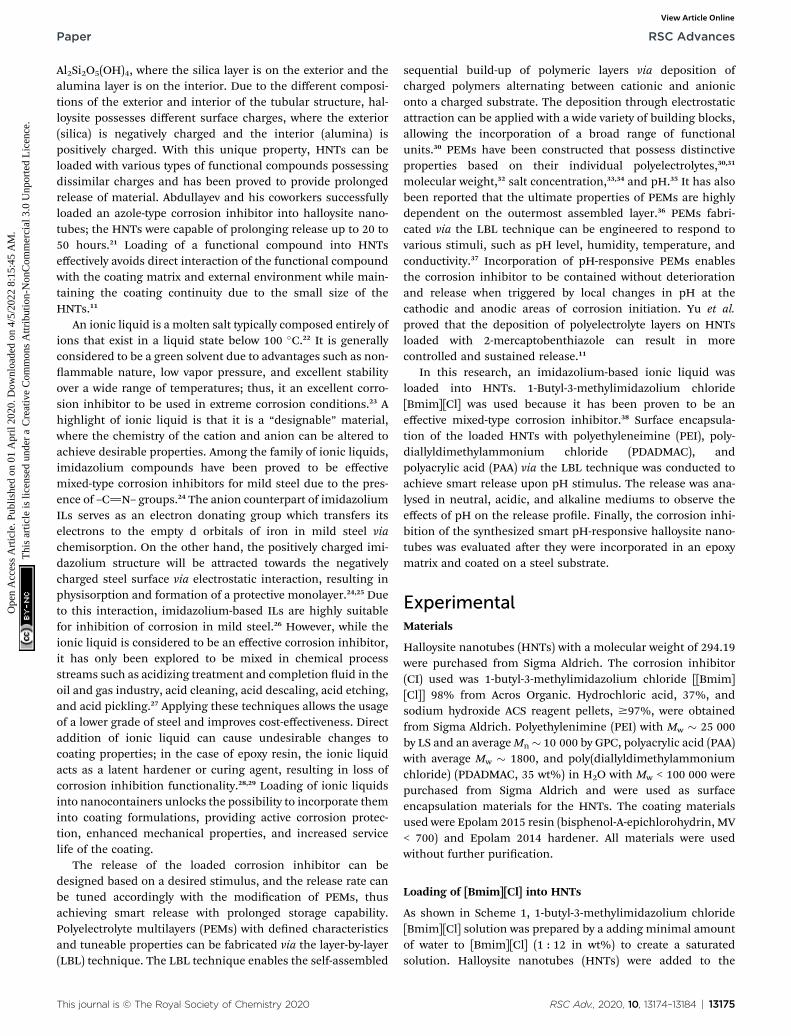
In the HNT–[Bmim][Cl] (PEI) sample, PEI is a weak acid;therefore, pH changes signicantly affect the porosity of thelayer. PEI is an attractive cationic polyelectrolyte that is oenused for nanoparticle engineering because of its weak-basebuffering properties.46 In acidic medium, PEI has greater posi-tive charge density owing to the excess H+ ion protonating thesecondary and tertiary amines in the backbone.47 The highlycharged PEI displays high intrachain repulsion, resulting inmore linear backbone extension.46 When the HNTs encapsu-lated with PEI were exposed to acidic medium, the highlycharged PEI with more linear expansion resulted in a moreporous polycationic layer, thus allowing the [Bmim][Cl] withsmall molecular size to escape. This phenomenon can beobserved by the change in the release exponent from 0.42 in
Fig. 5 The release profiles of [Bmim][Cl] from (a) HNT–[Bmim][Cl] (PEI), ([Bmim][Cl] (PDA, PAA) subjected to neutral, acidic and alkaline medium forepresent pH 4 medium, and blue squares represent pH 10 medium).
This journal is © The Royal Society of Chemistry 2020
neutral medium to 0.64 in the acidic medium of HNT–[Bmim][Cl] (PEI). In alkaline medium, PEI experiences deprotonationdue to the lack of H+ ions and loses charge, resulting in lowintrachain repulsion; this eventually causes aggregation. Theshrinkage of PEI can reduce the permeation of loaded content,resulting in an even smaller release exponent of 0.34. Thedifference in the release mechanism resulted in very differentultimate releases of 43.10% (neutral), 95.99% (pH 4), and
b) HNT–[Bmim][Cl] (PEI, PAA), (c) HNT–[Bmim][Cl] (PDA), and (d) HNT–r up to 72 hours (black circles represent neutral medium, red triangles
RSC Adv., 2020, 10, 13174–13184 | 13179

RSC Advances Paper
Ope
n A
cces
s A
rtic
le. P
ublis
hed
on 0
1 A
pril
2020
. Dow
nloa
ded
on 4
/5/2
022
8:15
:45
AM
. T
his
artic
le is
lice
nsed
und
er a
Cre
ativ
e C
omm
ons
Attr
ibut
ion-
Non
Com
mer
cial
3.0
Unp
orte
d L
icen
ce.
View Article Online
30.15% (pH 10) aer 72 hours, although the release rateconstants for all three conditions are similar. With the additionof the PAA layer to the HNT–[Bmim][Cl] (PEI, PAA) sample, theresponsiveness of its release in both acidic and alkalinemediums is more pronounced. PAA is a weak polyanion withincreasing charge at an elevated pH level. When the pH drops,PAA tends to shrink and prevent PEI from further expansion,restricting the pathway for the loaded content to pass through.On the other hand, PAA is highly charged, resulting in a morelinear expansion in the alkaline medium. PAA also possessesunique characteristics of capacity to absorb water.48 Whenexposed to alkaline medium, the PAA layers swell due to thehighly charged linear expansion and absorption of water. Thisphenomenon causes Fickian diffusion of [Bmim][Cl] in neutralmedium, with an n value equal to 0.57; here, the partiallycharged PEI and PAA act as porous watery shells that enablediffusion based on concentration. Subjecting the material toacidic and alkaline medium causes the release exponent to fallbelow 0.5. However, the release rate constants in acidic mediumand alkaline medium differ considerably from that in neutralmedium, namely 6.23 (pH 4), 5.95 (pH 10) and 1.28 (neutral);this is directly reected in the actual ultimate releases of 14.74%(neutral), 40.66% (pH 4) and 53.27% (pH 10).
On the other hand, the strong/weak combination of PDAD-MAC and PAA, in which PDADMAC is a strong polycation, willshow a lower response to pH changes.31 The deposition ofa single layer of PDADMAC in the HNT–[Bmim][Cl] (PDA)sample showed a release exponent of 0.52; this exhibits releasenear to Fickian diffusion, where the release depends on theconcentration gradient. Exposure to both acidic and alkalinemedium changes the release mechanism to 0.43, which exhibitsrestricted release, while the inner content swells with solventpenetration. The ultimate release of HNT–[Bmim][Cl] (PDA)reached 42.70% (neutral), 30.89% (pH 4) and 42.86% (pH 10).The addition of another layer of PAA further restricts the releaseof [Bmim][Cl]. This effect can be seen in HNT–[Bmim][Cl] (PDA,PAA) subjected to neutral medium, where the release exponentwas 1.06 but the release rate constant was only 0.18. Theencapsulation of PDADMAC and PAA creates a porous wateryouter shell caused by high association of water molecules withthe carboxylate groups; this allows constant rate diffusion buta signicantly low release rate due to restriction by the organicenvironment of PDADMAC, which does not favour water.31
When subjected to acidic medium, the restriction increases asthe PAA layer loses charge and shrinks, resulting in a releaseexponent of only 0.44. In alkaline medium, the PAA layer swells,causing the release to be near to Fickian diffusion. All threemediums afforded similar ultimate releases of 16.65%(neutral), 18.60% (pH 4) and 15.07% (pH 10) at 72 hours.
Corrosion initiation or an incoming external solution cancause pH changes to affect the stability of a complex, triggeringrelease of the inner content.49 To develop an effective smartresponsive nanocontainer containing a corrosion inhibitor, thePEMs should be tuned to release when triggered by pH changeswhile remaining stable in neutral medium. From the releasekinetics of the samples, it can be observed that the weak poly-electrolyte displayed high response towards pH changes, while
13180 | RSC Adv., 2020, 10, 13174–13184
the strong polyelectrolyte retained its stability throughout thepH variation. Responsiveness towards either acidic or alkalinemedium is highly dependent on the types of polyelectrolytesdeposited and their conguration. This effect can be seenclearly in the HNT–[Bmim][Cl] (PEI) sample, where the loadedHNTs were deposited with single layer PEI. Due to the nature ofPEI, the release responsiveness of the layer favoured acidicmedium while providing a lower release rate in alkalinemedium. The HNT–[Bmim][Cl] (PEI, PAA) sample appears to bean excellent candidate as an effective smart-responsive nano-container because it can respond to both acidic and alkalimediums; it was selected for evaluation of its anti-corrosionperformance.
Electrochemical impedance spectroscopy (EIS)
To evaluate the anticorrosion behavior of the selected SHparticles, electrochemical impedance spectroscopy (EIS) wasconducted on steel with and without the presence of HNT–[Bmim][Cl] (PEI, PAA). The obtained data for all the sampleswere tted using several different equivalent circuit models(ECMs), as shown in Fig. 6.
For the bare steel (BS) sample, a simple Randles circuit ofR(QR) was employed which involves the resistance of the solu-tion (Rs), double layer capacitance (Qdl) and charge transferresistance (Rct). The Nyquist diagram did not show the perfectsemicircle of a pure capacitor, which can be attributed to tworeasons: frequency dispersion due to interfacial porosity orroughness and the kinetic dispersion effect.50,51 Hence, tomodel the imperfect capacitor, the constant phase element (Q)was preferred. The impedance of the constant phase elementcan be computed from the formula below:
ZCPE ¼ 1
CðiuÞn (2)
where C indicates the capacitance, u indicates the frequency,and n indicates the frequency dispersion parameter resultingfrom the surface morphology of the electrode.
For steel coated with bare epoxy (SE) and epoxy with theaddition of smart pH-responsive halloysite nanotubes loadedwith the [Bmim][Cl] (SH) sample, a Randles circuit ECM ofR(R(QR)Q) was used to t the data, as shown in Fig. 6. In thehigh-frequency range, the electric current was distributeduniformly throughout the coating area, presenting as a semi-circle tted with a parallel circuit (Rpore, Qcoat), corresponding tothe pore resistance and dielectric behavior of the coating. Whenthe frequency range moves to the lower range, the electricalcurrent is focused at the active corrosion site, which occurswhere the articial defect was created. This phenomenon wastted with another parallel circuit of (Rct, Qdl) in series withRpore, corresponding to charge transfer resistance and doublelayer capacitance, respectively (Fig. 6).
From the analysis of the Nyquist plot as shown in Fig. 7 andTable 3, the bare steel (BS) sample showed an increasing trendin Rct from 129.78 U cm�2 at the 1st hour of exposure to 201.07Ucm�2 aer 72 hours of exposure owing to the formation ofstable oxide lms as a result of corrosion, which offers slight
This journal is © The Royal Society of Chemistry 2020

Fig. 6 (A) Simple randles circuit (R(RQ)) for the BS sample; (B) Randles circuit (R(R(RQ)Q)) for the SE and SH samples.
Fig. 7 Nyquist plots for the SE and SH samples after (A) 1 h, (B) 24 h, and (C) 72 h.
Paper RSC Advances
Ope
n A
cces
s A
rtic
le. P
ublis
hed
on 0
1 A
pril
2020
. Dow
nloa
ded
on 4
/5/2
022
8:15
:45
AM
. T
his
artic
le is
lice
nsed
und
er a
Cre
ativ
e C
omm
ons
Attr
ibut
ion-
Non
Com
mer
cial
3.0
Unp
orte
d L
icen
ce.
View Article Online
resistance towards the propagation of the current. The decreaseof the Rct value from 24 hours to 72 hours may be due todetachment of the thick accumulation of oxide layer. When anarticial defect was created on the epoxy-coated mild steel
Table 3 Values of the fitted ECMs for the BS, SE and SH samples
SampleImmersion time(Hr) Rs (U cm2) Rpore (U cm2) Rct (U cm2)
BS 1 2.9 — 129.7824 2.43 — 252.7372 2.19 — 201.07
SE 1 105.03 1035.5 733724 105.31 858.4 12 92172 114.15 978.15 12 677
SH 1 407.11 163 290 170 21024 456.38 132 220 222 46072 550.84 23 148 310 760
This journal is © The Royal Society of Chemistry 2020
sample, ions in the surrounding solution came into contactwith the metal substrate, leading to corrosion initiation withouthindrance. The formation of thick oxide layers, as shown in theSEM images in Fig. 8b, provides a certain limitation of thecorrosion at the defective coating area, leading to an increase incharge transfer resistance from 7337 U cm�2 at the 1st hour ofexposure to 12 677 U cm�2 aer 72 hours of exposure. When thecoating continuity of the SH sample was damaged due to thearticially induced crack, the embedded SH nanoparticlesexposed to the surrounding environment experienced pHchanges due to localized corrosion. The inner content wasreleased as the polyelectrolyte layer experienced changes due topH changes in the surroundings. The released [Bmim][Cl] wasable to undergo both chemisorption and physisorption onto thenegatively charged mild steel surface, thus forming a protectivelayer that provided a signicantly higher charge transfer resis-tance of 170 210 U cm�2 at the 1st hour of exposure.25 Thecharge transfer resistance further increased to 310 760 U cm�2
at 72 hours of exposure with the continuous release of [Bmim]
RSC Adv., 2020, 10, 13174–13184 | 13181

Fig. 8 SEM images of SE (a) before and (b) after and of SH (c) before and (d) after 72 hours of immersion in 3.5 wt% NaCl solution.
Table 4 EDS analysis of SE and SH samples before and after 72 hoursof immersion in 3.5 wt% NaCl solution
Sample Immersion
% weight percent ratio of elements
Fe C O N Cl Na
SE Before 90.8 8.3 0.5 — — —Aer 70.9 7 21.2 — 0.4 0.4
SH Before 83.3 14.9 1.2 — — —Aer 79.2 8.5 10 0.8 0.2 0.1
13182 | RSC Adv., 2020, 10, 13174–13184
RSC Advances Paper
Ope
n A
cces
s A
rtic
le. P
ublis
hed
on 0
1 A
pril
2020
. Dow
nloa
ded
on 4
/5/2
022
8:15
:45
AM
. T
his
artic
le is
lice
nsed
und
er a
Cre
ativ
e C
omm
ons
Attr
ibut
ion-
Non
Com
mer
cial
3.0
Unp
orte
d L
icen
ce.
View Article Online
[Cl] from the embedded SH nanoparticles. The Rpore values inthe SE and SH samples showed a decreasing trend withincreasing immersion time. As the immersion time increasesup to 72 hours, the decreasing trend of Rpore may be caused bythe increase in the exposed area.52 This may be due to propa-gation of the corrosion site, which leads to slight delaminationof the coating. The decrease of Rpore, however, could becompensated with the increasing Rct as a result of the inhibitioneffect of [Bmim][Cl]. Comparing the SEM images from Fig. 8 forboth the SE and SH samples aer immersion, one can observea distinct visual difference in the amount of corrosion productabove the metal substrate. This phenomenon was in agreement
This journal is © The Royal Society of Chemistry 2020

Paper RSC Advances
Ope
n A
cces
s A
rtic
le. P
ublis
hed
on 0
1 A
pril
2020
. Dow
nloa
ded
on 4
/5/2
022
8:15
:45
AM
. T
his
artic
le is
lice
nsed
und
er a
Cre
ativ
e C
omm
ons
Attr
ibut
ion-
Non
Com
mer
cial
3.0
Unp
orte
d L
icen
ce.
View Article Online
with the EDS results as shown in Table 4, where the oxygenweight percent of the SE sample increased from 0.5 wt% to21.2 wt% and that of the SH sample increased from 1.2 wt% to10 wt%. The presence of nitrogen and chloride in the scratchedarea of the SH sample proved the release of [Bmim][Cl] from thenanotubes, and the inhibition of [Bmim][Cl] results in lowerformation of corrosion product, as indicated by the oxygenweight percentage.
Conclusions
[Bmim][Cl] was successfully loaded into HNTs with a loadingefficiency of 13.40 wt%, as conrmed using TGA. HNT–[Bmim][Cl] was characterized by FTIR, which conrmed that nochemical interaction of [Bmim][Cl] with the chemical structureof the HNTs occurred. Zeta potential analysis proved thesuccessful deposition of polyelectrolyte. The release prole ofHNT–[Bmim][Cl] was studied via UV-Vis, and it was found thatthe initial release of 50–55% occurred within the rst 10minutes and achieved an ultimate release of approximately90%. Loading of [Bmim][Cl] into the HNTs provides extendedrelease over 72 hours compared to direct addition into thecoating matrix, which causes immediate release. When theloaded HNTs were encapsulated with PEMs, the release of[Bmim][Cl] was controlled and displayed pH responsiveness inits release prole. A weak polyelectrolyte provides rapidresponse towards pH variation, while a strong polyelectrolyte ismore resistant and stable to pH variation. The PEI/PAA multi-layers are an excellent candidate for effective smart pH-responsive encapsulation of corrosion inhibitor-loaded nano-containers. The addition of the smart pH-responsive halloysitenanotubes to the epoxy coating could provide responsive releaseof [Bmim][Cl] when an articial defect was induced on thecoating surface and signicantly increased corrosion protectionof the steel, as conrmed by the EIS corrosion study and SEM.Therefore, this study provided a novel encapsulation method of[Bmim][Cl] and produced smart pH-responsive nanoparticlesthat can be readily incorporated into an epoxy matrix forcombined passive and active corrosion protection of mild steel.
Conflicts of interest
There are no conicts to declare.
Acknowledgements
Great appreciation is offered to Universiti Teknologi PETRONASfor the facilities and research fund, Yayasan Universiti Tekno-logi PETRONAS (YUTP) 0153AA-H34.
References
1 M. Zheludkevich, J. Tedim and M. Ferreira, Electrochim. Acta,2012, 82, 314–323.
2 K. A. Zahidah, S. Kakooei, M. C. Ismail and P. B. Raja, Prog.Org. Coat., 2017, 111, 175–185.
This journal is © The Royal Society of Chemistry 2020
3 E. Abdullayev, R. Price, D. Shchukin and Y. Lvov, ACS Appl.Mater. Interfaces, 2009, 1, 1437–1443.
4 E. Shchukina, D. Shchukin and D. Grigoriev, Prog. Org. Coat.,2017, 102, 60–65.
5 J.-H. Liu, L.-M. Yang and E. Ganz, ACS Sustainable Chem.Eng., 2018, 6, 15494–15502.
6 J.-H. Liu, L.-M. Yang and E. Ganz, J. Mater. Chem. A, 2019, 7,3805–3814.
7 J.-H. Liu, L.-M. Yang and E. Ganz, RSC Adv., 2019, 9, 27710–27719.
8 L. Xu, L.-M. Yang and E. Ganz, Theor. Chem. Acc., 2018, 137,98.
9 Y. Liu, L.-M. Yang and E. Ganz, Condens. Matter, 2019, 4, 65.10 E. Abdullayev and Y. Lvov, J. Nanosci. Nanotechnol., 2011, 11,
10007–10026.11 D. Yu, J. Wang, W. Hu and R. Guo, Mater. Des., 2017, 129,
103–110.12 E. Abdullayev, D. Shchukin and Y. Lvov, Mater. Sci. Eng.,
2008, 99, 331–332.13 S. C. Olugebefola, A. R. Hamilton, D. J. Faireld, N. R. Sottos
and S. R. White, So Matter, 2013, 10, 544–548.14 J. Zhang, D. Zhang, A. Zhang, Z. Jia and D. Jia, Iran. Polym. J.,
2013, 22, 501–510.15 H. Ye, D. Chen, N. Li, Q. Xu, H. Li, J. He and J. Lu, Environ.
Sci.: Nano, 2019, 6, 1259–1266.16 Y. He, W. Xu, R. Tang, C. Zhang and Q. Yang, RSC Adv., 2015,
5, 90609–90620.17 H. Choi, Y. K. Song, K. Y. Kim and J. M. Park, Surf. Coat.
Technol., 2012, 206, 2354–2362.18 N. Pirhady Tavandashti, M. Ghorbani, A. Shojaei,
J. M. C. Mol, H. Terryn, K. Baert and Y. Gonzalez-Garcia,Corros. Sci., 2016, 112, 138–149.
19 J. Tedim, M. L. Zheludkevich, A. C. Bastos, A. N. Salak,A. D. Lisenkov and M. G. S. Ferreira, Electrochim. Acta,2014, 117, 164–171.
20 Y. M. Lvov, D. G. Shchukin, H. Mohwald and R. R. Price, ACSNano, 2008, 2, 814–820.
21 E. Abdullayev, V. Abbasov, A. Tursunbayeva, V. Portnov,H. Ibrahimov, G. Mukhtarova and Y. Lvov, ACS Appl. Mater.Interfaces, 2013, 5, 4464–4471.
22 A. L. Chong, M. Forsyth and D. R. Macfarlane, Electrochim.Acta, 2015, 159, 219–226.
23 Y. Guo, B. Xu, Y. Liu, W. Yang, X. Yin, Y. Chen, J. Le andZ. Chen, J. Ind. Eng. Chem., 2017, 56, 234–247.
24 Q. B. Zhang and Y. X. Hua, Electrochim. Acta, 2009, 54, 1881–1887.
25 S. Velusamy, S. Sakthivel, L. Neelakantan and J. S. Sangwai, J.Earth Sci., 2017, 28, 949–961.
26 A. Youse, S. Javadian, N. Dalir, J. Kakemam and J. Akbari,RSC Adv., 2015, 5, 11697–11713.
27 C. Verma, E. E. Ebenso and M. A. Quraishi, J. Mol. Liq., 2017,233, 403–414.
28 N. Saurın, J. Sanes and M. Bermudez, Tribol. Lett., 2015, 58,4.
29 H. Maka, T. Spychaj and R. Pilawka, eXPRESS Polym. Lett.,2014, 8(10), 723–732.
RSC Adv., 2020, 10, 13174–13184 | 13183

RSC Advances Paper
Ope
n A
cces
s A
rtic
le. P
ublis
hed
on 0
1 A
pril
2020
. Dow
nloa
ded
on 4
/5/2
022
8:15
:45
AM
. T
his
artic
le is
lice
nsed
und
er a
Cre
ativ
e C
omm
ons
Attr
ibut
ion-
Non
Com
mer
cial
3.0
Unp
orte
d L
icen
ce.
View Article Online
30 E. Maza, J. S. Tuninetti, N. Politakos, W. Knoll, S. Moya andO. Azzaroni, Phys. Chem. Chem. Phys., 2015, 17, 29935–29948.
31 T. Alonso, J. Irigoyen, J. J. Iturri, I. L. Larena and S. E. Moya,So Matter, 2013, 9, 1920–1928.
32 S. T. Dubas and J. B. Schlenoff, Macromolecules, 2001, 34,3736–3740.
33 Y. Ma, J. Dong, S. Bhattacharjee, S. Wijeratne, M. L. Brueningand G. L. Baker, Langmuir, 2013, 29, 2946–2954.
34 R. A. Ghostine, M. Z. Markarian and J. B. Schlenoff, J. Am.Chem. Soc., 2013, 135, 7636–7646.
35 P. Bieker and M. Schonhoff,Macromolecules, 2010, 43, 5052–5059.
36 S. M. Notley, M. Eriksson and L. Wagberg, J. Colloid InterfaceSci., 2005, 292, 29–37.
37 N. Y. Abu-Thabit and A. S. Hamdy, Surf. Coat. Technol., 2016,303, 406–424.
38 Q. Zhang and Y. Hua, Electrochim. Acta, 2009, 54, 1881–1887.39 R. W. Korsmeyer, R. Gurny, E. Doelker, P. Buri and
N. A. Peppas, Int. J. Pharm., 1983, 15, 25–35.40 H. Kim and R. Fassihi, J. Pharm. Sci., 1997, 86, 323–328.41 S. A. Dharaskar, M. N. Varma, D. Z. Shende, C. K. Yoo and
K. L. Wasewar, Sci. World J., 2013, 2013, 9.
13184 | RSC Adv., 2020, 10, 13174–13184
42 H. Yu, Y. Zhang, X. Sun, J. Liu and H. Zhang, Chem. Eng. J.,2014, 237, 322–328.
43 S. E. Burke and C. J. Barrett, Langmuir, 2003, 19, 3297–3303.44 M. Michel, V. Toniazzo, D. Ruch and V. Ball, ISRN Mater. Sci.,
2012, 2012, 701695.45 X. Xing, J. Wang, Q. Li, W. Hu and J. Yuan, Colloids Surf., A,
2018, 553, 295–304.46 K. A. Curtis, D. Miller, P. Millard, S. Basu, F. Horkay and
P. L. Chandran, PLoS One, 2016, 11, e0158147.47 Y.-C. Li, J. Schulz and J. C. Grunlan, ACS Appl. Mater.
Interfaces, 2009, 1, 2338–2347.48 S. W. Cranford, C. Ortiz and M. J. Buehler, So Matter, 2010,
6, 4175–4188.49 H. Pulikkalparambil, S. Siengchin and
J. Parameswaranpillai, Nano-Struct. Nano-Objects, 2018, 16,381–395.
50 L. C. Murulana, A. K. Singh, S. K. Shukla, M. M. Kabanda andE. E. Ebenso, Ind. Eng. Chem. Res., 2012, 51, 13282–13299.
51 R. Farahmand, B. Sohrabi, A. Ghaffarinejad andM. R. Z. Meymian, Corros. Sci., 2018, 136, 393–401.
52 N. Mat Nor, L. Ismail, S. Jamari, K. Ramesh,B. Vengadaesvaran and A. Arof, Pigm. Resin Technol., 2014,43, 371–378.
This journal is © The Royal Society of Chemistry 2020