Embed Size (px)
Citation preview

NEW ENGLAND COMMON ASSESSMENT PROGRAM
Released ItemsSupport Materials
2015
Grade 8Science
1NECAP 2015 Grade 8 Science Released Items_V2
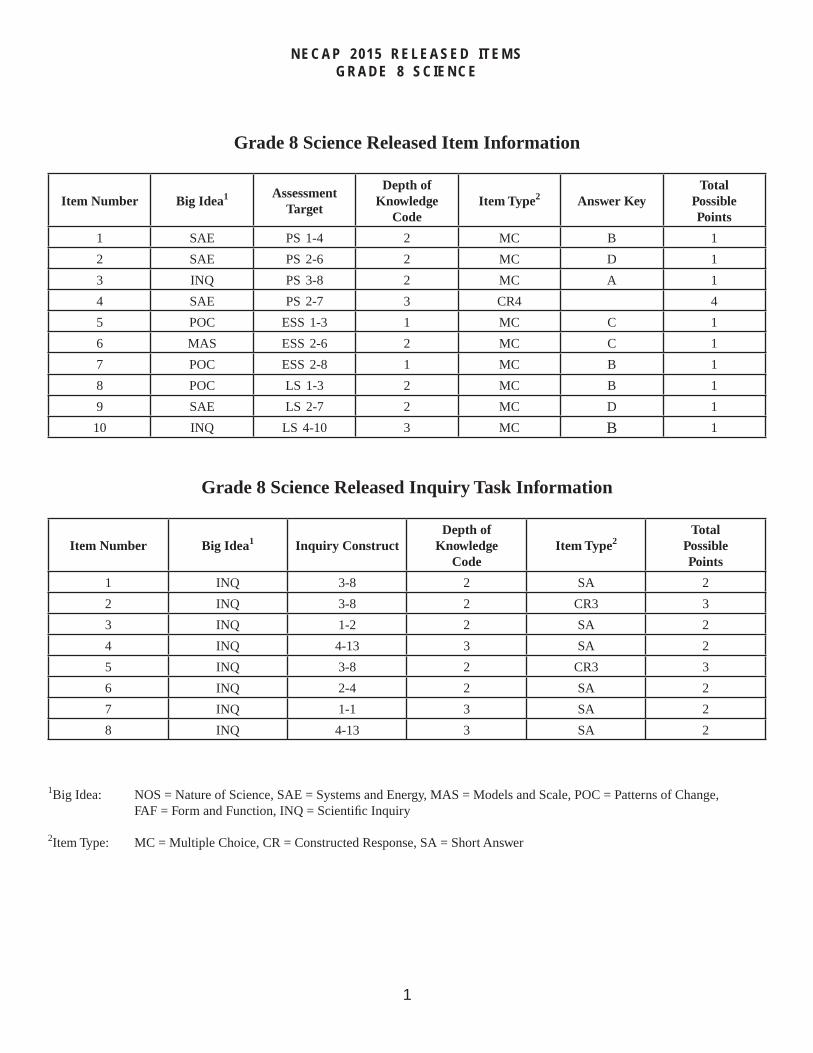
NECAP 2015 RELEASED ITEMSGRADE 8 SCIENCE
Grade 8 Science Released Item Information
Item Number Big Idea1 Assessment Target
Depth ofKnowledge
CodeItem Type2 Answer Key
TotalPossiblePoints
1 SAE PS 1-4 2 MC B 1
2 SAE PS 2-6 2 MC D 1
3 INQ PS 3-8 2 MC A 1
4 SAE PS 2-7 3 CR4 4
5 POC ESS 1-3 1 MC C 1
6 MAS ESS 2-6 2 MC C 1
7 POC ESS 2-8 1 MC B 1
8 POC LS 1-3 2 MC B 1
9 SAE LS 2-7 2 MC D 1
10 INQ LS 4-10 3 MC B 1
Grade 8 Science Released Inquiry Task Information
Item Number Big Idea1 Inquiry ConstructDepth of
KnowledgeCode
Item Type2Total
PossiblePoints
1 INQ 3-8 2 SA 2
2 INQ 3-8 2 CR3 3
3 INQ 1-2 2 SA 2
4 INQ 4-13 3 SA 2
5 INQ 3-8 2 CR3 3
6 INQ 2-4 2 SA 2
7 INQ 1-1 3 SA 2
8 INQ 4-13 3 SA 2
1Big Idea: NOS = Nature of Science, SAE = Systems and Energy, MAS = Models and Scale, POC = Patterns of Change, FAF = Form and Function, INQ = Scientifi c Inquiry
2Item Type: MC = Multiple Choice, CR = Constructed Response, SA = Short Answer
2NECAP 2015 Grade 8 Science Released Items_V2
NECAP 2015 RELEASED ITEMSGRADE 8 SCIENCE
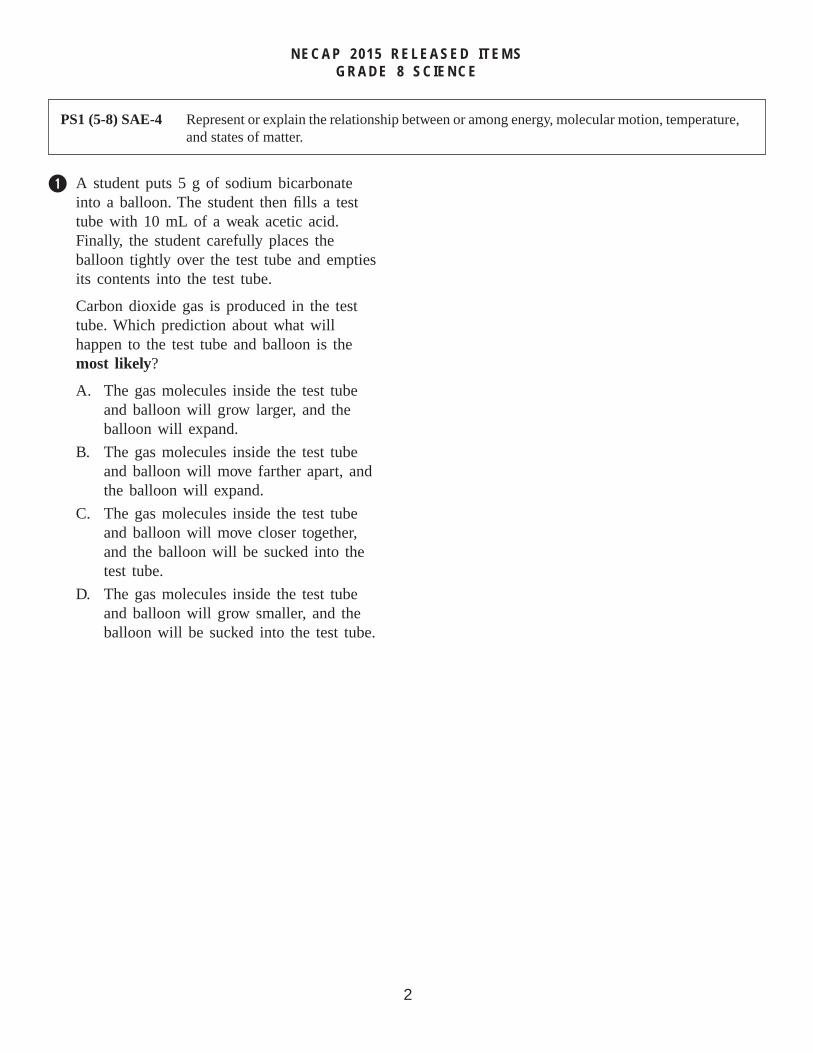
PS1 (5-8) SAE-4 Represent or explain the relationship between or among energy, molecular motion, temperature, and states of matter.
241664.007 B Common, CMN
q A student puts 5 g of sodium bicarbonate into a balloon. The student then fi lls a test tube with 10 mL of a weak acetic acid. Finally, the student carefully places the balloon tightly over the test tube and empties its contents into the test tube.
Carbon dioxide gas is produced in the test tube. Which prediction about what will happen to the test tube and balloon is the most likely?
A. The gas molecules inside the test tube and balloon will grow larger, and the balloon will expand.
B. The gas molecules inside the test tube and balloon will move farther apart, and the balloon will expand.
C. The gas molecules inside the test tube and balloon will move closer together, and the balloon will be sucked into the test tube.
D. The gas molecules inside the test tube and balloon will grow smaller, and the balloon will be sucked into the test tube.
3NECAP 2015 Grade 8 Science Released Items_V2
NECAP 2015 RELEASED ITEMSGRADE 8 SCIENCE
PS2 (5-8) SAE-6 Given a real-world example, show that within a system, energy transfers from one form to another (i.e., chemical, heat, electrical, gravitational, light, sound, mechanical).
144380.005 146858 D Common, CMN
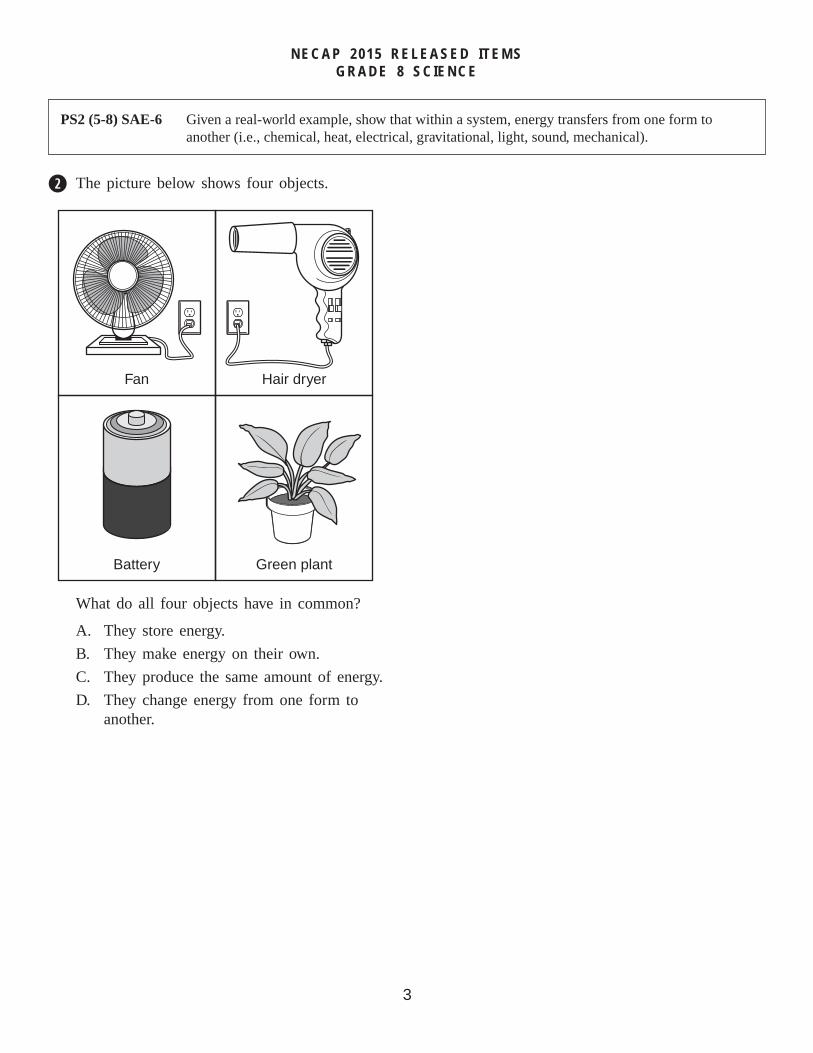
w The picture below shows four objects.
Fan Hair dryer
Battery Green plant
What do all four objects have in common?
A. They store energy.
B. They make energy on their own.
C. They produce the same amount of energy.
D. They change energy from one form to another.
4NECAP 2015 Grade 8 Science Released Items_V2
NECAP 2015 RELEASED ITEMSGRADE 8 SCIENCE
PS3 (5-8) INQ-8 Use data to determine or predict the overall net effect of multiple forces (e.g., friction, gravitational, magnetic) on the position, speed, and direction of motion of objects.
50021.005 50022 A Common, CMN
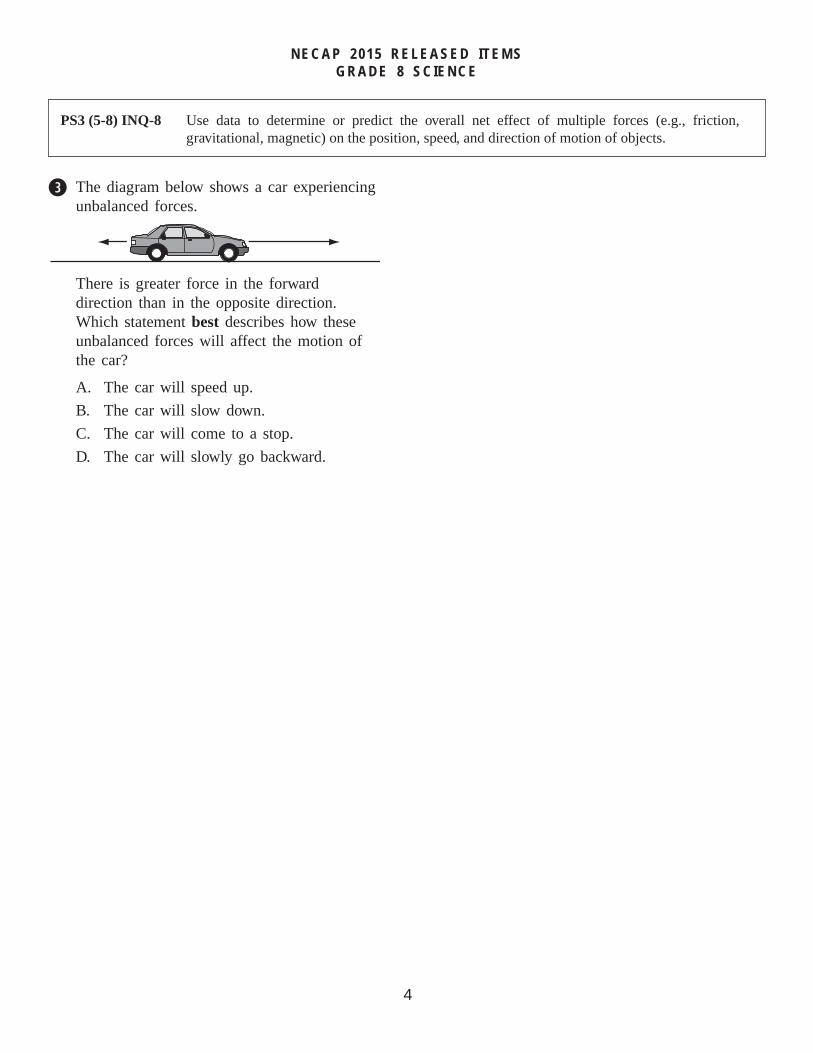
e The diagram below shows a car experiencing unbalanced forces.
There is greater force in the forward direction than in the opposite direction. Which statement best describes how these unbalanced forces will affect the motion of the car?
A. The car will speed up.
B. The car will slow down.
C. The car will come to a stop.
D. The car will slowly go backward.
5NECAP 2015 Grade 8 Science Released Items_V2
NECAP 2015 RELEASED ITEMSGRADE 8 SCIENCE
PS2 (5-8) SAE-7 Use data to draw conclusions about how heat can be transferred (convection, conduction, radiation).
219230.007 219231 Common, CMN
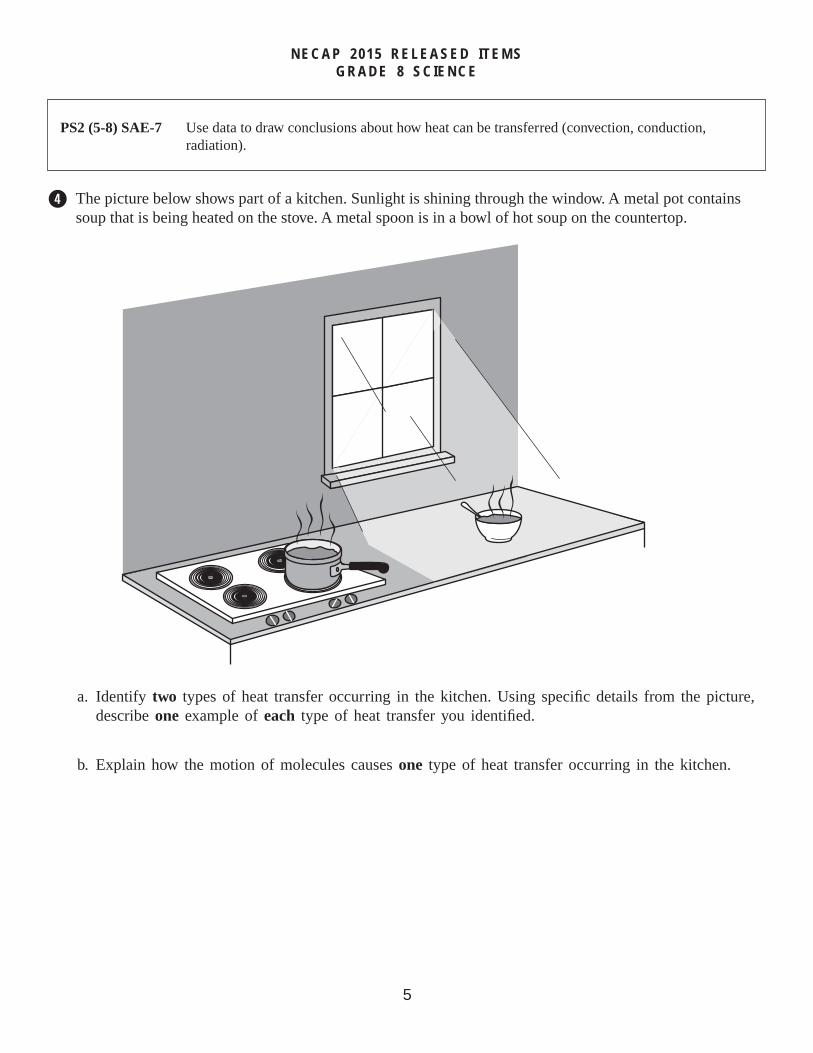
r The picture below shows part of a kitchen. Sunlight is shining through the window. A metal pot contains soup that is being heated on the stove. A metal spoon is in a bowl of hot soup on the countertop.
a. Identify two types of heat transfer occurring in the kitchen. Using specifi c details from the picture, describe one example of each type of heat transfer you identifi ed.
b. Explain how the motion of molecules causes one type of heat transfer occurring in the kitchen.
6NECAP 2015 Grade 8 Science Released Items_V2
NECAP 2015 RELEASED ITEMSGRADE 8 SCIENCE
Scoring Guide
Score Description
4
The response demonstrates a thorough understanding of how heat can be stored, transferred, and transformed. The response identifi es two types of heat transfer occurring in the kitchen and describes one example using specifi c information from the picture. The response also explains how the motion of molecules causes heat transfer.
3The response demonstrates a general understanding of how energy can be stored, transferred, and transformed. The overall response is general.
2The response demonstrates a limited understanding of how energy can be stored, transferred, and transformed. The overall response is limited.
1The response demonstrates a minimal understanding of how energy can be stored, transferred, and transformed. The overall response is minimal.
0 The response is incorrect or irrelevant to the skill or concept being measured.
Blank No response
Part a./b. A thorough response can be exemplifi ed by the following sample responses:
Heat is being transferred in the kitchen in the following ways:
• Radiation:
• Heat can be transferred from the sunlight into the room (e.g., direct sunlight is heating the air or the specifi c objects) when the sunlight (electromagnetic waves) is absorbed by the air/object and the molecules in the air/object vibrate more quickly.
• Heat can be transferred from the pot or bowl of hot soup into the air. When heated [by infrared, electromagnetic waves] the molecules in the air/object vibrate more quickly.
• Heat can be transferred from the stove’s electric burner to the air. When heated [by infrared, electromagnetic waves] the molecules in the air vibrate more quickly.
• Conduction:
• Heat can be transferred from the stove’s electric burner to the pot when the molecules in the pot/spoon heat up and vibrate faster. The vibrating molecules collide with other molecules, transferring the heat and causing them to vibrate faster.
• Heat can be transferred from the bowl of hot soup into the metal spoon when the molecules in the pot/spoon heat up and vibrate faster. The vibrating molecules collide with other molecules, transferring the heat and causing them to vibrate faster.
• Convection:
• Heat can be transferred within the soup in the pot or the bowl when the warmer soup molecules (that are moving quicker and are less dense) rise and carry the heat with them. This causes the cooler soup molecules (that are moving more slowly and are more dense) to move and replace the rising molecules. [These cooler molecules are then above the heat source and warm up.]
7NECAP 2015 Grade 8 Science Released Items_V2
NECAP 2015 RELEASED ITEMSGRADE 8 SCIENCE
• Heat can be transferred within the heated air above the pot of soup or the bowl when the warmer air molecules (that are moving quicker and are less dense) rise and carry the heat with them. This causes the cooler air molecules (that are moving more slowly and are more dense) to move and replace the rising molecules. [These cooler air molecules are then above the heat source and warm up.]
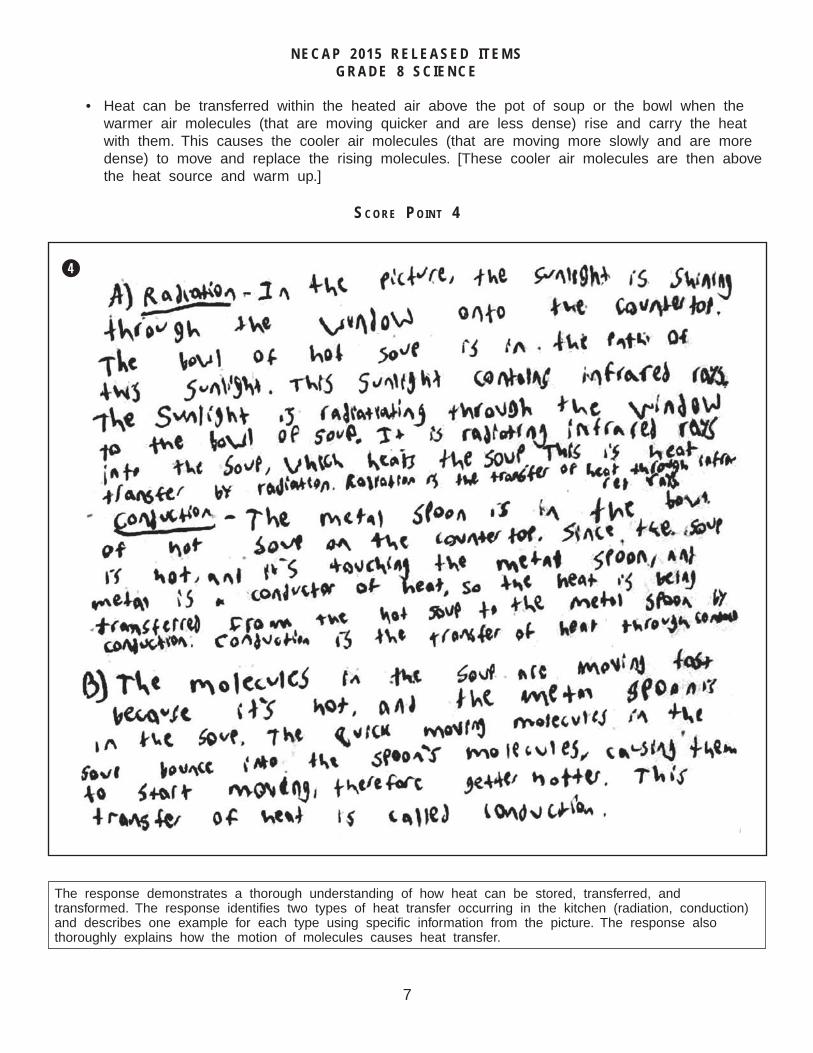
SCORE POINT 4
r
The response demonstrates a thorough understanding of how heat can be stored, transferred, and transformed. The response identifi es two types of heat transfer occurring in the kitchen (radiation, conduction) and describes one example for each type using specifi c information from the picture. The response also thoroughly explains how the motion of molecules causes heat transfer.
8NECAP 2015 Grade 8 Science Released Items_V2
NECAP 2015 RELEASED ITEMSGRADE 8 SCIENCE
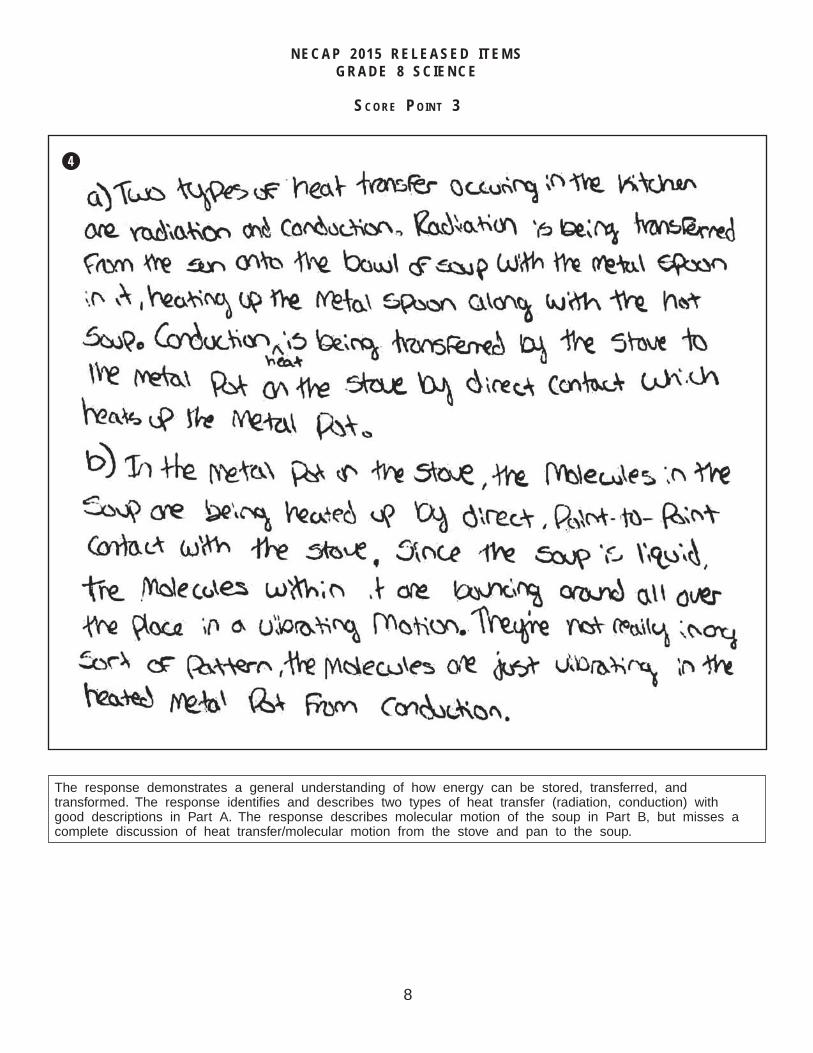
SCORE POINT 3
r
The response demonstrates a general understanding of how energy can be stored, transferred, and transformed. The response identifi es and describes two types of heat transfer (radiation, conduction) with good descriptions in Part A. The response describes molecular motion of the soup in Part B, but misses a complete discussion of heat transfer/molecular motion from the stove and pan to the soup.
9NECAP 2015 Grade 8 Science Released Items_V2
NECAP 2015 RELEASED ITEMSGRADE 8 SCIENCE
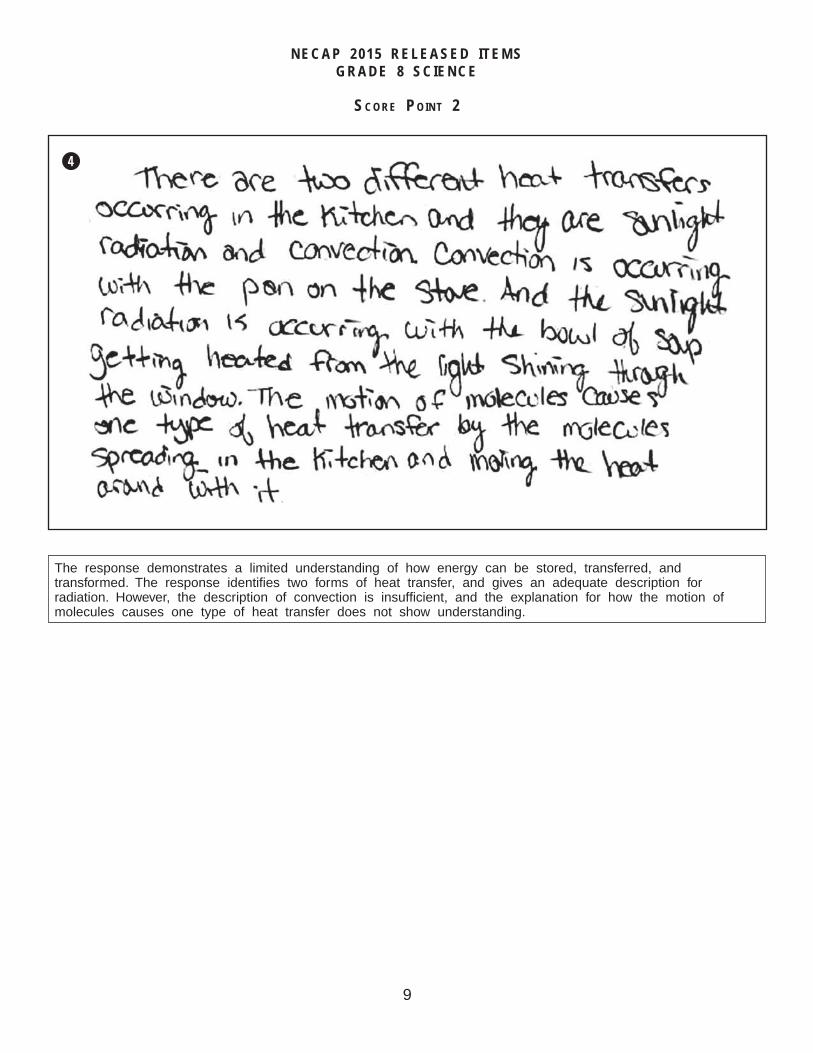
SCORE POINT 2
r
The response demonstrates a limited understanding of how energy can be stored, transferred, and transformed. The response identifi es two forms of heat transfer, and gives an adequate description for radiation. However, the description of convection is insuffi cient, and the explanation for how the motion of molecules causes one type of heat transfer does not show understanding.
10NECAP 2015 Grade 8 Science Released Items_V2
NECAP 2015 RELEASED ITEMSGRADE 8 SCIENCE
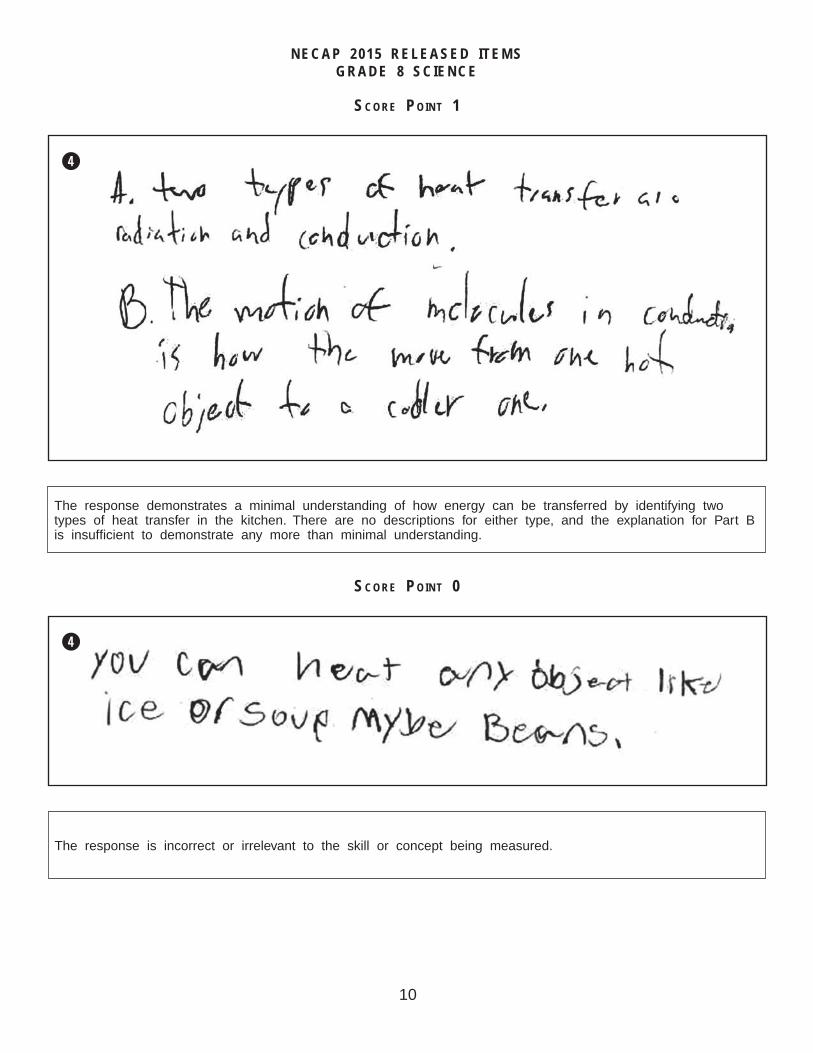
SCORE POINT 1
r
The response demonstrates a minimal understanding of how energy can be transferred by identifying two types of heat transfer in the kitchen. There are no descriptions for either type, and the explanation for Part B is insuffi cient to demonstrate any more than minimal understanding.
SCORE POINT 0
r
The response is incorrect or irrelevant to the skill or concept being measured.
11NECAP 2015 Grade 8 Science Released Items_V2
NECAP 2015 RELEASED ITEMSGRADE 8 SCIENCE
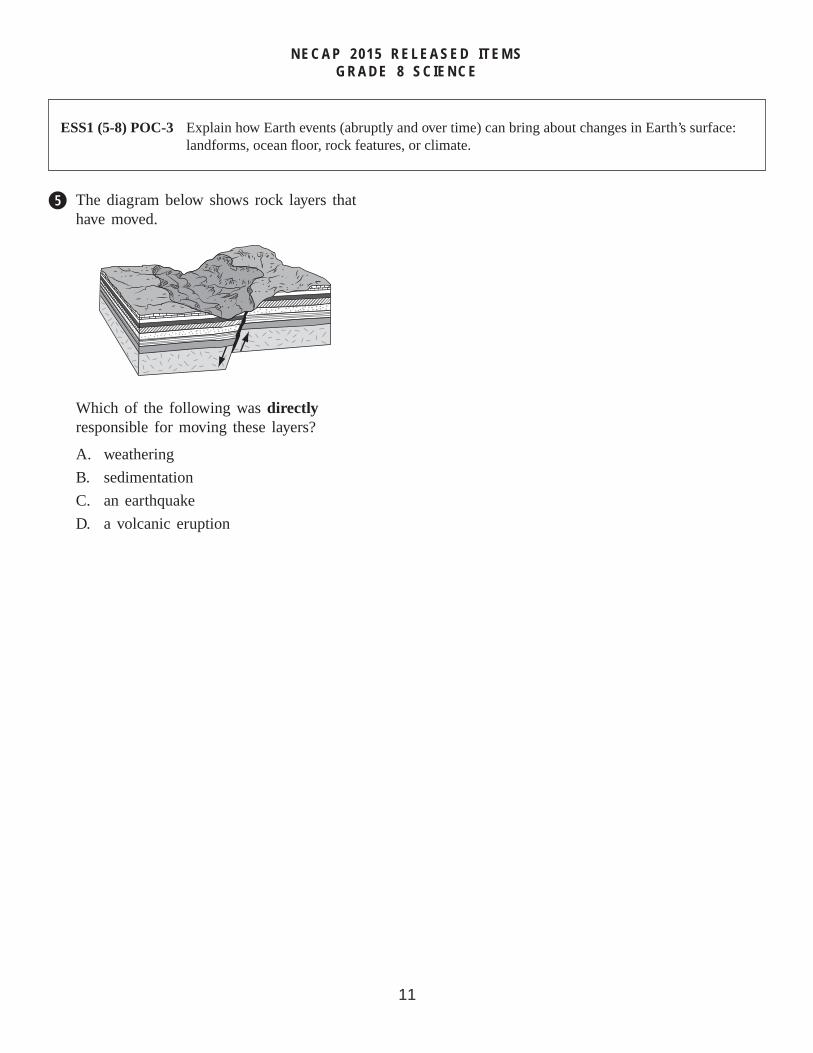
ESS1 (5-8) POC-3 Explain how Earth events (abruptly and over time) can bring about changes in Earth’s surface: landforms, ocean fl oor, rock features, or climate.
256610.004 256611 C Common, CMN
t The diagram below shows rock layers that have moved.
Which of the following was directly responsible for moving these layers?
A. weathering
B. sedimentation
C. an earthquake
D. a volcanic eruption
12NECAP 2015 Grade 8 Science Released Items_V2
NECAP 2015 RELEASED ITEMSGRADE 8 SCIENCE
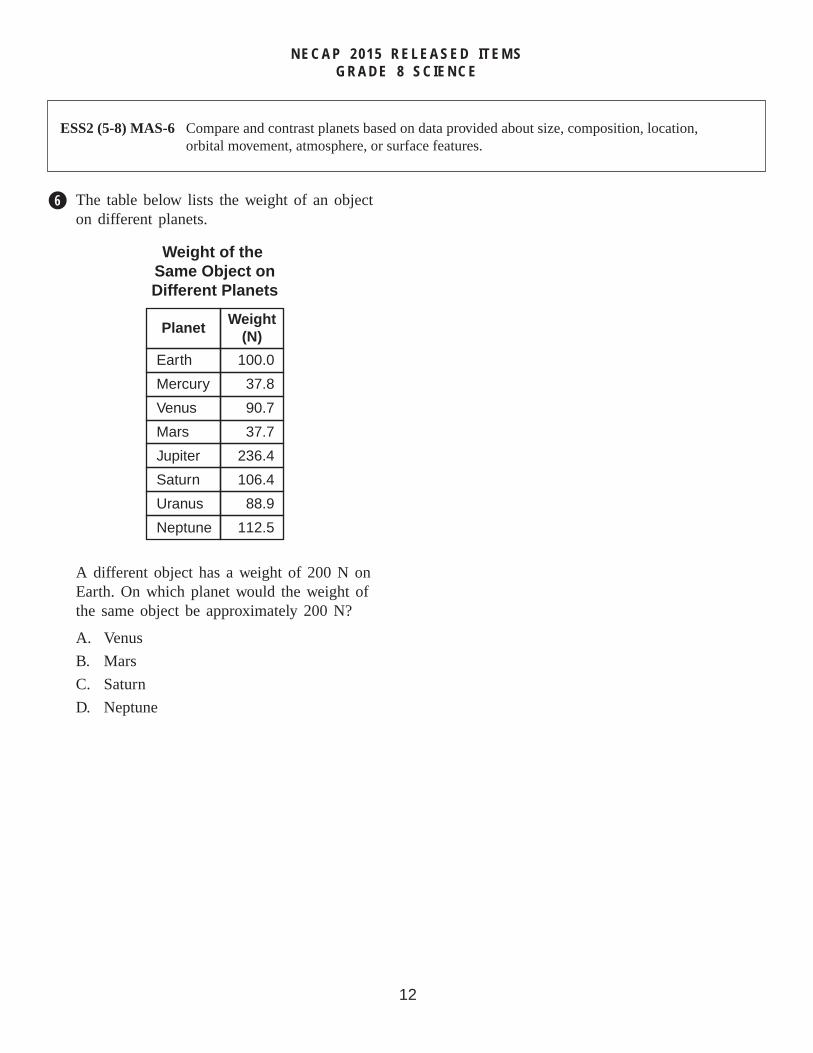
ESS2 (5-8) MAS-6 Compare and contrast planets based on data provided about size, composition, location, orbital movement, atmosphere, or surface features.
256830.006 256831 C Common, CMN
y The table below lists the weight of an object on different planets.
Weight of the Same Object onDifferent Planets
Planet
Earth
Mercury
Venus
Mars
Jupiter
Saturn
Uranus
Neptune
Weight(N)
100.0
37.8
90.7
37.7
236.4
106.4
88.9
112.5
A different object has a weight of 200 N on Earth. On which planet would the weight of the same object be approximately 200 N?
A. Venus
B. Mars
C. Saturn
D. Neptune
13NECAP 2015 Grade 8 Science Released Items_V2
NECAP 2015 RELEASED ITEMSGRADE 8 SCIENCE
ESS2 (5-8) POC-8 Explain temporal or positional relationships between or among the Earth, Sun, and Moon (e.g., night/day, seasons, year, tides) OR how gravitational force affects objects in the solar system (e.g., moons, tides, orbits, satellites).
60141.007 B Common, CMN
u Why do most locations on Earth experience day and night?
A. Earth travels around the Sun.
B. Earth rotates on its axis.
C. The Moon has a gravitational pull on Earth.
D. The Moon travels between Earth and the Sun.
14NECAP 2015 Grade 8 Science Released Items_V2
NECAP 2015 RELEASED ITEMSGRADE 8 SCIENCE
LS1 (5-8) POC-3 Compare and contrast sexual reproduction with asexual reproduction.
144224.009 B Common, CMN
i New sea stars can grow from pieces of a sea star that is torn apart. How are sea stars produced this way different from sea stars produced by sexual reproduction?
A. New sea stars grown from pieces cannot reproduce.
B. New sea stars grown from pieces are genetically identical.
C. New sea stars grown from pieces are genetically different.
D. New sea stars grown from pieces can regrow new organs but not new arms.
15NECAP 2015 Grade 8 Science Released Items_V2
NECAP 2015 RELEASED ITEMSGRADE 8 SCIENCE
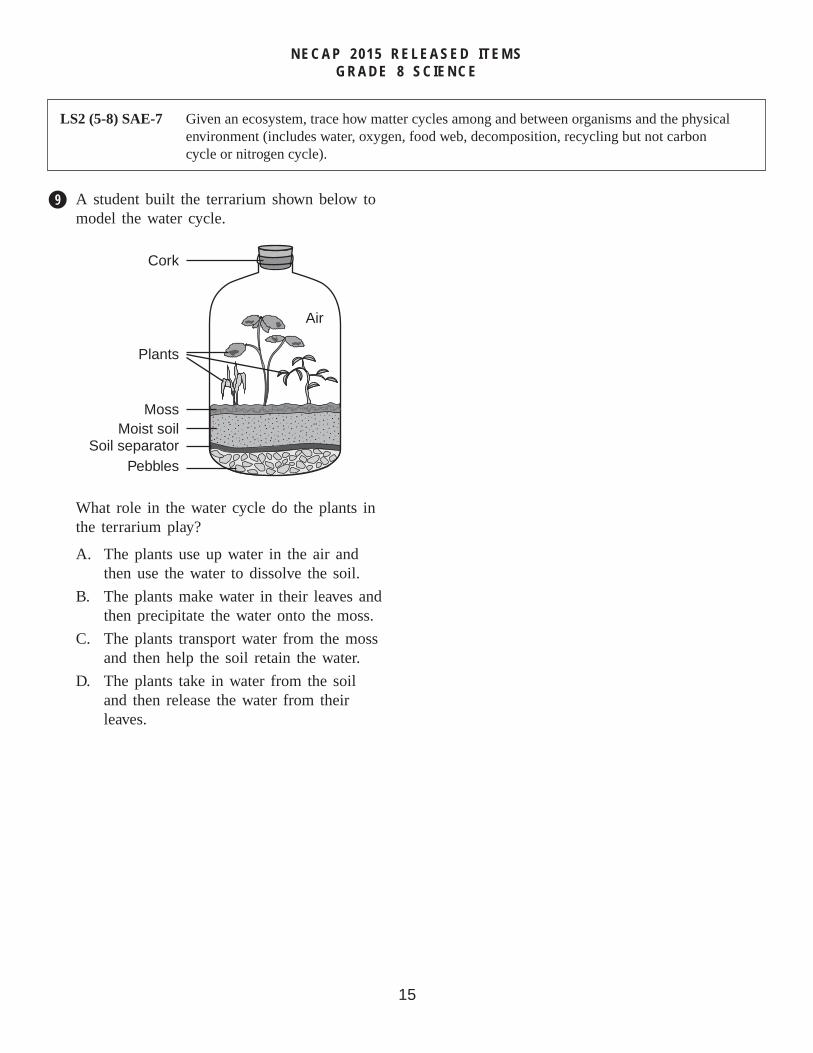
LS2 (5-8) SAE-7 Given an ecosystem, trace how matter cycles among and between organisms and the physical environment (includes water, oxygen, food web, decomposition, recycling but not carbon cycle or nitrogen cycle).
219445.006 219446 D Common, CMN
o A student built the terrarium shown below to model the water cycle.
PebblesSoil separator
Moist soil
Cork
Moss
Plants
Air
What role in the water cycle do the plants in the terrarium play?
A. The plants use up water in the air and then use the water to dissolve the soil.
B. The plants make water in their leaves and then precipitate the water onto the moss.
C. The plants transport water from the moss and then help the soil retain the water.
D. The plants take in water from the soil and then release the water from their leaves.
16NECAP 2015 Grade 8 Science Released Items_V2
NECAP 2015 RELEASED ITEMSGRADE 8 SCIENCE
LS4 (5-8) INQ-10 Use data and observations to support the concept that environmental or biological factors affect human body systems (biotic & abiotic).
58385.006 B Common, CMN
a Over the past several decades, the ozone layer over Australia has been thinning, causing increased levels of UV radiation to reach Earth’s surface.
What is the most likely health consequence of increased radiation?
A. People in Australia need more vitamin D in their diets.
B. People in Australia have an increased risk of skin cancer.
C. People in Australia have an increased sensitivity to cold.
D. People in Australia are more resistant to respiratory diseases.
17NECAP 2015 Grade 8 Science Released Items_V2
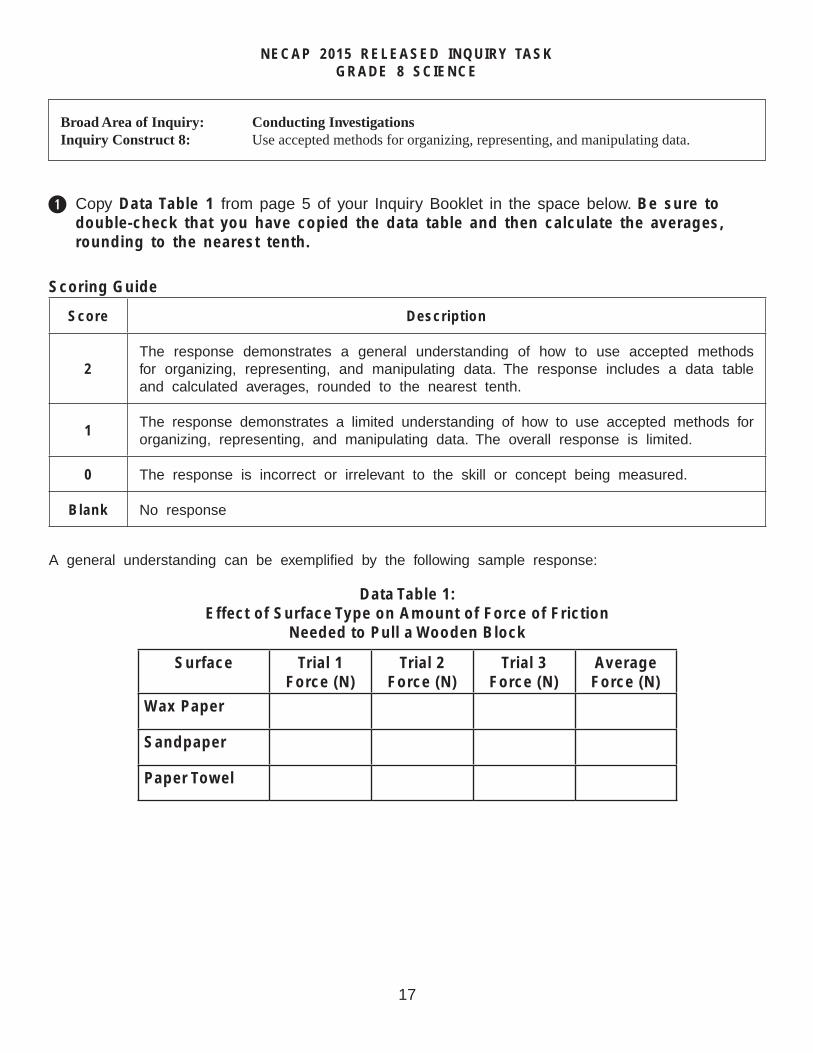
NECAP 2015 RELEASED INQUIRY TASKGRADE 8 SCIENCE
Broad Area of Inquiry: Conducting InvestigationsInquiry Construct 8: Use accepted methods for organizing, representing, and manipulating data.
Scoring Guide
Score Description
2The response demonstrates a general understanding of how to use accepted methods for organizing, representing, and manipulating data. The response includes a data table and calculated averages, rounded to the nearest tenth.
1The response demonstrates a limited understanding of how to use accepted methods for organizing, representing, and manipulating data. The overall response is limited.
0 The response is incorrect or irrelevant to the skill or concept being measured.
Blank No response
A general understanding can be exemplifi ed by the following sample response:
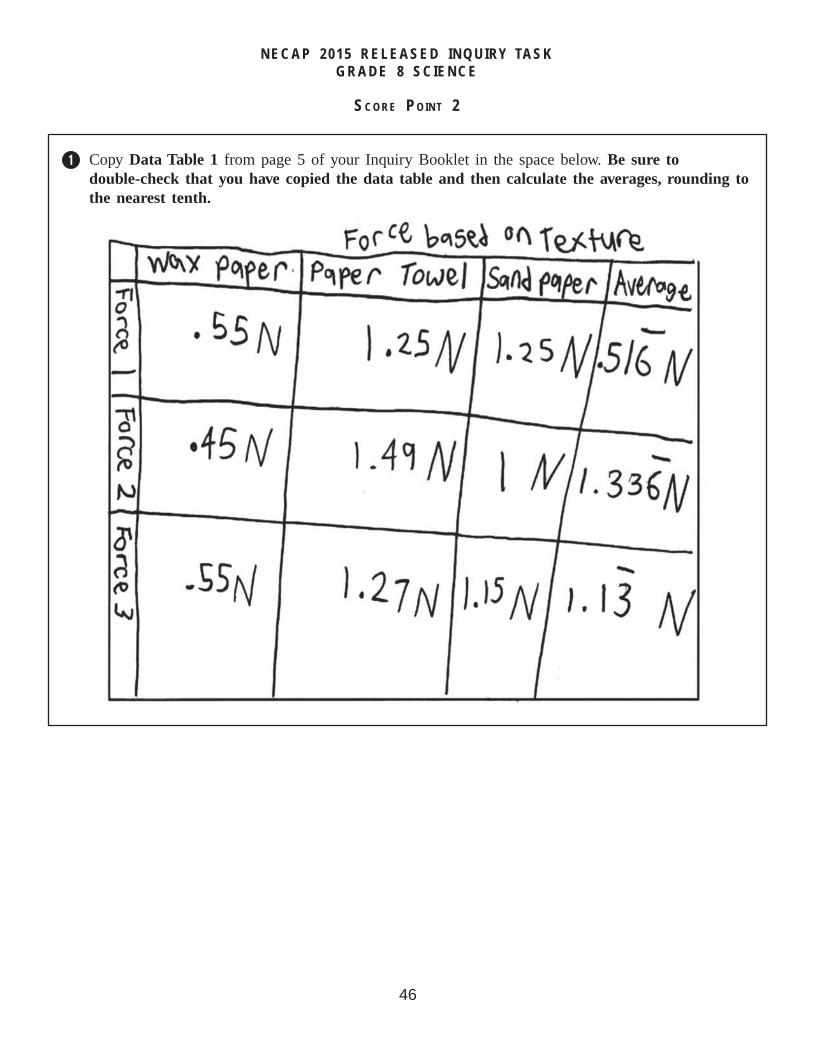
Data Table 1: Effect of Surface Type on Amount of Force of Friction
Needed to Pull a Wooden Block
Surface Trial 1 Force (N)
Trial 2 Force (N)
Trial 3 Force (N)
Average Force (N)
Wax Paper
Sandpaper
Paper Towel
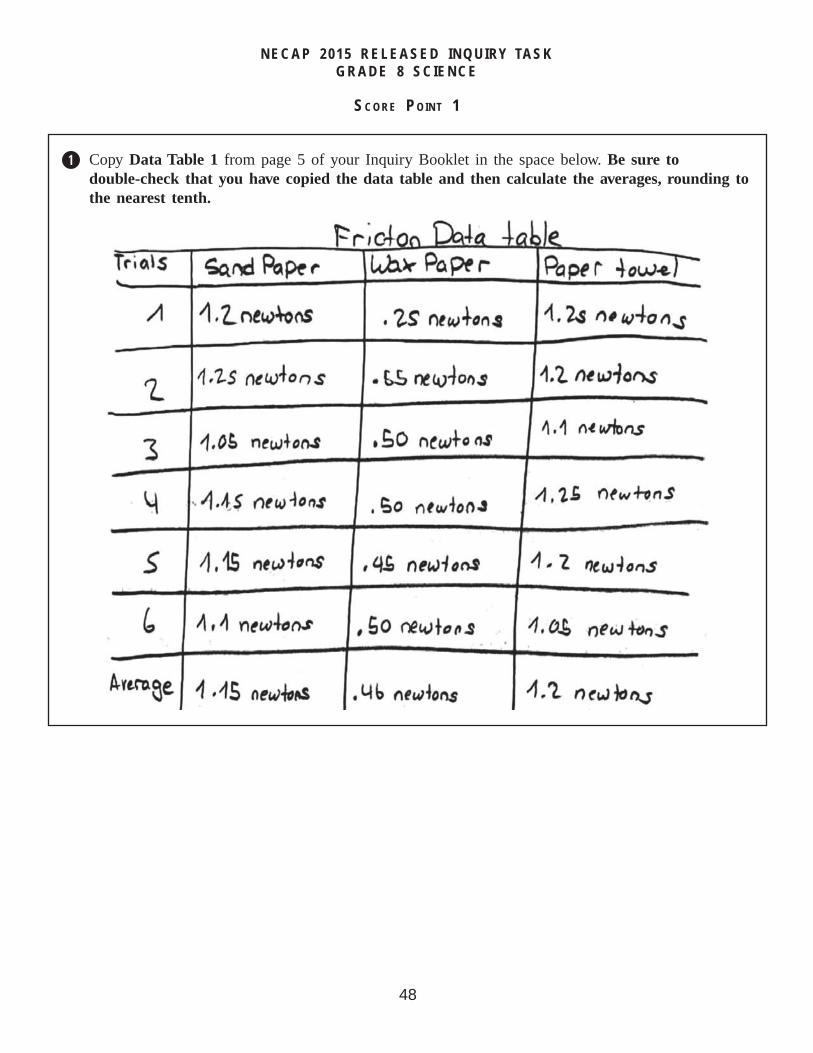
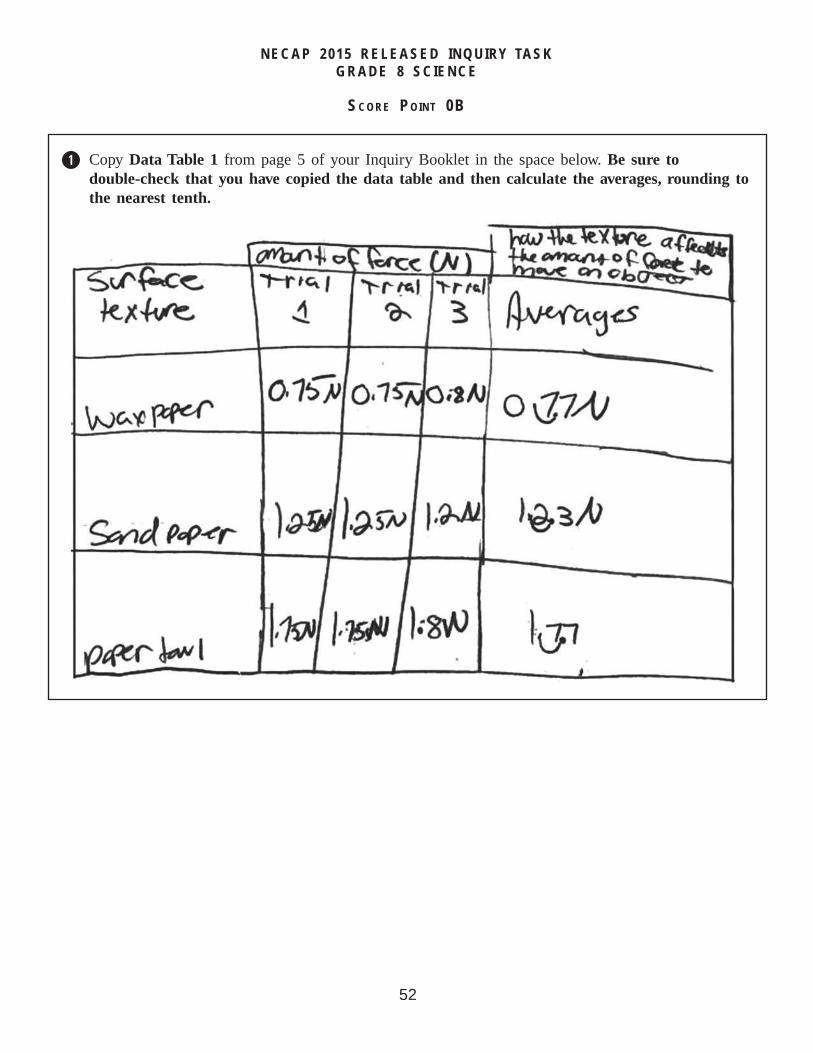
q Copy Data Table 1 from page 5 of your Inquiry Booklet in the space below. Be sure to double-check that you have copied the data table and then calculate the averages, rounding to the nearest tenth.
18NECAP 2015 Grade 8 Science Released Items_V2
NECAP 2015 RELEASED INQUIRY TASKGRADE 8 SCIENCE
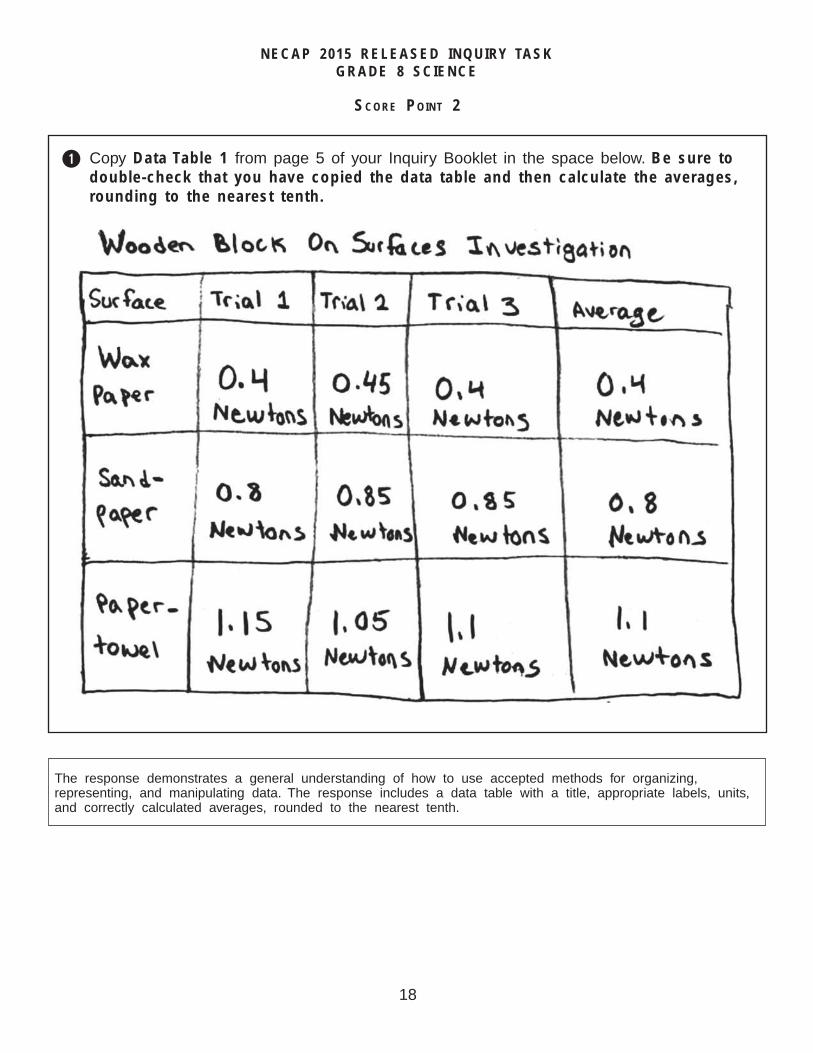
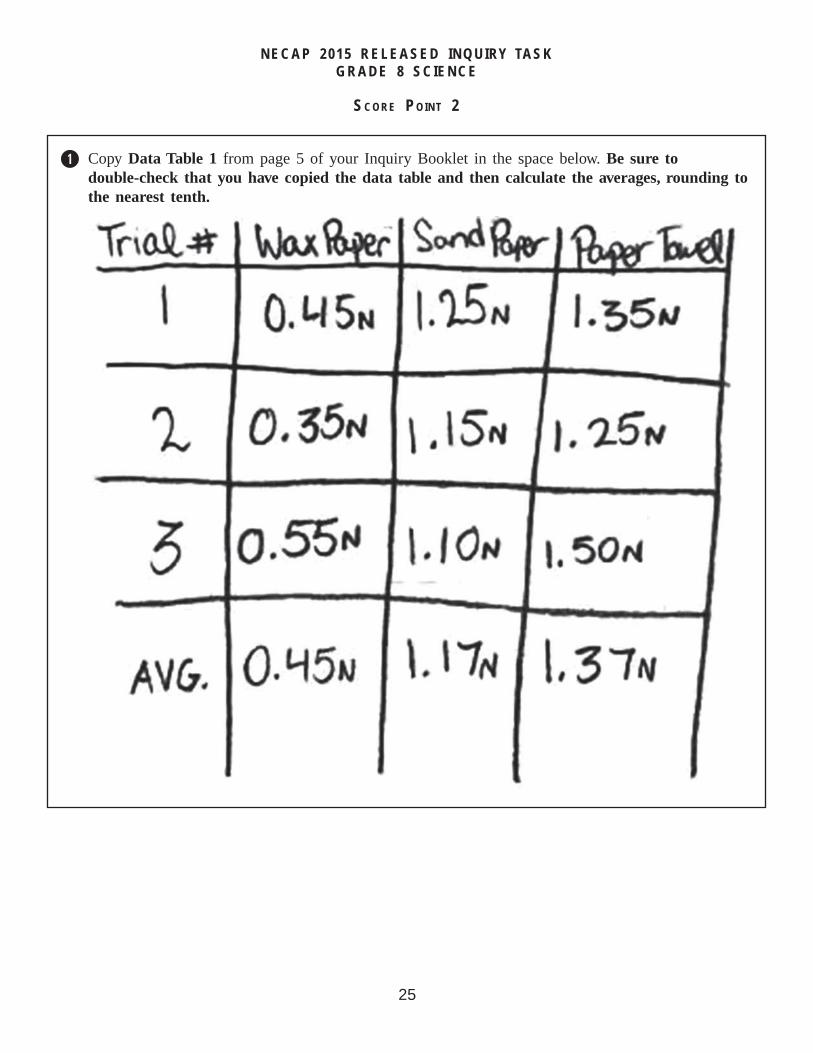
SCORE POINT 2
q Copy Data Table 1 from page 5 of your Inquiry Booklet in the space below. Be sure to double-check that you have copied the data table and then calculate the averages, rounding to the nearest tenth.
The response demonstrates a general understanding of how to use accepted methods for organizing, representing, and manipulating data. The response includes a data table with a title, appropriate labels, units, and correctly calculated averages, rounded to the nearest tenth.
19NECAP 2015 Grade 8 Science Released Items_V2
NECAP 2015 RELEASED INQUIRY TASKGRADE 8 SCIENCE
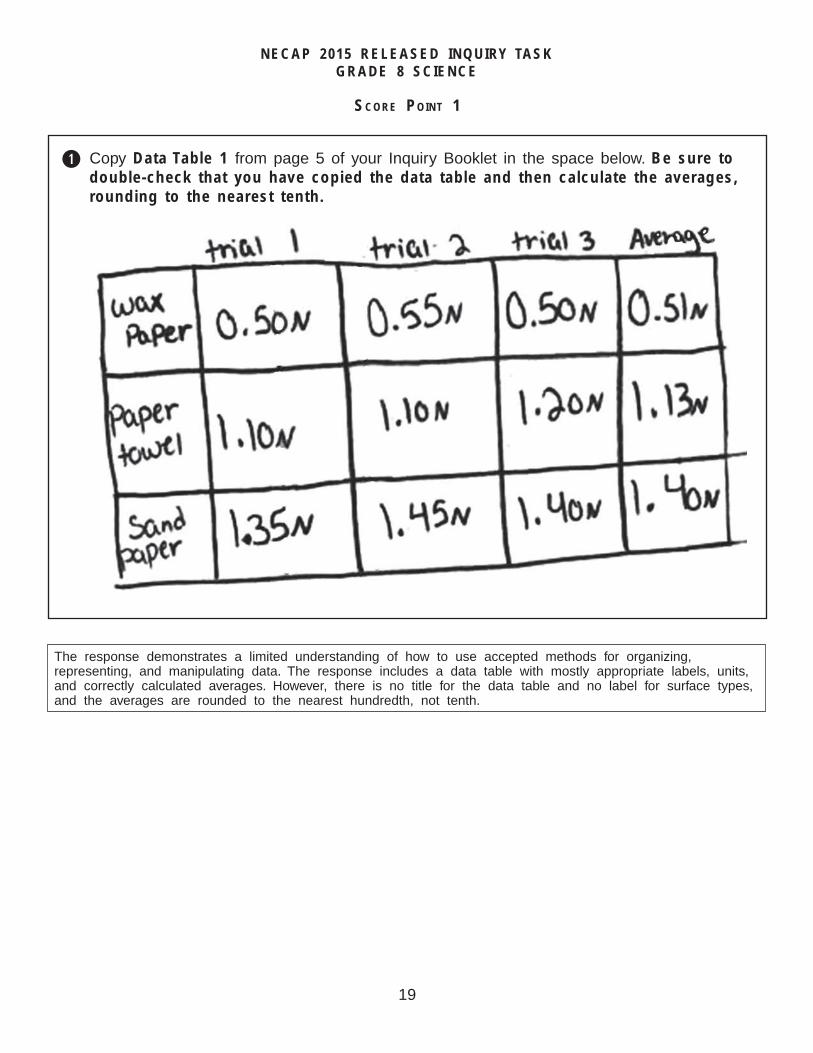
SCORE POINT 1
q Copy Data Table 1 from page 5 of your Inquiry Booklet in the space below. Be sure to double-check that you have copied the data table and then calculate the averages, rounding to the nearest tenth.
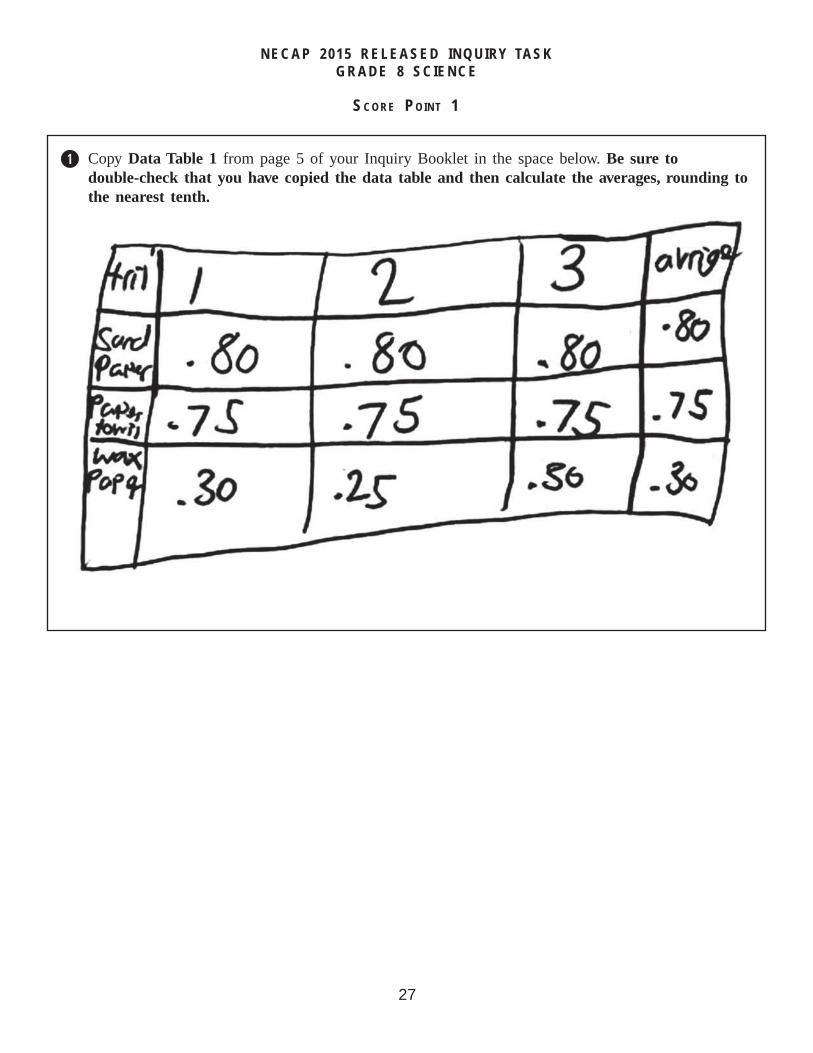
The response demonstrates a limited understanding of how to use accepted methods for organizing, representing, and manipulating data. The response includes a data table with mostly appropriate labels, units, and correctly calculated averages. However, there is no title for the data table and no label for surface types, and the averages are rounded to the nearest hundredth, not tenth.
20NECAP 2015 Grade 8 Science Released Items_V2
NECAP 2015 RELEASED INQUIRY TASKGRADE 8 SCIENCE
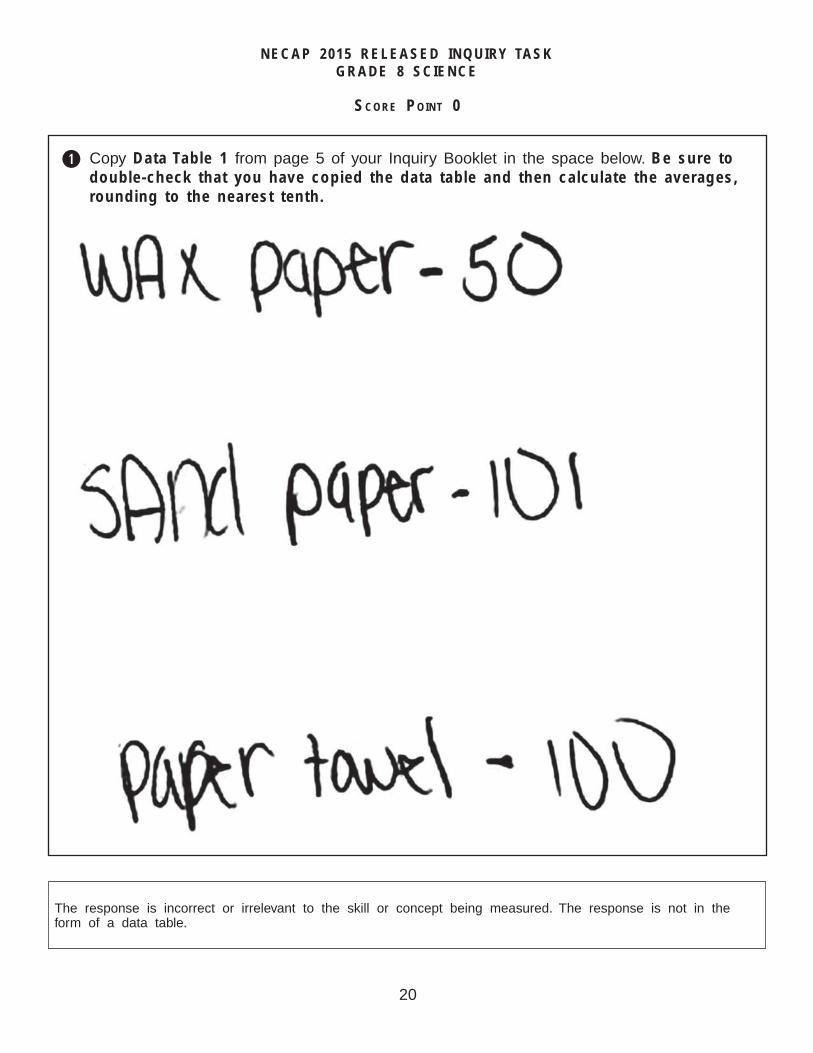
SCORE POINT 0
q Copy Data Table 1 from page 5 of your Inquiry Booklet in the space below. Be sure to double-check that you have copied the data table and then calculate the averages, rounding to the nearest tenth.
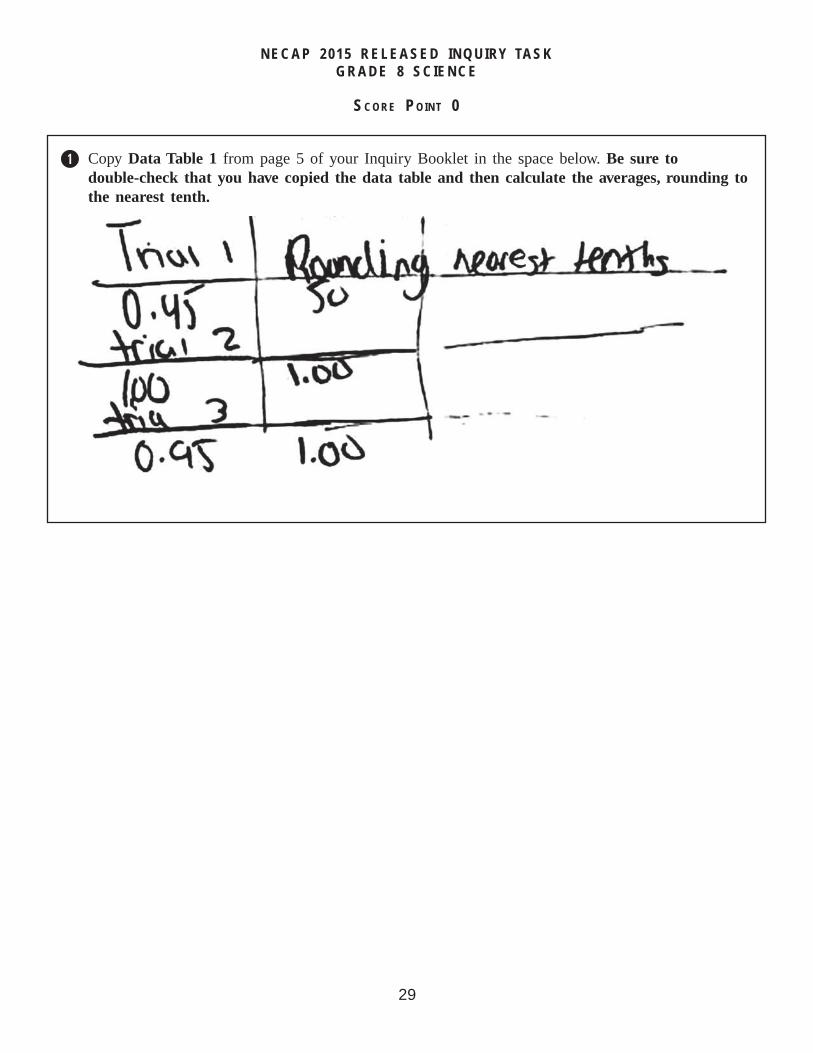
The response is incorrect or irrelevant to the skill or concept being measured. The response is not in the form of a data table.
21NECAP 2015 Grade 8 Science Released Items_V2
NECAP 2015 RELEASED INQUIRY TASKGRADE 8 SCIENCE
Broad Area of Inquiry: Conducting InvestigationsInquiry Construct 8: Use accepted methods for organizing, representing, and manipulating data.
w Use the information in Data Table 1 to create a bar graph of the average force of friction needed to pull the wooden block across the three different surfaces.
Scoring Guide
Score Description
3
The response demonstrates a thorough understanding of how to use accepted methods for organizing, representing, and manipulating data. The response includes a bar graph of the average force of friction needed to pull the wooden block across the three different surfaces that has an appropriate title, axes labels, and scale for the range of data plotted.
2The response demonstrates a general understanding of how to use accepted methods for organizing, representing, and manipulating data. The overall response is general.
1The response demonstrates a limited understanding of how to use accepted methods for organizing, representing, and manipulating data. The overall response is limited.
0 The response is incorrect or irrelevant to the skill or concept being measured.
Blank No response
22NECAP 2015 Grade 8 Science Released Items_V2
NECAP 2015 RELEASED INQUIRY TASKGRADE 8 SCIENCE
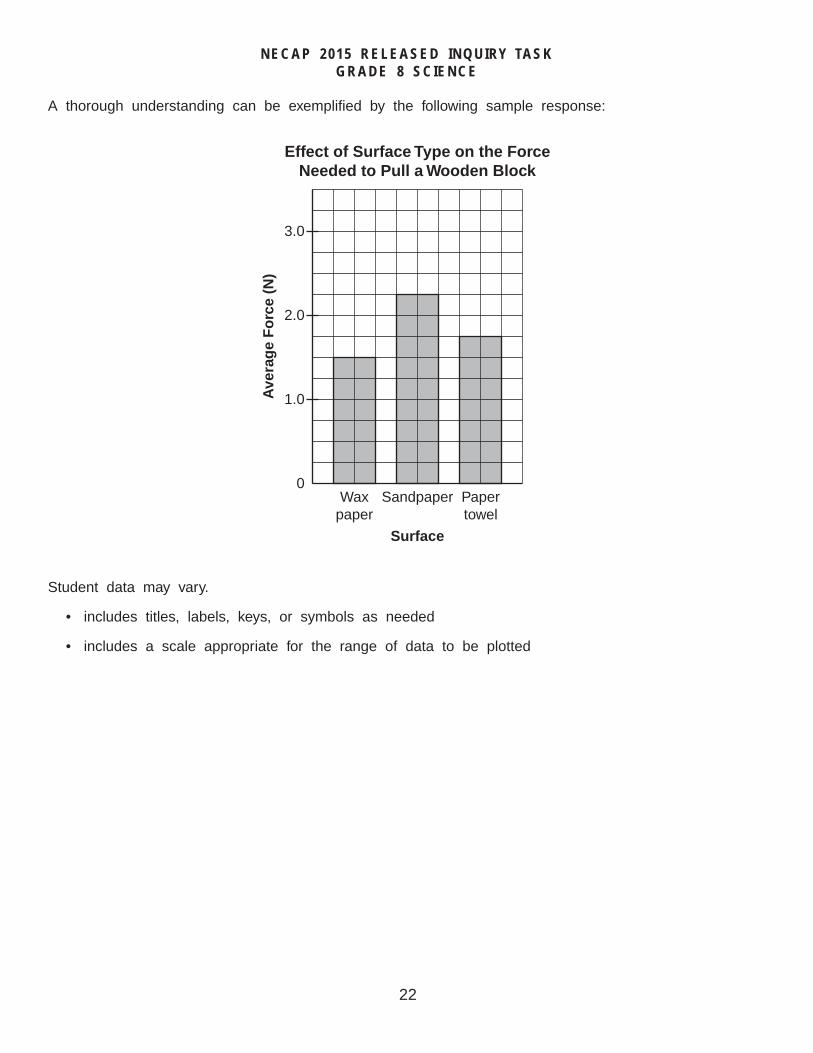
A thorough understanding can be exemplifi ed by the following sample response:
Effect of Surface Type on the ForceNeeded to Pull a Wooden Block
3.0
2.0
1.0
Waxpaper
Papertowel
Sandpaper0
Surface
Ave
rag
e F
orc
e (N
)
Student data may vary.
• includes titles, labels, keys, or symbols as needed
• includes a scale appropriate for the range of data to be plotted
23NECAP 2015 Grade 8 Science Released Items_V2
NECAP 2015 RELEASED INQUIRY TASKGRADE 8 SCIENCE
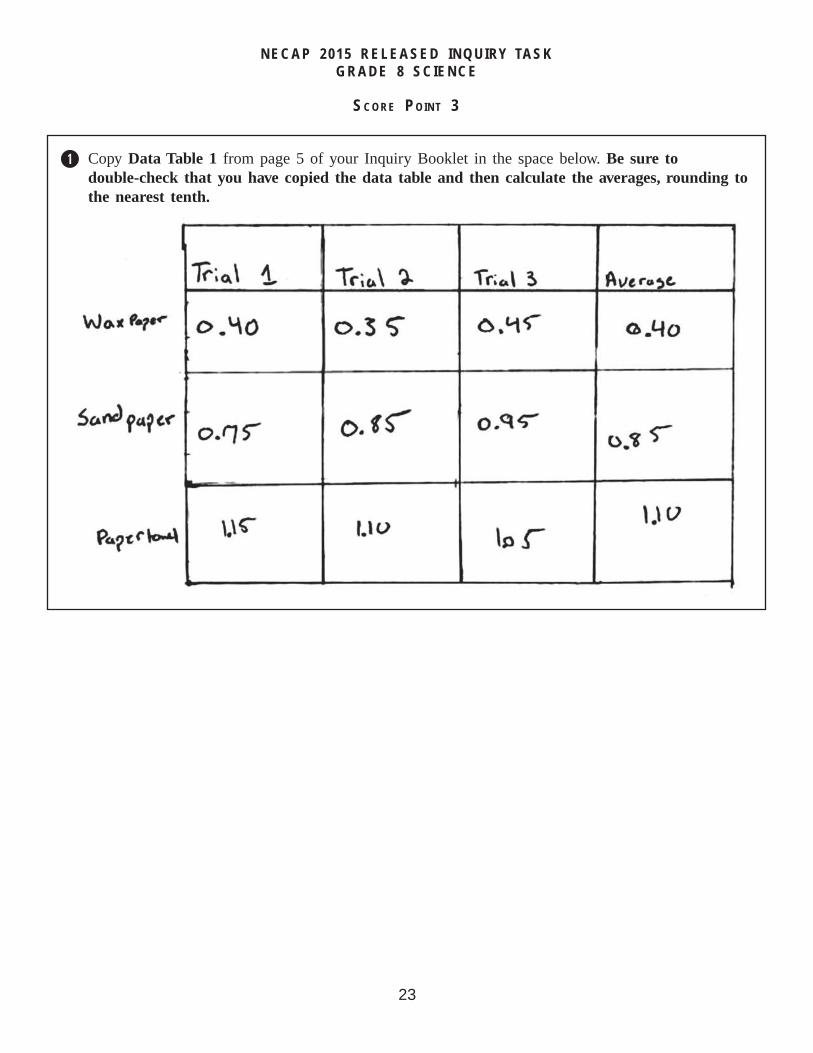
SCORE POINT 3
q Copy Data Table 1 from page 5 of your Inquiry Booklet in the space below. Be sure to double-check that you have copied the data table and then calculate the averages, rounding to the nearest tenth.
24NECAP 2015 Grade 8 Science Released Items_V2
NECAP 2015 RELEASED INQUIRY TASKGRADE 8 SCIENCE
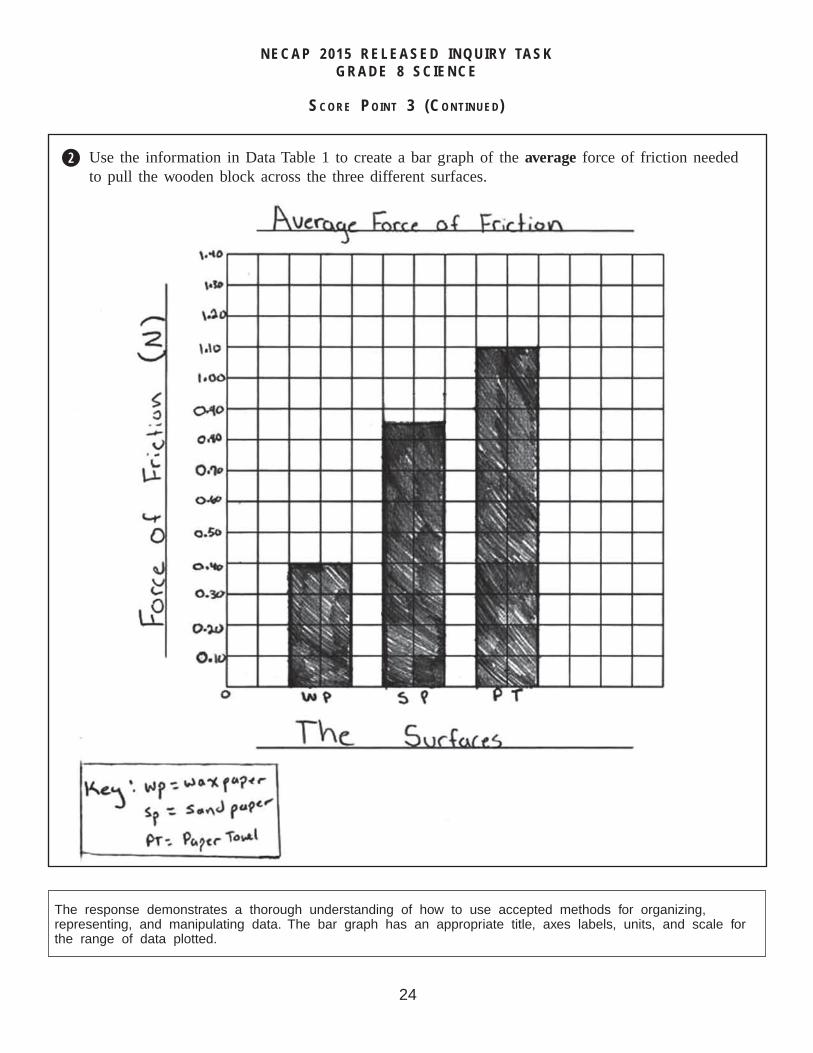
w Use the information in Data Table 1 to create a bar graph of the average force of friction needed to pull the wooden block across the three different surfaces.
The response demonstrates a thorough understanding of how to use accepted methods for organizing, representing, and manipulating data. The bar graph has an appropriate title, axes labels, units, and scale for the range of data plotted.
SCORE POINT 3 (CONTINUED)
25NECAP 2015 Grade 8 Science Released Items_V2
NECAP 2015 RELEASED INQUIRY TASKGRADE 8 SCIENCE
SCORE POINT 2
q Copy Data Table 1 from page 5 of your Inquiry Booklet in the space below. Be sure to double-check that you have copied the data table and then calculate the averages, rounding to the nearest tenth.
26NECAP 2015 Grade 8 Science Released Items_V2
NECAP 2015 RELEASED INQUIRY TASKGRADE 8 SCIENCE
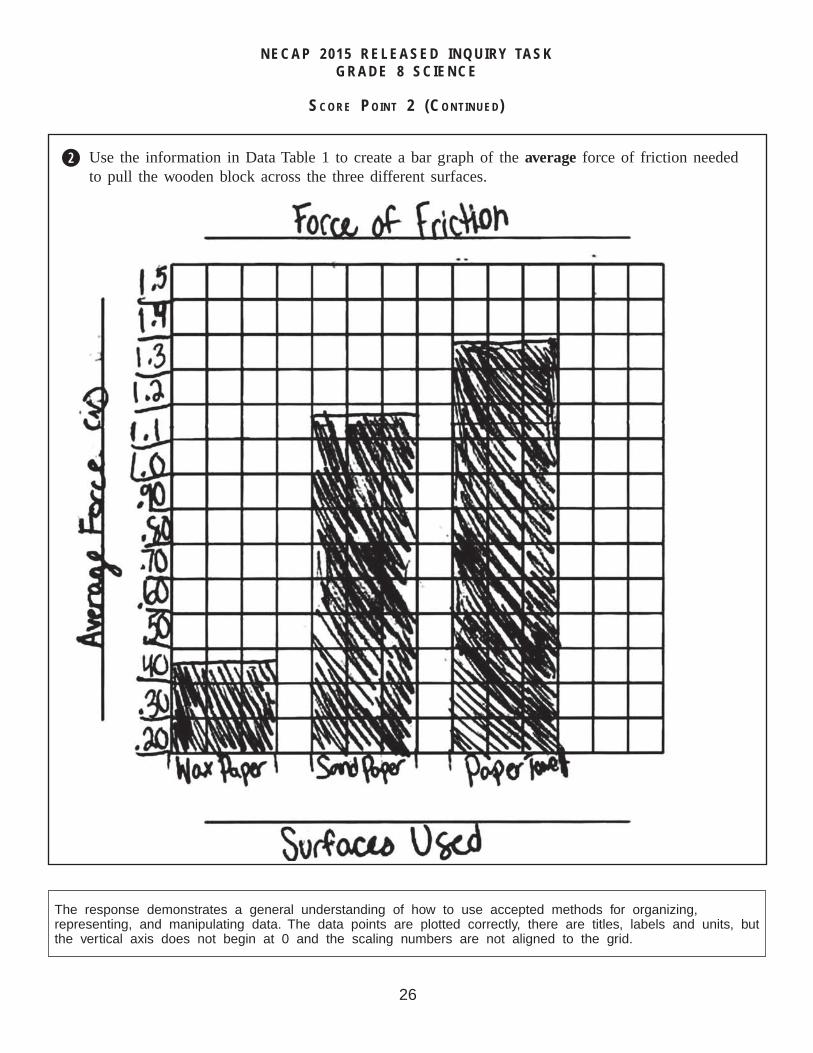
SCORE POINT 2 (CONTINUED)
w Use the information in Data Table 1 to create a bar graph of the average force of friction needed to pull the wooden block across the three different surfaces.
The response demonstrates a general understanding of how to use accepted methods for organizing, representing, and manipulating data. The data points are plotted correctly, there are titles, labels and units, but the vertical axis does not begin at 0 and the scaling numbers are not aligned to the grid.
27NECAP 2015 Grade 8 Science Released Items_V2
NECAP 2015 RELEASED INQUIRY TASKGRADE 8 SCIENCE
SCORE POINT 1
q Copy Data Table 1 from page 5 of your Inquiry Booklet in the space below. Be sure to double-check that you have copied the data table and then calculate the averages, rounding to the nearest tenth.
28NECAP 2015 Grade 8 Science Released Items_V2
NECAP 2015 RELEASED INQUIRY TASKGRADE 8 SCIENCE
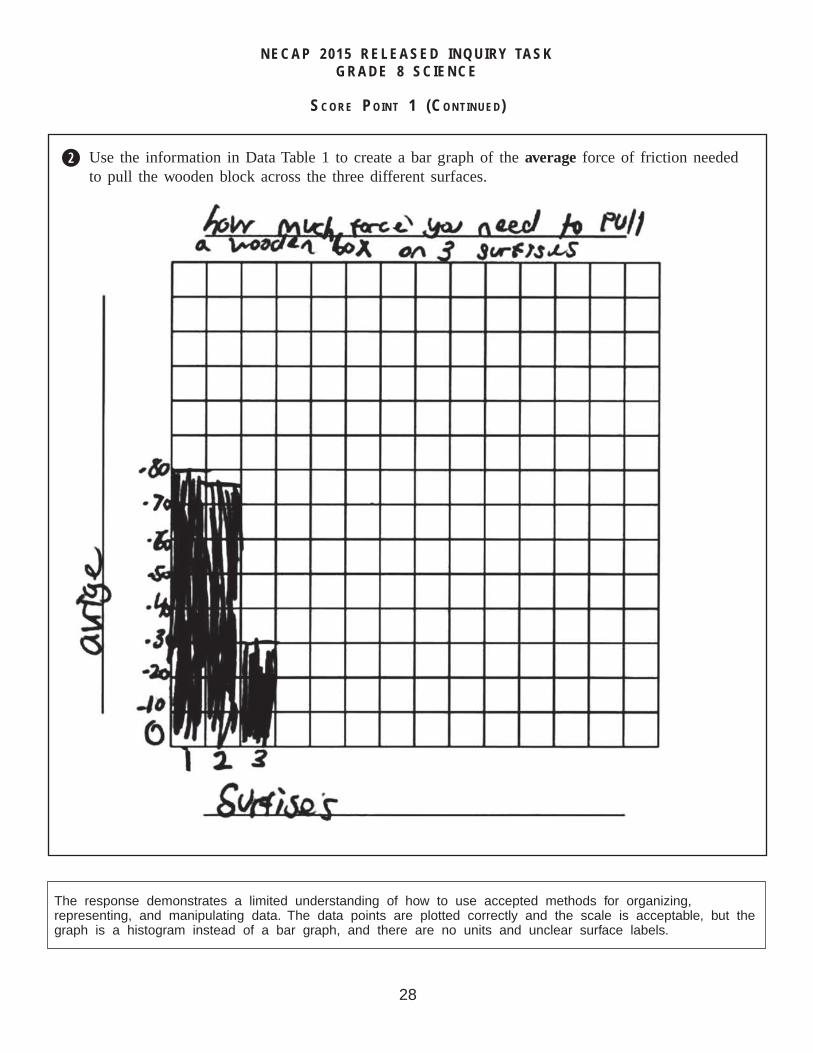
SCORE POINT 1 (CONTINUED)
w Use the information in Data Table 1 to create a bar graph of the average force of friction needed to pull the wooden block across the three different surfaces.
The response demonstrates a limited understanding of how to use accepted methods for organizing, representing, and manipulating data. The data points are plotted correctly and the scale is acceptable, but the graph is a histogram instead of a bar graph, and there are no units and unclear surface labels.
29NECAP 2015 Grade 8 Science Released Items_V2
NECAP 2015 RELEASED INQUIRY TASKGRADE 8 SCIENCE
SCORE POINT 0
q Copy Data Table 1 from page 5 of your Inquiry Booklet in the space below. Be sure to double-check that you have copied the data table and then calculate the averages, rounding to the nearest tenth.
30NECAP 2015 Grade 8 Science Released Items_V2
NECAP 2015 RELEASED INQUIRY TASKGRADE 8 SCIENCE
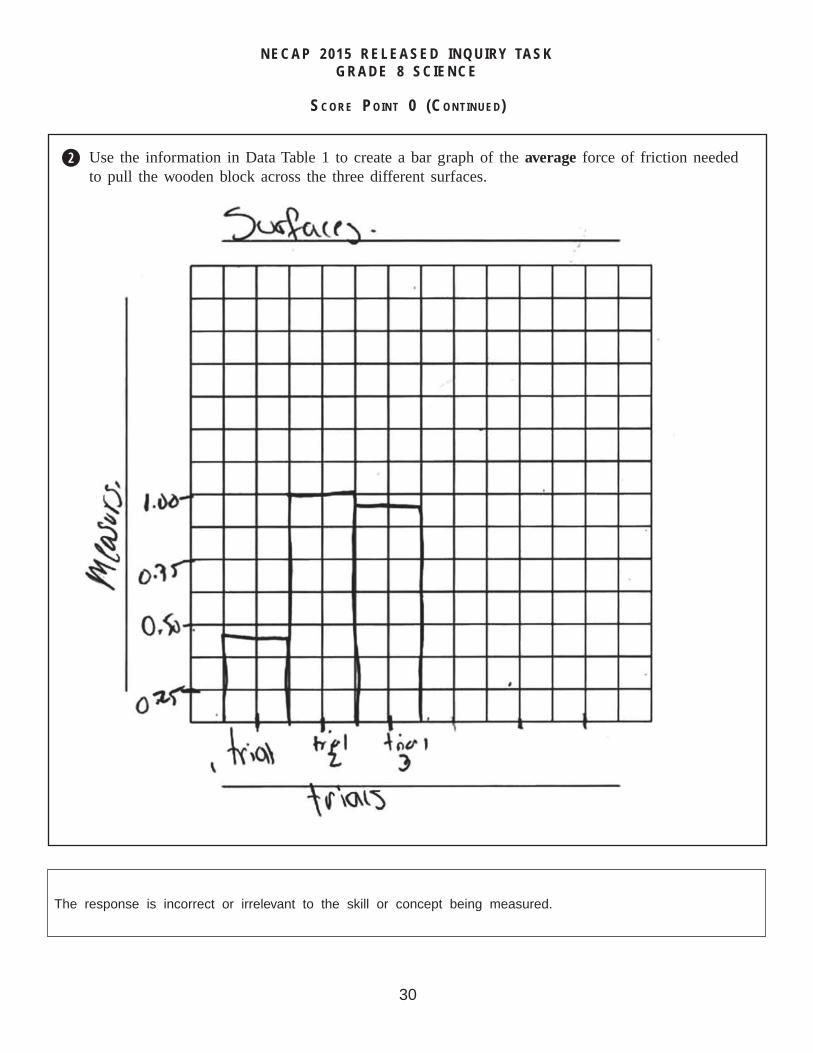
SCORE POINT 0 (CONTINUED)
258715.000 Common, CMN
w Use the information in Data Table 1 to create a bar graph of the average force of friction needed to pull the wooden block across the three different surfaces.
The response is incorrect or irrelevant to the skill or concept being measured.
31NECAP 2015 Grade 8 Science Released Items_V2
NECAP 2015 RELEASED INQUIRY TASKGRADE 8 SCIENCE
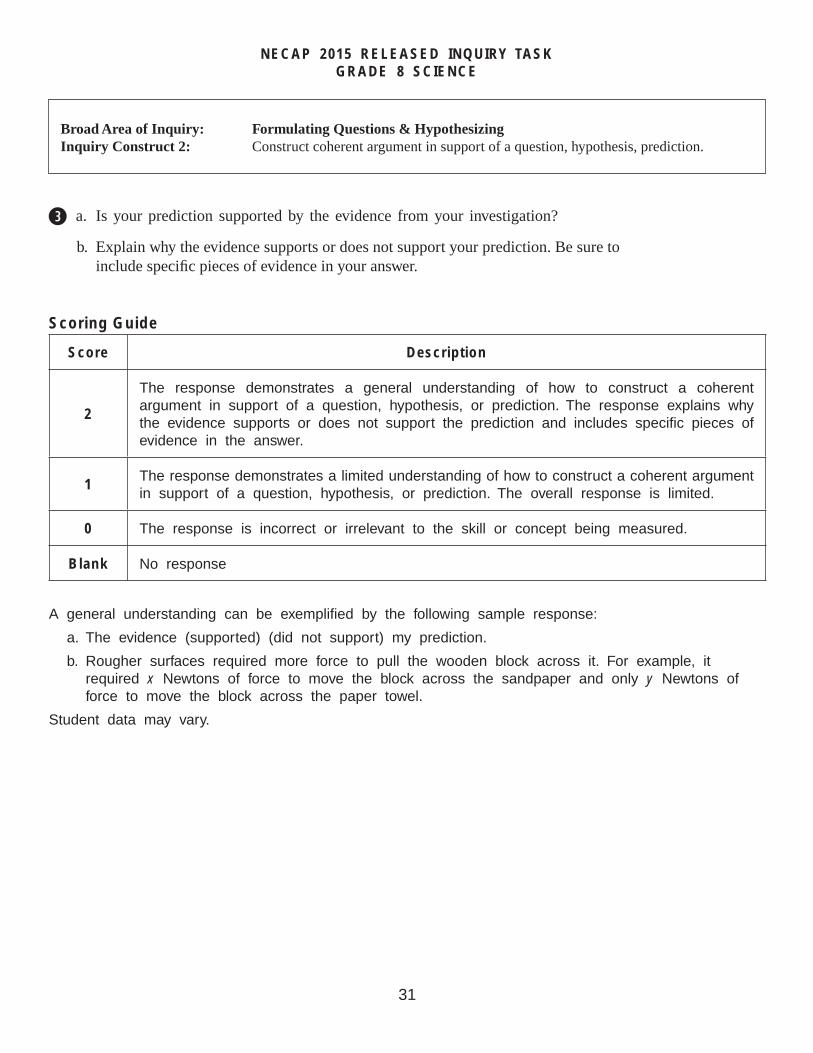
Broad Area of Inquiry: Formulating Questions & HypothesizingInquiry Construct 2: Construct coherent argument in support of a question, hypothesis, prediction.
Scoring Guide
Score Description
2
The response demonstrates a general understanding of how to construct a coherent argument in support of a question, hypothesis, or prediction. The response explains why the evidence supports or does not support the prediction and includes specifi c pieces of evidence in the answer.
1The response demonstrates a limited understanding of how to construct a coherent argument in support of a question, hypothesis, or prediction. The overall response is limited.
0 The response is incorrect or irrelevant to the skill or concept being measured.
Blank No response
A general understanding can be exemplifi ed by the following sample response:
a. The evidence (supported) (did not support) my prediction.
b. Rougher surfaces required more force to pull the wooden block across it. For example, it required x Newtons of force to move the block across the sandpaper and only y Newtons of force to move the block across the paper towel.
Student data may vary.
e a. Is your prediction supported by the evidence from your investigation?
b. Explain why the evidence supports or does not support your prediction. Be sure to include specifi c pieces of evidence in your answer.
32NECAP 2015 Grade 8 Science Released Items_V2
NECAP 2015 RELEASED INQUIRY TASKGRADE 8 SCIENCE
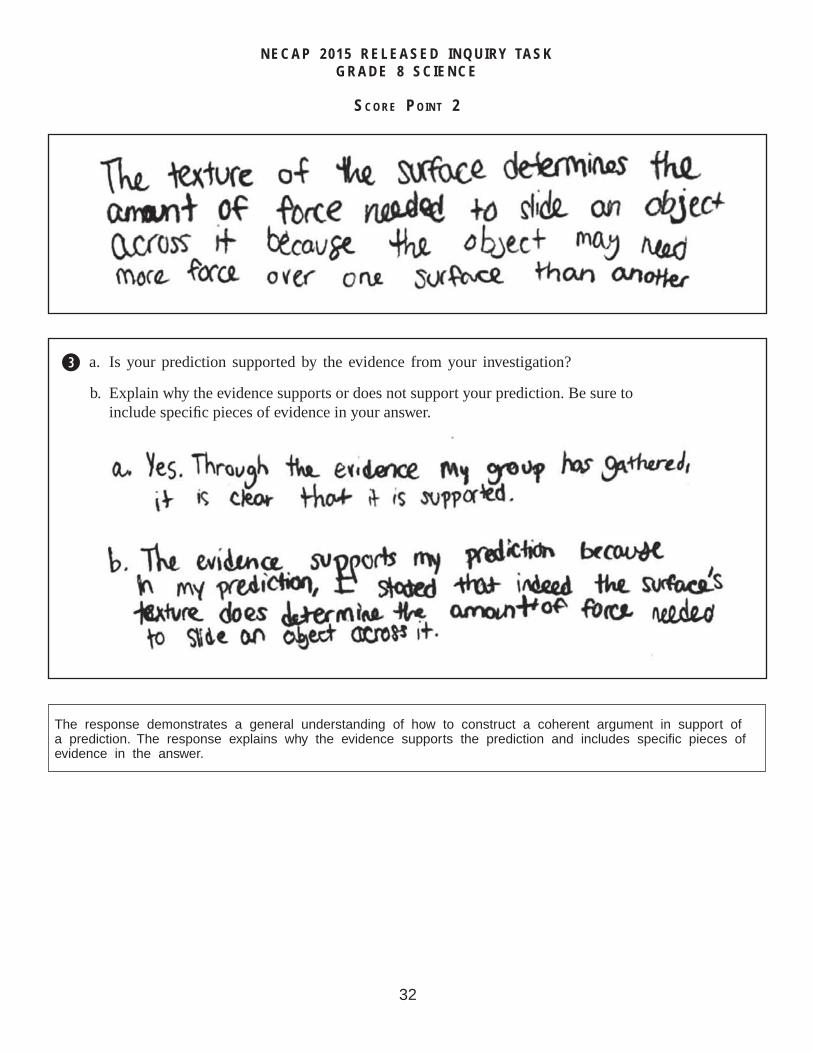
SCORE POINT 2
e a. Is your prediction supported by the evidence from your investigation?
b. Explain why the evidence supports or does not support your prediction. Be sure to include specifi c pieces of evidence in your answer.
The response demonstrates a general understanding of how to construct a coherent argument in support of a prediction. The response explains why the evidence supports the prediction and includes specifi c pieces of evidence in the answer.
33NECAP 2015 Grade 8 Science Released Items_V2
NECAP 2015 RELEASED INQUIRY TASKGRADE 8 SCIENCE
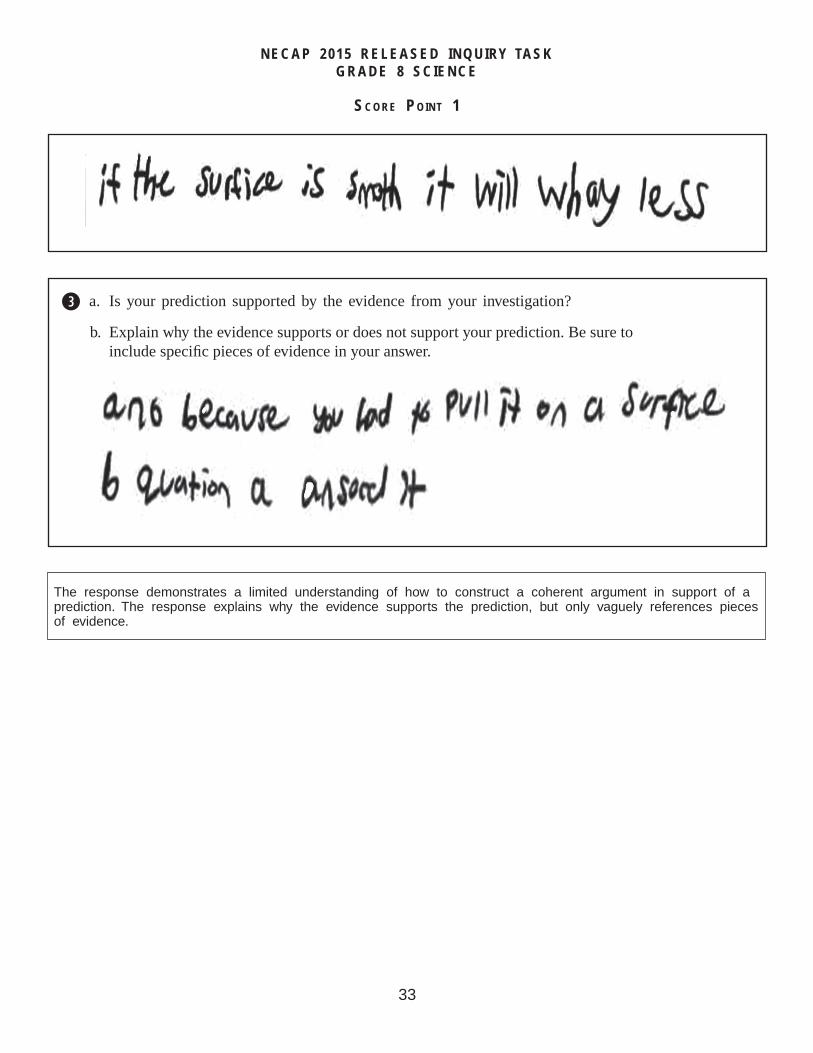
SCORE POINT 1
e a. Is your prediction supported by the evidence from your investigation?
b. Explain why the evidence supports or does not support your prediction. Be sure to include specifi c pieces of evidence in your answer.
The response demonstrates a limited understanding of how to construct a coherent argument in support of a prediction. The response explains why the evidence supports the prediction, but only vaguely references pieces of evidence.
34NECAP 2015 Grade 8 Science Released Items_V2
NECAP 2015 RELEASED INQUIRY TASKGRADE 8 SCIENCE
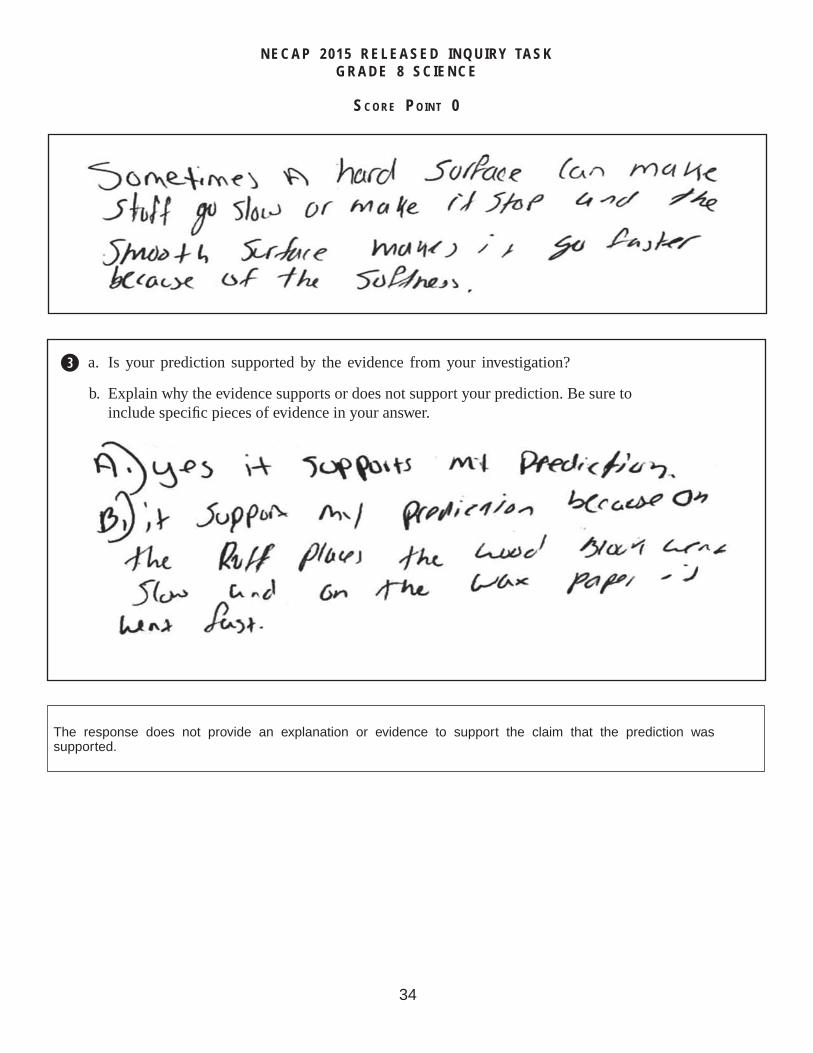
SCORE POINT 0
e a. Is your prediction supported by the evidence from your investigation?
b. Explain why the evidence supports or does not support your prediction. Be sure to include specifi c pieces of evidence in your answer.
The response does not provide an explanation or evidence to support the claim that the prediction was supported.
35NECAP 2015 Grade 8 Science Released Items_V2
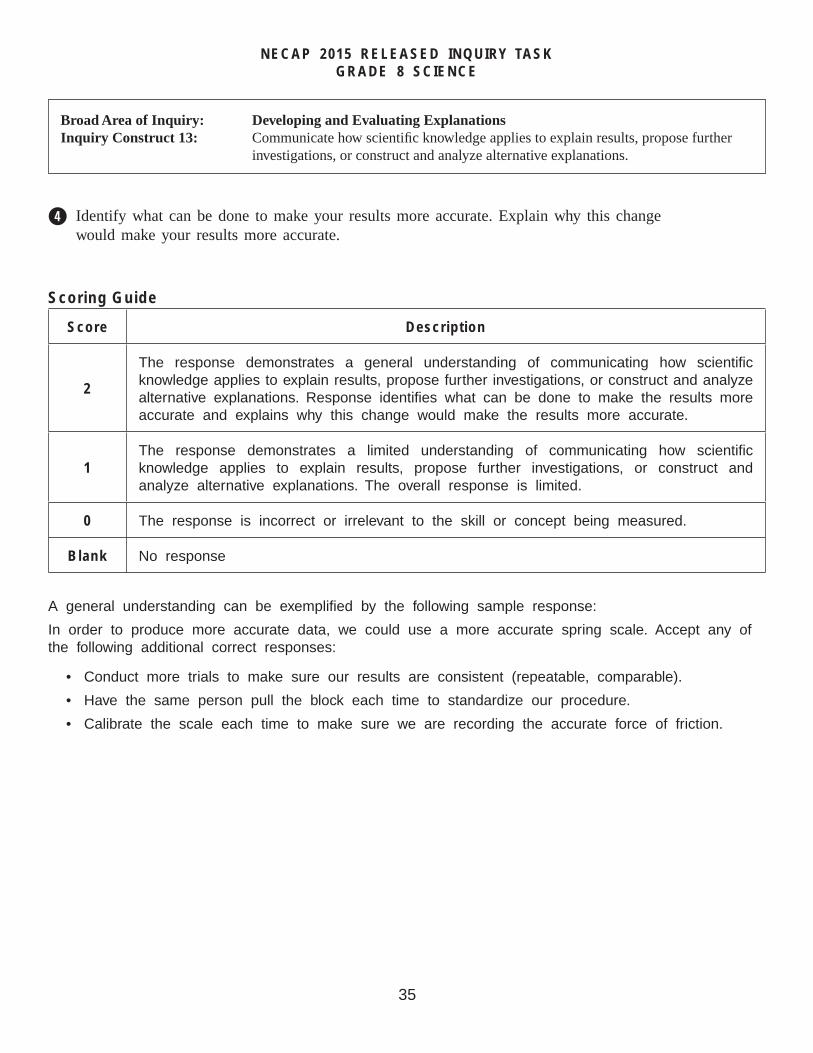
NECAP 2015 RELEASED INQUIRY TASKGRADE 8 SCIENCE
Broad Area of Inquiry: Developing and Evaluating ExplanationsInquiry Construct 13: Communicate how scientifi c knowledge applies to explain results, propose further
investigations, or construct and analyze alternative explanations.
Scoring Guide
Score Description
2
The response demonstrates a general understanding of communicating how scientifi c knowledge applies to explain results, propose further investigations, or construct and analyze alternative explanations. Response identifi es what can be done to make the results more accurate and explains why this change would make the results more accurate.
1The response demonstrates a limited understanding of communicating how scientifi c knowledge applies to explain results, propose further investigations, or construct and analyze alternative explanations. The overall response is limited.
0 The response is incorrect or irrelevant to the skill or concept being measured.
Blank No response
A general understanding can be exemplifi ed by the following sample response:
In order to produce more accurate data, we could use a more accurate spring scale. Accept any of the following additional correct responses:
• Conduct more trials to make sure our results are consistent (repeatable, comparable).
• Have the same person pull the block each time to standardize our procedure.
• Calibrate the scale each time to make sure we are recording the accurate force of friction.
r Identify what can be done to make your results more accurate. Explain why this change would make your results more accurate.
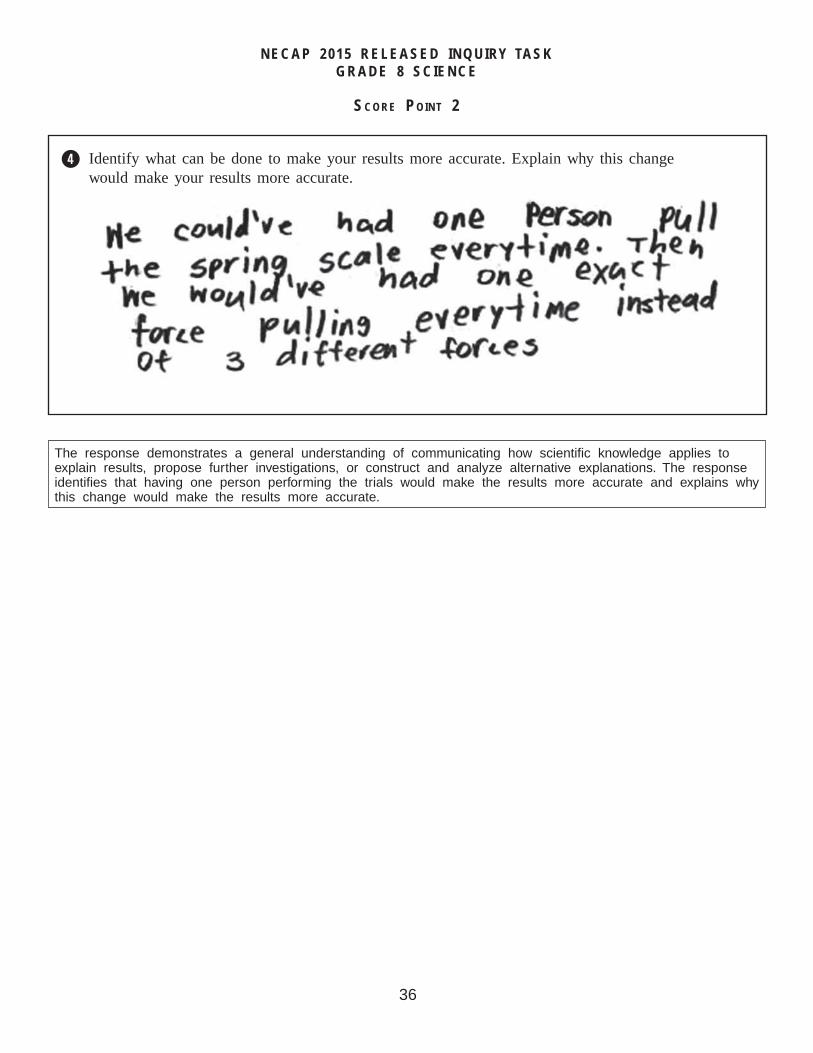
36NECAP 2015 Grade 8 Science Released Items_V2
NECAP 2015 RELEASED INQUIRY TASKGRADE 8 SCIENCE
SCORE POINT 2
r Identify what can be done to make your results more accurate. Explain why this change would make your results more accurate.
The response demonstrates a general understanding of communicating how scientifi c knowledge applies to explain results, propose further investigations, or construct and analyze alternative explanations. The response identifi es that having one person performing the trials would make the results more accurate and explains why this change would make the results more accurate.
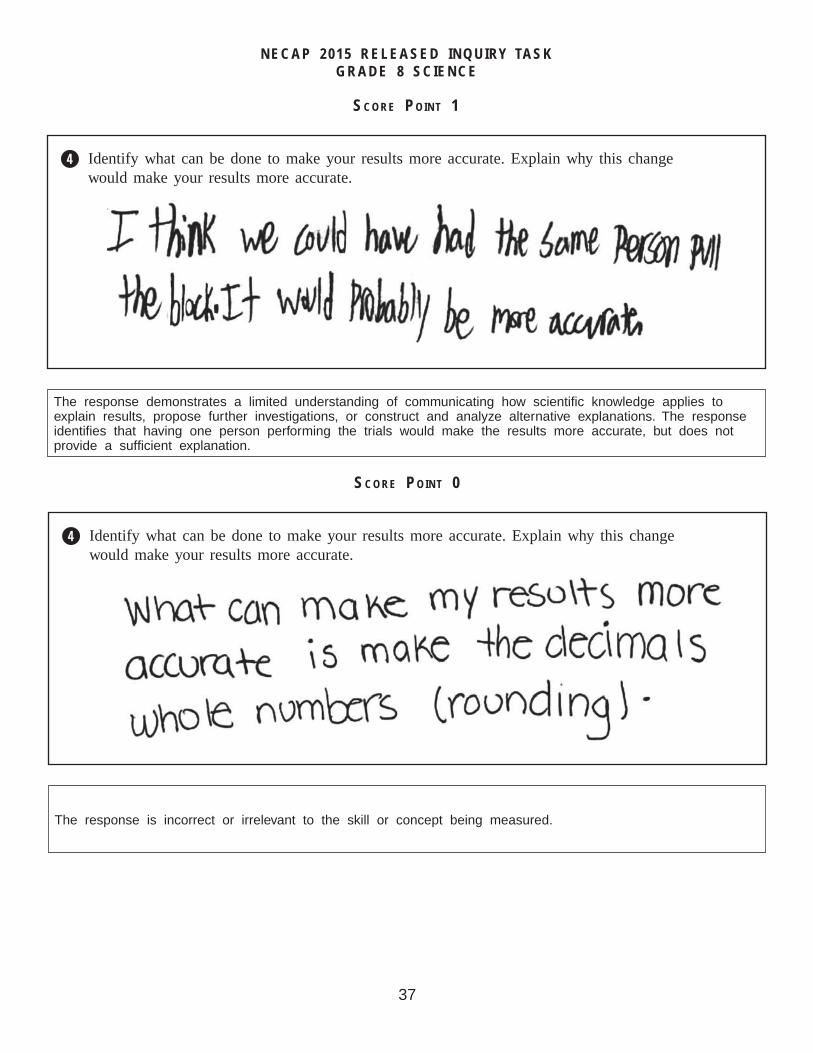
37NECAP 2015 Grade 8 Science Released Items_V2
NECAP 2015 RELEASED INQUIRY TASKGRADE 8 SCIENCE
SCORE POINT 1
r Identify what can be done to make your results more accurate. Explain why this change would make your results more accurate.
The response demonstrates a limited understanding of communicating how scientifi c knowledge applies to explain results, propose further investigations, or construct and analyze alternative explanations. The response identifi es that having one person performing the trials would make the results more accurate, but does not provide a suffi cient explanation.
SCORE POINT 0
r Identify what can be done to make your results more accurate. Explain why this change would make your results more accurate.
The response is incorrect or irrelevant to the skill or concept being measured.
38NECAP 2015 Grade 8 Science Released Items_V2
NECAP 2015 RELEASED INQUIRY TASKGRADE 8 SCIENCE
Broad Area of Inquiry: Conducting InvestigationsInquiry Construct 8: Use accepted methods for organizing, representing, and manipulating data.
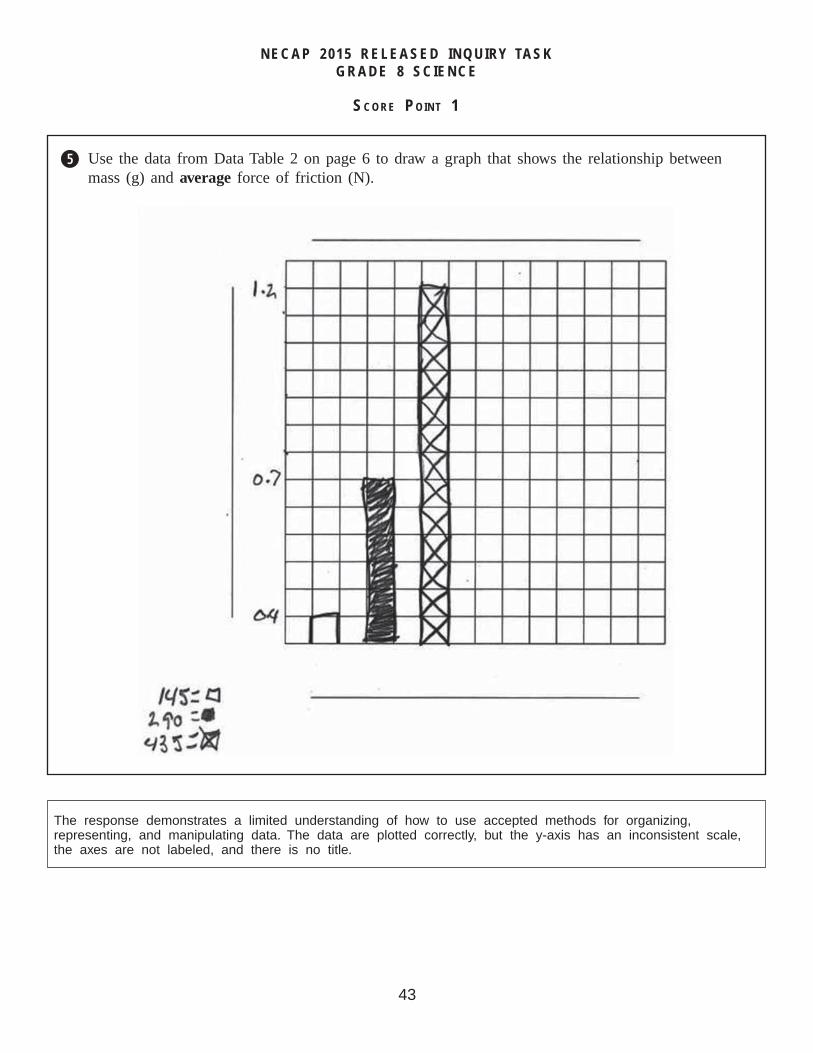
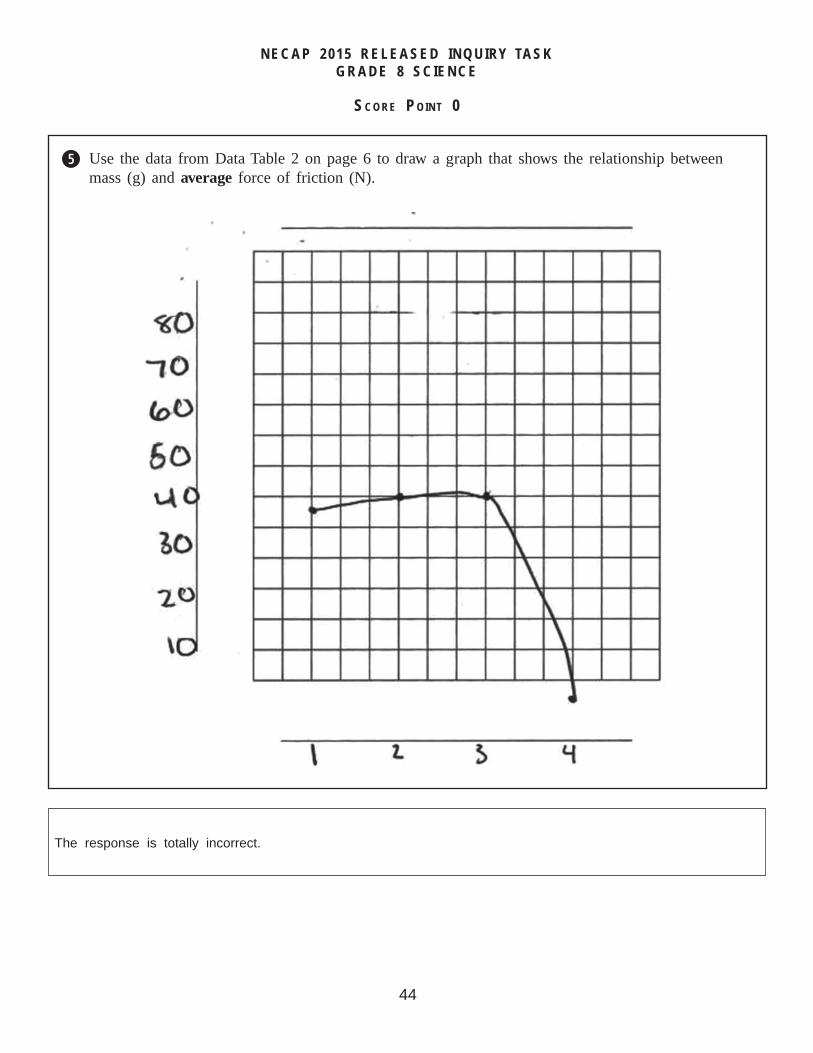
t Use the data from Data Table 2 on page 6 to draw a graph that shows the relationship between mass (g) and average force of friction (N).
Scoring Guide
Score Description
3
The response demonstrates a thorough understanding of how to use accepted methods for organizing, representing, and manipulating data. The response includes a graph of the relationship between mass (g) and average force of friction (N). Graph has appropriate title, axes labels, and scale for the range of data plotted.
2The response demonstrates a general understanding of how to use accepted methods for organizing, representing, and manipulating data. The overall response is general.
1The response demonstrates a limited understanding of how to use accepted methods for organizing, representing, and manipulating data. The overall response is limited.
0 The response is incorrect or irrelevant to the skill or concept being measured.
Blank No response
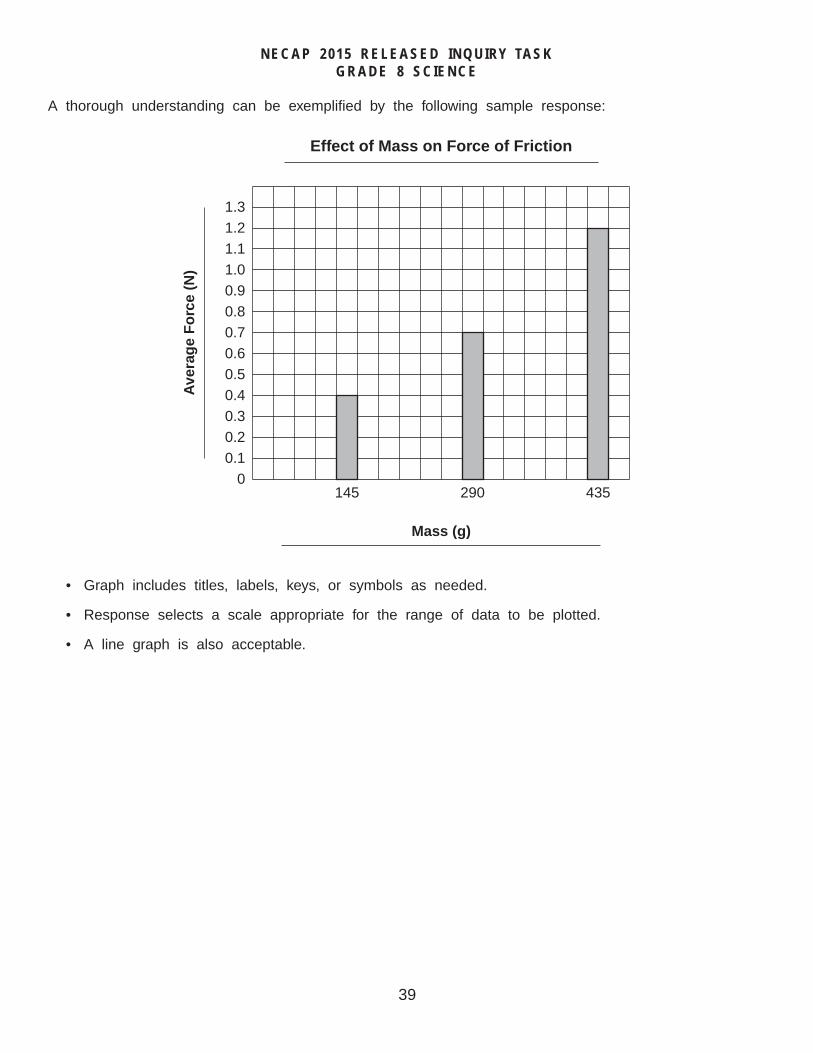
39NECAP 2015 Grade 8 Science Released Items_V2
NECAP 2015 RELEASED INQUIRY TASKGRADE 8 SCIENCE
A thorough understanding can be exemplifi ed by the following sample response:
Mass (g)
Ave
rag
e F
orc
e (N
)
145 290 435
0.10
0.20.30.40.50.60.70.80.91.01.11.21.3
Effect of Mass on Force of Friction
• Graph includes titles, labels, keys, or symbols as needed.
• Response selects a scale appropriate for the range of data to be plotted.
• A line graph is also acceptable.
40NECAP 2015 Grade 8 Science Released Items_V2
NECAP 2015 RELEASED INQUIRY TASKGRADE 8 SCIENCE
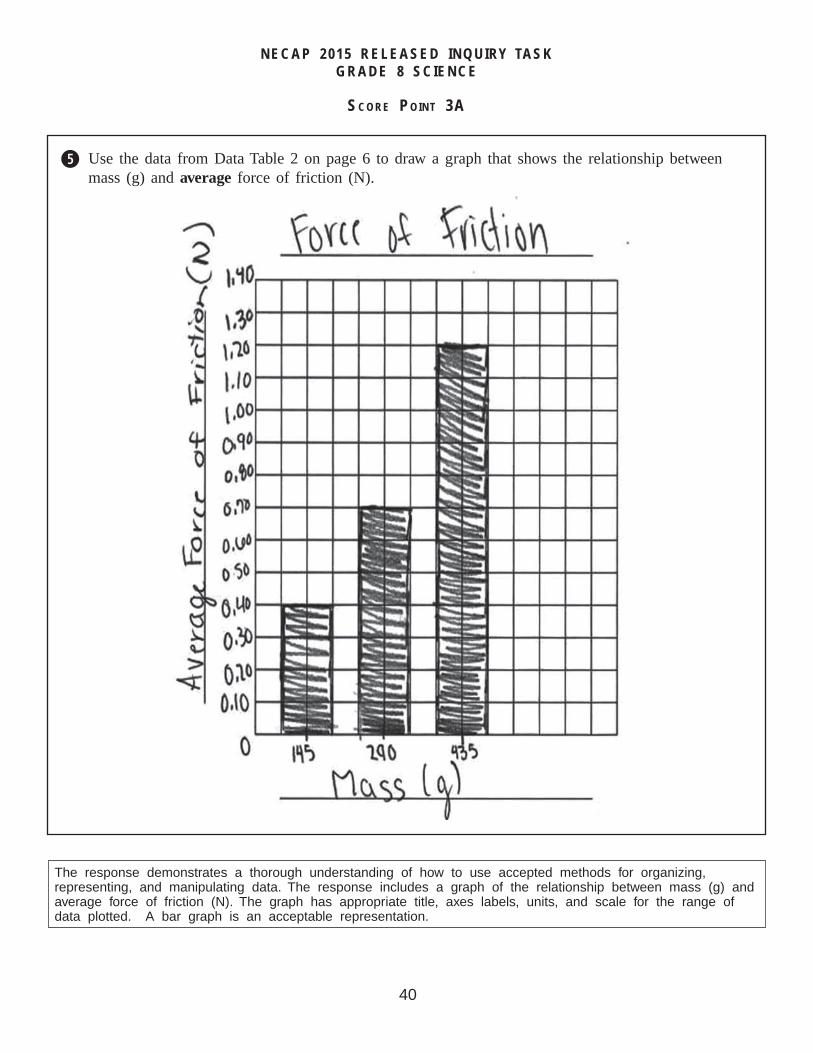
t Use the data from Data Table 2 on page 6 to draw a graph that shows the relationship between mass (g) and average force of friction (N).
SCORE POINT 3A
The response demonstrates a thorough understanding of how to use accepted methods for organizing, representing, and manipulating data. The response includes a graph of the relationship between mass (g) and average force of friction (N). The graph has appropriate title, axes labels, units, and scale for the range of data plotted. A bar graph is an acceptable representation.
41NECAP 2015 Grade 8 Science Released Items_V2
NECAP 2015 RELEASED INQUIRY TASKGRADE 8 SCIENCE
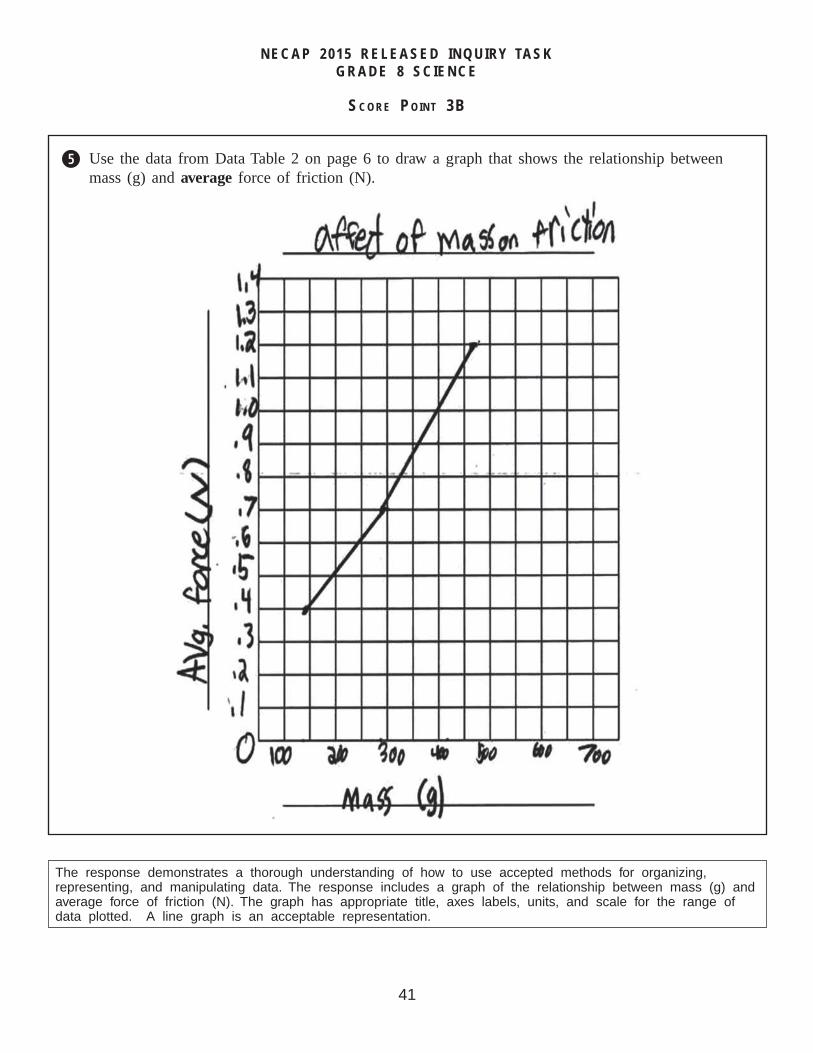
t Use the data from Data Table 2 on page 6 to draw a graph that shows the relationship between mass (g) and average force of friction (N).
SCORE POINT 3B
The response demonstrates a thorough understanding of how to use accepted methods for organizing, representing, and manipulating data. The response includes a graph of the relationship between mass (g) and average force of friction (N). The graph has appropriate title, axes labels, units, and scale for the range of data plotted. A line graph is an acceptable representation.
42NECAP 2015 Grade 8 Science Released Items_V2
NECAP 2015 RELEASED INQUIRY TASKGRADE 8 SCIENCE
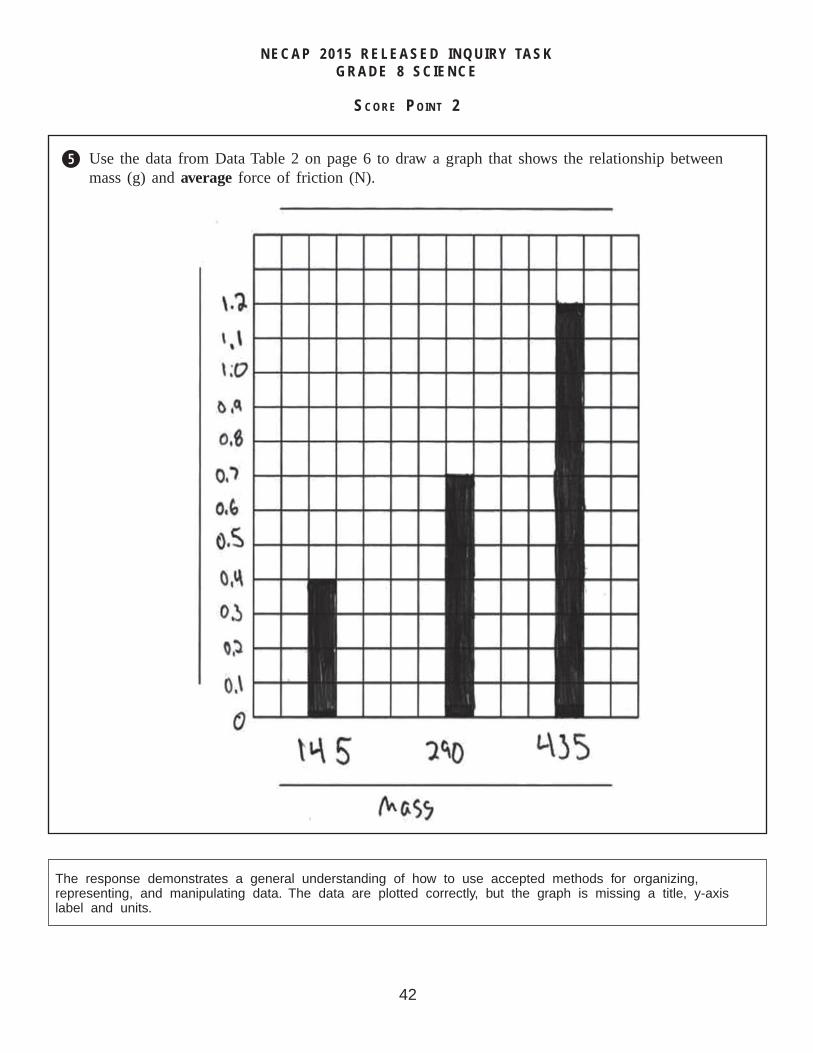
t Use the data from Data Table 2 on page 6 to draw a graph that shows the relationship between mass (g) and average force of friction (N).
SCORE POINT 2
The response demonstrates a general understanding of how to use accepted methods for organizing, representing, and manipulating data. The data are plotted correctly, but the graph is missing a title, y-axis label and units.
43NECAP 2015 Grade 8 Science Released Items_V2
NECAP 2015 RELEASED INQUIRY TASKGRADE 8 SCIENCE
t Use the data from Data Table 2 on page 6 to draw a graph that shows the relationship between mass (g) and average force of friction (N).
SCORE POINT 1
The response demonstrates a limited understanding of how to use accepted methods for organizing, representing, and manipulating data. The data are plotted correctly, but the y-axis has an inconsistent scale, the axes are not labeled, and there is no title.
44NECAP 2015 Grade 8 Science Released Items_V2
NECAP 2015 RELEASED INQUIRY TASKGRADE 8 SCIENCE
t Use the data from Data Table 2 on page 6 to draw a graph that shows the relationship between mass (g) and average force of friction (N).
SCORE POINT 0
The response is totally incorrect.
45NECAP 2015 Grade 8 Science Released Items_V2
NECAP 2015 RELEASED INQUIRY TASKGRADE 8 SCIENCE
Broad Area of Inquiry: Planning and Critiquing of InvestigationsInquiry Construct 4: Identify information/evidence that needs to be collected in order to answer the
question, hypothesis, prediction.
Scoring Guide
Score Description
2
The response demonstrates a general understanding of how to identify information/evidence that needs to be collected in order to answer the question, hypothesis, or prediction. Response identifi es which variable had the greatest effect on the force of friction needed to pull the wooden blocks, using evidence from Data Tables 1, 2, and 3 to explain the answer.
1The response demonstrates a limited understanding of how to identify information/evidence that needs to be collected in order to answer the question, hypothesis, or prediction. The overall response is limited.
0 The response is incorrect or irrelevant to the skill or concept being measured.
Blank No response
A general understanding can be exemplifi ed by the following sample response:
Mass and surface type are the variables that affected the force of friction. When mass increased from 145 g to 435 g, the amount of force needed to pull the block increased from 0.38 N to 1.17 N. Rougher surfaces required more force to pull the wooden block across them. The smooth wax paper needed only x N of force to pull the block, while the rougher sandpaper needed y N of force. Surface area had no effect on the amount of force needed to pull the blocks.
Student data may vary.
Only one variable is necessary.
Accept either mass or surface type if evidence is used to explain the answer.
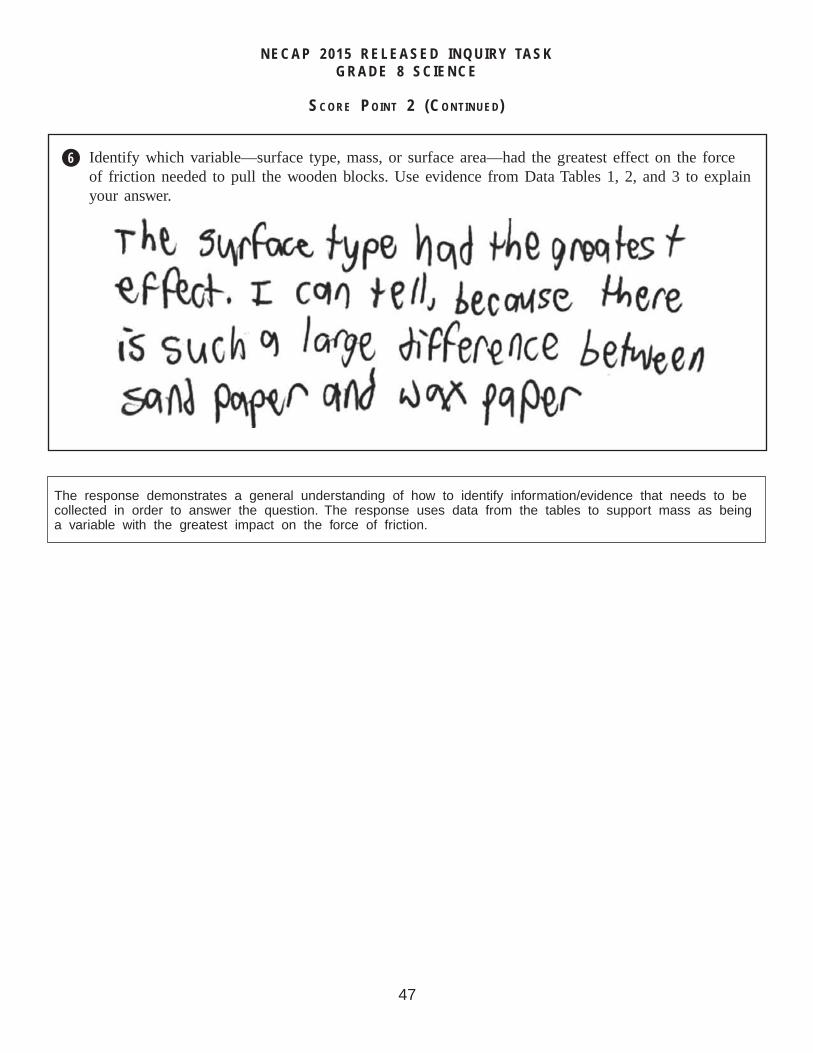
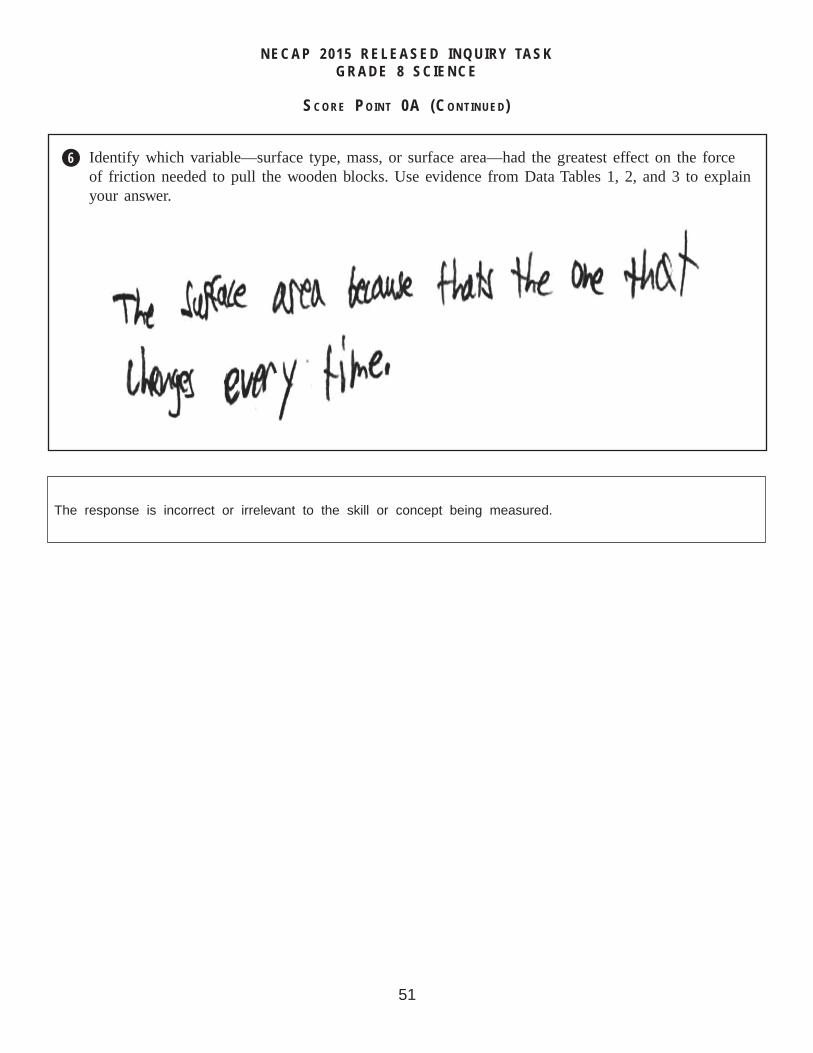
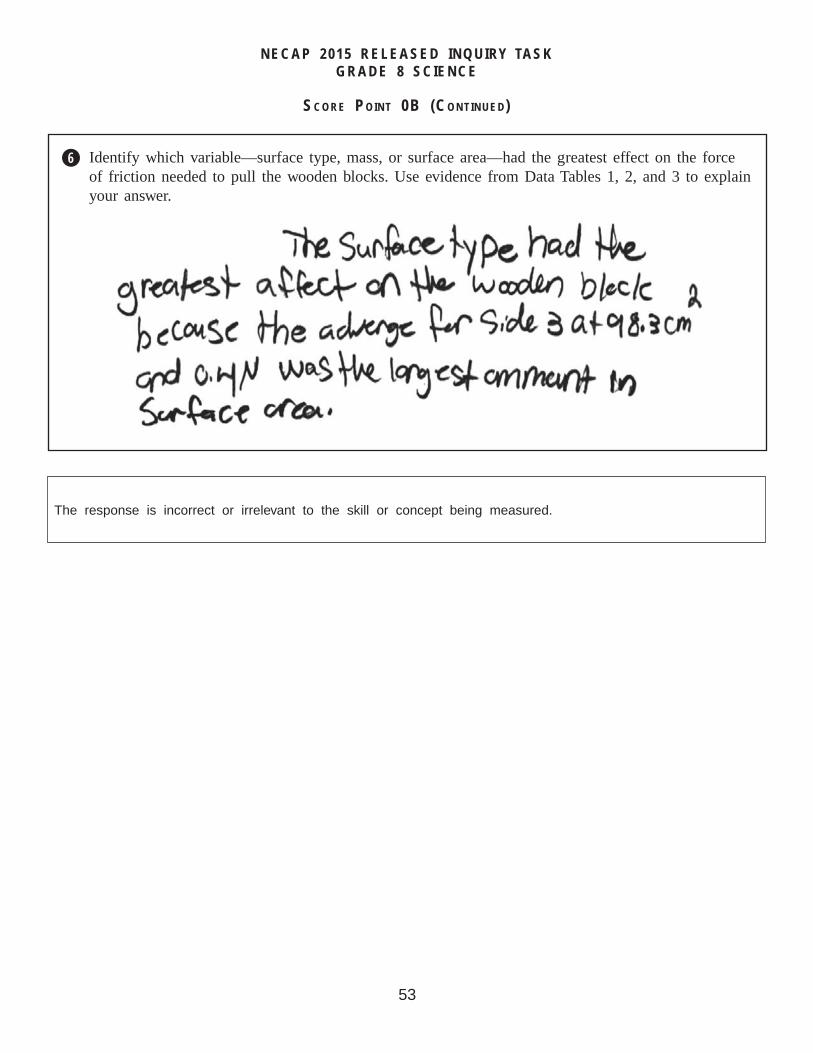
y Identify which variable—surface type, mass, or surface area—had the greatest effect on the force of friction needed to pull the wooden blocks. Use evidence from Data Tables 1, 2, and 3 to explain your answer.
46NECAP 2015 Grade 8 Science Released Items_V2
NECAP 2015 RELEASED INQUIRY TASKGRADE 8 SCIENCE
SCORE POINT 2
q Copy Data Table 1 from page 5 of your Inquiry Booklet in the space below. Be sure to double-check that you have copied the data table and then calculate the averages, rounding to the nearest tenth.
47NECAP 2015 Grade 8 Science Released Items_V2
NECAP 2015 RELEASED INQUIRY TASKGRADE 8 SCIENCE
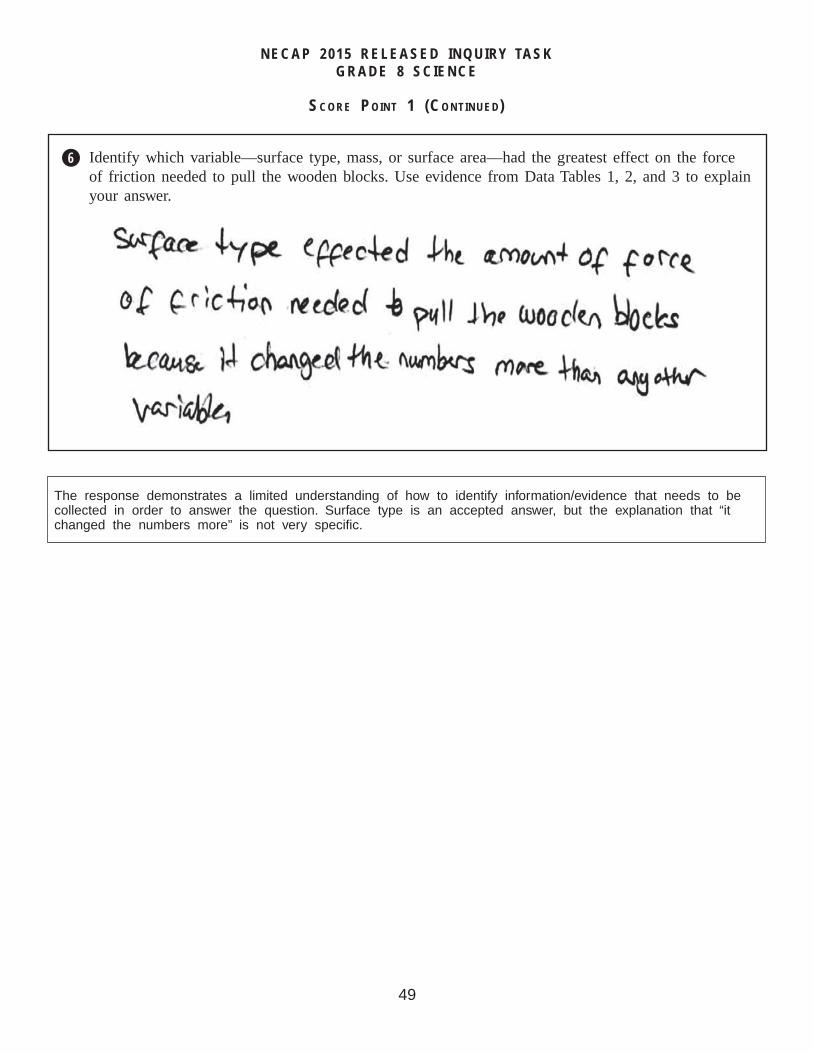
y Identify which variable—surface type, mass, or surface area—had the greatest effect on the force of friction needed to pull the wooden blocks. Use evidence from Data Tables 1, 2, and 3 to explain your answer.
SCORE POINT 2 (CONTINUED)
The response demonstrates a general understanding of how to identify information/evidence that needs to be collected in order to answer the question. The response uses data from the tables to support mass as being a variable with the greatest impact on the force of friction.
48NECAP 2015 Grade 8 Science Released Items_V2
NECAP 2015 RELEASED INQUIRY TASKGRADE 8 SCIENCE
SCORE POINT 1
q Copy Data Table 1 from page 5 of your Inquiry Booklet in the space below. Be sure to double-check that you have copied the data table and then calculate the averages, rounding to the nearest tenth.
49NECAP 2015 Grade 8 Science Released Items_V2
NECAP 2015 RELEASED INQUIRY TASKGRADE 8 SCIENCE
y Identify which variable—surface type, mass, or surface area—had the greatest effect on the force of friction needed to pull the wooden blocks. Use evidence from Data Tables 1, 2, and 3 to explain your answer.
SCORE POINT 1 (CONTINUED)
The response demonstrates a limited understanding of how to identify information/evidence that needs to be collected in order to answer the question. Surface type is an accepted answer, but the explanation that “it changed the numbers more” is not very specifi c.
50NECAP 2015 Grade 8 Science Released Items_V2
NECAP 2015 RELEASED INQUIRY TASKGRADE 8 SCIENCE
SCORE POINT 0A
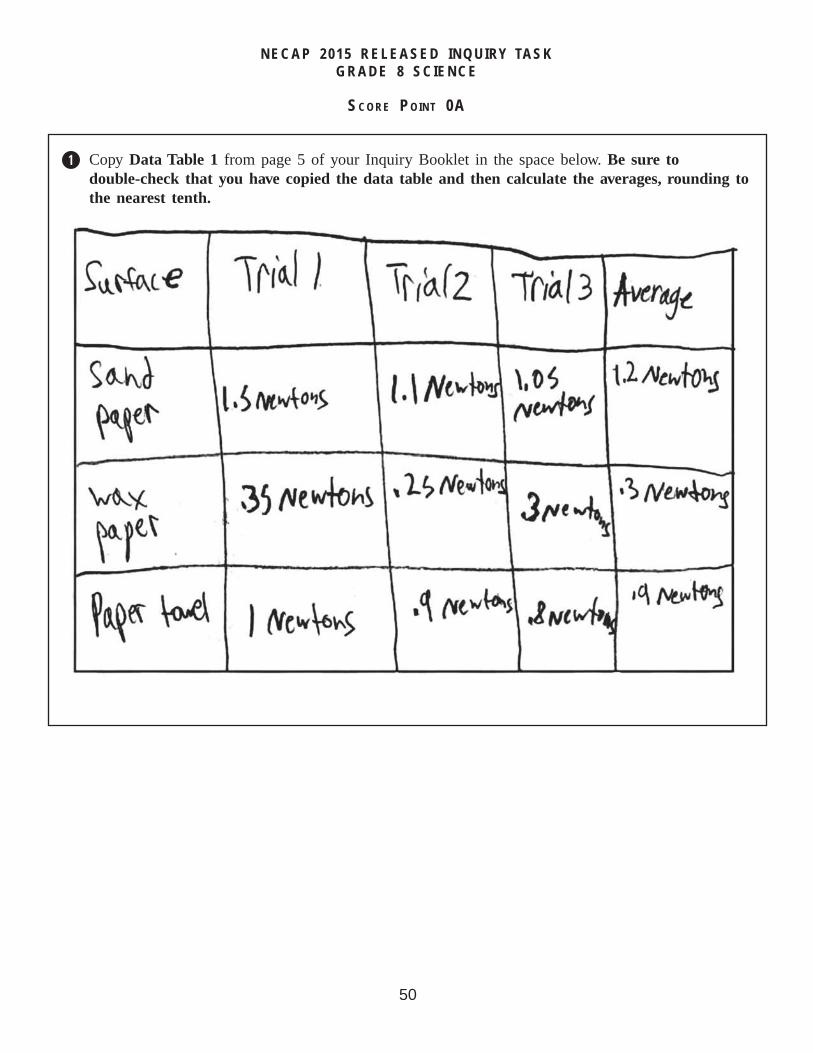
q Copy Data Table 1 from page 5 of your Inquiry Booklet in the space below. Be sure to double-check that you have copied the data table and then calculate the averages, rounding to the nearest tenth.
51NECAP 2015 Grade 8 Science Released Items_V2
NECAP 2015 RELEASED INQUIRY TASKGRADE 8 SCIENCE
SCORE POINT 0A (CONTINUED)
y Identify which variable—surface type, mass, or surface area—had the greatest effect on the force of friction needed to pull the wooden blocks. Use evidence from Data Tables 1, 2, and 3 to explain your answer.
The response is incorrect or irrelevant to the skill or concept being measured.
52NECAP 2015 Grade 8 Science Released Items_V2
NECAP 2015 RELEASED INQUIRY TASKGRADE 8 SCIENCE
SCORE POINT 0B
q Copy Data Table 1 from page 5 of your Inquiry Booklet in the space below. Be sure to double-check that you have copied the data table and then calculate the averages, rounding to the nearest tenth.
53NECAP 2015 Grade 8 Science Released Items_V2
NECAP 2015 RELEASED INQUIRY TASKGRADE 8 SCIENCE
SCORE POINT 0B (CONTINUED)
y Identify which variable—surface type, mass, or surface area—had the greatest effect on the force of friction needed to pull the wooden blocks. Use evidence from Data Tables 1, 2, and 3 to explain your answer.
The response is incorrect or irrelevant to the skill or concept being measured.
54NECAP 2015 Grade 8 Science Released Items_V2
NECAP 2015 RELEASED INQUIRY TASKGRADE 8 SCIENCE
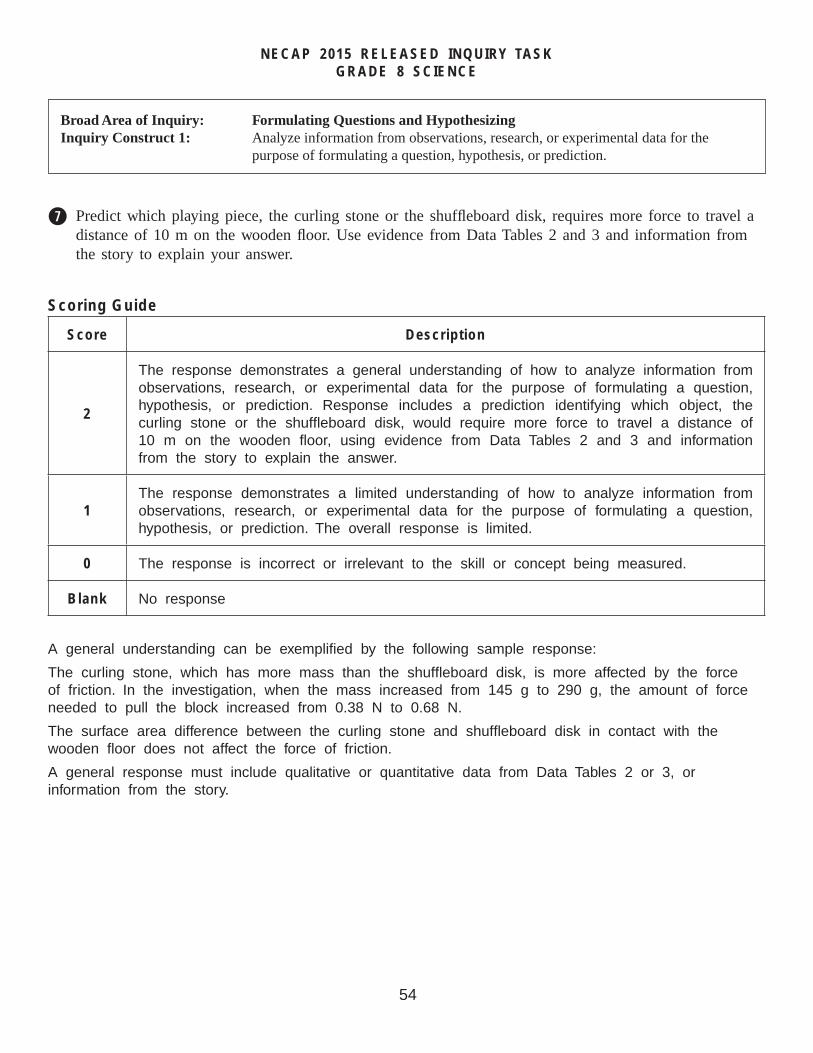
Broad Area of Inquiry: Formulating Questions and HypothesizingInquiry Construct 1: Analyze information from observations, research, or experimental data for the
purpose of formulating a question, hypothesis, or prediction.
Scoring Guide
Score Description
2
The response demonstrates a general understanding of how to analyze information from observations, research, or experimental data for the purpose of formulating a question, hypothesis, or prediction. Response includes a prediction identifying which object, the curling stone or the shuffl eboard disk, would require more force to travel a distance of 10 m on the wooden fl oor, using evidence from Data Tables 2 and 3 and information from the story to explain the answer.
1The response demonstrates a limited understanding of how to analyze information from observations, research, or experimental data for the purpose of formulating a question, hypothesis, or prediction. The overall response is limited.
0 The response is incorrect or irrelevant to the skill or concept being measured.
Blank No response
A general understanding can be exemplifi ed by the following sample response:
The curling stone, which has more mass than the shuffl eboard disk, is more affected by the force of friction. In the investigation, when the mass increased from 145 g to 290 g, the amount of force needed to pull the block increased from 0.38 N to 0.68 N.
The surface area difference between the curling stone and shuffl eboard disk in contact with the wooden fl oor does not affect the force of friction.
A general response must include qualitative or quantitative data from Data Tables 2 or 3, or information from the story.
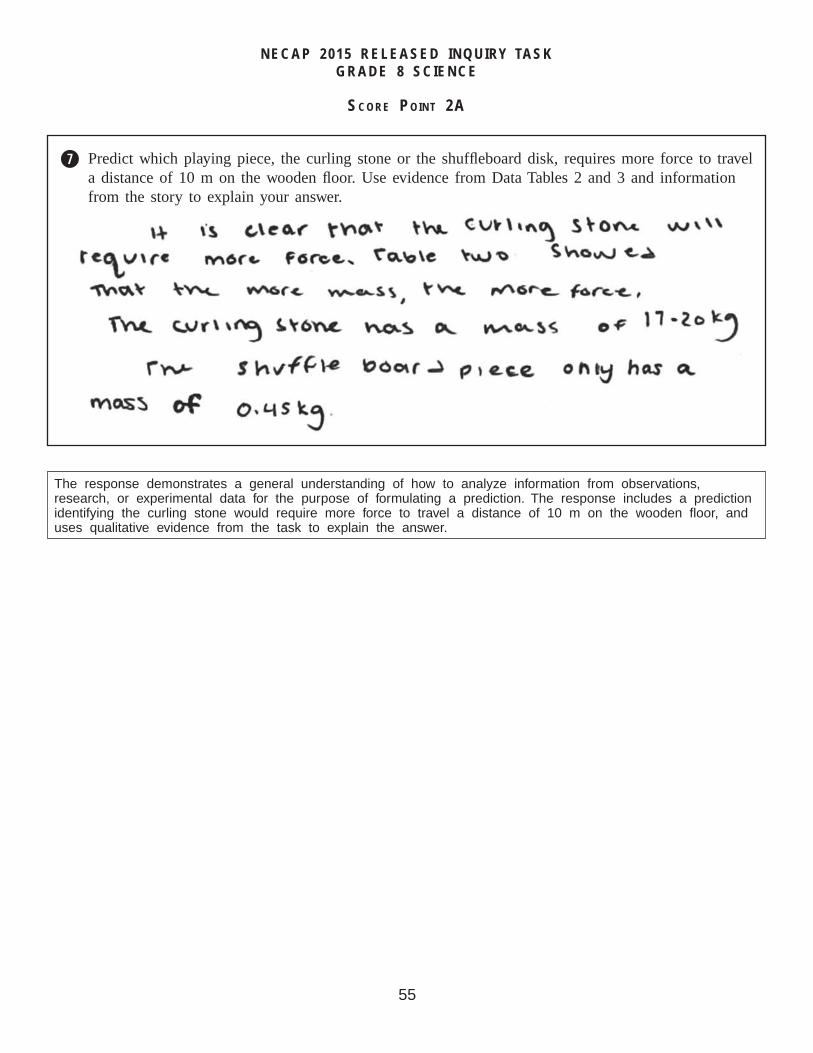
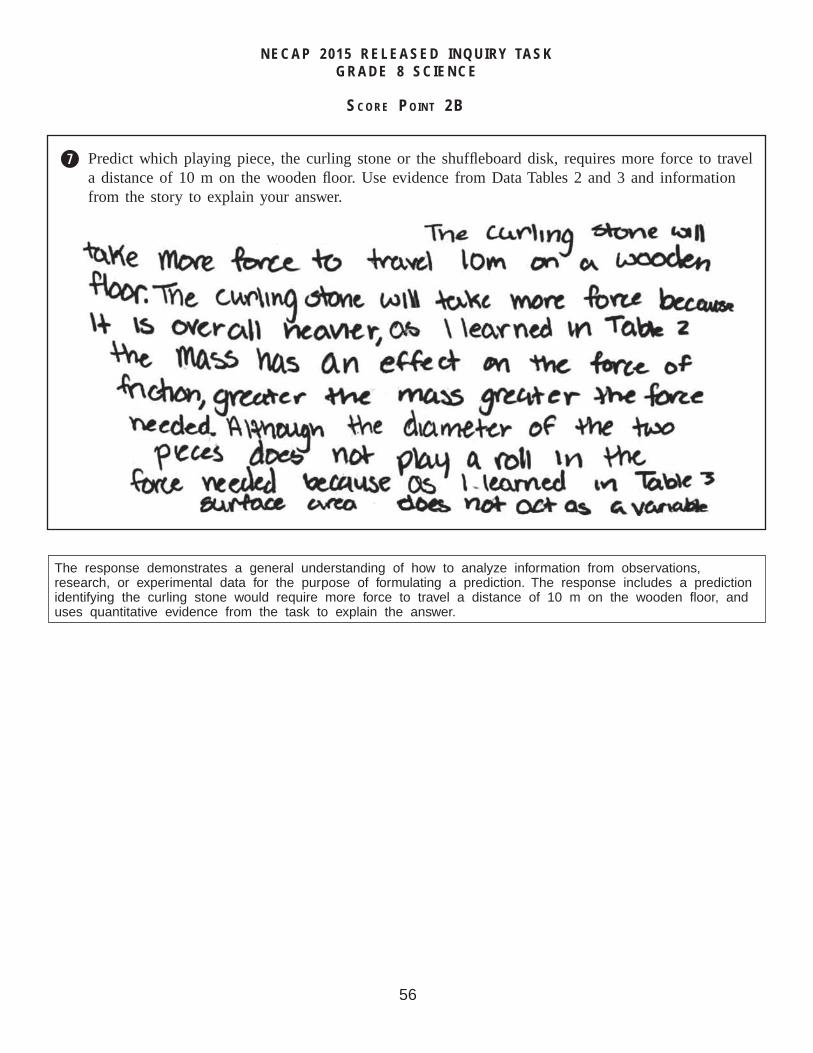
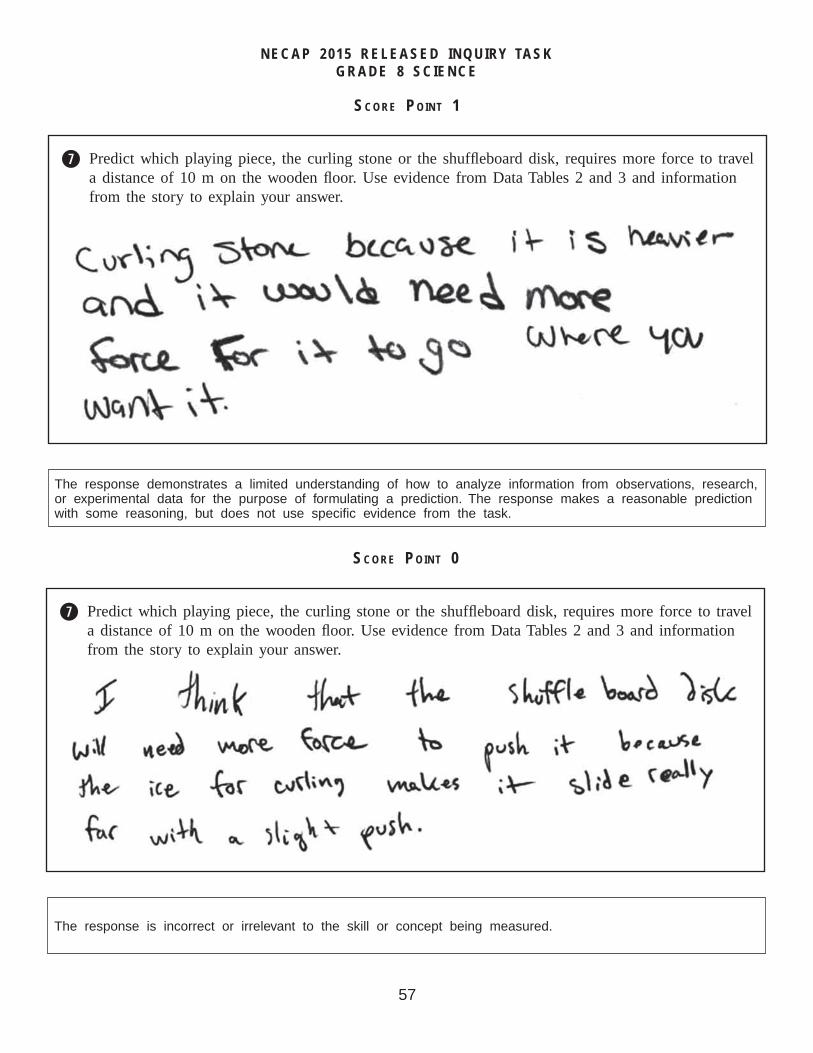
u Predict which playing piece, the curling stone or the shuffl eboard disk, requires more force to travel a distance of 10 m on the wooden fl oor. Use evidence from Data Tables 2 and 3 and information from the story to explain your answer.
55NECAP 2015 Grade 8 Science Released Items_V2
NECAP 2015 RELEASED INQUIRY TASKGRADE 8 SCIENCE
SCORE POINT 2A
u Predict which playing piece, the curling stone or the shuffl eboard disk, requires more force to travel a distance of 10 m on the wooden fl oor. Use evidence from Data Tables 2 and 3 and information from the story to explain your answer.
The response demonstrates a general understanding of how to analyze information from observations, research, or experimental data for the purpose of formulating a prediction. The response includes a prediction identifying the curling stone would require more force to travel a distance of 10 m on the wooden fl oor, and uses qualitative evidence from the task to explain the answer.
56NECAP 2015 Grade 8 Science Released Items_V2
NECAP 2015 RELEASED INQUIRY TASKGRADE 8 SCIENCE
SCORE POINT 2B
u Predict which playing piece, the curling stone or the shuffl eboard disk, requires more force to travel a distance of 10 m on the wooden fl oor. Use evidence from Data Tables 2 and 3 and information from the story to explain your answer.
The response demonstrates a general understanding of how to analyze information from observations, research, or experimental data for the purpose of formulating a prediction. The response includes a prediction identifying the curling stone would require more force to travel a distance of 10 m on the wooden fl oor, and uses quantitative evidence from the task to explain the answer.
57NECAP 2015 Grade 8 Science Released Items_V2
NECAP 2015 RELEASED INQUIRY TASKGRADE 8 SCIENCE
u Predict which playing piece, the curling stone or the shuffl eboard disk, requires more force to travel a distance of 10 m on the wooden fl oor. Use evidence from Data Tables 2 and 3 and information from the story to explain your answer.
SCORE POINT 1
The response demonstrates a limited understanding of how to analyze information from observations, research, or experimental data for the purpose of formulating a prediction. The response makes a reasonable prediction with some reasoning, but does not use specifi c evidence from the task.
u Predict which playing piece, the curling stone or the shuffl eboard disk, requires more force to travel a distance of 10 m on the wooden fl oor. Use evidence from Data Tables 2 and 3 and information from the story to explain your answer.
SCORE POINT 0
The response is incorrect or irrelevant to the skill or concept being measured.
58NECAP 2015 Grade 8 Science Released Items_V2
NECAP 2015 RELEASED INQUIRY TASKGRADE 8 SCIENCE
Broad Area of Inquiry: Developing and Evaluating ExplanationsInquiry Construct 13: Communicate how scientifi c knowledge applies to explain results, propose further
investigations, or construct and analyze alternative explanations.
Scoring Guide
Score Description
2
The response demonstrates a general understanding of communicating how scientifi c knowledge applies to explain results, propose further investigations, or construct and analyze alternative explanations. Response describes how the coach could make the sled more diffi cult to push, using one piece of evidence from the investigations to support the answer.
1The response demonstrates a limited understanding of communicating how scientifi c knowledge applies to explain results, propose further investigations, or construct and analyze alternative explanations. The overall response is limited.
0 The response is incorrect or irrelevant to the skill or concept being measured.
Blank No response
A general understanding can be exemplifi ed by the following sample response:
The coach could make the force of friction greater by adding more mass or placing the sled on a rougher surface. Increasing the force of friction between the sled and the ground would require the players to have to push harder on it to make it move. Evidence from the investigation includes the x N of force required to pull the blocks on the rougher paper towel compared to the y N of force required to pull the blocks on the smoother wax paper. More force was also required to pull the blocks when more blocks were added to the stack.
A correct response includes either adding mass or placing the sled on a rougher surface.
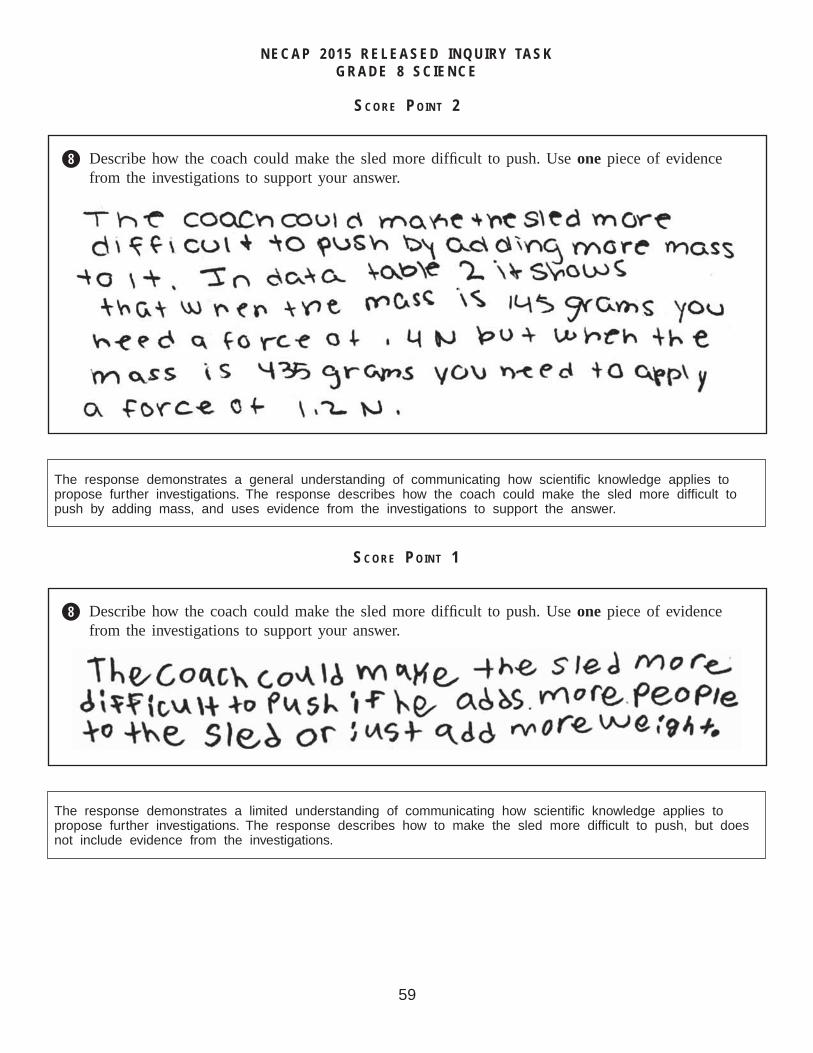
i Describe how the coach could make the sled more diffi cult to push. Use one piece of evidence from the investigations to support your answer.
59NECAP 2015 Grade 8 Science Released Items_V2
NECAP 2015 RELEASED INQUIRY TASKGRADE 8 SCIENCE
SCORE POINT 2
i Describe how the coach could make the sled more diffi cult to push. Use one piece of evidence from the investigations to support your answer.
The response demonstrates a general understanding of communicating how scientifi c knowledge applies to propose further investigations. The response describes how the coach could make the sled more diffi cult to push by adding mass, and uses evidence from the investigations to support the answer.
SCORE POINT 1
i Describe how the coach could make the sled more diffi cult to push. Use one piece of evidence from the investigations to support your answer.
The response demonstrates a limited understanding of communicating how scientifi c knowledge applies to propose further investigations. The response describes how to make the sled more diffi cult to push, but does not include evidence from the investigations.
60NECAP 2015 Grade 8 Science Released Items_V2
NECAP 2015 RELEASED INQUIRY TASKGRADE 8 SCIENCE
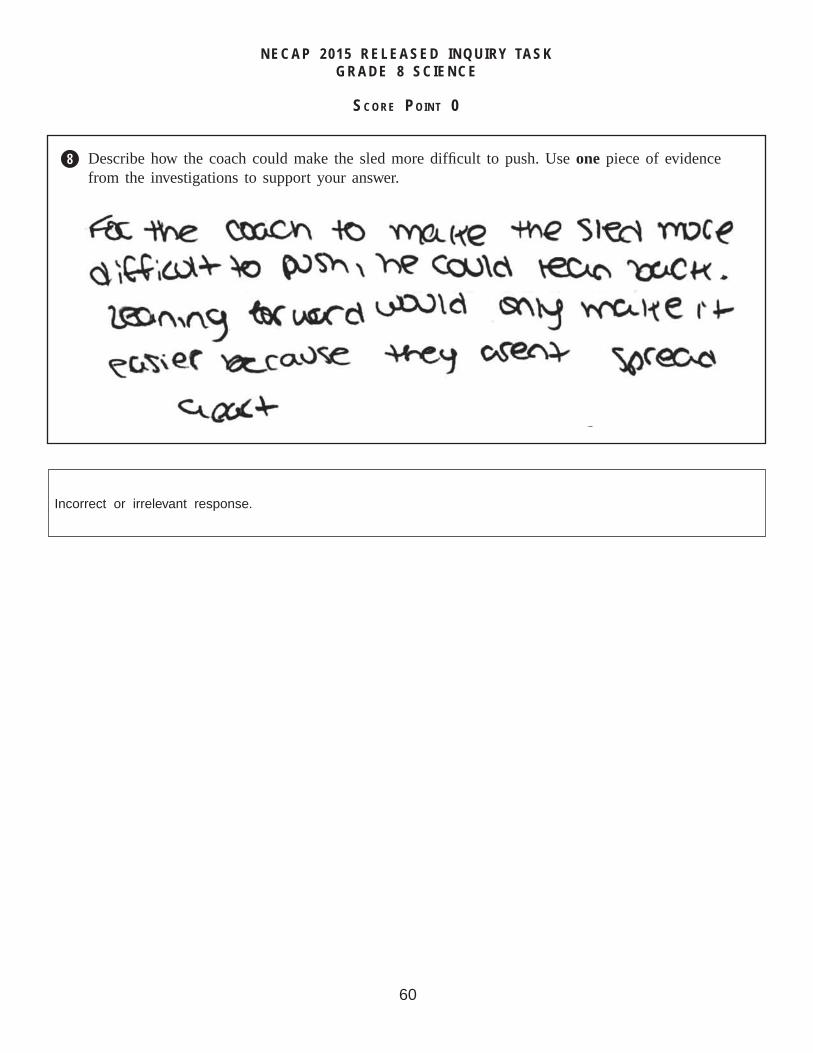
SCORE POINT 0
i Describe how the coach could make the sled more diffi cult to push. Use one piece of evidence from the investigations to support your answer.
Incorrect or irrelevant response.