Embed Size (px)
Citation preview
299
Geo
dets
ki v
estn
ik 5
7/2
(201
3)IZ
ZN
AN
OST
I IN
STR
OK
E
RElIaBIlITy aNalysIs Of INTERPOlaTION mEThODs IN TRaVEl TImE maPs – ThE CasE Of WaRsaW
sTaTIsTIČNa aNalIza zaNEsljIVOsTI INTERPOlaCIjskIh mETOD Na kaRTI ČasOVNE DOsTOPNOsTI – PRImER VaRŠaVE
Elzbieta Bielecka, Anna Bober
UDk: 519.65:656:659.2:91(438) klasifikacija prispevka po COBIss-u: 1.02
kljUČNE BEsEDE
isochrone, interpolation, accessibility, travel time map, interpolation errors
izohrona, interpolacija, dostopnost, karta časovne dostopnosti
kEy WORDs
IzVlEČEk
Določanje dostopnosti območja s sredstvi javnega prevoza je zelo pomembno. Zaradi velikosti in hitrosti sredstev mestnega prevoza so marsikateri kraji bolj dostopni kot na začetku 20. stoletja. Strokovnjaki so določali dostopnost območja, ki jo izraža čas prispetja na cilj, že v 19. stoletju, ko so izdali prvo karto javnega prevoza v Londonu. Od takrat je nastalo veliko kart dostopnosti. Poleg tega imamo na voljo teoretična pravila oblikovanja kart. Kljub temu nismo še analizirali vpliva metode interpolacije časa vožnje na točnost in obliko kart dostopnosti. Cilj tega prispevka je analiza metod interpolacije, ki so na voljo v programih tipa GIS, za aproksimacijo dostopnosti na poljubnem kraju. Raziskava je bila opravljena na višji šoli Wojskowa Akademia Techniczna (Vojaška tehniška akademija). Njen namen je bil oblikovanje izohron, ki prikazujejo čas vožnje z javnim prevoznimi sredstvi na akademijo. Izidi so dokazali, da je najmanjša napaka interpolacije značilna za metodo IDW, čeprav ta metoda ne registrira majhnih izohronih otokov. Največ napak interpolacije je bilo v metodi »najbližjega soseda«, najmanj koristna lega izohronih otokov pa je bila v metodi »spline«.
aBsTRaCT
Describing the accessibility, by public transport, of a given place is of particular importance today. The speed and multiplicity of urban public transport have made many places far more accessible than they were at the beginning of the 20th century. Descriptions of the accessibility of a given place, expressed in terms of travel time, have been carried out since the 19th
century, when the first map for journeys to London by public transport was published. Since then, many “accessibility maps” have been produced and the theoretical principles for their creation drawn up. However, the influence that particular methods for interpolating travel times have on the accuracy and appearance of such maps has not been analysed.
The purpose of this article is an analysis of interpolation methods, using a tool such as GIS, for estimating the accessibility of any location. The research was conducted by the Military University of Technology in Warsaw (MUT), drawing up an isochrone map that showed travel times by public transport to the MUT campus. According to the results, the lowest mean absolute percentage error (MAPE) and mean absolute error (MAE) were shown applying the IDW method, in which small isochronic islands did not appear. The highest estimation errors occurred with the nearest neighbour method, and the least beneficial arrangement of isochronic islands appeared using the spline method.
Elzbie
ta Bie
lecka
, Ann
a Bob
er - R
ELIA
BILITY
ANA
LYSIS
OF I
NTER
POLA
TION
MET
HODS
IN TR
AVEL
TIM
E MAP
S – TH
E CAS
E OF W
ARSA
W
300
Geo
dets
ki v
estn
ik 5
7/2
(201
3)IZ
ZN
AN
OST
I IN
STR
OK
E
1 BaCkGROUND. fROm GalTON’s maP TO a GlOBal maP Of aCCEssIBIlITy
Accessibility describes the length of travel time to a chosen location by different modes of transport (land, water and air). This time is most often visualised with the aid of an isarithmic method, by way of an isochrone1 or an isodapane2. The author of the first study to describe the accessibility, expressed in time, of a given location was Francis Galton. In 1881 he drew up an Isochronic Passage Chart for Travellers, a map that displayed the travel time to London, from anywhere in the world, via generally available modes of public transport (Galton, 1881). He marked those locations that were accessible in an equal time with isolines and named them isochrones. In the following decades, location accessibility was the object of research by both cartographers and geographers, and in latter years, urban planners and economists. The most valuable source of information concerning methods for describing accessibility time and its cartographic representation are the works of geographers and cartographers from the beginning of the 20th century, including Hassinger (1903), Schjerning (1903), Riedl (1911), Eckert (1925), Rewienska (1929), Kubijowicz (1923), Boczar (1933) as well as the recent work of mainly British scientists, such as Carden (2005), Nelson (2008), Lightfoot and Kelly (2006), as well as Lightfoot and Steinberg (2006). The time accessibility was also key element of industrial location model, introduced in the first decade of 20th century by Weber (Weber, 1929).
The accessibility maps drawn up differ in scale, mapped area, and methods for calculating travel time, as well as the mode of transport considered. The authors of accessibility maps (also known as time contour maps or travel-time maps) draw attention to the fact that isochrones vary depending on whether private transport, in addition to public transport, is considered in the calculations (Witt, 1970; Pietrusiewicz, 1996; Schurmann, 1999; Lightfoot and Kelly 2006; Lightfoot and Steinberg, 2006; Street, 2006). Isochrones for private transport generally have an elongated shape that follows the course of roads. In contrast, isochrones for public transport, which is limited by routes, stops and timetables, normally have a circular shape, thereby creating so called isochronic islands, the centres of which correspond to the location of stops or stations. When the accessibility of an area is analysed, and only public transport is considered, one result is the appearance on the map of ‘inaccessible’ areas, that is, areas from which it is impossible to reach the chosen destination. Analysis of all modes of transport, including private transport, enables the creation of one continuous surface uninterrupted by isochronic islands.
One example of this type of study is the Global Accessibility Map, made by the Joint Research Centre in Ispra for the World Bank (Nelson, 2008; Williams, 2009; World Bank Report, 2009). The map shows that barely 10% of the Earth’s land area is more than 48 hours away from towns with a population of 50,000 or more.
The approach to calculating location accessibility had changed markedly by the end of the 1990s. A multitude of computer applications have facilitated and made faster the tedious task of calculating travel times, making it possible to apply different interpolation methods and cost-distance algorithms, and also increasing the area to which the method can be applied.The methodological basics for creating accessibility maps by using geographic information systems 1 The curve for which the transportation means starting at one or different points finish at the same time after being released.2 The curve for which the travel or transportation starting at one or different points have de same costs of transport.Elz
bieta
Bielec
ka, A
nna B
ober
- REL
IABIL
ITY A
NALY
SIS O
F INT
ERPO
LATIO
N M
ETHO
DS IN
TRAV
EL TI
ME M
APS –
THE C
ASE O
F WAR
SAW
301
Geo
dets
ki v
estn
ik 5
7/2
(201
3)IZ
ZN
AN
OST
I IN
STR
OK
E
are described in many research papers (Juliao, 1997; Koening, 1980; Schurmannn, 1999; Street, 2006; Nelson, 2008; Müller and Glander 2010).
Location accessibility is the basis for drawing up area development strategies (EPSON, 2009; Feltynowski, 2009; Bogataj and Drobne, 2010; Zavodnik Lamovsek and Drobne, 2011), space management plans and studies (Bogataj and Drobne, 2005, 2010; Drobne, Lisec and Bogataj, 2008; Zegda, 2009), regionalisation, development of particular transport networks (Kaczmarek, 1978; Schurmann, 1999; Lighfoot and Kelly, 2006), as well as tourism and recreation development (Novosad, 1980). It is a significant factor involving the development of suburbanisation (Nelson, 2008), development of the property market (Carden, 2005) and also access to education (Guzik, 2003). In the last few years, we have seen the advent of web–based tools for presenting and analysing travel times. The most interesting applications are Travel Time Tube Map (Carden, 2005) and MySociety Travel–time maps (Lightfoot and Kelly, 2006; Lightfoot and Steinberg, 2006). The visualisation of travel times, using open data and web-based tools, creates new opportunities for individuals, and public and private organisations. It makes it easy to analyse commuting times without specialist software or expert skills (Müller and Glander, 2010).
Despite a great deal of work in the research field, the different interpolation methods used to define the accessibility of each point of a studied area in relation to a destination point have not been evaluated and, most often, not even mentioned. It is therefore unknown by what method location accessibility is described, what is the error in describing this accessibility and also how the choice of interpolation algorithm influences the accuracy of the results. Endeavouring to fill this gap in the studies undertaken to date, the authors performed an evaluation of the surface interpolation methods used for preparing time-contour maps.
2 OBjECT aND mEThOD Of REsEaRCh
2.1 Calculation of travel time
Determining location accessibility by means of the surface interpolation method requires:
(1) A decision whether to prepare a “mono” (single destination point) or “polycentric” (multiple destination point) map.
(2) Choice of transport mode and measurement points (quantity and distribution) and method for calculating travel time:
a. according to theoretical time, which is derived from permissible speeds and distances (“theoretical” isochrones) or the time listed in timetables (“actual” isochrones);
b. calculated time from the starting point to the exterior (“centrifugal” isochrones) or calculated from the boundaries of the studied area towards the destination point (“centripetal” isochrones).
(3) Determination of travel time between stops (measured points).
(4) Selection of interpolation method and performance of calculations.
(5) Accuracy assessment of results.
(6) Travel time visualisation. Elzbie
ta Bie
lecka
, Ann
a Bob
er - R
ELIA
BILITY
ANA
LYSIS
OF I
NTER
POLA
TION
MET
HODS
IN TR
AVEL
TIM
E MAP
S – TH
E CAS
E OF W
ARSA
W
302
Geo
dets
ki v
estn
ik 5
7/2
(201
3)IZ
ZN
AN
OST
I IN
STR
OK
E
The key elements of this process are the choice of methods for both travel time calculation and interpolation.
There is no agreement in the literature concerning the optimum method of travel time calculation. Different authors, depending on the size of the analysed area, and the scale of the study, choose varying methods for calculating travel time, taking into account shortest travel time, average time, maximal or time repeated most frequently in timetables and also time spent waiting and making connections (for bus or train). The time taken to reach a bus stop or station is most often accounted for only in large and medium scale studies. The accessibility of a specified place is a function of the location of the starting and ending points of a journey, the length of travel time, accessibility of transport, and cost preference. In order to calculate the total length of travel time (door-to-door), it is necessary to include the time taken to reach a bus stop or station, the time spent waiting for public transport to arrive and also the travel time itself, which may be expressed by the formula (Davis, 1986; Schnabel and Lohse, 1997).
T = td + ∑t
c + ∑t
p (1)
where:
T – total length of travel time,
td – initial walking time to the first stop,
tc – time spent waiting for transport,
tp – driving time in all participating vehicles.
As time is commensurate to distance at a given velocity, it is generally assumed that walking speed ranges from 3 to 5 km per hour.
2.2 Interpolation methods
Interpolation is a procedure that estimates a value that lies between two known values. In GIS, interpolation is based on the principle of spatial dependence between near and distinct objects. There are two categories of interpolation techniques: deterministic and statistical, which differ in interpolative functions, the number of input points used in the computation of output values, as well as the area from which the input points are taken (Bielecka, 2006). The most frequently employed deterministic interpolation methods are: IDW–inverse distance weighted), NN– nearest neighbour, spline and the stochastic method - kriging. The IDW, NN and spline methods enable all measurement points to be included in the calculation (global option) or only the nearest adjacent points (local option). NN interpolation identifies the closest subset of input points to a query point and applies weights to them based on proportionate areas in order to interpolate a value (Sibson, 1981). The surface passes through the input samples, is smooth everywhere except at the locations of the input samples, and works equally well with regularly and irregularly distributed data. IDW interpolation determines point values using a linearly weighted (function of inverse distance) combination of a set of input points. It relies on the inverse of the distance raised to the power. When distances are large, or the power value is large, the results may be Elz
bieta
Bielec
ka, A
nna B
ober
- REL
IABIL
ITY A
NALY
SIS O
F INT
ERPO
LATIO
N M
ETHO
DS IN
TRAV
EL TI
ME M
APS –
THE C
ASE O
F WAR
SAW
303
Geo
dets
ki v
estn
ik 5
7/2
(201
3)IZ
ZN
AN
OST
I IN
STR
OK
E
incorrect. Spline is a sufficiently smooth polynomial function that is piecewise defined, it passes exactly through the input points (Childs, 2004).
Kriging assigns weights, referred to as kriging coefficients, to the measurement points inside the estimation area in such a way as to minimise kriging variation. Similar to the IDW method, greater weight is assigned to points that lie closer to the input point, but in contrast to IDW, the determined weights are not the basis for distance inversion, but a semivariogram. Kriging is recognised as the best method for the interpolation of unevenly placed phenomena (Childs, 2004; Davis, 1986), but with an isotropic distribution. Therefore, its application for modelling location accessibility by modes of public transport seems unjustified, because the data distribution is isotropic.
2.3 method of evaluation
The spatial interpolation methods, as any other statistical modelling techniques, produce a certain degree of errors associated with the estimation. Error measurements that have been proposed for evaluation and comparison of interpolation methods are included in several research works, e.g.: Burrough and McDonnell (1998), Isaaks and Srivastava (1989), Li and Heap (2008), Nalder and Wein (1998), and Willmott (1981). Commonly used error measurements include: mean error (ME), mean absolute error (MAE), mean absolute percentage error (MAPE), mean square error (MSE) and root mean square error (RMSE). RMSE and MAE are argued to be among the best overall measures of model performance as they summarise the mean difference in the units of observed and estimated values (Willmott, 1982; Li and Heap, 2008). The mean absolute percentage error (MAPE) is also often useful for purposes of reporting, because it is expressed in generic percentage terms (Li and Heap, 2008).
All mentioned above errors should be calculated on the basis of verification (check) points, distributed randomly over the study area, the number of verification points depends on character of data (ISO 19114, 2003; ISO/DIS 19157, 2011).
Additionally, the number and size of isochronic islands should be analysed. According to literature (Eckert, 1925; Pietrusiewicz, 1996; Rewienska, 1929) the small isochronic islands negatively affect obtained results.
3 CasE sTUDy – aCCEssIBIlITy Of ThE mIlITaRy UNIVERsITy Of TEChNOlOGy
3.1 Preliminary assumptions and input data
The study, carried out for the Military University of Technology (MUT), gives an analysis of different interpolation methods for drawing up a time-contour map showing estimated travel time to the MUT campus from the whole Warsaw area. It is a “monocentric” map, and the isochrones are “actual” and “centripetal” in character. The measurement points, from which travel times are calculated, were public transport stops located at significant road junctions, by metro and railway stations and also within residential housing estates. The combined travel Elz
bieta
Bielec
ka, A
nna B
ober
- REL
IABIL
ITY A
NALY
SIS O
F INT
ERPO
LATIO
N M
ETHO
DS IN
TRAV
EL TI
ME M
APS –
THE C
ASE O
F WAR
SAW
304
Geo
dets
ki v
estn
ik 5
7/2
(201
3)IZ
ZN
AN
OST
I IN
STR
OK
E
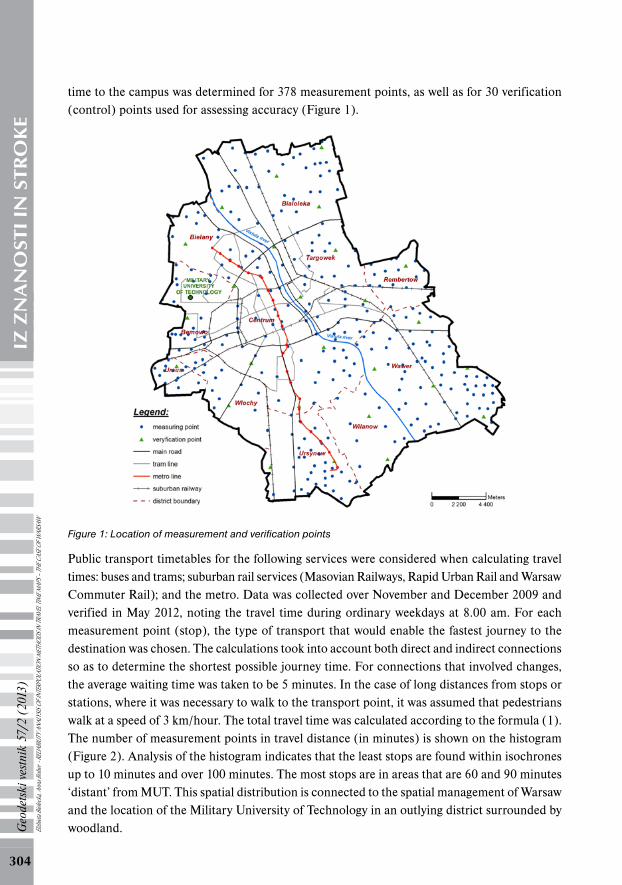
time to the campus was determined for 378 measurement points, as well as for 30 verification (control) points used for assessing accuracy (Figure 1).
Figure 1: Location of measurement and verification points
Public transport timetables for the following services were considered when calculating travel times: buses and trams; suburban rail services (Masovian Railways, Rapid Urban Rail and Warsaw Commuter Rail); and the metro. Data was collected over November and December 2009 and verified in May 2012, noting the travel time during ordinary weekdays at 8.00 am. For each measurement point (stop), the type of transport that would enable the fastest journey to the destination was chosen. The calculations took into account both direct and indirect connections so as to determine the shortest possible journey time. For connections that involved changes, the average waiting time was taken to be 5 minutes. In the case of long distances from stops or stations, where it was necessary to walk to the transport point, it was assumed that pedestrians walk at a speed of 3 km/hour. The total travel time was calculated according to the formula (1). The number of measurement points in travel distance (in minutes) is shown on the histogram (Figure 2). Analysis of the histogram indicates that the least stops are found within isochrones up to 10 minutes and over 100 minutes. The most stops are in areas that are 60 and 90 minutes ‘distant’ from MUT. This spatial distribution is connected to the spatial management of Warsaw and the location of the Military University of Technology in an outlying district surrounded by woodland.Elz
bieta
Bielec
ka, A
nna B
ober
- REL
IABIL
ITY A
NALY
SIS O
F INT
ERPO
LATIO
N M
ETHO
DS IN
TRAV
EL TI
ME M
APS –
THE C
ASE O
F WAR
SAW
305
Geo
dets
ki v
estn
ik 5
7/2
(201
3)IZ
ZN
AN
OST
I IN
STR
OK
E
Figure 2: The measurement points (stops) in travel time distance (expressed in minutes) to MUT
3.2 Research results
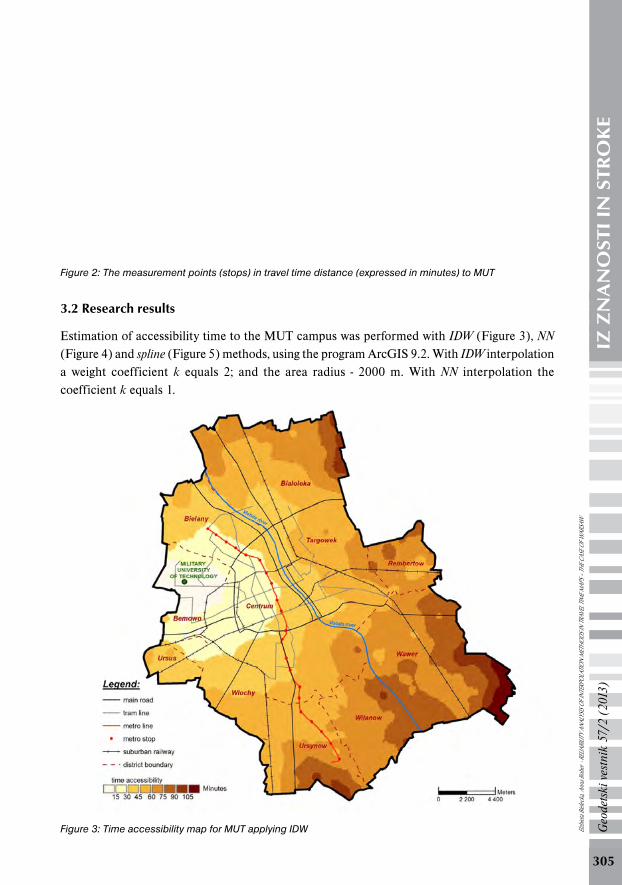
Estimation of accessibility time to the MUT campus was performed with IDW (Figure 3), NN (Figure 4) and spline (Figure 5) methods, using the program ArcGIS 9.2. With IDW interpolation a weight coefficient k equals 2; and the area radius - 2000 m. With NN interpolation the coefficient k equals 1.
Figure 3: Time accessibility map for MUT applying IDW Elzbie
ta Bie
lecka
, Ann
a Bob
er - R
ELIA
BILITY
ANA
LYSIS
OF I
NTER
POLA
TION
MET
HODS
IN TR
AVEL
TIM
E MAP
S – TH
E CAS
E OF W
ARSA
W
306
Geo
dets
ki v
estn
ik 5
7/2
(201
3)IZ
ZN
AN
OST
I IN
STR
OK
E
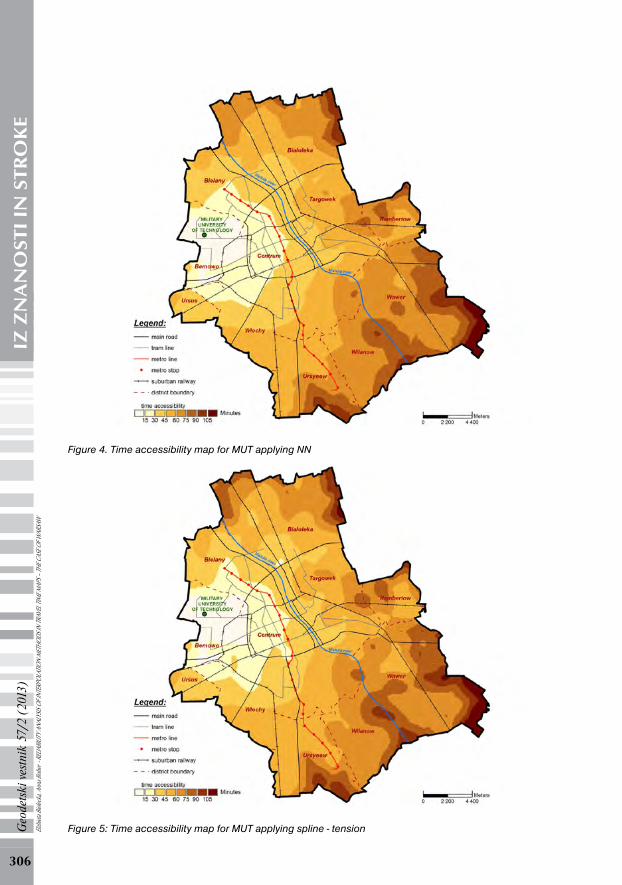
Figure 4. Time accessibility map for MUT applying NN
Figure 5: Time accessibility map for MUT applying spline - tensionElzbie
ta Bie
lecka
, Ann
a Bob
er - R
ELIA
BILITY
ANA
LYSIS
OF I
NTER
POLA
TION
MET
HODS
IN TR
AVEL
TIM
E MAP
S – TH
E CAS
E OF W
ARSA
W
307
Geo
dets
ki v
estn
ik 5
7/2
(201
3)IZ
ZN
AN
OST
I IN
STR
OK
E
With spline interpolation (Figure 5), the initial assumptions concerning minimal spatial curvature and its transition through measurement points can be achieved in two modes - regular and tension. In the regular mode the three derivative functions are minimised, while in tension mode - the first derivative. Experimental calculations were carried out with both methods, utilizing 15 points each time. Results for the tension mode were only marginally better.
4 aNalysIs aND assEssmENT Of REsUlTs
Analysis of the isochronic maps for time accessibility of MUT indicate that the fastest journeys to the MUT campus are from the city centre [Centrum] and from places located along the metro. The Ursus district, despite its proximity to the campus, has inconvenient transport connections; consequently travel times can take as long as 45 minutes. On the maps, several isochronic islands were noted. Their number and size are determined by the Warsaw public transport system and the chosen interpolation method. Such islands are located, among others, in the vicinity of railway stations; hence the travel time varies between 45 and 60 minutes, for a distance amounting to approximately 18 km.
Factors most favourable to rapid access are metro and tram line proximity. For places situated at the same distance from the campus, access from those located near the metro is faster by 15-20 minutes (e.g. for places 15 km away from MUT, the journey from Wawer takes 75 minutes whereas from Ursynow only 55 minutes are needed).
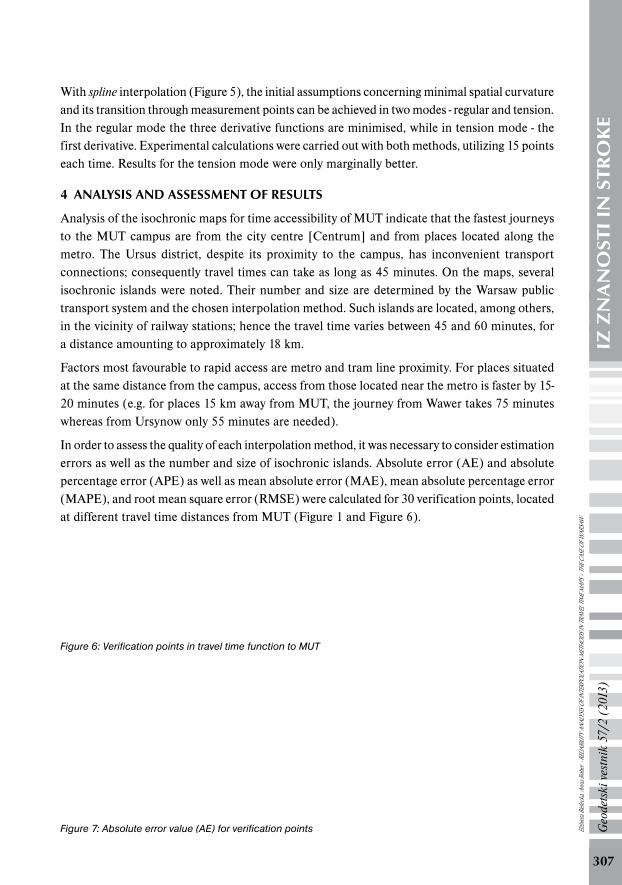
In order to assess the quality of each interpolation method, it was necessary to consider estimation errors as well as the number and size of isochronic islands. Absolute error (AE) and absolute percentage error (APE) as well as mean absolute error (MAE), mean absolute percentage error (MAPE), and root mean square error (RMSE) were calculated for 30 verification points, located at different travel time distances from MUT (Figure 1 and Figure 6).
Figure 6: Verification points in travel time function to MUT
Figure 7: Absolute error value (AE) for verification points Elzbie
ta Bie
lecka
, Ann
a Bob
er - R
ELIA
BILITY
ANA
LYSIS
OF I
NTER
POLA
TION
MET
HODS
IN TR
AVEL
TIM
E MAP
S – TH
E CAS
E OF W
ARSA
W
308
Geo
dets
ki v
estn
ik 5
7/2
(201
3)IZ
ZN
AN
OST
I IN
STR
OK
E
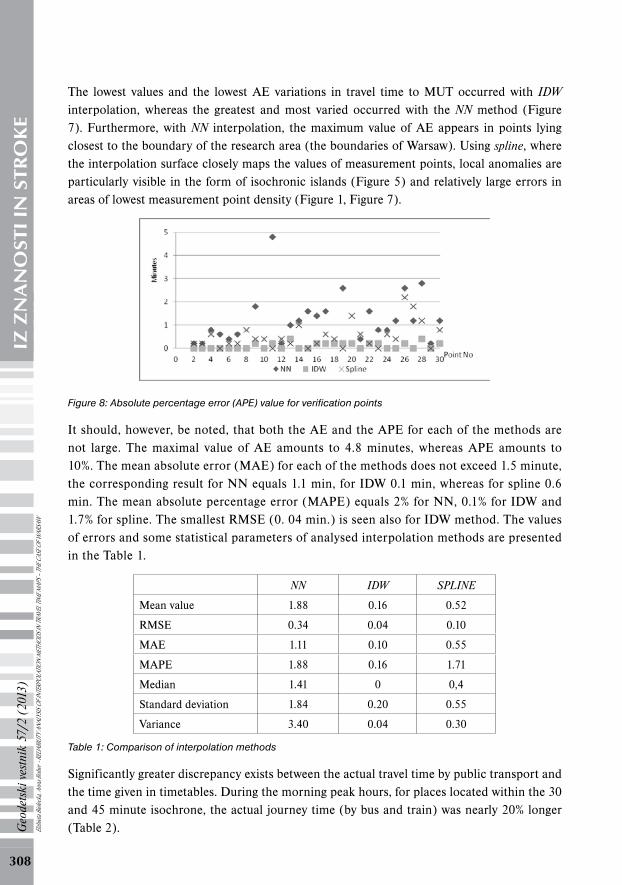
The lowest values and the lowest AE variations in travel time to MUT occurred with IDW interpolation, whereas the greatest and most varied occurred with the NN method (Figure 7). Furthermore, with NN interpolation, the maximum value of AE appears in points lying closest to the boundary of the research area (the boundaries of Warsaw). Using spline, where the interpolation surface closely maps the values of measurement points, local anomalies are particularly visible in the form of isochronic islands (Figure 5) and relatively large errors in areas of lowest measurement point density (Figure 1, Figure 7).
Figure 8: Absolute percentage error (APE) value for verification points
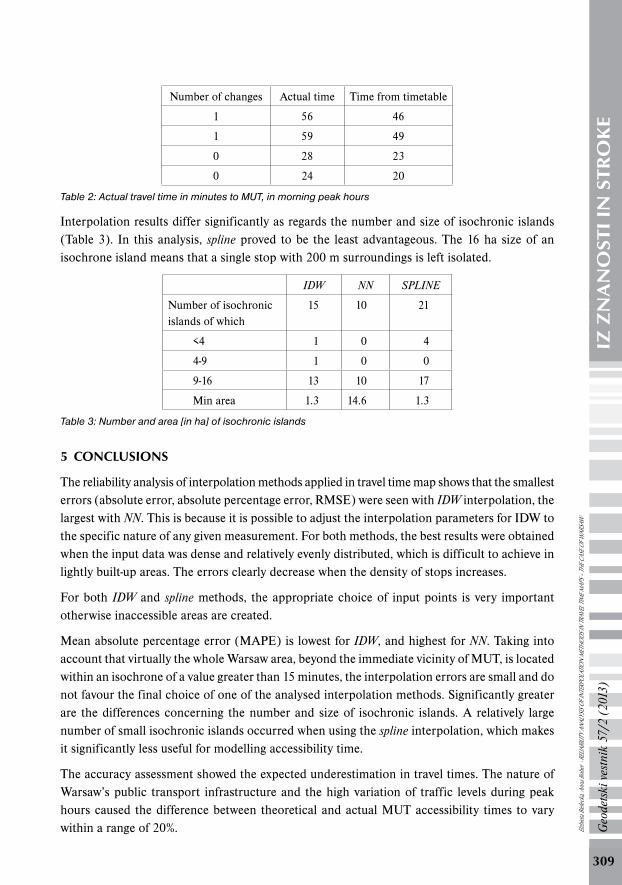
It should, however, be noted, that both the AE and the APE for each of the methods are not large. The maximal value of AE amounts to 4.8 minutes, whereas APE amounts to 10%. The mean absolute error (MAE) for each of the methods does not exceed 1.5 minute, the corresponding result for NN equals 1.1 min, for IDW 0.1 min, whereas for spline 0.6 min. The mean absolute percentage error (MAPE) equals 2% for NN, 0.1% for IDW and 1.7% for spline. The smallest RMSE (0. 04 min.) is seen also for IDW method. The values of errors and some statistical parameters of analysed interpolation methods are presented in the Table 1.
NN IDW SPLINE
Mean value 1.88 0.16 0.52
RMSE 0.34 0.04 0.10
MAE 1.11 0.10 0.55
MAPE 1.88 0.16 1.71
Median 1.41 0 0,4
Standard deviation 1.84 0.20 0.55
Variance 3.40 0.04 0.30
Table 1: Comparison of interpolation methods
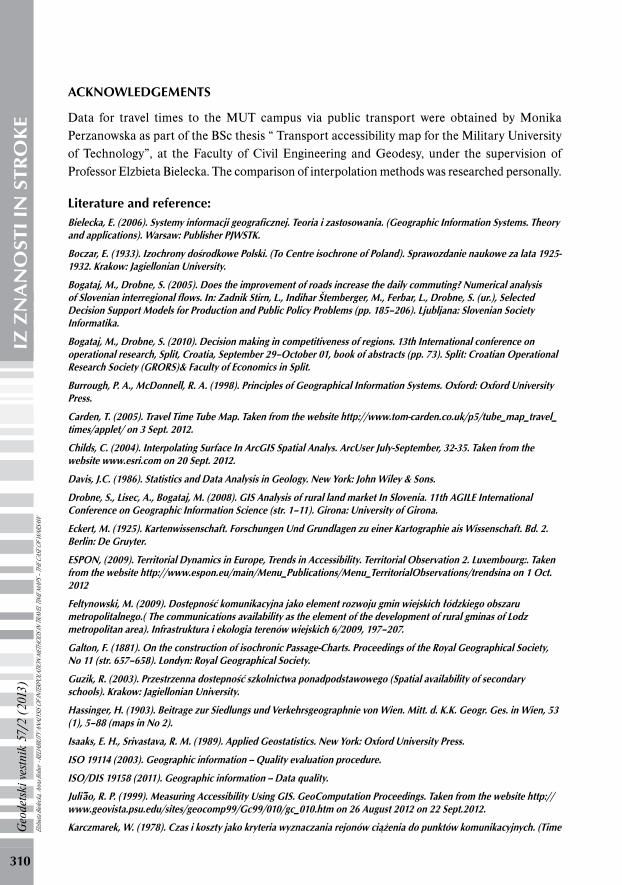
Significantly greater discrepancy exists between the actual travel time by public transport and the time given in timetables. During the morning peak hours, for places located within the 30 and 45 minute isochrone, the actual journey time (by bus and train) was nearly 20% longer (Table 2).Elz
bieta
Bielec
ka, A
nna B
ober
- REL
IABIL
ITY A
NALY
SIS O
F INT
ERPO
LATIO
N M
ETHO
DS IN
TRAV
EL TI
ME M
APS –
THE C
ASE O
F WAR
SAW
309
Geo
dets
ki v
estn
ik 5
7/2
(201
3)IZ
ZN
AN
OST
I IN
STR
OK
E
Number of changes Actual time Time from timetable
1 56 46
1 59 49
0 28 23
0 24 20
Table 2: Actual travel time in minutes to MUT, in morning peak hours
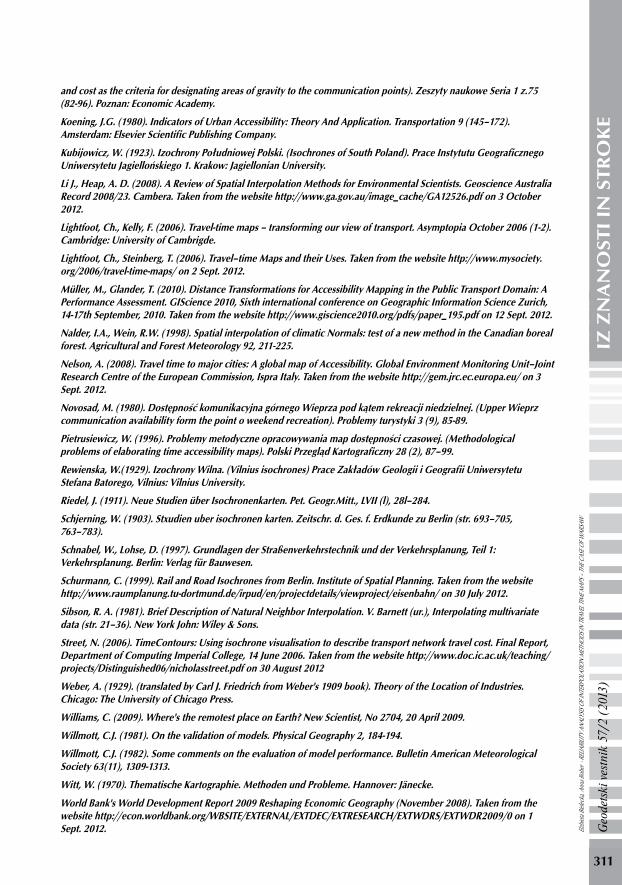
Interpolation results differ significantly as regards the number and size of isochronic islands (Table 3). In this analysis, spline proved to be the least advantageous. The 16 ha size of an isochrone island means that a single stop with 200 m surroundings is left isolated.
IDW NN SPLINE
Number of isochronic islands of which
15 10 21
<4 1 0 4
4-9 1 0 0
9-16 13 10 17
Min area 1.3 14.6 1.3
Table 3: Number and area [in ha] of isochronic islands
5 CONClUsIONs
The reliability analysis of interpolation methods applied in travel time map shows that the smallest errors (absolute error, absolute percentage error, RMSE) were seen with IDW interpolation, the largest with NN. This is because it is possible to adjust the interpolation parameters for IDW to the specific nature of any given measurement. For both methods, the best results were obtained when the input data was dense and relatively evenly distributed, which is difficult to achieve in lightly built-up areas. The errors clearly decrease when the density of stops increases.
For both IDW and spline methods, the appropriate choice of input points is very important otherwise inaccessible areas are created.
Mean absolute percentage error (MAPE) is lowest for IDW, and highest for NN. Taking into account that virtually the whole Warsaw area, beyond the immediate vicinity of MUT, is located within an isochrone of a value greater than 15 minutes, the interpolation errors are small and do not favour the final choice of one of the analysed interpolation methods. Significantly greater are the differences concerning the number and size of isochronic islands. A relatively large number of small isochronic islands occurred when using the spline interpolation, which makes it significantly less useful for modelling accessibility time.
The accuracy assessment showed the expected underestimation in travel times. The nature of Warsaw’s public transport infrastructure and the high variation of traffic levels during peak hours caused the difference between theoretical and actual MUT accessibility times to vary within a range of 20%. Elz
bieta
Bielec
ka, A
nna B
ober
- REL
IABIL
ITY A
NALY
SIS O
F INT
ERPO
LATIO
N M
ETHO
DS IN
TRAV
EL TI
ME M
APS –
THE C
ASE O
F WAR
SAW
310
Geo
dets
ki v
estn
ik 5
7/2
(201
3)IZ
ZN
AN
OST
I IN
STR
OK
E
aCkNOWlEDGEmENTs
Data for travel times to the MUT campus via public transport were obtained by Monika Perzanowska as part of the BSc thesis “ Transport accessibility map for the Military University of Technology”, at the Faculty of Civil Engineering and Geodesy, under the supervision of Professor Elzbieta Bielecka. The comparison of interpolation methods was researched personally.
literature and reference: Bielecka, E. (2006). systemy informacji geograficznej. Teoria i zastosowania. (Geographic Information systems. Theory and applications). Warsaw: Publisher PjWsTk.
Boczar, E. (1933). Izochrony dośrodkowe Polski. (To Centre isochrone of Poland). sprawozdanie naukowe za lata 1925-1932. krakow: jagiellonian University.
Bogataj, m., Drobne, s. (2005). Does the improvement of roads increase the daily commuting? Numerical analysis of slovenian interregional flows. In: zadnik stirn, l., Indihar Štemberger, m., ferbar, l., Drobne, s. (ur.), selected Decision support models for Production and Public Policy Problems (pp. 185–206). ljubljana: slovenian society Informatika.
Bogataj, m., Drobne, s. (2010). Decision making in competitiveness of regions. 13th International conference on operational research, split, Croatia, september 29–October 01, book of abstracts (pp. 73). split: Croatian Operational Research society (GRORs)& faculty of Economics in split.
Burrough, P. a., mcDonnell, R. a. (1998). Principles of Geographical Information systems. Oxford: Oxford University Press.
Carden, T. (2005). Travel Time Tube map. Taken from the website http://www.tom-carden.co.uk/p5/tube_map_travel_times/applet/ on 3 sept. 2012.
Childs, C. (2004). Interpolating surface In arcGIs spatial analys. arcUser july-september, 32-35. Taken from the website www.esri.com on 20 sept. 2012.
Davis, j.C. (1986). statistics and Data analysis in Geology. New york: john Wiley & sons.
Drobne, s., lisec, a., Bogataj, m. (2008). GIs analysis of rural land market In slovenia. 11th aGIlE International Conference on Geographic Information science (str. 1–11). Girona: University of Girona.
Eckert, m. (1925). kartenwissenschaft. forschungen Und Grundlagen zu einer kartographie ais Wissenschaft. Bd. 2. Berlin: De Gruyter.
EsPON, (2009). Territorial Dynamics in Europe, Trends in accessibility. Territorial Observation 2. luxembourg:. Taken from the website http://www.espon.eu/main/menu_Publications/menu_TerritorialObservations/trendsina on 1 Oct. 2012
feltynowski, m. (2009). Dostępność komunikacyjna jako element rozwoju gmin wiejskich łódzkiego obszaru metropolitalnego.( The communications availability as the element of the development of rural gminas of lodz metropolitan area). Infrastruktura i ekologia terenów wiejskich 6/2009, 197–207.
Galton, f. (1881). On the construction of isochronic Passage-Charts. Proceedings of the Royal Geographical society, No 11 (str. 657–658). londyn: Royal Geographical society.
Guzik, R. (2003). Przestrzenna dostepność szkolnictwa ponadpodstawowego (spatial availability of secondary schools). krakow: jagiellonian University.
hassinger, h. (1903). Beitrage zur siedlungs und Verkehrsgeographnie von Wien. mitt. d. k.k. Geogr. Ges. in Wien, 53 (1), 5–88 (maps in No 2).
Isaaks, E. h., srivastava, R. m. (1989). applied Geostatistics. New york: Oxford University Press.
IsO 19114 (2003). Geographic information -- Quality evaluation procedure.
IsO/DIs 19158 (2011). Geographic information -- Data quality.
juli~ao, R. P. (1999). measuring accessibility Using GIs. GeoComputation Proceedings. Taken from the website http://www.geovista.psu.edu/sites/geocomp99/Gc99/010/gc_010.htm on 26 august 2012 on 22 sept.2012.
karczmarek, W. (1978). Czas i koszty jako kryteria wyznaczania rejonów ciążenia do punktów komunikacyjnych. (Time Elzbie
ta Bie
lecka
, Ann
a Bob
er - R
ELIA
BILITY
ANA
LYSIS
OF I
NTER
POLA
TION
MET
HODS
IN TR
AVEL
TIM
E MAP
S – TH
E CAS
E OF W
ARSA
W
311
Geo
dets
ki v
estn
ik 5
7/2
(201
3)IZ
ZN
AN
OST
I IN
STR
OK
E
and cost as the criteria for designating areas of gravity to the communication points). zeszyty naukowe seria 1 z.75 (82-96). Poznan: Economic academy.
koening, j.G. (1980). Indicators of Urban accessibility: Theory and application. Transportation 9 (145–172). amsterdam: Elsevier scientific Publishing Company.
kubijowicz, W. (1923). Izochrony Południowej Polski. (Isochrones of south Poland). Prace Instytutu Geograficznego Uniwersytetu jagiellońskiego 1. krakow: jagiellonian University.
li j., heap, a. D. (2008). a Review of spatial Interpolation methods for Environmental scientists. Geoscience australia Record 2008/23. Cambera. Taken from the website http://www.ga.gov.au/image_cache/Ga12526.pdf on 3 October 2012.
lightfoot, Ch., kelly, f. (2006). Travel-time maps – transforming our view of transport. asymptopia October 2006 (1-2). Cambridge: University of Cambrigde.
lightfoot, Ch., steinberg, T. (2006). Travel–time maps and their Uses. Taken from the website http://www.mysociety.org/2006/travel-time-maps/ on 2 sept. 2012.
müller, m., Glander, T. (2010). Distance Transformations for accessibility mapping in the Public Transport Domain: a Performance assessment. GIscience 2010, sixth international conference on Geographic Information science zurich, 14-17th september, 2010. Taken from the website http://www.giscience2010.org/pdfs/paper_195.pdf on 12 sept. 2012.
Nalder, I.a., Wein, R.W. (1998). spatial interpolation of climatic Normals: test of a new method in the Canadian boreal forest. agricultural and forest meteorology 92, 211-225.
Nelson, a. (2008). Travel time to major cities: a global map of accessibility. Global Environment monitoring Unit–joint Research Centre of the European Commission, Ispra Italy. Taken from the website http://gem.jrc.ec.europa.eu/ on 3 sept. 2012.
Novosad, m. (1980). Dostępność komunikacyjna górnego Wieprza pod kątem rekreacji niedzielnej. (Upper Wieprz communication availability form the point o weekend recreation). Problemy turystyki 3 (9), 85-89.
Pietrusiewicz, W. (1996). Problemy metodyczne opracowywania map dostępności czasowej. (methodological problems of elaborating time accessibility maps). Polski Przegląd kartograficzny 28 (2), 87–99.
Rewienska, W.(1929). Izochrony Wilna. (Vilnius isochrones) Prace zakładów Geologii i Geografii Uniwersytetu stefana Batorego, Vilnius: Vilnius University.
Riedel, j. (1911). Neue studien über Isochronenkarten. Pet. Geogr.mitt., lVII (l), 28l–284.
schjerning, W. (1903). stxudien uber isochronen karten. zeitschr. d. Ges. f. Erdkunde zu Berlin (str. 693–705, 763–783).
schnabel, W., lohse, D. (1997). Grundlagen der straßenverkehrstechnik und der Verkehrsplanung, Teil 1: Verkehrsplanung. Berlin: Verlag für Bauwesen.
schurmann, C. (1999). Rail and Road Isochrones from Berlin. Institute of spatial Planning. Taken from the website http://www.raumplanung.tu-dortmund.de/irpud/en/projectdetails/viewproject/eisenbahn/ on 30 july 2012.
sibson, R. a. (1981). Brief Description of Natural Neighbor Interpolation. V. Barnett (ur.), Interpolating multivariate data (str. 21–36). New york john: Wiley & sons.
street, N. (2006). TimeContours: Using isochrone visualisation to describe transport network travel cost. final Report, Department of Computing Imperial College, 14 june 2006. Taken from the website http://www.doc.ic.ac.uk/teaching/projects/Distinguished06/nicholasstreet.pdf on 30 august 2012
Weber, a. (1929). (translated by Carl j. friedrich from Weber's 1909 book). Theory of the location of Industries. Chicago: The University of Chicago Press.
Williams, C. (2009). Where's the remotest place on Earth? New scientist, No 2704, 20 april 2009.
Willmott, C.j. (1981). On the validation of models. Physical Geography 2, 184-194.
Willmott, C.j. (1982). some comments on the evaluation of model performance. Bulletin american meteorological society 63(11), 1309-1313.
Witt, W. (1970). Thematische kartographie. methoden und Probleme. hannover: jänecke.
World Bank's World Development Report 2009 Reshaping Economic Geography (November 2008). Taken from the website http://econ.worldbank.org/WBsITE/EXTERNal/EXTDEC/EXTREsEaRCh/EXTWDRs/EXTWDR2009/0 on 1 sept. 2012. Elz
bieta
Bielec
ka, A
nna B
ober
- REL
IABIL
ITY A
NALY
SIS O
F INT
ERPO
LATIO
N M
ETHO
DS IN
TRAV
EL TI
ME M
APS –
THE C
ASE O
F WAR
SAW
312
Geo
dets
ki v
estn
ik 5
7/2
(201
3)IZ
ZN
AN
OST
I IN
STR
OK
E
zavodnik lamovšek, a., Drobne. s. (2011). Evaluation of the transport and other national policies for sustainable development as key for cohesion policy of slovenia – Experiences and thoughts for future. academic pepers and presentations,Regional studies association Conference 2011, 16th - 18th march 2011. Blend, slovenia. Taken from the website http://www.regional-studies-assoc.ac.uk/events/2011/mar-slovenia/papers/zavodnik.pdf on 2 sept. 2012.
zegda l. 2009, 2020 - Wyzwania dla małoposki (2000- Challenges for malopolska). Taken from the website http://www.starostwo.nowy-sacz.pl/konwent/pliki/2009-11-17/ on 12 august 2012.
Received for publication: 30 October 2012Received by: 17 march 2013
assoc. Prof. Dr. Elzbieta Bielecka,Military University of Technology, Faculty of Civil Engineering and Geodesy
Department of Geographical Information Systems, gen. S. Kaliskiego 2, 00-908 Warsaw, Poland
e-mail: [email protected]
m.sc. anna BoberMilitary University of Technology, Faculty of Civil Engineering and Geodesy
Department of Geographical Information Systems, gen. S. Kaliskiego 2, 00-908 Warsaw, Poland
e-mail: [email protected]
ta Bie
lecka
, Ann
a Bob
er - R
ELIA
BILITY
ANA
LYSIS
OF I
NTER
POLA
TION
MET
HODS
IN TR
AVEL
TIM
E MAP
S – TH
E CAS
E OF W
ARSA
W