Embed Size (px)
Citation preview

Reliability analysis of safety-critical embedded systems
Chunying Ma
October 2018
CONTROL AND COMPUTER ENGINEERING DEPARTMENT
Adviser:
Professor Matteo Sonza Reorda
Professor Massimo Violante
Research Assistant - PhD Student Jacopo Sini

ii
Abstract
IEC 61508 is an international standard published by the International Electrotechnical
Commission of rules applied in industry. It is titled Functional Safety of
Electrical/Electronic/Programmable Electronic Safety-related Systems (E/E/PE, or
E/E/PES). It is a basic functional safety standard applicable to all kinds of industry. It
defines functional safety as: “part of the overall safety relating to the EUC
(Equipment Under Control) and the EUC control system which depends on the
correct functioning of the E/E/PE safety-related systems, other technology
safety-related systems and external risk reduction facilities. However, IEC 61508 is
not well suited to automotive development and is often subject to different
interpretations. And it is not easy to align it with the traditional automotive
engineering V approach.
ISO 26262 is an international standard specific for the automotive industry. It applies
to safety-related road vehicle electronic and electrical (E/E) systems, and addresses
hazards due to malfunctions. Hazard analysis and risk assessment determine ASIL
and safety goals.
Considering hazard analysis and ASIL classification then we get the requirement of
software and hardware.
Functional test is used for End-of-manufacturing test, Incoming inspection, in-field
(or in-field) test. In-field test is especially crucial for safety-critical systems.
Software-Based Self-Test (SBST) is a special kind of functional test for processors and
system on chips(SoCs).
There are some methods for reliability engineering in ISO 26262: Failure Modes and
Effects Analysis (FMEA), Hardware Architecture Metrics. A Failure Modes and Effects
Analysis(FMEA) is a systematic technique that is designed to identify problems. It is a
bottom up method to identify potential failures.
For the materials and method used in the analysis. Renesas TB-S5D5 Target Board is
applied in an automotive case study. There are two ways to check the hardware
design of the embedded system: handmade and automatic FMEA result comparison
from the system level point of view.
The verification of the hardware design is applied in Simulink environment. And the
microcontroller is considered here to build the whole system. The ISO26262
hardware development contains Hardware evaluation, Hardware architecture
metrics. After analyzing the metrics, the target ASIL can be gotten easily.
Also the fault injection technique is widely used for evaluating the sensitivity of
systems to faults.

iii
The last part of the thesis is the discussion and conclusion of the hardware
verification.

iv
Acknowledgements
I would like to thank my supervisors from the University of Politecnico Di Torino,
Matteo Sonza Reorda and Massimo Violante, for their guidance and feedback
throughout the research project.
I am grateful for their valuable supervision, motivating ideas and never-ending
optimism.
Furthermore, I would like to thank those people who helped and supported us time
to time during the work whose names are not mentioned here.
I would like to thank you all!

v
Table of Contents
1 Introduction ......................................................................................................................... 1
1.1 Context ......................................................................................................................... 1
1.1.1 reliability ................................................................................................................ 1
1.1.2 Safety and ASIL classification ................................................................................ 3
1.1.4 FMEA ................................................................................................................... 23
2 Materials and method ....................................................................................................... 24
2.1 Renesas TB-S5D5 Target Board analysis ..................................................................... 24
2.2 Failure mode analysis of the components of the electronic board ........................... 27
2.3 Automotive case study related to FMEA .................................................................... 29
2.4 Selecting the related pins ........................................................................................... 32
2.4.1 Clock pins ............................................................................................................. 32
2.4.2 Analog input pins ................................................................................................. 32
2.4.3 PWM digital output pin ....................................................................................... 33
2.4.4 power supply pin ................................................................................................. 33
2.5 How to draw the schematics of the board on Simulink. ............................................ 34
2.6 The ISO26262 hardware development ...................................................................... 37
2.6.1 Hardware evaluation ........................................................................................... 38
2.6.2 Hardware architecture metrics ........................................................................... 40
2.6.3 fault injection ...................................................................................................... 44
3 Result ................................................................................................................................. 48
4 Discussion .......................................................................................................................... 49
5 Conclusion ......................................................................................................................... 50
vi
List of figure
FIGURE 1: SAFETY STANDARDS DEVELOPMENT .................................................................................................... 3
FIGURE 2: FUNCTIONALITIES IN VEHICLE ............................................................................................................ 4
FIGURE 3: THE PARTS INVOLVED IN ISO 2626 .................................................................................................... 5
FIGURE 4: ISO 26262 IMPLEMENTATION IN PHASES ........................................................................................... 5
FIGURE 5: SYSTEM/USER INTERACTION ............................................................................................................. 6
FIGURE 6: HARDWARE REDUNDANCY ............................................................................................................... 7
FIGURE 7: PASSIVE REDUNDANCY ..................................................................................................................... 7
FIGURE 8: FAULT TOLERANT VOTER ................................................................................................................... 8
FIGURE 9: NOT FAULT TOLERANT VOTER ............................................................................................................ 8
FIGURE 10: THE VOTER IMPLEMENTATION OF THE FUNCTIONALITY ......................................................................... 9
FIGURE 11: HYBRID REDUNDANCY ................................................................................................................... 9
FIGURE 12: BIST SYSTEM ARCHITECTURE ........................................................................................................ 10
FIGURE 13: NORMAL MODE OF BIST SYSTEM ARCHITECTURE ............................................................................. 11
FIGURE 14:TEST MODE OF BIST SYSTEM ARCHITECTURE.................................................................................... 11
FIGURE 15: THE ISO 26262 SAFETY LIFE CYCLE [3]. ......................................................................................... 12
FIGURE 16: OVERVIEW OF ISO 26262 ........................................................................................................... 13
FIGURE 17: ABS EXAMPLE OF ASIL DETERMINATION BASED ON HAZARD AND RISK ANALYSIS AT THE CONCEPT PHASE .. 17
FIGURE 18:INTEGRATION OF FUNCTIONS IN VIRTUAL AND PHYSICAL ENVIRONMENTS ............................................... 18
FIGURE 19: PHASES OF THE FUNCTIONAL SAFETY DEVELOPMENT PROCESS, CORRESPONDING REQUIREMENTS AND
EXAMPLES ......................................................................................................................................... 18
FIGURE 20: SOFTWARE SAFETY LIFECYCLE ........................................................................................................ 19
FIGURE 21: DEVELOPMENT OF THE PROCESS OF HARDWARE AND SOFTWARE REQUIREMENTS ................................... 19
FIGURE 22: SPECIFICATION OF SOFTWARE SAFETY REQUIREMENTS ....................................................................... 20
FIGURE 23: THE AUTOMOTIVE MARKET –MULTIPLE PLAYERS ............................................................................... 21
FIGURE 24: SBST TEST ARCHITECTURE FOR END-OF-MANUFACTURING TEST ......................................................... 21
FIGURE 25: SBST TEST ARCHITECTURE FOR INFIELD TEST ................................................................................... 22
FIGURE 26: TB-S5D5 TOP SIDE ..................................................................................................................... 24
FIGURE 27: TB-S5D5 BOTTOM SIDE .............................................................................................................. 25
FIGURE 28: ELECTRICAL SCHEMATICS (1) ........................................................................................................ 25
FIGURE 29: ELECTRICAL SCHEMATICS (2) ........................................................................................................ 26
FIGURE 30: ELECTRICAL SCHEMATICS (3) ........................................................................................................ 26
FIGURE 31: ELECTRICAL SCHEMATICS (4) ........................................................................................................ 27
FIGURE 32: MODEL-BASED VT MODE. ........................................................................................................... 30
FIGURE 33: MODEL-BASED SAFETY ANALYSIS FRAMEWORK. ............................................................................... 30
FIGURE 34: HARDWARE DESIGN .................................................................................................................... 31
FIGURE 35: SCHEMATICS OF SIMULINK. .......................................................................................................... 35
FIGURE 36: SCHEMATICS OF SIMULINK DETAILS(1). ........................................................................................... 35
FIGURE 37: SCHEMATICS OF SIMULINK DETAILS(2). ........................................................................................... 36
FIGURE 38: ADC CONVERTER SCHEMATICS. ..................................................................................................... 37
FIGURE 39: THE ISO 26262 HARDWARE DEVELOPMENT PROCESS[17]. ............................................................... 38
FIGURE 40: THE ISO 26262 HARDWARE ASSESSMENT PROCESS[18]. .................................................................. 39
FIGURE 41: SCHEME TO CLASSIFY FAILURE MODES. MPF STANDS FOR MULTIPLE-POINT FAULT[17]. 39
FIGURE 42: SINGLE-POINT FAULT METRIC ....................................................................................................... 41
vii
FIGURE 43: LATENT- FAULT METRIC ............................................................................................................... 41
FIGURE 44:ITEM ARCHITECTURE .................................................................................................................... 45
FIGURE 45:ITEM ARCHITECTURE EXAMPLE ....................................................................................................... 45
FIGURE 46:ITEM ARCHITECTURE IN MATLAB .................................................................................................. 46
FIGURE 47:OVERALL SIMULATOR ARCHITECTURE .............................................................................................. 46
FIGURE 48: FAULT INJECTION SIMULATION EXPERIMENTS ................................................................................... 47
FIGURE 49: FAULT SIMULATION ENVIRONMENT ............................................................................................... 47
List of table
TABLE 1: OTHER ESTABLISHED STANDARDS IN THE AUTOMOTIVE INDUSTRY .............................................................. 4
TABLE 2: EARLY RESEARCHES RELATED TO INTRODUCTION OF ISO 26262 .............................................................. 14
TABLE 3: CLASSIFICATION OF SEVERITY[4]........................................................................................................ 15
TABLE 4: CLASSIFICATION OF CONTROLLABILITY[4] ............................................................................................ 15
TABLE 5 CLASSIFICATION OF CONTROLLABILITY RELATED TO DIFFERENT SCENARIOS[4] .............................................. 15
TABLE 6: CLASSIFICATION OF EXPOSURE[4] ...................................................................................................... 15
TABLE 7: CLASSIFICATION OF EXPOSURE RELATED TO DIFFERENT SCENARIOS[4] ...................................................... 16
TABLE 8: ASIL DETERMINATION ..................................................................................................................... 16
TABLE 9: EXAMPLE OF THE ASIL CLASSIFICATION .............................................................................................. 17
TABLE 10: STUCK-AT AND TRANSITION FAULT REQUIREMENTS ............................................................................. 22
TABLE 11:FMEA FORMAT ............................................................................................................................ 24
TABLE 12:NORMALIZED FAILURE MODE DISTRIBUTIONS FOR CAPACITORS[10][11][12][13] .................................. 27
TABLE 13:NORMALIZED FAILURE MODE DISTRIBUTIONS FOR RESISTORS[10][11][12][13] .................................... 28
TABLE 14: NORMALIZED FAILURE MODE DISTRIBUTIONS FOR SWITCHES[10][11][12][13] .................................... 28
TABLE 15:COMPONENT ANALYSIS OF S5D5(1) ................................................................................................ 28
TABLE 16:COMPONENT ANALYSIS OF S5D5(2) ................................................................................................ 29
TABLE 17:TWO ADJACENT PINS OF MICROCONTROLLER ANALYSIS OF S5D5 .......................................................... 29
TABLE 18:PINS SELECTION OF EXTERNAL CLOCKS ............................................................................................... 32
TABLE 19:PINS SELECTION OF ANALOG SIGNAL ................................................................................................. 33
TABLE 20:PINS SELECTION OF PWM DIGITAL SIGNAL......................................................................................... 33
TABLE 21:PINS SELECTION OF POWER SUPPLY SIGNAL ........................................................................................ 34
TABLE 22:TARGETS FOR THE SINGLE-POINT FAULT METRIC[17]. ........................................................................... 41
TABLE 23:TARGETS FOR THE LATENT FAULT METRIC[17]. .................................................................................... 41
TABLE 24:TARGETS FOR THE RANDOM HARDWARE FAULT METRIC[17]. ................................................................. 42
TABLE 25:FMEA ANALYSIS MANUALLY(1) ....................................................................................................... 43
TABLE 26:FMEA ANALYSIS MANUALLY(2) ....................................................................................................... 43
TABLE 27:FMEA TABLE(1) ........................................................................................................................... 44
TABLE 28:FMEA TABLE(2) ........................................................................................................................... 44
TABLE 29:ASIL CLASSIFICATION ..................................................................................................................... 49
1
1 Introduction
In different applications from engineering point of view, reliability and safety are
crucial factors for using the product. Especially in electronic and automotive
industrials. If there is a fault inside the different phases---life cycle, life cycle contains
four sections: Specific phase, Design phase, Production phase, Operation phase. The
fault can be propagated to an error or even to a failure. It is necessary to evaluate the
potential failures of the product to avoid dangerous affection from the system level.
Nowadays, the embedded system is heavily applied in automotive industries. The
reliability of safety-critical of the embedded system is crucial for the automotive
cases.
The verification of the hardware design of ISO 26262 applying on automotive is a
crucial step. There is a new approach can be done automatically on the basis of
FMEA on system level.
1.1 Context
1.1.1 reliability
With the increasing complexity of the system, the reliability of the system is more
important issue to be discussed. The quality of an electronic system has a growing
importance with respect to the product success. Dependability is a key parameter
when assessing the quality of a product. Elements for dependability are Attributes,
Threats, Means. Attributes contain reliability and safety. At the same time, reliability
is quantifiable by direct measurements.
Reliability is defined as the conditional probability R(t) that the system correctly
behaves until the end of the period t0-t, given that it was correctly behaving at time
t0. Unreliability is defined as Q(t) = 1 - R(t); Unreliability is also known as the
probability of failure. Mean Time to Failure (MTTF) is one of the metrics used to
quantify reliability. The other metrics are failure rate and mean time to repair
(MTTR).
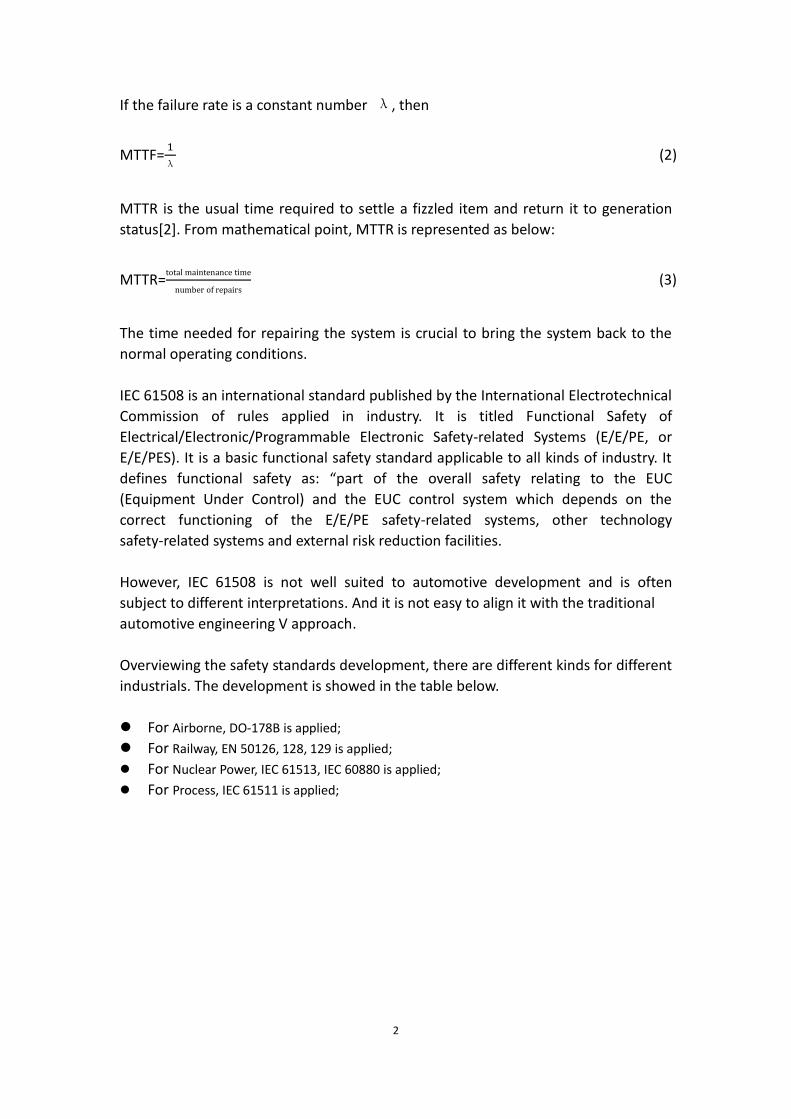
In reliability analysis, MTTF is a mean lifetime of an item. It is average time during
which item will be expected to last in operation [1]. The relationship between MTTF
and reliability function R(t) is shown below:
MTTF=∫ 𝑅(𝑡)𝑑𝑡∞
0 (1)
2
If the failure rate is a constant number λ, then
MTTF=1
λ (2)
MTTR is the usual time required to settle a fizzled item and return it to generation
status[2]. From mathematical point, MTTR is represented as below:
MTTR=
(3)
The time needed for repairing the system is crucial to bring the system back to the
normal operating conditions.
IEC 61508 is an international standard published by the International Electrotechnical
Commission of rules applied in industry. It is titled Functional Safety of
Electrical/Electronic/Programmable Electronic Safety-related Systems (E/E/PE, or
E/E/PES). It is a basic functional safety standard applicable to all kinds of industry. It
defines functional safety as: “part of the overall safety relating to the EUC
(Equipment Under Control) and the EUC control system which depends on the
correct functioning of the E/E/PE safety-related systems, other technology
safety-related systems and external risk reduction facilities.
However, IEC 61508 is not well suited to automotive development and is often
subject to different interpretations. And it is not easy to align it with the traditional
automotive engineering V approach.
Overviewing the safety standards development, there are different kinds for different
industrials. The development is showed in the table below.
For Airborne, DO-178B is applied;
For Railway, EN 50126, 128, 129 is applied;
For Nuclear Power, IEC 61513, IEC 60880 is applied;
For Process, IEC 61511 is applied;

3
Figure 1: Safety standards development
1.1.2 Safety and ASIL classification
Safety is the probability that the system either behaves correctly or it is able to
interrupt its activity without causing serious damages. Safety analysis requires a
preliminary step, aiming at assessing the seriousness of the possible misbehaviors.
FMEA (Failure Mode and Effect Analysis) is highly used on the basis of safety analysis
in automotive industrial.
Functional safety and reliability is crucial for safety-critical automotive applications.
Many years ago computers and software were very expensive, so they are only
applied in isolated cases, such as military systems, scientific computation, large bank
and insurance corporations. With the development of the technology, the price of
hardware has decreased. In embedded systems, computers and software are heavily
applied, especially in automotive. There are pros and cons with applying of the
technology. More functionalities are developed and more flexibilities are used.
However, the cons are more and more obvious. The complexity can cause defects
and even failures in different levels. But if it happens in safety critical or mission
critical systems , it is dangerous.
There is one safety critical case to explain. Toyota "Unintended Acceleration" Has
Killed 89. Unintended Acceleration (UA) refers to the occurrence of any degree of
acceleration that the vehicle driver did not purposely cause to occur. It is crucial to
avoid the problems previously.
The IEC 61508 Safety Lifecycle is not suited to automotive as it originated from
process and automation industry. As it shows in the figure below, more and more
functionalities are developed in vehicles.

4
Figure 2: Functionalities in vehicle
For this reason, ISO 26262 is introduced here. It is an international standard specific
for the automotive industry. It applies to safety-related road vehicle electronic and
electrical (E/E) systems, and addresses hazards due to malfunctions. It provides
requirements for the whole lifecycle of the E/E system (incl. H/w and S/w
components). The requirements for the E/E system development depend on the risk
for the customer. Risk is determined based on customer risk by identifying the
so-called Automotive Safety Integrity Level (ASIL) associated with each undesired
effects. ISO 26262 is focused on functional safety. There are some other standards
except from ISO 26262 and they are focusing on quality management, testing of
hardware and software. The table is showed below:
Table 1: Other established standards in the automotive industry
After applying the ISO 26262, the customers are more confident to buy a car
preventing the accidents and reducing of risks at an acceptable level. It helps to
prevent expensive recalls and to improve the establishment of a brand name.

5
There are many sections in ISO 26262. It begins with the conception phase to
product development, including the software and hardware parts. The parts involved
figure is shown below:
Figure 3: The parts involved in ISO 2626
For the automotive manufacturer, it is important to implement the standard
effectively, because it can ensure everything is under control. The figure is shown
below:
Figure 4: ISO 26262 Implementation in phases
For the early phase, we need to do the hazard analysis and risk assessment
depending on the systematic definition. Then we need to define the safety goals and
ASIL classification. For the development phase, functional safety and technical safety
requirements are defined.
For ISO 26262, there are two types of failures of the electrical/electronic (E/E)
component: systematic failures and random failures. For systematic failures, they are

6
represented by a change of the design, the manufacturing process, operational
procedures, documentation, or other relevant factors. For random failure, especially
for hardware random failures, they can be found in a hardware element. There are
two kinds of hardware random failures: permanent faults and transient faults.
To detect faults or maintain a safe state, a safety mechanism is needed. The examples
of the mechanism are showed below:
Error correction code (ECC)
Cyclic redundancy check (CRC)
Hardware redundancy
Built-in-self-test (BIST)
The fault can cause failure. From this point of view, fault tolerance technique is
crucial for the systems. Fault tolerant design contains three methods: Hardware
redundancy, Information redundancy, Time redundancy. Fault-tolerant time interval
is defined that after a failure has happened the system shifts to a safe state. Here in
this paper, only hardware redundancy is discussed. There is an example of
system/user interaction showed below.
Figure 5: system/user interaction
From the figure, there are many possibilities. For reliable and safety systems: If there
is a fault in the system and it never manifest itself as a failure. It can be masked and
the fault possibly can be removed from the system. If there is a fault in the system
and it may manifest itself as unexpected but harmless outputs. The fault is detected
and possibly removed from the system. If there is an error in the system and the
propagation is stopped, the output is sent to the user that is different from the
expected but harmless. For undependable systems, if there is an error in the system
and it propagates to a failure and arrives to the user. For fault tolerant systems, If
there is a fault in the system and it manifests as error. The error propagation is
stopped. An output is sent to the user that is the expected one.
7
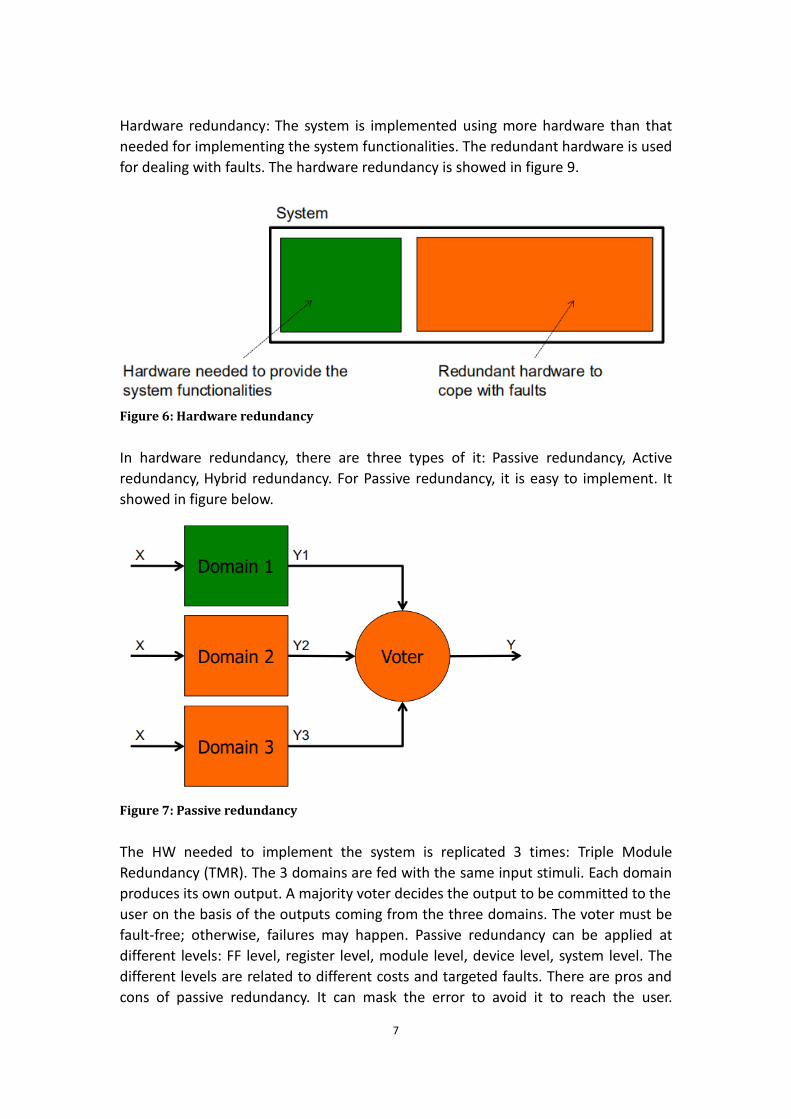
Hardware redundancy: The system is implemented using more hardware than that
needed for implementing the system functionalities. The redundant hardware is used
for dealing with faults. The hardware redundancy is showed in figure 9.
Figure 6: Hardware redundancy
In hardware redundancy, there are three types of it: Passive redundancy, Active
redundancy, Hybrid redundancy. For Passive redundancy, it is easy to implement. It
showed in figure below.
Figure 7: Passive redundancy
The HW needed to implement the system is replicated 3 times: Triple Module
Redundancy (TMR). The 3 domains are fed with the same input stimuli. Each domain
produces its own output. A majority voter decides the output to be committed to the
user on the basis of the outputs coming from the three domains. The voter must be
fault-free; otherwise, failures may happen. Passive redundancy can be applied at
different levels: FF level, register level, module level, device level, system level. The
different levels are related to different costs and targeted faults. There are pros and
cons of passive redundancy. It can mask the error to avoid it to reach the user.

8
However, it cannot correct the error. Also the cost is 3 times than the original one.
The voter must be fault-free; otherwise, failures may happen in the system. As it
shows below.
Figure 8: Fault tolerant voter
Figure 9: Not fault tolerant voter
The voter implements the following functionality:
9
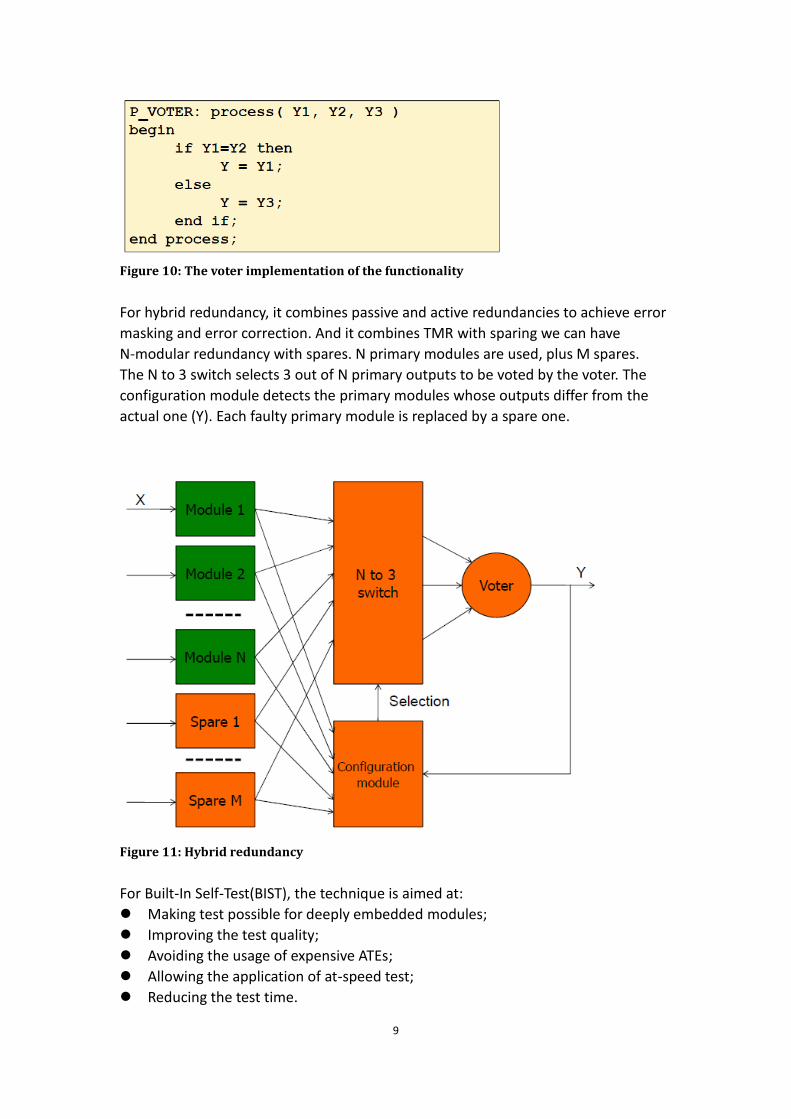
Figure 10: The voter implementation of the functionality
For hybrid redundancy, it combines passive and active redundancies to achieve error
masking and error correction. And it combines TMR with sparing we can have
N-modular redundancy with spares. N primary modules are used, plus M spares.
The N to 3 switch selects 3 out of N primary outputs to be voted by the voter. The
configuration module detects the primary modules whose outputs differ from the
actual one (Y). Each faulty primary module is replaced by a spare one.
Figure 11: Hybrid redundancy
For Built-In Self-Test(BIST), the technique is aimed at:
Making test possible for deeply embedded modules;
Improving the test quality;
Avoiding the usage of expensive ATEs;
Allowing the application of at-speed test;
Reducing the test time.
10
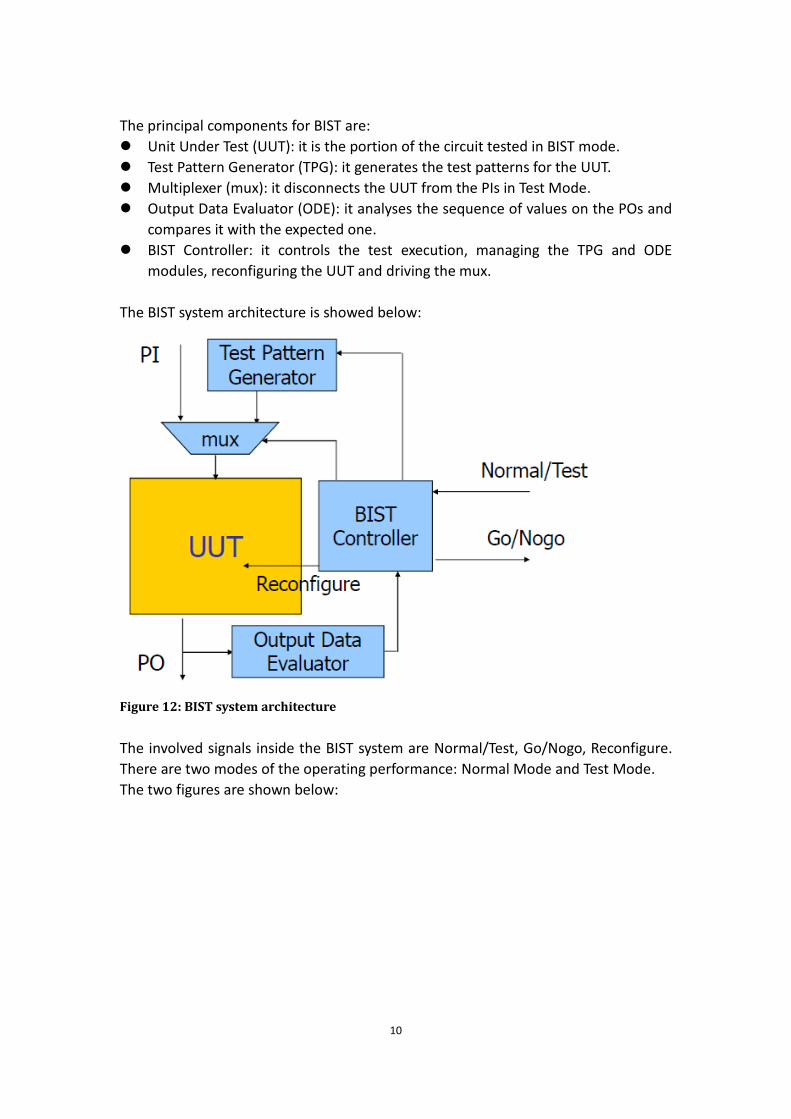
The principal components for BIST are:
Unit Under Test (UUT): it is the portion of the circuit tested in BIST mode.
Test Pattern Generator (TPG): it generates the test patterns for the UUT.
Multiplexer (mux): it disconnects the UUT from the PIs in Test Mode.
Output Data Evaluator (ODE): it analyses the sequence of values on the POs and
compares it with the expected one.
BIST Controller: it controls the test execution, managing the TPG and ODE
modules, reconfiguring the UUT and driving the mux.
The BIST system architecture is showed below:
Figure 12: BIST system architecture
The involved signals inside the BIST system are Normal/Test, Go/Nogo, Reconfigure.
There are two modes of the operating performance: Normal Mode and Test Mode.
The two figures are shown below:

11
Figure 13: Normal Mode of BIST system architecture
Figure 14:Test Mode of BIST system architecture
There are five phases of the BIST session:
The Normal/Test signal is driven by an ATE, a microprocessor, or the Boundary Scan
interface to switch to a test mode; the BIST controller orders the TPG to start
generating test patterns and the patterns are applied to the UUT; the BIST controller
orders the ODE to analyze the UUT outputs; The BIST controller compares the
analyzed output with the expected output for the golden circuit and updates an
internal flag; The Go/Nogo signal is driven to the outside on the basis of the state of
12
the pass/failure flag.
The advantages and disadvantages of BIST are shown below:
For the advantages: it reduces test costs; it increments final quality; it reduces Time
To Market (TTM); it represents the ideal solution for complex blocks embedded in a
device; it supports at-speed test; it allows both the re-use of library blocks and their
test; it is suitable for wafer and core test.
For the disadvantages: it involves some costs in terms of area and performance;
generally, it demands for radical changes in the test plan; it may imply higher power
consumption with respect to normal operation mode; the most suitable solution
depends on the circuit characteristics.
Functional Safety is part of the overall safety that depends on a system or equipment
operating correctly in response to it’s inputs [IEC 61508]. Its objective is the freedom
from unacceptable risk of physical injury or of damage to the health of people either
directly or indirectly. Functional Safety is the way to determine the risk of using
complex and simple circuit to perform a safety function. The safety function must
always be performed under normal/undisturbed conditions and under fault
conditions. Functional Safety is achieved when there is the absence of unreasonable
risk due to hazards caused by the malfunctioning of electrical / electronic systems.
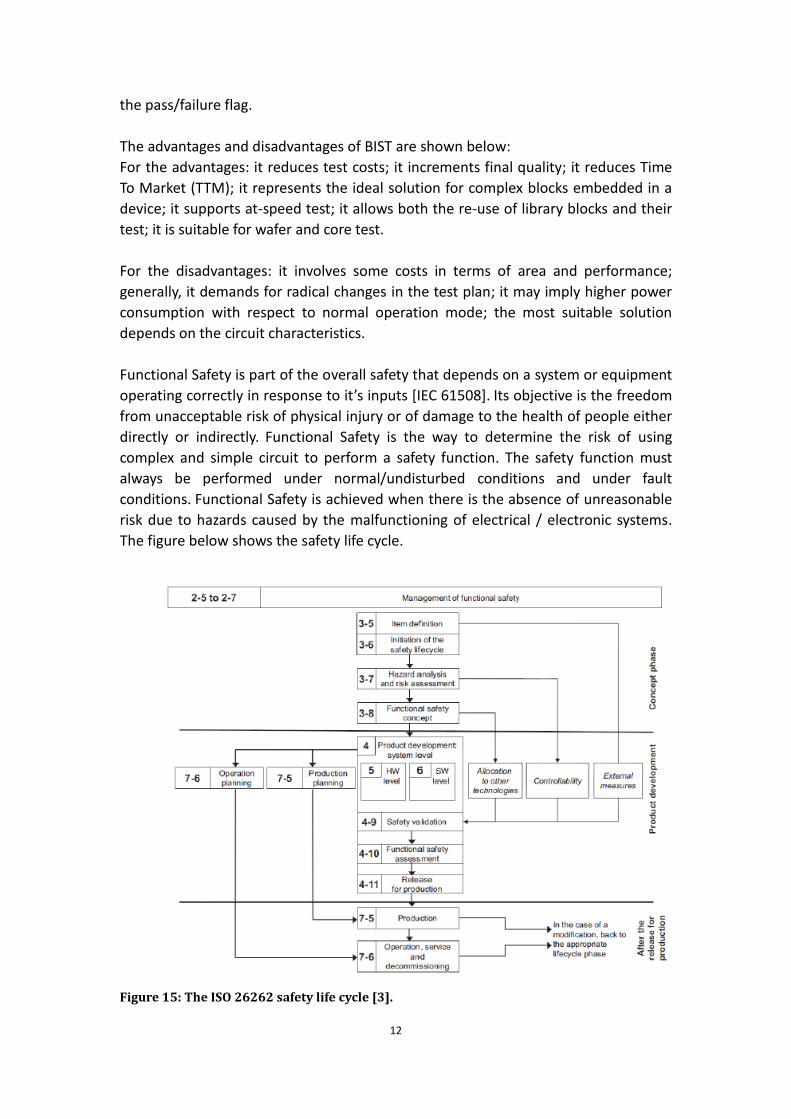
The figure below shows the safety life cycle.
Figure 15: The ISO 26262 safety life cycle [3].
13
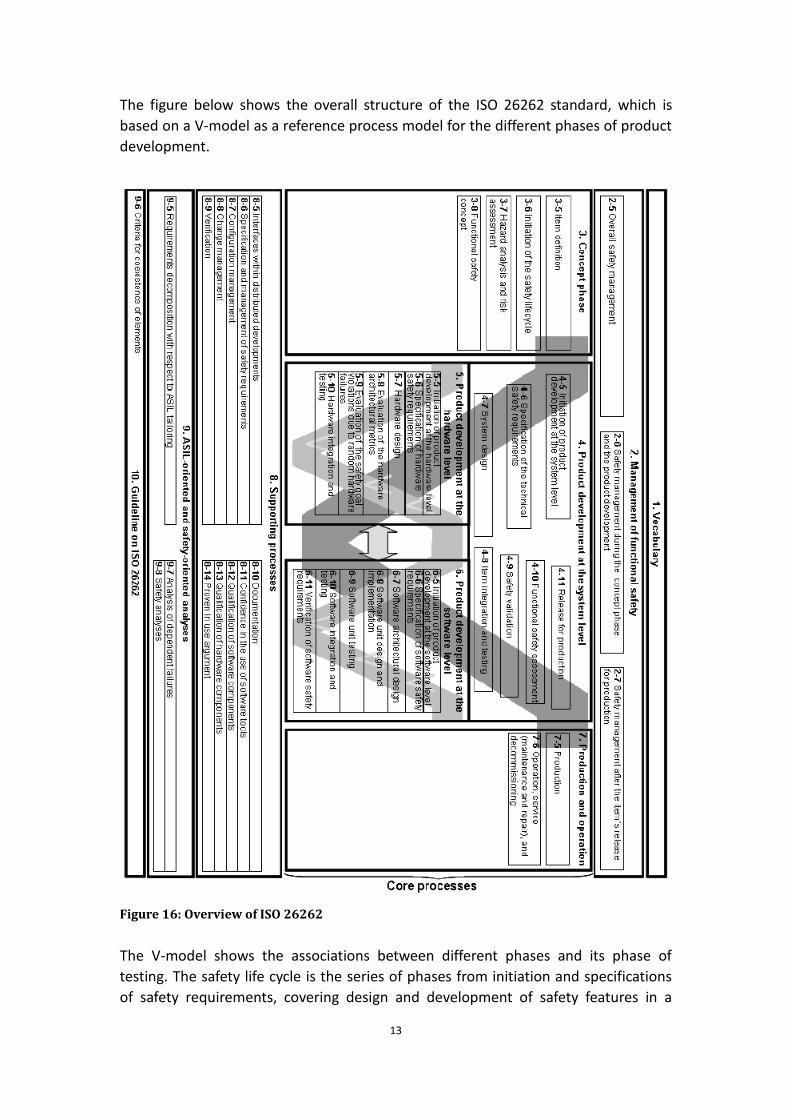
The figure below shows the overall structure of the ISO 26262 standard, which is
based on a V-model as a reference process model for the different phases of product
development.
Figure 16: Overview of ISO 26262
The V-model shows the associations between different phases and its phase of
testing. The safety life cycle is the series of phases from initiation and specifications
of safety requirements, covering design and development of safety features in a
14
safety-critical system, and ending in decommissioning of that system.
From the figure, initiation of the safety lifecycle describes the system in terms of
functionalities, interfaces. Hazard analysis and risk assessment determine
Automotive Safety Integrity Level (ASIL) and safety goals. Functional safety concept
specify functional safety requirements.
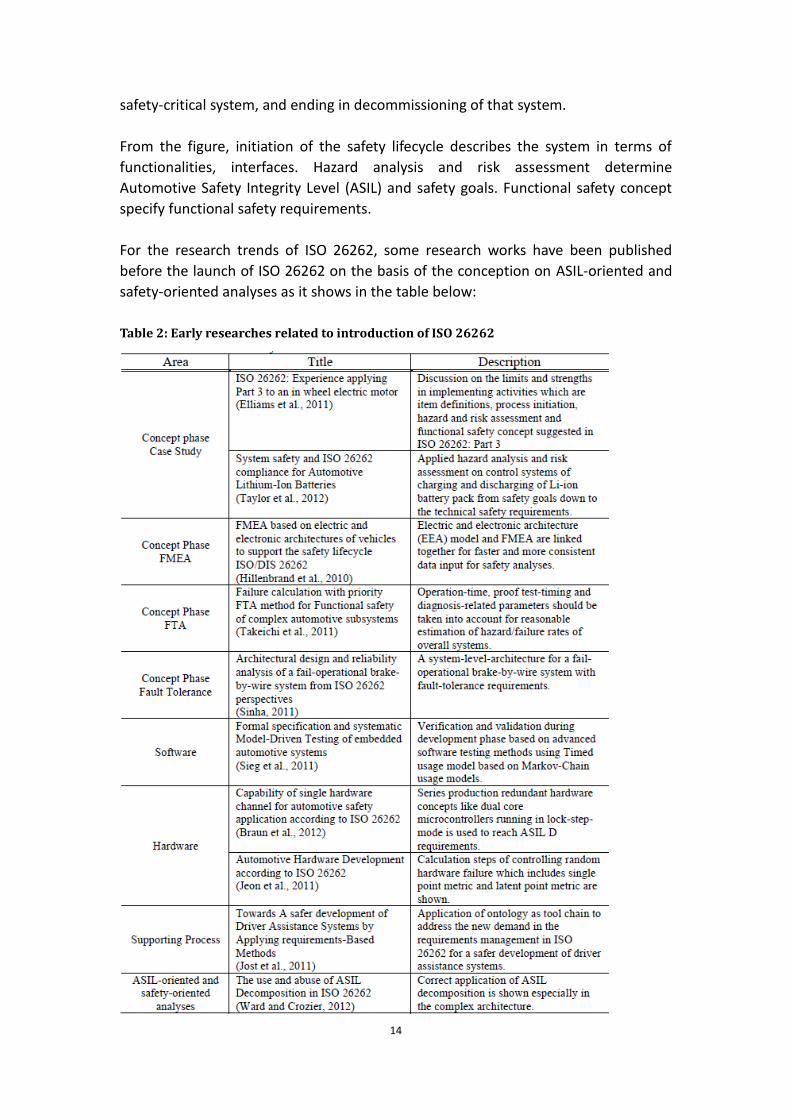
For the research trends of ISO 26262, some research works have been published
before the launch of ISO 26262 on the basis of the conception on ASIL-oriented and
safety-oriented analyses as it shows in the table below:
Table 2: Early researches related to introduction of ISO 26262

15
ASIL classification is based on three elements: Severity, Exposure, Controllability.
Severity S is the measure of the extent of harm to an individual. There are 4 kinds of
severity:S0-S3.It is showed in figure 2. Controllability C is the avoidance of the
specified harm or damage through the timely reaction of the persons involved. There
are also 4 kinds of controllability:C0-C3. It is showed in figure 3 and figure 4.
Exposure is being in an operational situation that can be hazardous if coincident with
the failure. There are 5 kinds of exposure:E0-E4. It is showed in figure 5 and figure 6.
Table 3: Classification of severity[4]
Table 4: Classification of controllability[4]
Table 5 Classification of controllability related to different scenarios[4]
Table 6: Classification of exposure[4]

16
Table 7: Classification of exposure related to different scenarios[4]
From the analysis above, as a conclusion, there are 5 kinds of ASIL classification: QM
(quality measures),A (least important),B,C,D (most important). It is showed in figure
below.
Table 8: ASIL determination
The figure below shows an Anti-lock Braking System(ABS) example how to get the
classification of ASIL on the basis of the functions and impacts.

17
Figure 17: ABS example of ASIL determination based on Hazard and Risk Analysis at the
concept phase
From the different systems of the automotive, there are different hazards and safety
goals as well as the level of random hardware failure target value, the example of
ASIL classification is shown below:
Table 9: Example of the ASIL Classification
The functional safety requirements are concluded from the functional safety concept.
For each safety goal, there is at least one functional safety requirement. The method
used for the setting of functional requirements are failure mode and effects analysis
(FMEA) and Preliminary Hazard Analysis (PHA), fault tree analysis (FTA), hazard and
operability analysis (HAZOP).
In automotive industry, the main functionality is driven by the development of the
software part. The software part integrated together to realize the function inside
the vehicles. For a further step, to realize the requirement of safety and comfort.
With the rising number of electric/electronic and software applied inside a vehicle,

18
the early we find the problems, the better of the whole system to avoid dangerous
injuries. Model-based software design is developed in automotive for the production
chain from supplier to manufacturers.
Most functions within an automotive electronic control units(ECUs) are implemented
and controlled through automotive ECU software and the complexity of this software
can reach more than 10 million lines of code, and up to 40 % of the production costs
of a car are attributed to electronics and software[5]. From the research that is done
by other car manufacturers, the complexity of software and the number of software
is still increasing inside the cars. The quality assurance and the maintenance is a key
point to pay attention. The integration of the virtual world and physical environment
implementing the function on ECU is showed below.
Figure 18:Integration of functions in virtual and physical environments
The ISO 26262 standard defines the phases of the functional safety lifecycles. From
the figure below, we can see clearly the connection between the concept phases and
the functional safety activities with examples. There are three main parts of the
figure from the left to the right: concept part, functional safety activities and
examples.
Figure 19: Phases of the Functional Safety development process, corresponding requirements and
examples

19
The software development process maps directly onto the V-model. And it is related
to ISO 26262. The process is divided into different layers and they are related to
different testing activities. The software lifecycle is showed below.
Figure 20: Software safety lifecycle
Typically, these programmable ECUs contain highly modular embedded software. For
this, we consider hazard analysis and ASIL classification then get the requirement of
software and hardware. The figure is showed below.
Figure 21: Development of the process of hardware and software requirements

20
The specification of software safety requirements and the communication to
hardware is showed below.
Figure 22: Specification of software safety requirements
There are many kinds of errors of software development cycle:
Requirement specification and communication
Software Design and coding errors
Errors due to software changes
Errors due to inadequate testing
The verification of software safety requirements contains a few test steps:
Unit Test
Ticket Integration Test
Integration Test
Software Test
System Integration Test
Analysis Test
Here take the Software-Based Self-Test as an example to explain.
1.1.3 Software-Based Self-Test
Functional test is used for End-of-manufacturing test, Incoming inspection, in-field
(or in-field) test. In-field test is especially crucial for safety-critical systems. For
Business issues, The market of safety-critical systems is very fragmented. For
example, Core providers, Semiconductor companies, Processor providers, OEMs, Car
21
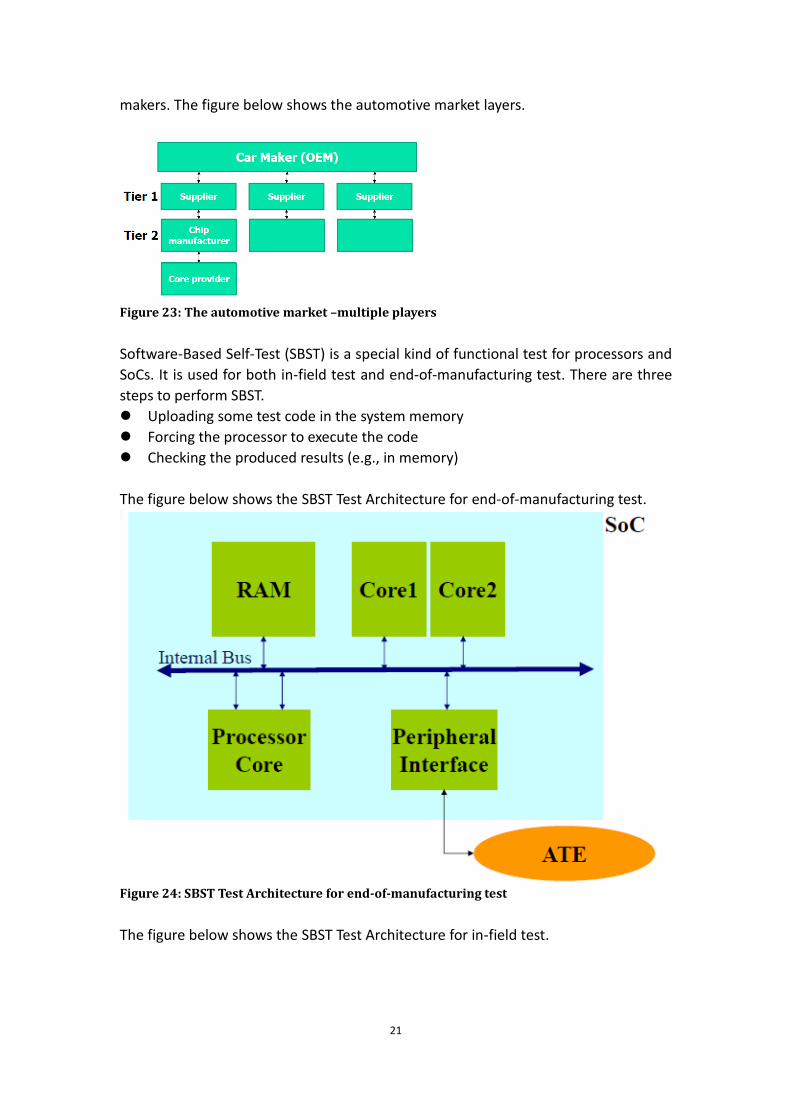
makers. The figure below shows the automotive market layers.
Figure 23: The automotive market –multiple players
Software-Based Self-Test (SBST) is a special kind of functional test for processors and
SoCs. It is used for both in-field test and end-of-manufacturing test. There are three
steps to perform SBST.
Uploading some test code in the system memory
Forcing the processor to execute the code
Checking the produced results (e.g., in memory)
The figure below shows the SBST Test Architecture for end-of-manufacturing test.
Figure 24: SBST Test Architecture for end-of-manufacturing test
The figure below shows the SBST Test Architecture for in-field test.

22
Figure 25: SBST Test Architecture for infield test
Some reliability standards define strict requirements for in-field test targets. For
example, the ISO 26262 standard for automotive requires the following fault
coverage (for stuck-at and transition faults), depending on the reliability level of the
application. The result is showed below.
Table 10: Stuck-at and transition fault requirements
In automotive cases(Anti-lock Braking Systems (ABS), Electronic Stability Program
(ESP), Adaptive Cruise Control (ACC), Emergency Brake Assistant (EBS), Brake-By-Wire
(BBW), Steer-By-Wire (SBW), air bags, light control and tire pressure) field,
safety-critical is the most important element and it has a huge requirement for
functional safety and reliability. In the past decade years, the car manufacturers and
system providers is responsible for functional safety. With the increasing complexity
of the electronic systems applied and embedded systems heavily used in automotive
industrial, the checking of the functional safety involved in many fields from the
beginning of the industrial, including semiconductor companies and design tool
providers. It is necessary to classify the hazard identification. Safety is not equal to
reliability. Reliability engineering focuses on component failures. And System can be
unsafe when none of the component fails. System can still be safe when components
fail. Consider in this way, There are some methods for reliability engineering in ISO
23
26262: Failure Modes and Effects Analysis (FMEA), Hardware Architecture Metrics,
ecc. FMEA is popular used method in automotive industrial.
1.1.4 FMEA
A Failure Modes and Effects Analysis(FMEA) is a systematic technique that is
designed to identify problems[6].It is a bottom up method to identify potential
failures.
Go back to FMEA, it tries to find all the failures in different levels of the system. One
system contains a lot of components from the beginning design process to the end.
FMEA can analyze one component at a time and propagate the analysis to the system
level, then the engineer can get the effect generally. The FMEA can be done on
different levels. The overall objective of FMEA is to identify possible failure modes of
the system components, evaluate their influences on system behavior, and propose
proper countermeasures to suppress these effects[7][8]. The primary reference for
the FMEA technique is MIL-STD-1629[9].From component point of view, there are
four steps to do FMEA[6]:
list all components of the analyzed system.
For each component, list all known failure modes.
For each component/failure mode, list effect on the next higher level.
For each component/failure mode, list the severity of effect.
The goal of FMEA is to identify the potential failures. After doing FMEA, the potential
failures in the devices or the systems can be deleted. It means that when there is a
new system, it is better to know the failure in the system as soon as possible to avoid
further problems. From manufacture point of view, design is the earliest phase in the
entire life cycle of the system, so this phase is the best time to do FMEA. Also the
more early time we do FMEA, the more money we can save from the cost point of
view. From the reliability and safety evaluation reason, FMEA can provide the
documentation input.
FMEA is widely used in hardware design verification and it is good way to improve
the safety and reliability of mission critical software. However, there are some
weaknesses in practice: the analysis of FMEA result is much based on the engineer’s
familiarity to the analyzed system. At the same time, most of the work has to be
finished by hand. The development of the object-oriented software for critical
systems has not been systematically considered in FMEA. In order to use FMEA, there
is FMEA format to follow is showed below.

24
Table 11:FMEA Format
2 Materials and method
2.1 Renesas TB-S5D5 Target Board analysis
In the experiment, one electronic board TB-S5D5 is analyzed. The board is used in
NASA space industrial. The TB-S5D5 top side and bottom side is showed as below in
figures .
Figure 26: TB-S5D5 top side
25
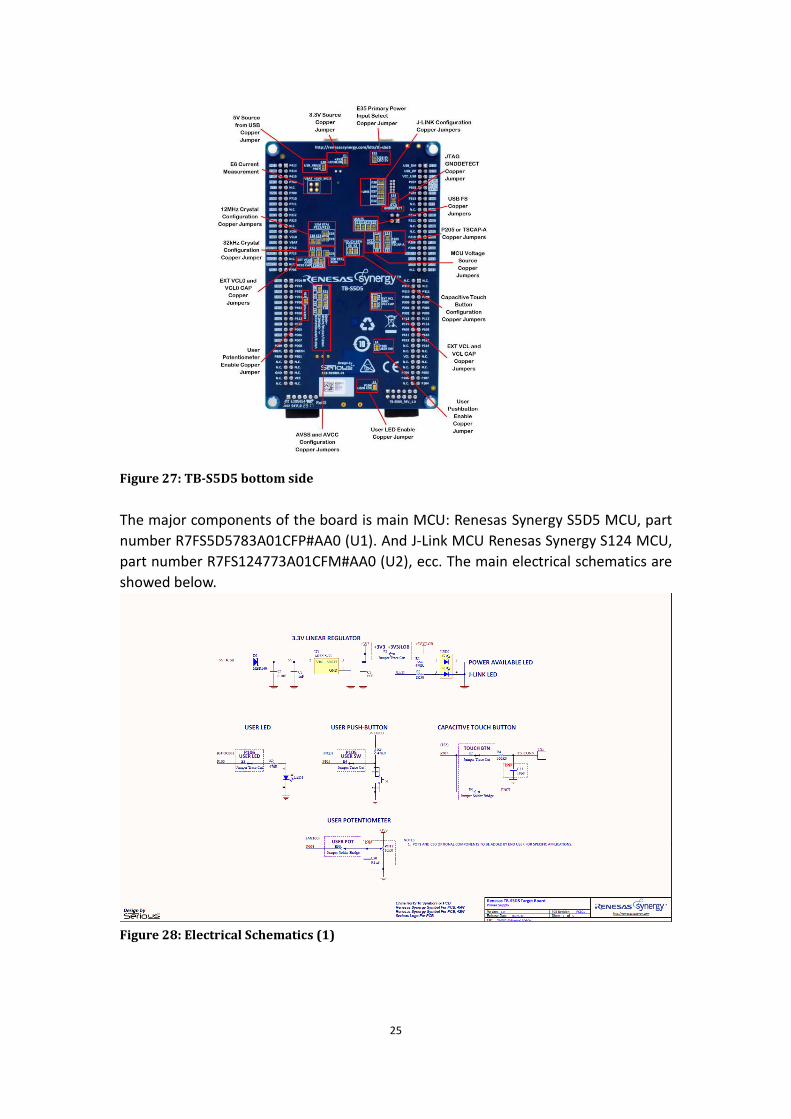
Figure 27: TB-S5D5 bottom side
The major components of the board is main MCU: Renesas Synergy S5D5 MCU, part
number R7FS5D5783A01CFP#AA0 (U1). And J-Link MCU Renesas Synergy S124 MCU,
part number R7FS124773A01CFM#AA0 (U2), ecc. The main electrical schematics are
showed below.
Figure 28: Electrical Schematics (1)
26
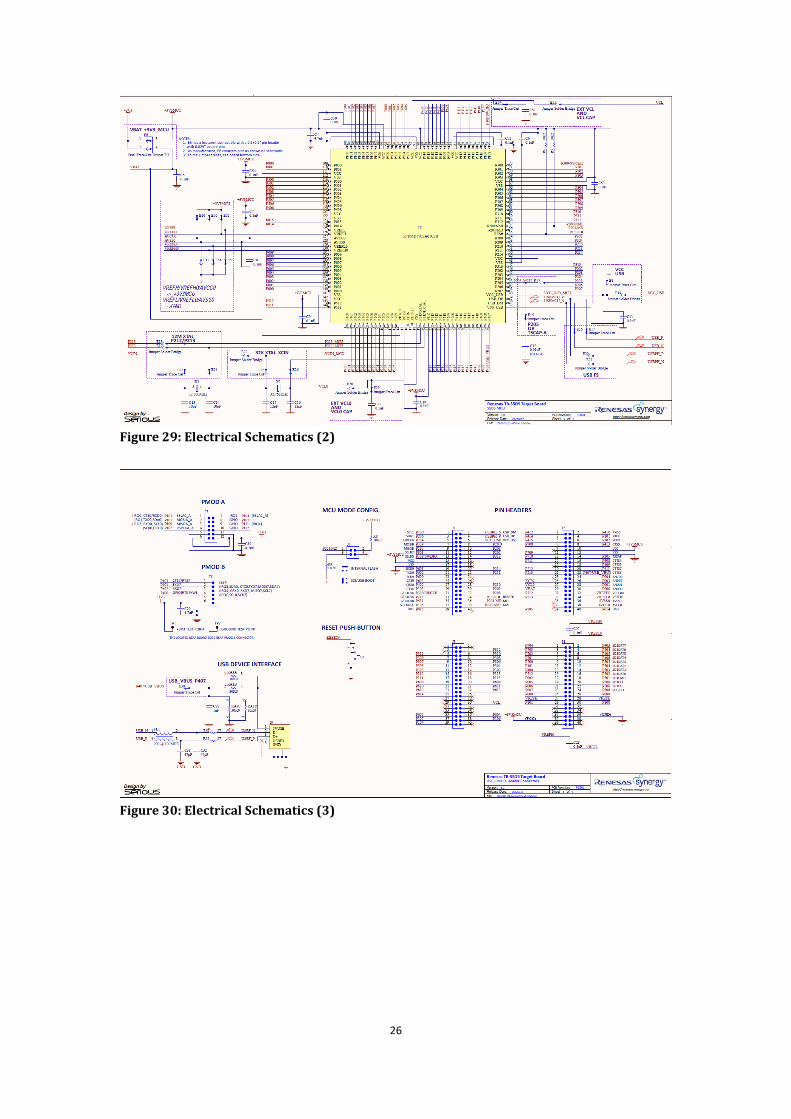
Figure 29: Electrical Schematics (2)
Figure 30: Electrical Schematics (3)
27
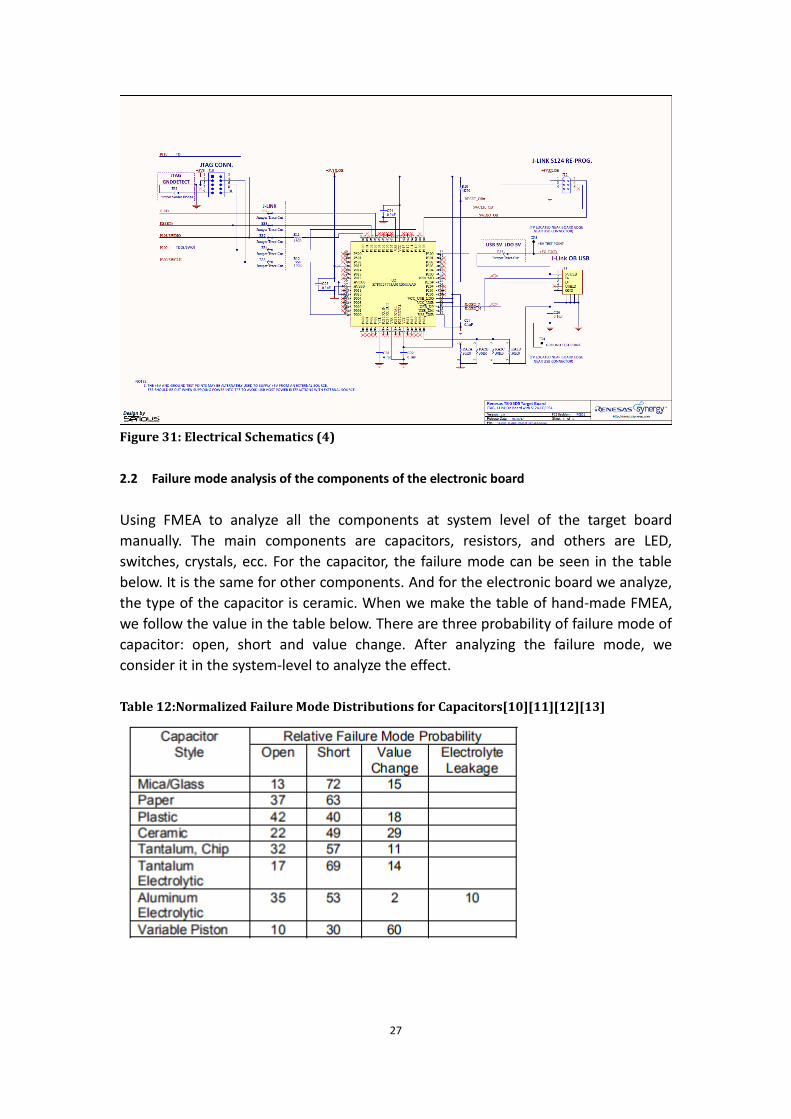
Figure 31: Electrical Schematics (4)
2.2 Failure mode analysis of the components of the electronic board
Using FMEA to analyze all the components at system level of the target board
manually. The main components are capacitors, resistors, and others are LED,
switches, crystals, ecc. For the capacitor, the failure mode can be seen in the table
below. It is the same for other components. And for the electronic board we analyze,
the type of the capacitor is ceramic. When we make the table of hand-made FMEA,
we follow the value in the table below. There are three probability of failure mode of
capacitor: open, short and value change. After analyzing the failure mode, we
consider it in the system-level to analyze the effect.
Table 12:Normalized Failure Mode Distributions for Capacitors[10][11][12][13]

28
Table 13:Normalized Failure Mode Distributions for Resistors[10][11][12][13]
Table 14: Normalized Failure Mode Distributions for Switches[10][11][12][13]
For crystal, it is estimated that 90% of quartz crystal failures are open circuits. The
remaining 10% of failures occur when electrical contact remains but there is a lack of
oscillation due to the loss of the piezoelectric phenomena characteristic with the
crystal structure.
For S5D5 board, all the capacitors used on this board are the type ceramic. The
number of capacitors are approximately 36 in this electronic system. From table 2,
we can know the related percentage of different failure modes. For resistors used in
the system, the type is film. The number of resistors are approximately 13 in this
electronic system. The result of the first step is showed in the table below. Here I pick
one example to show from the experiment.
Table 15:Component Analysis of S5D5(1)

29
Table 16:Component Analysis of S5D5(2)
For the other capacitors and resistors inside the board, the functionality is similar on
the system level. Here take one example to analyze.
For microcontroller of the S5D5 board. We consider it in two ways: the short circuit
among two adjacent pins or the microcontroller is not able to run software. Here I
take voltage adjacent pins as an example showed below.
Table 17:Two adjacent pins of Microcontroller Analysis of S5D5
2.3 Automotive case study related to FMEA
For this section, the case study follows with the research of a doctoral degree
student. The vehicles used as a golf cart or for municipal waste collection, so it is not
intended to be driven on high-speed motorways: in these cases it can be assumed
that a zero engine speed is always a safe condition. We consider the electronic
control unit(ECU), to avoid the possibility of a sudden unintended acceleration due to
a failure.
Model-based software design is a popular method in automotive industry to analyze
the system. Model-based safety analysis method is a novel approach comparing to
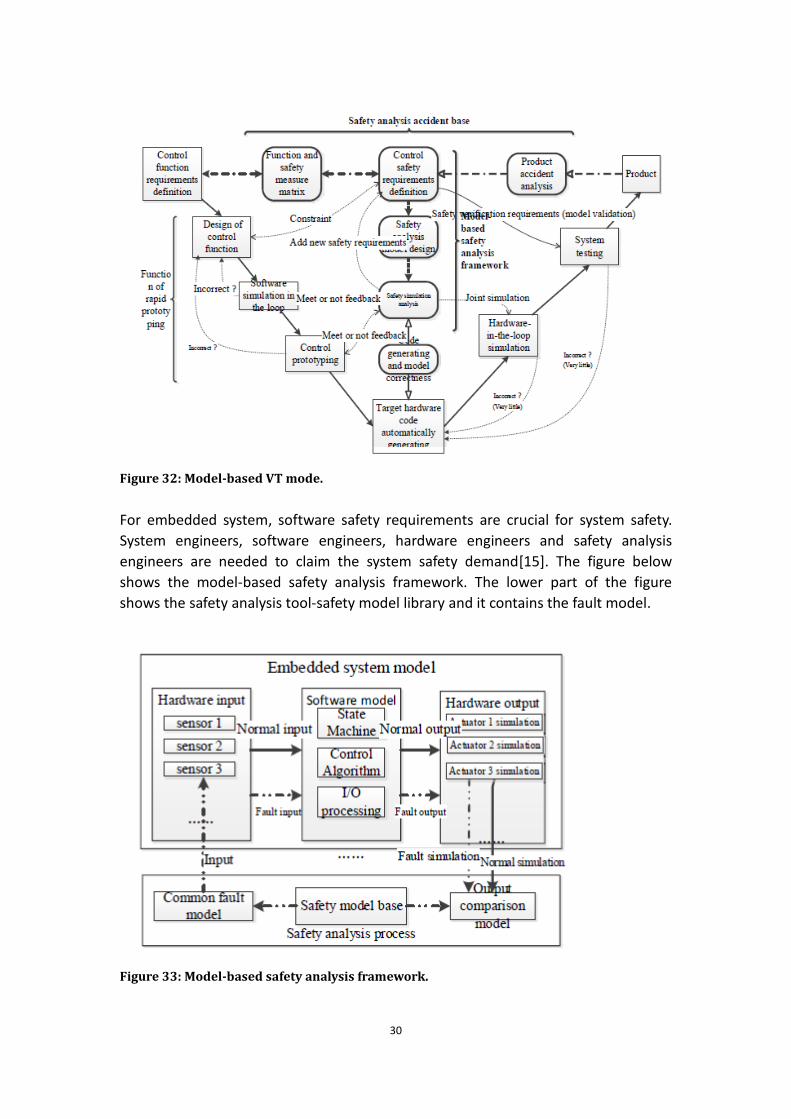
the traditional safety analysis method. The figure is shown below. The figure shows a
shape of VT model. The ‘V’ means the requirement analysis, design, product. The ‘T’
shape means the basis analysis of safety, improving the model from two main lines-
the horizontal safety analysis event database and vertical model-based safety
analysis framework[14].
30
Figure 32: Model-based VT mode.
For embedded system, software safety requirements are crucial for system safety.
System engineers, software engineers, hardware engineers and safety analysis
engineers are needed to claim the system safety demand[15]. The figure below
shows the model-based safety analysis framework. The lower part of the figure
shows the safety analysis tool-safety model library and it contains the fault model.
Figure 33: Model-based safety analysis framework.
31
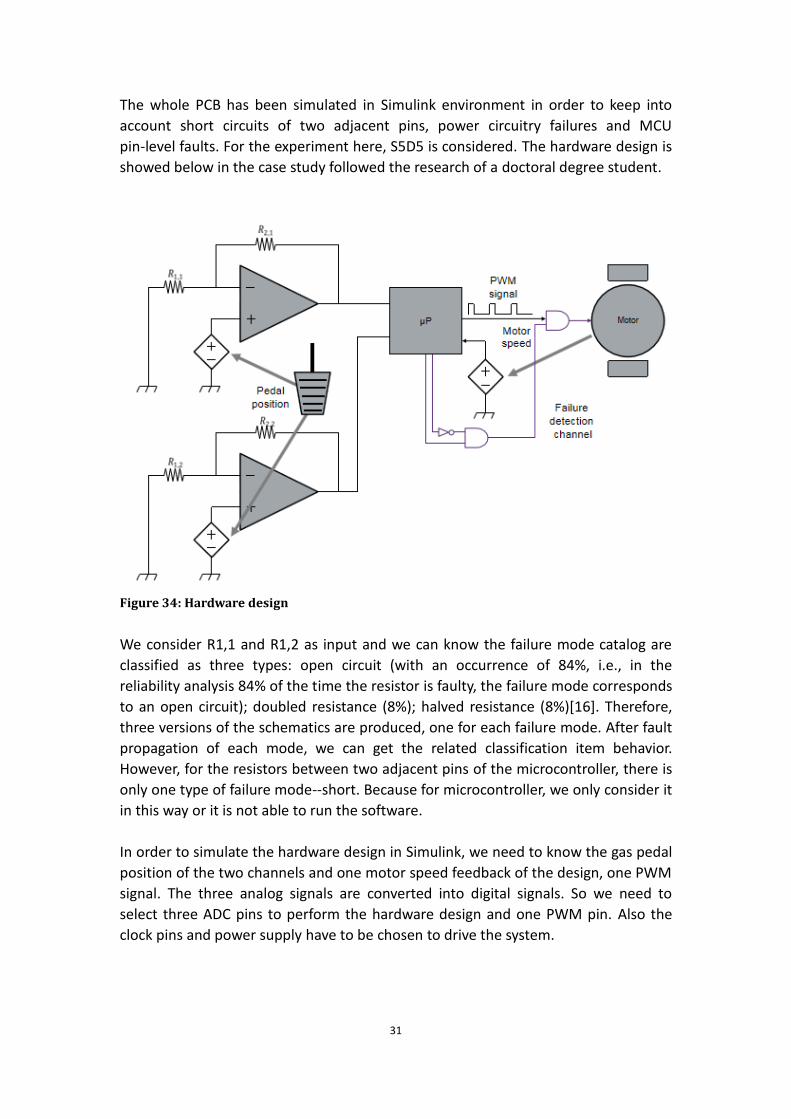
The whole PCB has been simulated in Simulink environment in order to keep into
account short circuits of two adjacent pins, power circuitry failures and MCU
pin-level faults. For the experiment here, S5D5 is considered. The hardware design is
showed below in the case study followed the research of a doctoral degree student.
Figure 34: Hardware design
We consider R1,1 and R1,2 as input and we can know the failure mode catalog are
classified as three types: open circuit (with an occurrence of 84%, i.e., in the
reliability analysis 84% of the time the resistor is faulty, the failure mode corresponds
to an open circuit); doubled resistance (8%); halved resistance (8%)[16]. Therefore,
three versions of the schematics are produced, one for each failure mode. After fault
propagation of each mode, we can get the related classification item behavior.
However, for the resistors between two adjacent pins of the microcontroller, there is
only one type of failure mode--short. Because for microcontroller, we only consider it
in this way or it is not able to run the software.
In order to simulate the hardware design in Simulink, we need to know the gas pedal
position of the two channels and one motor speed feedback of the design, one PWM
signal. The three analog signals are converted into digital signals. So we need to
select three ADC pins to perform the hardware design and one PWM pin. Also the
clock pins and power supply have to be chosen to drive the system.
32
2.4 Selecting the related pins
2.4.1 Clock pins
From the datasheet of S5D5, there are many kinds of clocks. It contains main clock
oscillator(MOSC), sub-clock oscillator(SOSC), high-speed on-chip oscillator (HOCO),
middle-speed on-chip oscillator (MOCO),low-speed on-chip oscillator (LOCO) and so
on. For the experiment here, the system clock(chip level) is no need to consider. We
only consider the external pins, because the external clock pins drive the
microcontroller to work, if it fails and then the system fails. And we analyze the
microcontroller failure mode as two adjacent pins shorted. It means that when two
adjacent pins are shorted, it is considered as open circuit, there is no current flow in
the circuit ,so there is no effect on the board. Consider in this way, the selecting
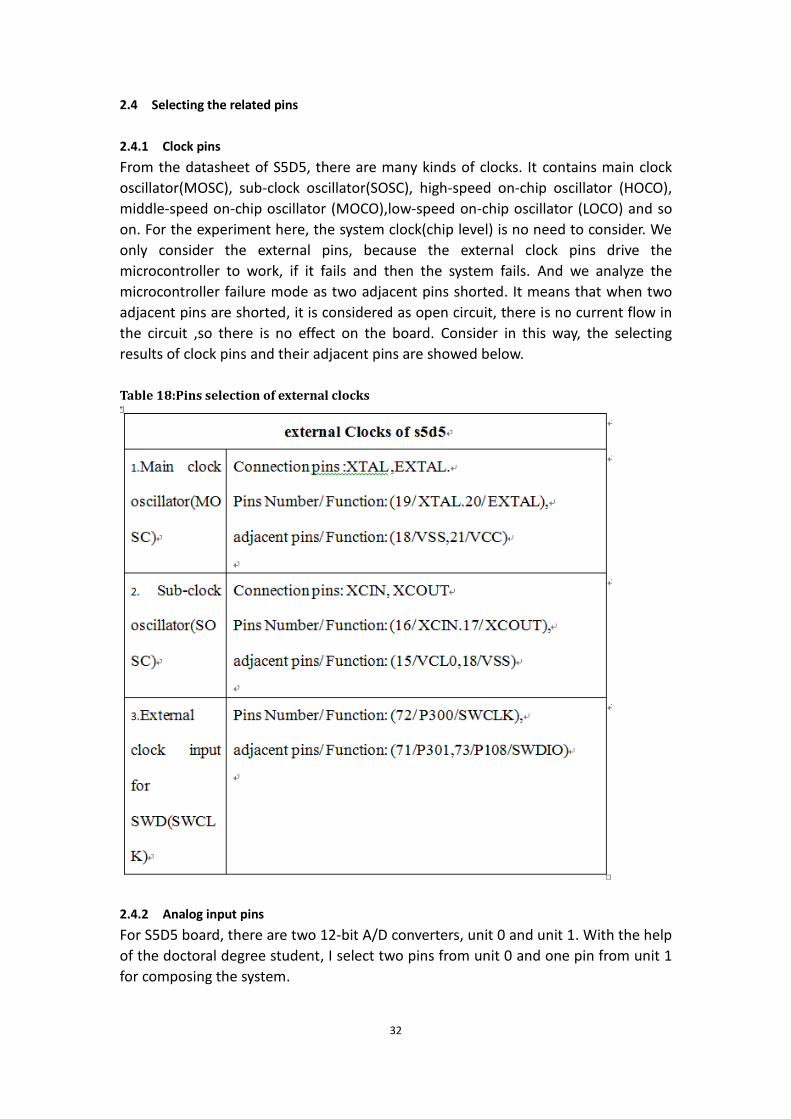
results of clock pins and their adjacent pins are showed below. Table 18:Pins selection of external clocks
2.4.2 Analog input pins
For S5D5 board, there are two 12-bit A/D converters, unit 0 and unit 1. With the help
of the doctoral degree student, I select two pins from unit 0 and one pin from unit 1
for composing the system.

33
Table 19:Pins selection of analog signal
2.4.3 PWM digital output pin
Comparing to other pins, the PWM digital output pin is relatively easy to choose, the
result is showed below.
Table 20:Pins selection of PWM digital signal
2.4.4 power supply pin
The power supply pins are obvious on the board, VCC and VSS.

34
Table 21:Pins selection of power supply signal
As a conclusion of the selection of the pins, it follows the hardware structure model.
For bidirection pins, we can fix it used as in/output using a buffer. For the power
supply pin, we only consider VCC and VSS, because the backup and stabilized voltage
are considered work properly.
2.5 How to draw the schematics of the board on Simulink.
On the basis of FMEA calculator application of the doctoral degree student. I need to
apply S5D5 board on the calculation structure. As discussed before, here 3 ADC pins
are needed, external clocks, 1PWM signal and power supply. Also the resistor
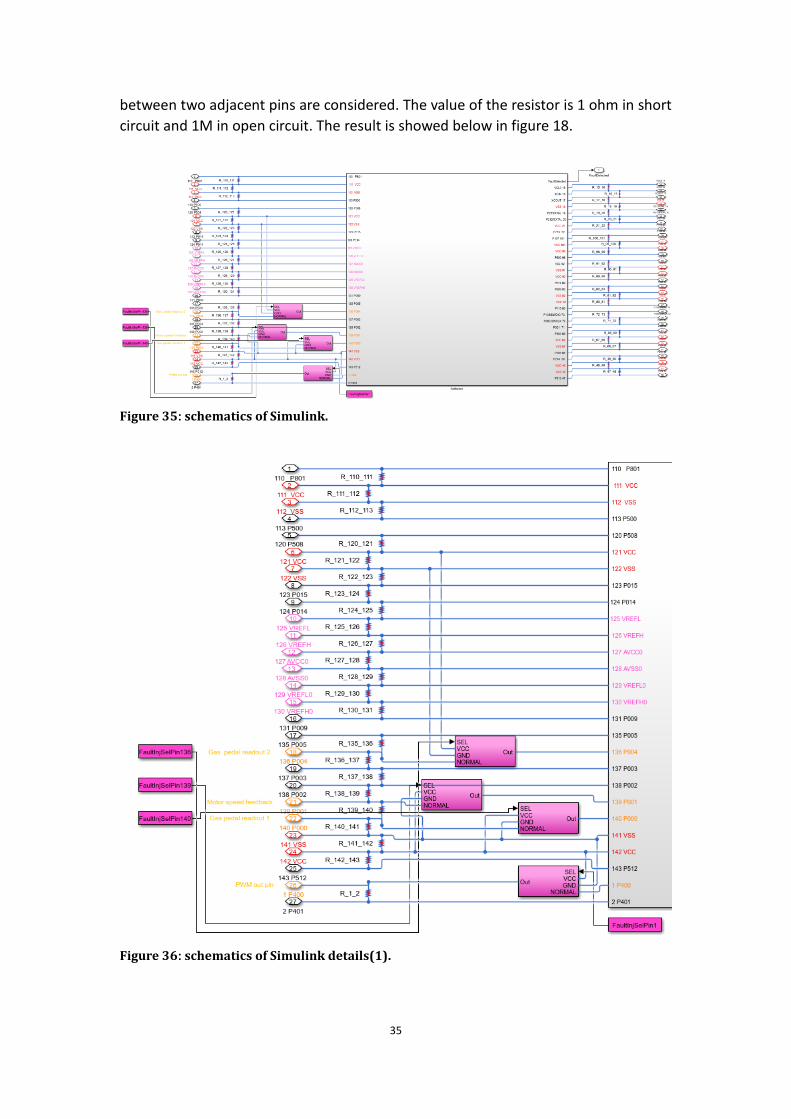
35
between two adjacent pins are considered. The value of the resistor is 1 ohm in short
circuit and 1M in open circuit. The result is showed below in figure 18.
Figure 35: schematics of Simulink.
Figure 36: schematics of Simulink details(1).
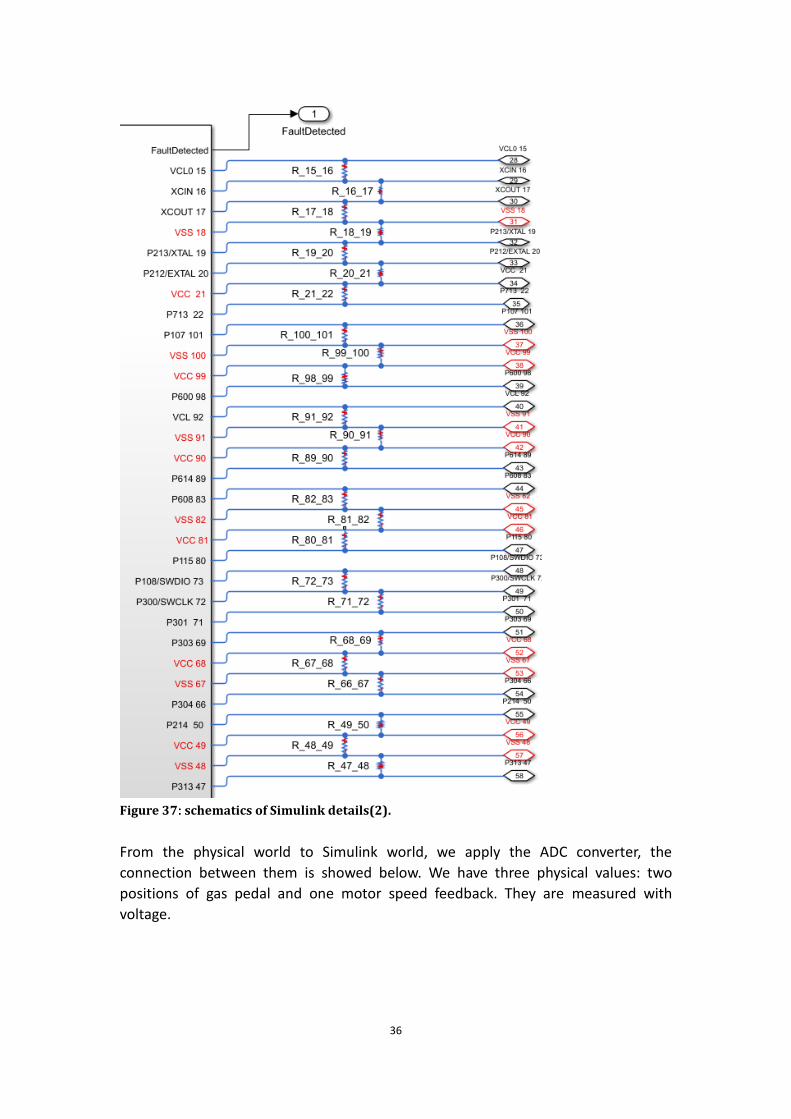
36
Figure 37: schematics of Simulink details(2).
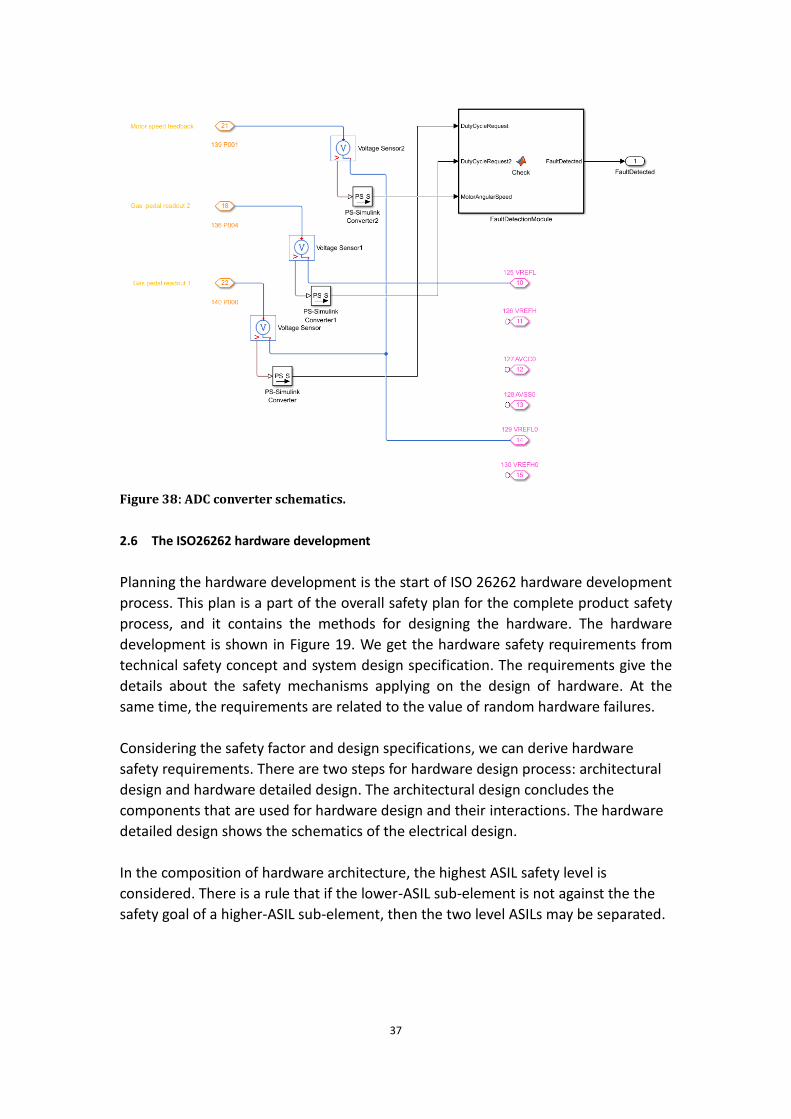
From the physical world to Simulink world, we apply the ADC converter, the
connection between them is showed below. We have three physical values: two
positions of gas pedal and one motor speed feedback. They are measured with
voltage.
37
Figure 38: ADC converter schematics.
2.6 The ISO26262 hardware development
Planning the hardware development is the start of ISO 26262 hardware development
process. This plan is a part of the overall safety plan for the complete product safety
process, and it contains the methods for designing the hardware. The hardware
development is shown in Figure 19. We get the hardware safety requirements from
technical safety concept and system design specification. The requirements give the
details about the safety mechanisms applying on the design of hardware. At the
same time, the requirements are related to the value of random hardware failures.
Considering the safety factor and design specifications, we can derive hardware
safety requirements. There are two steps for hardware design process: architectural
design and hardware detailed design. The architectural design concludes the
components that are used for hardware design and their interactions. The hardware
detailed design shows the schematics of the electrical design.
In the composition of hardware architecture, the highest ASIL safety level is
considered. There is a rule that if the lower-ASIL sub-element is not against the the
safety goal of a higher-ASIL sub-element, then the two level ASILs may be separated.

38
Figure 39: The ISO 26262 hardware development process[17].
2.6.1 Hardware evaluation
The hardware design is done on the basis of the verification of ASIL safety level after
defining the detailed hardware design. For this part, initially, the manual analysis of
hardware design is necessary in order to change the hardware design as an ideal one
including the modification of hardware architecture and components. In order to get
failure modes, failure rates and diagnostic coverage for the design, we can see the
figure below. Then these measures are applied to evaluate the hardware
architectural metrics on the basis of random hardware failures. Finally, the metrics
are compared to the target ones from the different ASILs.
There are many kinds of failure modes for the analysis of hardware design. They are
Safe fault ( 𝜆𝑆 ), Single-point fault( 𝜆𝑆𝑃𝐹 ), Residual fault( 𝜆𝑅𝐹 ), Multiple-point
fault(𝜆𝑀𝑃𝐹). The classification of failure modes is shown below.

39
Figure 40: The ISO 26262 hardware assessment process[18].
Figure 41: Scheme to classify failure modes. MPF stands for multiple-point fault[17].

40
2.6.2 Hardware architecture metrics
To understand this clearly, here more details are given. Among all the safety
techniques in automotive, ASIL C and D are strongly recommended. In order to
compare the results with ISO 26262 target values, a few values are needed to
computed: random hardware fault, single point fault, and the latent fault metrics.
Here we define the following terms for a given fault f:
Failure Rate, the Probability of Failure denoted as λ , The value of λ
corresponds to: λ= number of failures / period. The value ofλmay sometimes
be expressed using FIT (Failure in Time), 1 FIT = 1 failure every 109 hours.
Safe Detected (SD) rate, 𝜆𝑆𝐷𝑓: the rate of faults that are detected through the
functional safety mechanisms the item embeds;
Safe Undetected (SU) rate, 𝜆𝑆𝑈𝑓: the rate of faults that are not detected through
any of the functional safety mechanisms the item embeds;
Dangerous Detected (DD) rate, 𝜆𝐷𝐷𝑓
: the rate of faults that are detected through
the functional safety mechanisms the item embeds;
Dangerous Undetected (DU) rate, 𝜆𝐷𝑈𝑓
: the rate of faults that are not detected
through any of the functional safety mechanisms the item embeds;
The calculation procedure is applied on each component of the design, to compare
with ASIL level, the more further values are computed:
The item failure rate: λ=∑ 𝜆𝑓𝑓 ;
The single point fault rate: spf=∑ 𝜆𝐷𝑈𝑓
𝑓 ;
The residual fault rate: rf=∑ 𝜆𝐷𝐷𝑓
𝑓 ;
The latent fault rate: lf=∑ 𝜆𝑆𝑈𝑓
𝑓 ;
As we know the rates above, we can continue define the afterwards items:
The random hardware fault(rhf) metric is defined as: rhf=spf+rf;
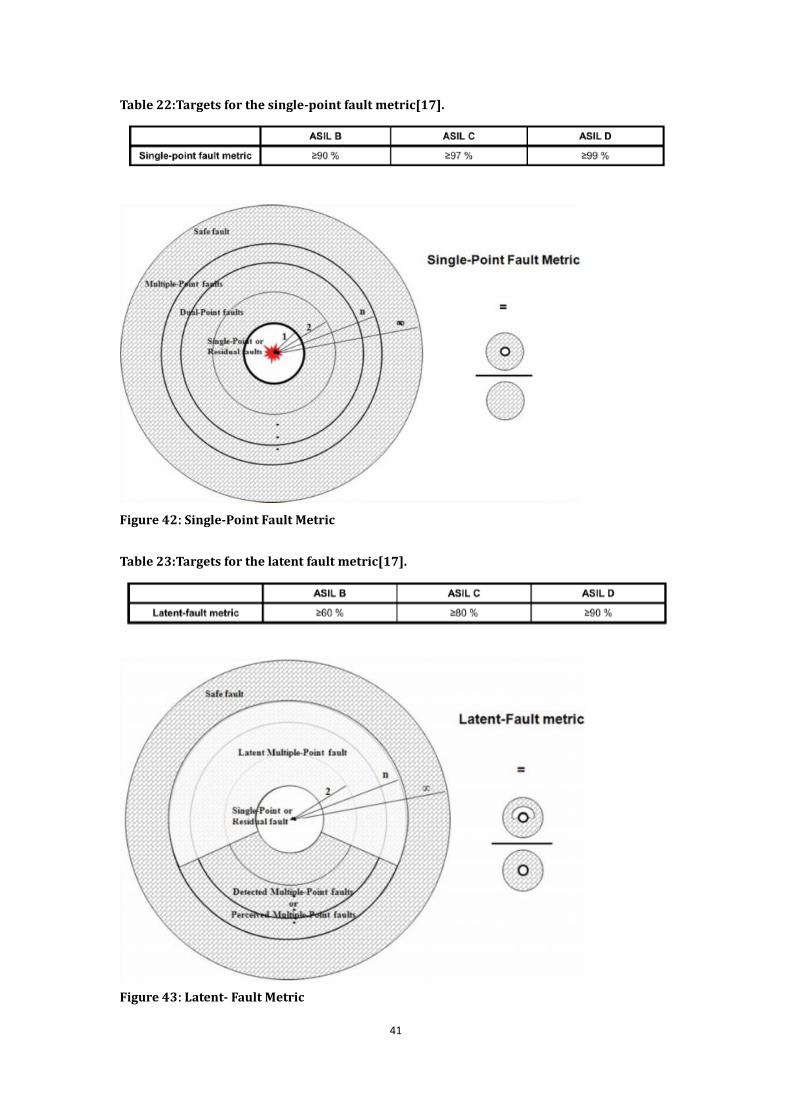
The single point fault metric(spfm) is defined as: spfm=1-spf/λ;
The latent fault metric(lfm) is defined as: lfm=1-lf/λ;
After computing the metrics above, we can compare the results to the ISO 26262
ASIL level to check whether the hardware design is finished or not. The targets HW
requirements are showed below:
41
Table 22:Targets for the single-point fault metric[17].
Figure 42: Single-Point Fault Metric
Table 23:Targets for the latent fault metric[17].
Figure 43: Latent- Fault Metric

42
Table 24:Targets for the random hardware fault metric[17].
The relevant failure rates for each safety goal of each component can be found using
failure modes effects analysis (FMEA) in the experiment.
Considering all the pins related components, mostly they are resistors, the failure
rate of each component can be evaluated with a failure rate method-FIDES. Failure
mode and failure mode rate of occurrence can be found in IEC 62380 and
MIL-HDBK-217 books, ecc. Then we can analyze the failure mode effect manually first,
and then use the automatic approach to check the FMEA result. Finally, after
knowing all the metrics, the ASIL mode can be analyzed easily according to the
targets for different metrics. The analysis is divided into a few steps.
Firstly, I analyzed the FMEA of the hardware components manually considering the
resistors between two adjacent pins. The result is showed below. Secondly, applying
the automatic way to check the FMEA result. Then there is a comparison between
the handmade and automatic result. Considering the fault injection, we modify the
failure rate and then get the item failure rateλ. Applying the metrics of hardware
design, the classification of ASIL can be gotten easily. The result is showed below.

43
Table 25:FMEA analysis manually(1)
Table 26:FMEA analysis manually(2)

44
Table 27:FMEA table(1)
Table 28:FMEA table(2)
2.6.3 fault injection
The proposed approach from the doctoral student is simply explained here.

45
Figure 44:Item architecture
There are three stages of the system: input conditioning, processing, output
conditioning. Input conditioning is the analog circuit suited to the requirements.
Processing is microcontroller to run the software. Output conditioning is an analog
circuit. The whole stage example is showed below.
Figure 45:Item architecture example
The proposed method is to analyze the fault propagation inside the stages from the
input to the output. So we need to consider the accuracy and efficiency. The faults
resort to SPICE-level fault injections, while Simulink fault injections are used to
analyze the software contribution to fault propagation.
A SPICE-level network is produced for the input and output stages. For every
component and the failure mode of the component, a mutated schematic is
produced which contains the faulty circuit according to the considered failure mode.
There is more than one failure mode of one component. Each time the item system
inoculate one failure mode and propagate it to the output. Fault propagation is done
using a mixed-level simulation environment. From the input to the processing and
from the processing to the output stage, failure modes affecting discrete
components are analyzed by using SPICE-level simulation. The propagation of fault
effects base on Simulink environment fault injection.
It is popular to apply a model-based software environment in automotive industry.
The functionalities are developed in the software model and then the production
code is generated automatically from the model. After setting of this, we can do the
hardware verification and it is easy to modify the parameters of the software design
to improve the performance of the hardware design in MATLB environment.
The items are simulated in the MATLAB environment. The figure is showed below.

46
Figure 46:Item architecture in MATLAB
It is convenient to simulate the item in the MATLAB environment. And we assume
that the processing stage is provided with adequate self-testing capabilities. Any
failure mode affecting the processing stage is classified as dangerous detected. The
overall simulator architecture is showed below.
Figure 47:Overall simulator architecture
Considering each component’s situation, including BOM and failure mode catalog
combined, we can get a fault list. Applying the fault list in the software system
environment. At the same time, workloads are applied to the simulator. The next
step is fault injection. Then we can get a hardware design classification through
classifier finally. The fault injection simulation is showed below.
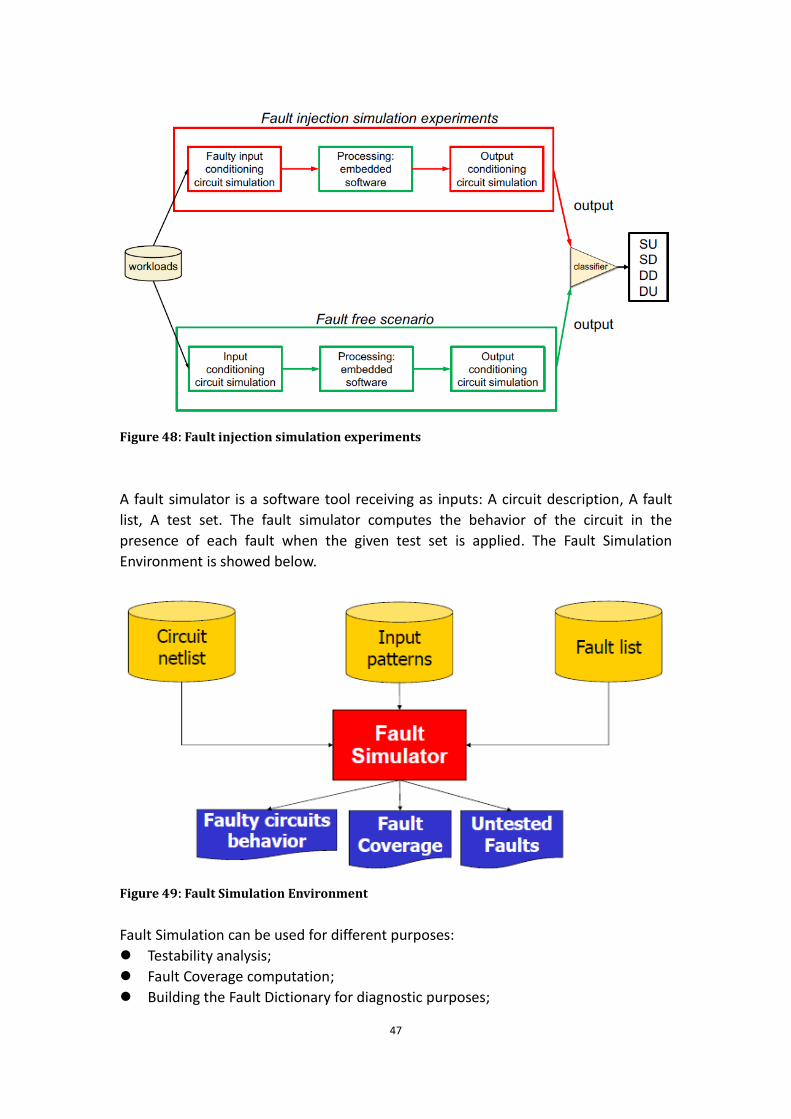
47
Figure 48: Fault injection simulation experiments
A fault simulator is a software tool receiving as inputs: A circuit description, A fault
list, A test set. The fault simulator computes the behavior of the circuit in the
presence of each fault when the given test set is applied. The Fault Simulation
Environment is showed below.
Figure 49: Fault Simulation Environment
Fault Simulation can be used for different purposes:
Testability analysis;
Fault Coverage computation;
Building the Fault Dictionary for diagnostic purposes;

48
Analysis of faulty circuit behavior;
The validation of test sets may be performed via physical fault insertion (when the
circuit is available, and only for those faults that can be physically inserted without
irreversibly damaging the circuit) in hardware. And in software, it may be performed
via fault simulation. Fault simulation algorithms are basically derived from those for
the simulation of the fault-free circuits.
There are a few fault simulation techniques:
Serial Fault Simulation- Fault Parallel Fault Simulation;
Deductive and Concurrent Fault Simulation;
Approximate methods- Fault sampling;
Hardware accelerators;
The most easy way to inject the faults is to change the nominal value of a component
of the model. In some special cases, it is not enough to change the value, so we need
to add some components to the design. These additional components represent the
behavior of the failure. In my case study, I consider the two adjacent pins shorted
when I analyze the failure modes of the components of the microcontroller. Short
circuits between these pins can be simulated by adding in the design resistor
between the pins. In fault-free conditions, these added resistors have a resistance
value of about 108 Ω, while to simulate a short this value is lowered to about 1 Ω.
There is a classifier considering the classification rules to get the result of the
hardware design level. The simulation results with the golden ones and assign to
each failure the relative effect as safe detected(SD), safe undetected (SU), dangerous
detected (DD), and dangerous undetected (DU).
3 Result
Following with the calculation procedure of each component of the design, the ASIL
level of the system result is showed below.
We can know failure rate from the IEC 62380, and the failure mode rate of
occurrence from MIL-HDBK-217 books, ecc. After that, the number of failure rate
multiply the number of failure mode rate of occurrence, we get item failure rate
λ.For each component, we already know the classification of the hardware design
level-SD,SU,DD,DU. So the other metrics, like single point fault rate(spf), residual fault
rate(rf), latent fault rate(lf), random hardware fault metric rhf, single point fault
metrics spfm, latent fault metric lfm, we can do the basic calculation. The last step is
to get the ASIL classification level. For our automotive case study, we consider the
ASIL level to ASIL C or D.
49
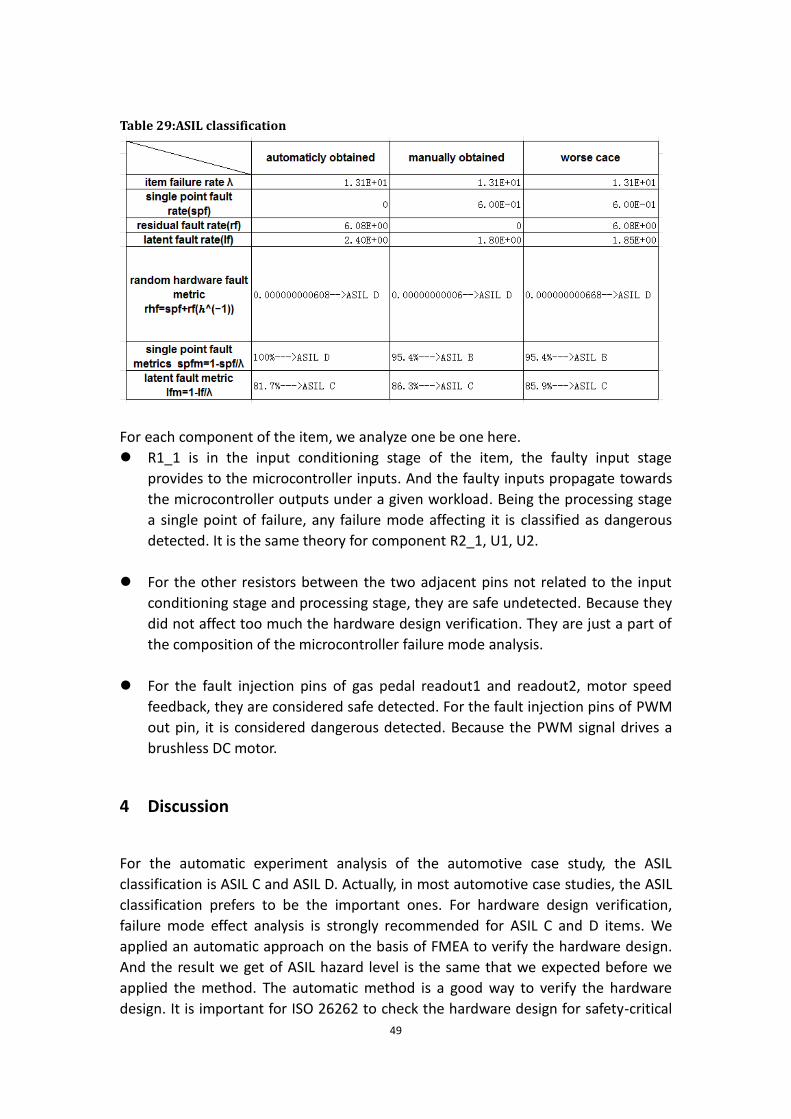
Table 29:ASIL classification
For each component of the item, we analyze one be one here.
R1_1 is in the input conditioning stage of the item, the faulty input stage
provides to the microcontroller inputs. And the faulty inputs propagate towards
the microcontroller outputs under a given workload. Being the processing stage
a single point of failure, any failure mode affecting it is classified as dangerous
detected. It is the same theory for component R2_1, U1, U2.
For the other resistors between the two adjacent pins not related to the input
conditioning stage and processing stage, they are safe undetected. Because they
did not affect too much the hardware design verification. They are just a part of
the composition of the microcontroller failure mode analysis.
For the fault injection pins of gas pedal readout1 and readout2, motor speed
feedback, they are considered safe detected. For the fault injection pins of PWM
out pin, it is considered dangerous detected. Because the PWM signal drives a
brushless DC motor.
4 Discussion
For the automatic experiment analysis of the automotive case study, the ASIL
classification is ASIL C and ASIL D. Actually, in most automotive case studies, the ASIL
classification prefers to be the important ones. For hardware design verification,
failure mode effect analysis is strongly recommended for ASIL C and D items. We
applied an automatic approach on the basis of FMEA to verify the hardware design.
And the result we get of ASIL hazard level is the same that we expected before we
applied the method. The automatic method is a good way to verify the hardware
design. It is important for ISO 26262 to check the hardware design for safety-critical

50
reliability automotive system. If there is a fault affecting the microcontroller. We
consider the fault as dangerous detected. The automatic approach improve the
quality of the hardware design. Comparing to the manual analysis of FMEA, the new
method saves a lot of time and it takes into consideration the real software.
5 Conclusion
The hardware design verification is important for ISO26262. With the complexity of
the embedded systems in automotive industry, the manual method becomes
ineffective. Also the manual method does not consider the contribution of the
embedded software. On the other hand, it requires a lot of man hours resulting in
long time-to-market.
At the same time, the new automatic method has a realized mixed-level simulation
structure. And the failure mode analysis is automatic instead of handmade. Each
time the simulation system simulates one failure mode of the component and
propagates it to the output at system level. Applying the software can prevent
overdesign. We are focused on the safety-critical embedded systems. And it is also
important for the cost and time to market for the productions. The automatic
method can satisfy the factors we consider.
51
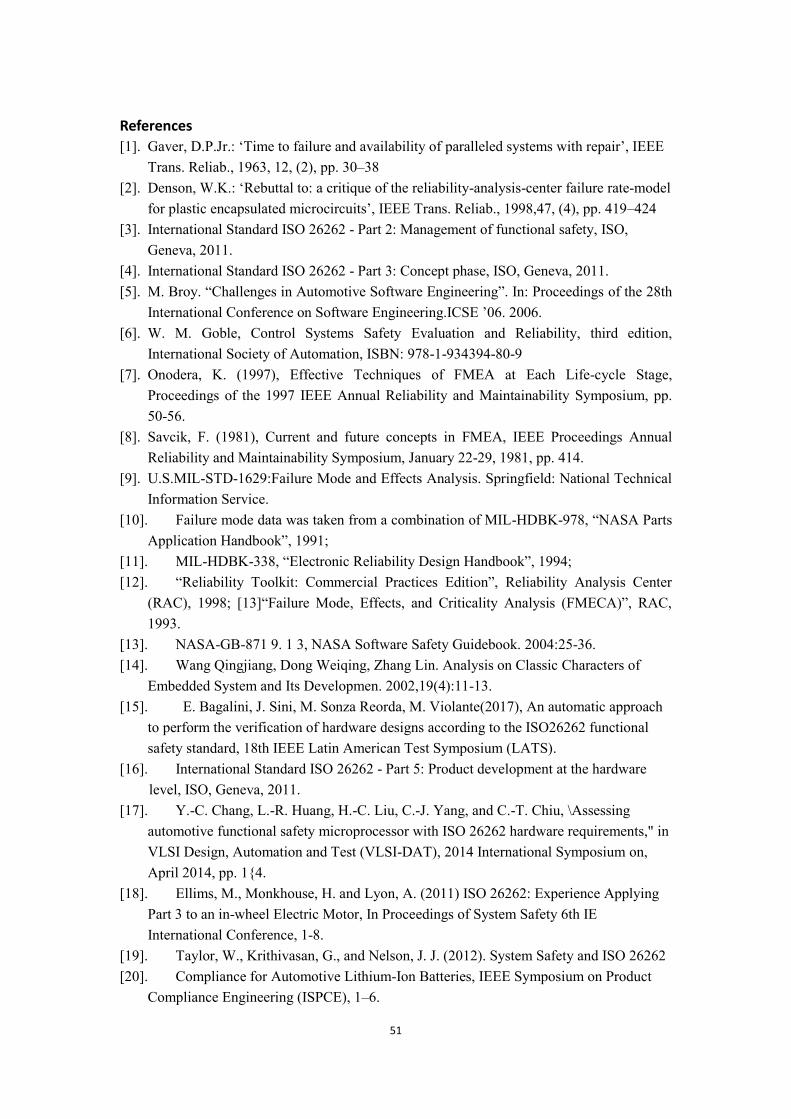
References
[1]. Gaver, D.P.Jr.: ‘Time to failure and availability of paralleled systems with repair’, IEEE
Trans. Reliab., 1963, 12, (2), pp. 30–38 [2]. Denson, W.K.: ‘Rebuttal to: a critique of the reliability-analysis-center failure rate-model
for plastic encapsulated microcircuits’, IEEE Trans. Reliab., 1998,47, (4), pp. 419–424 [3]. International Standard ISO 26262 - Part 2: Management of functional safety, ISO,
Geneva, 2011. [4]. International Standard ISO 26262 - Part 3: Concept phase, ISO, Geneva, 2011. [5]. M. Broy. “Challenges in Automotive Software Engineering”. In: Proceedings of the 28th
International Conference on Software Engineering.ICSE ’06. 2006. [6]. W. M. Goble, Control Systems Safety Evaluation and Reliability, third edition,
International Society of Automation, ISBN: 978-1-934394-80-9 [7]. Onodera, K. (1997), Effective Techniques of FMEA at Each Life-cycle Stage,
Proceedings of the 1997 IEEE Annual Reliability and Maintainability Symposium, pp. 50-56.
[8]. Savcik, F. (1981), Current and future concepts in FMEA, IEEE Proceedings Annual Reliability and Maintainability Symposium, January 22-29, 1981, pp. 414.
[9]. U.S.MIL-STD-1629:Failure Mode and Effects Analysis. Springfield: National Technical Information Service.
[10]. Failure mode data was taken from a combination of MIL-HDBK-978, “NASA Parts
Application Handbook”, 1991; [11]. MIL-HDBK-338, “Electronic Reliability Design Handbook”, 1994; [12]. “Reliability Toolkit: Commercial Practices Edition”, Reliability Analysis Center
(RAC), 1998; [13]“Failure Mode, Effects, and Criticality Analysis (FMECA)”, RAC,
1993. [13]. NASA-GB-871 9. 1 3, NASA Software Safety Guidebook. 2004:25-36. [14]. Wang Qingjiang, Dong Weiqing, Zhang Lin. Analysis on Classic Characters of
Embedded System and Its Developmen. 2002,19(4):11-13. [15]. E. Bagalini, J. Sini, M. Sonza Reorda, M. Violante(2017), An automatic approach
to perform the verification of hardware designs according to the ISO26262 functional safety standard, 18th IEEE Latin American Test Symposium (LATS).
[16]. International Standard ISO 26262 - Part 5: Product development at the hardware level, ISO, Geneva, 2011.
[17]. Y.-C. Chang, L.-R. Huang, H.-C. Liu, C.-J. Yang, and C.-T. Chiu, \Assessing automotive functional safety microprocessor with ISO 26262 hardware requirements," in VLSI Design, Automation and Test (VLSI-DAT), 2014 International Symposium on, April 2014, pp. 1{4.
[18]. Ellims, M., Monkhouse, H. and Lyon, A. (2011) ISO 26262: Experience Applying Part 3 to an in-wheel Electric Motor, In Proceedings of System Safety 6th IE International Conference, 1-8.
[19]. Taylor, W., Krithivasan, G., and Nelson, J. J. (2012). System Safety and ISO 26262 [20]. Compliance for Automotive Lithium-Ion Batteries, IEEE Symposium on Product
Compliance Engineering (ISPCE), 1–6.
52
[21]. Hillenbrand, M., Heinz, M., Adler, N., Matheis, J., and Muller-Glaser, K. D. (2010). Failure Mode and Effect Analysis based on Electric and Electronic Architectures of Vehicles to Support the Safety Lifecycle ISO/DIS 26262, In IEEE International Symposium on Rapid System Prototyping (RSP), 1–7.
[22]. Takeichi, M., Sato, Y., Suyama, K., and Kawahara, T. (2011) Failure Rate Calculation with Priority FTA Method for Functional Safety of Complex Automotive Subsystems, In Proceedings of Quality, Reliability, Risk, Maintenance, and Safety Engineering (ICQR2MSE), 55-58.
[23]. Sinha, P. (2011). Architectural Design and Reliability Analysis of a Fail-operational Brake-by-wire System from ISO 26262 Perspectives, Reliability Engineering &System Safety, 96, 1349–1359.
[24]. Siegl, S., Hielscher, K., German, R., and Berger, C. (2011). Formal Specification and Systematic Model-Driven Testing of Embedded Automotive Systems, Test, 1–6.
[25]. Braun, J., Miedl, C., Geyer, D., Mottok, J. and Minas, M. CCapability of Single Hardware Channel for Automotive Safety Applications according to ISO 26262, In Proceedings of Applied Electronics (AE), International Conference, 41-46.
[26]. Jeon, SH., Cho, J.-H., Jung, Y., Park, S., & Han, T.M. (2011). Automotive Hardware Development according to ISO 26262, In 13th International Conference on Advanced Communication Technology, 588–592.
[27]. Jost, H., Kohler, S. and Koster, F. Towards a Safer Development of Driver Assistance Systems by Applying Requirements-based methods, In Proceedings of Intelligent Transportation Systems (ITSC), 1144-1149.
[28]. Ward, D., and Crozier, S. (2012). The Uses and Abuses of ASIL Decomposition in ISO 26262, In System Safety, incorporating the Cyber Security Conference, 1–6.