Embed Size (px)
Citation preview

_____________________________________________________________________________________________________ *Corresponding author: E-mail: [email protected];
Journal of Engineering Research and Reports
2(4): 1-15, 2018; Article no.JERR.44330
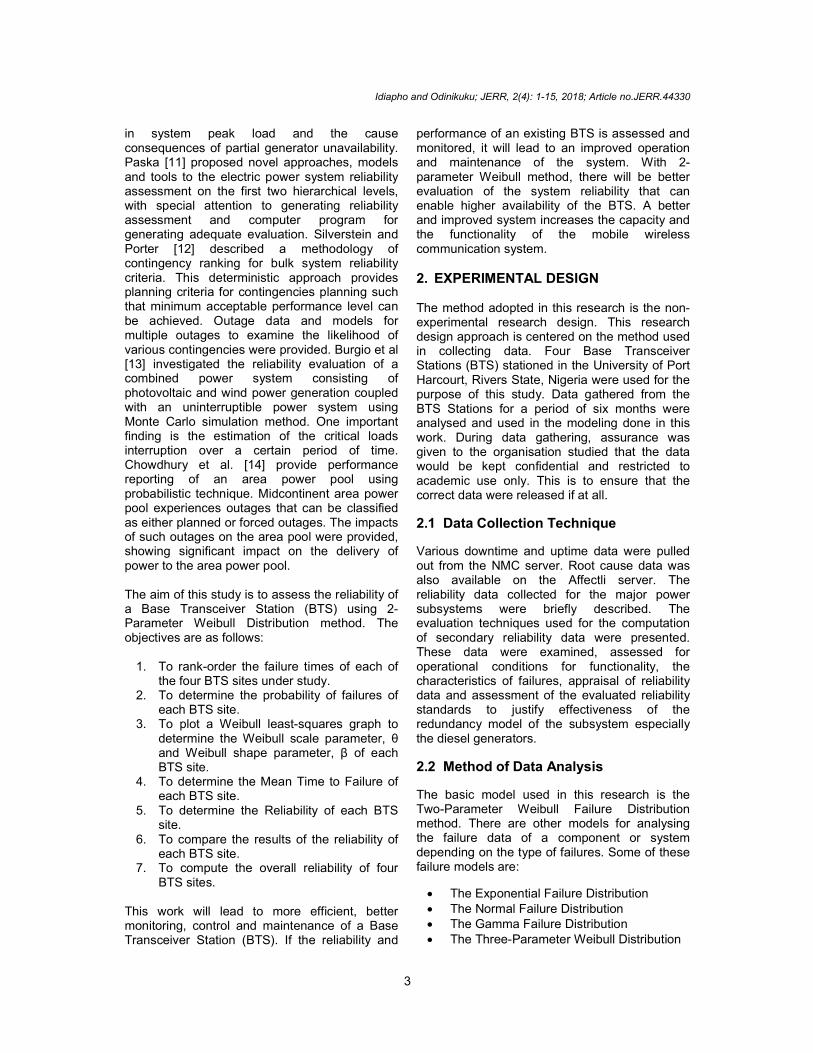
Reliability Assessment of a Base Transceiver Station Using 2-Parameter Weibull Distribution
Method
Onoriode K. Idiapho1* and William E. Odinikuku2
1Department of Production Engineering, University of Benin, Nigeria.
2Deparment of Mechanical Engineering, Petroleum Training Institute, Warri, Nigeria.
Authors’ contributions
This work was carried out in collaboration between both authors. Author OKI designed the study,
performed the statistical analysis, wrote the protocol, and wrote the first draft of the manuscript. Author WEO managed the analyses of the study and also the literature searches. Both authors read
and approved the final manuscript.
Article Information
DOI: 10.9734/JERR/2018/v2i416705 Editor(s):
(1) Dr. Djordje Cica, Associate Professor, Faculty of Mechanical Engineering, University of Banja Luka, Bosnia and Herzegovina.
Reviewers: (1) Kingsley Eghonghon Ukhurebor, Edo University Iyamho, Nigeria.
(2) K. Jayakumar, School of Computer Science, Vellore Institute of Technology, India. (3) Sasikumar Gurumoorthy, Sree Vidyanikethan Engineering College, India.
Complete Peer review History: http://www.sciencedomain.org/review-history/26807
Received 04 September 2018 Accepted 16 October 2018
Published 24 October 2018
ABSTRACT About 80% interruptions of cellular network availability occur due to power outage on BTS stations and reliability analysis of these systems is yet to receive exhaustive studies. Most network providers solely depend on generating power on their BTS sites using diesel generators since the grid power is least reliable, but the frequency of power outages from the diesel generators is alarming, hence, the need to analyse the reliability of these generators and their maintenance routine in relation to the site availability. In this study, the reliability of a Base Transceiver Station (BTS) is assessed by analysis of data obtained within a period of six months from four BTS sites used as case study using 2-parameter Weibull failure distribution method. The failure times of each BTS site were rank-ordered and the estimates of Weibull parameters θ and β were obtained from Weibull least-squares plots. The Weibull plots for the four BTS sites had a good index of fit which shows that a strong linear relationship exists. The value of the shape parameter (β) was found to be between the range of 1< β
Original Research Article

Idiapho and Odinikuku; JERR, 2(4): 1-15, 2018; Article no.JERR.44330
2
< 3 for all the BTS sites studied. This means that the probability density function is skewed and the failure rate of the BTS sites is increasing. The reliability of each BTS site was successfully computed. The reliability of the four BTS sites was found to be increasing as their values of scale parameter, θ increases. From the results obtained, BTS site RV0144 had the highest reliability while BTS site RV0248 had the lowest reliability.
Keywords: Base transceiver station; reliability; 2-parameter weibull distribution method; weibull plots.
1. INTRODUCTION
The telecommunication industry has been experiencing unprecedented expansion in the number of subscribers since the inception of Global System for Mobile communication (GSM) in Nigeria in 2001 Ukhurebor et al. [1]; Lawal et al. [2]; Ukhurebor et al. [3]; Ukhurebor et al. [4]. This increase in demand for the use of GSM network, however, have put enormous pressure on the network providers to ensure reliability and quality of service desired by the customers, but the situation on the ground is that many of the network providers have not achieved the desired results. Base Transceiver Stations are designed basically for reliable and uninterrupted communication which is very essential for the growth and development of any nation as well as improvement of lives through industrialisation. The poor availability and dependability of public power amidst mobile network expansion compelled the exigency for a supplementary power infrastructure at GSM sites to support the operation of network transmission and base station equipment so as to guarantee network reliability and minimise the impact of network failures due to power outages on customers. The supplementary power infrastructure is an integrated system with a collection of different power subsystems, which include a transformer, an automatic voltage regulator, two identical generators, a rectifier system, a battery bank, an automatic transfer switch, and automatic main failure, all interfaced in a definite topological structure, with redundancy scale that tolerates faults, allows for operation handover, and permits some degree of equipment downtime before restoration to optimal efficiency. Not only is the assessment of the rated capacity and the reliability standard of the major subsystems important to ascertain their effectiveness, sufficiency or superfluity in the face of maintenance resource scarcity and allocation challenges, but also the examination of the efficiency of the entire power system model is imperative to minimise network vulnerability due to fault occurrence and power outage on operating subsystems on the model.
Mas’ud [5] investigated fault management in intercellular network. This study showed that fault exists in the network due to radio frequency loss, down links and trunk outages. Intelligent agent technology was proffered as a solution to these problems coupled with preventive maintenance schedules. Chen [6], proposed empirical equations to the study of network reliability, availability, maintainability and survivability based on impacted incidents such as mean time to incident, mean time to restore network, quiescent availability, peak customer impacted and wireless prime lost line hours. These parameters provide an understanding of network characteristics concurrent outages and offer network operators valuable insights about predicting the frequency with which network incidents exceed severity thresholds. Snow et al. [7] proposed wireless network infrastructure element. This includes base station, mobile switching centers, home location registers and visitor location register database. The effect of mean time to failure and mean time to repair on the proposed network infrastructure was determined. These effects on network dependability were found to be significant impact. Albaghdadi and Razvi [8] studied 1320 cell GSM network. Their aim was to find an effective method for periodic transmission of network management information. The actual traffic loads were collected for 24 hours and analysed to determine their impact on the customer. Fawaz et al. [9] investigated fiber optic cable system reliability. It was concluded that the frequency of failure of optical network is not negligible and that cable cuts are the dominant failure scenario for long optical fiber networks. In analysis of network reliability based on power outages, Goel and Gupta [10] proposed a window based simulation tool for reliability evaluation of electricity generating capacity using the Monte Carlo simulation. This simulation technique compared favorably with the analytic solution obtained from Markov analysis in the prediction of the loss of load expectation and the loss of energy expectation. Also, the developed Monte Carlo simulation can provide information regarding the unit forced outage rates, variations
Idiapho and Odinikuku; JERR, 2(4): 1-15, 2018; Article no.JERR.44330
3
in system peak load and the cause consequences of partial generator unavailability. Paska [11] proposed novel approaches, models and tools to the electric power system reliability assessment on the first two hierarchical levels, with special attention to generating reliability assessment and computer program for generating adequate evaluation. Silverstein and Porter [12] described a methodology of contingency ranking for bulk system reliability criteria. This deterministic approach provides planning criteria for contingencies planning such that minimum acceptable performance level can be achieved. Outage data and models for multiple outages to examine the likelihood of various contingencies were provided. Burgio et al [13] investigated the reliability evaluation of a combined power system consisting of photovoltaic and wind power generation coupled with an uninterruptible power system using Monte Carlo simulation method. One important finding is the estimation of the critical loads interruption over a certain period of time. Chowdhury et al. [14] provide performance reporting of an area power pool using probabilistic technique. Midcontinent area power pool experiences outages that can be classified as either planned or forced outages. The impacts of such outages on the area pool were provided, showing significant impact on the delivery of power to the area power pool. The aim of this study is to assess the reliability of a Base Transceiver Station (BTS) using 2-Parameter Weibull Distribution method. The objectives are as follows:
1. To rank-order the failure times of each of the four BTS sites under study.
2. To determine the probability of failures of each BTS site.
3. To plot a Weibull least-squares graph to determine the Weibull scale parameter, θ and Weibull shape parameter, β of each BTS site.
4. To determine the Mean Time to Failure of each BTS site.
5. To determine the Reliability of each BTS site.
6. To compare the results of the reliability of each BTS site.
7. To compute the overall reliability of four BTS sites.
This work will lead to more efficient, better monitoring, control and maintenance of a Base Transceiver Station (BTS). If the reliability and
performance of an existing BTS is assessed and monitored, it will lead to an improved operation and maintenance of the system. With 2-parameter Weibull method, there will be better evaluation of the system reliability that can enable higher availability of the BTS. A better and improved system increases the capacity and the functionality of the mobile wireless communication system.
2. EXPERIMENTAL DESIGN The method adopted in this research is the non-experimental research design. This research design approach is centered on the method used in collecting data. Four Base Transceiver Stations (BTS) stationed in the University of Port Harcourt, Rivers State, Nigeria were used for the purpose of this study. Data gathered from the BTS Stations for a period of six months were analysed and used in the modeling done in this work. During data gathering, assurance was given to the organisation studied that the data would be kept confidential and restricted to academic use only. This is to ensure that the correct data were released if at all.
2.1 Data Collection Technique Various downtime and uptime data were pulled out from the NMC server. Root cause data was also available on the Affectli server. The reliability data collected for the major power subsystems were briefly described. The evaluation techniques used for the computation of secondary reliability data were presented. These data were examined, assessed for operational conditions for functionality, the characteristics of failures, appraisal of reliability data and assessment of the evaluated reliability standards to justify effectiveness of the redundancy model of the subsystem especially the diesel generators.
2.2 Method of Data Analysis
The basic model used in this research is the Two-Parameter Weibull Failure Distribution method. There are other models for analysing the failure data of a component or system depending on the type of failures. Some of these failure models are:
The Exponential Failure Distribution The Normal Failure Distribution The Gamma Failure Distribution The Three-Parameter Weibull Distribution

Idiapho and Odinikuku; JERR, 2(4): 1-15, 2018; Article no.JERR.44330
4
2.2.1 The Weibull Method One of the most useful probability distributions in reliability is the Weibull Failure Distribution. It may be used to model both increasing and decreasing failure rates. It is characterised by a hazard function of the form
batt (1)
is a power function. The function t known as
the failure rate or hazard rate is increasing for a > 0, b > 0 and is decreasing for a > 0, b < 0. There are three types of Weibull Failure Distribution, namely: The Single Parameter Weibull Method The 2-Parameter Weibull Method and The 3-Paraemter Weibull Method
The Weibull technique assumes, initially, that the distribution of failures, whilst not random, is at least able to be modeled by a simple 2-Parameter Weibull Distribution. It assumes that: R(t) = exp – (t/θ) β (2) R(t) is the Reliability function or the Probability of Survival The technique is to carry out a curve fitting (probability modeling) exercise to establish first that the data will fit this assumption. The next step is to estimate the values of the 2-parameters of Weibull distribution (θ and β). Generally, a least-squares fit of the data is recommended over a manual plot which is done using a Weibull Probability paper as it is more accurate and less subjective than fitting a straight line to the data by eye. Theta (θ) is a scale parameter that influences both the mean and spread of dispersion of the distribution. As θ increases, the reliability increases at a given point in time. The slope of the hazard rate decreases as θ increases. The parameter θ is also called the characteristics life and it has units identical to those of failure time T.
Beta (β) is referred to as the shape parameter. Its effect on the distribution varies for different values. If β = 1, then the failures are random and a constant failure rate can be assumed where failure rate,
t = 1/ β (3)
If β > 1, then the failure rate is increasing. The failures may be caused by fatigue, aging, corrosion and friction. If β < 1, then the failure rate is decreasing. The failures may be caused by poor quality control, manufacturing defects, poor workmanship etc. For 1 < β < 3, the density function is skewed. Two methods of estimating the Weibull parameters from a set of times to failure are the Least-Squares and Maximum Likelihood. The Least-Squares method is used as an initial calculation and involves calculating the hypothetical line for which the sum of the squares of the distances of the horizontal distances from the data points to the line is a minimum. The Weibull parameters (θ and β) are obtained from the line. They are parameters which allow us to compute Reliability and MTBF.
Probability of failure, �(��)�(� − 0.3)(� + 0.4) (4)
Where
�� = Failure time, hr n = Number of failures i = Rank of the failure time
�� = ����(1/(1 − �(��))) (5)
�� = ln�� (6)
Where �� are the values of the coordinates on the vertical axis and �� the values of the coordinates on the horizontal axis.
2.2.2 Weibull plots
Probability plots provide an informal method of evaluating the fit of a set data to a distribution. A least-squares fit of the data is recommended over a manual plot which is done using Weibull Probability paper as it is more accurate and less subjective than fitting a straight line to the data by eye. The vertical scale and the horizontal scale have been modified to linearize the cumulative distribution function. Since straight lines are easily identifiable. Our primary approach to probability plots is to fit a linear regression (least-squares) line of the form
� = � + �� (7)
If the failure times fit the assumed distribution, the transformed data will graph as a straight line and the fitted regression line will have a high index of fit, r.
A plot of
�� = ���� ��
���(��)� against �� = ln��
Idiapho and Odinikuku; JERR, 2(4): 1-15, 2018; Article no.JERR.44330
5
is constructed using a Weibull probability paper or by applying a least-squares fit to the data. From the plot, we obtain initial estimates of the Weibull parameters, θ and β of the distribution being fitted. β corresponds to the slope and βln θ is the intercept. From the initial estimates of Weibull parameters obtained, the mean time to failure (MTTF) and reliability of each BTS site is determined.
3. RESULTS AND DISCUSSION
3.1 Data Presentation
The data obtained from the four Base Transceiver Station (BTS) sites are presented in Tables 1 to 4.
From Table 1, the failure time in (hr; mins) is converted to hrs, so we can have a uniform unit and thus gotten below.
For Down time: 00:41:49, failure Time = 107:05. The minutes are converted as;
05107 : 05 0.8
60
107 : 05 : min 107.08hr hrs
3.2 Data Analysis
The data obtained from the four BTS sites RV0144, RV0686, RV0248 and RV0421 under
study was analysed in line with the theory and procedure described earlier in the experimental design. Tables 1 - 4 shows the 6-month data obtained from four BTS sites at University of Port Harcourt, Rivers State, Nigeria.
3.2.1 Analysis of BTS Site (RV0144)
The following failures were obtained after rank-ordering of eight (8) failure times obtained from BTS site (RV0144). Where �� = Failure time, hr i= Rank F(��) = Probability of failure n = Number of failures = 8 From equation (4) F(��) = (i-0.3)(n+0.4) i = 1, 2, 3,…,8 For i =1 and t = 26.53hr F(��) = (1-0.3)(8+0.4) = 0.0833 (8) ln�� = ln(26.53) = 3.2787 (9) From equation (5); ��= lnln(1/(1-F(��))) ��= =lnln(1/(1-0.0833)) ��= = -2.4417 (10)
Table 1. Data obtained from BTS Site RV0144
Downtime Failure Time (t) , (hr; mins) Failure Time (t), hr 00:41:59 107:05:00 107.08 00:28:59 26:32:00 26.53 00:03:59 119:53:00 119.88 00:43:00 1874:54:00 1874.90 00:27:00 1673:02:00 1673.03 02:09:00 280:51:00 280.85 01:40:00 129:41:00 129.68 1:33:00 40:47:00 40.78
Table 2. Data obtained from BTS Site RV0686
Down time Failure time (t), (hr; min) Failure time (t), hr 00:04:00 0:02:00 0.03 00:04:00 0:03:00 0.05 00:03:00 0:04:00 0.07 00:54:59 0:05:01 0.08 00:02:00 0:06:00 0.10 00:10:59 0:08:00 0.13 00:03:00 0:09:00 0.15

Idiapho and Odinikuku; JERR, 2(4): 1-15, 2018; Article no.JERR.44330
6
Down time Failure time (t), (hr; min) Failure time (t), hr 00:02:00 0:10:00 0.17 00:02:00 0:11:00 0.18 00:03:00 0:12:00 0.20 00:03:00 0:14:00 0.23 00:04:00 0:16:00 0.27 00:04:00 0:18:00 0.30 00:04:00 0:20:00 0.33 00:02:00 0:22:00 0.37 00:03:00 0:23:00 0.38 00:28:59 0:25:01 0.42 00:03:00 0:26:00 0.43 00:03:00 0:29:00 0.48 00:08:00 0:29:00 0.48 00:02:00 0:37:00 0.62 00:02:00 0:38:00 0.63 00:02:00 0:43:00 0.72 00:21:00 0:48:00 0.80 00:05:00 3:10:00 3.17 00:04:00 3:52:00 3.87 00:03:00 4:07:00 4.12 00:02:00 18:01:00 18.02 00:02:00 18:35:00 18.58 00:12:00 21:49:00 21.82 00:03:00 22:07:00 22.12 00:33:59 22:35:00 22.58 00:12:59 63:02:01 63.03 00:52:00 94:39:00 94.65 00:03:00 96:09:00 96.15
Table 3. Data obtained from BTS Site RV0248
Down time Failure Time (t), (hr: mins) Failure Time (t), hr 00:26:00 0:05:00 00:08:00 0:12:00 0.20 00:34:00 0:12:00 0.20 00:41:59 0:12:00 0.20 00:02:00 0:13:00 0.22 00:05:00 0:13:00 0.22 00:01:00 0:15:00 0.25 00:18:00 0:16:00 0.27 00:02:00 0:17:00 0.28 03:07:00 0:40:00 0.67 00:07:00 1:13:00 1.22 00:03:00 1:49:00 1.82 12:05:00 6:41:00 6.68 00:03:00 24:12:00 24.20 00:28:59 26:32:00 26.53 00:11:00 69:53:00 69.88 00:00:59 106:52:00 106.87 0:04:00 119:53:00 119.88 00:06:00 127:29:00 127.48 00:11:00 192:32:00 192.53 00:07:00 236:44:00 236.73 01:03:00 569:56:00 569.93 00:15:00 940:23:00 940.38 00:51:00 1486:10:00 1486.17
Idiapho and Odinikuku; JERR, 2(4): 1-15, 2018; Article no.JERR.44330
7
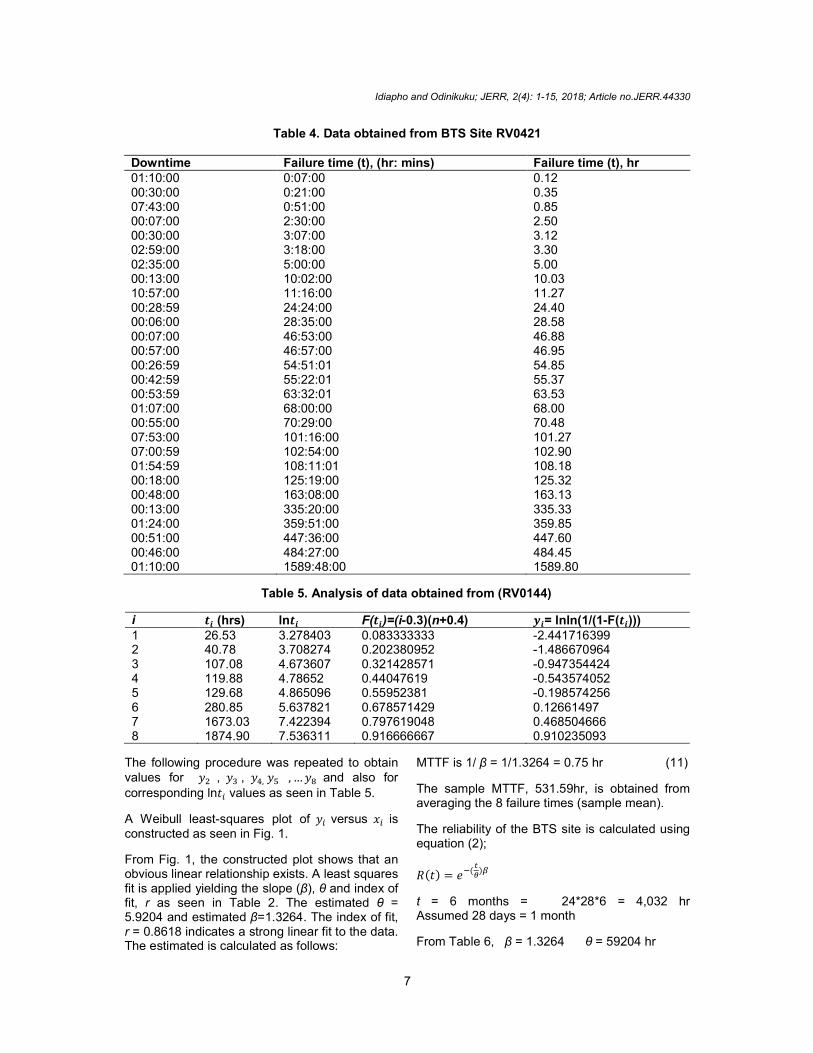
Table 4. Data obtained from BTS Site RV0421
Downtime Failure time (t), (hr: mins) Failure time (t), hr 01:10:00 0:07:00 0.12 00:30:00 0:21:00 0.35 07:43:00 0:51:00 0.85 00:07:00 2:30:00 2.50 00:30:00 3:07:00 3.12 02:59:00 3:18:00 3.30 02:35:00 5:00:00 5.00 00:13:00 10:02:00 10.03 10:57:00 11:16:00 11.27 00:28:59 24:24:00 24.40 00:06:00 28:35:00 28.58 00:07:00 46:53:00 46.88 00:57:00 46:57:00 46.95 00:26:59 54:51:01 54.85 00:42:59 55:22:01 55.37 00:53:59 63:32:01 63.53 01:07:00 68:00:00 68.00 00:55:00 70:29:00 70.48 07:53:00 101:16:00 101.27 07:00:59 102:54:00 102.90 01:54:59 108:11:01 108.18 00:18:00 125:19:00 125.32 00:48:00 163:08:00 163.13 00:13:00 335:20:00 335.33 01:24:00 359:51:00 359.85 00:51:00 447:36:00 447.60 00:46:00 484:27:00 484.45 01:10:00 1589:48:00 1589.80
Table 5. Analysis of data obtained from (RV0144)
i �� (hrs) ln�� F(��)=(i-0.3)(n+0.4) ��= lnln(1/(1-F(��))) 1 26.53 3.278403 0.083333333 -2.441716399 2 40.78 3.708274 0.202380952 -1.486670964 3 107.08 4.673607 0.321428571 -0.947354424 4 119.88 4.78652 0.44047619 -0.543574052 5 129.68 4.865096 0.55952381 -0.198574256 6 280.85 5.637821 0.678571429 0.12661497 7 1673.03 7.422394 0.797619048 0.468504666 8 1874.90 7.536311 0.916666667 0.910235093
The following procedure was repeated to obtain values for �� , �� , ��,�� , …�� and also for corresponding ln�� values as seen in Table 5.
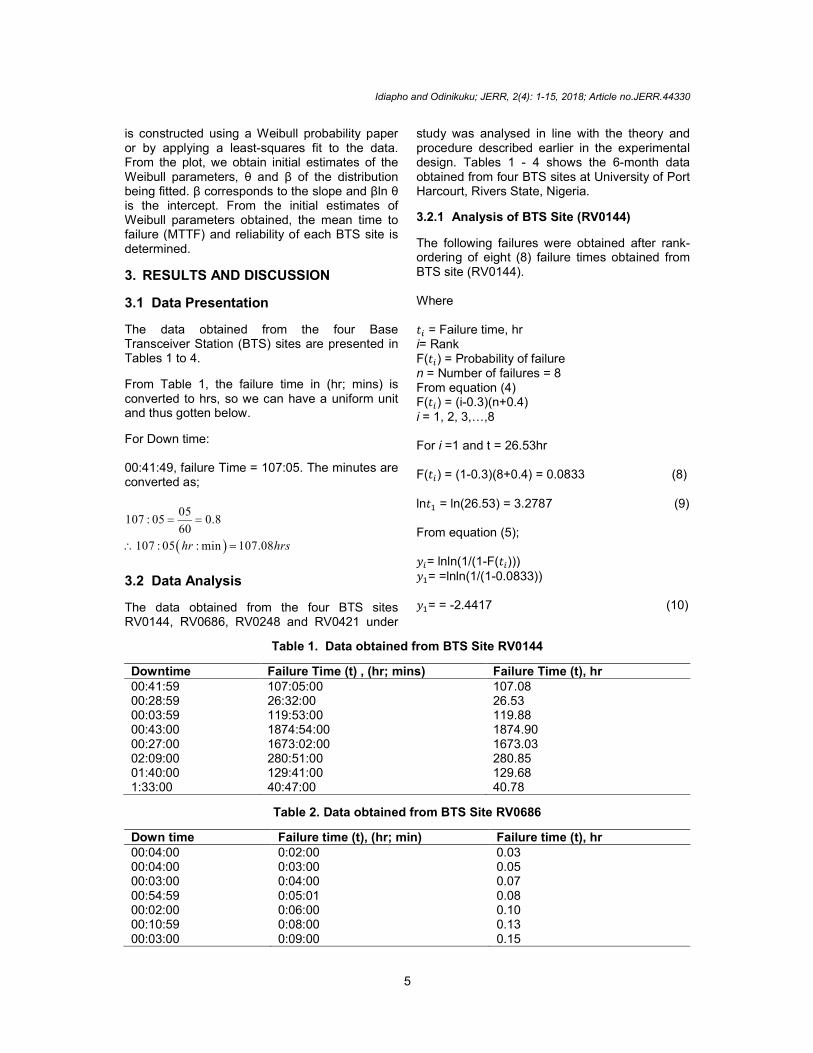
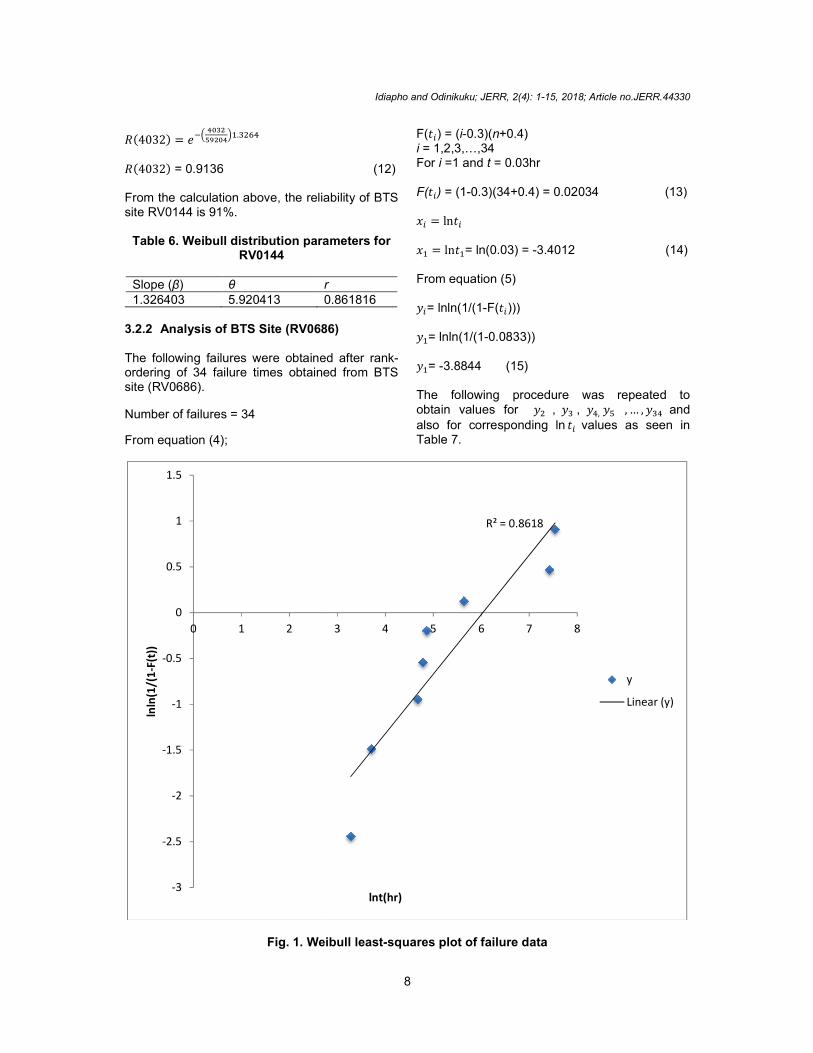
A Weibull least-squares plot of ��versus �� is constructed as seen in Fig. 1.
From Fig. 1, the constructed plot shows that an obvious linear relationship exists. A least squares fit is applied yielding the slope (β), θ and index of fit, r as seen in Table 2. The estimated θ = 5.9204 and estimated β=1.3264. The index of fit, r = 0.8618 indicates a strong linear fit to the data. The estimated is calculated as follows:
MTTF is 1/ β = 1/1.3264 = 0.75 hr (11)
The sample MTTF, 531.59hr, is obtained from averaging the 8 failure times (sample mean).
The reliability of the BTS site is calculated using equation (2);
�(�) = ��(�
�)�
t = 6 months = 24*28*6 = 4,032 hr Assumed 28 days = 1 month
From Table 6, β = 1.3264 θ = 59204 hr
�(4032) = �������
�������.����
�(4032) = 0.9136 (12) From the calculation above, the reliability of BTS site RV0144 is 91%.
Table 6. Weibull distribution parameters for RV0144
Slope (β) θ 1.326403 5.920413
3.2.2 Analysis of BTS Site (RV0686) The following failures were obtained after rankordering of 34 failure times obtained from BTS site (RV0686).
Number of failures = 34
From equation (4);
Fig. 1. Weibull least
-3
-2.5
-2
-1.5
-1
-0.5
0
0.5
1
1.5
0 1 2
lnln(1/(1-F(t))
Idiapho and Odinikuku; JERR, 2(4): 1-15, 2018; Article no.
8
= 0.9136 (12)
From the calculation above, the reliability of BTS
Table 6. Weibull distribution parameters for
r 0.861816
Analysis of BTS Site (RV0686)
The following failures were obtained after rank-ordering of 34 failure times obtained from BTS
F(��) = (i-0.3)(n+0.4) i = 1,2,3,…,34 For i =1 and t = 0.03hr F(��) = (1-0.3)(34+0.4) = 0.02034 �� = ln�� �� = ln��= ln(0.03) = -3.4012 From equation (5) ��= lnln(1/(1-F(��))) ��= lnln(1/(1-0.0833)) ��= -3.8844 (15) The following procedure was repeated to obtain values for �� , �� , ��,�also for corresponding ln �� values as seen in Table 7.
Fig. 1. Weibull least-squares plot of failure data
R² = 0.8618
3 4 5 6 7 8
lnt(hr)
; Article no.JERR.44330
0.3)(34+0.4) = 0.02034 (13)
(14)
The following procedure was repeated to �� , … , ��� and
values as seen in
y
Linear (y)
Idiapho and Odinikuku; JERR, 2(4): 1-15, 2018; Article no.JERR.44330
9
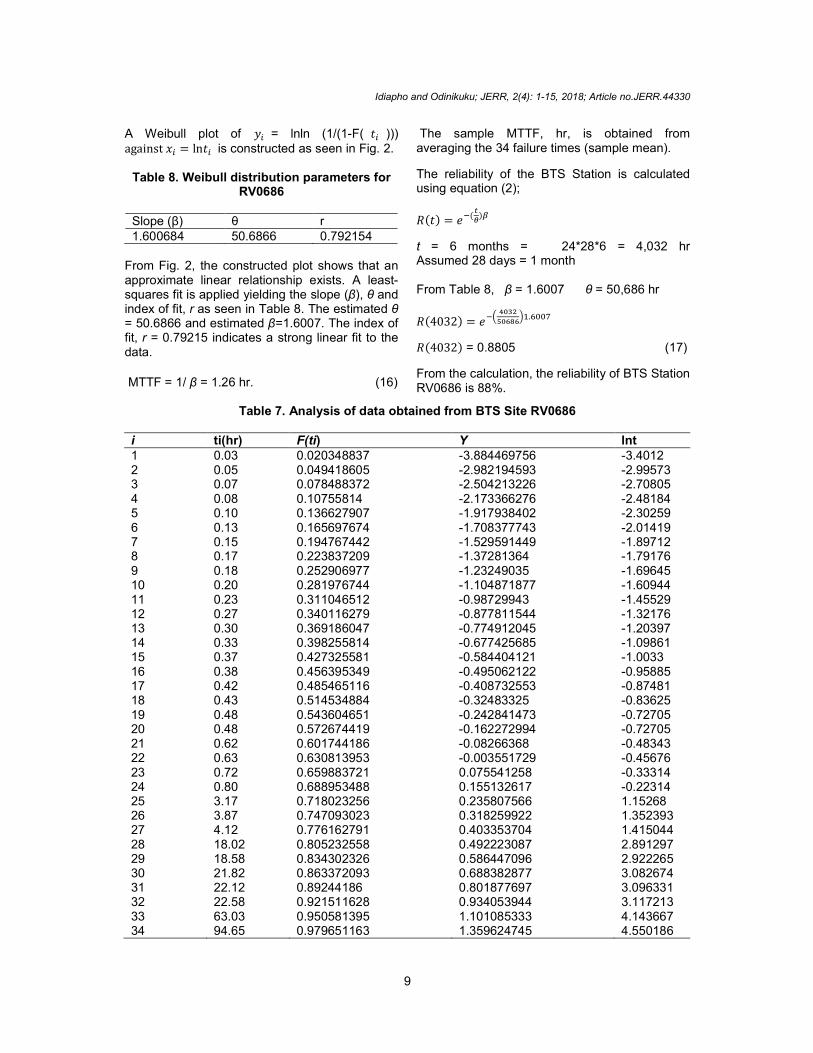
A Weibull plot of �� = lnln (1/(1-F( �� ))) against�� = ln�� is constructed as seen in Fig. 2.
Table 8. Weibull distribution parameters for RV0686
Slope (β) θ r 1.600684 50.6866 0.792154
From Fig. 2, the constructed plot shows that an approximate linear relationship exists. A least-squares fit is applied yielding the slope (β), θ and index of fit, r as seen in Table 8. The estimated θ = 50.6866 and estimated β=1.6007. The index of fit, r = 0.79215 indicates a strong linear fit to the data.
MTTF = 1/ β = 1.26 hr. (16)
The sample MTTF, hr, is obtained from averaging the 34 failure times (sample mean).
The reliability of the BTS Station is calculated using equation (2);
�(�) = ��(�
�)�
t = 6 months = 24*28*6 = 4,032 hr Assumed 28 days = 1 month From Table 8, β = 1.6007 θ = 50,686 hr
�(4032) = �������
�������.����
�(4032) = 0.8805 (17)
From the calculation, the reliability of BTS Station RV0686 is 88%.
Table 7. Analysis of data obtained from BTS Site RV0686
i ti(hr) F(ti) Y lnt 1 0.03 0.020348837 -3.884469756 -3.4012 2 0.05 0.049418605 -2.982194593 -2.99573 3 0.07 0.078488372 -2.504213226 -2.70805 4 0.08 0.10755814 -2.173366276 -2.48184 5 0.10 0.136627907 -1.917938402 -2.30259 6 0.13 0.165697674 -1.708377743 -2.01419 7 0.15 0.194767442 -1.529591449 -1.89712 8 0.17 0.223837209 -1.37281364 -1.79176 9 0.18 0.252906977 -1.23249035 -1.69645 10 0.20 0.281976744 -1.104871877 -1.60944 11 0.23 0.311046512 -0.98729943 -1.45529 12 0.27 0.340116279 -0.877811544 -1.32176 13 0.30 0.369186047 -0.774912045 -1.20397 14 0.33 0.398255814 -0.677425685 -1.09861 15 0.37 0.427325581 -0.584404121 -1.0033 16 0.38 0.456395349 -0.495062122 -0.95885 17 0.42 0.485465116 -0.408732553 -0.87481 18 0.43 0.514534884 -0.32483325 -0.83625 19 0.48 0.543604651 -0.242841473 -0.72705 20 0.48 0.572674419 -0.162272994 -0.72705 21 0.62 0.601744186 -0.08266368 -0.48343 22 0.63 0.630813953 -0.003551729 -0.45676 23 0.72 0.659883721 0.075541258 -0.33314 24 0.80 0.688953488 0.155132617 -0.22314 25 3.17 0.718023256 0.235807566 1.15268 26 3.87 0.747093023 0.318259922 1.352393 27 4.12 0.776162791 0.403353704 1.415044 28 18.02 0.805232558 0.492223087 2.891297 29 18.58 0.834302326 0.586447096 2.922265 30 21.82 0.863372093 0.688382877 3.082674 31 22.12 0.89244186 0.801877697 3.096331 32 22.58 0.921511628 0.934053944 3.117213 33 63.03 0.950581395 1.101085333 4.143667 34 94.65 0.979651163 1.359624745 4.550186
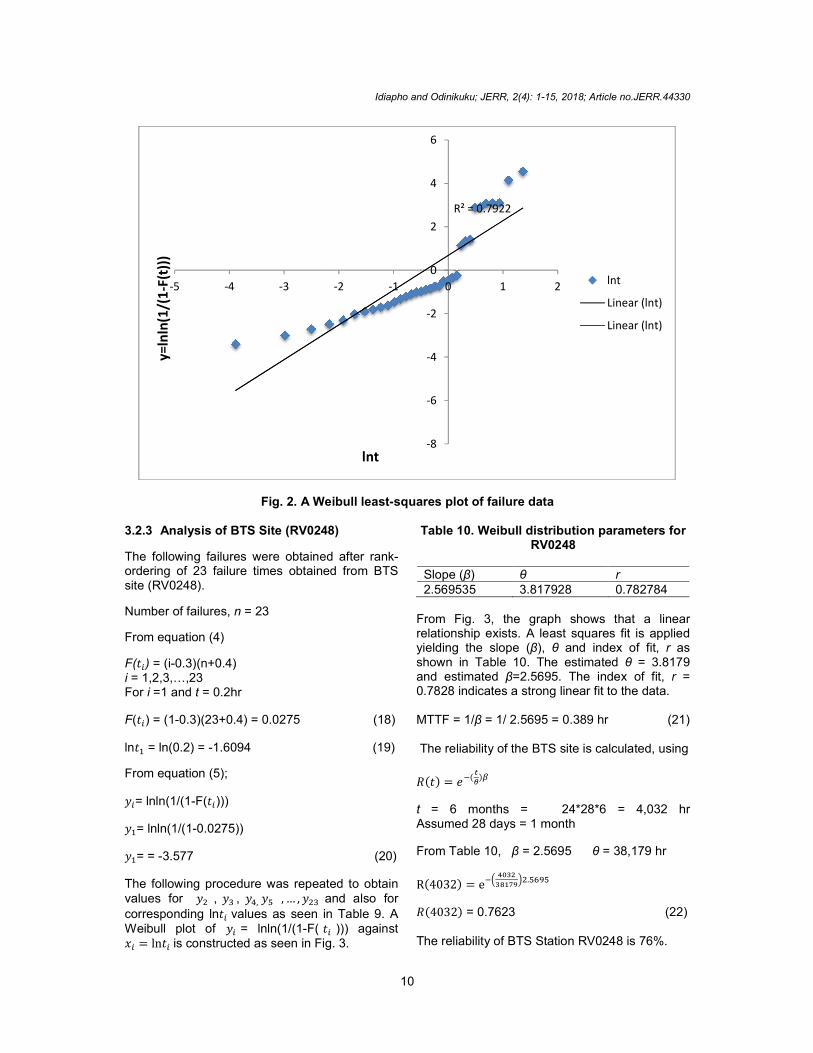
Fig. 2. A Weibull least 3.2.3 Analysis of BTS Site (RV0248)
The following failures were obtained after rankordering of 23 failure times obtained from BTS site (RV0248).
Number of failures, n = 23
From equation (4)
F(��) = (i-0.3)(n+0.4) i = 1,2,3,…,23 For i =1 and t = 0.2hr
F(��) = (1-0.3)(23+0.4) = 0.0275
ln�� = ln(0.2) = -1.6094
From equation (5);
��= lnln(1/(1-F(��)))
��= lnln(1/(1-0.0275))
��= = -3.577
The following procedure was repeated to obtain values for �� , �� , ��,�� , … , ���corresponding ln�� values as seen in Table 9. A Weibull plot of �� = lnln(1/(1-F(�� = ln��is constructed as seen in Fig
-5 -4 -3
y=lnln(1/(1-F(t)))
Idiapho and Odinikuku; JERR, 2(4): 1-15, 2018; Article no.
10
Fig. 2. A Weibull least-squares plot of failure data
Analysis of BTS Site (RV0248)
The following failures were obtained after rank-ordering of 23 failure times obtained from BTS
(18)
(19)
(20)
The following procedure was repeated to obtain and also for
values as seen in Table 9. A F( �� ))) against
is constructed as seen in Fig. 3.
Table 10. Weibull distribution parameters for RV0248
Slope (β) θ 2.569535 3.817928
From Fig. 3, the graph shows that a linear relationship exists. A least squares fit is applied yielding the slope (β), θ and index of fit, shown in Table 10. The estimated and estimated β=2.5695. The index of fit, 0.7828 indicates a strong linear fit to the data. MTTF = 1/β = 1/ 2.5695 = 0.389 hr (21) The reliability of the BTS site is calculated, using
�(�) = ��(�
�)�
t = 6 months = 24*28*6 = 4,032 hr Assumed 28 days = 1 month From Table 10, β = 2.5695 θ = 38,179 hr
R(4032) = e������
�������.����
�(4032) = 0.7623 (22) The reliability of BTS Station RV0248 is 76%.
R² = 0.7922
-8
-6
-4
-2
0
2
4
6
-2 -1 0 1 2
lnt
lnt
Linear (lnt)
Linear (lnt)
; Article no.JERR.44330
Table 10. Weibull distribution parameters for
r 0.782784
From Fig. 3, the graph shows that a linear relationship exists. A least squares fit is applied
and index of fit, r as shown in Table 10. The estimated θ = 3.8179
=2.5695. The index of fit, r = 0.7828 indicates a strong linear fit to the data.
= 1/ 2.5695 = 0.389 hr (21)
e is calculated, using
= 6 months = 24*28*6 = 4,032 hr
= 38,179 hr
= 0.7623 (22)
The reliability of BTS Station RV0248 is 76%.
lnt
Linear (lnt)
Linear (lnt)
Idiapho and Odinikuku; JERR, 2(4): 1-15, 2018; Article no.JERR.44330
11
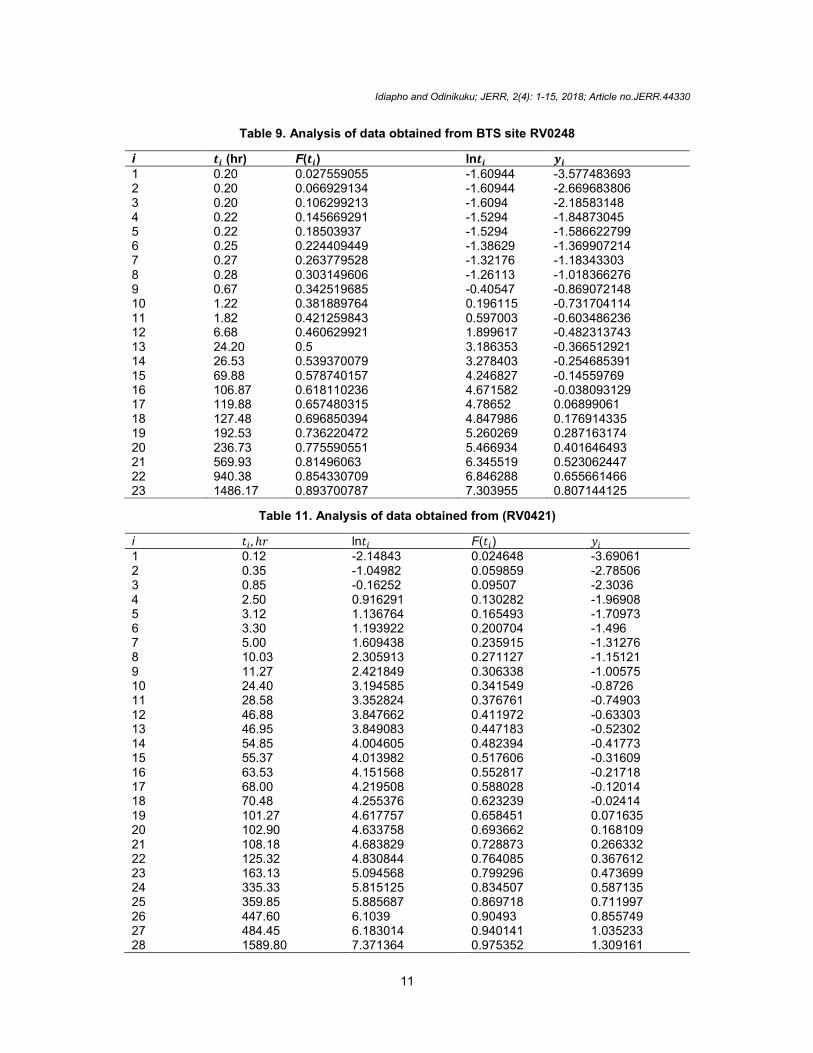
Table 9. Analysis of data obtained from BTS site RV0248
i �� (hr) F(��) ln�� �� 1 0.20 0.027559055 -1.60944 -3.577483693 2 0.20 0.066929134 -1.60944 -2.669683806 3 0.20 0.106299213 -1.6094 -2.18583148 4 0.22 0.145669291 -1.5294 -1.84873045 5 0.22 0.18503937 -1.5294 -1.586622799 6 0.25 0.224409449 -1.38629 -1.369907214 7 0.27 0.263779528 -1.32176 -1.18343303 8 0.28 0.303149606 -1.26113 -1.018366276 9 0.67 0.342519685 -0.40547 -0.869072148 10 1.22 0.381889764 0.196115 -0.731704114 11 1.82 0.421259843 0.597003 -0.603486236 12 6.68 0.460629921 1.899617 -0.482313743 13 24.20 0.5 3.186353 -0.366512921 14 26.53 0.539370079 3.278403 -0.254685391 15 69.88 0.578740157 4.246827 -0.14559769 16 106.87 0.618110236 4.671582 -0.038093129 17 119.88 0.657480315 4.78652 0.06899061 18 127.48 0.696850394 4.847986 0.176914335 19 192.53 0.736220472 5.260269 0.287163174 20 236.73 0.775590551 5.466934 0.401646493 21 569.93 0.81496063 6.345519 0.523062447 22 940.38 0.854330709 6.846288 0.655661466 23 1486.17 0.893700787 7.303955 0.807144125
Table 11. Analysis of data obtained from (RV0421)
i ��, ℎ� ln�� F(��) �� 1 0.12 -2.14843 0.024648 -3.69061 2 0.35 -1.04982 0.059859 -2.78506 3 0.85 -0.16252 0.09507 -2.3036 4 2.50 0.916291 0.130282 -1.96908 5 3.12 1.136764 0.165493 -1.70973 6 3.30 1.193922 0.200704 -1.496 7 5.00 1.609438 0.235915 -1.31276 8 10.03 2.305913 0.271127 -1.15121 9 11.27 2.421849 0.306338 -1.00575 10 24.40 3.194585 0.341549 -0.8726 11 28.58 3.352824 0.376761 -0.74903 12 46.88 3.847662 0.411972 -0.63303 13 46.95 3.849083 0.447183 -0.52302 14 54.85 4.004605 0.482394 -0.41773 15 55.37 4.013982 0.517606 -0.31609 16 63.53 4.151568 0.552817 -0.21718 17 68.00 4.219508 0.588028 -0.12014 18 70.48 4.255376 0.623239 -0.02414 19 101.27 4.617757 0.658451 0.071635 20 102.90 4.633758 0.693662 0.168109 21 108.18 4.683829 0.728873 0.266332 22 125.32 4.830844 0.764085 0.367612 23 163.13 5.094568 0.799296 0.473699 24 335.33 5.815125 0.834507 0.587135 25 359.85 5.885687 0.869718 0.711997 26 447.60 6.1039 0.90493 0.855749 27 484.45 6.183014 0.940141 1.035233 28 1589.80 7.371364 0.975352 1.309161
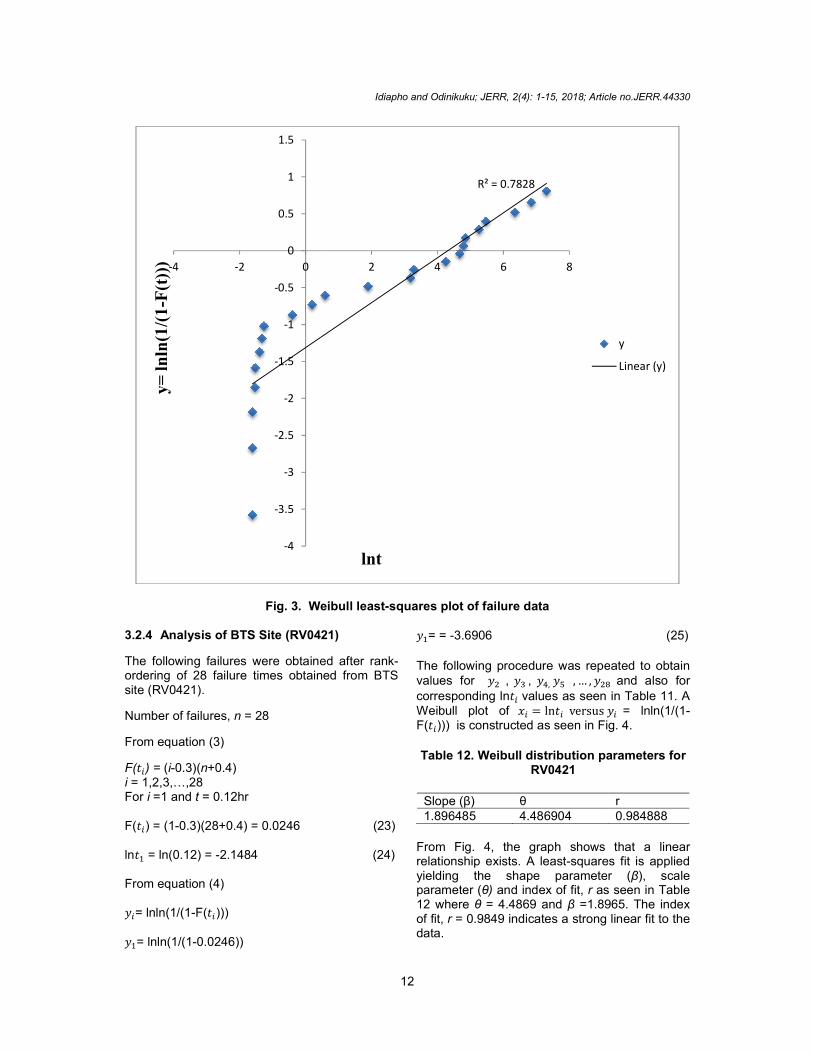
Fig. 3. Weibull least
3.2.4 Analysis of BTS Site (RV0421)
The following failures were obtained after rankordering of 28 failure times obtained from BTS site (RV0421).
Number of failures, n = 28
From equation (3)
F(��) = (i-0.3)(n+0.4) i = 1,2,3,…,28 For i =1 and t = 0.12hr F(��) = (1-0.3)(28+0.4) = 0.0246 ln�� = ln(0.12) = -2.1484 From equation (4) ��= lnln(1/(1-F(��))) ��= lnln(1/(1-0.0246))
-4
-3.5
-3
-2.5
-2
-1.5
-1
-0.5
0
0.5
1
1.5
-4 -2 0
y=
ln
ln(1
/(1
-F(t
)))
Idiapho and Odinikuku; JERR, 2(4): 1-15, 2018; Article no.
12
Fig. 3. Weibull least-squares plot of failure data
Analysis of BTS Site (RV0421)
The following failures were obtained after rank-ordering of 28 failure times obtained from BTS
0.3)(28+0.4) = 0.0246 (23)
(24)
��= = -3.6906
The following procedure was repeated to obtain values for �� , �� , ��,�� , … , ���corresponding ln�� values as seen in Table 11. A Weibull plot of �� = ln��versus�F(��))) is constructed as seen in Fig
Table 12. Weibull distribution parameters for
RV0421
Slope (β) θ 1.896485 4.486904
From Fig. 4, the graph shows relationship exists. A least-squares fit is applied yielding the shape parameter (parameter (θ) and index of fit, r as seen in Table 12 where θ = 4.4869 and β =1.8965. The index of fit, r = 0.9849 indicates a strong linear fit to thdata.
R² = 0.7828
2 4 6 8
lnt
; Article no.JERR.44330
(25)
The following procedure was repeated to obtain
�� and also for values as seen in Table 11. A
�� = lnln(1/(1-is constructed as seen in Fig. 4.
Weibull distribution parameters for
r 0.984888
From Fig. 4, the graph shows that a linear squares fit is applied
yielding the shape parameter (β), scale as seen in Table
=1.8965. The index = 0.9849 indicates a strong linear fit to the
y
Linear (y)
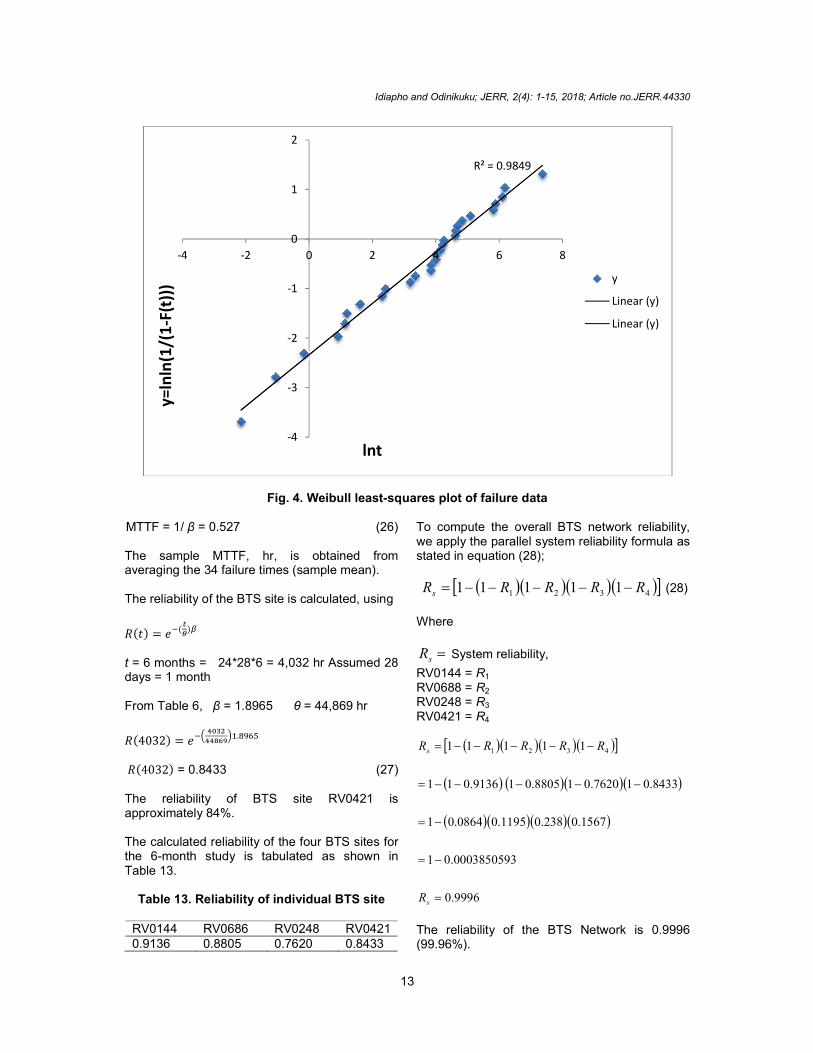
Fig. 4. Weibull least
MTTF = 1/ β = 0.527 The sample MTTF, hr, is obtained from averaging the 34 failure times (sample mean). The reliability of the BTS site is calculated, using
�(�) = ��(�
�)�
t = 6 months = 24*28*6 = 4,032 hr Assumed 28 days = 1 month From Table 6, β = 1.8965 θ = 44,869 hr
�(4032) = �������
�������.����
�(4032) = 0.8433 The reliability of BTS site RV0421 is approximately 84%. The calculated reliability of the four BTS sites for the 6-month study is tabulated as shown in Table 13.
Table 13. Reliability of individual
RV0144 RV0686 RV0248 0.9136 0.8805 0.7620
-4
-3
-2
-1
0
1
2
-4 -2 0
y=lnln(1/(1-F(t)))
Idiapho and Odinikuku; JERR, 2(4): 1-15, 2018; Article no.
13
Fig. 4. Weibull least-squares plot of failure data
(26)
The sample MTTF, hr, is obtained from averaging the 34 failure times (sample mean).
reliability of the BTS site is calculated, using
= 6 months = 24*28*6 = 4,032 hr Assumed 28
= 44,869 hr
(27)
The reliability of BTS site RV0421 is
The calculated reliability of the four BTS sites for month study is tabulated as shown in
individual BTS site
RV0421 0.8433
To compute the overall BTS network reliability, we apply the parallel system reliability formula as stated in equation (28);
321 1111 RRRRs
Where
sR System reliability,
RV0144 = R1 RV0688 = R2
RV0248 = R3 RV0421 = R4
9996.0
0003850593.01
1567.0238.01195.00864.01
7620.018805.019136.011
11111 4321
s
s
R
RRRRR
The reliability of the BTS Network is 0.9996 (99.96%).
R² = 0.9849
2 4 6 8
lnt
; Article no.JERR.44330
To compute the overall BTS network reliability, we apply the parallel system reliability formula as
41 R (28)
8433.017620
4
The reliability of the BTS Network is 0.9996
y
Linear (y)
Linear (y)

Idiapho and Odinikuku; JERR, 2(4): 1-15, 2018; Article no.JERR.44330
14
3.3 Discussion of Results From the analysis carried out on the failure times obtained from each of the four Base transceiver stations, BTS site RV0248 has the maximum value of shape parameter, β = 2.5 while BTS site RV0144 has β = 1.3 which is the minimum as seen in Tables 10 and 6 respectively. The value of the shape parameter (β) was found to be between the range of 1< β < 3 for all the BTS stations studied. This means that the probability density function is skewed and the failure rate of the BTS stations is increasing. Probable cause of failure is aging (wear-out) of components which can be reduced by preventive maintenance and parts replacement technology. The probability density function is skewed. The Weibull plots for the four BTS sites had a good index of fit, r, ranging from 0.78 to 0.98 which shows that a strong linear relationship exists as seen in Figs. 1 to 4. BTS site RV0421 produced the highest value of index of fit, r, yielding 0.98. BTS site RV0144 recorded the lowest number of failures, n = 8 while BTS site RV0686 has a total of 34 failures. The value of the scale parameter (θ) was found to be increasing as the number of failures decreases. This can be seen in BTS site RV0144 which had the highest value of θ = 59,204 hrs with number of failures, n = 8. From our results for reliability in equations (5), (10), (15) and (20), the reliability of the four BTS sites were found to be increasing as their values of scale parameter, θ increases. BTS site RV0144 had a scale parameter, θ = 59,204 hrs which resulted in a reliability of 0.91 (91%); BTS site RV0686 had a reliability of 0.88 (88%) for θ = 50,686hr; BTS site RV0421 yielded a reliability of 0.84 (84%) when θ = 44,869hrs and BTS site RV0248 had the lowest reliability of 0.76 (76%) for θ = 38,179hrs. Table 13 shows the reliability of the four BTS sites studied. The results indicate that BTS site RV0144 had the highest probability of survival in the 6-month data studied. On the other hand, BTS site RV0248 had the lowest reliability. The overall reliability of the four BTS sites was computed using equation (28). The value of 0.9996 was obtained.
4. CONCLUSION The reliability assessment of a Base Transceiver Station (BTS) has been studied. This study
includes the rank-ordering of the failure times of each of the four BTS sites used as case study, the determination of the probability of failures of each BTS site, a Weibull least-squares plot to determine the Weibull scale parameter, θ and Weibull shape parameter, β of each BTS site, the determination of the Mean Time to Failure and Reliability of each BTS site. The failure times obtained from the four BTS sites were analysed using 2-parameter Weibull failure distribution method. The estimates of Weibull parameters θ and β were obtained from the Weibull least-squares plots constructed. The reliability of each BTS site was successfully computed. From the results obtained, BTS site RV0144 was the most reliable while BTS site RV0248 had the lowest reliability. In this study, the failure times of four Base Transceiver Station (BTS) sites was successfully analysed by 2-parameter Weibull failure distribution method and the reliability of each BTS site was successfully determined.
COMPETING INTERESTS Authors have declared that no competing interests exist.
REFERENCES
1. Ukhurebor KE, Maor MS, Aigbe EE. ‘Mollification of WCDMA interference on uplink channels in cellular network using the power control approach. British Journal of Applied Science & Technology. 2017;20(4):1-11.
2. Lawal BY, Ukhurebor KE, Adekoya MA, Aigbe EE. Quality of service and performance analysis of A GSM network in eagle square, Abuja and Its Environs, Nigeria’, International Journal of Scientific & Engineering Research. 2016;7(8):1992- 1999.
3. Ukhurebor KE, Andikara J, Azi SO. Effects of upsurge of human traffic on the quality of service of GSM network in eagle Square Abuja, Nigeria. International Journal of Scientific & Engineering Research. 2015a;6(11):89- 104.
4. Ukhurebor KE, Awodu OM, Abiodun IC, Azi SO. A comparative study of the quality of service of GSM network during Crowd Upsurge in University of Benin, Nigeria’, International Journal of Scientific &
Idiapho and Odinikuku; JERR, 2(4): 1-15, 2018; Article no.JERR.44330
15
Engineering Research. 2015b;6(10):1484- 1497.
5. Mas’ud A. Fault management in communication networks (A Case Study of the CDMA Intercullar network at Kaduna). MSc Thesis. Ahmadu Bello University, Zaria. Retrieved March 21, 2008 from Department of Electrical Engineering Theses, Ahmadu Bello University, Zaria; 2006.
6. Chen Y. Episode perspective of wireless network dependability. MSc Thesis. Ohio University, Ohio; 2006.
7. Snow A, Varshney U, Malloy A. Reliability and survivability of wireless and mobile networks IEEE Computer Magazine. 2000;49-55.
8. Albaghdadi M, Razvi K. Efficient transmission of period data that follows a consistent daily pattern. 9th IFIP/IEEE International Symposium on Integrated Network Management, IEEE Operation Center, Piscataway, NY. 2005;511-526.
9. Fawaz W, Martignon F, Chen K, Pujolle G. A novel protection scheme for quality of service aware WDM Networks; 2005. IEEE, 0-7803-8939-5/2005.
10. Goel L, Gupta R. A Windows based simulation tool for reliability evaluation of electricity generating capacity. Int. J. Engng Ed. 2007;13(5):347-357.
11. Paska J. Methodology and tools for electric power system reliability assessment on HL I and HL II Levels. Paper presented at the 9th International Conference, Electrical Power Quality and Utilization, Barcelona; 2007.
12. Silverstein BL, Porter DM. Contingency ranking for bulk system reliability criteria. Transactions on Power Systems. 2002;7(3).
13. Burgio A, Menniti D, Pinnarelli A, Sorrentino N. The reliability evaluation of a power system in presence of photovoltaic and wind power generation plants and UPS. Paper presented at the 9th International Conference, Electrical Power Quality and Utilization, Barcelona; 2007.
14. Chowdhury AA, Glover BP, Herbert S, Stadley K, Turanli H. Bulk transmission equipment outage performance reporting at mid-continent area power pool, Power Engineering Society General Meeting, London; 2004.
_________________________________________________________________________________ © 2018 Idiapho and Odinikuku; This is an Open Access article distributed under the terms of the Creative Commons Attribution License (http://creativecommons.org/licenses/by/4.0), which permits unrestricted use, distribution, and reproduction in any medium, provided the original work is properly cited.
Peer-review history: The peer review history for this paper can be accessed here:
http://www.sciencedomain.org/review-history/26807