Embed Size (px)
Citation preview
Turk J Elec Eng & Comp Sci(2020) 28: 380 – 393© TÜBİTAKdoi:10.3906/elk-1904-143
Turkish Journal of Electrical Engineering & Computer Sciences
http :// journa l s . tub i tak .gov . t r/e lektr ik/
Research Article
Reliability comparisons of mobile network operators: an experimental case studyfrom a crowdsourced dataset
Engin ZEYDAN1,∗, Ahmet YILDIRIM21Centre Technologic de Telecomunicacions de Catalunya, Castelldefels, Barcelona, Spain
2Department of Computer Engineering, Faculty of Engineering, Boğaziçi University, İstanbul, Turkey
Received: 18.04.2019 • Accepted/Published Online: 27.09.2019 • Final Version: 27.01.2020
Abstract:It is of great interest for Mobile Network Operators (MNOs) to know how well their network infrastructure
performance behaves in different geographical regions of their operating country compared to their horizontal competitors.However, traditional network monitoring and measurement methods of network infrastructure use limited numbersof measurement points that are insufficient for detailed analysis and expensive to scale using an internal workforce.On the other hand, the abundance of crowdsourced content can engender various unforeseen opportunities for MNOsto cope with this scaling problem. This paper investigates end-to-end reliability and packet loss (PL) performancecomparisons of MNOs using a previously collected real-world proprietary crowdsourced dataset from a user applicationfor 13 months’ duration in Turkey. More particularly, a unified crowdsourced data-aided statistical MNO comparisonframework is proposed, which consists of data collection and network performance analysis steps. Our results arestatistically supported using confidence interval analysis for the mean difference of PL ratios and reliability levelsof MNOs using unpaired number of observations statistical analysis. The network performance results indicate thatsignificant performance differences in MNOs depending on different regions of the country exist. Moreover, we observethat the overall comparative ordered list of MNOs’ reliability performance does not differ when both PL and latencyrequirements vary.
Key words: Data analytics, MNOs, statistics, reliability, KPIs
1. IntroductionAlmost all Mobile Network Operators (MNOs) are heavily investing in network infrastructure where necessarychanges and technological upgrades have a clear impact on their daily end-to-end network performances.However, providing nationwide coverage with a high quality Key Performance Indicator (KPI) is not an easytask. Additionally, maintaining better KPI guarantees in some areas means that other parts of the countrywill not easily have excellence (e.g., in urban, suburban, or rural areas). As a matter of fact, services in largegeographical areas have different network demands and requirements where various technical approaches (e.g.,statistics, machine learning) need to be exploited for adequate provision in urban, suburban, or rural areas of thecountry. For example, to support an acceptable Internet connection, services such as voice over IP (VoIP), livestreaming (e.g., YouTube or Netflix), 4K Ultra or full HD Video, online video gaming, and instant messagingshould be enabled for all MNOs depending on the geographical locations as well as users’ periodic demands atcertain times of the day [1].∗Correspondence: [email protected]
This work is licensed under a Creative Commons Attribution 4.0 International License.380

ZEYDAN and YILDIRIM/Turk J Elec Eng & Comp Sci
MNOs’ performances over the mobile infrastructure have changed dramatically in recent years and aclose race between MNOs exists to upgrade to an advanced mobile infrastructure. The introduction of 4Gand Long Term Evolution Advanced (LTE-A) services has increased subscribers’ expectations in terms of datarates, latency, and reliability. The network end-to-end performances of different MNOs also differ based ontheir different investment and management strategies. For example, for some MNOs that are deploying massiveInternet of Things (IoT) devices, highly reliable and low block error rate (BLER) data transmission may beof interest, whereas for other MNO interested in providing communication for time-critical applications, lowlatency can be critical. Moreover, those KPI performances of MNOs can differ based on the geographicallocations’ target metrics and requirements. Some of the important KPIs that are studied within this paperfor comparing MNO performances as well as defining target requirements are as follows: (i) Latency is themeasurement of Round Trip Time (RTT) it takes for one packet sent from user equipment (UE) to reach toapplication server and then back to UE, (ii) Packet Loss (PL) is defined as lost data/total sent data, whichgives the ratio of data packets that are not arriving at the intended destination. (iii) Reliability is defined asthe average number of correct observations (in percentages) for the given requirements when the amount of β
bytes of transmitted data is transmitted with BLER less than λ and within a less than γ ms of latency. In otherwords, reliability measures provision of a high level of correct message transmission within a latency bound. Inthe present paper, we utilize The 3rd Generation Partnership Project (3GPP)’s reliability definition [2], whichis defined as one of the KPIs according to 3GPP’s The Fifth Generation (5G) requirements for Ultra reliabilityand low latency communications (URLLC) use case [3].
On the other hand, crowdsourcing data from the masses has also gained steam in the last few years as adesired source of insights [4]. Crowdsourcing data is differentiated from traditional data collection proceduresin many aspects in terms its cost efficiency, frequency, immediacy, and usability, and may lead to significantpotential to MNOs for analyzing their users’ behaviors. Together with a large number of received networkperformance observations scattered nationwide, unlocking valuable insights about a recent product, service, orbrand is possible. This can be helpful to solve large-scale network monitoring problems of MNOs in a cost-effective manner using the power of crowds. For example, analyzing large-scale test results from end-usersprovides the opportunity to understand network service performance, relate anomalies based on KPIs tests withother datasets (e.g., social media data), and study the evolution of network performance over the observationtime. For MNOs, this analysis is useful to build accurate models that can help in building smarter nextgeneration infrastructure. Additionally, extracting knowledge from crowdsourced data is especially valuable asit can enable the development of fine-grained business models.
To obtain valuable information from wireless 4G cellular networks using a crowdsourced dataset, utiliza-tion of appropriate statistical and intelligent analytic techniques is needed. In this light, a natural questionarises: how can crowdsourced data and statistics help us to extract insight into performances of MNOs as wellas their competitors’ wireless networks? Contributing to the solution of this question, in this paper we utilize areal-world proprietary KPI observations dataset that is built by experiments performed by different MNOs’ UEson large-scale geographical locations over a long period. Using statistical analysis methods on this dataset, wefocus on end-to-end performance comparisons of three major MNOs in Turkey1. Our results reveal the impactof location based on latency, reliability, and PL KPIs of different MNOs providing nationwide coverage.
1GSMA (2019). Definitive data and analysis for the mobile industry [online]. Website https://www.gsmaintelligence.com[accessed 09 October 2019].
381
ZEYDAN and YILDIRIM/Turk J Elec Eng & Comp Sci
2. Related workIn this section, we will classify the related works into three broad categories, namely network performancemeasurements, crowdsourced data, and reliability aspects.
2.1. Network performance measurements
For extracting knowledge from mobile network performance measurements, there are various works in theliterature for network planning [5–8] and for analyzing KPI performance differences of MNOs [9–11]. Arecent enabler technology that provides low-latency and ultrahigh reliable communication services is givenelsewhere [8]. Coverage analysis based on Base Station (BS) KPIs to reduce drive test and field measurementcost using big data analytics is proposed [12]. A case study targeting dropped calls and bad quality-of-serviceminimization is provided [6]. In order to identify variance in end-to-end performance of network behavior, space-and time-based properties of network performances of different carriers are analyzed [9]. A previous study [10]investigated interactions between radio layers, network protocols, and applications and their effects on 4G LongTerm Evolution (LTE) network performance. The impact of packet size on one-way delay for the Download(DL) in 3G mobile networks using measurements from several Swedish mobile operators is shown [11].
In a recent work performed in the UK [13], it is shown that the network performance effects are quiteimportant and play an important role in terms of end-users’ choice of MNOs. Similarly, the significantpositive impact of network effects on the demand for mobile services and end-user’s decisions is demonstratedby analyzing the data from January 1998 to June 2003 in Germany [14]. Experimental results on networkperformances of 12 commercial mobile operators across Europe are described [15]. Finally, large-scale cellularnetwork traffic collected from thousands of BSs for traffic modeling purposes is analyzed [16]. However, inmost of the above cases, network performance measurements and comparisons between MNOs are done eitherusing small-scale datasets collected via experimental trials (such as drive tests with devices capable of collectingKPI data using multiple MNO subscriber identification module (SIM) cards) or lack appropriate comparativereliability analysis using large-scale crowdsourced datasets collected from thousands of UEs.
2.2. Crowdsourced dataCrowdsourced datasets are useful for the analysis and exploration of the MNOs’ performances. There arenumerous works employing different aspects of crowdsourced data for better network optimization in MNOs [17,18]. Using Austrian Regulatory Authority for Broadcasting and Telecommunications (RTR) Open Data (acrowdsourced dataset) 2, Kousias et al. [17] investigated the effect of different features that distinguishedMNOs from each other. On the other hand, Apajalahti et al. [18] used both RTR Nettest and Netradar [19]crowdsourced datasets to design a feature mapping strategy between those datasets. A set of quality-of-service(QoS)-related metrics that are crowdsourced from the UEs are used to analyze the MNOs network performancesunder stringent ElectroMagnetic Field (EMF) constraints and regulations [20]. Fida and Marina [21] rely oncrowdsourced data to provide coverage maps of different MNOs and also focus on coverage map accuracy fromthe perspective of device diversity. Compared to most of the existing analysis based on using crowdsourceddatasets, in this work we focus on understanding the comparative behaviors of the performance of MNOs usingspecific network infrastructure KPIs (e.g., calculated reliability together with packet loss and latency KPIs) on
2NETZTEST (2019). RTR – NetTest [online]. Website https://www.netztest.at/en/ [accessed 09 October 2019].
382
ZEYDAN and YILDIRIM/Turk J Elec Eng & Comp Sci
a large scale (i.e. in nationwide locations with thousands of measurements over a long period of duration ofmajor MNOs’ metrics in Turkey).
2.3. Reliability
The reliability metric has been the focus of the 5G era for mission-critical services that require URLLC [22–24].URLLC cases demand 99.999% network reliability and 1 ms latency [25]. In general, it specifies that packetsare successfully delivered while the latency bound is satisfied. However, other definitions also exist includingreliability definition by 3GPP, reliability per node, and control channel reliability [2, 8]. A low cost portablemeasurement framework to quantify the end-to-end latency and reliability metrics of communication links isgiven [24]. Qu et al. [22] introduced a REliability-Aware service CHaining (REACH) framework to ensurereliable service chaining with Virtual Network Functions (VNFs). In another paper [23], the authors propose asoftwarized 5G architecture to ensure end-to-end reliability of network services such as mission-critical traffic.Although there have been many works on ensuring reliability aspects for MNOs, no experimental evaluationshave been devised for comparisons of different MNOs in terms of their composite metrics such as reliabilityusing a crowdsourced dataset. In our previous related work, we investigated the performance of three MNOsin terms of latency, DL/Upload (UL) speed, jitter, and PL [26]. Different from our previous analysis, in thepresent paper we extend these comparison ideas into combining different metrics to evaluate the performanceof MNOs in terms of their reliability.
2.4. Our contributionsThe statistical comparative performance analysis of major MNOs is still an open and active research area whereMNOs, users, and service providers are willing to know how well their horizontal and vertical competitorsare performing in certain regions of their operating country. In this paper, different from the previous worksoutlined above, we analyze the end-to-end performance comparisons of MNOs based on reliability and PL KPIsusing statistical confidence interval (CI) for proportions analysis as our basis methodology. Compared to thestate-of-the-art, our MNO reliability analysis contributions are mainly focusing on a real-world proprietarycrowdsourced network performance test dataset collected from thousands of UEs over a period of 13 months inTurkey, which is different from pure simulation-based analysis that relies mostly on synthetic data generators.A summary of our key findings is given as follows:
• A framework that invokes statistical techniques using crowdsourced data and extracts MNO networksperformances in different cities in Turkey is proposed where the visualization is done using the Foliumvisualization tool’s interactive map.
• Statistical approaches suitable for comparisons of MNOs are proposed according to different KPIs suchas reliability and PL.
• Our results indicate that there may be major variations in end-to-end network performances betweenMNOs based on different geographical regions of Turkey and ordered list of reliability performancecomparisons of analyzed MNOs do not change when latency and PL ratio requirements vary.
Table 1 provides the notations and their corresponding descriptions that are used throughout the rest ofthe paper. Within the paper, sets are denoted by uppercase calligraphic letters such as N and L . The rest of thepaper is organized as follows: in Section 3, we provide the system model and architecture. In Section 4 we provide
383
ZEYDAN and YILDIRIM/Turk J Elec Eng & Comp Sci
requirements for reliability and concepts for statistical calculation analysis using performance comparisons ofproportions. In Section 5, we provide evaluation results for comparisons of major MNOs in Turkey. Finally, inSection 6 we provide the conclusions and future work.
Table 1. Notations and their corresponding descriptions.
Notation Description Notation Description
L Number of test-sitelocations
γEnd-to-end
latency target
K Number ofKPIs
se Standard error
M Number ofMNOs
Nm
Total number ofobservationsfor MNO-m
λBLERtarget
PmPL or reliabilityratio for MNO-m
βTarget amount of transmitted
data in bytesCI Confidence interval
α Significance level zx X-quantile of N (0, 1)
N (0, 1)Complex Gaussian distribution
with zero mean and unit variance— —
3. System model and architecture
3.1. Network modelThe present paper studies the 4G network performances of major MNOs using a dataset that contains KPIssuch as PL and latency (due to RTT) as end-to-end performance metrics. Moreover, we also compute thereliability metric by analyzing whether the general requirements based on PL, latency, and transmitted datasize are satisfied. Formally, we assume that there are L test-site locations, K KPIs, and M MNOs in total inour system. We denote the MNO set as M = {1, 2, . . . ,M} , the test-site locations set as L = {1, 2, . . . , L} , andthe KPI set as K = {1, 2, . . . ,K} . Our focus is on comparative KPI performance differences of MNOs operatingnationwide in different regions or cities. Focusing on UE level measurements, we identify the impact of locationon MNO performance. To make fair comparisons for performance, we utilize CI for the mean difference thatis utilized in unpaired comparison scenarios, i.e. the case when the number of measurements over a specifiedregion is different.
3.2. Data collection procedure
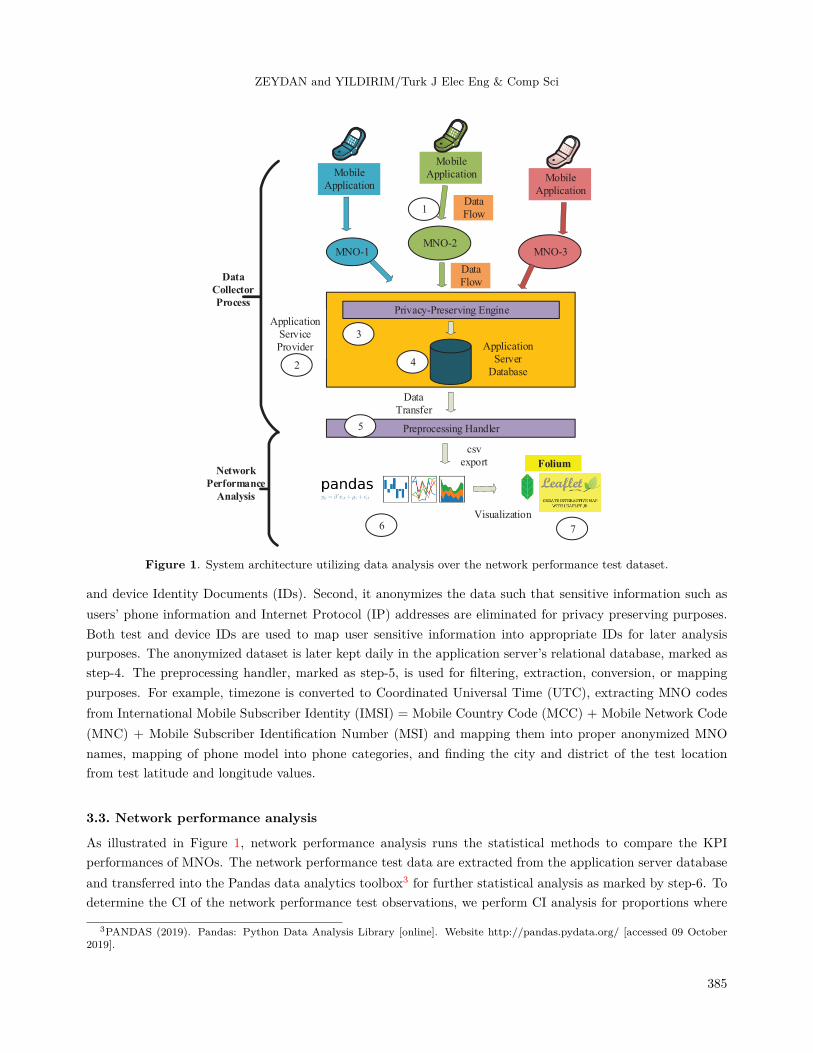
Figure 1 demonstrates the system level architecture for utilizing data analysis over the network performancetest dataset for an example of three MNOs. As illustrated in Figure 1, the data collection process for obtainingthe data involves several steps. First, UEs perform the measurement tests via a network performance testapplication installed in the mobile UE of each MNO and send the measured KPI values into the applicationservice provider marked as data flow in step-1. The application service provider, marked as step-2, has aprivacy preserving unit, marked as step-3, which performs two main tasks. First, it generates unique test
384
ZEYDAN and YILDIRIM/Turk J Elec Eng & Comp Sci
MNO-1MNO-2
MNO-3
Network
Performance
Analysis
Data
Transfer
csv
export
Mobile
Application
Mobile
ApplicationMobile
Application
Data
Collector
Process
Data
Flow
Privacy-Preserving Engine
Preprocessing Handler
Application
Server
Database
Folium
Visualization
Application
Service
Provider
Data
Flow1
2
3
4
5
6 7
Figure 1. System architecture utilizing data analysis over the network performance test dataset.
and device Identity Documents (IDs). Second, it anonymizes the data such that sensitive information such asusers’ phone information and Internet Protocol (IP) addresses are eliminated for privacy preserving purposes.Both test and device IDs are used to map user sensitive information into appropriate IDs for later analysispurposes. The anonymized dataset is later kept daily in the application server’s relational database, marked asstep-4. The preprocessing handler, marked as step-5, is used for filtering, extraction, conversion, or mappingpurposes. For example, timezone is converted to Coordinated Universal Time (UTC), extracting MNO codesfrom International Mobile Subscriber Identity (IMSI) = Mobile Country Code (MCC) + Mobile Network Code(MNC) + Mobile Subscriber Identification Number (MSI) and mapping them into proper anonymized MNOnames, mapping of phone model into phone categories, and finding the city and district of the test locationfrom test latitude and longitude values.
3.3. Network performance analysis
As illustrated in Figure 1, network performance analysis runs the statistical methods to compare the KPIperformances of MNOs. The network performance test data are extracted from the application server databaseand transferred into the Pandas data analytics toolbox3 for further statistical analysis as marked by step-6. Todetermine the CI of the network performance test observations, we perform CI analysis for proportions where
3PANDAS (2019). Pandas: Python Data Analysis Library [online]. Website http://pandas.pydata.org/ [accessed 09 October2019].
385
ZEYDAN and YILDIRIM/Turk J Elec Eng & Comp Sci
proportion is defined as the percentage of reliability or PL. At certain times of the month, one MNO can yieldbetter latency or lower PL performance than other MNOs. This is expected due to randomness in the numberof test data samples and wireless network. Therefore, the statistics on such random sampled data need to bespecified in CIs. In the present paper, we study an unpaired comparison case where there is no one-to-onecorrespondence between the network test data observations of MNOs [27]. After comparisons are calculated,data visualizations over the map are performed using Folium & Leaflet interactive maps4, marked as step-7 inFigure 1.
4. Reliability and packet loss analysisTo compare the performance of MNOs, providing high reliability is a critical requirement for performing a stabledata exchange between the UEs and the content. Reliability performance can also be a differentiating factorfor MNOs. In general, 4G systems’ reliability performance is good where the typical BLER (or PL ratio inthis paper) is around 10−2 to 10−3 [28]. Depending on the applications, some may also require much higherreliability together with low latency (e.g., 10 ms for some URLLC applications such as cooperative collisionavoidance system (CCAS) [29]). On the other hand, it is difficult to achieve both high reliability and low latencysimultaneously. For our analysis, we aim to meet the following reliability requirement:
• PL < λ for the transmission of β bytes with an end-to-end latency of γ ms.
4.1. CI for packet loss ratio and reliability percentagesTo calculate unpaired PL performance comparisons of MNOs based on those collected unpaired and independentKPI-k ∈ K observations between MNOs, we compute the sample means of reliability percentages and PL ratiosand then utilize the statistical difference of two observations to conclude about performance advantages orweaknesses of a given MNO compared to other MNOs. For calculating PL CI, we utilize CI analysis forproportions method [27]. For proportions, we calculate the average ratio of PL at each geographic location-l∈ L over the observation duration for all MNO-m ∈ M and KPI-k ∈ K .
To compare two MNOs using the difference between two means of reliability and PL ratios, we utilize theCI for comparative studies method. When two observations are independent of each other, the standard errorfor the difference between two means of observations is
sm,ne (k, l) =
√(sme (k, l))2 + (sne (k, l))
2,
∀m,n ∈ M,m ̸= n, ∀k ∈ K,∀l ∈ L,
where sme (k, l) and sne (k, l) are the standard error of the observation KPI-k ∈ K for MNO-m and MNO-n∈ M , respectively, for a given geographic location-l ∈ L . The standard error is calculated as
sme (k, l) =
√pm(k, l)(1− pm(k, l))
Nm,
∀m ∈ M, k ∈ K,∀l ∈ L,
(1)
4FOLIUM (2019). Folium: Python Data Visualization [online]. Website https://folium.readthedocs.io/en/latest/ [accessed 09October 2019].
386

ZEYDAN and YILDIRIM/Turk J Elec Eng & Comp Sci
where the PL ratio (or reliability) for Nm observations is pm(k, l) for the m-th MNO and location l . Ifnormal approximation of binomial distribution with Nmpm(k, l) ≥ 10 exists, the confidence interval for the PLratio or reliability percentage can be calculated as
CIm(k, l) = pm(k, l)± z1−α/2sme (k, l),
∀m ∈ M, k ∈ K,∀l ∈ L,(2)
where α denotes the significance level and z1−α/2 denotes the (1 − α/2) -quantile of N (0, 1) . Thus, aconfidence level of (1-α)100% in calculating CIm,n(k, l) for the differences between two PL ratios (or reliabilitypercentages) is given by
p̄m(k, l)− p̄n(k, l)± z[1−α2 ]s
m,ne (k, l),
∀m,n ∈ M,m ̸= n, ∀k ∈ K,∀l ∈ L,(3)
where p̄m(k, l) is the average PL ratio (or reliability) over all observations. After observing the CIvalue of (3), if the CI contains zero within this (1-α)100% confidence interval, then the statistical difference isinsignificant and no conclusions can be drawn based on the PL (or reliability) ratios of two MNOs.
5. Evaluation resultsFor evaluation results of three MNOs, anonymized data are collected offline on a daily basis according to thedata collector process of Section 3.2 and transferred into the network performance test database for a periodof 13 months ranging from January 2017 to February 2018. The statistics of the measurement tests are givenin Table 2 for all MNOs, which yields a relatively large sample size for fair comparisons. To obtain graphicalresults, we have utilized Python’s seaborn statistical data visualization library5.
The network performance test measurements are done by ''real users '', i.e. the users of MNOs themselvesperforming tests at different nationwide locations and times using the preinstalled applications on their UEs.These users measure the network performance of their MNOs at certain positions (which can be enterprises,homes, airports, shopping centers, etc). Note also that not all experiments done by the users of each MNO areusing the same infrastructure, i.e. different network infrastructures (radio access network (RAN) and transportand core networks). Moreover, the amounts of data used for comparisons are at city-scale or nationwide.
5.1. Parameters for comparisonsFor our evaluation results, we have selected the reliability requirements for λ and γ values as the mean valuesof PL ratios and latency, respectively, of all measurements in Turkey as also given in Table 2. Therefore, theaverage reliability in Table 2 is also given with respect to these selected values.
For our MNOs comparisons, without loss of generality, we have selected the numerical requirementsλ = 0.007 (mean nationwide PL ratio) and γ = 28.279 ms (mean nationwide latency) for transmitting β = 32
bytes of data transmission size. Note that these requirements can also be selected to correspond to specificapplication requirements, which is outside the scope of this paper. To make fair comparisons, we have alsoassumed that latency is linearly proportional to transmitted data size and have updated all latency values with
5SEABORN (2019). Seaborn: Statistical Data Visualization [online]. Website https://seaborn.pydata.org/ [accessed 09 October2019].
387
ZEYDAN and YILDIRIM/Turk J Elec Eng & Comp Sci
respect to transmission of β = 32 bytes (which is similar to 3GPP defined definition in [2]), i.e all experiments’latency values are multiplied by a factor of 32/xi , where xi is the transmitted data size of the i -th experiment.
Table 2. Nationwide network performance test data statistics in Turkey for 4G network tests.
# of measurements 648,966 # of cities 81# of districts 890 λ, PL (avg.) 0.007M 3 γ, Latency (avg., ms) 28.279Reliability (avg. %) 75 Obser. duration 13 monthsConfidence level 90% Total # of UE 209,776
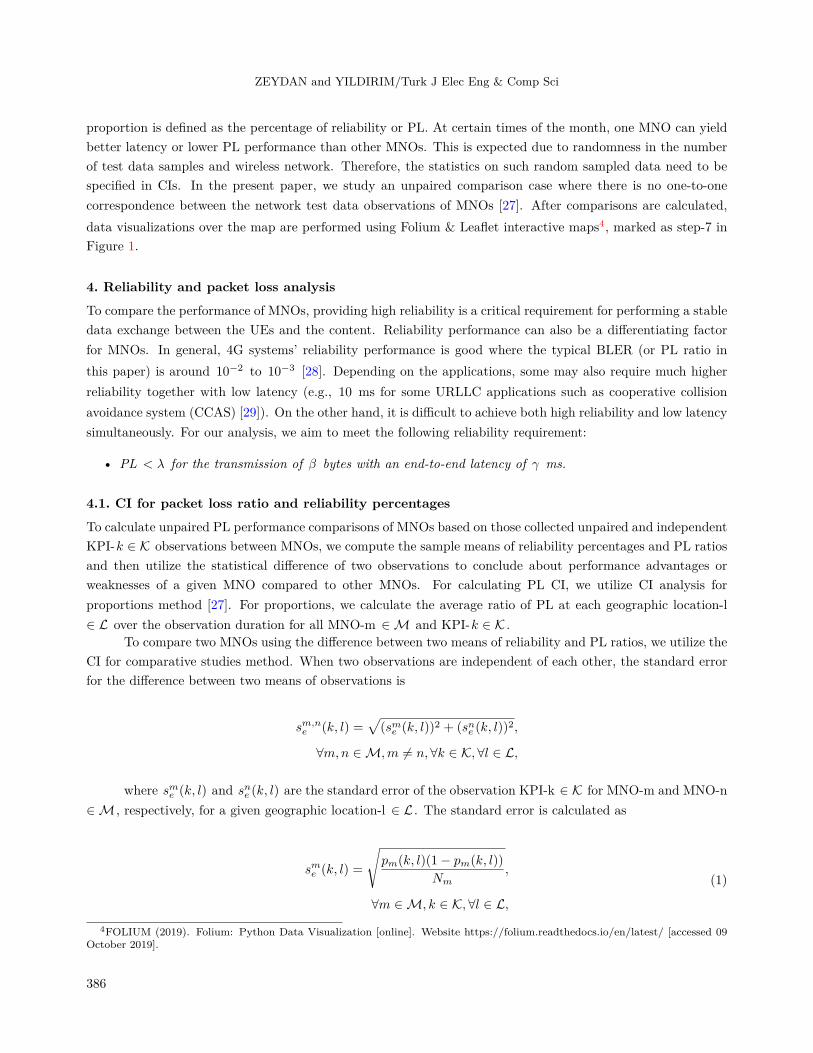
Table 3 shows the Coefficient of Variation (CoV) (=stdv/mean) value comparisons of PL and latencynationwide. We can observe high CoV values in PL for MNO-3 and in latency for MNO-2. The numberof observations of the three MNOs are 425, 301 , 27, 269 and 196, 396 for MNO-1, MNO-2, and MNO-3,respectively.
Table 3. Comparisons of CoV values of observed KPI nationwide.
CoV MNO-1 MNO-2 MNO-3PL 7.988 5.814 18.678Latency 0.770 0.983 0.960
Figure 2 shows the violin plot of latency distributions in all Turkey using the Seaborn data visualizationlibrary. We can observe that the median value (marked as a white dot in all figures) of MNO-2 is higher thanthat of the other MNOs and most of the observations of all MNOs are observed to be below median values.
0 20 40 60 80 100 120 140
latency…(ms)
MNO-1
MNO-2
MNO-3
Figure 2. Latency violin plot of three major MNOs in Turkey.
5.2. Performance difference of MNOs across different geographical regions
In this subsection, we investigate the performance differences of MNOs with respect to reliability and PL indifferent city locations in Turkey. We also visualize the CI data using the Folium interactive heatmap tool.
5.2.1. Reliability results and CI visualizations
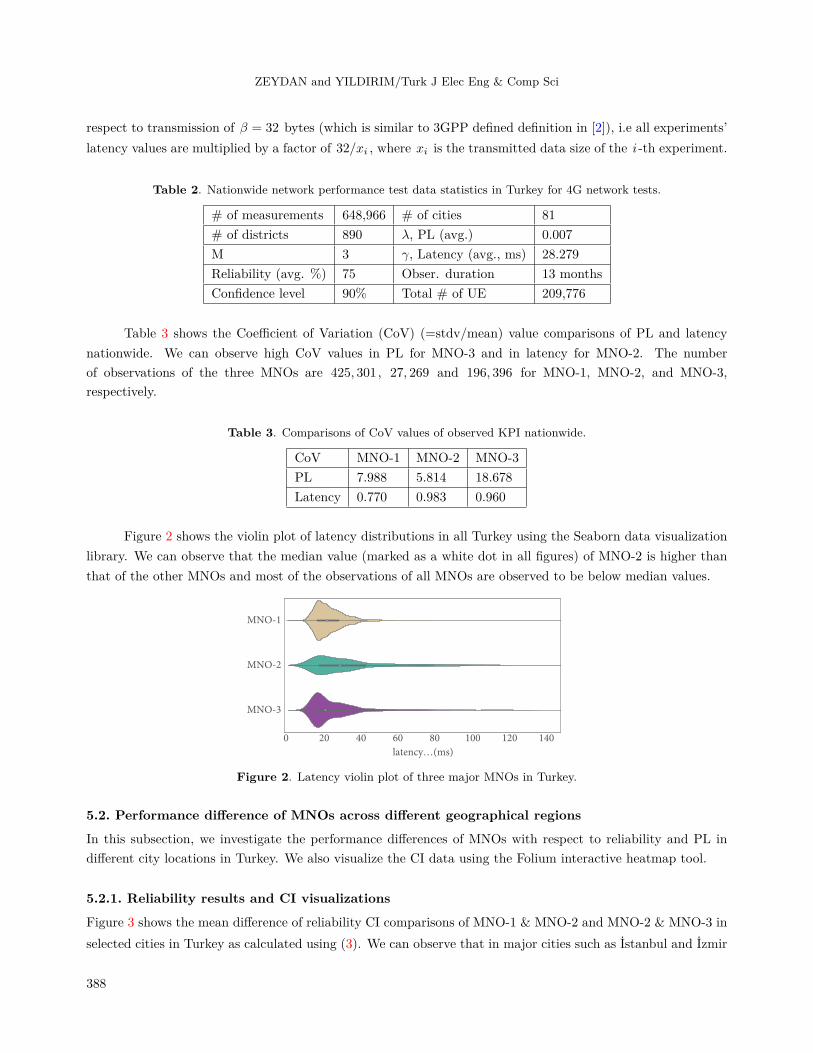
Figure 3 shows the mean difference of reliability CI comparisons of MNO-1 & MNO-2 and MNO-2 & MNO-3 inselected cities in Turkey as calculated using (3). We can observe that in major cities such as İstanbul and İzmir
388
ZEYDAN and YILDIRIM/Turk J Elec Eng & Comp Sci
MNO-1 performs better than MNO-2 and MNO-3 performs better than MNO-2 (note that a similar trend isalso observed in Adana). In the other big city, Ankara, MNO-1 is again better than MNO-2, whereas MNO-2has better reliability than MNO-3 (note that a similar trend is also observed in Çorum). In small cities suchas Çankırı and Bitlis, we cannot conclude with 90% confidence levels that MNO-1 or MNO-2 is better thanthe other. Moreover, CI levels in those cities are higher due to the existence of relatively small numbers ofobservations (around 0.196% of all observations). Similarly, for Mardin and Kırıkkale, no decisions can beinferred when MNO-2 and MNO-3 are compared.
Adana Ankara Bitlis Çankırı Çorum İstanbul İzmir Kırıkkale Mardin Yalova
cities
relia
bilit
y m
ean
diff
eren
ce
-0.8
-0.6
-0.4
-0.2
0.0
0.2
0.4
0.6
0.8
MNO-1 MNO-2
MNO-2 MNO-3
Figure 3. Mean difference reliability CI comparisons of MNO-1–MNO-2 and MNO-2–MNO-3 in selected cities in Turkeywhen λ=0.07, β=32 bytes, and γ=28.279 ms.
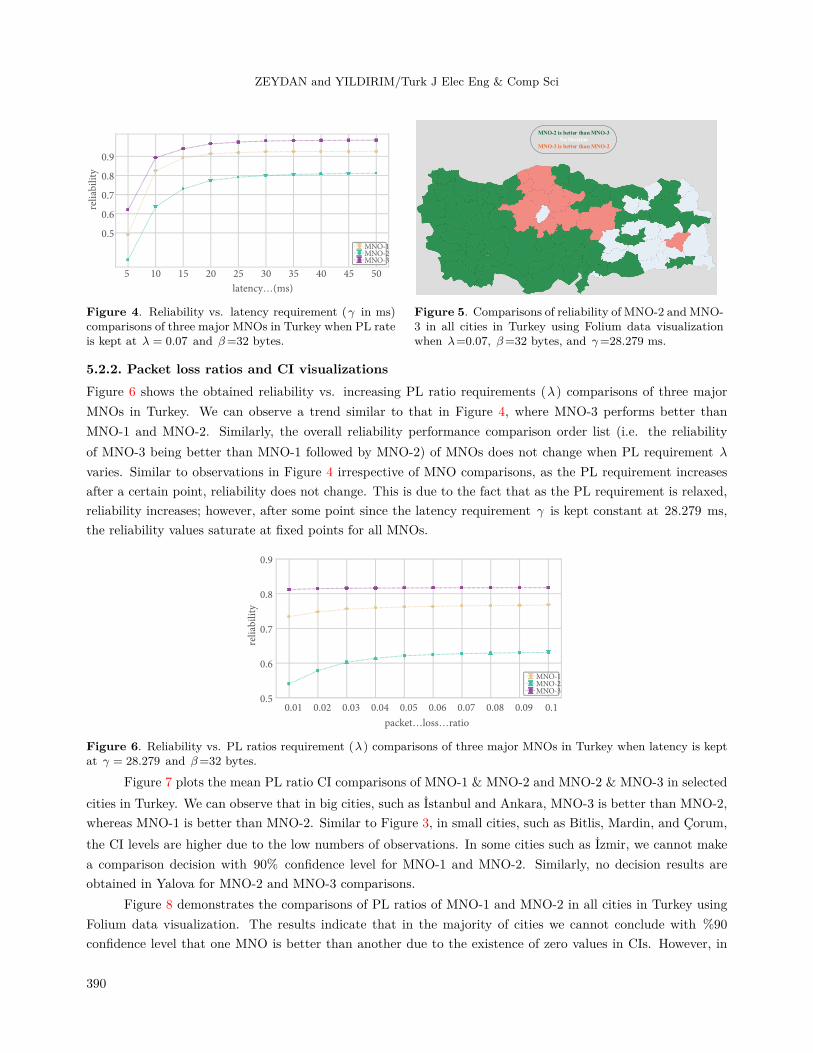
Figure 4 shows the obtained reliability versus increasing latency (ms) requirements (γ ) graph for compar-isons of three major MNOs in Turkey. Note that we have also shown CI values for each point using Eq. (2). Wecan easily observe that MNO-3 performs the best, followed by MNO-1 and MNO-2. We can also observe that aslatency requirement γ increases, the trend for performance order differences between MNOs does not change,i.e. MNO-3 performs the best, followed by MNO-1 and MNO-2. Moreover, irrespective of MNO comparisons,it is observed that, as the latency requirement increases, after a certain point reliability does not change. Thisis due to the fact that as the latency requirement is relaxed reliability increases; however, after some point sincethe PL rate requirement λ is kept constant at 0.07 , the reliability values saturate at fixed points for all MNOs.
For general reliability comparisons of MNO-2 and MNO-3 in all cities in Turkey, we plot Figure 5 usingFolium data visualization. From this figure, we can easily observe that MNO-2 is better than MNO-3 in themajority of cities in western and southern regions, whereas MNO-3 performs better in the central regions ofthe country. We cannot conclude with 90% confidence level that MNO-2 or MNO-3 is better than the other ineastern cities of the country, which are marked in white.
389
ZEYDAN and YILDIRIM/Turk J Elec Eng & Comp Sci
5 10 15 20 25 30 35 40 45 50
latency…(ms)
reliab
ilit
y
0.5
0.6
0.7
0.8
0.9
MNO-1MNO-2MNO-3
Figure 4. Reliability vs. latency requirement (γ in ms)comparisons of three major MNOs in Turkey when PL rateis kept at λ = 0.07 and β=32 bytes.
MNO-2 is better than MNO-3
No Decision
MNO-3 is better than MNO-2
Figure 5. Comparisons of reliability of MNO-2 and MNO-3 in all cities in Turkey using Folium data visualizationwhen λ=0.07, β=32 bytes, and γ=28.279 ms.
5.2.2. Packet loss ratios and CI visualizationsFigure 6 shows the obtained reliability vs. increasing PL ratio requirements (λ) comparisons of three majorMNOs in Turkey. We can observe a trend similar to that in Figure 4, where MNO-3 performs better thanMNO-1 and MNO-2. Similarly, the overall reliability performance comparison order list (i.e. the reliabilityof MNO-3 being better than MNO-1 followed by MNO-2) of MNOs does not change when PL requirement λ
varies. Similar to observations in Figure 4 irrespective of MNO comparisons, as the PL requirement increasesafter a certain point, reliability does not change. This is due to the fact that as the PL requirement is relaxed,reliability increases; however, after some point since the latency requirement γ is kept constant at 28.279 ms,the reliability values saturate at fixed points for all MNOs.
0.01 0.02 0.03 0.04 0.05 0.06 0.07 0.08 0.09 0.1
packet…loss…ratio
reliab
ilit
y
0.5
0.6
0.7
0.8
0.9
MNO-1MNO-2MNO-3
Figure 6. Reliability vs. PL ratios requirement (λ) comparisons of three major MNOs in Turkey when latency is keptat γ = 28.279 and β=32 bytes.
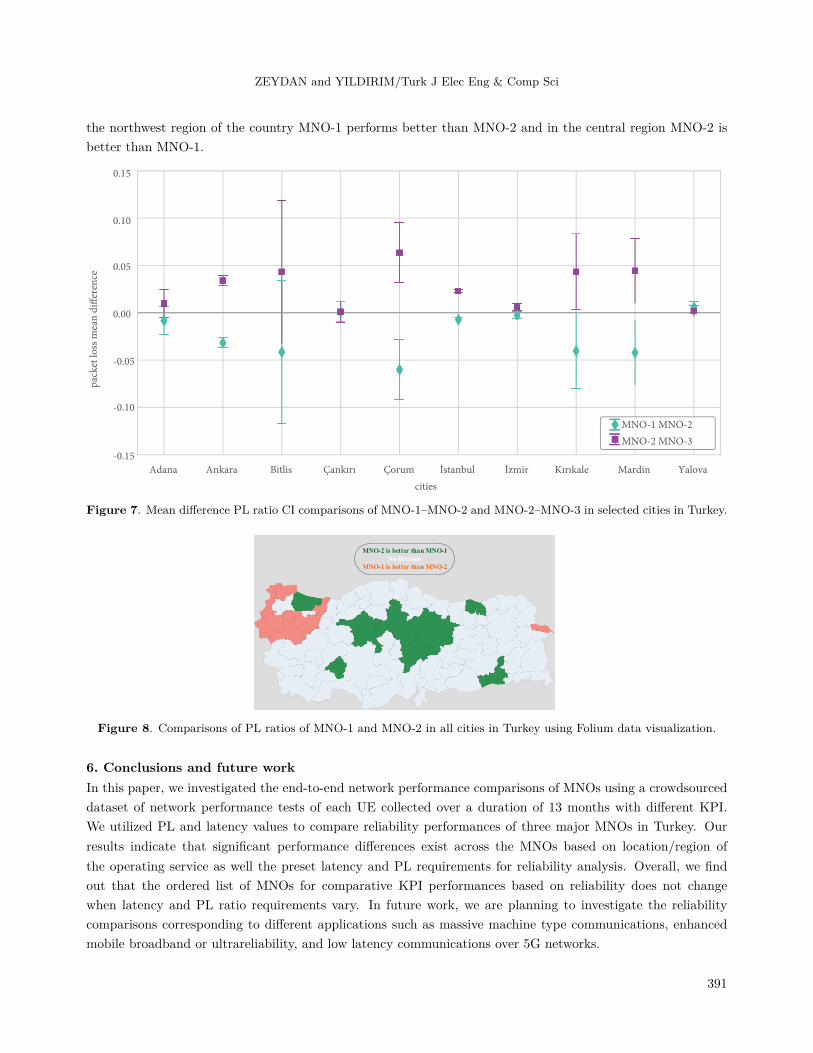
Figure 7 plots the mean PL ratio CI comparisons of MNO-1 & MNO-2 and MNO-2 & MNO-3 in selectedcities in Turkey. We can observe that in big cities, such as İstanbul and Ankara, MNO-3 is better than MNO-2,whereas MNO-1 is better than MNO-2. Similar to Figure 3, in small cities, such as Bitlis, Mardin, and Çorum,the CI levels are higher due to the low numbers of observations. In some cities such as İzmir, we cannot makea comparison decision with 90% confidence level for MNO-1 and MNO-2. Similarly, no decision results areobtained in Yalova for MNO-2 and MNO-3 comparisons.
Figure 8 demonstrates the comparisons of PL ratios of MNO-1 and MNO-2 in all cities in Turkey usingFolium data visualization. The results indicate that in the majority of cities we cannot conclude with %90
confidence level that one MNO is better than another due to the existence of zero values in CIs. However, in
390
ZEYDAN and YILDIRIM/Turk J Elec Eng & Comp Sci
the northwest region of the country MNO-1 performs better than MNO-2 and in the central region MNO-2 isbetter than MNO-1.
Adana Ankara Bitlis Çankırı Çorum İstanbul İzmir Kırıkale Mardin Yalova
cities
pac
ket
loss
mea
n d
iffer
ence
-0.15
-0.10
-0.05
0.00
0.05
0.10
0.15
MNO-1 MNO-2
MNO-2 MNO-3
Figure 7. Mean difference PL ratio CI comparisons of MNO-1–MNO-2 and MNO-2–MNO-3 in selected cities in Turkey.
MNO-2 is better than MNO-1
No Decision
MNO-1 is better than MNO-2
Figure 8. Comparisons of PL ratios of MNO-1 and MNO-2 in all cities in Turkey using Folium data visualization.
6. Conclusions and future workIn this paper, we investigated the end-to-end network performance comparisons of MNOs using a crowdsourceddataset of network performance tests of each UE collected over a duration of 13 months with different KPI.We utilized PL and latency values to compare reliability performances of three major MNOs in Turkey. Ourresults indicate that significant performance differences exist across the MNOs based on location/region ofthe operating service as well the preset latency and PL requirements for reliability analysis. Overall, we findout that the ordered list of MNOs for comparative KPI performances based on reliability does not changewhen latency and PL ratio requirements vary. In future work, we are planning to investigate the reliabilitycomparisons corresponding to different applications such as massive machine type communications, enhancedmobile broadband or ultrareliability, and low latency communications over 5G networks.
391
ZEYDAN and YILDIRIM/Turk J Elec Eng & Comp Sci
Acknowledgments
This work was partially funded by Spanish MINECO grant TEC2017-88373-R (5G-REFINE) and by Generalitatde Catalunya grant 2017 SGR 1195.
References
[1] IEEE 5G Initiative Technology Roadmap Working Group. IEEE 5G and Beyond Technology Roadmap. WhitePaper 2017.
[2] 3GPP Technical Specification Group Radio Access Network. Study on scenarios and requirements for next generationaccess technologies. TR 38.913 V15.0.0 (Release 15) 2018.
[3] Benjebbour A, Kitao K, Kakishima Y, Na C. 3GPP defined 5G requirements and evaluation conditions. NTTDOCOMO Technical Journal 2018; 3: 13-23.
[4] Faggiani A, Gregori E, Lenzini L, Valerio L, Vecchio A. Smartphone-based crowdsourcing for network monitor-ing: opportunities, challenges, and a case study. IEEE Communications Magazine 2014; 52 (1): 106-113. doi:10.1109/MCOM.2014.6710071
[5] Zeydan E, Bastug E, Bennis M, Kader MA, Karatepe IA et al. Big data caching for networking: moving from cloudto edge. IEEE Communications Magazine 2016; 54 (9): 36-42. doi: 10.1109/MCOM.2016.7565185
[6] Baldo N, Giupponi L, Mangues-Bafalluy J. Big data empowered self organized networks. In: Proceedings of 20thEuropean Wireless Conference; Barcelona, Spain; 2014. pp. 1-8.
[7] Narmanlioglu O, Zeydan E, Kandemir M, Kranda T. Prediction of active UE number with Bayesian neural networksfor self-organizing LTE networks. In: Proceedings of Network of Future Conference; London, UK; 2017.
[8] Bennis M, Debbah M, Poor HV. Ultra reliable and low-latency wireless communication: tail, risk, and scale.Proceedings of the IEEE 2018; 106 (10): 1834-1853. doi: 10.1109/JPROC.2018.2867029
[9] Nikravesh A, Choffnes DR, Katz-Bassett E, Mao ZM, Welsh M. Mobile network performance from user devices: alongitudinal, multidimensional analysis. In: Proceedings of International Conference on Passive and Active NetworkMeasurement; Los Angeles, CA, USA; 2014. pp. 12-22.
[10] Nikravesh A, Guo Y, Qian F, Mao ZM, Sen S. An in-depth understanding of multipath TCP on mobile devices:measurement and system design. In: Proceedings of the 22nd Annual International Conference on Mobile Computingand Networking; New York, NY, USA; 2016. pp. 189-201.
[11] Arlos P, Fiedler M. Influence of the packet size on the one-way delay in 3G networks. In: Proceedings of InternationalConference on Passive and Active Network Measurement; Zurich, Switzerland; 2010. pp. 61-70.
[12] Celebi OF, Zeydan E, Kurt OF, Dedeoglu O, Ileri O et al. On use of big data for enhancing network coverageanalysis. In: Proceedings of International Conference on Telecommunications; Casablanca, Morocco; 2013. pp. 1-5.
[13] Birke D, Swann GMP. Network effects and the choice of mobile phone operator. In: Cantner U, Malerba F (editors).Innovation, Industrial Dynamics and Structural Transformation. Berlin, Germany: Springer-Verlag, 2018, pp. 109-128.
[14] Doganoglu T, Grzybowski L. Estimating network effects in mobile telephony in Germany. Information Economicsand Policy 2007; 19 (1): 65-79. doi: 10.1016/j.infoecopol.2006.11.001
[15] Mancuso V, Quirós MP, Midoglu C, Moulay M, Comite V et al. Results from running an experiment as aservice platform for mobile broadband networks in Europe. Computer Communications 2019; 133: 89-101. doi:10.1016/j.comcom.2018.09.004
[16] Xu F, Li Y, Wang H, Zhang P, Jin D. Understanding mobile traffic patterns of large scale cellular tow-ers in urban environment. IEEE/ACM Transactions on Networking (TON) 2017; 25 (2): 1147-1161. doi:10.1109/TNET.2016.2623950
392

ZEYDAN and YILDIRIM/Turk J Elec Eng & Comp Sci
[17] Kousias K, Midoglu C, Alay O, Lutu A, Argyriou A et al. The same, only different: contrasting mobile operatorbehavior from crowdsourced dataset. In: Proceedings of IEEE 28th Annual International Symposium on Personal,Indoor, and Mobile Radio Communications; Montreal, Canada; 2017. pp. 1-6.
[18] Apajalahti K, Walelgne EA, Manner J, Hyvönen E. Correlation-based feature mapping of crowdsourced LTEdata. In: Proceedings of IEEE 29th Annual International Symposium on Personal, Indoor and Mobile RadioCommunications; Bologna, Italy; 2018. pp. 1-7.
[19] Sonntag S, Manner J, Schulte L. Netradar - measuring the wireless world. In: Proceedings of 11th InternationalSymposium and Workshops on Modeling and Optimization in Mobile, Ad Hoc and Wireless Networks; TsukubaScience City, Japan; 2013. pp. 29-34.
[20] Chiaraviglio L, Galán-Jiménez J, Fiore M, Blefari-Melazzi N. Not in my neighborhood: a user equipment per-spective of cellular planning under restrictive EMF limits. IEEE Access 2019; 7: 6161-6185. doi: 10.1109/AC-CESS.2018.2888916
[21] Fida M, Marina MK. Impact of device diversity on crowdsourced mobile coverage maps. In: Proceedings of 14thInternational Conference on Network and Service Management; Rome, Italy; 2018. pp. 348-352.
[22] Qu L, Khabbaz M, Assi C. Reliability-aware service chaining in carrier-grade softwarized networks. IEEE Journalon Selected Areas in Communications 2018; 36 (3): 558-573. doi: 10.1109/JSAC.2018.2815338
[23] Petrov V, Lema M, Gapeyenko M, Antonakoglou K, Moltchanov D et al. Achieving end-to-end reliability of mission-critical traffic in softwarized 5G networks. IEEE Journal on Selected Areas in Communications 2018; 36 (3): 485-501.doi: 10.1109/JSAC.2018.2815419
[24] Pocovi G, Kolding T, Lauridsen M, Mogensen R, Markmoller C et al. Measurement framework for assessingreliable real-time capabilities of wireless networks. IEEE Communications Magazine 2018; 56 (99): 1-8. doi:10.1109/MCOM.2018.1800159
[25] Huawei. Indoor 5G Networks (version 2.0). White Paper 2018.
[26] Yildirim A, Zeydan E, Yigit IO. A statistical comparative performance analysis of mobile network operators.Wireless Networks 2018; 1-20. doi: 10.1007/s11276-018-1837-6
[27] Jain R. The Art Of Computer Systems Performance Analysis: Techniques For Experimental Design, Measurement,Simulation, and Modeling. New York, NY, USA: Wiley, 1991.
[28] Ji H, Park S, Yeo J, Kim Y, Lee J et al. Ultra-reliable and low-latency communications in 5G downlink: physicallayer aspects. IEEE Wireless Communications 2018; 25 (3): 124-130. doi: 10.1109/MWC.2018.1700294
[29] Liu J, Wan J, Zeng B, Wang Q, Song H et al. A scalable and quick-response software defined vehicu-lar network assisted by mobile edge computing. IEEE Communications Magazine 2017; 55 (7): 94-100. doi:10.1109/MCOM.2017.1601150
393