Embed Size (px)
Citation preview
NASA Electronic Parts and Packaging (NEPP) Program
NEPP Task:
Reliability of High-Voltage Tantalum Capacitors
(Parts III and IV)
Electrical Engineering Division
Parts, Packaging, and Assembly Technologies Branch
Alexander Teverovsky
Dell Perot Systems
Code 562, NASA GSFC, Greenbelt, MD 20771
September 2010
https://ntrs.nasa.gov/search.jsp?R=20110015254 2018-06-06T03:10:58+00:00Z

Part III. Analysis of Weibull Grading Test for Solid Tantalum Capacitors.
I. Abstract Weibull grading test is a powerful technique that allows selection and reliability rating of solid tantalum capacitors for military and space applications. However, inaccuracies in the existing method and non-adequate acceleration factors can result in significant, up to three orders of magnitude, errors in the calculated failure rate of capacitors. This paper analyzes deficiencies of the existing technique and recommends more accurate method of calculations. A physical model presenting failures of tantalum capacitors as time-dependent-dielectric-breakdown is used to determine voltage and temperature acceleration factors and select adequate Weibull grading test conditions. This model is verified by highly accelerated life testing (HALT) at different temperature and voltage conditions for three types of solid chip tantalum capacitors. It is shown that parameters of the model and acceleration factors can be calculated using a general log-linear relationship for the characteristic life with two stress levels.
Contents I. Abstract ................................................................................................................................... 2
II. Introduction ............................................................................................................................. 3
III. Errors of failure rate estimations............................................................................................. 5
III.1. Errors related to method of calculation ............................................................................ 5
Neglecting early failures ......................................................................................................... 6 Uncertainty in the time to failure and method of approximation ............................................ 7 Statistical variations in the number of failures for high reliability parts ................................ 9 Risk of wear-out degradation ................................................................................................ 11
III.2. Errors related to acceleration factor. ............................................................................... 14 Uncertainty in the rated voltage. ........................................................................................... 14 Uncertainty in the acceleration constant. .............................................................................. 15
IV. Physical model of WGT failures........................................................................................... 16
IV.1. Thermochemical model of time dependent dielectric breakdown .................................. 16
IV.2. Model validation ............................................................................................................. 18
Temperature dependence of breakdown voltages ................................................................. 18 HALT at different test conditions ......................................................................................... 20 Estimation of parameters of the model. ................................................................................ 21
V. Estimation of WGT conditions at different temperatures and voltages. ............................... 22
VI. Discussion ............................................................................................................................. 24 Historical data on AF used for WGT .................................................................................... 24 Reliability AF reported by manufacturers. ........................................................................... 27 Voltage derating. ................................................................................................................... 28

3
VII. Conclusion ............................................................................................................................ 29
VIII. References ............................................................................................................................. 31
II. Introduction As manufactured, electronic components might have a certain proportion of defective parts that would cause failures early during operation, so-called infant mortality (IM) failures. One of the major methods of removing these marginal devices is 100% screening of the lot by applying stresses at or above the maximum operating conditions. This technique is called burn-in (BI) when applied to active devices and magnetics, power conditioning when applied to resistors (e.g. per MIL-PRF-55182), voltage conditioning when applied to ceramic capacitors or wet tantalum capacitors per MIL-PRF-39006, and Weibull grading test (WGT) when applied to solid tantalum capacitors manufactured per MIL-PRF-55365 or MIL-PRF-39003. The specific of WGT is that it not only removes IM failures as a regular BI screen, but does it in a controllable way that allows the determination of the failure rate (FR) of the lot. The original idea of this test that goes back to 1960 was to permit each customer to pay for only as much grading as needed, without the risk of getting too little or overpaying for too much reliability [1].
The period of IM failures is characterized by a decreasing FR with time and distribution of these failures are typically described using a Weibull function with the shape factor, β, below one. It is generally assumed that for electronic components the IM period is followed by a so-called random failure or useful life period when FR levels off. The parts that passed BI assumed to have an exponential distribution of times to failure (or Weibull distribution with β = 1). Following this period, the failure rate might increase due to wear-out mechanisms of degradation with the relevant Weibull distributions having β > 1. In many cases this wear-out period is not achieved under normal operating conditions and reliability of parts is determined by random failures at the level that is verified during extended life testing (typically 10,000 hrs test) by accumulation the necessary amount of device-hours.
An approach that is used for reliability estimations of solid tantalum capacitors is different compared to other established reliability electronic components. It is commonly accepted that tantalum capacitors have no wear-out mechanisms, their FR is declining during long-term operation [1-3], and the distribution of times-to-failure can be adequately described by Weibull functions with β < 1. In this case, by determining parameters of Weibull distribution based on results of WGT it is possible to calculate variations of FR with time and stop the test when the required level is achieved. This gives a conservative estimation of FR because it will further decrease with time, and the reliability of parts during operation should be even better than the calculated value.

4
A combination of BI that is typically a screening procedure and of assessment of FR that is typically a sample-base qualification procedure results in a substantial cost saving and makes WGT one of the most important tests for solid tantalum capacitors. Although life testing is often used for FR verification, conditions of life test per MIL-PRF-55365 are not sufficient to confirm the reliability level for parts with FR below 1%/1000 hr [4]. For this reason manufacturers and users of solid tantalum capacitors are relying on the results of WGT for both, the assurance and verification of the necessary reliability level.
The notion of controllable BI that is in the basis of WGT is very potent because it permits selection of high reliability parts from any lot of tantalum capacitors. Contrary to the common wisdom that reliability cannot be achieved by testing and screening out the defective parts only, but should be built-in in the design, materials, and manufacturing process control, this test allows reduction of FR for any group of devices below the required level. This is often used in practice when tantalum capacitors that are manufactured on the same line within one large lot and considered commercial or military grade parts depending on the level of testing they received. The common wisdom is likely related to devices having a constant failure rate for which BI is not effective and reliability of such parts cannot be improved by screening.
WGT is currently performed typically for 40 hrs at a rated temperature of 85 oC and acceleration of failures is achieved by applying voltages exceeding the rated voltage (VR) up to 1.52 times. Calculations of the test conditions (applied voltage) and reliability grading per MIL-PRF-55365 are based on two assumptions. First is that times to failure of tantalum capacitors can be described with a two-parameter unimodal Weibull distribution that allows for calculation of the failure rate during the testing conditions:
ttFt ))(1ln()( −×−
=βλ , (1a)
where β is the Weibull shape parameter, β < 1, F(t) is the proportion of parts failing by time t, and t is the time of testing.
Second condition is that the voltage acceleration factor is an exponential function of applied voltage, V, that can be written in a simple form:
)exp( uBAF ×= , (1b)
where u is the voltage accelerating parameter, u = V/VR-1, and B = 18.772 is the voltage acceleration constant.
With these assumptions, the failure rate at operating conditions (85 oC and V = VR) is calculated as λ(t)/AF. Equation (1b) was obtained by Navy Crane in the late 1970s for hermetically sealed solid tantalum capacitors [5], and its applicability for contemporary chip tantalum capacitors is questionable [6-7].

5
It will be shown in this paper that errors in FR calculations increase substantially at high levels of voltage acceleration. This might require using another accelerating factor for WGT – temperature. However, literature data on the effect of temperature are limited and contradictory, so currently there is no methodology that would allow testing and calculations of FR at different temperature and voltage conditions.
The importance of WGT for reliability assurance of tantalum capacitors requires a thorough analysis of deficiencies of the used methodology and possible errors in determining failure rate. Some problems related to technical implementation of this test, in particular to detection of failures as blown 1A or 2A fuses, have been discussed before [4]. In this paper we consider possible variations of the calculated FR, estimate errors caused by uncertainty in acceleration factors, and suggest a method for determining WGT conditions at different temperature and voltages based on physics of failure approach. Experimental data will be used to demonstrate the technique of determining AF based on the time dependent dielectric breakdown model (TDDB) and application of general log-linear relationship for characteristic life.
III. Errors of failure rate estimations Results of Weibull grading test can be affected by different factors:
1 Definition of failure and used hardware; 2 Method of approximation of test results with Weibull functions, or method of calculations; 3 Value of acceleration factor used.
The first group of errors mostly due to the definition of failures as blown 1A or 2A fuses has been discussed before, and below we’ll consider errors related to groups 2 and 3 only. Note however, that the original Navy Crane definition of failures during WGT included not blown fuses only, but also post-testing electrical failures. This is an important difference considering that many failures are due to scintillation breakdown events that might not generate a current spike that would cause a fuse to blow, but sufficient to degrade electrical performance of the capacitor, in particular, leakage current and breakdown voltage, and compromise reliability of the part.
III.1. Errors related to method of calculation As was mentioned before, the first stage in determining FR is calculation of parameters of Weibull distributions at accelerated conditions. The following sources of inaccuracy could be attributed to this stage and will be considered below:
• Neglecting early failures; • Uncertainty in the time to failure and method of approximation; • Statistical variations in the number of failures for high reliability parts; • Errors related to the absence of WGT failures.

6
Neglecting early failures
According to MIL-PRF-55365 failures that occur during WGT before 0.25 hr are defined as infant mortality failures and are not used for calculations. However, the slope of distributions during WGT is always assumed to be below 1, which corresponds to a decreasing FR, and all observed failures should be considered as IM failures. Note also, that at V = 1.5VR AF = 20000 and 0.25 hr of WGT corresponds to ~7 months of operation at rated conditions.
A virtual lot of capacitors with a set post-WGT failure rate, λ(tWGT), was generated using a Monte-Carlo method and Weibull-7 software available from ReliaSoft to simulate results of Weibull grade testing. For a given shape factor, β, that is considered the same for accelerated and normal conditions, and accelerating factor, AF, calculated per Eq.(1b) at a given accelerating voltage V = (u+1)×VR the failure rate at test conditions FRAFtWGT ×=)(λ . For this case the characteristic life at WGT conditions can be calculated as:
ββ
λβη
11
)(
×=
−
WGT
WGTWGT t
t
, (2)
where tWGT is the duration of testing.
The effect of neglecting early failures was evaluated for a case when β = 0.1, FR = 0.01%/1000 hr = 10-7 /hr, and u = 0.4. The calculations yield AF = 1824 and ηWGT = 9.36×10¹² hr.
Figure 1 shows the simulated distribution of times to failure for 300 capacitors tested at 85 oC and V = 1.4 VR. This virtual lot has 23 samples failing before 40 hrs (WGT failures) out of which 17 samples failed before 0.25 hr, one sample failed between 0.25 hr and 2 hr and five more samples failed between 2 hr and 40 hr. The chart shows also distributions calculated for all 23 samples that “failed” during WGT and for 6 samples that are selected per MIL-PRF-55365 requirements as failures between 0.25 hr and 40 hr. The distribution calculated for 23 samples had β= 0.12 and ηWGT = 3×10¹⁰ hr that is close to the parameters calculated for the whole lot. However, calculations per MIL-spec requirements resulted in the characteristic life that is eight orders of magnitude less than the expected value and β exceeding the expected value by a factor of seven.

7
Figure 1. Monte-Carlo simulation of distributions of times to failure during WGT at β = 0.1, FR = 10-7 1/hr, and u = 0.4 for 300 samples (triangular marks), for 23 samples selected at t < 40 hrs
(large square marks), and for 6 samples selected per MIL-PRF-55365 (black circles).
Uncertainty in the time to failure and method of approximation
Neglecting early failures might be one of the sources of errors during analysis of WGT results. Another source is related to the assumption that all failures in the interval from 0.25 hr to 2 hr occurred at t1 = 2 hr, and all failures in the interval 2 hr to 40 hr occurred at t2 = 40 hr. A regression analysis (RA) or maximum likelihood estimation (MLE) for the interval data take into account the uncertainty of time to failure and provide more accurate estimations of the parameters of Weibull distributions.
Results of WGT for 5 lots of MIL-PRF-55365 capacitors were analyzed using RA and MLE with Weibull-7 ReliaSoft software and also by following the MIL-spec recommendations. Figure 2 displays results of WGT that have been approximated using regression analysis (a) and MLE (b) for three time intervals: before 0.25 hr, between 0.25 hr and 2 hr, and between 2 hr and 40 hr. The regression analysis allows for calculation of probability lines that follow experimental data more closely, but MLE method accounts for censored data more accurately than regression analysis and is more suitable when interval data are used for calculations. Obviously, the more time intervals are available and/or the more accurately the times to failure are estimated, the more accurate results of the analysis are.
WGT Simulation
time, hr
cumu
lative
prob
abilit
y, %
1.E-3 1.E+91.E-1 10 1000 100000 1.E+71.E-1
5.E-1
1
5
10
50
90
100
1.E-1
x 5
300 pcs, h=5E12hr, b=0.123 pcs, h=3E10hr, b=0.12
6 pcs, h=1E4hr, b=0.7
MIL-spec calculations

8
a) b) Figure 2. Results of WGT for 5 types of MIL-PRF-55365 capacitors analyzed using regression analysis (a) and maximum likelihood estimation (b). Note that time intervals are not shown in Figure b) for the purpose of not overloading the picture with multiple intervals, but they are the
same as in Figure 2a.
Correlation between FR calculated for five lots of capacitors using regression analysis and MLE is shown in Figure 3a. In all cases except one, the ratio FR_RA/FR_MLE does not exceed two times. The one case having the ratio of 4 had also anomalously large proportion of early failures and relatively small number of failures between 0.25 hr and 40 hr resulting in extremely low β ~ 0.05.
Figure 3b shows a correlation between FR calculated using MLE and MIL-PRF-55365 methods. The data calculated according to the MIL specification were 1.5 to 6 times less than those calculated using maximum likelihood estimations.
a) b) Figure 3. Correlation between failure rates calculated using regression analysis and MLE
techniques (a) and between FR calculated based on MLE and MIL-spec results (b). Dashed lines correspond to the no-change data.
It is apparent that different calculation techniques might result in variations of FR up to an order of magnitude. Considering that MLE provides most accurate estimations of parameters of
WGT for 5 lots of MIL-PRF-55365 capacitors at V=1.52VR
time, hr
cumu
lative
prob
abilit
y, %
1.E-2 10001.E-1 1 10 1001.E-1
5.E-1
1
5
10
50
90
99
1.E-1
x 4
x 16x 3
x 2
x 6
x 2
x 23
x 26
x 50
WGT for 5 lots of MIL-PRF-55365 capacitors at V=1.52VR
time, hr
cumu
lative
prob
abilit
y, %
1.E-1 1001 101.E-1
5.E-1
1
5
10
50
90
99
1.E-1
1.E-09
1.E-08
1.E-07
1.E-06
1.E-09 1.E-08 1.E-07 1.E-06FR b
ased
on
MLE
of
all d
ata,
1/h
r
FR based on RA of all data, 1/hr
Results of Weibull Grading Test
1.E-09
1.E-08
1.E-07
1.E-06
1.E-09 1.E-08 1.E-07 1.E-06
FR b
ased
on
MIL
-spe
c, 1
/hr
FR based on MLE of all data, 1/hr
Results of Weibull Grading Test

9
Weibull distributions, calculations per MIL-PRF-55365 might result in FR that is less by several times than the real values.
Statistical variations in the number of failures for high reliability parts
Possible statistical variations in the number of failures during WGT of high reliability parts might result in significant variations of Weibull distributions and calculated FR due to a relatively small total number of failures.
Using Monte-Carlo simulation described above four virtual lots of capacitors with 300 pcs each having the same FR of 0.01%/1000 hr but different values of β have been generated. Relevant distributions of times to failure are shown in Figure 4. The results indicate that as β is increasing, the probability of observing failures during WGT decreases substantially and at λWGT = 1.8e-4 1/hr and β = 1 only one out of 300 samples fails during the testing.
Figure 4. Monte-Carlo simulation of times to failure during testing at 85 oC, V= 1.4VR for lots having the same FR = 0.01%/1000 hr but different values of β.
For high quality lots, a small number of failures is expected even at relatively small values of the slope β. The probability of failure during BI can be calculated using Weibull function:
−−=
β
ηttF exp1)(
, (3)
where t = tWGT, and η is the characteristic life for the Weibull grade test conditions, ηWGT.
To have at least a few failures during testing of 300 samples, the probability of failure should be above ~1%. Assuming tWGT = 40 hr and calculating ηWGT for FR = 0.01%/1000 hr and FR = 0.001%/1000 hr per Eq.(2) at different β, the values of F(tWGT) were calculated for test conditions at u = 0.3, 0.4, and 0.5. Results of these calculations are shown in Figure 5 and indicate that at FR = 0.001%/1000 hr and u = 0.4 the probability of failures is below 1% for all
Weibull Simulation at FR= 0.01%/1000hr, V=1.4VR
time, hr
cumu
lative
prob
abilit
y, %
1.E-1 10000001 10 100 1000 10000 1000001.E-1
5.E-1
1
5
10
50
90
100
1.E-1
β = 3 β = 1 β = 0.5
β = 0.1

10
cases when β > 0.1. At highly accelerated test conditions when u = 0.5 this probability is below 1% at relatively large β > 0.5.
Figure 5. Probability of failure during WGT for lots having FR = 0.01%/1000 hr and
0.001%/1000 hr at V/VR=1.3, 1.4, and 1.5.
For cases when only a few failures are observed, random variations in the number of failed samples during 0.25 hr to 2 hr or in 2 hr to 40 hr periods might result in significant variations of distributions. An increment by which the proportion of failures, P1 and P2, can vary when 300 samples are tested is 0.0033. Respectively, an error of these proportions is about 0.003.
Figure 6 shows variations of FRs and Weibull shape parameters calculated for WGT at V/VR = 1.4 according to MIL-PRF-55365 requirements for cases when 1, 2, or 3 failures out of 300 samples occurred after 2 hrs and by 40 hrs the number of failures increased by 1, 2, or 3 more parts. If one out of 300 samples failed by 2 hrs and one more by 40 hrs FR = 2×10⁻⁸ 1/hr, whereas with 3 failures by 40 hrs this value increases to 8×10⁻⁸ 1/hr. In both cases the part would be graded as level “C” (less than 10 -7 1/hr). However, if no failures are observed by 2 hrs, then calculations based on total one or 3 failures during 40 hrs would yield FR = 1.8×10⁻⁷ and 3×10-71/hr respectively, and the part would have grade “B” (less than 10-6 1/hr).
1.E-04
1.E-03
1.E-02
1.E-01
1.E+00
0 0.2 0.4 0.6 0.8 1
prob
abili
ty o
f fai
lure
beta
Probability of failure during 40hr WGT
u=0.3, l=1e-7 u=0.3, l=1e-8 u=0.4, l=1e-7u=0.4, l=1e-8 u=0.5, l=1e-7 u=0.5, l=1e-8

11
a) b)
Figure 6. Results of calculations of failure rate (a) and Weibull shape parameter, β, per MIL-PRF-55365 at V/VR=1.4 for cases with up to 3 samples failing between 0.25 hr and 2 hrs (P1
from 0.003 to 0.009) and up to 3 more samples failing by 40 hrs (P2 from 0.006 to 0.018).
All situations considered above are within the possible sample size errors and indicate that at a small number of failures an error in determining FR is about an order of magnitude. Although it is not a MIL spec requirement, most manufacturers are using the same fuses and test conditions for all parts as for 300 samples required for calculations. Obviously, the accuracy of FR grading can be increased substantially if failures are counted not for 300 samples only, but for the whole lot.
Risk of wear-out degradation
Another issue related to the small number of failures during WGT is the possibility of missing a lot susceptible to wear-out degradation. This degradation for example might be observed if a lot is prone to failures due to field-induced crystallization [8]. In this case no failures would be observed before the onset of wear-out, but then the failures would occur with an increasing rate.
Parts failing mostly due to wear-out processes have shape factors of Weibull distributions greater than one. Let us consider a lot that has β = 3 and FR determined by WGT of 0.01%/1000 hrs, and let us assume that WGT for this lot is performed at V=1.4VR. The distribution of times to failure for this case is plotted in Figure 4. Figure 7 shows variations of the failure rate with time for virtual lots graded to the same failure rate, FR = 0.01%/1000 hrs, and the shape factors as in Figure 4. Note that these lots suppose to have the same level of FR by the end of WGT, λWGT(40) = 1.8E-4 1/hr, and some variations of λWGT at tWGT = 40 hr from this value in Figure 7 are due to statistical deviations associated with the Monte-Carlo technique and the accuracy of approximations.
0.0E+00
2.0E-08
4.0E-08
6.0E-08
8.0E-08
1.0E-07
0.003 0.006 0.009 0.012 0.015 0.018 0.021
lam
bda,
1/h
r
P2
Variations of FR for different P1 and P2 at V=1.4VR
P1=0.003P1=0.006P1=0.009
0
0.1
0.2
0.3
0.4
0.5
0.003 0.006 0.009 0.012 0.015 0.018 0.021
beta
P2
Variations of beta for different P1 and P2 at V=1.4VR
P1=0.003P1=0.006P1=0.009

12
Figure 7. Time dependence of failure rates for four virtual lots at 85 oC and V = 1.4VR. All lots had the same FR = 0.01%/1000 hr but different shape factors, β, of the relevant Weibull
distributions.
As Figure 4 shows no failures are expected during WGT at V=1.4VR for the lot having β = 3 and FR = 0.01%/1000hr. In this case the value of FR per MIL-PRF-55365 should be calculated using an equation for exponential distributions of time to failure:
tNAFnlc
×××
+−=
112
)22,.1(2χλ, (4)
where χ2 is the chi-square function, c.l. is the confidence level, n is the number of failures, and N is the total number of samples.
At n = 0 and a confidence level of 90% χ2 = 4.6 and λ = 10-7 1/hr which might be acceptable for many high-reliability applications. However, as Figure 7 shows the rate of failures in this case increases rapidly with time, and the probability of failure during the mission increases substantially. This makes formal compliance with the required level of reliability misleading.
It is typically assumed that the Weibull shape factor is below or equal one, and most experimental data confirm this assumption. Still it is possible that some lots have β >1 and as the above example shows, the existing WGT method is not capable of detecting lots that are prone to wear-out failures. Although MIL-spec requires β to be less than 0.9, this requirement cannot be verified if no failures occurred during WGT or the number of failed samples does not allow for accurate enough estimations of β.
Note also that the mechanisms of failure and hence acceleration factors for IM, random, and wear-out failures might be different. This might require different test conditions to accelerate failures and estimate failure rate of parts for these three areas of the reliability bath-tub curve.
Weibull Simulation at FR=0.01%/1000hr, V=1.4VR
time, hr
failur
e rate
, 1/h
r
0 10020 40 60 800
1.E-3
2.E-4
4.E-4
6.E-4
8.E-4
β = 3β = 0.5
β = 0.1β = 1
FR_ set = 0.01%/1000 hr
λ_40 ∼1.8Ε−4

13
An extension of the duration of WGT up to 160 hrs, which is a typical time of BI for many electronic components, would give more confidence that no wear-out failures occur and/or provide additional data for more accurate estimation of the probability of failures during a long-term mission.
The probability of failures during WGT between time t2 and t1can be calculated as
)()()_( 1221 tFtFttP −= , (5)
where F(t) is Weibull function, Eq.(3).
The probability of failures for different time intervals were calculated for lots having FR = 10-7 1/hr and values of β varying from 0.1 to 3 for test conditions with V = 1.4 VR and V = 1.5VR. The acceleration factors were calculated per MIL-STD-55365 requirements using Eq.(1) at B = 18.77.
Figure 8 shows results of calculations for time intervals of 0.25 hr to 2 hr, P(0.25 -2), 2 hr to 40 hr, P(2_40), and 40 hr to 160 hr, P(40_160). In most cases, in particular at β > 0.5, the probability of failures before 40 hrs of testing is below 1% even at FR = 0.01%/1000 hr, so no failures out of 300 samples are expected. However, lots with β > 1 would have likely more than a few samples failing in the interval of 40 hr to 160 hrs even for lots with FR = 0.001%/1000 hr. This indicates that extension of testing to 160 hrs for lots having no failures during 40-hour WGT at high accelerating voltages, would allow for more reliable detection of wear-out degradation.
a) b)
Figure 8. Effect of the shape factor, β, on the probability of failure between 0.25 hr to 2 hr, P(0.25 -2), 2 hr to 40 hr, P(2_40), and 40 hr to 160 hr, P(40_160) during WGT at V = 1.4VR (a)
and V = 1.5VR (b) for lots having failure rate of 0.01%/1000 hr (a) and 0.001%/1000 hr (b).
0.0001
0.001
0.01
0.1
0 0.5 1 1.5 2 2.5 3
prob
abili
ty o
f fai
lure
beta
WGT at FR=0.01%/1000hr, V/VR=1.4
P_0.25_2P_2_40P_40_160
0.0001
0.001
0.01
0.1
0 0.5 1 1.5 2 2.5 3
prob
abili
ty o
f fai
lure
beta
WGT at FR=0.001%/1000hr, V/VR=1.5
P_0.25_2P_2_40P_40_160

14
III.2. Errors related to acceleration factor. The rate of failures for a lot of capacitors operating at rated conditions (T = 85 oC, V = VR) is calculated based on λWGT(40) determined at accelerated WGT conditions as FRrated = λWGT/AF, so possible variations of the acceleration factor are transferred to the errors of FRrated directly.
It has been shown above that FR variations related to the assessment of λWGT including the calculation technique, method of counting of failures, and possible errors due to a small number of failures, sums up to approximately an order of magnitude. Below, we’ll show that the major source of errors is related to possible variations of the voltage acceleration factor. There are two elements contributing to these variations: one is related to the method of assigning or determining the rated voltage, and another to the accelerating constant B in Eq.(1).
Uncertainty in the rated voltage.
The value of rated voltage is assigned by manufacturers of tantalum capacitors based on proprietary calculations taking into account materials used, manufacturing processes, in particular conditions of anodic oxide growth, and estimated thickness of the dielectric. The only parameter that is measured at rated voltage is leakage current that is used to verify that all parameters of the capacitors are within the requirements. The life testing of tantalum capacitors is not a reliability test, but a quality assurance test and is not used to confirm or verify failure rate of the parts. Obviously, the rated voltage is below the breakdown voltage, VBR, of the dielectric; however, the margin between VBR and VR varies significantly from lot-to-lot even for parts produced by the same manufacturer [9].
Let us assume that there are lots of capacitors that have “ideal” rated voltages VRo, which are chosen so that the accelerating factor determined by Eq.(1) at B = 18.772 describes behavior of these parts under voltage accelerating conditions accurately. It is possible however, that other lots are not so lucky and their rated voltages deviate from VRo by approximately 10%. Figure 9 shows that in this case variations of AF can reach two orders of magnitude at relatively low voltages, V ~ 1.1VR, and up to ~2.5 orders of magnitude at V = 1.5VR.
1.E-01
1.E+00
1.E+01
1.E+02
1.E+03
1.E+04
1.E+05
1.E+06
0 0.1 0.2 0.3 0.4 0.5 0.6
AF
u=V/VR-1
Effect of VR variations
0.9VRo
VRo
1.1VRo
15
Figure 9. Variations of acceleration factors with rated voltage. The dashed line corresponds to an “ideal” case when the rated voltage, VRo corresponds to the model described by Eq.(1) at B =
18.772. Solid lines are calculated for cases when lots deviate from VRo by 10%.
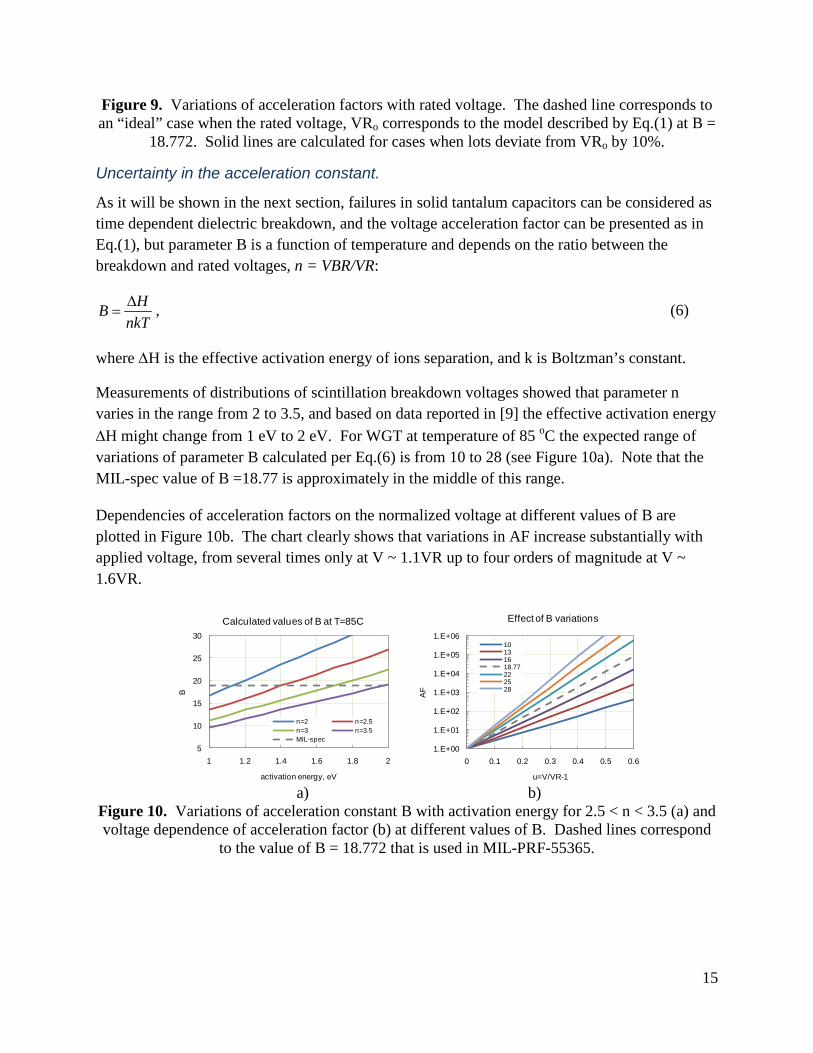
Uncertainty in the acceleration constant.
As it will be shown in the next section, failures in solid tantalum capacitors can be considered as time dependent dielectric breakdown, and the voltage acceleration factor can be presented as in Eq.(1), but parameter B is a function of temperature and depends on the ratio between the breakdown and rated voltages, n = VBR/VR:
nkTHB ∆
= , (6)
where ∆H is the effective activation energy of ions separation, and k is Boltzman’s constant.
Measurements of distributions of scintillation breakdown voltages showed that parameter n varies in the range from 2 to 3.5, and based on data reported in [9] the effective activation energy ∆H might change from 1 eV to 2 eV. For WGT at temperature of 85 oC the expected range of variations of parameter B calculated per Eq.(6) is from 10 to 28 (see Figure 10a). Note that the MIL-spec value of B =18.77 is approximately in the middle of this range.
Dependencies of acceleration factors on the normalized voltage at different values of B are plotted in Figure 10b. The chart clearly shows that variations in AF increase substantially with applied voltage, from several times only at V ~ 1.1VR up to four orders of magnitude at V ~ 1.6VR.
a) b)
Figure 10. Variations of acceleration constant B with activation energy for 2.5 < n < 3.5 (a) and voltage dependence of acceleration factor (b) at different values of B. Dashed lines correspond
to the value of B = 18.772 that is used in MIL-PRF-55365.
5
10
15
20
25
30
1 1.2 1.4 1.6 1.8 2
B
activation energy, eV
Calculated values of B at T=85C
n=2 n=2.5n=3 n=3.5MIL-spec
1.E+00
1.E+01
1.E+02
1.E+03
1.E+04
1.E+05
1.E+06
0 0.1 0.2 0.3 0.4 0.5 0.6
AF
u=V/VR-1
Effect of B variations
10131618.77222528

16
IV. Physical model of WGT failures.
IV.1. Thermochemical model of time dependent dielectric breakdown In our previous work, it was shown that failures of solid tantalum capacitors can be considered as time-dependent dielectric breakdown (TDDB) and time to failure (TF) can be estimated using the thermochemical model developed for oxide films by McPherson and co-workers [10-11]. According to this model, electrical breakdown occurs when the local electrical field weakens polar molecular bonds to the level at which thermal energy is sufficient to cause the breakage. This model predicts that the time to failure is an exponential function of applied electrical field, E:
∆
+−×=kTHEtTF o γexp
, (7)
where ∆H is the activation energy required for displacement of ions from their normal bonding environment, γ is the field acceleration parameter, and to is a time constant. For Ta2O5 dielectric ∆H is in the range from 1.7 eV to 2 eV and γ = 13.6 cm/MV [10]. However, the presence of large concentration of electron traps and movable oxygen vacancies in anodic Ta2O5 dielectric can change local polarization, so the effective activation energy, ∆H, is likely in the range from 1 eV to 2 eV [7, 12].
According to this equation the breakdown field, EBR, is determined as a field at which breakdown occurs instantly (TF ~ to) at the following condition:
kTHEBR
∆=×γ
(8)
Substitution of (8) in (7) allows expressing TF as a function of applied and breakdown voltages:
−×
∆×=
BRo V
VkTHtTF 1exp
, (9a)
or assuming that VBR is proportional to the rated voltage, VBR = n×VR, where n is a constant,
TF can be expresses via a ratio of applied and rated voltages:
−×
∆×=
Ro nV
VkTHtTF 1exp
. (9b)
Acceleration factor for time to failure in general case, when both temperature and voltage of testing are varying, can be written in the following form:

17
−−
−
∆==
2
2
1
1
2122
11 111exp),(),(
TV
TV
nVRTTkH
VTTFVTTFATF
, (10)
Note that the acceleration factor for failures is just a reverse of time to failure acceleration, AF = 1/ATF.
When voltage is constant, and acceleration is achieved by increasing temperature only, the above equation can be simplified and converted into Arrhenius-like form:
−−==
122
1 11exp)()(
TTkE
TTFTTFATF eff
T
, (11)
where
−×∆=
Reff nV
VHE 1 is the effective activation energy that depends on applied voltage.
The effective activation energy is decreasing with applied voltage and the range of possible Eeff values at ∆H in the range from 1 eV to 2 eV and V/VR in the range from 1.1 to 1.5 varies from 0.4 eV to 1.4 eV (see Figure 11a).
In the case when temperature of the test is constant the voltage acceleration factor can be expressed similar to Eq.(1):
( )BuVV
nkTH
VTFVTFATF
R
RV −=
−×
∆== exp1exp
)()(
, (12)
where B depends on temperature and ratio of VBR/VR as defined in Eq.(6).
Based on this theory the voltage acceleration constant B is decreasing with temperature and considering possible variations of ∆H and n is likely in the range from 10 to 28 (see Figure 11b).
a) b)
0.4
0.6
0.8
1
1.2
1.4
0 0.1 0.2 0.3 0.4 0.5
Ea,
eV
u=V/VR-1
Effective activation energy
DH=2, n=3.5 DH=1, n=3.5DH=2, n=2.5 DH=1, n=2.5
0
5
10
15
20
25
30
80 90 100 110 120 130 140
B
temperature, deg.C
Acceleration constant
DH=2, n=3.5 DH=1, n=3.5DH=2, n=2.5 DH=1, n=2.5

18
Figure 11. Voltage dependence of the effective activation energy (a) and temperature dependence of the voltage acceleration constant (b) for possible variations of ∆H and n.
IV.2. Model validation
Temperature dependence of breakdown voltages
Distributions of breakdown voltages measured at different temperatures for parts rated for 50V and 63V are shown in Figure 12. An increase in temperature results in decreasing of breakdown voltages as predicted by the theory. Note also that the slopes of distributions in Weibull coordinates remain practically the same indicating that the mechanism of breakdown is not changing with temperature.
a) b)
Figure 12. Distributions of breakdown voltages at different temperatures for 4.7uF 50V (a) and 22uF 63V (b) solid chip tantalum capacitors.
Based on Eq.(8) the breakdown voltage is inversely proportional to the absolute temperature and the slope of VBR(1/T) line can be used to estimate the value of activation energy, ∆H:
kTdHVBR ×
×∆=
γ , (13)
Variations of average breakdown voltages with temperature in the range from 22 oC to 165 oC for three part types are plotted against 1/T in Figure 13a. In this coordinates the experimental data can be approximated with straight lines as predicted by Eq.(13).
4.7uF 50V scintillation breakdown
breakdown voltage, V
cumu
lative
prob
abilit
y, %
40 2001001
5
10
50
90
99
165C
145C
125C
85C
22C
22uF 63V scintillation breakdown
breakdown voltage, V
cumu
lative
prob
abilit
y, %
50 2001001
5
10
50
90
99
22C125C
85C

19
a) b)
Figure 13. Temperature dependencies of breakdown voltages for 22uF 63V, 22uF 50V, and 4.7uF 50V capacitors (a) and distributions of VBR for 4.7uF 50V capacitors after long-term
stress testing under high voltages (b). Error bars in Figure (a) correspond to standard deviations.
Assuming γ = 13.6 cm/MV and thickness of Ta2O5 layer is proportional to the rated voltage, d = a×VR, where a = 7 nm/V, the values of ∆H were calculated based on the slopes of VBR(1/T) lines for these three parts as well as several other parts tested earlier [9]. Results of these calculations are shown in Table 1 and indicate a range of ∆H variations from 1 eV to 2 eV which corresponds to the expectations.
Table 1. Activation energies calculated based on temperature dependence of VBR.
Part slope, V*K d, nm ∆H, eV
22uF 63V 38699 441 0.99
4.7uF 50V 31665 350 1.03
22uF 50V 33864 350 1.10
3.3uF 10V 8926 70 1.45
10uF 25V 21331 175 1.38
15uF 10V 9557 70 1.55
100uF 16V 11320 112 1.15
220uF 6V 7321 42 1.98
6.8uF 35V 30314 245 1.40
It is quite possible that the long-term reliability of solid tantalum capacitors is greater than predicted per Eq.(14). This is due to the fact that breakdown voltages have a trend of increasing with time of operation. As an example, Figure 13b shows distributions of breakdown voltages for 4.7 uF 50 V capacitors measured after 45 hr stress testing at room temperature and V = 1.75VR and after 70 hr at 2VR. The characteristic breakdown voltage increases from 110 V initially to 121 V after stressing at 87.5 V and to 133 V after 100 V stress.
50
70
90
110
130
150
0.002 0.0024 0.0028 0.0032 0.0036
VB
R_s
cint
1/T, 1/K
Scintillation breakdown
22uF 63V
4.7uF 50V
22uF 50V
4.7uF 50V scintillation breakdown
breakdown voltage, V
cumu
lative
prob
abilit
y, %
70 2001001
5
10
50
90
99
initial
after 70hr 100Vafter 45hr 87.5V

20
HALT at different test conditions
Highly accelerated life testing, HALT, was carried out for three part types in the range of temperatures from room to 130 oC and voltages varying from 1.25VR to 2.25VR according to the test matrix presented in Table 2. Test results were monitored using a data acquisition system that checked periodically condition of 125 mA fuses connected in series with each capacitor. This allowed detection of time to failure with an accuracy of better than 5%.
Table 2. HALT test matrix.
Part Voltage, V Temperature, oC Time, hr QTY
4.7uF 50V
75 125 100 34 87.5 85 80 33 75 22 150 40
87.5 22 48 38 100 22 72 51
112.5 22 24 11
22uF 50V 80 125 50 13 60 130 100 4
87.5 22 100 17 100 22 64 17
22uF 63V 80 125 50 20 95 85 48 40 100 22 200 18 110 22 75 21
Results of HALT are plotted in Weibull coordinates in Figure 14. The slopes of distributions at different levels of stress were similar suggesting that different test conditions most likely did not cause changes in the mechanism of failure.
a) b)
Figure 14. Results of highly accelerated life testing for 4.7uF 50V (a) and 22uF 50V (b) capacitors at different accelerating factors (voltage and temperature).
4.7uF 50V capacitors at different BI conditions
time, hr
cumu
lative
prob
abilit
y, %
1.E-2 10001.E-1 1 10 1001
5
10
50
90
99
112.5V 22C 75V 125C87.5V 85C
100V 22C
87.5V 22C
75V 22C
22uF 50V capacitors at different BI conditions
time, hr
cumu
lative
prob
abilit
y, %
1.E-3 10001.E-2 1.E-1 1 10 1001
5
10
50
90
99
125C 80V
130C 60V
22C 100V
22C 87.5V

21
Estimation of parameters of the model.
In accordance with the TDDB model, the characteristic time of Weibull distribution can be expressed as a function of voltage and temperature:
−×
∆×=
Ro nV
VkTH 1expηη
, (14)
where ηo is a time constant.
By setting:
( )00 ln ηα = ; kH∆
=1α ; T
X 11 = ;
RVnkH××
∆−=2α ;
TVX =2
, (14a)
The characteristic life can be presented as a general log-linear relationship with two variables X1 and X2:
( )22110exp XX αααη ++= (15)
This allows using ALTA-7 software available from ReliaSoft to calculate parameters of the model by approximating experimental results using the maximum likelihood estimations method. Table 3 displays parameters of log-linear approximation and parameters of the model calculated based on Eq.(14a). The table includes also the total number of failed samples, F, total number of suspended samples, S, shape factor of Weibull distributions, β, and voltage acceleration constant B that was calculated at 85 oC per Eq.(6).
Table 3. Parameters of log-linear model, Eq.(15) and HALT model, Eq.(14) data
source F S β α0 α1 α2 t0, hr ∆H, eV n B_85C
4.7uF 50V 90 117 0.24 -15.06 12761.6 -68.61 2.9E-07 1.1 3.7 9.6
22uF 50V 40 41 0.40 -28.13 21026.1 -124.49 6.1E-13 1.8 3.4 17.4
22uF 63V 59 43 0.24 -28.45 25072.2 -145.03 4.4E-13 2.1 3.5 20.6
Activation energy ∆H was in the range between 1.1 eV and 2.1 eV which is close to the range of data obtained based on temperature dependence of VBR and literature data. The ratio between the breakdown and rated voltages, n, was between 3.4 and 3.7 which is somewhat larger than expected based on measurements of distributions of VBR, from ~2 to ~2.3. The range of values of acceleration constant B was from 9.6 to 20.6 which is in accordance to our estimations made earlier.

22
These data demonstrate the applicability of the TDDB model to adequately describe acceleration factors of Weibull grading tests and the effectiveness of using log-linear relationship for estimation of the parameters of the model. Using this approach an estimation of voltage acceleration factors can be obtained by testing parts at two stress levels only, and both voltage and temperature acceleration factors can be calculated based on testing at three temperature/voltage levels of stress. Obviously, the larger the number of stress levels and quantity of tested parts the more accurate estimations can be made.
V. Estimation of WGT conditions at different temperatures and voltages.
Weibull grading tests at two conditions are equivalent when the product of test duration and acceleration factor remains the same:
222111 ),(),( tVTAFtVTAF ×=× , (16)
where T1, V1, t1 and T2, V2, t2 are temperatures, voltages, and durations for two WGT conditions.
Currently, typical WGT for high-reliability tantalum capacitors are carried out at T1 = 85 oC, t1 = 40 hr, and voltages varying from V1 = 1.3VR to 1.52VR. Let us assume that parameters of the failure model have been determined similar to what was done above, so the value of AF can be calculated at any combination of temperatures and voltages. Let us assume also that two out of three variables determining test conditions (T, V, and tWGT) are set. For example, we need to find the necessary test voltages for two cases when T2 = 145 oC and t2 = 40 hrs and when T2 = 105 oC and t2 = 160 hrs.
The ratio of acceleration factors at condition “1” when T1 = 85 oC and voltage stress factors u1 set at 0.3, 0.4, 0.5 and test condition “2” when T2 is varying from 85 oC to 155 oC in 10 oC increments and voltage stress factors u2 is varying from -0.25 to 0.55 were calculated per Eq.(10). These calculations were carried out for 4.7 uF 50 V and 22 uF 50 V capacitors using parameters of the model shown in Table 3. Figure 15 shows an example of calculations for a case when u1 = 0.3.

23
a) b)
Figure 15. Variations of acceleration factors normalized to conditions V1 = 1.3VR and T1 = 85 oC with voltage stress factors u2 at different temperatures T2 from 85 oC to 155 oC for 4.7 uF 50
V capacitors (a) and 22 uF 50 V capacitors (b).
In the first case when duration of testing at conditions 2 and 1 is the same, the necessary voltage accelerating conditions can be determined as the intercept of the line AF = 1 and the curves AF(u2) for a given temperature T2. It is seen that increasing temperature from 85 oC to 145 oC allows for reduction of test voltage from 1.3VR to 0.9VR for 4.7 uF 50 V capacitors and to 0.95VR for 22 uF 50 V capacitors.
When the test duration is increased to 160 hr, the necessary acceleration factor can be decreased in t1/t2 = 4 times. For this case the necessary voltage can be determined at the intercept of the line AF = 0.25 and the respective temperature curve, in our case 105 oC. Analysis of Figure 15 shows that the necessary voltage is V2 = 1.02VR for 4.7 uF 50 V capacitors and V2 = 1.1VR for 22 uF 50 V parts.
Similar calculations have been repeated for u1 = 0.4 and u1 = 0.5 resulting in a range of T2 and u2 conditions that provide the same accelerating factors as conditions 1 (see Figure 16.) Based on these data to assure WGT conditions equivalent to T1 = 85 oC and V1 = 1.5VR at higher temperature, T2 = 145 oC, the necessary voltage stress factor should be V2= 1.13VR for 4.7 uF 50 V capacitors and V2 = 1.18VR for 22 uF 50 V capacitors. For the case when T2 = 105 oC and t2 = 160 hr the required voltages are V2 = 1.22VR and V2 = 1.32VR for 4.7 uF and 22 uF parts respectively.
1.E-02
1.E-01
1.E+00
1.E+01
1.E+02
1.E+03
-0.3 -0.2 -0.1 0 0.1 0.2 0.3 0.4 0.5 0.6
AF(
2)/A
F(1)
u2 = V2/VR-1
4.7uF 50V AF to 85C 1.3VR
85C 95C105C 115C125C 135C145C 155CAF=1 AF=0.25
1.E-02
1.E-01
1.E+00
1.E+01
1.E+02
1.E+03
-0.3 -0.2 -0.1 0 0.1 0.2 0.3 0.4 0.5 0.6
AF(
2)/A
F(1)
u2 = V2/VR-1
22uF 50V AF to 85C 1.3VR 85C 95C105C 115C125C 135C145C 155CAF=1 AF=0.25

24
a) b)
Figure 16. Temperature-voltage relationship for 4.7 uF 50 V (a) and 22 uF 50 V (b) capacitors that have the same acceleration factors as WGT at 85 oC and V1 = 1.3, 1.4, or 1.5 VR.
VI. Discussion Historical data on AF used for WGT
The Navy Crane report from 1982 describes results of testing at 85 oC of more than 29,000 hermetically sealed solid tantalum capacitors manufactured per MIL-C-39003/1 by five manufacturers. The purpose of the testing was to determine acceleration factors for different types of tantalum capacitors and decide how they can be combined for different values, voltages, case sizes, and manufacturers.
It was found that for the majority of the part types the Weibull shape factor β was less than one and testing of good units at rated conditions for 5000 hr. after accelerated test conditions at voltages up to 2.5VR showed no failures. The electrical end point data indicated that some units healed themselves even after blowing one ampere fuses during accelerated testing. This is in agreement with our observations and confirms that failures of tantalum capacitors can be considered as time dependent scintillation breakdowns.
No significant variations in AF between manufacturers, rated voltages and sizes of the capacitors were observed. Experimental data were averaged together resulting in exponential voltage dependence of AF in the form that is currently used in MIL-PRF-39003 and MIL-PRF-55365:
AF = 7.03412025×10⁻⁹×exp(18.77249321×V/VR)
Note, that the preexponential coefficient is just a normalization constant that assures AF = 1 at V = VR, so this equation can be written in a simple form, AF = exp(Bu), where u = V/VR-1, and B=18.772. In this form AF is determined by the acceleration constant B only.
Variations of the observed acceleration factors with applied voltage that were accumulated during that study are displayed in Figure 17. The legend shows values of acceleration constant B
20
40
60
80
100
120
140
160
-0.2 -0.1 0 0.1 0.2 0.3 0.4 0.5 0.6
T2, d
eg.C
u2=V2/VR-1
4.7uF 50V WGT conditions equivalent to 40hr 85C at 1.3VR, 1.4VR, and 1.5V
u1=0.3, t2=t1u1=0.4, t2=t1u1=0.5, t2=t1u1=0.3, t2=4*t1u1=0.4, t2=4*t1u1=0.5, t2=4*t1
20406080
100120140160180
-0.2 -0.1 0 0.1 0.2 0.3 0.4 0.5 0.6
T2, d
eg.C
u2=V2/VR-1
22uF 50V WGT conditions equivalent to 40hr 85C at 1.3VR, 1.4VR, and 1.5V
u1=0.3, t2=t1u1=0.4, t2=t1u1=0.5, t2=t1u1=0.3, t2=4*t1u1=0.4, t2=4*t1u1=0.5, t2=4*t1

25
calculated for cases with minimal and maximum AF. The chart has also data reported by KEMET back in 1972 for their high-reliability Weibull graded hermetic capacitors [13].
Figure 17. Experimental data for acceleration factors from the Navy Crane report, 1982, for various hermetic solid tantalum capacitors. Square marks show minimal and maximal data,
triangle marks represent data reported by KEMET in 1972, and dashed line corresponds to the currently used acceleration factors.
Experimental data obtained in late 1970s confirm exponential dependence of acceleration factors on voltage and show that different lots of tantalum capacitors might have significant variations of the constant B, from 10.3 to 24.4. At high stress factors, u ~ 0.5, variations of AF can reach up to three orders of magnitude, which is in agreement with our estimations made based on the TDDB model.
Note that KEMET-72 data are identical to those presented by Didinger in 1964 [1]. The Navy Crane equation that was first accepted for MIL-C-39003 specification in 1982 remains also unchanged for over 30 years and is used for AF calculations for contemporary solid chip tantalum capacitors. The reason for which AF values were not updated is likely due to the difficulties, or even impossibility, to describe different part types using the same set of acceleration factors, so any attempts to come up with a “combined” AF that is applicable to all lots of capacitors would face the same difficulties. Most likely adequate values of AF can be obtained for a specific group of parts only.
Considering that the existing software simplifies significantly the necessary calculations, obtaining and/or verifying of AF can be easily carried out by a manufacturer for each lot of their high-reliability product. This might require a couple of hundred of samples and about one week of testing only and should be performed periodically as a part of qualification testing. Details of the necessary procedure can be worked out based on the discussed methodology.
Unfortunately, the Navy Crane report does not include analysis of the effect of temperature, and only scarce data exist in literature on temperature dependence of acceleration factors. Figure 18 shows voltage variations of AF at two temperatures, 85 oC and 125 oC reported by Didinger,
1.E+00
1.E+01
1.E+02
1.E+03
1.E+04
1.E+05
1 1.1 1.2 1.3 1.4 1.5
acce
lera
tion
fact
or
V/VR
MIL-C-39003 capacitors
MIL-spec, B=18.77NC min, B=10.3NC max, B=24.4KEMET-1972, B=14.7

26
KEMET, in 1964 [1]. According to these data the same temperature acceleration is applicable for different voltages, and assuming Arrhenius law, the effective activation energy is ~1.5 eV.
Figure 18. Variations of acceleration factors with voltage at 85 oC and 125 oC per Didinger’64
[1]. Dashed line corresponds to the currently used acceleration factors.
According to MIL-PRF-55365 life testing can be carried out for 2000 hrs either by testing of 102 parts (with one sample allowed to fail) at V = VR and T = 85 oC or by testing 24 samples (without failures) at V = 2/3VR and T = 125 oC. Assuming that these test conditions verify the same failure rate and that the acceleration factor of testing can be determined as a product of voltage acceleration, AFV, and temperature acceleration, AFT, the following equation can be written based on Eq.(4):
( ) ( )[ ]
( ) ( )[ ])67.0()125(
12000241
22,..1
)()85(1
20001021
24,..1
2
125
2
85
VRAFCAFlc
VRAFCAFlc
VTC
VTC
××
××
−==
=×
××
×−
=
χλ
χλ, (17a)
Assuming that AFV can be calculated per Eq.(1), AFV (VR) = 1, and AFV (0.67VR) = 0.002. In this case at c.l. = 90%:
1228)4,1.0()2,1.0(
)67.0()(
24102
)85()125(
2
2
=××=χχ
VRAFVRAF
CAFCAF
V
V
T
T , (17b)
To achieve this acceleration, the effective activation energy should be Eeff = 2.1 eV. This result shows that for the conditions of life testing used by MIL-PRF-55365 to be equivalent, the activation energy of failures should exceed 2 eV. This is a relatively large and unjustified value that casts some doubts on the equivalence of life test conditions. Most likely both assumptions, the validity of voltage acceleration factor at B = 18.772, and the equivalency of life test conditions are wrong.
B_85C = 14.7
B_125C = 14.7
1.E-03
1.E-01
1.E+01
1.E+03
1.E+05
1.E+07
0.5 1 1.5 2
acce
lera
tion
fact
or
V/VR
MIL-C-9003 capacitors
D_85C 1964D_125C 1964MIL-spec 85C

27
Reliability AF reported by manufacturers.
Most manufacturers of tantalum capacitors suggest acceleration factors that should be used to calculate reliability of their product at different application conditions including temperature, voltage, and series resistance of the circuit. In general, electronic components might have different acceleration factors for infant mortality failures during BI and random failures during application conditions. However, for tantalum capacitors, IM period is considered extending through the whole useful life of the parts, and it is reasonable to expect that the same equation for AFV can be applied during WGT at V > VR and during application when V < VR.
Figure 19 shows voltage dependence of AF below the rated voltage for tantalum capacitors manufactured by six different vendors in comparison with the MIL-spec data. The data were recalculated based on information that is publically available from vendors’ web sites. Note that Vishay believes that, if their capacitors are manufactured per military requirements, reliability of the product should follow the rules established by the relevant military specifications and refer their customers to MIL-HDBK-217F for calculations of the acceleration factors.
Figure 19. Variations of acceleration factors with voltage for solid tantalum capacitors
manufactured by different vendors. Legend indicates calculated values of the acceleration constant, B.
At similar conditions different vendors suggest AF varying more than three orders of magnitude, and the effective values of B are in the range from 3.4 to 18.3. Both military documents, MIL-PRF-55365 and MIL-HDBK-217, apparently use the same acceleration constant B at V > VR and at 0.5VR < V < VR. The spread of AF factors suggested by different manufacturers is increasing as voltage decreases below VR and the range of effective acceleration constant B is close to the range calculated based on Navy Crane experiments and the range estimated based on the TDDB model.
The observed difference in AF might be due to some technological variations that are specific to different vendors or to different methodology of defining rated voltages. However, most likely different lots of capacitors from the same vendor would have different AF, and lot-to-lot
0.0001
0.001
0.01
0.1
1
10
100
1000
0 0.2 0.4 0.6 0.8 1 1.2 1.4
acce
lera
tion
fact
or
V/VR
MIL-PRF, B=18.77AVX, B=8.1KEMET, B=14.7NEC/TOKIN, B~7.2Hitach, B~6.8Vishay*, B=18.3Panasonic, B=3.4

28
variations would result in a similar spread of AF as shown in Figure 17. In this case results of Figure 19 might reflect a limited (due to a high cost of reliability testing) experience that each vendor has with reliability of their product.
Assuming the AF(T) function follows the Arrhenius law, activation energies were estimated based on charts suggested by different vendors to calculate the effect of temperature on reliability of their capacitors. Results of these calculations are summarized in Table 4 and indicate the range of Ea from 0.16 eV to 1.17 eV. This is far below the value calculated above based on life test conditions in MIL-PRF-55365, but close to the range of possible variations predicted by the TDDB model.
Table 4. Activation energies calculated based on data suggested by different vendors and MIL specifications.
Manufacturer Ea, eV
AVX 0.63
KEMET 1.17
MIL-PRF-55365 2.1
HITACHI 0.62
NEC/TOKIN 0.66
Vishay*/MIL-HDBK-217F 0.15
Panasonic 0.16
Voltage derating.
Derating is a reduction of operating electrical and temperature conditions used by original equipment manufacturers (OEM) to further increase reliability of components compared to the rated conditions. To estimate the adequate level of derating it is necessary to know failure rate at the rated conditions, required reliability during the mission, and dependence of AF on the level of stress.
For a tantalum capacitor that passed WGT the probability of failure during a mission can be calculated as a conditional probability of failure [14]:
)(1)()()(
WGT
WGTWGTMM tAFF
tAFFtAFtFtP×−
×−×+= , (18)
where F(t) is the cumulative Weibull distribution function, Eq.(3) and tM is the mission time.
As an example, suppose tM = 10 years and the required reliability is P(10) <0.003%. For a lot of tantalum capacitors that has FR = 0.001%/1000 hr (1E-8 /hr) after WGT, at β < 1 and rated voltage the probability of failure during the mission P(10) is ~ 8.8×10⁻⁴ which still exceeds the required level. If the voltage acceleration factor can be calculated per Eq.(1) at B = 18.772

29
(MIL-spec data) then derating to 80% of VR would increase AF by a factor of 50 resulting in reduction of P(10) to below 2×10⁻⁵ which is in compliance with the requirements. However, if the acceleration constant B is much smaller than it is assumed by MIL-PRF-55365, then the part cannot be used without severe derating.
Suppose B = 10, then the calculated AF would be almost two orders of magnitude less than the one expected per military specifications, and the part that we thought to have FR = 0.001%/1000hr would have in reality FR = 0.1%/1000 hr. In this case the probability of failure at rated conditions during a 10-year mission is unacceptably large, P(10) = 8.4%. At this conditions voltage derating to 50% VR would reduce AF to 0.0067, decrease FR to 6.7×10⁻⁹ 1/hr and P(10) to 5.6×10⁻⁴, which is still much larger than the required 0.003%. For such a capacitor derating down to 30%VR might be helpful. Obviously, without the knowledge of acceleration factors OEM cannot make a decision on how significant derating should be.
This example shows that the uncertainty in the acceleration factor can be compensated for by severe voltage derating. This is likely one of the reasons why all manufacturers of chip tantalum capacitors do not recommend using their parts without reducing voltages below the rated. However, this approach refutes the notion of WGT and the benefits of this test for the user, that in theory suppose to pay for the level of reliability required for applications. At these conditions WGT can be replaced with a regular burn-in and severe voltage derating will likely assure the necessary reliability of the part.
Cost reduction was one of the major driving forces for accepting WGT to manufacture high reliability parts. This technique can be effective and can assure the required level of reliability when properly used and when accurate estimations AF that are specific for a given group of capacitors are available. Obviously it is much easier and cheaper for a manufacturer of capacitors to recommend severe derating instead of verification of the voltage acceleration factors and reliability levels at rated conditions. However, derating that depends on application conditions and requirements should remain a prerogative of the user to further increase reliability of the parts above the rated level. Manufacturers of high-reliability capacitors should be able to confirm the failure rate of their product at rated conditions, determine, and make available to the users adequate acceleration factors for derating.
VII. Conclusion 1. Monte-Carlo simulations and analysis of results of HALT and Weibull grading tests of solid
tantalum capacitors showed that the estimated failure rate might vary significantly depending on the method of calculation and acceleration factor used. Reliance on MIL-PRF-55365 method for reliability rating of solid tantalum capacitors might be misleading.
2. Errors related to the method of calculation, including neglecting initial failures, approximation technique, and possible statistical variations in the number of failed samples,

30
sum up to approximately one order of magnitude. Using all failures for calculations, maximum likelihood method for data approximation, and increasing the number of samples for high-reliability lots can decrease these errors substantially.
3. Possible deviations of the acceleration factor from the values calculated per MIL-PRF-55365 specification are the major source of errors in failure grading. These errors increase with voltage exponentially and can cause variations in the calculated failure rate up to three orders of magnitude. To avoid these errors, AF should be determined and/or verified by HALT using at least two levels of stress factors.
4. To make sure that the failure rate would decrease with time of operation, values of the Weibull shape factor should be verified to be below one during the screening testing. This confirmation is not possible when a standard 40-hr test does not detect sufficient number of failures. In these cases an extension of test time to 160 hrs might increase the confidence in reliability of parts significantly.
5. A thermochemical model for time-dependent dielectric breakdown has been used to determine temperature and voltage acceleration factors of WGT. The model predicts an exponential dependence of AF on voltage, similar to the currently used equation, but with the voltage acceleration constant B depending on temperature and physical characteristics of the dielectric. Temperature dependence of AF can be presented in the Arrhenius-like form with the effective activation energy depending on applied voltage.
6. Experiments including temperature dependence of breakdown voltages and HALT at different stress conditions for three types of solid chip tantalum capacitors confirmed the applicability of the TDDB model and allowed for estimations of parameters necessary to calculate temperature and voltage acceleration factors.
7. It has been shown that the acceleration factors can be calculated by approximation of HALT test results with a general log-linear relationship at two stress factors. This method requires experiments to be performed at two stress levels minimum if only one stress variable used (voltage or temperature) or at three levels minimum if both temperature and voltage are used to accelerate failures.
8. Analysis of literature data showed a wide spread of voltage and temperature acceleration factors suggested by different manufacturers of tantalum capacitors to estimate reliability of their product at derating conditions. The reported voltage acceleration factors vary up to four orders of magnitude, and effective activation energies are in the range from 0.16 eV to 2 eV, which is in agreement with predictions of the TDDB model.
9. In the absence of reliable data for the failure rate and voltage and temperature acceleration factors, manufacturers of high-reliability systems have to employ a severe derating to assure reliability of tantalum capacitors. This approach is not effective because of unknown gain in reliability that is achieved by derating and in cases when parts have low AF might not reduce FR to the required level.

31
10. Information about acceleration factors is critical to suggest adequate derating conditions. Manufacturers of tantalum capacitors should establish/confirm AF for their product by periodical HALT at different voltage/temperature accelerating conditions, but the level of derating should be determined by the end user. A standardized method for determining acceleration factors can be developed based on results of this paper.
VIII. References [1] G. H. Didinger, "Tantalum capacitor accelerated life testing," Evaluation Engineering,
vol. Sept/Oct, 1964. [2] J.D.Prymak, et al., "Derating review of Ta-MnO2 vs. Ta-polymer vs.Al-polymer vs.
NbO-MnO2," presented at the CARTS Europe, Nice, Fr, 2004. [3] T.Zednicek and J.Gill, "Voltage derating rules for solid tantalum and niobium
capacitors," presented at the CARTS Europe, Stuttgart, Germany, 2003. [4] A. Teverovsky, "Screening and Qualification Testing of Chip Tantalum Capacitors for
Space Applications," in CARTS USA, New Orleans, LA, 2010. [5] J. N. Burkhart, "Use of accelerated testing techniques in military specification MIL-C--
39003," in CARTS, Phoenix, AZ, 1983, pp. 111-117. [6] J. L. Paulsen, et al., "Reliability of Tantalum Polymer Capacitors," in CARTS 2004: 24th
Annual Capacitor and Resistor Technology Symposium, 2004, pp. 114-121. [7] A. Teverovsky, "Scintillation Breakdowns and Reliability of Solid Tantalum Capacitors,"
IEEE Transactions on device and materials reliability, vol. 9, pp. 318-324, 2009. [8] T. Tripp and Y. Freeman, Major Degradation Mechanisms in Tantalum and Niobium
Based Capacitors: Components Technology Institute Inc., 2008. [9] A. Teverovsky, "Scintillation and Surge Current Breakdown Voltages in Solid Tantalum
Capacitors," IEEE Transactions on Dielectrics and Electrical Insulation, vol. 16, pp. 1134-1142, 2009.
[10] L. McPherson, et al., "Proposed universal relationship between dielectric breakdown and dielectric constant," in Digest. International Electron Devices Meeting, IEDM '02, 2002, pp. 633 - 636.
[11] J. W. McPherson, et al., "Trends in the Ultimate Breakdown Strength of High Dielectric-Constant Materials," IEEE transactions on electron devices, vol. 50, pp. 1771-1778, August 2003 2003.
[12] A. Teverovsky, " Degradation of Leakage Currents in Solid Tantalum Capacitors under Steady-State Bias Conditions " in 60th Electronic Components and Technology Conference, Las Vegas, NV, 2010.
[13] KEMET, GR500, General specification for graded reliability fixed tantalum, solid electrolyte, high-reliability capacitors, 1972.
[14] P. A. Tobias and D. C. Trindade, Applied reliability: Van Nostrand Reinhold, 1995.