Embed Size (px)
Citation preview

REVIEW
i
ACKNOWLEDGEMENTS
This report was produced by the U.S. Department of Energy’s Office of Energy Policy and Systems Analysis (DOE-
EPSA) under the direction of Aaron Bergman with substantial input from Paul Denholm and Daniel C. Steinberg of
the National Renewable Energy Laboratory and David Rosner of the Department of Energy. We would like to thank
the peer reviewers inside and outside of government who provided helpful comments on the document. Figure 2
is adapted with permission from Mills and Wiser 2012. Figures 7 and 9 are used with permission from Mark
O’Malley, University College Dublin.
This report was prepared as an account of work completed by an agency of the United States Government. Neither
the United States Government nor any agency thereof, nor any of their employees, makes any warranty, express
or implied, or assumes any legal liability or responsibility for the accuracy, completeness, or usefulness of any
information, apparatus, product, or process disclosed, or represents any specific commercial product, process, or
service by trade name, trademark, manufacture, or otherwise does not necessarily constitute or imply its
endorsement, recommendation, or favoring by the United States Government or any agency thereof. The views
and opinions of authors expressed herein do not necessarily state or reflect those of the United States
Government or any agency thereof.

ii
TABLE OF CONTENTS
Acknowledgements ....................................................................................................................................... i
Executive Summary ............................................................................................................................. 1
Introduction ......................................................................................................................................... 4
Following the Four Rules: Past, Present, and Future ............................................................................. 6
Rule 1: Power Generation and Transmission Capacity Must Be Sufficient to Meet Peak Demand for
Electricity. ..................................................................................................................................................... 6
Why Peak Demand Matters ......................................................................................................................... 6
Complying with Rule 1: Traditional Means ................................................................................................... 8
Complying with Rule 1: New Options ......................................................................................................... 10
Rule 2: Power systems must have adequate flexibility to address variability and uncertainty in
demand (load) and generation resources. ................................................................................................. 16
Why Flexibility Matters .............................................................................................................................. 16
Complying with Rule 2: Traditional Means ................................................................................................. 17
Complying with Rule 2: New Options ......................................................................................................... 17
Rule 3: Power Systems Must be able to Maintain Steady Frequency .................................................................. 20
Why Steady Frequency Matters ................................................................................................................. 20
Complying with Rule 3: Traditional Means ................................................................................................. 23
Complying with Rule 3: New Options ......................................................................................................... 24
Rule 4: Power Systems Must Be Able to Maintain Steady Voltage at Various Points on the Grid ....................... 28
Why Voltage Stability Matters.................................................................................................................... 28
Complying with Rule 4: Traditional Means ................................................................................................. 29
Complying with Rule 4: New Options ......................................................................................................... 30
Conclusion ......................................................................................................................................... 31
References ......................................................................................................................................... 32
List of Figures
Figure 1. Historic hourly load patterns for ERCOT, CAISO, NYISO and Florida Power and Light for important
weeks in 2014. ................................................................................................................................................ 6
Figure 2. Capacity credit of PV as a function of penetration for different regions ...................................................... 11
Figure 3. Load and net load profiles for California under increased penetration of PV for three
representative days of peak demand in the summer .................................................................................. 12
Figure 4. Example of identical energy use with different consumption patterns during a 24-hour period ................ 13
Figure 5. Increased PV penetration leads to shorter intervals of peak demand ......................................................... 15
Figure 6. Increase in net load variability with added wind .......................................................................................... 16
Figure 7. Representation of the existing grid powered by synchronous generators .................................................. 20
Figure 8. Sequence of reserves activation in response to a contingency event such as a large power plant
failure ........................................................................................................................................................... 21

iii
Figure 9. Representation of a grid with both synchronous and inverter-based generators ....................................... 24
Figure 10. Power systems maintain voltage at different levels in different parts of the power system ..................... 28
List of Tables
Table 1. Regulating and Spinning Contingency Reserve Requirements in U.S. Wholesale Markets ........................... 23
Table 2. Additional Regulating Reserve Requirements Due to the Addition of VG ..................................................... 25

1
EXECUTIVE SUMMARY The electric sector is undergoing a time of transition. Inexpensive natural gas, lower cost renewable
power and increased use of energy efficiency and distributed generation are leading to a transformation
in the way power is produced and delivered to consumers. As a consequence, many of the old
paradigms that govern the sector are also evolving, importantly the traditional model of large
centralized generators as a means of producing electricity and maintaining reliability. As more of these
generators have retired in recent years and been replaced with new sources of power and energy
efficiency, there have been questions about how to sustain the current level of reliability. This paper
discusses the tools that the power sector will use to maintain reliability through this time of
transformation.
While there are numerous standards and regulations that govern reliability of the power sector, this
paper consolidates them into four “rules”:
1. Power generation and transmission capacity must be sufficient to meet peak demand for
electricity
2. Power systems must have adequate flexibility to address variability and uncertainty in demand
(load) and generation resources
3. Power systems must be able to maintain steady frequency
4. Power systems must be able to maintain voltage within an acceptable range
For each rule, we discuss how it has been met historically and the new technologies and practices that
will let it be met during and after this time of power sector transformation. The conclusion is that, while
reliability has been historically maintained by a limited set of tools, primarily large spinning generators,
there is now a new toolbox for maintaining reliability. With this new toolbox and continued careful
planning, coordination and investment, reliability can remain a trademark characteristic of our evolving
power system.
POWER GENERATION AND TRANSMISSION CAPACITY MUST BE
SUFFICIENT TO MEET PEAK DEMAND FOR ELECTRICITY
The power grid must have sufficient capacity available to meet the demand for electricity. Because there
are uncertainties in forecasting demand and the potential for generation and transmission outages, the
total amount of capacity is required to exceed the expected level of demand by a given fraction, termed
the reserve margin, often about 15%.
TRADITIONAL MEANS: Large conventional generators have traditionally provided the capacity to
meet peak demand and reserve margins, and high voltage transmission lines have provided the means
to move the power to where it is needed. In recent years, resources that lower demand for electricity
have also begun to play a significant role.
2
NEW OPTIONS: While one cannot know far in advance the output of any variable resource such as
wind and solar, these resources can still play a role in meeting peak demand by taking into account the
probabilistic aspects of their generation profile. Aggregation of these resources can reduce their overall
variability. Demand response and smart grid technologies can be used to reduce peak load. Lastly,
storage can be used to meet peak load by saving power (or thermal energy) from when it is cheaper to
generate and using it when it is most valuable.
POWER SYSTEMS MUST HAVE ADEQUATE FLEXIBILITY TO ADDRESS
VARIABILITY AND UNCERTAINTY IN DEMAND (LOAD) AND GENERATION
RESOURCES
The level of demand changes throughout the day and from season to season. This, and the addition of
variable generation such as wind and solar, places a premium on having flexible generation capacity that
can change its level of output to account for changes in demand and the amount of generation from
variable resources (such as when the wind stops blowing or the sun goes down).
TRADITIONAL MEANS: Traditionally, the need for flexible generation has been met with natural gas
generators, which are capable of ramping their output up and down rapidly. Demand response has also
played a growing role. Recent analyses indicate that the current level of flexibility on the grid can
accommodate variable generation levels of up to 35% of all generation.
NEW OPTIONS: Many grid operators are planning to or are already implementing policies to increase
the flexibility of their systems. New, modern gas generators have been designed to provide very fast
ramp rates. Expanded use of demand response also provides more flexibility. Lastly, it is possible to add
technology to allow variable resources to decrease generation and, potentially, to increase it if they are
not using all available power. This ability to dispatch variable generation is already being used to provide
flexibility across the country.
POWER SYSTEMS MUST BE ABLE TO MAINTAIN STEADY FREQUENCY
The power system uses what is called alternating current (AC) where the electricity reverses direction
sixty times per second (60 Hz). If this frequency of oscillation were to deviate significantly from 60 Hz, it
could damage machines and electronics. Any mismatch between the supply and demand of electricity
can cause this sort of deviation, and a number of mechanisms operating at different timescales are used
to maintain a steady frequency.
TRADITIONAL MEANS: Large spinning generators are used to arrest any change in frequency
because it takes time for them to change their rate of rotation. Generators can have governors that
detect any change in their rate of rotation and increase or decrease power to compensate. On longer
timescales, generation that can rapidly respond is kept in reserve to match supply and demand.

3
NEW OPTIONS: Studies have shown that increased levels of variable generation on the grid increase
reserve requirements necessary to maintain a steady frequency, but these increases are quite modest.
Transmission can be used to average out some of the variability and reduce the need for additional
reserves. Even as they retire, large spinning generators can be used as “synchronous condensers” that
spin synchronously with the grid, not consuming fuel, but serving to arrest changes in frequency. In
addition, it is possible to make a variable resource act like a large spinning generator through the use of
advanced power electronics. Demand response and storage to balance supply and demand also will
likely play a growing role in maintaining a steady frequency.
POWER SYSTEMS MUST BE ABLE TO MAINTAIN VOLTAGE WITHIN AN
ACCEPTABLE RANGE
In addition to maintaining a steady frequency, the electric grid must also deliver electricity at a given
voltage. This voltage varies throughout the power grid with transformers used to change voltages.
Maintaining the correct voltage requires the management of “reactive power” which is a property of AC
electricity that allows power to flow. If the levels of reactive power are too high or are too low, the
voltage level can change, potentially even collapsing catastrophically.
TRADITIONAL MEANS: Large spinning generators that are synchronized with the grid can control
voltage levels and reactive power by adjusting their output. Various electrical devices such as shunt
capacitors are used to control reactive power throughout the transmission and distribution networks.
NEW OPTIONS: As with frequency control, advanced power electronics can give variable generation
resources like wind and solar the ability to control reactive power and voltage. FERC has recently issued
an order requiring this capability on larger variable generation units. Many types of storage can also use
this sort of power electronics. In addition, synchronous condensers can be used to provide reactive
power. Lastly, there is a class of relative inexpensive electronic devices called Flexible AC Transmission
Systems (FACTS) that have existed for a while but are becoming less expensive and more widely
deployed and can solve many voltage control problems that historically would have required larger and
more costly generators, transmission lines or electromechanical devices.

4
INTRODUCTION In the United States, we enjoy the benefits of a highly reliable electrical power system. Reliable,
affordable electric power fuels the economy and supports our quality of life. Each time we turn on a
light, plug in a phone, approach a traffic signal, or log onto a computer, we trust that the power system
will be working to enable the services we expect. That is power system reliability: the ability of the
system to deliver expected service through both planned and unplanned events.
Catastrophic events such as hurricanes and earthquakes can disrupt U.S. power service, but day-to-day
interruptions are rare. Typically, power system failures result in interruption in customer service for less
than 3 hours of the 8,760 hours in a year.1 Furthermore, most of these failures affect relatively few
customers and occur on the distribution system—the network of local lower-voltage power lines that
transfer electricity from the high-voltage bulk power system to our homes and businesses. Power
outages due to failures of the bulk power transmission system are far less common. This is due, in large
part, to how such power systems are built and operated so that safeguards keep the systems running
even when any individual component fails.
The high level of reliability provided by the U.S. grid is not by accident.2 The U.S. Department of Energy,
Federal Energy Regulatory Commission (FERC), North American Electric Reliability Corporation (NERC),
regional planning authorities, utilities, power system operators, and other organizations work to ensure
adequate reliability of the U.S. power system through implementation of reliability standards, timely
planning and investment, and effective system operations and coordination.
During most of the 20th century, electric utilities adhered to industry and self-imposed reliability criteria
for electricity generation and transmission as they built and operated large hydroelectric, nuclear, and
fossil-fueled power plants. These power plants, regionally connected with high-voltage power lines, now
form the foundation of reliable, affordable electricity systems throughout the United States and
internationally.
Recently, however, a combination of market forces and emerging trends are transforming the ways we
generate and deliver electricity. Key drivers include comparatively low-cost natural gas, the increase in
deployment of renewable energy technologies, environmental policies, consumer preferences, low
demand growth, and the creation and continued evolution of restructured electricity markets. In many
cases, the traditional model of large centralized generators is evolving as retiring generators are
replaced with variable wind and solar generators, smaller and more flexible natural gas generators, and
non-traditional resources such as demand-response (DR) and distributed generation. In the midst of
1 This is the national average. There is a very large variation by state. In 2013, the range was 7 minutes on average
in Vermont to more than 18 hours in South Dakota. See Wirfs-Brock, J. 2015. “How Long is Your Blackout?” Inside
Energy. Accessed March 2016, http://insideenergy.org/2015/03/20/ie-questions-how-long-is-your-blackout/ 2 For additional discussion of the concept of power system reliability see
http://www.nerc.com/pa/Stand/Resources/Documents/Adequate_Level_of_Reliability_Definition_(Informational_
Filing).pdf.

5
these changes, a variety of new technologies and practices have arisen to help maintain electric system
reliability. In this paper, we examine how power system operators are using these new technologies and
practices to maintain a high level of grid reliability.
There is an extensive set of standards and regulations that utilities and system operators must meet to
maintain a reliable grid. For this report, we consolidate these into four overarching “rules”3 for power
system reliability:
1. Power generation and transmission capacity must be sufficient to meet peak demand for
electricity
2. Power systems must have adequate flexibility to address variability and uncertainty in demand
(load) and generation resources
3. Power systems must be able to maintain steady frequency
4. Power systems must be able to maintain voltage within an acceptable range
In the remainder of this paper, we will discuss each of these rules, how they have been met historically
and how modern energy system practices and technologies—including variable renewable generation
like wind and solar power and “smart grid” technologies—give power system operators new tools and
methods for ensuring power system reliability.
3 These “rules” are not directly formalized in any single regulation. Instead, they represent a summary of the
numerous regulations and practices that grid operators follow to maintain reliability.

6
FOLLOWING THE FOUR RULES: PAST,
PRESENT, AND FUTURE
RULE 1: POWER GENERATION AND TRANSMISSION CAPACITY MUST BE
SUFFICIENT TO MEET PEAK DEMAND FOR ELECTRICITY.
WHY PEAK DEMAND MATTERS
The demand for electricity varies over short and long timescales. Typically, electricity demand is higher
during the day and during warmer summer months, which aligns with greatest use of air conditioning.
The demand for electricity on a hot summer afternoon can be more than twice the demand during
spring evenings. This pattern of demand is similar across most of the United States, although some
northern states experience peak demand during winter. Figure 1 illustrates the hourly demand for three
different one-week periods in four regions of the country. The power system must be able to effectively
deliver energy during these peak demand periods, or there would partial black-outs. Having sufficient
resources available on the system to be able to meet peak demand is called “resource adequacy”.
Figure 1. Historic hourly load patterns for ERCOT (Texas), CAISO (California), NYISO (New York) and Florida Power and Light for significant weeks in 2014.

7
System planners estimate the total peak demand for electricity for several years into the future to
account for expected load growth. This process is called “load forecasting.” Planners then determine if
or how much additional capacity will be needed to meet forecast demand. These calculations typically
account for existing capacity, anticipated plant retirements and a host of federal and state regulatory
issues ranging from emissions regulations to renewable portfolio standards. In some cases, retired
generators are not replaced at all, which removes some capacity from the power system. There is some
degree of regional variation in the methods that planners use to calculate the amount of capacity
required to meet peak load, but all planners must develop an estimate of the required capacity.
Forecasting and advance planning help ensure that utilities and developers have adequate lead time to
bring new generators and supporting infrastructure online, as the approval, permitting and construction
process can take several years.
Two key steps are important when determining the total generation capacity requirement: 1) establish a
target resource adequacy level (often measured by loss of load expectation as discussed later in this
section), and 2) estimate the amount of generation needed to meet that resource adequacy level (often
measured by the planning reserve margin). These steps are repeated (typically at least once a year) to
ensure that the system is able to respond to load growth and other factors affecting system reliability.
The planning reserve margin is the quantity of “spare” or “backup” capacity that the utility or grid
operator holds in reserve that can be used to respond to a range of factors that could threaten the
ability to meet load. These factors include:
1. Errors in forecasting: Load can be higher than anticipated, as is the case when unusually hot
summer weather creates a spike in air conditioning demand.
2. Forced (unplanned) outages: No power plant is 100% reliable, and since generators can fail, it is
necessary to have spare capacity available to provide backup.
3. Transmission outages: Transmission lines and associated equipment can also fail, which limits
the amount of electricity that can be delivered from generators to load.
The planning reserve margin is measured by the total amount of capacity available (typically measured
in MW) above the expected peak demand. For example, a system with an anticipated peak demand of
10,000 MW might maintain a planning reserve margin of 15%, or a total of 11,500 MW of conventional
capacity. The 1,500 MW of “spare” capacity is then available to maintain system reliability. In setting the
planning reserve margin target, utilities, system operators or regulators often rely on detailed reliability
calculations to determine how much capacity is needed to ensure that blackouts rarely occur. For
example, a utility may set a planning reserve margin based on a loss-of-load expectation target of 0.1
days/year or 0.1 events/year.4 Once the target planning reserve margin is set and the total amount of
4 For a comprehensive discussion, see Pfeifenberger et al. (2013), who note, “Although the 1-in-10 standard is
widely used across North America, substantial variations in how it is implemented mean that it does not represent
a uniform level of reliability…. the 1-in-10 standard may be interpreted as either one event in ten years or one day
in ten years. One event in ten years translates to 0.1 loss of load events (LOLE) per year, regardless of the
magnitude or duration of the anticipated individual involuntary load shed events. One day in ten years translates
to 2.4 loss of load hours (LOLH) per year, regardless of the magnitude or number of such outages.”

8
capacity needed is estimated, utilities or project developers determine what type of resources to build
to provide that capacity.
COMPLYING WITH RULE 1: TRADITIONAL MEANS
Traditionally, system operators rely on generators to provide the capacity to meet planning reserve
margins. However, building adequate conventional capacity is not the only tool for maintaining resource
adequacy. Energy Efficiency (EE) and Demand Response (DR) have been used by utilities to reduce peak
demand. By lowering peak demand, these options can often act as a direct substitution for conventional
capacity for meeting planning reserve margins and maintaining system reliability. In addition, the
construction of new transmission lines to enable access to power from neighboring resources has also
been used as a traditional means of meeting reserve margins.
CONVENTIONAL POWER PLANTS
Before the large-scale penetration of variable generation (VG) resources, power plants were often
categorized by the type of load they commonly provided: baseload, intermediate or peaking. Generally,
different types of plants are used to meet each type of load. Baseload plants, which are typically lower-
cost nuclear or coal plants, are used to meet the constant demand on the system. Although the output
levels of these plants can be altered, it is usually most economical for them to run at close-to-full
capacity at all times. Intermediate load plants, often gas-fired, including combined-cycle plants, are used
to meet the daily variations in demand. More recently, low gas prices are prompting the use of natural
gas combined-cycle (NGCC) plants as baseload plants. Where available, hydroelectric units are also used
as baseload or intermediate load plants. Finally, peaking generators meet the more extreme spikes in
demand and often are used for only a few hours of the year. Peaking generators are typically “simple
cycle” gas turbines or older gas- or oil-fired steam generators.5 Peaking plants are relatively inexpensive
to build but are more expensive to run because they are generally less efficient than other types of
plants or use more expensive fuel. In planning and daily operations, system operators tend to choose
the mix of generators that allows them to meet demand in the most economic fashion. Determining this
mix is an important part of planning the power system.
The emergence of wholesale energy and capacity markets has led some of the planning to be replaced
by market mechanisms, but developers still examine patterns of load growth, system requirements, and
expected utilization to determine the type of plant to construct.
ENERGY EFFICIENCY
Energy efficiency improvements reduce the amount of electricity required to provide a particular end-
use service, such as lighting or air-conditioning. For example, more efficient devices such as light-
emitting diode (LED) light bulbs provide the same amount of light (lumens) as traditional incandescent
bulbs, but use a fraction of the energy. Reducing end-use consumption of electricity through energy
efficiency improvements can displace the need for new capacity. For example, because most of the
5 In some locations, peak demand is met with pumped storage plants, which store energy by pumping water up a
hill to a reservoir and then release that stored energy through a conventional hydroelectric generator during
periods of peak demand.

9
United States has peak demand in the summer, more efficient air conditioning can maintain comfort
levels with less power, and more efficient lighting that loses less energy to heat would, in turn, make
buildings easier to cool and lower demand on air conditioning systems.
DEMAND RESPONSE AND INTERRUPTIBLE LOAD
DR and interruptible load are additional tools that can be used to reduce the need for capacity without
impacting levels of service. Instead of building new capacity, utilities can provide incentives to (or pay)
electricity users to reduce demand (often referred to as conservation) or to shift demand to parts of the
day with lower demand (often referred to as load-shifting), thus reducing the overall need for capacity.
Such programs can be cost-effective as long as the cost of incentive payments is less than the cost of
new generation capacity.
Historically, large industrial and commercial customers have been offered “demand-based” or
“interruptible” rates.6 Under demand-based plans, utilities charge customers a higher rate for usage
during peak demand periods. This provides incentives for large industrial consumers to reduce demand
during these periods, which in turn reduces the need for peaking capacity. Under interruptible rate
structures, in exchange for offering lower electric rates, the utility reserves the option to limit or turn off
electricity supply to the customer under certain defined circumstances. These rates structures are very
rare for smaller consumers such as households because of the need for (historically) expensive
communications and metering equipment. However, that is changing, as discussed below under “Smart
Grid Technologies.”
Utilities also offer DR programs for residential customers. A common type is direct load control (DLC)
programs. DLC programs allow utilities to directly control certain appliances—most frequently air
conditioners and electric water heaters—to reduce peak demand.7 In exchange for a reduction on the
customer’s bill, the utility installs a remotely controlled switch on the appliance and receives the right to
occasionally turn off the appliances for short intervals, often 15 - 30 minutes.8 For most consumers the
interruption of service is rarely noticeable.9 More recently, new classes of demand-response programs
are available through the emergence of wholesale markets; see “Smart Grid Technologies” below.
TRANSMISSION
Finally, transmission is another tool for increasing power system reliability during periods of peak
demand. Transmission provides better access to available power sources. Transmission allows regions to
share resources, so that if a generator fails in one region, generators in another region can provide
power to the affected area. Transmission can also link regions with non-coincident peak demand for
6 For a comprehensive overview of the principles of utility rate structure design, see Bonbright et al. (1988). 7 A survey of residential DLC programs is provided at https://www.clearlyenergy.com/residential-demand-
response-programs/. 8 Examples of DLC programs with different cycling requirements are provided at
http://www.constellation.com/business-energy/demand-response/pages/capacity-programs.aspx and
http://www.coned.com/energyefficiency/demand_response.asp. 9 Utilities can also employ conservation voltage reduction which reduces power consumed by appliances. This is
only utilized under extreme conditions to avoid blackouts.

10
electricity (such as the Northwest and California), therefore sharing resources and reducing the need for
peaking capacity. Transmission, therefore, can effectively act as a source of reliable capacity even in the
absence of adding any new generation within a particular area. Transmission upgrades can also act to
reduce losses, improving the efficiency of delivery and reducing the amount of capacity needed to meet
peak demand (Jackson et al. 2015).
COMPLYING WITH RULE 1: NEW OPTIONS
Today, new technologies provide utilities with new options for meeting peak demand and providing
reliable service. These options include variable generation (VG) like wind and solar power, smart grid
technologies and energy storage. These new options also provide new opportunities for DR programs.
Many of these options are relatively inexpensive and fast to deploy, especially as compared to
constructing traditional large, conventional power plants.
VARIABLE GENERATION
The cost and performance of VG resources like wind and solar photovoltaic (PV) systems have greatly
improved over the past decade, providing power system operators with viable new tools that can meet
peak demand. Due to their variable output, these new technologies are quite different from traditional
generation resources. Wind and solar units are only available to generate electricity when the wind is
blowing or the sun is shining, and for this reason they are often referred to as “variable generation”
resources and do not fit the traditional paradigm of building capacity to meet baseload, intermediate, or
peaking needs. Nonetheless, they can provide power during times of peak demand and be used to meet
reserve margins.
The value of a VG resource toward providing reliable capacity to meet planning reserve margins is
measured by its “capacity credit,” which is a ratio of the power output during peak demand periods and
the rated (nameplate) capacity of the variable resource.10 If a PV generator is rated at 100 MW, but only
typically produces 55 MW during peak demand periods, then the capacity credit for that generator
would be 55%. Studies of capacity credit show wide variation. The capacity credit for a fossil fuel or
nuclear plant is typically 90%–95%.11 Because wind resources are not typically well-correlated with peak
demand, wind capacity credits are generally low – in the range of 5%–40% (Keane et al. 2011). Capacity
credits for PV vary as well, as shown in Figure 2, but at low penetrations (less than 5%); capacity credits
range from approximately 30%–75%. The large range of estimates results from both methodological
differences and the regional variation in the coincidence of wind and solar generation with peak
demand. For example, peak loads in cooler climates such as the Pacific Northwest may be driven by
electric heating demand, which occurs during times of low solar output. Likewise, the wind output in the
United States tends to be lower during hot, sunny afternoons when air conditioning demand typically
peaks.
10 This explanation is a simplification of the calculations used to estimate the capacity credit of new generation
resources. For details, including a glossary of terms, see Madaeni et al. 2012. 11 Fossil and nuclear plants typically receive a capacity credit less than 100% due to unplanned plant outages and
summer derates.

11
Figure 2. Capacity credit of PV as a function of penetration for different regions. Dashed lines are
average (fleet-wide) capacity credit while solid lines are marginal capacity credit.
Because VG is not dispatchable, the contribution of VG to meeting reserve margins is often measured by
how it changes what is called “net load”. Net load is equal to the normal load minus wind and solar
generation.12 The result of this subtraction is the amount of load that must be met by conventional,
dispatchable generation. An important feature of Figure 2 is that the capacity credit declines with
penetration. This is because increasing amounts of solar generation on the system changes the time
when peak net load occurs.
This shift in peak net load is illustrated in Figure 3, which shows the load for three days in California,
using simulated solar data at increasing penetration (Denholm et al. 2016). At low penetration (5% and
10% in Figure 3), PV reduces the peak net load (i.e., the peak of the demand minus PV generation). But
at higher penetrations (15% and 20%), the peak net load does not continue to decline because the peak
has shifted to later in the day when PV is not generating. While PV continues to reduce demand during
the original peak period (about 4 p.m.), the new peak between 7 p.m. and 8 p.m. is not reduced.
12 Some sources define net load as load minus distributed generation. The definition we use here encompasses all
wind and solar generation.

12
Figure 3. Load and net load profiles for California under increased penetration of PV for three
representative days of peak demand in the summer
There are several options that can increase the capacity credit of VG resources. New transmission can
interconnect regions with different renewable energy (RE) resources and load patterns, which in turn
can increase the correlation between VG and peak load. Finally, there are a number of dispatchable (on-
demand) RE sources, including biomass, geothermal, and concentrating solar power with thermal
storage that provide both energy and capacity. These technologies can receive capacity credit equal to
those for conventional (dispatchable) generators.
DEMAND RESPONSE AND SMART GRID TECHNOLOGIES
While EE and DR have been part of utility planning for decades, the emergence of smart grid
technologies enables even greater opportunities for changing load shapes and reducing peak demand
and, hence, the need for traditional capacity to meet resource adequacy requirements. Smart grid
technologies include new devices such as smart meters and appliances that “talk” to the utility. These
types of devices allow for the use of innovative rate structures and other mechanisms to more cost-
effectively balance the demand and supply of electricity. In the United States, most residential
customers are charged based on how much total energy they use independent of when they use it.
However, these rate structures hide the true costs of electricity because the cost of generating
electricity at different times of the day and different times of the year varies dramatically. Thus,
electricity rates that only consider total consumption of electricity, but not when it is used (sometimes
called volumetric rates), do not provide incentives for load shifting. Despite this, volumetric energy rates
have been the norm because technologies to measure electricity use more accurately have been
expensive, and rates that vary with the time of day or year, or rates that vary with usage can be more
difficult for consumers to interpret. Modern smart grid technologies have reduced these metering costs
and can now provide consumers and utilities with information that better reflects the true costs of

13
electricity consumption in end-user rates and, therefore, offer incentives to consumers to conserve or
shift usage to periods of lower demand. As more consumers shift their usage to periods of lower rates,
peak capacity needs (and therefore overall costs) can be reduced.
The total cost of providing electricity includes the cost of both capacity and energy.13 Capacity costs
include building generators, transmission lines and distribution lines. Energy costs are the costs of
buying fuel to run the generators and the costs of operating them. Customer usage patterns determine
how much capacity and energy is needed and the corresponding costs that customers actually incur. Flat
rates, however, do not reflect differing patterns of consumption among consumers and may over-charge
or under-charge customers based on when customers use electricity.
To illustrate how this works, Figure 4 shows the hypothetical electricity consumption patterns for three
different consumers. All use the same total amount of energy during a day, but their pattern of usage is
very different. Consumer A’s demand for electricity is relatively flat. Consumer B’s use sharply spikes in
the middle of the day but is lower at night. Consumer C’s usage is more typical of the average consumer,
and utilities commonly employ this typical usage profile to set flat rates.
Figure 4. Example of identical energy use with different consumption patterns during a 24-hour period
Flat, energy-only retail rates ignore the potentially significant differences in capacity that each customer
requires to serve its load. In the Figure 4 scenario, the utility would need to build more capacity to meet
13 The cost to provide the capacity and energy needed to provide reliability are often separated out. These costs
are typically small when compared to capacity and energy costs needed to directly serve load but are needed to
provide necessary services to run the power system. Some of these are discussed under rules 3 and 4.

14
Consumer B’s demand. However, because Consumer B uses the same amount of electricity as
Consumers A and C, under a volumetric rate she would be charged the same amount. As a result
Consumer C would overpay for her “share” of the power system, while Consumer B would underpay,
because of her greater than average need for generation capacity.
Smart meter and grid technologies allow rates to be set that reflect the differences in cost of providing
energy to meet these different load profiles and, therefore, are more proportional to actual
consumption of services (both energy and capacity). Until recently, such technology was available but
prohibitively expensive for use by most residential consumers. Costlier meters and measuring practices
have been available to large commercial and industrial customers for some time.
Though still relatively rare, a number of new rate structures are now available to residential consumers
thanks to smart grid technologies. For example, demand-based rates charge the customer separately for
both the energy used and the capacity required to meet their load. A demand-based rate structure
imposes a per-kW (not per-kWh) charge based on the customer’s peak demand during each billing cycle.
A demand charge is used to pay for the cost of building and maintaining the generation, transmission,
and distribution capacity to meet that customer’s peak demand. A separate energy charge covers the
cost of fuel and other costs associated with operating generators and other parts of the grid. With these
more direct price signals, consumers have more information to adjust their demand or usage patterns,
which can reduce the need for new capacity. In the Figure 4 example, Consumer B’s rates would go up
to reflect the true cost of providing service, and, conversely, Consumer A’s rates would decline.
Alternatively, utilities can also use energy prices that vary throughout the day as generation costs
change. This structure is typically referred to as time-of-use pricing. With time-of-use pricing, utilities
charge different rates for electricity during different parts of the day. Other options include real-time
pricing and other rate structures that tie consumption patterns to actual costs. Real-time prices are
established by the actual cost of generating and delivering electricity during any given moment in time.
When prices are very high, smart appliances and devices could be programmed by the consumer to
reduce load, reducing the need for new generation capacity.
ENERGY STORAGE
Energy storage in the form of pumped hydro storage has long been a part of electric power system
planning and operation. Storage can provide an alternative to conventional capacity by storing
electricity during off-peak periods (historically during the early morning) and discharging during peak
hours. Off-peak charging can improve the efficiency of the power system by allowing the lowest
operational cost generators to remain online, while on-peak discharging tends to displace the highest
cost generators. This requires storage to have a sufficient number of hours of energy generation to
cover the peak demand period, which is typically up to eight hours in duration (Sioshansi et al. 2014). As
discussed in the following section, PV may decrease the length of the peak demand period and reduce
the storage capacity needed to meet peak demand, lowering costs. Beyond pumped hydro storage, a
number of emerging or not widely deployed storage technologies can also enhance reliable operation by
providing capacity. These technologies include compressed air energy storage, flywheels, new battery
technologies as well as various types of thermal energy storage. Thermal storage, such as storing ice

15
produced during off-peak periods, can reduce on-peak air conditioning demand and lessen the need for
additional peaking capacity.
SYNERGIES BETWEEN PV, DR, AND ENERGY STORAGE
Beyond the ability of PV, DR, and energy storage to separately provide capacity and replace
conventional generation, they also can work together to provide further benefits. By reducing the
duration of the peak demand period, PV can reduce the cost of energy storage needed to provide
reliable capacity, as well as increase DR availability. As shown previously in Figure 3, PV changes the
shape of the net load curve. This is shown in more detail in Figure 5, which illustrates two changes at
increased penetration of PV. First, there is a reduced amount of time between on-peak and off-peak
periods. Second, the overall on-peak period narrows. Reducing the amount of time between on-peak
and off-peak periods creates opportunity for DR. DR (particularly load-shifting DR) requires a load that
can be used earlier or later than would normally occur.
The second impact of solar on net load shape is the narrowing of the peak period. Figure 5
demonstrates how, in the summer, the number of hours of peak demand becomes shorter. Previous
analyses suggest that in a system with little or no PV, as much as eight hours of storage capacity may be
needed to achieve the same level of reliability as a traditional generator (Sioshansi et al. 2014). Long-
duration batteries with this amount of energy capacity are costly. Increasing VG penetration and
narrowing the peak demand period creates opportunity to meet demand using more affordable,
shorter-duration batteries. However, a narrower peak may also require additional flexibility on the
system as is discussed in the next section.
Figure 5. Increased PV penetration leads to shorter intervals of peak demand

16
RULE 2: POWER SYSTEMS MUST HAVE ADEQUATE FLEXIBILITY TO
ADDRESS VARIABILITY AND UNCERTAINTY IN DEMAND (LOAD) AND
GENERATION RESOURCES.
WHY FLEXIBILITY MATTERS
The demand for electricity varies from minute to minute and hour to hour, so grid operators constantly
vary the output from conventional generators to meet the variation in demand. Figure 1 in the previous
section shows that the demand for electricity varies significantly over a 24-hour period, with demand in
the summer almost doubling over the course of a day. As a result, even in the absence of any VG, system
planners need to ensure adequate system flexibility to accommodate highly variable demand on both an
hourly and seasonal basis. Increasing amounts of VG sources like wind and solar increases the variability
of net load. Therefore, a power system with increasing VG needs to be even more flexible to balance
supply and demand.
Figure 6. illustrates the impact of wind on net load, which, as noted earlier, is the power demand that
must be met by conventional generation. In this example, both the net load ramp rate and net load
ramp range increase, and, as a result, conventional generators must change output more than has
historically been required. For example, in the figure, on April 8, the system operator would normally
need to increase output from the generation fleet by as much as 4,000 MW per hour (blue line). With
added wind generation (red line), the system operator would instead need to increase output by as
much as 5,500 MW per hour to account for the increased variability in net load (green line), an increase
of 1,500 MW per hour. As shown previously in Figure 3, solar PV can also increase the net load
variability.
Figure 6. Increase in net load variability with added wind

17
COMPLYING WITH RULE 2: TRADITIONAL MEANS
As discussed in Section 1, variation in demand is typically met with intermediate-load or peaking plants
(often gas-fired) that can vary output on an hourly or sub-hourly basis. These units are used to meet
most of the day-to-day variation in demand, varying generation from low output during periods of low
demand to high (or full) output during periods of higher demand. Many of these plants may also turn off
during the evening or in the spring when demand is typically at its lowest. During hot summer days,
when demand is at its highest level, operators utilize peaking plants, which can start quickly and are
often run for just a few hours during the day.
Recent analysis has demonstrated that the
current fleet of installed generation can
typically provide sufficient system flexibility
to accommodate significant increases in
wind and solar generation (Cochran et al.
2015, Lew et al. 2013; Bloom et al. 2016).
These studies of systems with up to 35% VG
demonstrate that existing resources that are
“backed down” to accommodate VG can
typically ramp rapidly enough to provide
load following at 5-minute dispatch time
scales [see text box “System Ramping”]. The
implication of this finding is that, while VG
can increase ramping requirements, the
existing generation fleet is largely adequate
to meet this requirement. The average age
of the gas combined-cycle fleet and
combustion turbine fleet in the United States
is 12 and 16 years respectively (EIA 2016), so
this capacity can provide grid flexibility
services for the foreseeable future.
COMPLYING WITH RULE 2: NEW OPTIONS
Even as traditional means suffice to comply with Rule 2, much more can be done to increase the
flexibility of the grid and reduce costs while maintaining reliability. Analysis and recent experience
indicate that new policies and operational procedures can help the power system accommodate
increases in net load variability. Many of these are targeted toward unlocking flexibility that already
exists (CPUC 2015). For example, there may be contractual agreements that prevent a generator from
ramping (Lew et al. 2015).
In addition, regions throughout the United States are creating new incentives and standards for system
flexibility. Proposed standards typically set a flexibility requirement and allow market participants to
choose among existing or emerging technologies to meet the requirements. For example, the California
System Ramping
Power system operators have historically dealt with
often highly fluctuating demand in electricity. For
example, in 2006 the maximum 3-hour ramp
observed by the California Independent System
Operator was 11,072 MW as load ramped up from
30,252 MW to 41,342 MW the morning of July 22. By
planning and careful forecasting, the system was able
to increase the output of the generator fleet to meet
this change in demand. In 2014, the maximum 3-hour
ramp rate had actually dropped to 7,859 MW, in part
due to the impact of distributed PV, which reduces
the summer-time ramp rate (observable in Figure 5).
As PV penetration increases, the peak demand will
shift from summer to spring, and the CAISO predicts a
PV-driven 3-hour ramp of about 13,000 MW, or
about 15% higher than the 2006 ramp.

18
Public Utilities Commission requires that load-serving entities under its jurisdiction (primarily the state’s
three large investor-owned utilities) procure capacity with sufficient flexibility to address the largest
predicted 3-hour ramp rate in each month (CPUC 2014). Other system operators are developing tools
and practices to address shorter-duration ramps, particularly those created by solar and wind resource
uncertainty, by requiring flexibility reserves. While the specific technical requirements have yet to be
defined, flexibility reserves represent the ability to change generator output (or, in the case of demand
response, load) in response to forecasting errors associated with short-term variations in load or VG
resources (Xu and Tretheway 2012; Navid et al. 2011).
Newer, more flexible generation technologies
are also available. For example, gas-fired
generators tend to be more flexible than coal-
fired generators. If coal units were to be
replaced with more flexible gas-fired units as
they retire, system operators would increase
their ability to rapidly adjust generation. Certain
types of modern gas-fired generation are
capable of very fast ramp rates, and certain new
gas-fired combustion turbines and reciprocating
engines are capable of very short start times [see
text box “Flexible Generators”]. These units can
provide flexibility reserves without being online,
avoiding the need to operate a plant at less than
its full potential output, which can reduce
efficiency and increase costs. In addition, certain
coal units and potentially some nuclear units are
capable of operating flexibly.
However, many of the new and emerging
technologies that provide conventional capacity
(discussed in Rule 1) can also be used to provide
grid flexibility, reducing the need to construct
new natural gas plants to provide flexibility.
Advanced biomass and concentrating solar
power equipped with thermal energy storage
provide fast ramping capability (Jorgenson et al.
2014). DR with the appropriate pricing signals
can be used to vary load in response to extreme
or unexpected ramp events, and most storage
technologies can ramp as fast as or faster than
conventional generators (Ma et al. 2016). Finally,
VG itself can be used to mitigate ramp events via
curtailment (reduction in output from a
generator from what it could otherwise produce
Flexible Generators
Several modern generator types are capable of
starting and reaching full load in as few as 5–10
minutes. These include aeroderivative gas
turbines and reciprocating engines.
Aeroderivative turbines are similar to traditional
gas turbines, but the moving parts are derived
from aircraft jet engines and are therefore very
light. This allows the turbines to change output
rapidly in response to the variation in demand
that can be created by wind and solar resources.
Reciprocating engines, similar to vehicle engines,
can also start rapidly. Both aeroderivative and
reciprocating generators have been installed in
locations needing generators that can provide
responsive capacity without the need to keep
traditional generators online.
Dispatching Wind
In several regions of the country, wind has
become a dispatchable resource. The output of
wind energy can be controlled to reduce output
when the supply exceeds demand. Operators can
also deliberately reduce output in order to ramp
the plant up and down to follow load or provide
reserves. Using dispatchable wind, one utility
(Xcel Energy in Colorado) has been able to serve
over 60% of its load with wind power during
certain hours of the year (Bird et al. 2014).

19
given available resources) [see text box “Dispatching Wind”]. Curtailment of VG incurs the cost of lost
energy production and is typically avoided, but occasional curtailments can be effective for helping
balance supply and demand, managing transmission overloads and maintaining system reliability.
Specifically, curtailments can be less costly than shutting down and starting up a conventional power
plant for a few hours during short periods of high VG output.

20
RULE 3: POWER SYSTEMS MUST BE ABLE TO MAINTAIN STEADY
FREQUENCY
WHY STEADY FREQUENCY MATTERS
The U.S. power grid uses alternating current, meaning that the flow of electricity in a power line
switches direction rapidly. This change in direction is measured by its frequency, the number of times
per second the current changes direction. In the United States, the frequency is 60 cycles per second
(Hertz, abbreviated Hz).
The frequency is determined by how fast the generators spin. All conventional fossil, nuclear, and
hydroelectric generators are “synchronous” generators, meaning they are all “synchronized” with each
other spinning at some multiple of 60 Hz (see text box “Spinning Generators”). Figure 7 provides a
simplified representation of the existing grid. The blue motors represent synchronous generators that all
act in unison to “spin” the grid at 60 Hz. The coupling (synchronization) of the generators to the grid is
represented by the chains.
It is important for this frequency to remain
constant. Many motors and other machines
are designed to operate based on receiving
60 Hz electricity. If the frequency were to
change significantly, machines and
electronics can be damaged. Automatic
controls help prevent extreme damage
from frequency changes. If the frequency
drops beyond a certain point, protection
systems automatically initiate “under-
frequency load shedding” and disconnect a
certain part of the grid (neighborhoods, city
blocks, etc.). This protects the machinery but at the cost of a blackout for some of the grid. The ability to
maintain a stable frequency prevents a single plant or transmission line failure from triggering a wide-
spread power outage.
To maintain system frequency and avoid power outages, system operators employ operating reserves
that are able to respond to unplanned events. These events can be a short as a few seconds or minutes
due to unexpected changes in load or generation not accounted for under economic dispatch, or as long
as days or weeks in the event that a transmission line or power plant fails. Operating reserves represent
spare capacity to deal with this unplanned variability of demand or supply, including unplanned outages
that can occur rapidly. If one of the generators in Figure 7 were to fail unexpectedly, the other
generators must have enough capacity to provide the needed electricity, while maintaining a frequency
of 60 Hz.
Figure 7. Representation of the existing grid powered
by synchronous generators
21
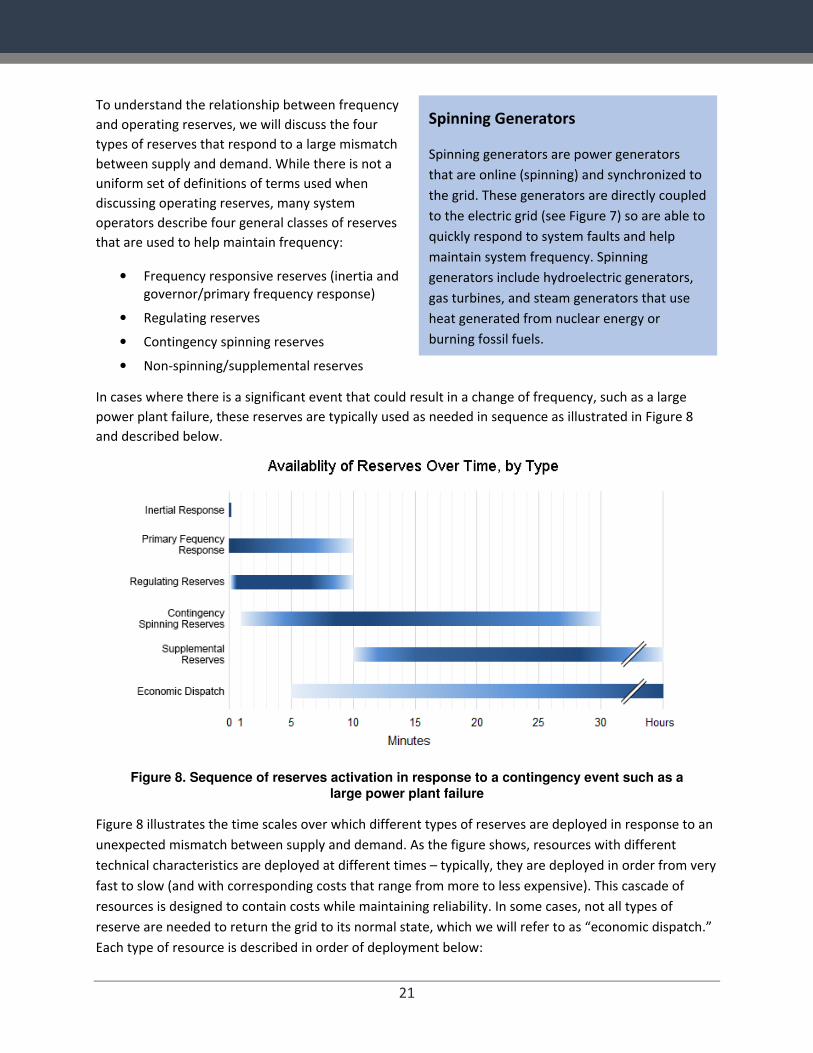
To understand the relationship between frequency
and operating reserves, we will discuss the four
types of reserves that respond to a large mismatch
between supply and demand. While there is not a
uniform set of definitions of terms used when
discussing operating reserves, many system
operators describe four general classes of reserves
that are used to help maintain frequency:
• Frequency responsive reserves (inertia and
governor/primary frequency response)
• Regulating reserves
• Contingency spinning reserves
• Non-spinning/supplemental reserves
In cases where there is a significant event that could result in a change of frequency, such as a large
power plant failure, these reserves are typically used as needed in sequence as illustrated in Figure 8
and described below.
Figure 8. Sequence of reserves activation in response to a contingency event such as a
large power plant failure
Figure 8 illustrates the time scales over which different types of reserves are deployed in response to an
unexpected mismatch between supply and demand. As the figure shows, resources with different
technical characteristics are deployed at different times – typically, they are deployed in order from very
fast to slow (and with corresponding costs that range from more to less expensive). This cascade of
resources is designed to contain costs while maintaining reliability. In some cases, not all types of
reserve are needed to return the grid to its normal state, which we will refer to as “economic dispatch.”
Each type of resource is described in order of deployment below:
Spinning Generators
Spinning generators are power generators
that are online (spinning) and synchronized to
the grid. These generators are directly coupled
to the electric grid (see Figure 7) so are able to
quickly respond to system faults and help
maintain system frequency. Spinning
generators include hydroelectric generators,
gas turbines, and steam generators that use
heat generated from nuclear energy or
burning fossil fuels.

22
1. Frequency Responsive Reserves
A. Inertial Response. When there is mismatch in the supply and demand for electricity, the
frequency of the grid will begin to change, but the inertia of the generators on the grid
will delay that process (inertia is the physical property of spinning machines that
reduces rate of change of frequency). When this occurs, all the spinning generators
currently synchronized to the grid will continue to spin due to their stored inertia.
However, the frequency of the system will begin to change as more energy is removed
from or added to the grid due to the mismatch between supply and demand. The rate at
which the frequency changes is determined by the magnitude of the imbalance between
load and generation and the total inertia of the system. Large spinning generators on
the grid can slow the rate of change in frequency and provide time for systems to detect
those changes and respond accordingly.
B. Primary Frequency Response. Primary frequency response is one of two parts of the
“cruise control” of the electric power system. Primary frequency response (sometimes
known as governor response) detects changes in frequency and automatically adjusts
operations of online generators to maintain frequency within the desired range.
Governors (the devices that sense frequency) can be installed on any conventional
fossil, nuclear, or hydro generator, but grid disturbances are typically not so large that
governors are needed on all generators.
2. Regulating Reserves. While inertia and primary frequency response occur system-wide and
work automatically to prevent large frequency deviations, additional actions are needed locally
to restore the system to its “pre-event” state—spinning at 60 Hz with all generators operating as
scheduled. Regulating reserves are the second part of the “cruise control” of the power system
that works to reset the system to “normal” conditions and correct any imbalance resulting from
localized mismatches between supply and demand. Systems can measure the unscheduled flow
of power into or out of the region where local generation is not matching load, and computers
can signal generators in that area to modify their output as needed. Regulating reserves are
provided by any synchronized (spinning) generation/storage resources that can receive these
automated signals and rapidly ramp (begin changing output within seconds and reach the new
desired setpoint within minutes).
3. Contingency Spinning Reserves. A power plant or other significant failure is often referred to as
a “contingency.” When a contingency occurs, the automated “cruise control” systems listed
above take action to correct and restore frequency and power flows. Systems do not typically
have enough primary frequency response capacity and regulating reserves to handle large
contingencies. Furthermore, the use of these services depletes their effectiveness for further
response, such as another contingency or other unscheduled variation in supply or demand.
System operators address large contingency events using a dedicated class of reserves known as
contingency spinning reserves. Spinning reserves are like an additional synchronized engine that
can be engaged quickly when needed to maintain performance. They are provided by partially
loaded conventional generation/storage resources, with enough spare capacity (in aggregate) to
meet the failure of the single-largest power plant or transmission line in the system.
4. Non-spin/Replacement/Supplemental Reserves. If contingency reserves are engaged, system
operators must eventually restore them to a reserve status. Otherwise, another contingency
could find them without enough spare capacity to meet this second event. To prevent this,
power system operators hold supplemental reserves, which are typically fast-starting units that
can start and begin providing energy within about 10 minutes. System operators activate

23
supplemental reserves to “relieve” the contingency reserves units so that they are ready to be
called upon again. Any plant that can begin generating within 10 minutes can provide these
reserves.
5. Economic Dispatch (normal system operation). Non-spinning reserves are eventually replaced
by the normal economic dispatch of conventional generators, as the system is restored to a pre-
contingency state.
COMPLYING WITH RULE 3: TRADITIONAL MEANS
Traditionally, conventional resources such as coal, gas, and nuclear power have provided nearly all of
the system’s inertia, primary frequency response and regulating reserves. An important point is that,
while reserves are an important part of reliable system operation, the amount of reserves needed is
relatively small compared to the total capacity requirements. Table 1 summarizes the regulating and
spinning contingency reserve requirements held by different operators and demonstrates that larger
areas can typically carry fewer reserves on a relative basis due to the fact that a greater aggregation of
supply and demand reduces overall variability.
Table 1. Regulating and Spinning Contingency Reserve Requirements in U.S. Wholesale Markets
Region Regulating Reserve Spinning Contingency Reserve 2013 Demand
CAISO average (varies): ~338 MW up, ~325 MW down
~850 MW (average) peak: 45,097 MW
average: 26,461 MW
ERCOT average (varies): ~300 MW down, ~500 MW up
range: 400–900 MW
2,800 MW (maximum of 50% from load)
peak: 67,245 MW
average: 37,900 MW
MISO range: 300–500 MW 1,000 MW (2,000 MW total and 1,000 MW of spin)
peak: 98,576 MW
average: 52,809 MW
PJM average: 753 MW in 2013e 1,375 MW (Tier 2; maximum of 33% from DR)f
peak: 157,508 MW
average: 89,560 MW
ISO-NE average 60 MW
range 30–150 MW
10-minute reserve: 1,750 MW
30-minute reserve: 2,430 MW
peak: 27,400 MW
average: 14,900 MW
NYISO 150–250 MW 10-minute spin: (330 east zone, 655 MW NY control area
10-minute total 1,310 MW
peak: 33,956 MW
average: 18,700 MW
SPP average: ~300 MW up, ~320 MW down
545 MW peak: 45.256 MW
average: 26,360 MW
Source: Denholm et al. 2015

24
COMPLYING WITH RULE 3: NEW OPTIONS
The current transformation of the grid affects Rule 3 in many ways. The increased deployment of VG
changes the reserve requirements needed to maintain a steady frequency on the grid. At the same time,
it is possible for VG to provide the needed reserves at little additional cost, and there are also new
technologies like energy storage and demand response that can provide needed reserves.
VARIABLE GENERATION
VG impacts reserve requirements in several ways. First, it reduces generation from conventional
generators, and the inertia in generators that are not operating is thus removed from the system. VG
such as wind and solar uses power electronics (inverters) rather than synchronous generators to
connect to the grid, so it does not replace the physical inertia from conventional generators. As a result,
replacing conventional generation with VG typically reduces real inertia and traditional frequency
response. Figure 9 illustrates a grid where some of the synchronous generators have been replaced with
inverter-based generators (illustrated in green). These generators are “loosely coupled” to the grid and
do not automatically respond to a grid fault.
VG also is not always completely
predictable, even on short timescales. This
can increase the potential for mismatches
between generation and load and, hence,
the need for increased regulating reserves.
Several studies and real-world experience of
power system operators indicate that
increasing the amount of VG on the system
slightly increases reserve requirements to
maintain frequency stability (Ela et al.
2011). VG increases variability of the net
load on various timescales, including very
short time scales. As a result, an important
area of study has been to estimate the
change in reserves needed to address this increase in net load variability.
Table 2 summarizes several studies that consider the additional reserves needed when wind power is
added to a power system. These studies demonstrate a modest increase in regulating reserve
requirements. Furthermore, recent experience has demonstrated little need for additional regulating
reserves. As an example, MISO found that the addition of 12 GW of wind resulted in no need for
additional regulating reserves (Navid 2013). While this result may be surprising, it highlights the
timeframe of the variability of wind. The output from wind does not change drastically over seconds or
even a few minutes, and thus the need for additional regulating reserves is limited. Furthermore, over
longer time scales, improved wind forecasting has decreased the need for operating reserves needed to
address wind uncertainty (Milligan et al. 2015).
Figure 9. Representation of a grid with both
synchronous and inverter-based generators

25
Despite rapid growth in recent years, the penetration of PV is still quite low, and, as a result, the impact
of PV on reserve requirements has yet to be determined. While the output of a single PV system can
change rapidly due to passing clouds, over large regions the aggregated output of many PV systems is
much smoother and easier to predict. Variability in PV output is thus driven by longer-term weather
impacting output over periods of many minutes to hours. This type of variation is the driving motivation
to create a new “flexi-ramp” reserve product, which can create a more economic method to incorporate
VG. VG also does not add to the need for contingency spinning reserves (those used to address the
largest single point of failure in the system) unless a single wind or solar plant (or a transmission line
collecting multiple wind/solar generators) becomes the single-largest contingency (point of failure).
Table 2. Additional Regulating Reserve Requirements Due to the Addition of VG
Location VG Added/ System Size Increase in Regulating Reserves
New York 3,300 MW of wind on system with projected peak load of 33,000 MW 36 MW
Minnesota 5,700 MW of wind on system with peak load of 20,984 MW (providing 25% of total demand)
20 MW
Arizona 1,260 MW of wind providing 10% of annual demand 6.2 MW
Texas (ERCOT)
15,000 MW of wind 53 MW
California (CAISO)
6,700 MW of wind Up to 230 MW
Source: Ela et al. 2011
One of the first U.S. studies to examine the impact of VG on frequency stability is the Western Wind and
Solar Integration Study phase 3 (GE 2014). This study simulated the electric grid with more renewables
in the western part of the United States. The study examined multiple scenarios of increased VG to
determine whether a large contingency would lead to frequency collapse under various scenarios. The
study found that, in simulations where VG was providing up to about 35% of the annual demand, the
system operated normally in the case of a large power plant failure and was able to maintain enough
primary frequency response to avoid under frequency load shedding where certain customers are
dropped (blackouts) to restore the balance between supply and demand.14 In some of the simulations,
up to 64% of the total demand in any given moment in time was being met by VG. So, even when a large
fraction of the demand was being met by VG, there was enough “residual” inertia and primary
frequency response to prevent a blackout caused by under frequency load shedding.
Even as some large spinning generators retire, the existing generators still contribute to maintaining a
stable frequency. To the extent that this generation is replaced with natural gas, those generators also
help maintain stability in the traditional manner. However, many of these generators may be replaced
with VG which is also capable of providing valuable “active power control” services for the grid (GE
14 In this study the failure was the loss of two of the three units of the Palo Verde nuclear plant, a loss of about
2,750 MW.
26
2014, Gevorgian and O’Neill 2016). Active power control is sometimes used to describe the set of
frequency stabilizing services including inertia, primary frequency response, and regulating reserves.
With sensors and controls that monitor grid frequency, VG generators can change output as needed to
provide active power control. Wind turbines can draw stored energy from the rotor to help arrest a
frequency decline or can be operated at reduced output during periods of high VG penetration to
provide “synthetic” inertia and primary frequency response. For wind and solar to increase output and
respond to a grid fault, they typically have to be operated at less than full capacity. At low levels of VG
penetration, the power system typically has plenty of reserves available from other resources, so it does
not make economic sense to provide these services from VG. However, at increased penetration, it may
make sense to selectively curtail wind and solar to provide a variety of grid stability and reserve services.
Active power control from wind turbines is now available from many manufacturers and has been
installed in the United States. For example, the Texas grid operator now requires wind generators to
provide primary frequency response, which helps keep a system stable in the initial moments after a
disturbance (Bird et al. 2014). In addition, FERC is also requesting comment on issues involving potential
requirements for primary frequency response on new and existing generation and how compensation
for such a requirement might work.15 For the most part, active power control involves very little change
to existing turbines (mostly software changes).
Provision of reserves from VG will require new mechanisms, whether market incentives or
interconnection requirements or other means, to ensure that inverter-based wind and solar generators
can meet the frequency response needs of the grid as they become a larger proportion of the
generation fleet and displace traditional synchronous machines.
DEMAND-RESPONSE
DR can provide reserves and grid stability services.
Several regions of the United States already derive a
significant amount of operating reserves from DR. DR
can provide active power control in the same way
that generators can, by sensing frequency changes
and decreasing load. Some regions, such as ERCOT,
have programs where certain electricity consumers
have loads that disconnect when they sense a drop in
frequency, allowing them to provide a combined
primary frequency response/contingency reserves
service. The ERCOT grid now derives 50% of its
contingency reserves from DR in the form of this “fast
frequency response”, which is the maximum
currently allowed by ERCOT market rules (Potomac
Economics 2014). The emergence of restructured
markets [see text box “Load as a Resource”], new
15 See https://www.ferc.gov/whats-new/comm-meet/2016/111716/E-3.pdf.
Load as a Resource
Through a variety of demand response
programs, load has increasingly become a
resource for utilities and system operators.
For example, the ERCOT (Texas) “Load
Resource” program now allows the demand
from large industrial customers to provide
the exact same services as conventional
generators, including being scheduled to
vary demand and provide operating reserves
(Potomac Economics 2014). For smaller
consumers, aggregators act as a broker,
combining the demand from many individual
customers and allowing them collectively to
sell market services by adjusting demand.

27
communication (smar0t grid) technologies, and rules allowing smaller entities to participate via the use
of DR aggregation programs will likely increase the role of DR in providing reserves.
ENERGY STORAGE
Most forms of energy storage, including pumped storage, compressed air energy storage and batteries,
can provide multiple reserve services, and storage often has greater ramp rates than conventional
generators. Pumped storage and compressed air energy storage utilize synchronous generators that
provide real inertia and can provide primary frequency response. Other types of storage including
flywheels and batteries do not use synchronous generators but can provide synthetic inertia and
primary frequency response in the same way it would be done with wind or solar. Storage devices such
as flywheels and batteries have been installed specifically for the purpose of providing regulating
reserves. The Western Wind and Solar Integration Study phase 3 (GE 2014) found that a relatively small
amount of storage could provide significant grid stability benefits across the entire Western
Interconnection.
TRANSMISSION
Transmission can reduce the variability of overall net load in any individual region by connecting regions
together into larger areas, averaging out the changes in variable generation. Transmission also allows for
greater spatial diversity of VG resources, and the associated “averaging” will tend to level out much of
the very short term variability. This can lower regulating and contingency reserve requirements.
Because it links more generators together in one power system, transmission increases the amount of
system inertia. It also allows for greater sharing of all resources including primary frequency response.
OTHER TECHNOLOGIES
There are a number of technologies that can provide grid stability services when replacing traditional
generators. One example is a synchronous condenser, which is a generator that has been
“disconnected” from its turbine; this lets the generator spin freely and provide inertia and other grid
services. Historically, synchronous condensers were used to provide voltage control (see the next
section), but now system planners are
considering them for additional applications,
such as the provision of inertia. These
devices can use the generators from
decommissioned units or could be installed
in new sites. One opportunity would involve
installing clutches on new power plants so
the generator could provide inertia even
when the power plant is not running [see
text box “Synchronous Condensers”].
Synchronous Condensers
Utilities in several locations have found it useful to re-
purpose old power stations as “synchronous
condensers.” When the old generator spins (powered
by grid electricity), it acts as a giant flywheel and
helps control and stabilize both voltage and
frequency.

28
RULE 4: POWER SYSTEMS MUST BE ABLE TO MAINTAIN STEADY
VOLTAGE AT VARIOUS POINTS ON THE GRID
WHY VOLTAGE STABILITY MATTERS
Ensuring electric system reliability requires maintaining both frequency (discussed in the previous
section) and voltage. While frequency is constant throughout the grid, voltage varies depending on
location. Figure 10 summarizes the voltage levels in different parts of the grid.
Figure 10. Power systems maintain voltage at different levels in different parts of the power system

29
In a sense, voltage in the electrical system is analogous to “pressure” in a fluid system, and each part of
the grid is designed to work at a specific voltage level. Voltage that is too high or too low can result in
malfunction or damage to electrical devices. To provide reliable service, power system operators
continuously adjust voltage at various points on the grid to keep voltage stable or within a certain
tolerance. As with frequency decay, voltage collapse is possible when there is insufficient voltage control
to maintain steady voltage after an equipment failure on the grid.16 Devices that provide voltage control
maintain appropriate voltage on the grid during both normal operating conditions and fault conditions.
COMPLYING WITH RULE 4: TRADITIONAL MEANS
Power system operators use a variety of electrical devices to maintain voltage throughout the grid.
Conventional generators typically produce about 10,000-25,000 volts (Figure 9), which is “stepped-up”
to as much as 765,000 volts for transmission. The higher voltage results in lower losses allowing energy
to be efficiently transmitted over long distances. To deliver electricity to homes and businesses, voltage
is then “stepped-down” as electricity moves to the distribution network, and then stepped-down
again—typically to about 240 or 120 volts—for residential and commercial customers. Changes in
voltage between different parts of the transmission and distribution system are accomplished via
transformers.
Voltage is controlled by different methods at different points of the grid. A key element of controlling
voltage at each point on the grid is the ability to inject or absorb reactive power. Reactive power is a
property of AC electrical current that is needed to maintain the flow of power. Too much or too little
reactive power can reduce the flow of power and result in inadequate voltage. Reactive power cannot
be transmitted over long distances.17 Therefore, voltage control is performed at each of the three major
parts of the grid:
• At the point of generation, by monitoring local voltage levels and adjusting the spinning
synchronous generator’s reactive power output to maintain voltage at a specified level.
• In the transmission network, using electrical devices including shunt capacitors (to supply
reactive power and increase voltage), shunt reactors (to absorb reactive power and lower
voltage), electro-mechanical devices such as load tap changing transformers (to increase or
decrease the how much a transformer steps up or steps down voltage) and power electronic
equipment that actively injects or absorbs reactive power.
• At the distribution network, using similar types of devices as on the transmission network to
provide local voltage control.
16 An example of an event caused by voltage collapse was the 2003 East Coast blackout. See U.S.-Canada Power
System Outage Task Force. 2004. 17 For additional discussion of reactive power, see FERC 2005. Principles for Efficient and Reliable Reactive Power
Supply and Consumption at http://www.ferc.gov/CalendarFiles/20050310144430-02-04-05-reactive-power.pdf.

30
COMPLYING WITH RULE 4: NEW OPTIONS
Today, new technologies based on power electronics supplement the traditional voltage control tools
listed above. Power electronics can quickly and efficiently absorb or generate reactive power. Typically,
power electronics are inexpensive and are built into inverters used by VG or energy storage devices or
installed as stand-alone devices.
VARIABLE GENERATION
The power electronics built into wind turbines and PV inverters are well-suited to providing voltage
control and reactive power. In 2016, FERC issued order 827 requiring VG units over 20 MW to provide
reactive power (FERC 2016), and even before this utilities and system operators were increasingly
requiring VG units to provide voltage control (Milligan et al. 2015). Using the power electronics that
already exist in VG resources to control voltage often involves little more than software changes.
ENERGY STORAGE
Pumped storage and compressed air energy storage utilize synchronous generators that can provide
voltage control in the same manner as conventional generators. However, many other types of storage,
including flywheels and batteries, use power electronics to generate 60 Hz AC power. The use of power
electronics allows energy storage devices to easily provide local voltage control similar in manner to VG
devices.
OTHER STAND-ALONE POWER ELECTRONIC DEVICES
Power system operators also have new tools to control voltage at the transmission level in the event of
a grid disturbance. Commonly grouped under the term Flexible AC Transmission Systems (FACTS), these
power electronics-based devices can provide fast voltage control in response to grid disturbances.18
While FACTS devices have existed for decades (Hingorani and Gyugyi 1999), decreasing costs and new
technologies provide utilities with new options. These devices are typically scalable, so they can be
installed relatively quickly in the right size to perform the necessary job, which can reduce or defer the
need to build transmission lines or large power plants. FACTS can typically be located close to areas of
potential concern. Overall, modern power electronics can solve many voltage control problems that
historically would have required larger and more costly generators, transmission lines or electro-
mechanical devices.
OTHER TECHNOLOGIES
Beyond these new technologies, as old generators are retired, some areas of the grid may have
insufficient local reactive power to maintain voltage stability. In these cases, the retired generator is
sometimes put to a new use as a stand-alone synchronous condenser to provide local reactive power.
18 They include static var compensators, static synchronous compensators, thyristor controlled phase shifting
transformers, unified power flow controllers, and thyristor controlled series compensation. See CIGRE, “Overview
of Flexible AC Transmission Systems, FACTS”.
http://b4.cigre.org/content/download/1973/25265/version/2/file/FACTS+overview_Cigr%C3%A9+B4_What+is+FA
CTSID10VER39.pdf.
31
CONCLUSION In the United States, the reliable power system underpins our economy and quality of life. That
reliability has been designed into our system. Historically, power system operators have had a limited
set of tools at their disposal to balance power supply and demand and maintain proper frequency and
voltage at all times, but these tools—primarily large spinning generators in addition to specialized
equipment used to maintain voltage—have worked very well. Today, power systems are evolving, and
many of those generators are retiring. However, at the same time, the evolution of the power system
has provided a new toolbox for maintaining reliability. As more variable generation is built, it can be
used to maintain reliability in ways similar to the generation it is replacing, and new, more affordable
power electronics create new opportunities for DR programs and other tools for balancing supply and
demand. With this new toolbox and continued careful planning, coordination, and investment, reliability
can remain a trademark characteristic of our evolving power system.

32
REFERENCES Bird, L., J. Cochran, and X. Wang. 2014. Wind and Solar Energy Curtailment: Experience and Practices in
the United States. NREL/TP-6A20-60983. Golden, CO: National Renewable Energy Laboratory.
http://www.nrel.gov/docs/fy14osti/60983.pdf.
Bloom, Aaron, Aaron Townsend, David Palchak, Joshua Novacheck, Jack King, Clayton Barrows, Eduardo
Ibanez, Matthew O’Connell, Gary Jordan, Billy Roberts, Caroline Draxl, and Kenny Gruchalla.
2016. Eastern Renewable Generation Integration Study, NREL/TP-6A20-64472-ES. Golden, CO:
National Renewable Energy Laboratory. http://www.nrel.gov/docs/fy16osti/64472-ES.pdf.
Bonbright, James, Albert Danielsen, David Kamerschein. Principles of Public Utility Rates. Public Utilities
Report, Incorporated. 1988.
CAISO. 2007. Integration of Renewable Resources. CAISO.
http://www.caiso.com/1ca5/1ca5a7a026270.pdf.
CAISO (California Independent System Operator). 2013. Annual Report on Market Issues and
Performance. CAISO.
Cappers, P., J. MacDonald, and C. A. Goldman. 2013. Market and Policy Barriers for Demand Response
Providing Ancillary Services in U.S. Markets, LBNL-6155E. Berkeley, CA: Ernest Orlando Lawrence
Berkeley National Laboratory. https://emp.lbl.gov/sites/all/files/lbnl-6155e.pdf.
CPUC (California Public Utilities Commission). 2014. 2015 Filing Guide for System, Local and Flexible
Resource Adequacy (RA) Compliance Filings. CPUC.
CPUC. 2015. Beyond 33% Renewables: Grid Integration Policy for a Low-Carbon Future. CPUC.
Cochran, J., P. Denholm, B. Speer, and M. Miller. 2015. Grid Integration and the Carrying Capacity of the
U.S. Grid to Incorporate Variable Renewable Energy, NREL/TP-6A20-62607. Golden, CO: National
Renewable Energy Laboratory. http://www.nrel.gov/docs/fy15osti/62607.pdf.
Denholm, Paul, J. Eichman, T. Markel, and O. Ma. Summary of Market Opportunities for Electric Vehicles
and Dispatchable Load in Electrolyzers. No. NREL/TP-6A20-64172. National Renewable Energy
Laboratory (NREL), Golden, CO (United States), 2015.
http://www.nrel.gov/docs/fy15osti/64172.pdf.
Denholm, Paul, Kara Clark, and Matt O’Connell. 2016. On the Path to SunShot: Emerging Issues and
Challenges in Integrating High Levels of Solar into the Electrical Generation and Transmission
System, NREL/TP-6A20-65800. Golden, CO: National Renewable Energy Laboratory.
http://www.nrel.gov/docs/fy16osti/65800.pdf.
EIA (Energy Information Administration). 2012. “Today in Energy: State Electric Retail Choice Programs
are Popular with Commercial and Industrial Customers.” Last modified May 14.
http://www.eia.gov/todayinenergy/detail.cfm?id=6250.
EIA. 2013. Electric Power Annual 2012. Washington, DC: U.S. Department of Energy.
EIA. 2016. “Form EIA-860 Detailed Data.” Last modified June 17.
https://www.eia.gov/electricity/data/eia860/.
Ela, E., B. Kirby, N. Navid, and J. C. Smith. 2012. “Effective Ancillary Services Market Designs on High
Wind Power Penetration Systems,” NREL/CP-5500-57683. Proceedings of the 2012 IEEE Power
and Energy Society General Meeting, San Diego, CA, 22–26 July. Piscataway, NJ: Institute of
Electrical and Electronics Engineers. http://dx.doi.org/10.1109/PESGM.2012.6345361.

33
Ela, E., M. Milligan, and B. Kirby. 2011. Operating Reserves and Variable Generation. NREL/TP-5500-
51978. Golden, CO: National Renewable Energy Laboratory.
http://www.nrel.gov/docs/fy11osti/51978.pdf.
FERC (Federal Energy Regulatory Commission). 2012. Energy Primer A Handbook of Energy Market
Basics. Washington, DC: FERC.
FERC. 2014. Assessment of Demand Response and Advanced Metering. Washington, DC: FERC.
http://www.ferc.gov/legal/staff-reports/2014/demand-response.pdf.
FERC. 2015. “Open Access Transmission Tariff (OATT) Reform.” Last modified May 11.
http://www.ferc.gov/industries/electric/indus-act/oatt-reform.asp.
FERC. 2016. Reactive Power Requirements for Non-Synchronous Generation, Order No. 827.
http://www.ferc.gov/whats-new/comm-meet/2016/061616/E-1.pdf.
GE Energy. 2005. The Effects of Integrating Wind Power on Transmission System Planning, Reliability,
and Operations: Report on Phase 2. Prepared by General Electric International, Inc.,
Schenectady, NY. Albany, NY: The New York State Energy Research and Development Authority.
GE Energy. 2008. Analysis of Wind Generation Impact on ERCOT Ancillary Services Requirements.
Prepared by General Electric International, Inc., Schenectady, New York. Electric Reliability
Council of Texas. http://www.uwig.org/attchb-ercot_a-s_study_final_report.pdf.
GE Energy. 2014. Western Wind and Solar Integration Study Phase 3: Frequency Response and Transient
Stability, NREL/SR-550-62906. Prepared by GE Energy Management, Schenectady, NY. Golden,
CO: National Renewable Energy Laboratory. http://www.nrel.gov/docs/fy15osti/62906.pdf.
Gevorgian, Vahan, and Barbara O’Neill. 2016. Advanced Grid-Friendly Controls Demonstration Project for
Utility-Scale PV Power Plants, NREL/TP-5D00-65368. Golden, CO: National Renewable Energy
Laboratory. http://www.nrel.gov/docs/fy16osti/65368.pdf.
Hingorani, Narain G., and Laszlo Gyugyi. 1999. Understanding FACTS: Concepts and Technology of
Flexible AC Transmission Systems. Wiley-IEEE Press.
Hummon, M., P. Denholm, J. Jorgenson, T. Jenkin, D. Palchak, B. Kirby, and O. Ma. 2013. Fundamental
Drivers of the Cost and Price of Operating Reserves, NREL/TP-6A20-58465. Golden, CO: National
Renewable Energy Laboratory. http://www.nrel.gov/docs/fy13osti/58491.pdf.
Jackson, R., O. C. Onar, H. Kirkham, E. Fisher, K. Burkes, M. Starke, O. Mohammed, and G. Weeks. 2015.
Opportunities for Energy Efficiency Improvements in the U.S. Electricity Transmission and
Distribution System, ORNL/TM-2015/5. Oak Ridge, TN: Oak Ridge National Laboratory.
http://energy.gov/sites/prod/files/2015/04/f22/QER%20Analysis%20-
%20Opportunities%20for%20Energy%20Efficiency%20Improvements%20in%20the%20US%20El
ectricity%20Transmission%20and%20Distribution%20System_0.pdf.
Jorgenson, Jennie, Paul Denholm, and Mark Mehos. "Estimating the value of utility-scale solar
technologies in California under a 40% renewable portfolio standard." National Renewable
Energy Laboratory, Technical Report, TP-6A20-61685 (2014).
http://www.nrel.gov/docs/fy14osti/61685.pdf.
Keane, Andrew, Michael Milligan, Chris J. Dent, Bernhard Hasche, Claudine D'Annunzio, Ken Dragoon,
Hannele Holttinen, Nader Samaan, Lennart Soder, and Mark O'Malley. "Capacity value of wind
power." IEEE Transactions on Power Systems 26, no. 2 (2011): 564-572.
Lew, D., G. Brinkman, E. Ibanez, A. Florita, M. Heaney, B. M. Hodge, M. Hummon, G. Stark, J. King, S. A.
Lefton, N. Kumar, D. Agan, G. Jordan, and S. Venkataraman. 2013. The Western Wind and Solar

34
Integration Study Phase 2, NREL/TP-5500-55588. Golden, CO: National Renewable Energy
Laboratory. http://www.nrel.gov/docs/fy13osti/55588.pdf.
Lew, D., M. Schroder, N. Miller, and M. Lecar. 2015. Integrating Higher Levels of Variable Energy
Resources in California. Prepared by GE Energy Consulting, Schenectady, NY. Large-scale Solar
Association. http://www.largescalesolar.org/files/Final-CA-VER-Integration-6-15-15.pdf.
Ma, O., N. Alkadi, P. Cappers, P. Denholm, J. Dudley, S. Goli, M. Hummon, S. Kiliccote, J. MacDonald, N.
Matson, D. Olsen, C. Rose, M.D. Sohn, M. Starke, B. Kirby, and M. O’Malley. 2013 “Demand
Response for Ancillary Services.” IEEE Transactions on Smart Grid 4(4): 1988–1995.
Ma, O., K. Cheung, N. Alkadi, D. Bhatnagar, P. Cappers, A. B. Currier, P. Denholm, J. Dudley, S. Goli, M.
Hummon, J. Jorgenson, S. Kiliccote, J. MacDonald, N. Matson, D. Olsen, D. Palchak, C. Rose, M.
D. Sohn, M. Starke, B. Kirby, and M. O’Malley. 2016. Demand Response and Energy Storage
Integration Study, DOE EE-1282. Washington, DC: U.S. Department of Energy.
http://energy.gov/sites/prod/files/2016/03/f30/DOE-EE-1282.pdf.
Madaeni, S. H., R. Sioshansi, and P. Denholm. 2012 Comparison of Capacity Value Metrics for
Photovoltaics in the Western United States, NREL/TP-6A20-54704. Golden, CO: National
Renewable Energy Laboratory. http://www.nrel.gov/docs/fy12osti/54704.pdf.
Miller, N. W., M. Shao, S. Pajic, and R. D’Aquila. 2014. Western Wind and Solar Integration Study Phase
3: Frequency Response and Transient Stability (Report and Executive Summary), NREL/SR-5D00-
62906 and NREL/SR-5D00-62906-ES. Golden, CO: National Renewable Energy Laboratory.
http://www.nrel.gov/grid/wwsis.html.
Milligan, M., B. Frew, B. Kirby, M. Schuerger, K. Clark, D. Lew, P. Denholm, B. Zavadil, M. O’Malley, and
B. Tsuchida. 2015. “Alternatives No More: Wind and Solar Power Are Mainstays of a Clean,
Reliable, Affordable Grid.” IEEE Power and Energy Magazine 13(6): 78–87.
Milligan, M., and B. Kirby. 2010. “Utilizing Load Response for Wind and Solar Integration and Power
System Reliability,” NREL/CP-550-48247. Presented at WindPower 2010, May 23–26. Golden,
CO: National Renewable Energy Laboratory. http://www.nrel.gov/docs/fy10osti/48247.pdf.
Mills, A., and R. Wiser. 2012. An Evaluation of Solar Valuation Methods Used in Utility Planning and
Procurement Processes, LBNL-5933E. Berkeley, CA: Ernest Orlando Lawrence Berkeley National
Laboratory. https://emp.lbl.gov/sites/all/files/lbnl-5933e.pdf.
MISO (Midcontinent Independent System Operator, Inc.). 2013. Business Practices: Manual Energy and
Operating Reserve Markets. MISO.
MISO. 2014. MISO 2013 Annual Market Assessment Report: Information Delivery and Market Analysis.
MISO.
https://www.misoenergy.org/Library/Repository/Report/Annual%20Market%20Report/2013%2
0Annual%20Market%20Assessment%20Report.pdf.
Navid, N. 2013. “Multi-Faceted Solution for Managing Flexibility with High Penetration of Renewable
Resources.” Presented at FERC technical conference, Increasing RT & DA Market Efficiency
through Improved Software, June 24–26.
Navid, N., G. Rosenwald, and D. Chatterjee. 2011. Ramp Capability for Load Following in the MISO
Markets. MISO.
NERC (North American Electric Reliability Corporation). 2008. WECC Standard BAL-002-1: Contingency
Reserves. http://www.nerc.com/files/BAL-002-WECC-1.pdf.
35
Northern Arizona University. 2007. Arizona Public Service Wind Integration Cost Impact Study. Prepared
by Northern Arizona University, Flagstaff, AZ. Arizona Public Service Company.
https://nau.edu/uploadedFiles/Academic/CEFNS/Centers-
Institutes/Folder_Templates/_Media/Arizona-Public-Service-Wind-Integration-Cost-Impact-
Study.pdf.
Potomac Economics. 2014. 2013 State of the Market Report for the ERCOT Wholesale Electricity
Markets. Fairfax, VA: Potomac Economics.
https://www.potomaceconomics.com/uploads/ercot_documents/2013_ERCOT_SOM_REPORT.
pdf.
Pfeifenberger, Johannes P., Kathleen Spees, Kevin Carden, and Nick Wintermantel. 2013. Resource
Adequacy Requirements: Reliability and Economic Implications. Prepared by the Brattle Group
and Astrape Consulting. Washington, DC: FERC. https://www.ferc.gov/legal/staff-
reports/2014/02-07-14-consultant-report.pdf.
PJM (PJM Interconnection). 2014a. The Evolution of Demand Response in the PJM Wholesale Market.
Norristown, PA: PJM.
PJM. 2014b. PJM Manual 11: Energy and Ancillary Services Market Operations Revision 75. Prepared by
Forward Market Operations. Norristown, PA: PJM.
http://www.pjm.com/~/media/documents/manuals/archive/m11/m11v75-energy-and-
ancillary-services-market-operations-04-09-2015.ashx.
Sioshansi, R., S. H. Madaeni, and P. Denholm. 2014. “A Dynamic Programming Approach to Estimate the
Capacity Value of Energy Storage.” IEEE Transactions on Power Systems 29(1): 395–403.
U.S.-Canada Power System Outage Task Force, Spencer Abraham, Herb Dhaliwal, R. John Efford, Linda J.
Keen, Anne McLellan, John Manley et al. Final report on the August 14, 2003 blackout in the
United states and Canada: causes and recommendations. U.S.-Canada Power System Outage
Task Force, 2004.
Xu, L., and D. Tretheway. 2012. Flexible Ramping Products: Draft Final Proposal. CAISO.