Embed Size (px)
Citation preview
Reliable Underwater Feedback Transmission viaSoftware-Defined Acoustic Modems
Caroline Abel Ray Chenc [email protected] [email protected]
James Gallicchio Grace Zhang Kathryn [email protected] [email protected] [email protected]
Project Mentors
Adam Gurney* Mehdi Rahmati* Dr. Dario [email protected] mehdi [email protected] [email protected]
New Jersey’s Governor’s School of Engineering and TechnologyJuly 27, 2018
*Corresponding Author
Abstract—Underwater wireless communication providesgreat potential through semi-autonomous aquatic robots thathave use in scientific research, pollution monitoring, and mainte-nance of underwater facilities. However, the underwater settingposes a unique array of difficulties for wireless communica-tion, including path attenuation, colored noise, Doppler shift-ing, multipath propagation, and bandwidth limitations. Currentunderwater robot communication systems lack a robust andreliable feedback channel that mitigates the impact of underwatertransmission challenges. This research concludes that the useof low-rate binary frequency shift keying (BFSK) maximizesaccuracy of the feedback channel.
Index Terms—Modulation, underwater acoustic communica-tions, software-defined modems.
I. INTRODUCTION
A. OverviewAs the world of communication technologies expands,
underwater wireless transmission has become an emergingarea of research. Underwater transmission is an invaluablepiece of technology to develop because of the growing numberof aquatic applications including maintenance, discovery, andsafety. Applications of underwater transmission include, butare not limited to, remote oil rig inspections, oceanographicdata collection, pollution monitoring, offshore exploration, tac-tical surveillance applications, and marine life research [1]–[3].Autonomous Underwater Vehicles (AUVs) find applications inunderwater monitoring and exploration as an individual vehi-cle or as a team of vehicles. For instance, Rutgers Universityhas AUVs called “Challenger Gliders,” seen in Figure 1, whichcollect data from over 128,000 km of ocean basin [4]. Ratherthan requiring gliders to rise towards the water surface in orderto transmit their data, the creation of a reliable underwater
transmission system would allow these gliders to send datawhile they are traveling to the next site; by simultaneouslytransmitting the data and traveling to the next site, the AUVssave time and the researchers get their data earlier than theywould have beforehand. Overall, underwater transmission al-lows vehicles to communicate information between themselvesand the user without the dangerous and arduous task of sendingdivers or relaying the data physically through another process.
Figure 1. The Rutgers Challenger Glider can take advantage of underwatercommunication by sending live data to remote sites during travel [4].
1
For many of the mentioned applications, a reliable trans-mission is a challenging problem in such a harsh environment,in which Radio-Frequency (RF) waves cannot travel abovea few tens of meters because of absorption in the water.Optical waves could be another option for transmission, butthey require narrow laser beams and works for the very shortdistances. Acoustic waves are the only feasible solution asthey are able to propagate up to several tens of kilometers[5]. However, due to high transmission loss and very dynamicchannel, it leads to error prone, spectrum limited, and slowcommunications [6].
Consistency and accuracy are crucial in underwater datatransmission, where the properties of the underwater environ-ment pose unique challenges that could potentially result incommunication errors [7], [8]. Miscommunication often hascritical implications in many applications, such as sendingfaulty commands to costly underwater robots or receivingincorrect data transmitted from underwater drones. Thus,relevant research is necessary to address these concerns.To achieve these goals, the possibility of replacing the tra-ditional underwater hardware-based acoustic modems withthe software-defined modems should be explored. Currently,traditional commercial acoustic modems with their fixed-hardware designs are more common. Meanwhile, software-defined modems are highly flexible, reconfigurable, and re-programmable [9]. These modems use minimal hardware, anddepend on the host's, i.e a computer, cpu and other resourcesto process the data.
B. Purpose and Motivation
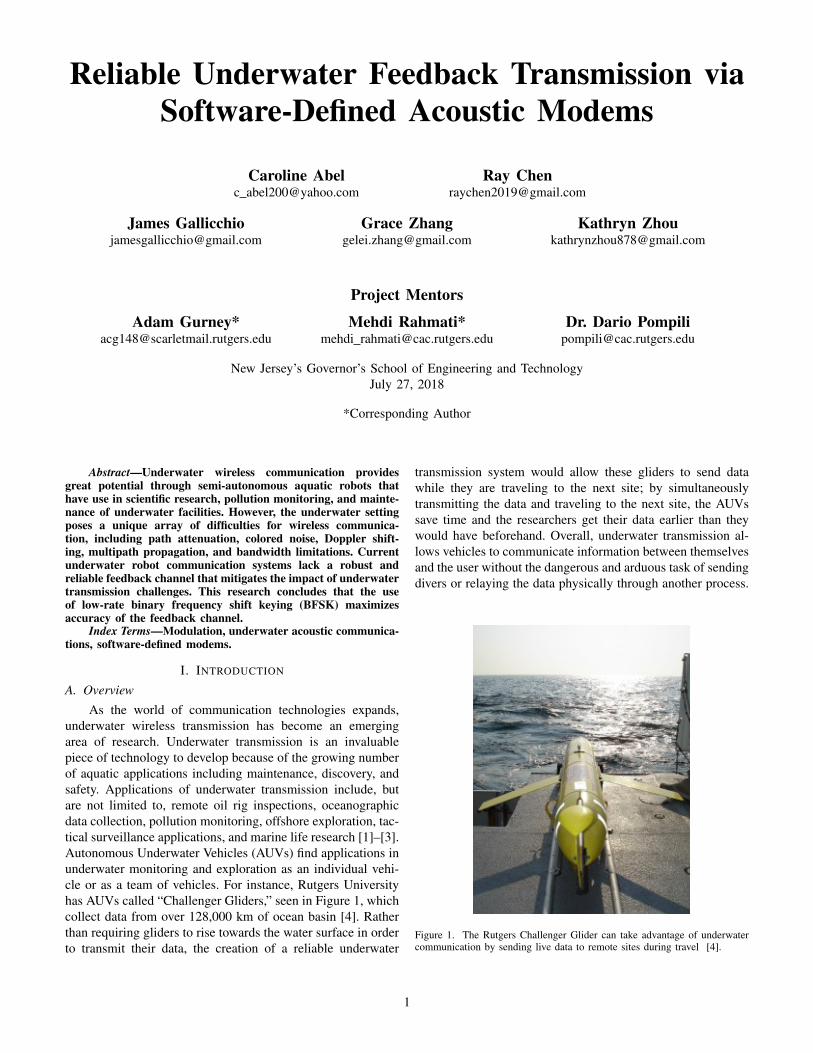
The purpose of this research is to understand the complex-ities of underwater transmission and explore factors that canlead to robustness, reliability, and accuracy. Dr. Dario Pompili,director of the Cyber-Physical Systems Laboratory (CPS Lab)and an associate professor of Electrical and Computer Engi-neering at Rutgers University, Mehdi Rahmati, a Rutgers PhDcandidate, and their research team concern the developmentof a real-time software-defined multi-antenna communicationsystem between autonomous underwater robots and remotetransmitters/receivers on the buoy/land station, seen in Figure2. The main goal is to create high-speed acoustic links betweenthe robots and the buoy/land station, so that underwatervideos, captured by the robots, can be processed, compressed,and transmitted through these high-speed links in a timelymanner and under a certain level of Quality of Service (QoS).Achieving this goal requires a closed-loop algorithm thatcreates a reliable feedback delivery system for underwaterdrone usage, where different encoding tools can be used toreduce potential errors. In their research [10], a test-bed isformed based on software-defined Universal Software RadioPeripheral (USRP) with high processing capabilities. Thesystem is cable of transmitting videos, which are captured byunderwater robots, processed locally and coded with ScalableVideo Coding (SVC) H.264/MPEG-4 AVC compression stan-dard.
Figure 2. This is the 6-thruster vectored configuration underwater robot [11],used in a research project at the CPS Lab, Rutgers University, in which ateam of heterogeneous and coordinated robots with different functionalitiesare exploited in large bodies of water to capture video [12].
To have a bidirectional communication and to guaran-tee data delivery, a reliable feedback system is required inthe reverse direction —from buoy/land station to robots—to acknowledge the received packets and to issue the up-to-date commands, accordingly. However, without a robustcommunication system, the feedback system would compounderror upon error while attempting to detect or correct previ-ous mistakes. The current research aims at investigating andoptimizing the most stable and reliable methods possible toguarantee the reliability of the mentioned system.
C. Paper Organization
The remainder of the paper is organized as follows.Sect. II introduces the fundamental concepts and the basics,which are used through this paper. Sect. III includes theproposed solution for a reliable underwater acoustic transmis-sion. Sect. IV presents the performance evaluations and resultsbased on the simulations; finally, Sect. V concludes the paperand discusses the future path of this research.
II. BACKGROUND AND THE RELATED WORK
A. General Telecommunication
Figure 3. The overall process for general telecommunication transmissions.It can be summarized as the collection and conversion of data into a wave,the traversal of the wave through space, the interception of the wave by anantenna, and the conversion of the wave back into data [13, pp. 2-3].
The information to be transmitted (text file, audio, video,etc.) starts as a series of 1s and 0s which occupies unitsof memory called bits. The information is compressed, such
2

as in a zip file, to reduce the quantity of information to betransmitted; this is the source encoder phase in Figure 3.Afterwards, redundant information is added in the channelencoder phase. These redundant bits are relevant in the channeldecoder phase, where they are used to correct potential errorsthat occurred during the transmission process. Then, duringthe modulation phase, the encoded string of binary bits isconverted into a voltage wave in which the waves’ amplitudes,phases, and/or frequencies contain the transmitted informa-tion [14]. After modulation, the transmitter antenna outputs thewave generated, and this wave travels through a medium orfield called the channel. In the process of traveling through thechannel, external noises interfere with the transmitted waves.Specifically, the channel does not differentiate between thetransmitted wave and external waves. Thus, the frequencies ofthe external sound waves are added on top of the transmittedwave to form a singular superimposed wave.
Concerning the receiver phases, there is a receivingantenna that intercepts the superimposed transmitted waveand delivers it to the demodulator. The demodulator convertsthe incoming wave into a string of bits. However, due tothe superimposed wave’s inclusion of external sounds, thedemodulator may incorrectly convert the wave, producing aseries of bits that does not match the original wave. Thechannel decoding phase is used to fix these transmission errors.Then, the source decoder takes the string of bits and translatesit back to the original file for the receiver to view [14].
1) Symbols: Specifically in modulation and demodula-tion, there is an intermediate phase between the bit string andthe transmitted wave. Initially, the bit string is split into n-bitwords (e.g. 2-bit words: 00, 01, 10, or 11. For 3-bit words,there are 8 possible words). In modulation, these words aremapped to a series of symbols that describes the physicalwave to be transmitted. Time variant sinusoids are defined ingeneral by three parameters: amplitude (the peak intensity ofthe wave, A), frequency (the number of cycles of the wave perunit time, f), and phase (the time offset between some startingtime and the waves first cycle, φ). The generalized sinusoidparent function can be summarized as follows,
I(t) = A sin(2πft+ φ). (1)
Each possible symbol is associated with a distinct com-bination of A, f, and φ in Equation (1), giving the symbol adistinct waveform that can be demodulated at the receiver. Themapping of bit words to symbols is known as a modulationscheme. There are a multitude of modulation scheme typesthat vary by the defining parameters.
2) Modulation Schemes: The most basic modulationschemes utilize only one of the three parameters: phase,amplitude, or frequency.
For amplitude shift keying (ASK), a sinusoidal carrierwave is modulated to have distinct amplitudes for each symbol[16]. The frequency and phase of the wave remain constant,while the amplitude jumps between distinct values. When theantenna receives the transmission, it demodulates the signal
Figure 4. A visualization of ASK, FSK, and PSK modulation schemes [15].
via its amplitudes. In Figure 4, the data in the first linecorresponds to the ASK signal in the second line; a bit valueof 1 corresponds to a high amplitude wave segment while abit value of 0 corresponds to a low amplitude wave segment.
Similarly, another class of modulators is frequency shiftkeying (FSK). FSK operates in the same manner as ASK, butby varying frequencies between distinct values to representeach symbol instead of using amplitudes [16]. In Figure 4,the data in the first line corresponds to the FSK signal in thesecond line; a 1 corresponds to a high frequency wave segmentwhile a 0 corresponds to a low frequency wave segment.
Meanwhile, phase shift keying (PSK) relates the data tothe transmitted waves’ phases. In the string of binary data bits,if the bits alternate - either a 1 followed by a 0 or vice versa -then the carrier signal will have a 180 degree phase shift [16].This is seen in Figure 4 between the first line of data and thecorresponding PSK wave in the fourth line.
Each modulation scheme has its strengths and weaknessesdepending on the situation or task at hand. In the underwaterenvironment, acoustic FSK shows promise as a medium-rangecommunication method. The underwater signal waves oftenencounter and reflect off surfaces, including the ocean surface,sea bed, and aquatic landmarks, which produce echoes thatchange direction and interfere with the original transmission.Known as multipath propagation, this interference shifts theamplitude and phase of the signal, rendering ASK and PSKvery unreliable. FSK circumvents this problem by solelyfocusing on frequency. Since the demodulator only needs todistinguish one symbol from another, or one frequency fromanother, in order to determine the correct tone, the changes inamplitude or phase due to underwater echoes have no effecton FSK.
The general form of FSK is M-FSK, where M indicatesthe number of distinct frequencies used. In M-FSK, thereare M symbols, with each symbol corresponding to a singleunique tone. Given the binary nature of computers, M is almost
3
exclusively a power of 2; in this configuration, log2M bits canbe sent in a single symbol. For example, in binary frequencyshift keying (BFSK, M=2), data is represented by patternsof two values, 0 and 1. In quadrature frequency shift keying(QFSK, M = 4), there are four possible 2-bit combinations.The symbol 00 represents one frequency (f1), 01 another(f2), 10 (f3), and 11 (f4), while amplitude and phase remainconstant. The same technicalities apply to modulation schemesother than FSK, such as M-PSK (BPSK, QPSK, etc.) and M-ASK (BASK, QASK, etc).
B. Underwater Difficulties
1) Time Variant Factors: The complexity of underwatertransmission lies in the variances of the acoustic channelenvironments. Multiple factors, such as temperature, salinity,and pressure, can greatly impact the characteristics of theaquatic channel.
2) Bandwidth Concerns: The available bandwidth forunderwater communications is 100 kHz. This is an extremelysmall range compared to the bandwidth for radio communi-cations in air, which is on the order of gigahertz. A smallbandwidth limits the maximum bit rate, the speed that bits aretransmitted.
3) Noise: All transmissions will be affected by externalnoises from the environment, but underwater communicationsdeal with additional noises that do not occur in generaltransmissions. For terrestrial communications, external noisecan be modeled by additive white Gaussian noise (AWGN),which is normally distributed and has uniform power acrossthe frequency band.
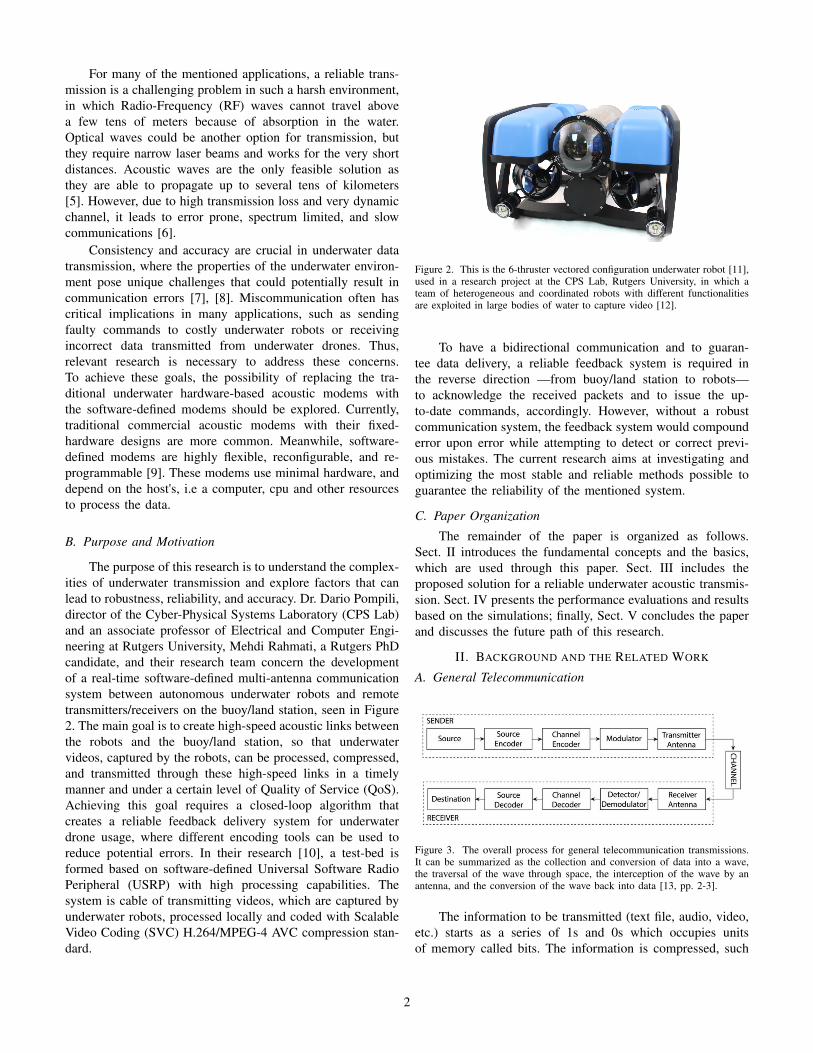
Underwater transmissions introduce complications sincethere are additional forms of noises that cannot be modeledby white noise. These include but are not limited to man-madesources of noise from sea vessels and underwater machinery,ambient noise from currents, tides, and storms, and noise fromsea life [1]. These noises are highly dependent on the specificenvironment. However, they can be generalized as Brownian,meaning that lower frequency noise is more pronounced thanhigher frequency noise.
Sea animals send and detect various frequencies for com-municating with others, acquiring food, and navigating throughtheir environments. For example, the bottle-nose dolphin usesclicks of frequencies between 40 and 150 kHz for echoloca-tion [2, Fig. 6]. Since this research will use a frequency bandof 50 to 150 kHz, the frequencies transmitted by sea life couldpotentially interfere with the signals transmitted by humans,and vice versa.
4) Path Loss/Attenuation: As the carrier wave propagates,the amplitude of the signal decreases, a phenomenon knownas path loss or path attenuation [17]. Since water is heavyand therefore takes more energy to move as compared to air,the underwater acoustic waves’ acoustic energy converts toheat energy as the distance traveled increases. With modulationschemes that do not rely on the wave amplitude (e.g. PSK andFSK), a reduction in amplitude is negligible, so long as the
Figure 5. Distribution of frequencies in Brownian noise; low frequency signalsare much more common.
signal’s amplitude is large enough to be differentiable fromthe background noise.
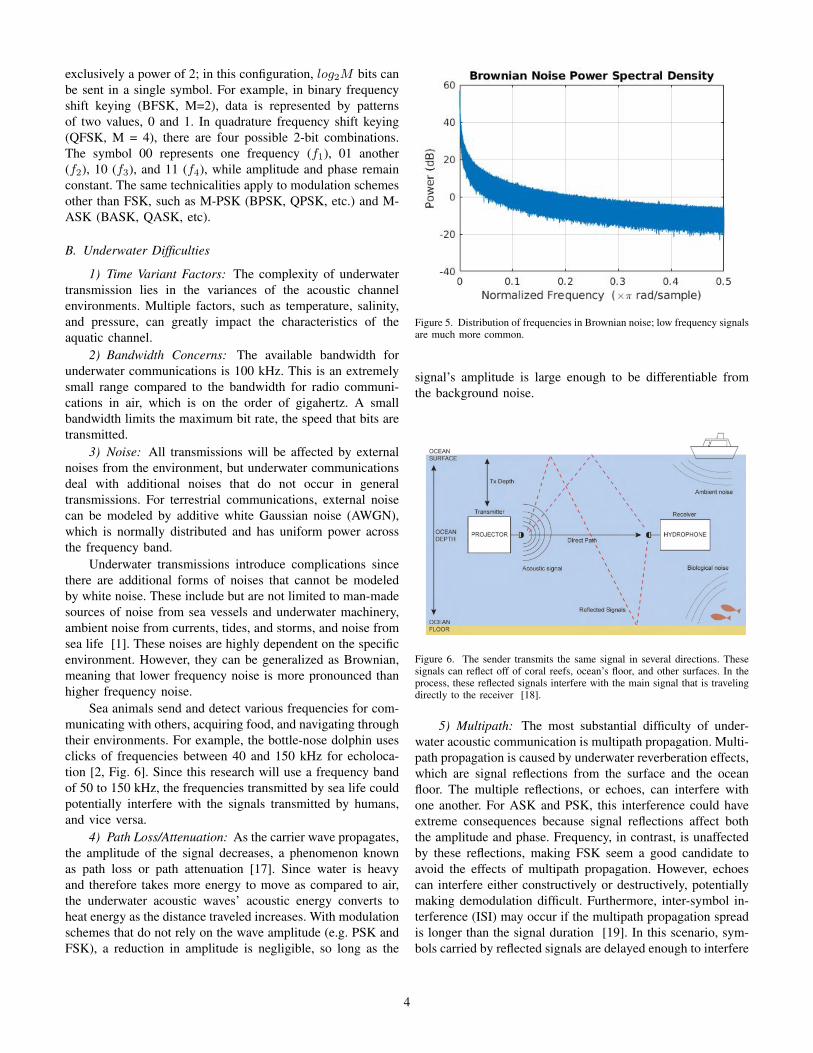
Figure 6. The sender transmits the same signal in several directions. Thesesignals can reflect off of coral reefs, ocean’s floor, and other surfaces. In theprocess, these reflected signals interfere with the main signal that is travelingdirectly to the receiver [18].
5) Multipath: The most substantial difficulty of under-water acoustic communication is multipath propagation. Multi-path propagation is caused by underwater reverberation effects,which are signal reflections from the surface and the oceanfloor. The multiple reflections, or echoes, can interfere withone another. For ASK and PSK, this interference could haveextreme consequences because signal reflections affect boththe amplitude and phase. Frequency, in contrast, is unaffectedby these reflections, making FSK seem a good candidate toavoid the effects of multipath propagation. However, echoescan interfere either constructively or destructively, potentiallymaking demodulation difficult. Furthermore, inter-symbol in-terference (ISI) may occur if the multipath propagation spreadis longer than the signal duration [19]. In this scenario, sym-bols carried by reflected signals are delayed enough to interfere
4

with subsequent symbols and can confuse the demodulator byappearing to show multiple symbols simultaneously.
6) Doppler Effect: The Doppler effect refers to frequencyshifts in underwater transmissions as the result of the trans-mitter and receiver moving relative to the water [20]. Aswitnessed in Figure 7, an observer will hear different pitchesdepending on the relative velocity of the transmitter (in thisdiagram, the ambulance) and the receiver (the person listen-ing). If the ambulance approaches the listener, the observerhears a higher frequency than the actual frequency. Similarly,if the ambulance distances itself from the listener, the observerhears a lower frequency. For frequency dependent modulationschemes, such as FSK, this frequency shift could be largeenough to introduce demodulation errors.
Figure 7. If the sound source is approaching the observer, the perceived signalhas a higher frequency than the original. If the sound source is leaving theobserver, the perceived signal has a lower frequency than the original [21].
III. PROCEDURE
The overall research process consisted of simulating threeunderwater-specific issues, analyzing their effects on the trans-missions’ accuracy, and utilizing the results to optimize under-water acoustic modulation for accuracy. Given the advantagesposed by FSK schemes in handling multipath propagation-the most substantial difficulty for underwater transmission-this research tested multiple FSK schemes (BFSK, QFSK, 8-FSK, and 16-FSK), as well as BPSK as a control to comparethese FSK schemes to a non-FSK scheme. All five modulationschemes were tested under 1) Brownian Noise, 2) DopplerEffect with Brownian Noise, and 3) Multipath with BrownianNoise. These three simulations were representative of most ofthe difficulties presented within the underwater environment.
Additionally, the inherent limitations of the channel re-garding frequency band and power were obeyed in all simula-tions. Because underwater channels generally operate between50kHz and 150kHz, all tests used an average bandwidth valueof 100kHz. Similarly, signal to noise ratios below 20 dBwere varied to model relatively small transmitters with limitedpower for acoustic output.
Lastly, a signal was generated using FSK and sent througha 20 gallon fish tank testbed in a Rutgers Engineering Lab
measuring 3 feet by 1 foot by 1 foot; this was the closestthing to testing the modulation schemes in the real world.
A. BER vs. SNR
For each of these simulations, a BER vs. SNR graph wasgenerated. BER or bit error rate is the number of bit errors perbit and SNR or signal-to-noise ratio is a measure of how loudthe signal is in comparison to the background noise. Graphs ofBER vs. SNR are a clear way to see at what point the qualityof the channel is compromised as they show the accuracy atdifferent SNRs. The most desirable outcome is to have thelowest SNR possible with acceptable error.
B. Generating Testbed Signals
Initially, it was necessary to obtain a 1 MB data filerepresenting the transmission wave. After downloading theMATLAB communication toolbox, a MATLAB program wascreated to modulate the data using BFSK and transform it intoa passband signal. This signal was subsequently sent through atestbed, a physical manifestation of underwater transmissionssimilar to the real world environment. The testbed was a 20gallon fish tank that measured three feet by one foot by onefoot.
C. Simulating Brownian Noise
Brownian noise was poorly supported in the MATLABenvironment. More factors must be manually accounted forwhen using this type of noise. Raw Brownian noise wasgenerated using the Digital Signal Processing toolbox. Next,the relative average amplitude of the noise was adjusted toconform to the selected sound-to-noise ratios. The root meansquare function (rms) was then used to “measure” the averageamplitude of the noise and of the signal, a common techniquein signal processing. The raw noise was normalized using theformula:
noiseadj = noiseraw ∗rmssignalrmsnoise
/snr (2)
The adjusted noise (noiseadj) was then added directly tothe signal.
D. Simulating Doppler Shift
To simulate the Doppler effect in an underwater setting,the Doppler equation can be used to calculate frequency shifts.Given the velocity of the carrier wave, vwave, the velocityof the transmitter, vsource, and the velocity of the receiver,vobserver, the Doppler shift is described by:
fobserved =(vwave ± vobserver)(vwave ± vsource)
factual (3)
Sound travels at an average vwave = 1500m/s underwater. Forthis research, vsource was assumed to be 0, while vobserverwas tested at -10 m/s, -5 m/s, -1 m/s, 10 m/s, 5 m/s, and 1m/s. These selected values were representative of velocities inthe real world, while also taking into account directionalityand producing graphs with visually prominent shifts. Witheach velocity, the frequency shift was applied to a modulated
5

signal. The Brownian noise was added to the shifted signalsaccording to the chosen signal to noise ratios, interpolating thenoise to match the length of the signal. Next, the bit error ratewas decimated, demodulated, and calculated for each signalto noise ratio and velocity combination. This was performedfor all five modulation schemes.
E. Simulating Multipath
To simulate multipath signals and path attenuation, theRician Channel function within the Communications toolboxwas utilized. The sampling frequency of the path was set at 200kHz. This was derived from the Nyquist rate, which dictatesthat the minimum sample rate for accurate demodulation istwice the bandwidth of the function. Since the bandwidthused in this project is 100 kHz, the sample rate was setto 200 kHz [22]. The path delay parameter describes thetime, in seconds, it takes for an additional path to arrive atthe receiver, relative to the main path. Path gain refers tothe change, in decibels, that any additional path undergoespost multipath propagation reverberations. The PathDelaysand AveragePathGains were set using empirically determinedvalues that represent relatively heavy multipath propagation.In order to analyze the effects of the Doppler Shift on thesignal separately, the Doppler Shift component of the RicianChannel was set to 0. The Doppler Effect was simulated usingthe frequency shift aforementioned. After running the signalthrough the Rician channel, the frequency distribution of thesignal was displayed using the Welch Power Spectral DensityEstimate, as seen in Figure 8. There is a noticeable shift infrequencies observed.
Figure 8. After processing the signal through the generated Rician channel,the frequency distribution shifts. The blue line depicts the original frequencydistribution of the signal, while the red line depicts the frequency distributionof the signal after being passed through the Rician Channel.
IV. RESULTS
A. Noise-Only Test
When Brownian noise was introduced to the signal, allof the tested modulation schemes handled the issue relativelywell. However, the BER for BFSK dropped off significantlymore quickly than other schemes.
As seen in Figure 9, BPSK reached a BER below 10−4
at an SNR of around 4 dB. In comparison, Figure 10 shows
that BFSK reached similar error rates at a much lower SNRaround -5 dB.
The higher order FSK schemes are each less accurate thanthe previous. QFSK has a simulated error rate of around 10−3
by -3 dB; 8-FSK reaches a BER below 10−2 by an SNR of0 dB; 16-FSK reaches a BER below 2% by 0 dB. Thoughthe simulations do not offer a complete image of the BER forvarious SNRs across all schemes, the data can be extrapolatedto find that BFSK, QFSK, and potentially 8-FSK all performbetter than BPSK when Brownian noise is added.
Figure 9. BER vs. SNR for BPSK with Brownian noise.
Figure 10. BER vs. SNR for M-FSK schemes with Brownian noise. As SNRincreases, the four FSK modulation schemes responded differently in termsof BER.
B. Doppler Effect Test
BFSK was tested under the Doppler effect with a rangeof relative velocities between -10 m/s and 10 m/s. The BERvs. SNR graphs after applying four different frequency offsetswere almost indistinguishable from each other, as shown inFigure 11. The similarity of each plot indicates that Dopplershifting at relatively low velocities has minimal impact onBFSK transmissions.
It is unclear whether the effect would be more pronouncedon other modulation schemes, as only BFSK was tested in thiscase. With higher modulation orders, frequencies are closer
6
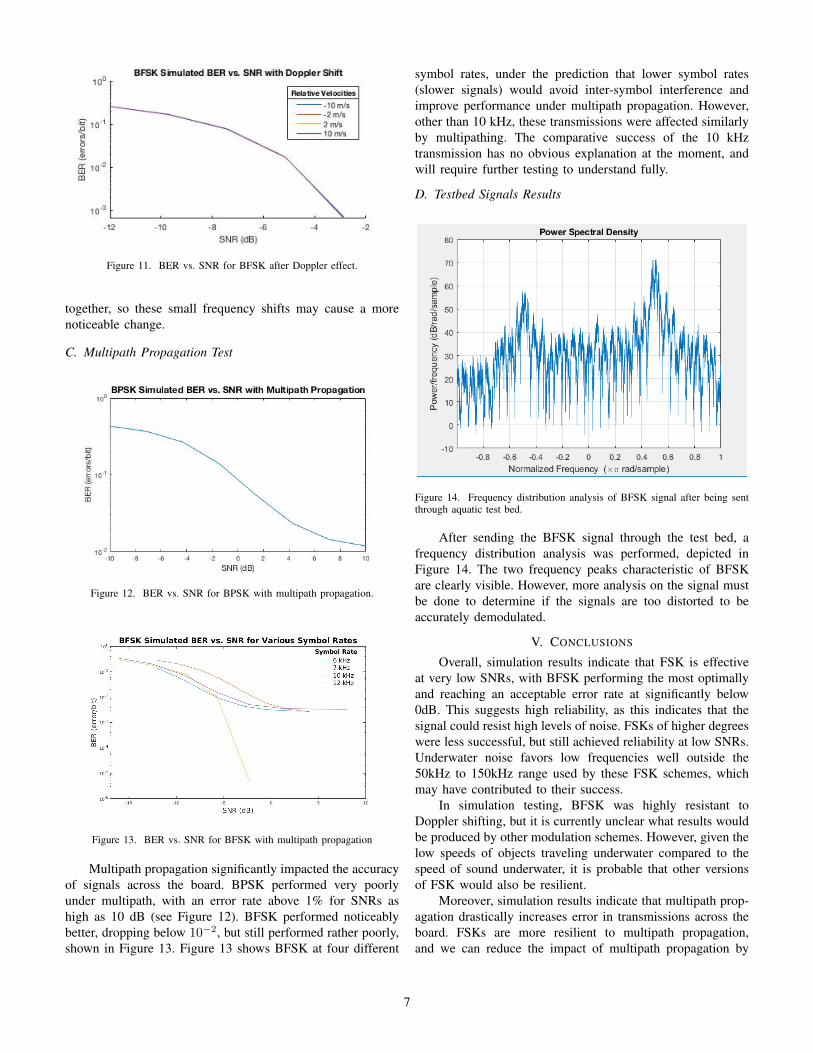
Figure 11. BER vs. SNR for BFSK after Doppler effect.
together, so these small frequency shifts may cause a morenoticeable change.
C. Multipath Propagation Test
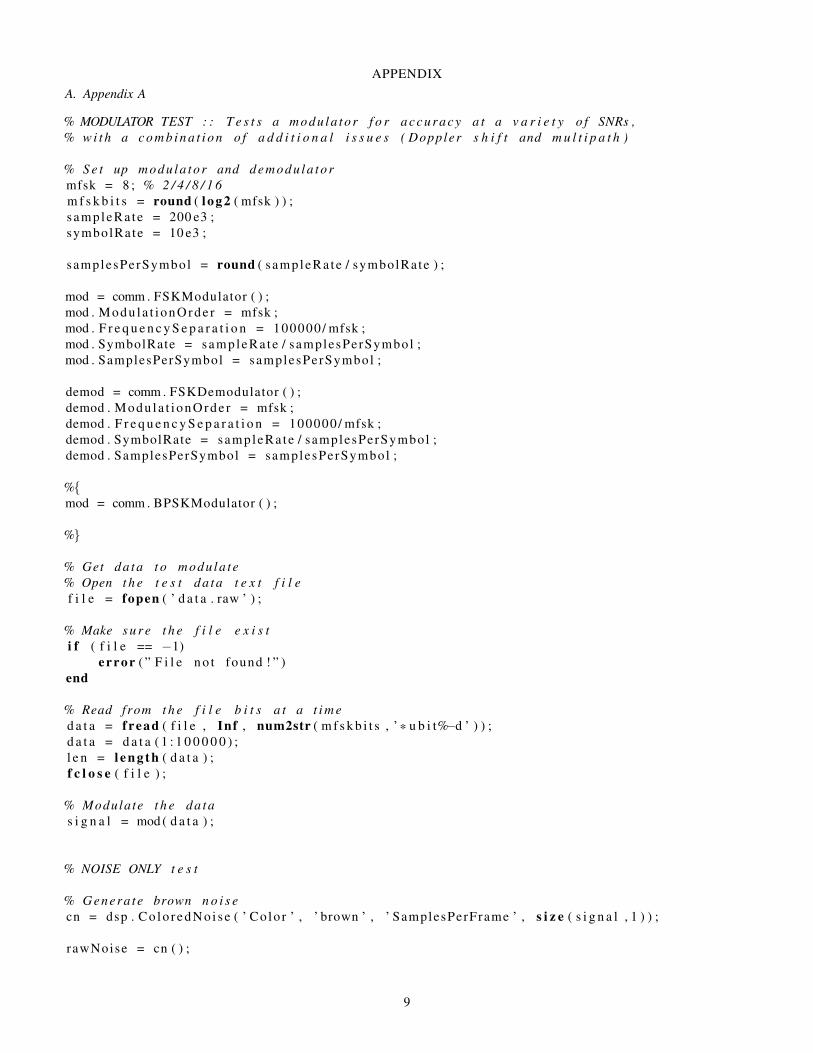
Figure 12. BER vs. SNR for BPSK with multipath propagation.
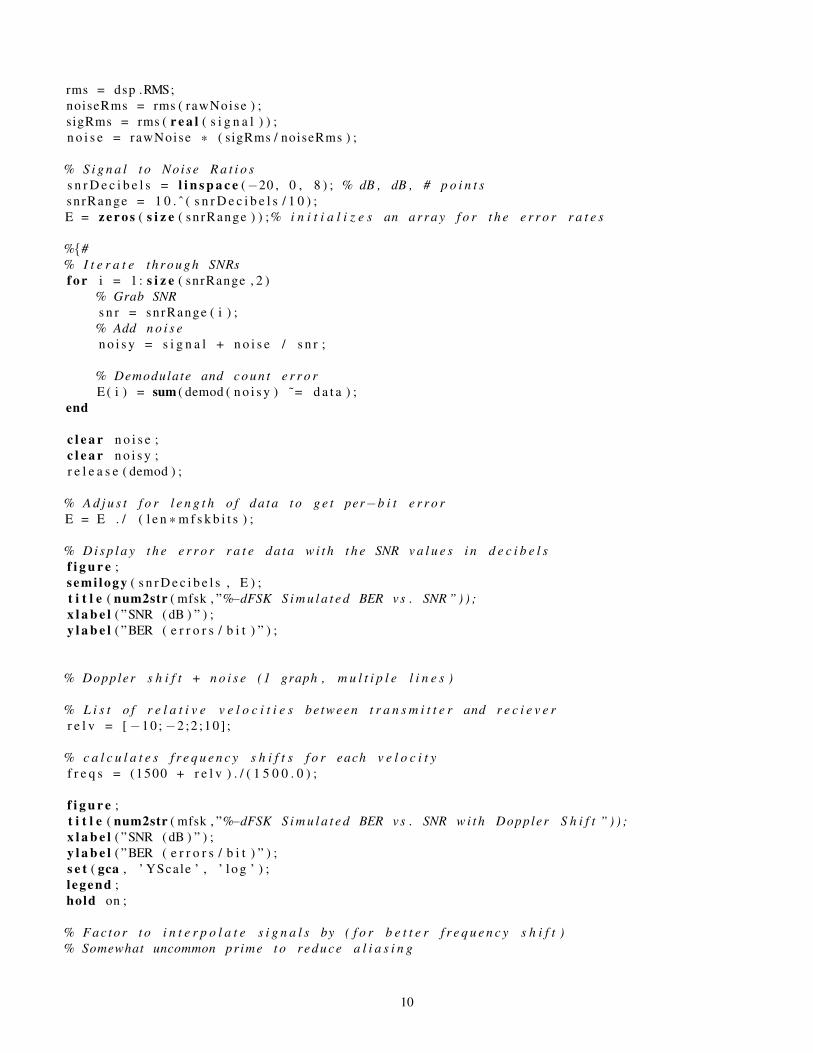
Figure 13. BER vs. SNR for BFSK with multipath propagation
Multipath propagation significantly impacted the accuracyof signals across the board. BPSK performed very poorlyunder multipath, with an error rate above 1% for SNRs ashigh as 10 dB (see Figure 12). BFSK performed noticeablybetter, dropping below 10−2, but still performed rather poorly,shown in Figure 13. Figure 13 shows BFSK at four different
symbol rates, under the prediction that lower symbol rates(slower signals) would avoid inter-symbol interference andimprove performance under multipath propagation. However,other than 10 kHz, these transmissions were affected similarlyby multipathing. The comparative success of the 10 kHztransmission has no obvious explanation at the moment, andwill require further testing to understand fully.
D. Testbed Signals Results
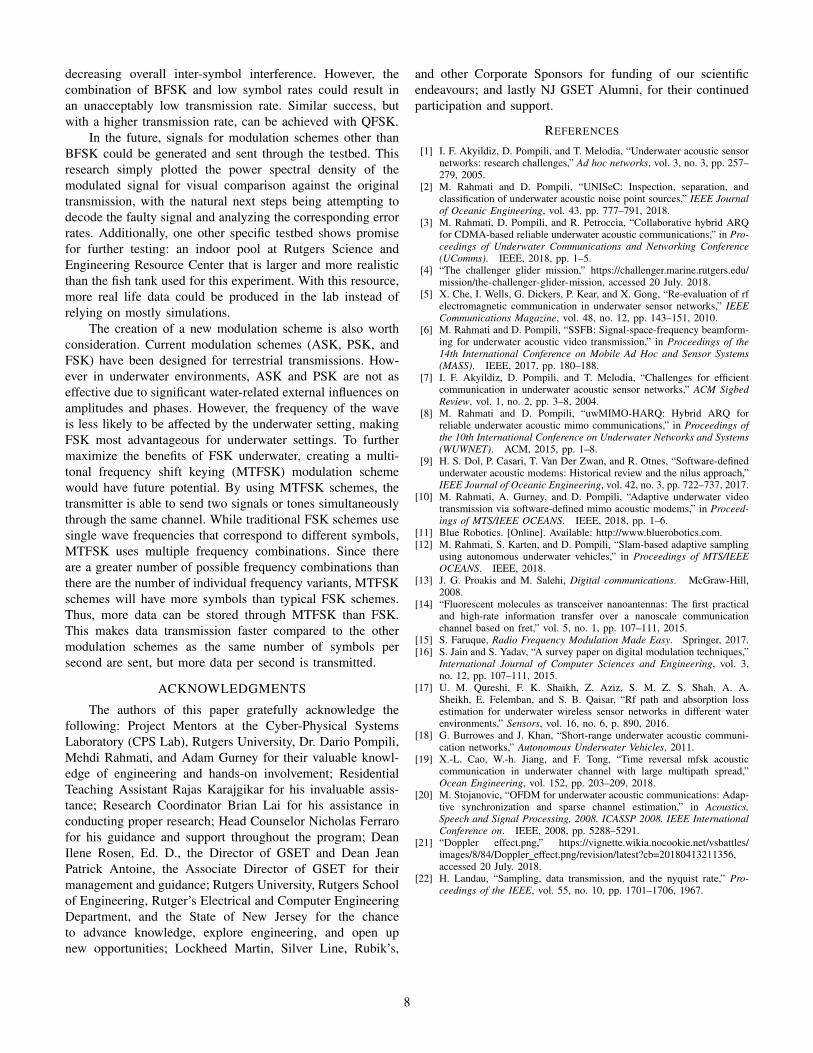
Figure 14. Frequency distribution analysis of BFSK signal after being sentthrough aquatic test bed.
After sending the BFSK signal through the test bed, afrequency distribution analysis was performed, depicted inFigure 14. The two frequency peaks characteristic of BFSKare clearly visible. However, more analysis on the signal mustbe done to determine if the signals are too distorted to beaccurately demodulated.
V. CONCLUSIONS
Overall, simulation results indicate that FSK is effectiveat very low SNRs, with BFSK performing the most optimallyand reaching an acceptable error rate at significantly below0dB. This suggests high reliability, as this indicates that thesignal could resist high levels of noise. FSKs of higher degreeswere less successful, but still achieved reliability at low SNRs.Underwater noise favors low frequencies well outside the50kHz to 150kHz range used by these FSK schemes, whichmay have contributed to their success.
In simulation testing, BFSK was highly resistant toDoppler shifting, but it is currently unclear what results wouldbe produced by other modulation schemes. However, given thelow speeds of objects traveling underwater compared to thespeed of sound underwater, it is probable that other versionsof FSK would also be resilient.
Moreover, simulation results indicate that multipath prop-agation drastically increases error in transmissions across theboard. FSKs are more resilient to multipath propagation,and we can reduce the impact of multipath propagation by
7
decreasing overall inter-symbol interference. However, thecombination of BFSK and low symbol rates could result inan unacceptably low transmission rate. Similar success, butwith a higher transmission rate, can be achieved with QFSK.
In the future, signals for modulation schemes other thanBFSK could be generated and sent through the testbed. Thisresearch simply plotted the power spectral density of themodulated signal for visual comparison against the originaltransmission, with the natural next steps being attempting todecode the faulty signal and analyzing the corresponding errorrates. Additionally, one other specific testbed shows promisefor further testing: an indoor pool at Rutgers Science andEngineering Resource Center that is larger and more realisticthan the fish tank used for this experiment. With this resource,more real life data could be produced in the lab instead ofrelying on mostly simulations.
The creation of a new modulation scheme is also worthconsideration. Current modulation schemes (ASK, PSK, andFSK) have been designed for terrestrial transmissions. How-ever in underwater environments, ASK and PSK are not aseffective due to significant water-related external influences onamplitudes and phases. However, the frequency of the waveis less likely to be affected by the underwater setting, makingFSK most advantageous for underwater settings. To furthermaximize the benefits of FSK underwater, creating a multi-tonal frequency shift keying (MTFSK) modulation schemewould have future potential. By using MTFSK schemes, thetransmitter is able to send two signals or tones simultaneouslythrough the same channel. While traditional FSK schemes usesingle wave frequencies that correspond to different symbols,MTFSK uses multiple frequency combinations. Since thereare a greater number of possible frequency combinations thanthere are the number of individual frequency variants, MTFSKschemes will have more symbols than typical FSK schemes.Thus, more data can be stored through MTFSK than FSK.This makes data transmission faster compared to the othermodulation schemes as the same number of symbols persecond are sent, but more data per second is transmitted.
ACKNOWLEDGMENTS
The authors of this paper gratefully acknowledge thefollowing: Project Mentors at the Cyber-Physical SystemsLaboratory (CPS Lab), Rutgers University, Dr. Dario Pompili,Mehdi Rahmati, and Adam Gurney for their valuable knowl-edge of engineering and hands-on involvement; ResidentialTeaching Assistant Rajas Karajgikar for his invaluable assis-tance; Research Coordinator Brian Lai for his assistance inconducting proper research; Head Counselor Nicholas Ferrarofor his guidance and support throughout the program; DeanIlene Rosen, Ed. D., the Director of GSET and Dean JeanPatrick Antoine, the Associate Director of GSET for theirmanagement and guidance; Rutgers University, Rutgers Schoolof Engineering, Rutger’s Electrical and Computer EngineeringDepartment, and the State of New Jersey for the chanceto advance knowledge, explore engineering, and open upnew opportunities; Lockheed Martin, Silver Line, Rubik’s,
and other Corporate Sponsors for funding of our scientificendeavours; and lastly NJ GSET Alumni, for their continuedparticipation and support.
REFERENCES
[1] I. F. Akyildiz, D. Pompili, and T. Melodia, “Underwater acoustic sensornetworks: research challenges,” Ad hoc networks, vol. 3, no. 3, pp. 257–279, 2005.
[2] M. Rahmati and D. Pompili, “UNISeC: Inspection, separation, andclassification of underwater acoustic noise point sources,” IEEE Journalof Oceanic Engineering, vol. 43, pp. 777–791, 2018.
[3] M. Rahmati, D. Pompili, and R. Petroccia, “Collaborative hybrid ARQfor CDMA-based reliable underwater acoustic communications,” in Pro-ceedings of Underwater Communications and Networking Conference(UComms). IEEE, 2018, pp. 1–5.
[4] “The challenger glider mission,” https://challenger.marine.rutgers.edu/mission/the-challenger-glider-mission, accessed 20 July. 2018.
[5] X. Che, I. Wells, G. Dickers, P. Kear, and X. Gong, “Re-evaluation of rfelectromagnetic communication in underwater sensor networks,” IEEECommunications Magazine, vol. 48, no. 12, pp. 143–151, 2010.
[6] M. Rahmati and D. Pompili, “SSFB: Signal-space-frequency beamform-ing for underwater acoustic video transmission,” in Proceedings of the14th International Conference on Mobile Ad Hoc and Sensor Systems(MASS). IEEE, 2017, pp. 180–188.
[7] I. F. Akyildiz, D. Pompili, and T. Melodia, “Challenges for efficientcommunication in underwater acoustic sensor networks,” ACM SigbedReview, vol. 1, no. 2, pp. 3–8, 2004.
[8] M. Rahmati and D. Pompili, “uwMIMO-HARQ: Hybrid ARQ forreliable underwater acoustic mimo communications,” in Proceedings ofthe 10th International Conference on Underwater Networks and Systems(WUWNET). ACM, 2015, pp. 1–8.
[9] H. S. Dol, P. Casari, T. Van Der Zwan, and R. Otnes, “Software-definedunderwater acoustic modems: Historical review and the nilus approach,”IEEE Journal of Oceanic Engineering, vol. 42, no. 3, pp. 722–737, 2017.
[10] M. Rahmati, A. Gurney, and D. Pompili, “Adaptive underwater videotransmission via software-defined mimo acoustic modems,” in Proceed-ings of MTS/IEEE OCEANS. IEEE, 2018, pp. 1–6.
[11] Blue Robotics. [Online]. Available: http://www.bluerobotics.com.[12] M. Rahmati, S. Karten, and D. Pompili, “Slam-based adaptive sampling
using autonomous underwater vehicles,” in Proceedings of MTS/IEEEOCEANS. IEEE, 2018.
[13] J. G. Proakis and M. Salehi, Digital communications. McGraw-Hill,2008.
[14] “Fluorescent molecules as transceiver nanoantennas: The first practicaland high-rate information transfer over a nanoscale communicationchannel based on fret,” vol. 5, no. 1, pp. 107–111, 2015.
[15] S. Faruque, Radio Frequency Modulation Made Easy. Springer, 2017.[16] S. Jain and S. Yadav, “A survey paper on digital modulation techniques,”
International Journal of Computer Sciences and Engineering, vol. 3,no. 12, pp. 107–111, 2015.
[17] U. M. Qureshi, F. K. Shaikh, Z. Aziz, S. M. Z. S. Shah, A. A.Sheikh, E. Felemban, and S. B. Qaisar, “Rf path and absorption lossestimation for underwater wireless sensor networks in different waterenvironments,” Sensors, vol. 16, no. 6, p. 890, 2016.
[18] G. Burrowes and J. Khan, “Short-range underwater acoustic communi-cation networks,” Autonomous Underwater Vehicles, 2011.
[19] X.-L. Cao, W.-h. Jiang, and F. Tong, “Time reversal mfsk acousticcommunication in underwater channel with large multipath spread,”Ocean Engineering, vol. 152, pp. 203–209, 2018.
[20] M. Stojanovic, “OFDM for underwater acoustic communications: Adap-tive synchronization and sparse channel estimation,” in Acoustics,Speech and Signal Processing, 2008. ICASSP 2008. IEEE InternationalConference on. IEEE, 2008, pp. 5288–5291.
[21] “Doppler effect.png,” https://vignette.wikia.nocookie.net/vsbattles/images/8/84/Doppler effect.png/revision/latest?cb=20180413211356,accessed 20 July. 2018.
[22] H. Landau, “Sampling, data transmission, and the nyquist rate,” Pro-ceedings of the IEEE, vol. 55, no. 10, pp. 1701–1706, 1967.
8
APPENDIX
A. Appendix A
% MODULATOR TEST : : T e s t s a modu la to r f o r a c c u r a c y a t a v a r i e t y o f SNRs ,% w i t h a c o m b i n a t i o n o f a d d i t i o n a l i s s u e s ( Doppler s h i f t and m u l t i p a t h )
% S e t up modu la tor and demodu la to rmfsk = 8 ; % 2 / 4 / 8 / 1 6m f s k b i t s = round ( l og2 ( mfsk ) ) ;s ampleRa te = 200 e3 ;symbolRate = 10 e3 ;
samplesPerSymbol = round ( s ampleRa te / symbolRate ) ;
mod = comm . FSKModulator ( ) ;mod . Modu la t i onOrde r = mfsk ;mod . F r e q u e n c y S e p a r a t i o n = 100000/ mfsk ;mod . SymbolRate = sampleRa te / samplesPerSymbol ;mod . SamplesPerSymbol = samplesPerSymbol ;
demod = comm . FSKDemodulator ( ) ;demod . Modu la t i onO rde r = mfsk ;demod . F r e q u e n c y S e p a r a t i o n = 100000/ mfsk ;demod . SymbolRate = sampleRa te / samplesPerSymbol ;demod . SamplesPerSymbol = samplesPerSymbol ;
%{mod = comm . BPSKModulator ( ) ;
%}
% Get da ta t o modu la te% Open t h e t e s t da ta t e x t f i l ef i l e = fopen ( ’ d a t a . raw ’ ) ;
% Make s u r e t h e f i l e e x i s ti f ( f i l e == −1)
error ( ” F i l e n o t found ! ” )end
% Read from t h e f i l e b i t s a t a t i m ed a t a = f read ( f i l e , Inf , num2str ( m f s k b i t s , ’ * u b i t%−d ’ ) ) ;d a t a = d a t a ( 1 : 1 0 0 0 0 0 ) ;l e n = l e n g t h ( d a t a ) ;f c l o s e ( f i l e ) ;
% Modulate t h e da tas i g n a l = mod ( d a t a ) ;
% NOISE ONLY t e s t
% Genera te brown n o i s ecn = dsp . C o l o r e d N o i s e ( ’ Co lo r ’ , ’ brown ’ , ’ SamplesPerFrame ’ , s i z e ( s i g n a l , 1 ) ) ;
rawNoise = cn ( ) ;
9
rms = dsp .RMS;noiseRms = rms ( rawNoise ) ;sigRms = rms ( r e a l ( s i g n a l ) ) ;n o i s e = rawNoise * ( sigRms / noiseRms ) ;
% S i g n a l t o No i se R a t i o ss n r D e c i b e l s = l i n s p a c e (−20 , 0 , 8 ) ; % dB , dB , # p o i n t ssnrRange = 1 0 . ˆ ( s n r D e c i b e l s / 1 0 ) ;E = z e r o s ( s i z e ( snrRange ) ) ;% i n i t i a l i z e s an a r r a y f o r t h e e r r o r r a t e s
%{#% I t e r a t e t h r o u g h SNRsf o r i = 1 : s i z e ( snrRange , 2 )
% Grab SNRs n r = snrRange ( i ) ;
% Add n o i s en o i s y = s i g n a l + n o i s e / s n r ;
% Demodulate and c o u n t e r r o rE ( i ) = sum ( demod ( n o i s y ) ˜= d a t a ) ;
end
c l e a r n o i s e ;c l e a r n o i s y ;r e l e a s e ( demod ) ;
% A d j u s t f o r l e n g t h o f da ta t o g e t per−b i t e r r o rE = E . / ( l e n * m f s k b i t s ) ;
% D i s p l a y t h e e r r o r r a t e da ta w i t h t h e SNR v a l u e s i n d e c i b e l sf i g u r e ;semi logy ( s n r D e c i b e l s , E ) ;t i t l e ( num2str ( mfsk , ”%−dFSK S i m u l a t e d BER vs . SNR ” ) ) ;x l a b e l ( ”SNR ( dB ) ” ) ;y l a b e l ( ”BER ( e r r o r s / b i t ) ” ) ;
% Doppler s h i f t + n o i s e (1 graph , m u l t i p l e l i n e s )
% L i s t o f r e l a t i v e v e l o c i t i e s be tween t r a n s m i t t e r and r e c i e v e rr e l v = [ −10 ; −2 ;2 ;10 ] ;
% c a l c u l a t e s f r e q u e n c y s h i f t s f o r each v e l o c i t yf r e q s = (1500 + r e l v ) . / ( 1 5 0 0 . 0 ) ;
f i g u r e ;t i t l e ( num2str ( mfsk , ”%−dFSK S i m u l a t e d BER vs . SNR w i t h Doppler S h i f t ” ) ) ;x l a b e l ( ”SNR ( dB ) ” ) ;y l a b e l ( ”BER ( e r r o r s / b i t ) ” ) ;s e t ( gca , ’ YScale ’ , ’ l o g ’ ) ;l egend ;hold on ;
% Fa c t or t o i n t e r p o l a t e s i g n a l s by ( f o r b e t t e r f r e q u e n c y s h i f t )% Somewhat uncommon pr ime t o r ed u ce a l i a s i n g
10

i n t e r p F a c t o r = 1 1 ;
i n t e r p N o i s e = i n t e r p ( rawNoise , i n t e r p F a c t o r ) ;
f o r i d x = 1 : l e n g t h ( f r e q s )
f s o = comm . P h a s e F r e q u e n c y O f f s e t ( ’ F r e q u e n c y O f f s e t ’ , f r e q s ( i d x ) , ’ SampleRate ’ , 200 e3 ) ;
% Doppler s h i f t s i g n a l , i n t e r p o l a t i n g f o r b e t t e r r e s u l t ss h i f t e d S i g n a l = f s o ( i n t e r p ( s i g n a l , i n t e r p F a c t o r ) ) ;
% Regen n o i s esigRms = rms ( r e a l ( s h i f t e d S i g n a l ) ) ;n o i s e = i n t e r p N o i s e * ( sigRms / noiseRms ) ; % I n t e r p o l a t e n o i s e t o match l e n g t h
% I t e r a t e t h r o u g h SNRsf o r i = 1 : s i z e ( snrRange , 2 )
% Grab SNRs n r = snrRange ( i ) ;
% Add n o i s en o i s y = s h i f t e d S i g n a l + n o i s e / s n r ;
% Demodulate and c o u n t e r r o rE ( i ) = sum ( demod ( d e c i m a t e ( no i sy , i n t e r p F a c t o r ) ) ˜= d a t a ) ;
end
% A d j u s t f o r l e n g t h o f da ta t o g e t per−b i t e r r o rE = E . / ( l e n * m f s k b i t s ) ;
% D i s p l a y t h e e r r o r r a t e da ta w i t h t h e SNR v a l u e s i n d e c i b e l sp l o t ( s n r D e c i b e l s , E , ’ DisplayName ’ , num2str ( r e l v ( i d x ) , ’%−d m/ s ’ ) ) ;
endhold o f f
c l e a r s h i f t e d S i g n a l ;c l e a r i n t e r p N o i s e ;c l e a r n o i s e ;c l e a r n o i s y ;r e l e a s e ( demod ) ;
%}#
% M u l t i p a t h + n o i s e
% Cr ea t e a R i c i a n Channelp a t h D e l a y s = [0 0 .001 0 .004 0 .006 0 .007 0 .0075 0 .008 0 .0085 0 .009 0 . 0 0 9 5 ] ; % s e cp a t h G a i n s = [0 −5 −8 −11 −15 −16 −17 −18 −19 −20]; % dBr i c i a n = comm . R i c i a n C h a n n e l ( ’ SampleRate ’ , 200 e3 , ’ P a t h D e l a y s ’ , pa thDe lays , ’ Ave ragePa thGa ins ’ , pa thGa ins , ’ KFac to r ’ , 3 , ’ MaximumDopplerShif t ’ , 0 , ’ RandomStream ’ , ’ mt19937ar wi th seed ’ ) ;
m u l t i S i g n a l = r i c i a n ( s i g n a l ) ;
% Add n o i s esigRms = rms ( r e a l ( m u l t i S i g n a l ) ) ;n o i s e = rawNoise * ( sigRms / noiseRms ) ;
% I t e r a t e t h r o u g h SNRsf o r i = 1 : s i z e ( snrRange , 2 )
11
% Grab SNRs n r = snrRange ( i ) ;n o i s y = m u l t i S i g n a l + n o i s e / s n r ;
% Demodulate and c o u n t e r r o rE ( i ) = sum ( demod ( n o i s y ) ˜= d a t a ) ;
end
% A d j u s t f o r l e n g t h o f da ta t o g e t per−b i t e r r o rE = E . / ( l e n * m f s k b i t s ) ;
% D i s p l a y t h e e r r o r r a t e da ta w i t h t h e SNR v a l u e s i n d e c i b e l sf i g u r e ;semi logy ( s n r D e c i b e l s , E ) ;t i t l e ( num2str ( mfsk , ”%−dFSK S i m u l a t e d BER vs . SNR w i t h M u l t i p a t h P r o p a g a t i o n ” ) ) ;x l a b e l ( ”SNR ( dB ) ” ) ;y l a b e l ( ”BER ( e r r o r s / b i t ) ” ) ;
12


![Aquatic Therapy: Scientific Foundations and …...tank. On returning to California, he transformed the hospital’s lily pond into 2 therapeutic pools [1]. At Warm Springs, Georgia,](https://img.pdfslide.net/doc/110x75/5e6831794860476bb3378008/aquatic-therapy-scientiic-foundations-and-tank-on-returning-to-california.jpg)


![Introduction to Scientific Computing · 2.1 Introduction to Scientific Computing Scientific computing – subject on crossroads of physics, chemistry, [social, engineering,...]](https://img.pdfslide.net/doc/110x75/5edc24c2ad6a402d6666af19/introduction-to-scientiic-computing-21-introduction-to-scientiic-computing.jpg)