Embed Size (px)
Citation preview
April 201814 Fundamentals
Equity - Diversified Multi Cap
Details as on March 31, 2018
Type of Scheme
An open ended Diversified Equity Scheme
Current Investment Philosophy
It is a multi-cap, trend based fund with the flexibility to be overweight in a particular sector or market caps depending on the potential & opportunities as they arise. Investment in large caps may help to capture market movements & ensures liquidity in volatile times while exposure to niche themes (primarily mid/small cap companies) having scalable business models offers alpha creation possibilities. At any point of time between 40%-60% of the fund is invested in companies in the large Cap space, which provides significant stability & market participation. The balance is invested in the emerging businesses which can be further categorized as:
• Quality Mid cap plays with a track record andscalable business models
• Emerging or niche themes with sustainablecompetitive advantages
• DeepValue Component – > DeepValue Stocks -Currently mispriced by markets due to non-fundamental reasons
Date of Allotment
March 28, 2005
Fund Manager
Sailesh Raj Bhan
Benchmark
S&P BSE 100
Fund Size
Monthly Average: ` 9,723.91 Cr
Month End: ` 9,551.39 Cr
NAV as on March 28, 2018
Growth Plan ` 89.7021
Dividend Plan ` 28.2783
Bonus Option ` 89.7021
Direct - Growth Plan ` 93.3808
Direct - Dividend Plan ` 35.6180
Direct - Bonus Option ` 93.3808
Volatility Measures
Standard Deviation 4.50
Beta 1.03
Sharpe Ratio -0.05
Note: The above measures have been calculated using monthly rolling returns for 36
months period with 9.39% risk free return (FBIL Overnight MIBOR as on 28/03/2018).
Portfolio Turnover (Times) 0.60
Expense Ratio^
Regular/Other than Direct 1.98
Direct 1.28
Load structure
Entry Load: Nil
Exit Load: 1% if redeemed or switched out on or before completion of 1 year from the date of allotment of units. Nil, thereafter.
Product Label
This product is suitable for investors who are seeking*:
Investors understand that their principal
will be at Moderately High risk
� Long term capital growth
� Investment in equity and equity related securities
*Investors should consult their financial advisors if in doubt about whether the product
is suitable for them.
Portfolio as on March 31, 2018
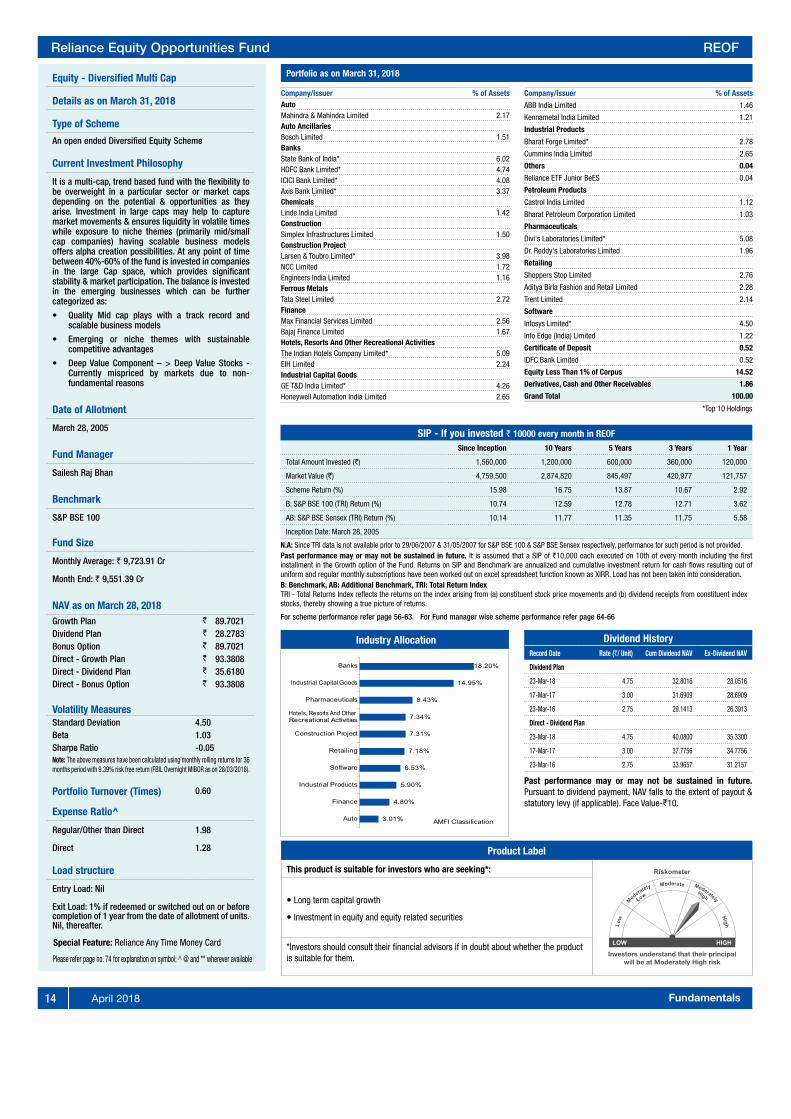
Industry Allocation Dividend History
Record Date Rate (`/ Unit) Cum Dividend NAV Ex-Dividend NAV
Dividend Plan
23-Mar-18 4.75 32.8016 28.0516
17-Mar-17 3.00 31.6909 28.6909
23-Mar-16 2.75 29.1413 26.3913
Direct - Dividend Plan
23-Mar-18 4.75 40.0800 35.3300
17-Mar-17 3.00 37.7756 34.7756
23-Mar-16 2.75 33.9657 31.2157
Past performance may or may not be sustained in future.
Pursuant to dividend payment, NAV falls to the extent of payout &
statutory levy (if applicable). Face Value-`10.
Special Feature: Reliance Any Time Money Card
Reliance Equity Opportunities Fund REOF
Portfolio as on March 31, 2018
SIP - If you invested ` 10000 every month in REOF
Since Inception 10 Years 5 Years 3 Years 1 Year
Total Amount Invested (`) 1,560,000 1,200,000 600,000 360,000 120,000
Market Value (`) 4,759,500 2,874,820 845,497 420,977 121,757
Scheme Return (%) 15.98 16.75 13.87 10.67 2.92
B: S&P BSE 100 (TRI) Return (%) 10.74 12.59 12.78 12.71 3.62
AB: S&P BSE Sensex (TRI) Return (%) 10.14 11.77 11.35 11.75 5.58
Inception Date: March 28, 2005
N.A: Since TRI data is not available prior to 29/06/2007 & 31/05/2007 for S&P BSE 100 & S&P BSE Sensex respectively, performance for such period is not provided.
Past performance may or may not be sustained in future. It is assumed that a SIP of `10,000 each executed on 10th of every month including the first installment in the Growth option of the Fund. Returns on SIP and Benchmark are annualized and cumulative investment return for cash flows resulting out of uniform and regular monthly subscriptions have been worked out on excel spreadsheet function known as XIRR. Load has not been taken into consideration.
B: Benchmark, AB: Additional Benchmark, TRI: Total Return Index
TRI - Total Returns Index reflects the returns on the index arising from (a) constituent stock price movements and (b) dividend receipts from constituent index stocks, thereby showing a true picture of returns.
For scheme performance refer page 56-63. For Fund manager wise scheme performance refer page 64-66
Please refer page no. 74 for explanation on symbol: ^ @ and ** wherever available
Company/Issuer % of Assets
Auto
Mahindra & Mahindra Limited 2.17
Auto Ancillaries
Bosch Limited 1.51
Banks
State Bank of India* 6.02
HDFC Bank Limited* 4.74
ICICI Bank Limited* 4.08
Axis Bank Limited* 3.37
Chemicals
Linde India Limited 1.42
Construction
Simplex Infrastructures Limited 1.50
Construction Project
Larsen & Toubro Limited* 3.98
NCC Limited 1.72
Engineers India Limited 1.16
Ferrous Metals
Tata Steel Limited 2.72
Finance
Max Financial Services Limited 2.56
Bajaj Finance Limited 1.67
Hotels, Resorts And Other Recreational Activities
The Indian Hotels Company Limited* 5.09
EIH Limited 2.24
Industrial Capital Goods
GE T&D India Limited* 4.26
Honeywell Automation India Limited 2.65
Company/Issuer % of Assets
ABB India Limited 1.46
Kennametal India Limited 1.21
Industrial Products
Bharat Forge Limited* 2.78
Cummins India Limited 2.65
Others 0.04
Reliance ETF Junior BeES 0.04
Petroleum Products
Castrol India Limited 1.12
Bharat Petroleum Corporation Limited 1.03
Pharmaceuticals
Divi's Laboratories Limited* 5.08
Dr. Reddy's Laboratories Limited 1.96
Retailing
Shoppers Stop Limited 2.76
Aditya Birla Fashion and Retail Limited 2.28
Trent Limited 2.14
Software
Infosys Limited* 4.50
Info Edge (India) Limited 1.22
Certificate of Deposit 0.52
IDFC Bank Limited 0.52
Equity Less Than 1% of Corpus 14.52
Derivatives, Cash and Other Receivables 1.86
Grand Total 100.00
*Top 10 Holdings