Embed Size (px)
Citation preview
Journal of Affective Disorders 54 (1999) 149–159
Research report
Religious climate and geographical distribution of depressivesymptoms in older Dutch citizens
a , a b a*Arjan W. Braam , Aartjan T.F. Beekman , Pieter van den Eeden , Dorly J.H. Deeg ,c aKees P.M. Knipscheer , Willem van Tilburg
aDepartment of Psychiatry, Vrije Universiteit Amsterdam, Amsterdam, The NetherlandsbDepartment of Social Science Methodology, Vrije Universiteit Amsterdam, Amsterdam, The Netherlands
cDepartment of Sociology and Social Gerontology, Vrije Universiteit Amsterdam, Amsterdam, The Netherlands
Received 30 March 1998; received in revised form 15 September 1998; accepted 16 October 1998
Abstract
This study examines whether the degree of conservatism of the religious climate affects the geographical distribution oflate life depressive symptoms. A U-shaped relationship is hypothesized: high levels of depressive symptoms at the extremes(both a-religious and hyperconservative), and a low level in the middle (moderate–conservative). Subjects are 3051 olderDutch citizens (55–85 years), living in 11 municipalities. Depressive symptoms are assessed using the CES-D. Religiousclimate is estimated on the municipality level, using percentages votes on political parties with a Christian background(moderate–conservative versus hyperconservative). Using multi-level analysis, the results support the U-curve hypothesis. 1999 Elsevier Science B.V. All rights reserved.
Keywords: Religion; Context; Depression; Elderly; Community
1. Introduction empirically. Generally, it is assumed to be caused bythe social (e.g. family values, network ties), econ-
Studies of the geographical distribution of depres- omic (prosperity), and cultural context (religioussion have mainly focused on the differences between climate, conservatism) (Blazer et al., 1985; Dewey eturban and rural areas (Sartorius, 1986; Madianos and al., 1993; Rutter et al., 1997). The issue addressed inStefanis, 1992; Beekman et al., 1995). The higher the present study is whether local religious climate,prevalence of depression in urbanized regions, both as a contextual quality, affects the geographicalin younger and older adults, has not been explained distribution of depressive symptoms. The study
focuses on older adults, because, in The Netherlands,* the majority of older people have been raised in aCorresponding author. Longitudinal Aging Study Amsterdam,
De Boelelaan 1081-C, 1081 HV Amsterdam, The Netherlands. religious tradition (Becker and Vink, 1994). As is
0165-0327/99/$ – see front matter 1999 Elsevier Science B.V. All rights reserved.PI I : S0165-0327( 98 )00172-4
150 A.W. Braam et al. / Journal of Affective Disorders 54 (1999) 149 –159
stated by Rutter et al. (1997), there is a need to suggest a U-shaped curvilinear relationship betweenconsider broader contextual features in the epi- suicide rate and the degree of social integration anddemiology of psychopathology. Insight into con- regulation, as determined by the religious climate.textual effects on depression in later life may be To what extent can this U-shaped relationship bedesirable, not only because depression in later life recognized in studies on religion and depression? Asconstitutes a serious mental health problem (Blazer, described by Batson et al. (1993), there are opposing1994), but also because some contextual features views with respect to influence of religion onmay be modified by health care policies. depression. These views are likely to reflect the
In psychiatric epidemiology, the vulnerability– diverging types of religious beliefs. Some religiousstress model of Brown and Harris (1978) has been doctrines foster feelings of comfort and hope (Jung,used to understand processes that lead to depression. 1931; Allport, 1950; Koenig, 1994), fitting Fromm’sAccording to this model, vulnerability to depression category of ‘humanistic’ religion (Fromm, 1950).facilitates the onset of a depressive episode when the Other religious doctrines evoke feelings of guilt andindividual is exposed to stress. In older adults, loss insufficiency (Freud, 1959; Ellis, 1980; Schilder,of physical health is found to be a major stressor 1987). These would belong to Fromm’s category ofevoking depression (Berkman et al., 1986; Gurland ‘authoritarian’ religion, in which the individual sur-and Wilder, 1988). Brown and Harris suggested links renders to the higher power, exchanging feelings ofbetween the epidemiology of depression and broader worth, independence and integrity for the feeling ofeconomic, political, and cultural structures (p. 254, being protected. Although Fromm views CalvinismBrown and Harris, 1978). Nevertheless, the factors as an authoritarian religion, he does not take accountdistinguished in their model are operationally defined of the different degrees of conservatism amongon the level of the individual, and later research Calvinist denominations. In general, conservativegenerally has not included contextual characteristics. denominations foster optimism (Sethi and Seligman,
In contrast, sociological theory emphasizes the 1993), and protect against suicide (Pescosolido androle of contextual features on mental health, with Georgianna, 1989). Only hyperconservatism, as ex-religion as a particular focus of interest (Durkheim, ists in fundamentalist or sectarian denominations, is1960; Pescosolido and Georgianna, 1989; Idler and known to be positively associated with depressionKasl, 1992; Neeleman et al., 1997). In studies on (MacDonald and Luckett, 1983; Koenig et al., 1994),suicide, the effects of religion are defined as func- as it is with suicide (Kruyt, 1960). Therefore,tions of network ties. Properties of network ties authoritarian religion may be represented more accu-involve integrative aspects, i.e. the ability to provide rately by hyperconservative forms of Calvinism.social and emotional support, and regulative aspects, For religion as a contextual quality, three hypoth-i.e. guiding action through advice and behaviour eses can be derived from the arguments outlinedmonitoring, such as social control (Umberson, 1987). above. Firstly, a local climate with an a-religiousReligious climate reflects both aspects, through tradition enhances depressive symptoms. Secondly, ashared values and their related norms in the com- local climate with a predominantly moderate–con-munity, based on the locally dominating religious servative religious tradition protects against depres-tradition. Pescosolido and Georgianna (1989) have sive symptoms. Thirdly, a local climate that iselaborated the linkage between religious climate, dominated by a hyperconservative, Calvinist tradi-suicide, and network ties. They suggest that when tion, again enhances depressive symptoms. Thesenetworks are moderately or even strongly integrated hypotheses presuppose a U-shaped relationship be-and regulated, members are protected, in the case of tween religious climate (in particular its degree ofindividual crisis, from self-destructive impulses. The conservatism) and depressive symptoms. In terms ofrisk of suicide would increase, however, when social processes, the depressogenic effects by religi-networks supply either poor integration (e.g. among ous climate are expected to be explained by pooratheists), or overly tight regulation, (e.g. when mem- social integration (a-religious climate) or socialbers are subjected to strong religious regulative overregulation (hyperconservative climate). Finally,authority). Pescosolido and Georgianna therefore it will be explored whether religious climate in-
A.W. Braam et al. / Journal of Affective Disorders 54 (1999) 149 –159 151
fluences the association between poor physical the respondents by specially trained and intensivelyhealth, representing a major stressor in later life, and supervised lay-interviewers. Informed consent wasdepressive symptoms. obtained from all subjects prior to the study. The
The hypotheses pertain to associations between number of respondents in the LSN-sample was 3805.variables on a higher, contextual level (religious The response-rate was 62.3%. From these, a total ofclimate) and a lower, individual level (depressive 3107 participated in the main LASA interview,symptoms). To test associations between the two resulting in a response rate of 81.7% (10.4% refus-levels adequately, multi-level analysis is used. The als; 8.0% deceased, ineligible, or not contacted). Tomulti-level approach for the present study (see Table examine the distribution of depression across com-1) is discussed in the next section. munities, data are complete for 3051 respondents.
Data on social integration measures are available for2817 respondents. Non-responders were older and
2. Methods reported more depressive symptoms (P , 0.01).Non-response was not related to sex or to religious
2.1. Sample denomination.
The study is part of the ‘Longitudinal Aging Study 2.2. InstrumentsAmsterdam’ (LASA), a nation-wide, 10-year inter-disciplinary study on predictors and consequences of 2.2.1. Individual levelchanges in autonomy and well-being in the aging
`population (Deeg and Westendorp de Seriere, 1994). 2.2.1.1. Dependent variableLASA uses the sample recruited by the NESTOR Depressive symptoms are measured using theprogram ‘Living Arrangements and Social Networks Center for Epidemiologic Studies Depression Scaleof Older Adults in the Netherlands’ (LSN) (Broese (CES-D). This is a 20-item self-report scale de-van Groenou et al., 1995). Participants of LSN were veloped to measure depressive symptoms in theapproached for the first LASA-cycle 11 months after community (Radloff, 1977). Items are scored on athe LSN interview. The cohort was based on a four-point scale (0–3), indicating the frequency ofrandom sample of older adults between the ages of occurrence in the past week. The total score of the55 and 85, stratified for age, sex, and expected CES-D ranges from 0 to 60. The Dutch translationmortality 5 years into the study, which was com- has satisfactory psychometric properties (Cronbach’sputed for males and females in each age category a 5 0.87) (Beekman et al., 1994).using national survival rates of the population in the55–84 age group (NCBS, 1990). The sampling 2.2.1.2. Explanatory variablesframe is provided by registries of 11 municipalities Social integration is assessed with questions onin areas in the West (most secularized), North-East size of social network and on emotional and in-(predominantly Protestant), and South (predominant- strumental support. The social networks of personsly Roman Catholic) of The Netherlands. A property with whom the respondents maintain an importantof this country is that rivalry between several and frequent relationship are determined using aCalvinist ( 5 Reformed) Protestant traditions, along procedure based on Cochran (1990) (van Tilburg,with Roman Catholic and secularized traditions, has 1994). In each of seven categories (persons living indominated sociocultural life profoundly, especially in the same household, children and children-in-law,the generations grown up in the first half of this other relatives, neighbours, persons with whom onecentury (Peters and Schreuder, 1987). Despite the has been working or studying, contacts in organiza-fact that the country is small, the rivalry has resulted tions, and other contacts), the respondents are askedin a distinct geographical variety of religious tradi- to name persons above the age of eighteen who aretions. These traditions are also represented politically important to them and with whom they are in touchby several Christian parties (see under Section 2.2). regularly. The size of the network is determined by
The interviews were conducted in the homes of the number of people named in the seven categories.
152 A.W. Braam et al. / Journal of Affective Disorders 54 (1999) 149 –159
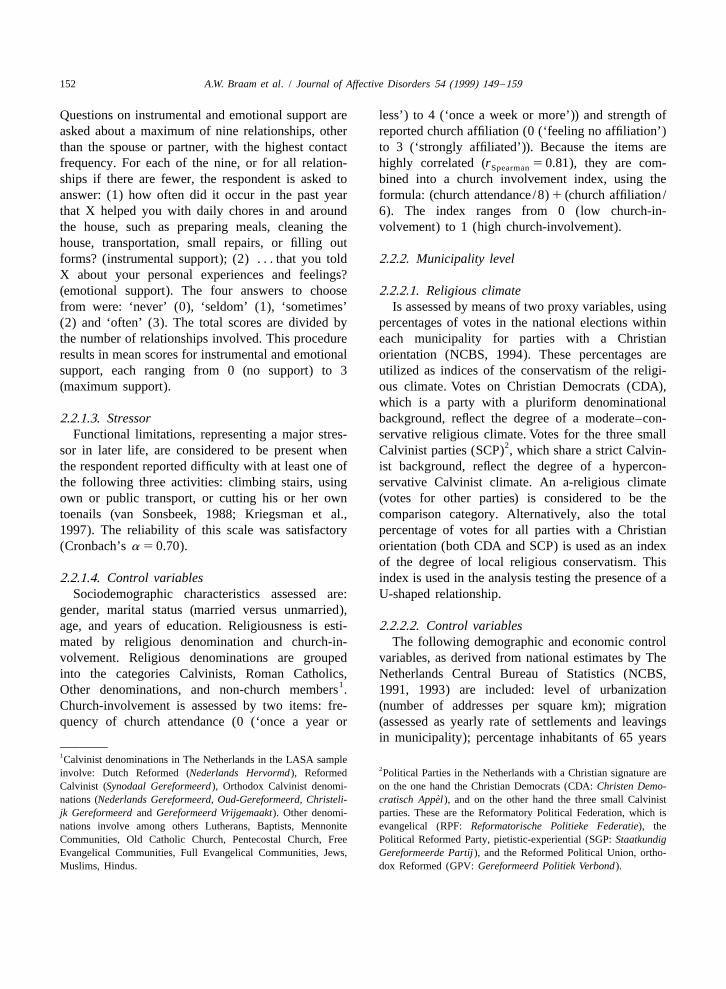
Questions on instrumental and emotional support are less’) to 4 (‘once a week or more’)) and strength ofasked about a maximum of nine relationships, other reported church affiliation (0 (‘feeling no affiliation’)than the spouse or partner, with the highest contact to 3 (‘strongly affiliated’)). Because the items arefrequency. For each of the nine, or for all relation- highly correlated (r 5 0.81), they are com-Spearman
ships if there are fewer, the respondent is asked to bined into a church involvement index, using theanswer: (1) how often did it occur in the past year formula: (church attendance /8) 1 (church affiliation /that X helped you with daily chores in and around 6). The index ranges from 0 (low church-in-the house, such as preparing meals, cleaning the volvement) to 1 (high church-involvement).house, transportation, small repairs, or filling outforms? (instrumental support); (2) . . . that you told 2.2.2. Municipality levelX about your personal experiences and feelings?(emotional support). The four answers to choose 2.2.2.1. Religious climatefrom were: ‘never’ (0), ‘seldom’ (1), ‘sometimes’ Is assessed by means of two proxy variables, using(2) and ‘often’ (3). The total scores are divided by percentages of votes in the national elections withinthe number of relationships involved. This procedure each municipality for parties with a Christianresults in mean scores for instrumental and emotional orientation (NCBS, 1994). These percentages aresupport, each ranging from 0 (no support) to 3 utilized as indices of the conservatism of the religi-(maximum support). ous climate. Votes on Christian Democrats (CDA),
which is a party with a pluriform denominational2.2.1.3. Stressor background, reflect the degree of a moderate–con-
Functional limitations, representing a major stres- servative religious climate. Votes for the three small2sor in later life, are considered to be present when Calvinist parties (SCP) , which share a strict Calvin-
the respondent reported difficulty with at least one of ist background, reflect the degree of a hypercon-the following three activities: climbing stairs, using servative Calvinist climate. An a-religious climateown or public transport, or cutting his or her own (votes for other parties) is considered to be thetoenails (van Sonsbeek, 1988; Kriegsman et al., comparison category. Alternatively, also the total1997). The reliability of this scale was satisfactory percentage of votes for all parties with a Christian(Cronbach’s a 5 0.70). orientation (both CDA and SCP) is used as an index
of the degree of local religious conservatism. This2.2.1.4. Control variables index is used in the analysis testing the presence of a
Sociodemographic characteristics assessed are: U-shaped relationship.gender, marital status (married versus unmarried),age, and years of education. Religiousness is esti- 2.2.2.2. Control variablesmated by religious denomination and church-in- The following demographic and economic controlvolvement. Religious denominations are grouped variables, as derived from national estimates by Theinto the categories Calvinists, Roman Catholics, Netherlands Central Bureau of Statistics (NCBS,
1Other denominations, and non-church members . 1991, 1993) are included: level of urbanizationChurch-involvement is assessed by two items: fre- (number of addresses per square km); migrationquency of church attendance (0 (‘once a year or (assessed as yearly rate of settlements and leavings
in municipality); percentage inhabitants of 65 years1Calvinist denominations in The Netherlands in the LASA sample
2involve: Dutch Reformed (Nederlands Hervormd), Reformed Political Parties in the Netherlands with a Christian signature areCalvinist (Synodaal Gereformeerd), Orthodox Calvinist denomi- on the one hand the Christian Democrats (CDA: Christen Demo-
`nations (Nederlands Gereformeerd, Oud-Gereformeerd, Christeli- cratisch Appel), and on the other hand the three small Calvinistjk Gereformeerd and Gereformeerd Vrijgemaakt). Other denomi- parties. These are the Reformatory Political Federation, which isnations involve among others Lutherans, Baptists, Mennonite evangelical (RPF: Reformatorische Politieke Federatie), theCommunities, Old Catholic Church, Pentecostal Church, Free Political Reformed Party, pietistic-experiential (SGP: StaatkundigEvangelical Communities, Full Evangelical Communities, Jews, Gereformeerde Partij), and the Reformed Political Union, ortho-Muslims, Hindus. dox Reformed (GPV: Gereformeerd Politiek Verbond).
A.W. Braam et al. / Journal of Affective Disorders 54 (1999) 149 –159 153
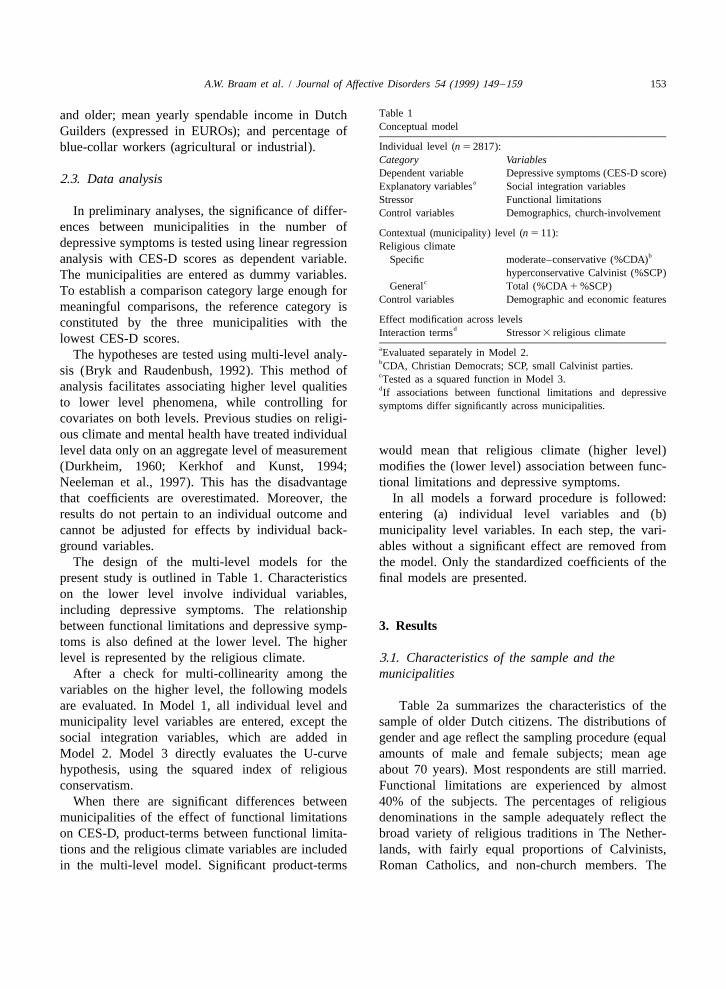
Table 1and older; mean yearly spendable income in DutchConceptual modelGuilders (expressed in EUROs); and percentage ofIndividual level (n 5 2817):blue-collar workers (agricultural or industrial).Category VariablesDependent variable Depressive symptoms (CES-D score)2.3. Data analysis aExplanatory variables Social integration variablesStressor Functional limitations
In preliminary analyses, the significance of differ- Control variables Demographics, church-involvementences between municipalities in the number of Contextual (municipality) level (n 5 11):depressive symptoms is tested using linear regression Religious climate
banalysis with CES-D scores as dependent variable. Specific moderate–conservative (%CDA)hyperconservative Calvinist (%SCP)The municipalities are entered as dummy variables.
cGeneral Total (%CDA 1 %SCP)To establish a comparison category large enough forControl variables Demographic and economic features
meaningful comparisons, the reference category isEffect modification across levelsconstituted by the three municipalities with the
dInteraction terms Stressor 3 religious climatelowest CES-D scores.aEvaluated separately in Model 2.The hypotheses are tested using multi-level analy-bCDA, Christian Democrats; SCP, small Calvinist parties.sis (Bryk and Raudenbush, 1992). This method of cTested as a squared function in Model 3.
analysis facilitates associating higher level qualities dIf associations between functional limitations and depressiveto lower level phenomena, while controlling for symptoms differ significantly across municipalities.covariates on both levels. Previous studies on religi-ous climate and mental health have treated individuallevel data only on an aggregate level of measurement would mean that religious climate (higher level)(Durkheim, 1960; Kerkhof and Kunst, 1994; modifies the (lower level) association between func-Neeleman et al., 1997). This has the disadvantage tional limitations and depressive symptoms.that coefficients are overestimated. Moreover, the In all models a forward procedure is followed:results do not pertain to an individual outcome and entering (a) individual level variables and (b)cannot be adjusted for effects by individual back- municipality level variables. In each step, the vari-ground variables. ables without a significant effect are removed from
The design of the multi-level models for the the model. Only the standardized coefficients of thepresent study is outlined in Table 1. Characteristics final models are presented.on the lower level involve individual variables,including depressive symptoms. The relationshipbetween functional limitations and depressive symp- 3. Resultstoms is also defined at the lower level. The higherlevel is represented by the religious climate. 3.1. Characteristics of the sample and the
After a check for multi-collinearity among the municipalitiesvariables on the higher level, the following modelsare evaluated. In Model 1, all individual level and Table 2a summarizes the characteristics of themunicipality level variables are entered, except the sample of older Dutch citizens. The distributions ofsocial integration variables, which are added in gender and age reflect the sampling procedure (equalModel 2. Model 3 directly evaluates the U-curve amounts of male and female subjects; mean agehypothesis, using the squared index of religious about 70 years). Most respondents are still married.conservatism. Functional limitations are experienced by almost
When there are significant differences between 40% of the subjects. The percentages of religiousmunicipalities of the effect of functional limitations denominations in the sample adequately reflect theon CES-D, product-terms between functional limita- broad variety of religious traditions in The Nether-tions and the religious climate variables are included lands, with fairly equal proportions of Calvinists,in the multi-level model. Significant product-terms Roman Catholics, and non-church members. The
154 A.W. Braam et al. / Journal of Affective Disorders 54 (1999) 149 –159
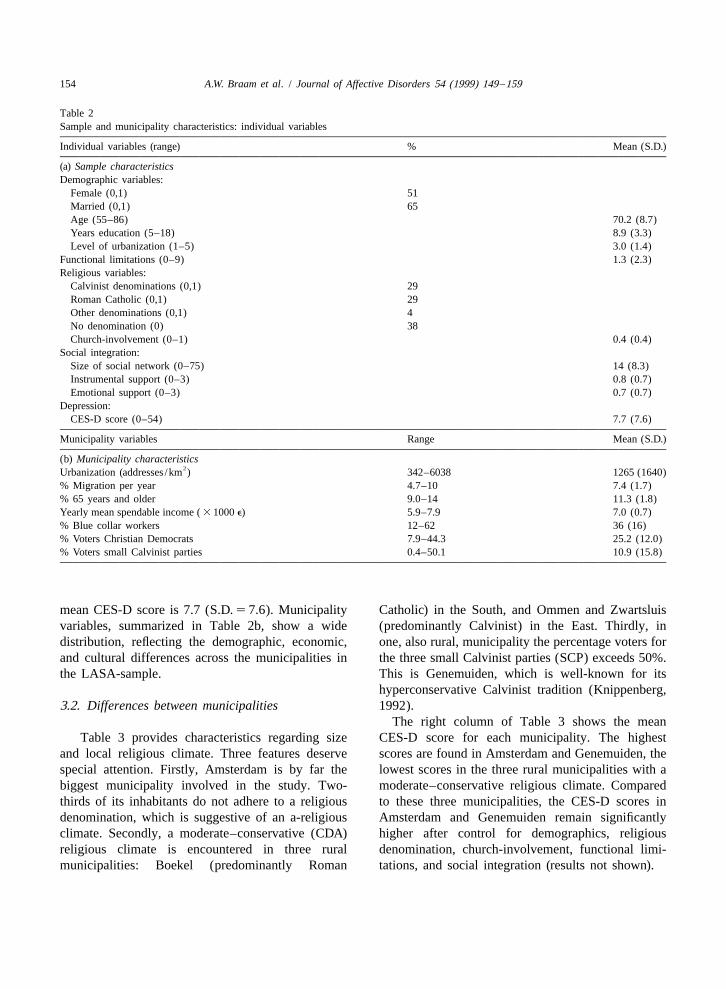
Table 2Sample and municipality characteristics: individual variables
Individual variables (range) % Mean (S.D.)
(a) Sample characteristicsDemographic variables:
Female (0,1) 51Married (0,1) 65Age (55–86) 70.2 (8.7)Years education (5–18) 8.9 (3.3)Level of urbanization (1–5) 3.0 (1.4)
Functional limitations (0–9) 1.3 (2.3)Religious variables:
Calvinist denominations (0,1) 29Roman Catholic (0,1) 29Other denominations (0,1) 4No denomination (0) 38Church-involvement (0–1) 0.4 (0.4)
Social integration:Size of social network (0–75) 14 (8.3)Instrumental support (0–3) 0.8 (0.7)Emotional support (0–3) 0.7 (0.7)
Depression:CES-D score (0–54) 7.7 (7.6)
Municipality variables Range Mean (S.D.)
(b) Municipality characteristics2Urbanization (addresses /km ) 342–6038 1265 (1640)
% Migration per year 4.7–10 7.4 (1.7)% 65 years and older 9.0–14 11.3 (1.8)Yearly mean spendable income ( 3 1000 e) 5.9–7.9 7.0 (0.7)% Blue collar workers 12–62 36 (16)% Voters Christian Democrats 7.9–44.3 25.2 (12.0)% Voters small Calvinist parties 0.4–50.1 10.9 (15.8)
mean CES-D score is 7.7 (S.D. 5 7.6). Municipality Catholic) in the South, and Ommen and Zwartsluisvariables, summarized in Table 2b, show a wide (predominantly Calvinist) in the East. Thirdly, indistribution, reflecting the demographic, economic, one, also rural, municipality the percentage voters forand cultural differences across the municipalities in the three small Calvinist parties (SCP) exceeds 50%.the LASA-sample. This is Genemuiden, which is well-known for its
hyperconservative Calvinist tradition (Knippenberg,3.2. Differences between municipalities 1992).
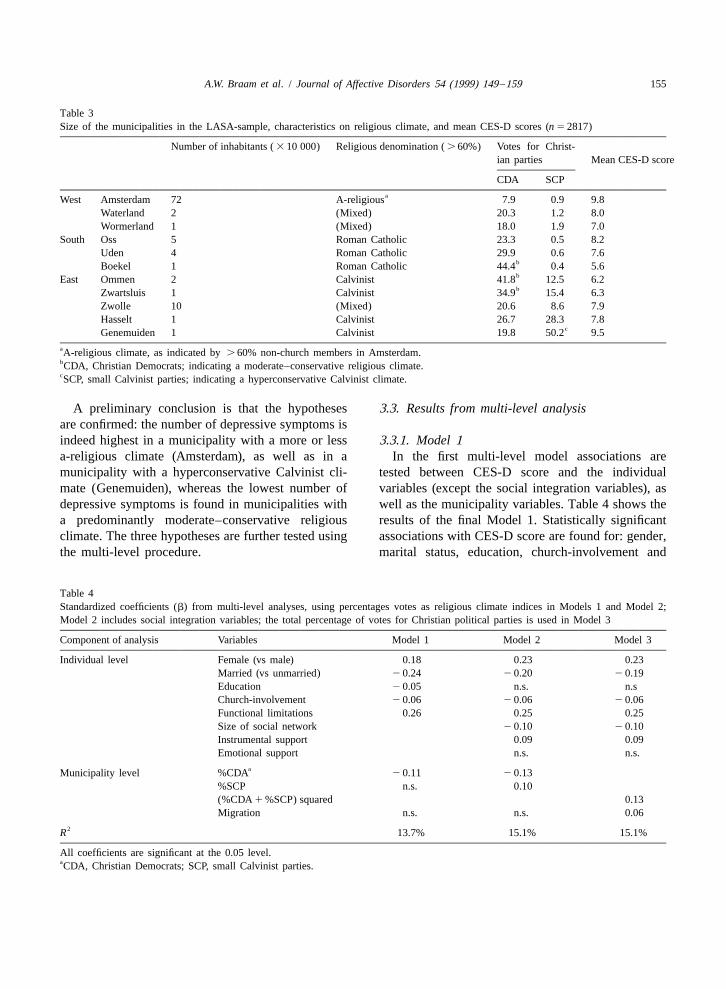
The right column of Table 3 shows the meanTable 3 provides characteristics regarding size CES-D score for each municipality. The highest
and local religious climate. Three features deserve scores are found in Amsterdam and Genemuiden, thespecial attention. Firstly, Amsterdam is by far the lowest scores in the three rural municipalities with abiggest municipality involved in the study. Two- moderate–conservative religious climate. Comparedthirds of its inhabitants do not adhere to a religious to these three municipalities, the CES-D scores indenomination, which is suggestive of an a-religious Amsterdam and Genemuiden remain significantlyclimate. Secondly, a moderate–conservative (CDA) higher after control for demographics, religiousreligious climate is encountered in three rural denomination, church-involvement, functional limi-municipalities: Boekel (predominantly Roman tations, and social integration (results not shown).
A.W. Braam et al. / Journal of Affective Disorders 54 (1999) 149 –159 155
Table 3Size of the municipalities in the LASA-sample, characteristics on religious climate, and mean CES-D scores (n 5 2817)
Number of inhabitants ( 3 10 000) Religious denomination ( . 60%) Votes for Christ-ian parties Mean CES-D score
CDA SCPaWest Amsterdam 72 A-religious 7.9 0.9 9.8
Waterland 2 (Mixed) 20.3 1.2 8.0Wormerland 1 (Mixed) 18.0 1.9 7.0
South Oss 5 Roman Catholic 23.3 0.5 8.2Uden 4 Roman Catholic 29.9 0.6 7.6
bBoekel 1 Roman Catholic 44.4 0.4 5.6bEast Ommen 2 Calvinist 41.8 12.5 6.2bZwartsluis 1 Calvinist 34.9 15.4 6.3
Zwolle 10 (Mixed) 20.6 8.6 7.9Hasselt 1 Calvinist 26.7 28.3 7.8
cGenemuiden 1 Calvinist 19.8 50.2 9.5aA-religious climate, as indicated by . 60% non-church members in Amsterdam.bCDA, Christian Democrats; indicating a moderate–conservative religious climate.cSCP, small Calvinist parties; indicating a hyperconservative Calvinist climate.
A preliminary conclusion is that the hypotheses 3.3. Results from multi-level analysisare confirmed: the number of depressive symptoms isindeed highest in a municipality with a more or less 3.3.1. Model 1a-religious climate (Amsterdam), as well as in a In the first multi-level model associations aremunicipality with a hyperconservative Calvinist cli- tested between CES-D score and the individualmate (Genemuiden), whereas the lowest number of variables (except the social integration variables), asdepressive symptoms is found in municipalities with well as the municipality variables. Table 4 shows thea predominantly moderate–conservative religious results of the final Model 1. Statistically significantclimate. The three hypotheses are further tested using associations with CES-D score are found for: gender,the multi-level procedure. marital status, education, church-involvement and
Table 4Standardized coefficients (b) from multi-level analyses, using percentages votes as religious climate indices in Models 1 and Model 2;Model 2 includes social integration variables; the total percentage of votes for Christian political parties is used in Model 3
Component of analysis Variables Model 1 Model 2 Model 3
Individual level Female (vs male) 0.18 0.23 0.23Married (vs unmarried) 2 0.24 2 0.20 2 0.19Education 2 0.05 n.s. n.sChurch-involvement 2 0.06 2 0.06 2 0.06Functional limitations 0.26 0.25 0.25Size of social network 2 0.10 2 0.10Instrumental support 0.09 0.09Emotional support n.s. n.s.
aMunicipality level %CDA 2 0.11 2 0.13%SCP n.s. 0.10(%CDA 1 %SCP) squared 0.13Migration n.s. n.s. 0.06
2R 13.7% 15.1% 15.1%
All coefficients are significant at the 0.05 level.aCDA, Christian Democrats; SCP, small Calvinist parties.
156 A.W. Braam et al. / Journal of Affective Disorders 54 (1999) 149 –159
functional limitations. CES-D scores are higher for entered as a squared function of the CES-D score. Asfemale respondents and respondents with functional can be read from Table 4, a significant, positivelimitations. CES-D scores are lower if respondents coefficient (b 5 0.13) is found. This indicates theare married, highly educated, or strongly involved in presence of a curvilinear relationship between thethe church. degree of conservatism of the religious climate and
Before the municipality variables were entered in depressive symptoms, which is U-shaped, becauseModel 1, their intercorrelations were evaluated. The the coefficient is positive. The local percentage ofPearson correlation between percentage Christian migration also remains in the final model: the moreDemocrats and urbanization amounted to 2 0.81. To migration locally, the more depressive symptoms.avoid multi-collinearity, the variable urbanizationwas removed from Model 1 (and subsequently also 3.3.4. Effect modificationfrom Model 2). In the final Model 1, the percentage The product-terms between functional limitationsvoters for Christian Democrats is associated nega- and the religious climate variables are evaluated intively (b 5 2 0.11) with the mean municipality analogous models (results not presented). However,CES-D score. This finding supports the second the differences in effects of functional limitations onhypothesis, that depressive symptoms are less preva- CES-D scores across the municipalities are too smalllent in a moderate–conservative religious climate. (and only significant on the 0.10 significance-level)
to justify their interpretation or further discussion.3.3.2. Model 2 Therefore, it is concluded that there is no relevant
The social integration variables are incorporated in effect modification by religious climate on thethe second model. Nearly identical results are found association between functional limitations and depres-for the individual variables gender, marital status and sive symptoms.functional limitations. Respondents with large socialnetworks generally had lower CES-D scores thanthose with small networks, indicating that social 4. Discussionintegration protects against depressive symptoms.Respondents who received relatively much in- The objective of the present study was to demon-strumental support had higher CES-D scores. This strate whether religious climate, as a contextualfinding probably reflects that limited physical health quality, affects the geographical distribution of de-(and the consequent dependency on help) is associ- pressive symptoms in later life. Evidence was foundated with both receiving instrumental support and of the existence of the hypothesized U-shaped curvi-being depressed. linear relationship between the degree of conservat-
As is shown in Table 4, the association between ism of the religious climate and depressive symp-percentage votes for Christian Democrats and the toms. The U-curve hypothesis encompasses threemean municipality CES-D score is slightly stronger separate hypotheses.(b 5 2 0.13) in Model 2 than in Model 1. More- Some support was found for the first hypothesis,over, the percentage votes for small Calvinist parties that an a-religious climate enhances depressiveshows a significant, positive association with the symptoms. In Amsterdam, which is characterized bymean municipality CES-D scores (b 5 0.10). This an a-religious climate, depressive symptoms werelatter finding supports the third hypothesis of the more prevalent. This association was however notpresent study, that depressive symptoms are more tested directly, because a-religious climate served asprevalent in a hyperconservative Calvinist climate. the contrast category for the proxy variables of
moderate–conservative and hyperconservative religi-3.3.3. Model 3 ous climate. The high prevalence of depressive
The U-curve hypothesis is tested more specifically symptoms in Amsterdam, as well as in urban areas inin Model 3. The total percentage of votes for general, may be attributed to a broad variety ofChristian political parties, which is used as an index contextual factors. One of these factors may be aof the conservatism of the religious climate, is cultural climate that lacks a religious orientation.
A.W. Braam et al. / Journal of Affective Disorders 54 (1999) 149 –159 157
Other factors that may increase stress for older adults and Harris (1978). Religious climate did not con-in urban areas are anonymity, bureaucracy, busy dition the association between a stressor (functionaltraffic, impoverishment and crime. limitations) and depressive symptoms. This might be
In support of the second hypothesis, depressive due to the fact that between-municipality differencessymptoms were, indeed, less prevalent in in health-care provisions are most probably verymunicipalities with a moderate–conservative religi- small in The Netherlands. Because of the high
2ous climate. The finding held when controlling for population density of the country (449 per km inindividual church-involvement and individual religi- 1993), health-care services are available withinous denomination. Therefore, in its association with limited distances.depressive symptoms, religious climate seems to Although the sample was intended to be repre-represent a factor that operates independently of sentative of the older Dutch population, the potentialindividual religiousness. Effects of individual religi- bias caused by attrition must be considered. Non-ousness on depression in the present sample were response was selective for the older (and less heal-described in more detail in an earlier article (Braam thy) subjects throughout the study. The samplinget al., 1997). Furthermore, the effect of religious strategy was designed with the specific aim toclimate cannot be attributed to the effects of size of include older-old subjects. Paradoxically, oversam-social network and social support. Explanations for pling in the most vulnerable strata of the olderthis protective effect of religious climate are offered population has lead to a higher non-response. In spiteby Ellison (1994). He focuses on qualitative aspects of the somewhat restricted representativity, non-re-of social integration in a religious community, such sponse has not lead to a sample of ‘healthy elderly’.as a sense of belonging and interpersonal trust, The non-response within the study sample, due towhich in turn bolster perceptions of network re- item non-response and the use of a short version ofliability. the interview for frail respondents, was associated
As was hypothesized (third hypothesis), depres- with depression. Therefore, the variability of depres-sive symptoms were more prevalent in a hypercon- sive symptoms is smaller in the sample left. Thisservative Calvinist environment. It should be noted may result in underestimation of geographical differ-that a significant association was only revealed when ences in depressive symptoms.effects of social integration were controlled for. This Another limitation of the study is that only proxysuggests that social integration attenuates the in- variables for religious climate were available. Itfluence of a hyperconservative Calvinist climate on might be argued that voting for a particular partylate life depressive symptoms. Therefore, in terms of occurs on the basis of its policies rather than itssocial processes (Pescosolido and Georgianna, religious orientation. As far the authors know, the1989), the origins of the depressogenic net-effect of validity of this procedure remains to be quantified.hyperconservative Calvinist climate cannot be sought With respect to the SCP, it is our impression that thein a poor degree of social integration. The remaining hyperconservative Calvinist background is prominentexplanation is related to overregulation. Overregula- in many aspects of life (media, mental health care,tion induces strict adherence to the Calvinist doc- politics), which especially occurs in particular geog-trines, reinforcing ideas about predestination and raphic areas, recognized as the Dutch ‘Bible Belt’.culpability. A totally different explanation that can The validity with respect to the CDA may be lessbe offered is that the higher prevalence of depression evident. Nevertheless, a strong correlation betweenis due to genetic susceptibility, as might be caused percentage of local church-membership and percent-by the fairly low migration rate in the communities age votes for the CDA (r 5 0.83) suggestsSpearman
with a hyperconservative Calvinist climate. Never- that voting CDA is not independent of religioustheless, migration rate did not explain the effects of orientation. Furthermore, the CDA suffered a severehyperconservative Calvinist climate in the present loss in the elections of 1994. It might be assumedanalyses. that many of the remaining voters still endorsed the
No support was found for the hypothesis that was traditional Christian background of this party, ratherbased on the vulnerability–stress model of Brown than its political achievements.
158 A.W. Braam et al. / Journal of Affective Disorders 54 (1999) 149 –159
Studies of the geographical distribution of depres- Referencession and suicide have been firmly criticized because
Allport, G.W., 1950. The Individual and His Religion: A Psycho-of methodological errors. Especially the ‘ecologicallogical Interpretation. Macmillan, New York.fallacy’ (treating group data as though they were
Batson, C.D., Schoenrade, R., Ventis, W.L., 1993. Religion and theindividual data) has been a major shortcoming of, forIndividual. University Press, Oxford.
example, Durkheim’s study of religion, anomia, and Becker, J.W., Vink, R., 1994. Secularisatie in Nederland, 1966–suicide in European countries (van Poppel and Day, 1991; de verandering van opvattingen en enkele gedragingen
[Secularization in the Netherlands, 1966–1991]. Social and1996). The present method has avoided this short-Cultural Studies, Volume 19, Rijswijk, the Netherlands.coming as far as possible by applying the multi-level
Beekman, A.T.F., van Limbeek, J., Deeg, D.J.H., Wouters, L., vanapproach. This allowed controlling for effects of Tilburg, W., 1994. Een screeningsinstrument voor depressie bijindividual background variables, as well as sys- ouderen in de algemene bevolking: de bruikbaarheid van detematic inspection of cross-relationships between the Center for Epidemiologic Studies Depression Scale (CES-D)
[Screening for depression in the community: using the Centerhigher and lower level of measurement.for Epidemiologic Studies Depression Scale (CES-D) in TheThe present study offered an appropriate nationalNetherlands]. Tijdschr. Gerontol. Geriatr. 25, 95–103.
cross-cultural setting to demonstrate the presence of Beekman, A.T.F., Deeg, D.J.H., van Tilburg, T., Smit, J.H.,cultural effects on the geographical distribution of Hooijer, C., van Tilburg, W., 1995. Major and minor depressiondepressive symptoms. Through the last four cen- in later life: a study of prevalence and risk factors. J. Affect.
Disord. 36, 65–75.turies, The Netherlands have repeatedly experiencedBerkman, L.F., Berkman, C.S., Kasl, S.V., Freeman, D.H., Leo, L.,fundamentalist movements which have tried to re-
Osfield, A.M., Coroni-Huntly, J., Brody, J., 1986. Depressivestore strict Calvinist orthodoxy (Peters and symptoms in relation to physical health and functioning in theSchreuder, 1987). These movements have been elderly. Am. J. Epidemiol. 124, 372–388.successful, ultimately, in small towns and villages in Blazer, D.G., 1994. Epidemiology of late life depression. In:
Schneider, L.J., Reynolds, C.F. III, Lebowitz, B.D., Friedhoff,rural areas, situated in a more or less diagonal lineA.J. (Eds.), Diagnosis and Treatment of Late Life Depression:from the south-west to the north-east of the country,Results of the NIH-Consensus Development Conference. APA,
sometimes referred to as the aforementioned Dutch Washington, pp. 9–21.‘Bible Belt’. This Calvinist phenomenon may be Blazer, D.G., George, L.K., Landerman, R., Pennybaker, M.,particular to The Netherlands and less evident in Melville, M.L., Woodbury, M., Manton, K.G., Jordan, K.,
Locke, B., 1985. Psychiatric disorders; a rural /urban com-other European countries. Nevertheless, religiousparison. Arch. Gen. Psychiatry 42, 651–656.conservatism is essentially present in many degrees
Braam, A.W., Beekman, A.T.F., van Tilburg, T.G., Deeg, D.J.H.,in virtually all nations and cultures, and appears to van Tilburg, W., 1997. Religious involvement and depression inbe a suitable phenomenon to include in psychiatric– older Dutch citizens. Soc. Psychiatry Psychiatr. Epidemiol. 32,epidemiological surveys. Future research is war- 284–291.
Broese van Groenou, M.I., van Tilburg, T.G., de Leeuw, E.D.,ranted to disentangle the adaptive and maladaptiveLiefbroer, A.C., 1995. Data collection. In: Knipscheer, C.P.M.,mechanisms of religious climate as a contextualde Jong Gierveld, J., van Tilburg T.G., Dijkstra, P.A. (Eds.),
condition. A clear understanding of its sociological Living Arrangements and Social Networks of Older Adults.VUmechanisms may help policy-makers and mental University Press, Amsterdam, pp. 185–197.health workers to improve intervention strategies. Brown, G.W., Harris, T., 1978. Social Origins of Depression: A
Study of Psychiatric Disorder in Women. Tavistock, London.Bryk, A.S., Raudenbush, S.W., 1992. Hierarchical Linear Models:
Applications and Data Analysis Methods. Sage, Newbury Park,CA.
Acknowledgements Cochran, M., 1990. Extending Families: The Social Networks ofParents and their Children. Cambridge University Press, Cam-bridge.This study was conducted as a part of the Longi-
`Deeg, D.J.H., Westendorp de Seriere, M., 1994. Autonomy andtudinal Aging Study Amsterdam (LASA), which isWell-Being in the aging Population I. Report from the Longi-
funded by the Dutch Ministry of Health, Welfare and tudinal Aging Study Amsterdam 1992–1993. VU UniversitySports and by the Universitair Stimuleringsfonds of Press, Amsterdam.
´the Vrije Universiteit. Dewey, M.E., de la Camara, C., Copeland, J.R.M., Lobo, A., Saz,
A.W. Braam et al. / Journal of Affective Disorders 54 (1999) 149 –159 159
P., 1993. Cross-cultural comparison of depression and depres- Netherlands Central Bureau of Statistics (NCBS) (1994) Statistieksive symptoms in older people. Acta Psychiatr. Scand. 87, der Verkiezingen 1994; Tweede Kamer, 3 mei [Statistics of the369–373. National Elections 1994; Parliament May 3d]. Centraal Bureau
Durkheim, E., 1960 [1897]. Le Suicide [Suicide]. Presses Uni- voor de Statistiek, Heerlen, The Netherlands.versitaires de France, Paris. Netherlands Central Bureau of Statistics (NCBS) (1990) Over-
Ellis, A., 1980. Psychotherapy and atheistic values: a response to levingstafels voor mannen en vrouwen naar leeftijd, 1985–A.E. Bergin’s ‘Psychotherapy and religious values’. J. Consult. 1989 [Survival tables for men and women according to age,Clin. Psychol. 48, 635–639. 1985–1989]. Maandstatistiek van de bevolking, 90/9, 50–51.
Ellison, C.G., 1994. Religion, the life stress paradigm, and the Netherlands Central Bureau of Statistics (NCBS) (1991). Statis-study of depression. In: Levin, J.S. (Ed.), Religion in Aging tisch Bestand Nederlandse Gemeenten 1990 [Statistical Fileofand Health: Theoretical Foundations and Methodological Fron- the Municipalities in The Netherlands 1990]. Centraal Bureautiers. Sage, Thousand Oaks, CA. voor de Statistiek, Voorburg /Heerlen, The Netherlands.
Freud, S., 1959 [1907]. Obsessive Actions and Religious Prac- Netherlands Central Bureau of Statistics (NCBS) (1993). Re-tices. Standard Edition, vol. 9, pp. 115–127. gionaal Statistische Jaarcijfers 1993 [Regional Yearly Statistics
Fromm, E., 1950. Psychoanalysis and religion. Yale University 1993]. Centraal Bureau voor de Statistiek, Voorburg /Heerlen,Press, New Haven. The Netherlands.
Gurland, B.J., Wilder, D.E., 1988. Depression and disability in the Pescosolido, B.A., Georgianna, S., 1989. Durkheim, suicide, andelderly: reciprocal relations and changes with age. Int. J. religion: toward a network theory of suicide. Am. Soc. Rev. 54,Geriatr. Psychiatry 3, 163–179. 33–48.
Idler, E.L., Kasl, S.V., 1992. Religion, disability, depression, and Peters, J., Schreuder, O., 1987. Katholiek en Protestant: Eenthe timing of death. Am. J. Sociol. 97, 1052–1079. Historisch en Contemporain Onderzoek naar Confessionele
Jung, C.G., 1931. Die Lebenswende [The stages of life]. In: Culturen [Catholic and protestant: a historical and contempor-¨ ¨Seelenprobleme der Gegenwart, Vortrage und Aufsatze; Psy- ary study of confessional cultures]. Instituut voor Toegepaste
¨chologische Abhandlungen, Band III. Rascher Verlag, Zurich / Sociale Wetenschappen, Nijmegen, The Netherlands.Leipzig. van Poppel, F., Day, L.H., 1996. A test of Durkheim’s theory of
Kerkhof, A., Kunst, A., 1994. A European perspective on suicidal suicide—without committing the ‘ecological fallacy’. Am. Soc.behaviour. In: Jenkins, R., Griffiths, S., Wylie, I., Hawton, K., Rev. 61, 500–507.Morgan, G., Tylee, A. (Eds.), The Prevention of Suicide. Radloff, L.S., 1977. The CES-D scale: a self-report depressionHMSO, London. scale for research in the general population. Appl. Psychol.
Knippenberg, H., 1992. The religious map of the Netherlands: size Meas. 1, 385–401.and geographic distribution of the religious denominations Rutter, M., Dunn, J., Plomin, R., Simonoff, E., Pickles, A.,from the Age of Reformation until modern time. Van Gorcum, Maughan, B., Ormel, J., Meyer, J., Eaves, L., 1997. IntegratingAssen, The Netherlands. nature and nurture; implications of person-environment correla-
Koenig, H.G., 1994. Religion and hope for the disabled elder. In: tions and interactions for developmental psychopathology.Levin, J.S. (Ed.), Religion in Aging and Health: Theoretical Development and Psychopathology. 9, 335–364.Foundations and Methodological Frontiers. Sage, Thousand Sartorius, N., 1986. Cross-cultural research on depression. Psy-Oaks, CA. chopathology 19, 6–11.
Koenig, H.G., George, L.K., Meador, K.G., Blazer, D.G., Dyck, Schilder, A., 1987. Hulpeloos maar schuldig; het verband tussenP.B., 1994. Religious affiliation and psychiatric disorder among een gereformeerde paradox en depressie [Helpless but guilty:protestant baby boomers. Hosp. Community Psychiatry 45, the relation between a reformatory paradox and depression].586–596. Kok, Kampen, the Netherlands.
Kriegsman, D.M.W., van Eijk, J.Th.M., Penninx, B.W.J.H., Deeg, Sethi, S., Seligman, M.E.P., 1993. Optimisim and fundamentalism.D.J.H., Boeke, A.J.P., 1997. Does family support buffer the Psychol. Science. 4, 256–259.impact of specific chronic diseases on mobility in community- van Sonsbeek, J.L.A., 1988. Methodological and substantialdwelling elderly? Disabil. Rehabil. 19, 71–83. aspects of the OECD indicator of chronic functional limita-
Kruyt, C.S., 1960. Zelfmoord, statistisch-sociologische verkenn- tions. Maandbericht Gezondheid. 88, 4–17.ingen [Suicide, statistical-sociological explorations]. Van Gor- van Tilburg, T.G., 1994. Social network size and support. In:
`cum, Assen, the Netherlands. Deeg, D.J.H., Westendorp de Seriere, M. (Eds.), Autonomy andMacDonald, C.B., Luckett, J.B., 1983. Religious affiliation and Well-Being in the Aging Population I: Report from the
psychiatric diagnoses. J. Sci. Stud. Religion 22, 15–37. Longitudinal Aging Study Amsterdam 1992–1993. VU Uni-Madianos, M.G., Stefanis, C.N., 1992. Changes in the prevalence versity Press, Amsterdam.
of symptoms of depression and depression across Greece. Soc. Umberson, D., 1987. Family status and health behaviors: socialPsychiatry Psychiatr. Epidemiol. 27, 211–219. control as a dimension of social integration. J. Health Social
Neeleman, J., Halpern, D., Leon, D., Lewis, G., 1997. Tolerance Behav. 28, 306–319.of suicide, religion and suicide rates: an ecological andindividual study in 19 Western countries. Psychol. Med. 27,1165–1171.