Embed Size (px)
Citation preview
Religious Representation and Economic Growth: Evidence from Indian States
Undergraduate Research Thesis
Presented in partial fulfillment of the requirements for graduation with honors research distinction in
Economics in the undergraduate colleges of The Ohio State University
by
Sarah Siddiqui
The Ohio State University
April 2021
Project Advisors: Professor Bruce Weinberg and Professor Joyce Chen, Department of Economics
I. Abstract
In places such as India where both identity and conflict are often derived from religious
affiliation, the question of how religion impacts policy is an important one. Representation in politics
may improve the status of disadvantaged religious groups such as Muslims or be influenced by
underlying religious beliefs. In this project, I use regression discontinuity analysis looking at narrow
electoral victories to estimate the effect of electing politicians of different religious groups on
economic growth. I overcome data-related challenges by using a novel method to predict politician
religion from names, and by substituting traditional economic output metrics with light generated at
night. I find that between 1989 and 2008, economic growth in Indian constituencies increased by 26-
37% when Muslims took state-level office. These results suggest that local political representation of
Muslims can have important effects for India as a whole. More broadly, this research contributes to
the idea that representation of religious minority groups is integral to improving socioeconomic
outcomes.
II. Introduction
The relationship between religion and economic growth has been examined since as far back as
Weber’s seminal theory of the Protestant work ethic. Over the past 30 years in particular, the study of
religion, culture, and economic outcomes across countries within the field of economics has gained
significant traction (Chen & Hungerman, 2014). Much of this interest is driven by the idea that
religion and politics are often intertwined, particularly within Christianity, Judaism, and Islam
(Becker et al., 2020). However, studying how religion and religiosity impact economic and social
outcomes is hampered by a two-way causal relationship: whereas religion may impact individual
characteristics such as incentives to work, it is also true that economic development, politics, and
institutions in turn impact religious participation (McCleary & Barro, 2006). This poses a challenge
for disentangling the causal impact of religious belief and affiliation from its predictors. Gathering
data that disaggregates accurately by religion is also a challenge, further hindering efforts to study
the impacts of religious affiliation.
Regarding Islam, a significant area of literature in political economy focuses on the institutional
effects of Islamically ruled states. For example, Kuran (2011) argued that the economic divergence
between the Middle East can be explained by certain institutions in Islamic law that held the Islamic
world from developing. Yet it remains unclear to what extent individual religious affiliation
influences the decisions made by policymakers in secular states. Myersson (2014) studied rule by
Islamic political parties in Turkey, finding that Islamic rule enables women’s access to education.
Barro and McCleary (2019) showed that Muslims have particularly strong beliefs in heaven and hell
as well as strong religious participation, characteristics that typically correlate with economic growth.
As I study here, it is possible that legislators of different faiths make different policy decisions.
Within the Indian context, there are several reasons why Muslim legislators may make different
decisions than non-Muslim legislators. For one, Muslims are socioeconomically disadvantaged,
discriminated against, and politically underrepresented (Asher et al., 2020). Yet evidence exists that
political representation of minority groups improves social and economic status (Bhalotra et al.,
2014). Consistent with existing literature on minority representation, proper representation of
Muslims in politics may lead to better economic outcomes because they are more familiar with the
needs of their group (Bhavnani & Lee, 2021). Members of a minority group may also hold cognitive
bias in favor of their group, face pressure from members of their group, or be less likely to
discriminate against their group. Bhalotra et al. (2014) most comprehensively studied the impact of
Muslim legislators on social and development outcomes from the lens of minority representation.
Using a regression discontinuity design, they concluded that electing Muslims to state legislatures
improved infant mortality rates and educational attainment for all, with no evidence for favoritism for
Muslims. Similar conclusions hold in a related body of literature where electing women to office
results in enacting more women-friendly policies (Brollo & Troiano, 2016).

The prevalence of anti-Muslim discrimination may also mean that Muslims who do gain political
power are more qualified than those who do not. Therefore, we may expect Muslim legislators to
implement more effective policies than members of the majority Hindu group. Finally, Muslim
legislators may hold different priorities than legislators of other faiths. For example, they may hold
different perspectives on the role of government which manifest through policy decisions.
The question of how politician religion contributes to local economic growth in India remains
relatively unexplored, but is especially relevant in the climate of polarization between political
parties in India, often divided over religious lines (Mitra & Ray, 2019). My goal is to quantify the
impact of local politician identity on state-level economic output, an effect that may occur through
the mechanism of local policy change. I find that raising the proportion of Muslims in state-level
offices stimulates economic growth. Moreover, this work can have implications for India’s
reservation system that establishes quotas for certain disadvantaged groups, including Muslims.
III. Background
Indian Legislature
The Constitution of India establishes the nation as a “secular, democratic republic.” A federal
union of 28 states and 8 union territories, India is governed by a parliamentary system, with the
national legislative system composed of an upper and lower House. With 8 recognized national
parties and over 40 regional parties, there is significant turnover between political parties at the
national, state, and local levels.
The structure of Indian state and territory governments varies. Six states (Andhra Pradesh,
Karnataka, Telangana, Maharashtra, Bihar, and Uttar Pradesh) have bicameral legislatures composed
of two houses – a state Legislative Council (Vidhan Parishad) as the upper house, with the state
Legislative Assembly (Vidhan Sabha) as the lower house. Five territories do not have state legislative
bodies and instead are directly governed by the national government. The other 22 states and three
Union territories have unicameral governments, consisting of only a Legislative Assembly. Members
of the state Legislative Assemblies (MLAs), the focus of this paper, are elected directly by their
constituencies through a single-member “first-past-the-post” system. The candidate who receives the
most votes in each legislative constituency is elected to serve a 5-year term in state office. There are
approximately 4,000 MLAs nationwide at any given time. Because elections typically take place
during the spring, MLAs who are elected to serve take office the same year the election occurs. In
some cases, MLAs will elect to leave their position before the end of their term, resulting in a bye-
election to fill the position.
State governments are the primary legislators with regards to social and economic issues and
expenditure (Bhalotra et al., 2014). Constitutionally, MLAs hold significant control over public
goods and state budgets. They also oversee how local development funds are spent and can utilize
discretionary development funds within their constituencies. Moreover, MLAs exercise control over
the state bureaucracy and its financial allocations. Thus, MLAs have the capacity to make policy
decisions that notably impact local economic growth (Prakash et al., 2019).
Muslims in Politics
According to the 2011 Census of India, Muslims comprise the largest religious minority in India
at 14.2% of the population, approximately 172 million people. A well-known 2006 report released by
the Sachar committee documented the social, economic, and political inequities faced by Muslims,
stating in regard to political representation that “minorities in India lack effective agency and
political importance. They do not have the necessary influence or the opportunity to either change or
even influence events which enables their meaningful and active participation in development
process,” (Sachar, 2006). At the federal level, Ghouse (2018) shows that population-wise, 57% of
Muslims were not represented in India’s lower house (Lok Sabha) over the 2004, 2009, and 2014
elections. Below, I document the share of Muslim MLAs out of all MLAs between 1974 and 2018.
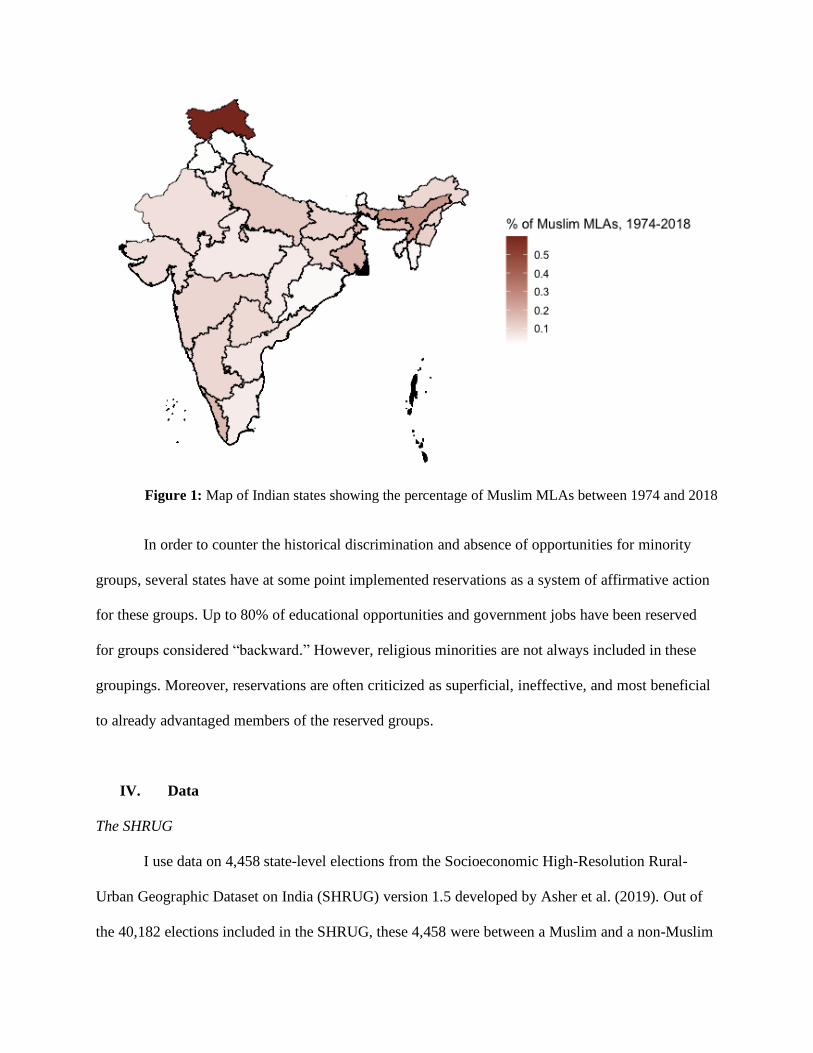
Figure 1: Map of Indian states showing the percentage of Muslim MLAs between 1974 and 2018
In order to counter the historical discrimination and absence of opportunities for minority
groups, several states have at some point implemented reservations as a system of affirmative action
for these groups. Up to 80% of educational opportunities and government jobs have been reserved
for groups considered “backward.” However, religious minorities are not always included in these
groupings. Moreover, reservations are often criticized as superficial, ineffective, and most beneficial
to already advantaged members of the reserved groups.
IV. Data
The SHRUG
I use data on 4,458 state-level elections from the Socioeconomic High-Resolution Rural-
Urban Geographic Dataset on India (SHRUG) version 1.5 developed by Asher et al. (2019). Out of
the 40,182 elections included in the SHRUG, these 4,458 were between a Muslim and a non-Muslim
– either the winning candidate was Muslim and the second-place candidate was non-Muslim, or the
winning candidate was non-Muslim and the second-place candidate was Muslim. The SHRUG
uniquely links Indian administrative data with external data sources to include demographic
information at the towns and village level and economic indicators such as unemployment and night
light emissions.
At the state legislative constituency level, the SHRUG compiles data originating from the Trivedi
Center for Political Data on candidates in Indian state legislative assembly elections from 1974 to
2018. The data includes wins, losses, and election vote share. Also disaggregated to the legislative
constituency level is a measure of economic growth indicated by the presence of light detected at
night – a relationship that I describe in a later section. This luminosity data, recorded through high
resolution images taken nightly by NASA satellites between 8:30pm and 10:00pm local time, is
available annually for the years 1994 to 2013. The SHRUG can therefore be used to compare local
political and economic trends for the past 44 years. An advantage of the SHRUG is that it tracks
consistent spatial units even if states and constituencies have merged or fractured. Moreover, the
availability of novel and highly accurate luminosity data in the SHRUG allows for a more
comprehensive analysis than otherwise available through traditional markers of economic growth
such as GDP.
Classifying Religion
In order to infer the likely religion of each legislative assembly election candidate, I used a name-
based religion prediction algorithm developed by Chaturvedi and Chaturvedi (2020). The algorithm
uses machine learning and character-based linguistic differences to predict the likelihood that a name
is Muslim. Similar techniques have been used to predict demographic characteristics such as gender
and ethnicity (Wood-Doughty et al., 2018). Such predictions for India are enabled by the fact that
Islamic names have heavy influence from Arabic, whereas non-Islamic Indian names are most often
derived from Sanskrit. The program evaluates linguistic patterns and character usage frequency
between the names – for example, the characters “P”, “V”, and “X” are highly relevant to non-
Muslims, whereas “F”, “Q”, and “Z” are most common in Muslim names. The model is trained on
data from India’s Rural Economic & Demographic Survey as well as a set of household names from
the state of Uttar Pradesh and has 100% classification coverage.
The authors of Chaturvedi and Chaturvedi (2020) generously provided religion likelihood
estimates using their single-name support vector machine (SVM) classification model. The model
receives a candidate “single name” input rather than both the candidate’s and another family
member’s name for additional validation. For Muslim names, the single-name SVM model had a
precision (true positive rate) of over 90% for both testing datasets. It had a recall (positive detection
rate) of over 81%. The precision level of this model is higher than that of a more complex neural
model tested by the authors as well as a dictionary-based model relying on a pre-classified list of
names. The output shows a decision function score in which observations with a score greater than 0
are classified as Muslim, and observations with a score less than 0 are classified as non-Muslim. In
my dataset, all names were either Muslim or Hindu. However, it is possible Buddhist, Christian, Jain,
or Sikh names were incorrectly classified as Hindu – the shared roots of these names being the source
of most of the model’s incorrect predictions. Therefore, in my analysis, I identify all names as either
Muslim or non-Muslim.
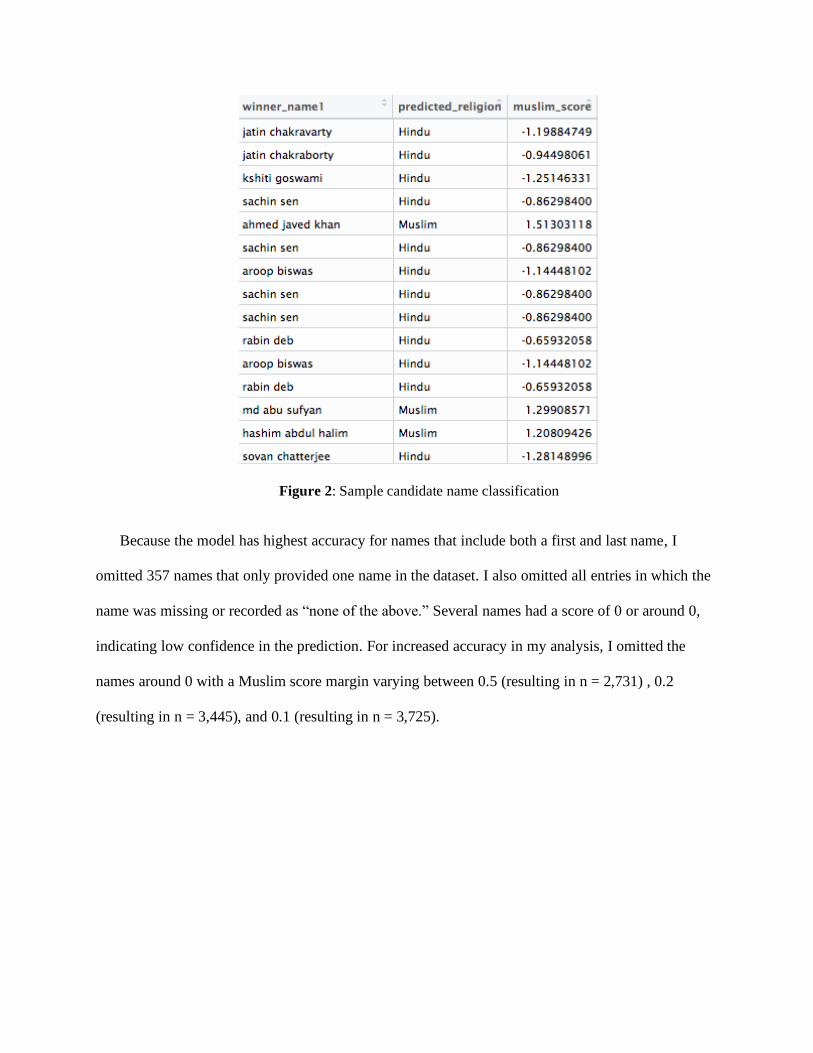
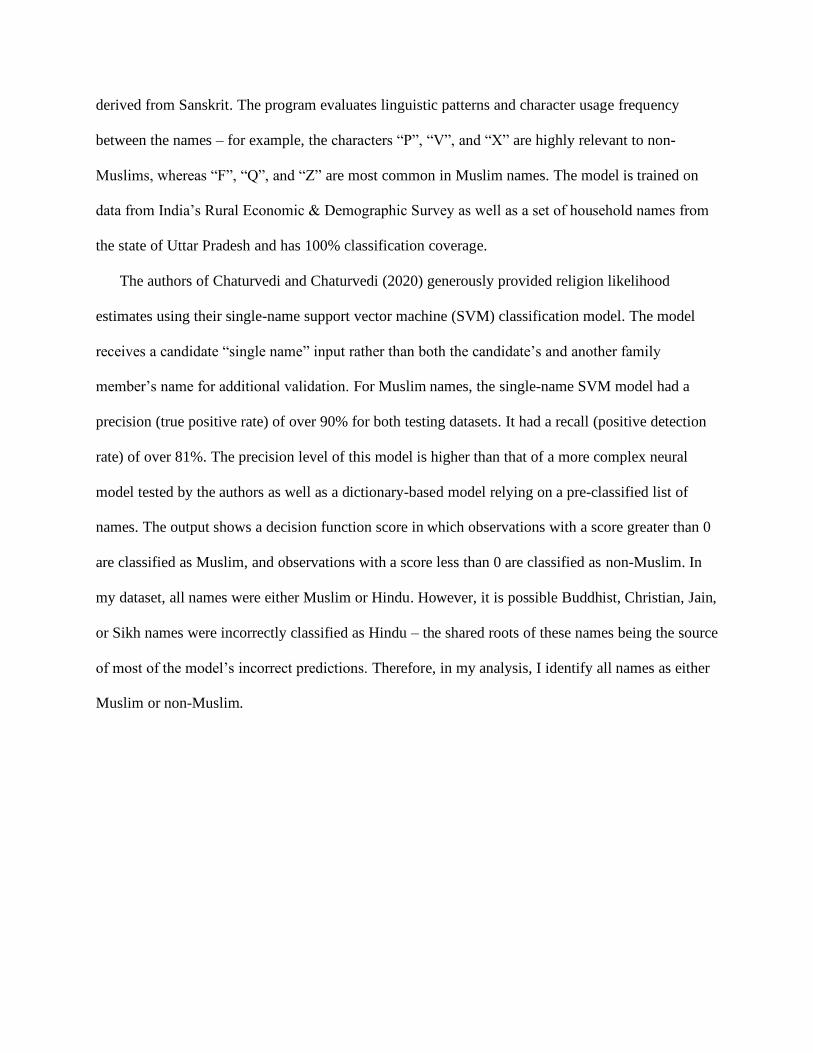
Figure 2: Sample candidate name classification
Because the model has highest accuracy for names that include both a first and last name, I
omitted 357 names that only provided one name in the dataset. I also omitted all entries in which the
name was missing or recorded as “none of the above.” Several names had a score of 0 or around 0,
indicating low confidence in the prediction. For increased accuracy in my analysis, I omitted the
names around 0 with a Muslim score margin varying between 0.5 (resulting in n = 2,731) , 0.2
(resulting in n = 3,445), and 0.1 (resulting in n = 3,725).
Figure 3: Density plot of religion prediction output
Luminosity and Economic Growth
Night light remote sensing data is highly correlated with national and subnational measures of
economic output, including GDP and GRP (Doll et al., 2006). It measures artificial light, primarily
due to electrical use, generated by businesses and human settlements that is visible from open sky.
Luminosity at night is an increasingly desirable way to measure economic growth due to its ease of
availability, high levels of disaggregation, and its inclusion of informal sector activity. It is most
beneficial in countries like India with low-quality statistical systems but adds little value in countries
where reliable data is already available (Chen & Nordhaus, 2011). Within India as well as other
developing countries, the availability of luminosity data is advantageous because of the lack of
spatially disaggregated data at the administrative level. Moreover, there are often significant time
lags between data collection and when such administrative data is made publicly available, and
reporting and weighting inaccuracies make socioeconomic indicators even more difficult to
accurately track (Singhal et al., 2020). Night lights also account for activity from the shadow
economy. Administrative calculations of economic activity are often underestimated because of the
magnitude of the informal sector, which does not report transactions in a systematized manner. Using
satellite data therefore bypasses attempts to subvert inclusion in official estimates of GDP. Due to its
time insensitivity and general inaccuracy, particularly in the developing world, an alternative to
standard population and economic measures is needed.
Because of its novelty as a proxy for economic activity, luminosity data is not perfectly
understood. It is also not perfectly accurate. For example, while night light data captures emissions
from open spaces, it is limited in its ability to capture emissions from buildings, which are often
places of high productivity. Moreover, seasonal and annual variation in night light data requires
further research (Singhal et al., 2020). Luminosity is also top coded at a maximum value and suffers
from inaccuracies due to “overglow,” which occurs when recorded light spills over to neighboring
pixels (Doll et al., 2006). The accuracy of night light data as a proxy varies by sector and region – for
example, approximations tend to be overestimated in urban areas and underestimated in rural areas
(Mellander et al., 2015). Some studies have found that luminosity serves as a better proxy for
population density than local economic activity for developed countries (Mellander et al., 2015).
Despite these limitations, luminosity remains a robust and popular benchmark of economic
growth when standard indicators are not widely available. At the legislative constituency level in
India, it is difficult to find data that is geographically disaggregated enough to identify direct effects
on constituencies. Identifying data reported on an annual basis presents a similar challenge. Using
luminosity overcomes these challenges of completeness.
V. Methodology
A standard approach to this question would use regression analysis to measure the impact of the
MLA member’s religion on economic output. However, this approach is confounded by the fact that
the election of a Muslim candidate to state legislature is not random. For example, states that elect
Muslim MLAs may be predisposed to doing so because of other factors. Muslims may also be more
likely to run or win in certain constituencies than others.
To overcome the potential bias resulting from this challenge and identify a causal effect, I use a
regression discontinuity (RD) design exploiting narrow electoral victories to estimate the effect of
electing politicians of different faith groups on economic activity. In this design, it is assumed that
constituencies in which Muslim candidates win by a narrow margin are comparable to constituencies
in which runner-up candidates lose by a narrow margin (Imbens & Lemieux, 2008; Lee & Lemieux,
2010). Because the race is so close that it could have resulted in favor of either candidate, the actual
outcome of the election is effectively random. The outcome of the election can then be attributed to
chance. On average, then, the only systematic difference between these two types of candidates
should be religion.
I calculated the percentage point difference between the vote shares of the first and second place
candidates to find the margin of win. The variable muslim_margin is greater than 0 when a Muslim
candidate won the election (n=2,044), and muslim_margin is less than 0 when the Muslim candidate
lost (n=2,411). I measure the resulting difference in economic output between Muslim-represented
states and non-Muslim represented states. This approach has precedent in several studies involving
elections, including studies in India and studies assessing the impacts of Islamic rule (Pettersson-
Lidbom, 2008; Eggers et al, 2015; Myersson, 2014; Bhalotra et al., 2014). I model my design closely
after Prakash et al. (2019), who show using an RD design that electing criminally accused politicians
in India significantly reduces economic output.
An important assumption of the RD model rests on the continuity of the forcing variable at the
point of discontinuity (Lee & Lemieux, 2010). In this case, I show that neither Muslim nor non-
Muslim politicians are more likely to win a close election. This ensures that the election results are
not being manipulated by nefarious actors. The figure below shows the distribution of the forcing
variable, the margin by which a Muslim candidate wins or loses, as close to symmetrical, with

candidates being approximately equally likely to win as they are to lose in close elections. It also
shows the prevalence of elections with close margins as contained in the dataset.
Figure 4: Plot showing continuity of the forcing variable across the threshold
The main specification is a sharp RD design taking the following form:
𝑑𝑙𝑜𝑔(𝐿𝑢𝑚𝑖𝑛𝑜𝑠𝑖𝑡𝑦)𝑐 = 𝛽0 + 𝛽1𝑀𝑢𝑠𝑙𝑖𝑚𝑀𝐿𝐴𝑐 + 𝑓(𝑀𝑢𝑠𝑙𝑖𝑚𝑀𝑎𝑟𝑔𝑖𝑛; 𝜃) + 𝜀𝑐
The outcome of interest is the change in log luminosity of constituency c from the beginning
of the MLA’s term to the end of the MLA’s term. Because legislative assembly members serve a 5-
year term, I calculated the change in log luminosity from the election year to 5 years after the
election. This value was available only for elections from 1994 to 2008. By design, this calculation
controls for constituency-level fixed effects. The independent variable MuslimMLA is a binary
variable equal to 1 if the MLA member is Muslim. MuslimMargin refers to the margin of victory.
Standard errors are clustered at the constituency level. I perform local linear regressions to either side
of the threshold using a triangular kernel, as recommended by Lee and Lemieux (2010). The choice
of bandwidth for margin of win is somewhat arbitrary and varies across literature on elections,
though Bhalotra et al. (2014) use a 2% margin and evaluate 3% in robustness checks.
To contrast the causal RD design with another approach, I also perform a regression with the
same dependent variable but with fixed effects for year of election and state. This allows me to
control for a greater locale than the legislative constituency.
VI. Results
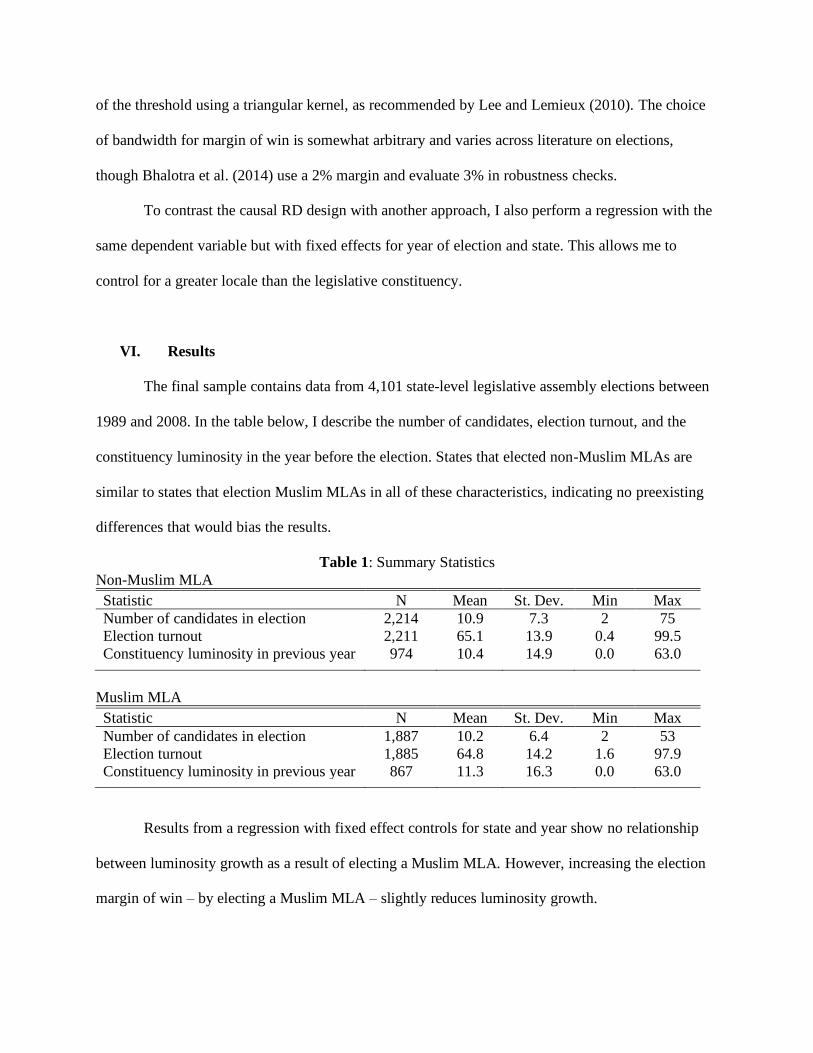
The final sample contains data from 4,101 state-level legislative assembly elections between
1989 and 2008. In the table below, I describe the number of candidates, election turnout, and the
constituency luminosity in the year before the election. States that elected non-Muslim MLAs are
similar to states that election Muslim MLAs in all of these characteristics, indicating no preexisting
differences that would bias the results.
Table 1: Summary Statistics
Non-Muslim MLA
Statistic N Mean St. Dev. Min Max
Number of candidates in election 2,214 10.9 7.3 2 75
Election turnout 2,211 65.1 13.9 0.4 99.5
Constituency luminosity in previous year 974 10.4 14.9 0.0 63.0
Muslim MLA
Statistic N Mean St. Dev. Min Max
Number of candidates in election 1,887 10.2 6.4 2 53
Election turnout 1,885 64.8 14.2 1.6 97.9
Constituency luminosity in previous year 867 11.3 16.3 0.0 63.0
Results from a regression with fixed effect controls for state and year show no relationship
between luminosity growth as a result of electing a Muslim MLA. However, increasing the election
margin of win – by electing a Muslim MLA – slightly reduces luminosity growth.
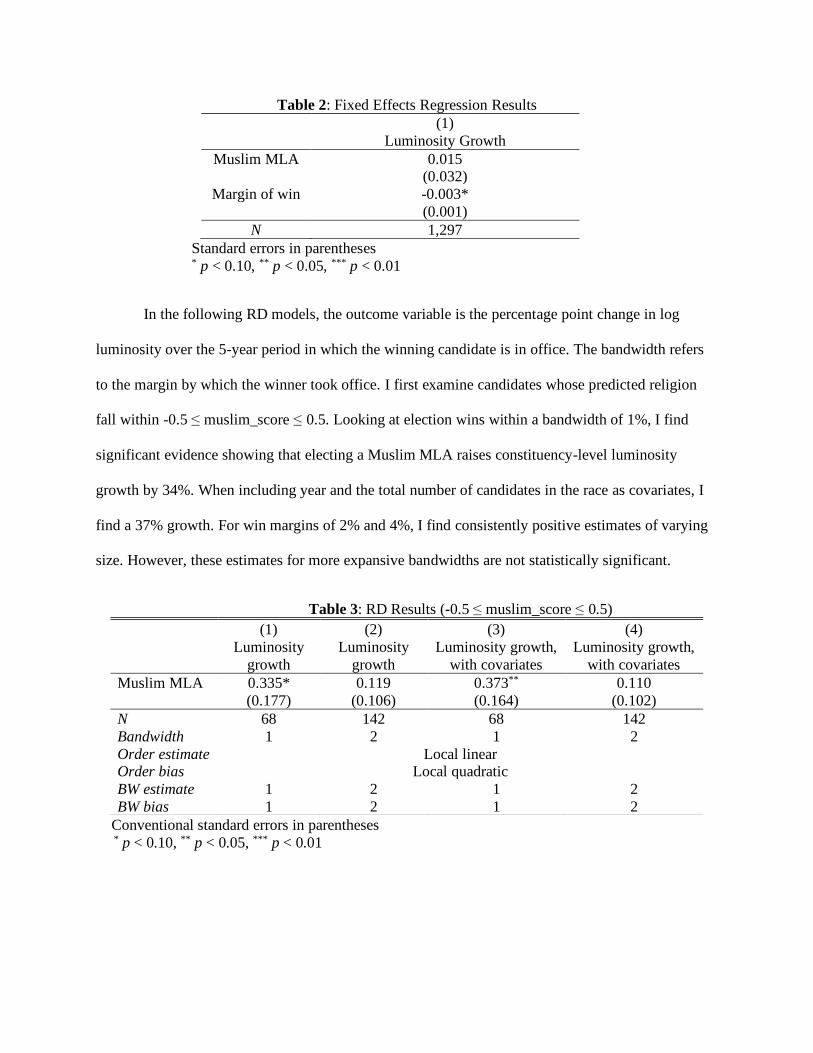
Table 2: Fixed Effects Regression Results
(1)
Luminosity Growth
Muslim MLA 0.015 (0.032)
Margin of win -0.003*
(0.001)
N 1,297
Standard errors in parentheses * p < 0.10, ** p < 0.05, *** p < 0.01
In the following RD models, the outcome variable is the percentage point change in log
luminosity over the 5-year period in which the winning candidate is in office. The bandwidth refers
to the margin by which the winner took office. I first examine candidates whose predicted religion
fall within -0.5 ≤ muslim_score ≤ 0.5. Looking at election wins within a bandwidth of 1%, I find
significant evidence showing that electing a Muslim MLA raises constituency-level luminosity
growth by 34%. When including year and the total number of candidates in the race as covariates, I
find a 37% growth. For win margins of 2% and 4%, I find consistently positive estimates of varying
size. However, these estimates for more expansive bandwidths are not statistically significant.
Conventional standard errors in parentheses * p < 0.10, ** p < 0.05, *** p < 0.01
Table 3: RD Results (-0.5 ≤ muslim_score ≤ 0.5)
(1)
Luminosity
growth
(2)
Luminosity
growth
(3)
Luminosity growth,
with covariates
(4)
Luminosity growth,
with covariates
Muslim MLA 0.335* 0.119 0.373** 0.110
(0.177) (0.106) (0.164) (0.102)
N 68 142 68 142
Bandwidth 1 2 1 2
Order estimate Local linear Order bias Local quadratic
BW estimate
BW bias
1
1
2
2
1
1
2
2
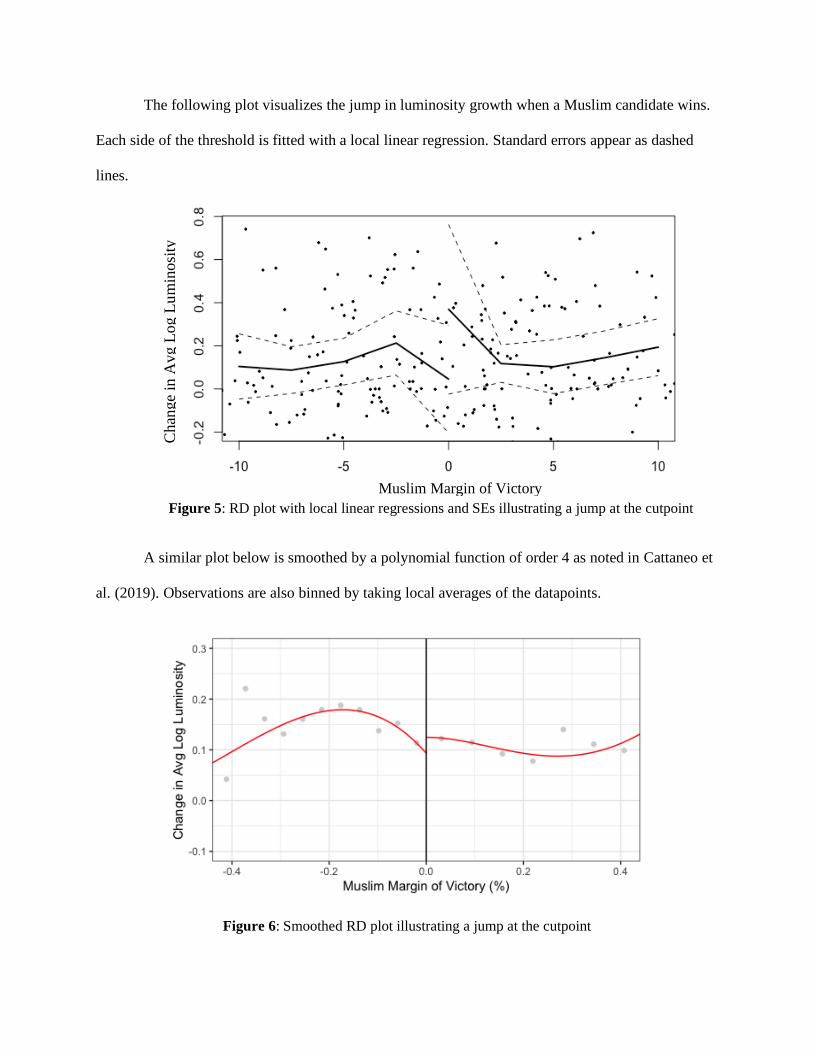
The following plot visualizes the jump in luminosity growth when a Muslim candidate wins.
Each side of the threshold is fitted with a local linear regression. Standard errors appear as dashed
lines.
Figure 5: RD plot with local linear regressions and SEs illustrating a jump at the cutpoint
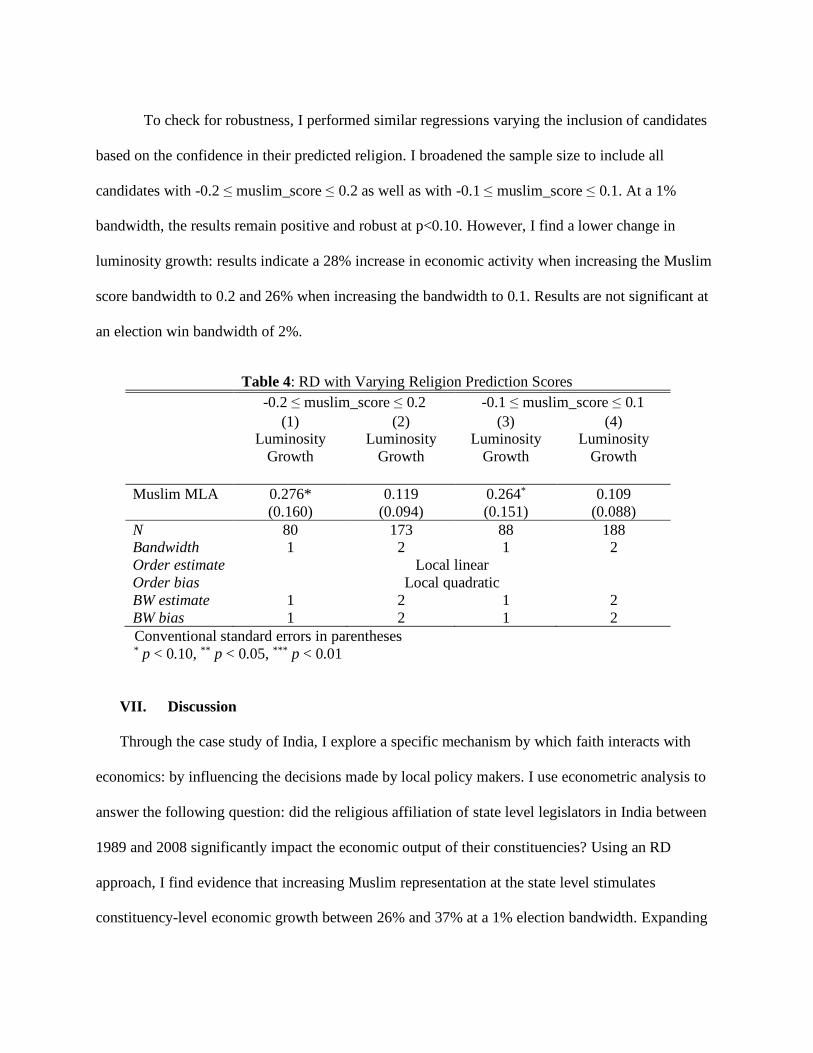
A similar plot below is smoothed by a polynomial function of order 4 as noted in Cattaneo et
al. (2019). Observations are also binned by taking local averages of the datapoints.
Figure 6: Smoothed RD plot illustrating a jump at the cutpoint
Muslim Margin of Victory
Chan
ge
in A
vg L
og L
um
inosi
ty
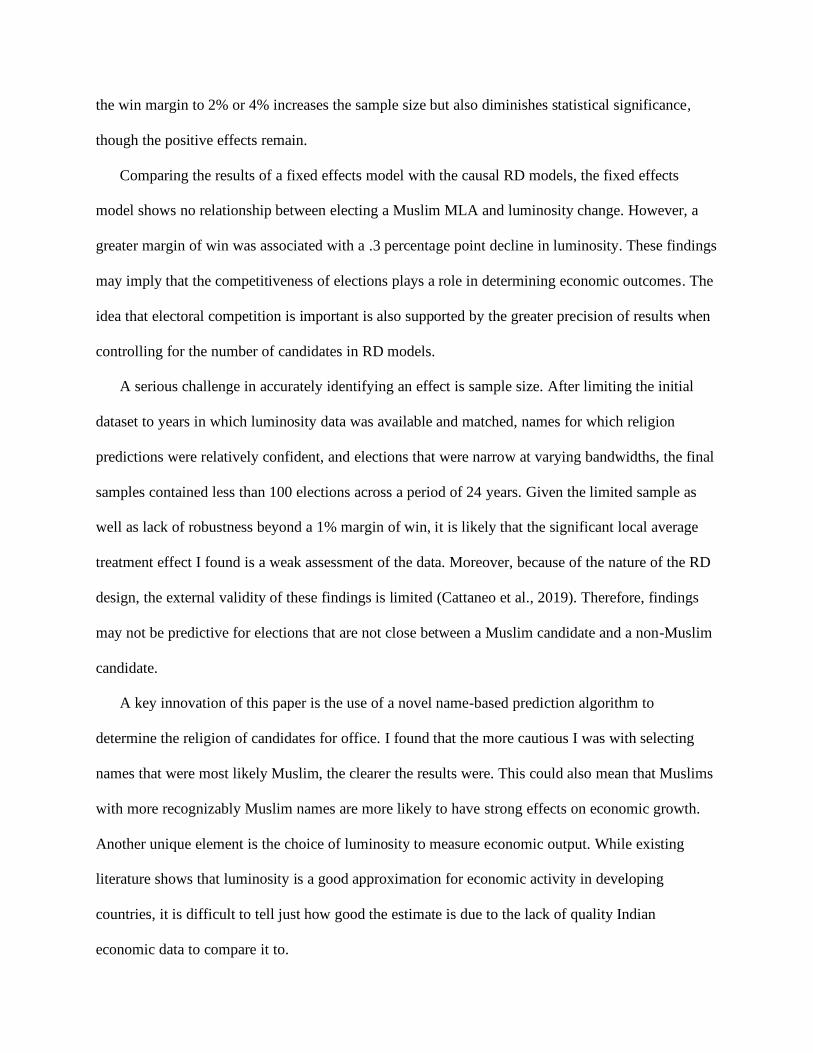
To check for robustness, I performed similar regressions varying the inclusion of candidates
based on the confidence in their predicted religion. I broadened the sample size to include all
candidates with -0.2 ≤ muslim_score ≤ 0.2 as well as with -0.1 ≤ muslim_score ≤ 0.1. At a 1%
bandwidth, the results remain positive and robust at p<0.10. However, I find a lower change in
luminosity growth: results indicate a 28% increase in economic activity when increasing the Muslim
score bandwidth to 0.2 and 26% when increasing the bandwidth to 0.1. Results are not significant at
an election win bandwidth of 2%.
Table 4: RD with Varying Religion Prediction Scores
-0.2 ≤ muslim_score ≤ 0.2 -0.1 ≤ muslim_score ≤ 0.1
(1) Luminosity
Growth
(2) Luminosity
Growth
(3) Luminosity
Growth
(4) Luminosity
Growth
Muslim MLA 0.276* 0.119 0.264* 0.109
(0.160) (0.094) (0.151) (0.088)
N 80 173 88 188 Bandwidth 1 2 1 2
Order estimate Local linear
Order bias Local quadratic
BW estimate
BW bias
1
1
2
2
1
1
2
2
Conventional standard errors in parentheses * p < 0.10, ** p < 0.05, *** p < 0.01
VII. Discussion
Through the case study of India, I explore a specific mechanism by which faith interacts with
economics: by influencing the decisions made by local policy makers. I use econometric analysis to
answer the following question: did the religious affiliation of state level legislators in India between
1989 and 2008 significantly impact the economic output of their constituencies? Using an RD
approach, I find evidence that increasing Muslim representation at the state level stimulates
constituency-level economic growth between 26% and 37% at a 1% election bandwidth. Expanding
the win margin to 2% or 4% increases the sample size but also diminishes statistical significance,
though the positive effects remain.
Comparing the results of a fixed effects model with the causal RD models, the fixed effects
model shows no relationship between electing a Muslim MLA and luminosity change. However, a
greater margin of win was associated with a .3 percentage point decline in luminosity. These findings
may imply that the competitiveness of elections plays a role in determining economic outcomes. The
idea that electoral competition is important is also supported by the greater precision of results when
controlling for the number of candidates in RD models.
A serious challenge in accurately identifying an effect is sample size. After limiting the initial
dataset to years in which luminosity data was available and matched, names for which religion
predictions were relatively confident, and elections that were narrow at varying bandwidths, the final
samples contained less than 100 elections across a period of 24 years. Given the limited sample as
well as lack of robustness beyond a 1% margin of win, it is likely that the significant local average
treatment effect I found is a weak assessment of the data. Moreover, because of the nature of the RD
design, the external validity of these findings is limited (Cattaneo et al., 2019). Therefore, findings
may not be predictive for elections that are not close between a Muslim candidate and a non-Muslim
candidate.
A key innovation of this paper is the use of a novel name-based prediction algorithm to
determine the religion of candidates for office. I found that the more cautious I was with selecting
names that were most likely Muslim, the clearer the results were. This could also mean that Muslims
with more recognizably Muslim names are more likely to have strong effects on economic growth.
Another unique element is the choice of luminosity to measure economic output. While existing
literature shows that luminosity is a good approximation for economic activity in developing
countries, it is difficult to tell just how good the estimate is due to the lack of quality Indian
economic data to compare it to.

It is also difficult to tell how much of the positive effects shown here can be attributed to the
benefits of minority group representation versus unobservable effects associated with being
outwardly Muslim. However, the knowledge that representation of Muslims has positive effects on
subnational economic activity may serve as an incentive for the nation to increase affirmative action
opportunities for Muslims; if not for the purpose of representation in itself, then for the purpose of
stimulating economic growth.
Several areas for extension remain from this work. One alternative method of identifying
causality is to incorporate a differences-in-differences model using a Muslim MLA as the treatment.
Moreover, in order to fully answer the question of minority representation effects, the level of
concentration of the positive effects in Muslim populations should be studied with the aid of religion
data disaggregated to the level of legislative constituency. Extensions along these lines could have
implications for further studies of the mechanisms underlying the individual practice of Islam as well
as the influence of religion on socioeconomic outcomes.
References
Asher, S., Lunt, T., Matsuura, R., & Novosad, P. (2019). The Socioeconomic High-resolution Rural-
Urban Geographic Dataset on India (SHRUG).
Asher, S., Novosad, P., & Rafkin, C. (2020). Intergenerational Mobility in India: New Methods and
Estimates Across Time, Space, and Communities.
Becker, S. O., Rubin, J., & Woessmann, L. (2020). Religion in economic history: A survey.
Bhalotra, S., Clots-Figueras, I., Cassan, G., & Iyer, L. (2014). Religion, politician identity and
development outcomes: Evidence from India. Journal of Economic Behavior &
Organization, 104, 4-17.
Bhavnani, R. R., & Lee, A. (2021). Does affirmative action worsen bureaucratic performance?
evidence from the Indian administrative service. American Journal of Political Science,
65(1), 5-20.
Brollo, F., & Troiano, U. (2016). What happens when a woman wins an election? Evidence from
close races in Brazil. Journal of Development Economics, 122, 28-45.
Cattaneo, M. D., Idrobo, N., & Titiunik, R. (2019). A practical introduction to regression
discontinuity designs: Foundations. Cambridge University Press.
Chaturvedi, R., & Chaturvedi, S. (2020). It's All in the Name: A Character Based Approach To Infer
Religion. arXiv preprint arXiv:2010.14479.
Chen, D. L., & Hungerman, D. M. (2014). Economics, religion, and culture: A brief introduction.
Journal of Economic Behavior and Organization, 104(1-3).
Chen, X., & Nordhaus, W. D. (2011). Using luminosity data as a proxy for economic statistics.
Proceedings of the National Academy of Sciences, 108(21), 8589-8594.
Doll, C. N., Muller, J. P., & Morley, J. G. (2006). Mapping regional economic activity from night-
time light satellite imagery. Ecological Economics, 57(1), 75-92.
Eggers, A. C., Fowler, A., Hainmueller, J., Hall, A. B., & Snyder Jr, J. M. (2015). On the validity of
the regression discontinuity design for estimating electoral effects: New evidence from over
40,000 close races. American Journal of Political Science, 59(1), 259-274.
Ghouse, M. Political Dis-Empowerment of Muslims in India: Role of the State. Journal of Polity, 51.
Imbens, G. W., & Lemieux, T. (2008). Regression discontinuity designs: A guide to practice. Journal
of Econometrics, 142(2), 615-635.
Kuran, T. (2011). The Long Divergence: How Islamic Law Held Back the Middle East. Princeton;
Oxford: Princeton University Press.
Lee, D. S., & Lemieux, T. (2010). Regression discontinuity designs in economics. Journal of
Economic Literature, 48(2), 281-355.
McCleary, R. M., & Barro, R. J. (2006). Religion and economy. Journal of Economic Perspectives,
20(2), 49-72.
McCleary, R., & Barro, R. (2019). The Wealth of Religions: The Political Economy of Believing and
Belonging. Princeton; Oxford: Princeton University Press. doi:10.2307/j.ctvc775c4
Mellander, C., Lobo, J., Stolarick, K., & Matheson, Z. (2015). Night-time light data: A good proxy
measure for economic activity?. PloS one, 10(10), e0139779.
Meyersson, E. (2014). Islamic Rule and the Empowerment of the Poor and Pious. Econometrica,
82(1), 229-269.
Mitra, A., & Ray, D. (2019). Hindu-Muslim Violence in India: A Postscript from the Twenty-First
Century. In Advances in the Economics of Religion (pp. 229-248). Palgrave Macmillan,
Cham.
Pettersson-Lidbom, P. (2008). Do parties matter for economic outcomes? A regression-discontinuity
approach. Journal of the European Economic Association, 6(5), 1037-1056.
Prakash, N., Rockmore, M., & Uppal, Y. (2019). Do criminally accused politicians affect economic
outcomes? Evidence from India. Journal of Development Economics, 141, 102370.
Sachar, R. (2006). Social, Economic and Educational Status of the Muslim Community of India.
Government of India.
Singhal A, Sahu S, Chattopadhyay S, Mukherjee A, Bhanja SN (2020). Using night time lights to
find regional inequality in India and its relationship with economic development. PloS one
15(11): e0241907.
Wood-Doughty, Z., Andrews, N., Marvin, R., & Dredze, M. (2018). Predicting Twitter user
demographics from names alone. Proceedings of the Second Workshop on Computational
Modeling of People’s Opinions, Personality, and Emotions in Social Media, 105-111.