Embed Size (px)
Citation preview

REMEDIATION WORK PLAN
The Butler Company 325 South Broadway Street
Butler, DeKalb County, Indiana 46721 BFD #4170705
July 2020
Prepared for:
City of Butler 215 South Broadway Street
Butler, Indiana 46721
Indiana Brownfields Program Indiana Finance Authority
100 North Senate Avenue, Room 1275 Indianapolis, Indiana 46204

Remediation Work Plan BFD #4170705
Page i
ENVIRONMENTAL PROFESSIONAL STATEMENT
I certify, under penalty of law, that this document and all appendices and attachments as applicable were prepared under my direction or supervision in accordance with a system designed to assure that qualified personnel properly gathered and evaluated the information submitted. Based on my inquiry of the person or persons who manage the system or those persons directly responsible for gathering the information, the information submitted is, to the best of my knowledge and belief, true, accurate, and complete. I declare that, to the best of my professional knowledge and belief, I meet the definition of Environmental Professional as defined in §312.10 of 40 CFR 312. I have the specific qualifications based on education, training, and experience. ________________________ Glen A Howard, CHMM Senior Project Manager SES Fort Wayne, IN

Remediation Work Plan BFD #4170705
Page ii
EXECUTIVE SUMMARY
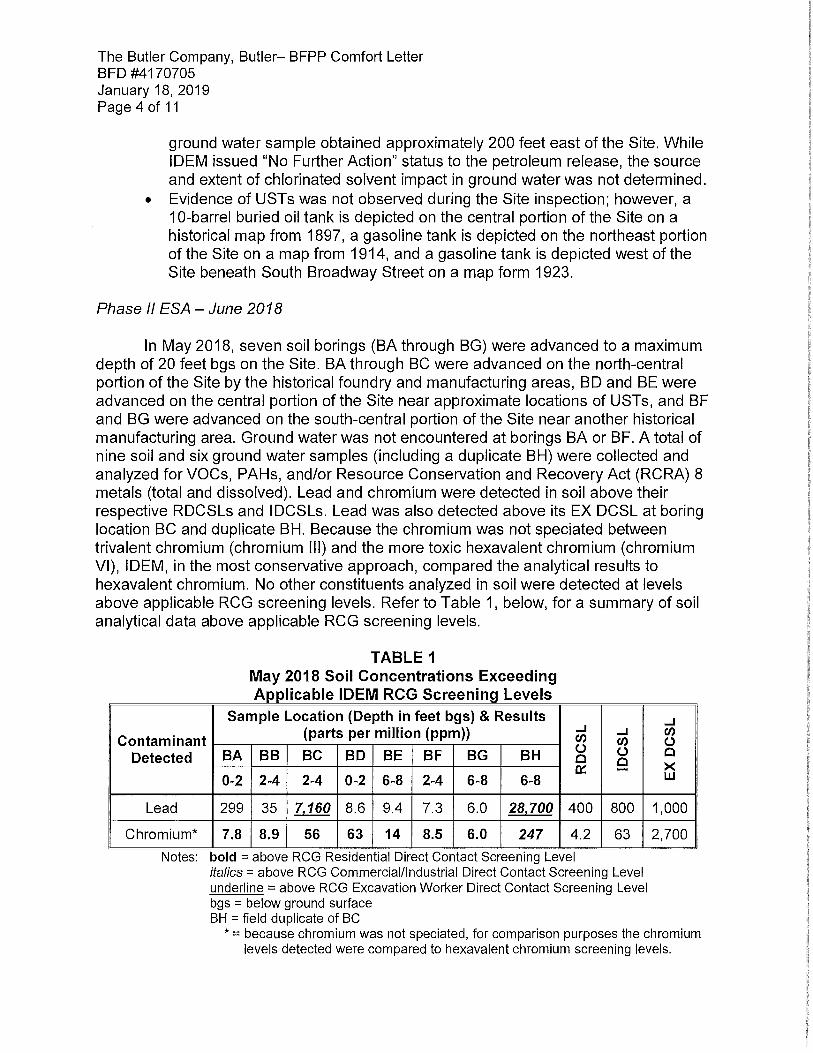
This document serves as a remediation work plan (RWP) for addressing contaminants at the former The Butler Company property located at 325 South Broadway Street, Butler, DeKalb County, Indiana 46721 (hereinafter collectively referred to as the site). This RWP was prepared on behalf of the City of Butler, the Indiana Brownfields Program (IBP) and Indiana Finance Authority (IFA). The City of Butler (City) will utilize brownfield funding (i.e., grant) from the U.S. EPA Region 5 and the Indiana Finance Authority (IFA) to conduct remediation of hazardous substances (lead contaminated soils) at the subject property, as well as asbestos abatement and chemical container removal and disposal. Cleanup will help revitalize approximately 3.5 acres of blighted property in downtown Butler, Indiana. The City intends to redevelop the property for commercial use. Background Information The site consists of a 3.55-acre property located at the northeast corner of South Broadway Street and East Willow Street, on the south side of the City of Butler, Indiana central business district. Railroad tracks border the site to the north, South Broadway Street is located to the west, and East Willow Street is located to the south. The area surrounding the site includes commercial businesses and residences. The central and west portions are covered with concrete and brick debris associated with former building structures. Two buildings remain partially intact on the north and east portions. Remaining areas are covered with grass, trees, and scrub vegetation. Foundry slag was observed on the north-central and northeast portions of the site in the vicinity of a former foundry building. Piles of building debris covered the central and west portions of the site. The piles generally consist of brick, concrete, scrap wood and metal, wood pallets, and roof materials. Site observations also included a riveted steel exhaust stack on the central portion, 55-gallon drums, burn barrels, and plastic tote containers, and various small containers (<10 gallons) of chemicals. Historical review indicates the site was first developed by The Butler Manufacturing Company in 1888. The property was sold in 1894 and was renamed “The Butler Company.” Expansions and reconfigurations occurred throughout the 1890’s as windmills, bicycles, buggies and mail wagons were manufactured on-site. An additional factory was built in 1906. A new foundry was built in 1918. Oil-bath style windmills were then constructed on-site. By the 1930s, The Butler Company site included a machine shop, foundry, paint shop, pipe shed, lumber shed, tin shop and storage building. A major fire destroyed the three-story storage building on the southwest portion of the site in 1958. The site was then used as a distributor of plumbing, heating, and cooling parts. The building closest to the railroad tracks to the north of the property was used by the Carbola Chemical Company in approximately the late 1950’s and early 1960’s. The Butler Company continued as a jobber of electrical, plumbing, heating, cooling, and well drilling supplies until the facility was closed in 1997. The site was acquired by FSPI 401K Employee Profit Sharing Plan at a tax sale in 2012. A massive fire destroyed the site buildings on March 26, 2015. The City of Butler acquired the site via a tax sale in January 2020. Environmental site assessments were conducted at the site between October 2017 and June 2019 and included Phase I and Phase II Environmental Site Assessments (ESAs). Phase I ESAs identified historical manufacturing operations and use of hazardous substances and petroleum products as a recognized environmental condition (REC). Other RECs included potential chlorinated solvent groundwater impact from an off-site source and oil tanks identified on historical maps/documents. Phase II ESA screening investigations have included soil, groundwater, and vapor investigation, geophysical survey, asbestos and lead based paint surveys, and a chemical inventory of petroleum and/or hazardous substances remaining on site. Soil, groundwater, and vapor investigation consisted of advancing 30 soil borings throughout the site. Samples of surface fill material, native clay soil, perched water, and groundwater were collected and analyzed for VOCs, PAHs, RCRA 8 metals, copper, and zinc as a screening for contaminants of concern. Soil vapor was analyzed

Remediation Work Plan BFD #4170705
Page iii
for VOCs only. Investigation results indicate impact is limited to arsenic and lead within the fill material (0-4 feet) at concentrations exceeding industrial direct contact levels. A geophysical survey was conducted to identify potential tanks or other subsurface structures. It should be noted; significant debris and metal objects on the ground throughout the facility limited the effectiveness of the survey. USTs were not identified during the survey. Several remnant subsurface utilities were identified including water and natural gas. A storm sewer catch basin was also located. Asbestos and lead-based paint surveys were conducted on building materials within the debris piles, as well as accessible standing buildings. Asbestos containing materials (ACMs) were identified in the East Central Building debris pile and the North Building. ACMs included transite panels and tar roofing materials. The lead-based paint survey was conducted using an XRF field meter to determine the presence of lead on building materials. If present, a physical sample was collected for laboratory analysis. One sample of red paint from the door and door frame in the East Building exhibited a 1.8% by weight results (18,000 ppm). A chemical inventory of petroleum and/or hazardous substances remaining on site was completed. Totes, drums, small containers (<10 gallons) of paints, dyes, and water filtration chemicals were identified during the inventory. Constituents of Concern (COCs) Investigation results indicate constituents of concern are limited to arsenic and lead in soil/fill; however, asbestos containing materials in the East Central Building debris pile and the North Building are identified as concerns, as well as the containerized chemicals and lead-based paint. Focus COC Area Soil barrier installation is proposed, and soil barrier installation is proposed at three areas where previous investigation results indicate lead and/or arsenic concentrations exceed industrial direct contact screening levels. The areas are also depicted on Figure 2 and soil barrier construction has been selected to isolate the following three areas.
Area 1) Lead contamination at southwest portion of site at sampling locations BC-GP-3- SS1 (1-2) and BC-GP3-S10 (1-2).
Area 2) Arsenic contamination at east central portion of site at sampling locations BC-GP7-SS1 (1-2), BC-GP-8-SS1 (2-3) and BC-GP14-SS1 (0.5-1.5).
Area 3) Arsenic and lead contamination at northeast portion of site at sampling locations BC, BC-GP16-E10 (1-2), and BC-GP-16-W5 (1-2).
Potential Exposure Assessment Constituents of concern have been documented in near surface soils/fill at levels that pose an exposure risk for visitors, trespassers, and/or transient site workers and maintenance personnel. Ingestion or inhalation of wind-blown dust particles and surface runoff/erosion/soil washing migration to offsite areas and/or storm sewers are also identified as potential concerns. A Freshwater Forested/Shrub Wetland extends onto the northeast portion of the site and this area may be a potentially susceptible ecological area and habitat for animal species. Inhalation of asbestos is another potential exposure pathway and chemical containers and lead-based paint should be removed/disposal to eliminate exposure hazards. Future Land Use The site is currently characterized as a fire-damaged property. The City of Butler intends to redevelop the property for commercial use.

Remediation Work Plan BFD #4170705
Page iv
Proposed Remedial Approach Based on the identified contaminants and concentrations, as well as inferred distribution of constituents of concern and the potential exposure risk to human health and the environment, soil barrier installation is proposed, and soil barrier installation is proposed at three areas where previous investigation results indicate lead and/or arsenic concentrations exceed industrial direct contact screening levels. Site work will also include the removal and offsite disposal of fire damaged debris/structures by City personnel with hazardous materials awareness training, the disposal of red colored lead-based paint during demolition under the supervision of SES, the removal/disposal of asbestos by a licensed abatement contractor, and the removal/disposal of chemical containers under the supervision of a CHMM. Groundwater monitoring is also proposed to confirm contaminants in soil have not leached to groundwater. Finally, a risk-based environmental remedy is anticipated to address any residual contaminants in soil/fill pursuant to the BFF Comfort Letter and Environmental Restrictive Covenant (ERC) issued in IBP correspondence dated January 18, 2019. SES anticipates IBP will prepare a revised ERC following implementation and completion of this RWP. Schedule Regulatory approval of this RWP is requested to initiate remediation of this site. RWP implementation is estimated to require at least 14 months.

Remediation Work Plan BFD #4170705
Page v
TABLE OF CONTENTS 1.0 INTRODUCTION ................................................................................................................................................ 1 1.1 Project Identification ....................................................................................................................................... 1 1.2 Overview of COC Distribution and Cleanup Approach .................................................................................... 1 2.0 GENERAL BACKGROUND INFORMATION ............................................................................................................. 2 2.1 Site Location and Setting ................................................................................................................................. 2 2.2 Surrounding Population and Land Use ............................................................................................................ 3 2.3 Site and Site History ........................................................................................................................................ 3 2.4 Surface Waters ................................................................................................................................................ 3 2.5 Regional and Local Topography ...................................................................................................................... 4 2.6 Subsurface Structures ..................................................................................................................................... 4 2.7 Geology and Hydrogeology. ............................................................................................................................ 4 2.7.1 Regional ............................................................................................................................................ 4 2.7.2 Site .................................................................................................................................................... 5 2.8 Location and Usage of Water Wells. ............................................................................................................... 5
2.9 Future Land Use .............................................................................................................................................. 5 2.10 Susceptible Area Evaluation ............................................................................................................................ 6 2.11 Constituents of Concern ................................................................................................................................. 6 2.12 Potential Exposure Evaluation ........................................................................................................................ 7
3.0 PREVIOUS INVESTIGATIONS................................................................................................................................ 7 3.1 Phase I Environmental Site Assessment – November 2017 ............................................................................ 7 3.2 Screening Investigation – June 2018 ............................................................................................................... 8 3.3 Phase I Environmental Site Assessment – October 2018 ................................................................................ 9 3.4 Analysis of Brownfield Cleanup Alternatives .................................................................................................. 9 3.5 Comfort Letter .......................................................................................................................................... 10 3.6 IWM, Phase II Assessment – July 2019 .......................................................................................................... 10 3.7 Field Activity Report – June 2020 .................................................................................................................. 12 3.8 Contemplated Redevelopment and Cost Estimates ..................................................................................... 14 4.0 REMEDIATION APPROACH AND RATIONALE ..................................................................................................... 14 4.1 Source and Nature of COCs ........................................................................................................................... 14 4.2 Distribution .......................................................................................................................................... 16 4.3 Baseline Ecological Assessment .................................................................................................................... 18 4.4 Identification and Evaluation of Potential Human Receptors ....................................................................... 18 4.5 Soil Barrier .......................................................................................................................................... 19 4.6 Groundwater Monitoring .............................................................................................................................. 21 4.7 Abatement and Disposal ............................................................................................................................... 22 4.8 Schedule .......................................................................................................................................... 23 5.0 HEALTH AND SAFETY PLAN ............................................................................................................................... 23 6.0 QUALITY ASSURANCE ................................................................................................................................ 24 REFERENCES FIGURES APPENDICES

Remediation Work Plan BFD #4170705
Page vi
LIST OF TABLES
Table 1. Surrounding Land Uses Table 2. Arsenic and Lead in Soil – Testing Summary
LIST OF FIGURES
Figure 1. Topographic Map Figure 2. Site Area Map – Phase I Environmental Site Assessment (11/9/2017) Figure 3. Debris Piles Figure 4. Impact Extent and Utilities Figure 5. Soil Barrier Areas Figure 6. Groundwater Monitoring
LIST OF APPENDICES
Appendix A. USDA Soil Report Appendix B. Water Well Logs Appendix C. Soil Boring Logs Appendix D. Data Compilation Tables and Figures Appendix E. Exposure Assessment Data Appendix F. IBP’s BFF Comfort Letter and Environmental Restrictive Covenant (ERC)
Remediation Work Plan BFD #4170705
Page 1
1.0 INTRODUCTION
This document serves as a remediation work plan (RWP) for addressing contaminants at the former The Butler Company property located at 325 South Broadway Street, Butler, DeKalb County, Indiana 46721 (hereinafter collectively referred to as the site). This RWP was prepared on behalf of the City of Butler, the Indiana Brownfields Program (IBP) and Indiana Finance Authority (IFA). The City of Butler (City) will utilize brownfield funding (i.e., grant) from the U.S. EPA Region 5 and the Indiana Finance Authority (IFA) to conduct remediation of hazardous substances (lead contaminated soils) at the subject property, as well as asbestos abatement and chemical container removal and disposal. Cleanup will help revitalize approximately 3.5 acres of blighted property in downtown Butler, Indiana. The City intends to redevelop the property for commercial use. The plan begins by providing a summary of site conditions and previous environmental investigation conducted between October 2017 and June 2020. This discussion is followed by details concerning contaminant characteristics, distribution, and potential exposure scenarios. The plan concludes by presenting details concerning the remediation approaches chosen for the site. All figures referenced in the text are located together at the conclusion of the report. Project supporting information is provided in the Appendices. 1.1 Project Identification
The site consists of a 3.55-acre fire-damaged property. The central and west portions are covered with concrete and brick rubble associated with former building structures. Two buildings remain partially intact on the north and east portions. Remaining areas are covered with grass, trees, and scrub vegetation. The City of Butler acquired the site via a tax sale in January 2020. Contact information for involved parties are as follows:
Owner Indiana Brownfields / Indiana Finance Authority Consultant City of Butler
215 South Broadway Street Butler, IN 46721
Mike Hartman, Mayor Office: (260) 7868-5200
Indiana Brownfields / Indiana Finance Authority 100 North Senate Avenue, Suite 1275
Indianapolis, IN 46204 Tracey Michael, Project Manager
Office: 317-232-4402 [email protected]
SES Environmental 3807 Transportation Drive
Fort Wayne, IN 46818 Glen A. Howard, Project Manager
Office: (260) 497-7645 [email protected]
1.2 Overview of COC Distribution and Cleanup Approach
Environmental site assessments were conducted at the site between October 2017 and June 2019 and included Phase I and Phase II Environmental Site Assessments (ESA). Phase I ESAs identified historical manufacturing operations and use of hazardous substances and petroleum products as a recognized environmental condition (REC). Other RECs included potential chlorinated solvent groundwater impact from an off-site source and oil tanks identified on historical maps/documents. The Phase II ESA identified surface fill material with barium, cadmium, chromium, copper, lead, zinc, and mercury concentrations being evidence of contamination that poses a concern. Subsequent Phase II ESA investigation in May and June 2019 included soil, groundwater, and vapor investigation, geophysical survey, asbestos and lead based paint surveys, and a chemical inventory of petroleum and/or hazardous substances remaining on site. Soil, groundwater, and vapor investigation consisted of advancing 30 soil borings throughout the site. Samples of surface fill material, native clay soil, perched water, and groundwater were collected and analyzed for VOCs, PAHs, RCRA 8 metals, copper, and zinc as a screening for contaminants of concern. Soil vapor was analyzed for VOCs only. Investigation results indicate impact was limited to arsenic and lead within the fill material (0-4 feet) at concentrations exceeding industrial direct contact levels.
Remediation Work Plan BFD #4170705
Page 2
A geophysical survey was conducted during the 2019 investigation to identify potential tanks or other subsurface structures. It should be noted, significant debris and metal objects on the ground throughout the facility limited the effectiveness of the survey. USTs were not identified during the survey. Several remnant subsurface utilities were identified including water and natural gas. A storm sewer catch basin was also located. A site inspection was completed in May 2020. Asbestos and lead-based paint surveys were conducted on building materials within the debris piles, as well as accessible standing buildings. Asbestos containing materials (ACMs) were identified in the East Central Building debris pile and the North Building. ACMs included transite panels and tar roofing materials. The lead-based paint survey was conducted using an XRF field meter to determine the presence of lead on building materials. If present, a physical sample was collected for laboratory analysis. One sample of red paint from the door and door frame in the East Building exhibited a 1.8% by weight results (18,000 ppm). A chemical inventory of petroleum and/or hazardous substances remaining on site was completed. Totes, drums, small containers (<10 gallons) of paints, dyes, and water filtration chemicals were identified during the inventory. Small containers were inventoried as a ‘lab pack’ for potential disposal at a Tradebe disposal facility. Universal wastes and larger containers were also inventoried, and profiles were prepared. Totes containing sand/sludge filtration material were observed inside and outside of the north building. Representative samples of the materials were obtained (one sample inside and one sample outside) for laboratory analysis and profiling purposes. SES anticipates the removal and offsite disposal of fire damaged debris/structures, asbestos transite panels and roofing tar, and chemical containers. Clean soils (soil barrier) will be applied over three areas of lead and/or arsenic impacted soils/fill to prevent direct contact with the contaminants. The soils selected for barrier construction will be screened for potential contaminants (VOCs, SVOCs, and RCRA eight metals). SES also anticipates that groundwater monitoring would confirm contaminants in soil have not leached to groundwater. Finally, a risk-based environmental remedy is anticipated to address any residual contaminants in soil/fill pursuant to the BFF Comfort Letter and Environmental Restrictive Covenant (ERC) issued in IBP correspondence dated January 18, 2019. SES anticipates IBP will prepare a revised ERC following implementation and completion of this RWP. 2.0 GENERAL BACKGROUND INFORMATION This section provides general information concerning local and site-specific conditions. This information was obtained from published sources and site reconnaissance. 2.1 Site Location and Setting The site consists of one land parcel located at 325 South Broadway Street, Butler, DeKalb County, Indiana and identified by the DeKalb County Assessor’s Offices as Parcel ID 23-07-12-109-001. Geographically, the site is located at approximately 41.4267450° north latitude and 84.8704460° west longitude. An abbreviated legal description of the site obtained from DeKalb County Assessor’s Office is as follows:
3.55 Acres in the Mid Part of the West ½ of the Northwest ¼ of Section 12, Township 34 North, Range 14 East, Wilmington Township, DeKalb County, Indiana.
The elevation of this site is approximately 870 feet above mean sea level as shown on the Butler East, Indiana USGS 7.5-Minute Quadrangle Map. A Topographic Map and Site Area Map are presented as Figures 1 and 2, respectively.

Remediation Work Plan BFD #4170705
Page 3
2.2 Surrounding Population and Land Use
The area surrounding the site includes commercial businesses and residences. Railroad tracks are located north of the site with a laundry and carwash facility beyond. A bulk petroleum storage facility is located east of the site. What appear to be empty aboveground storage tanks (ASTs) and drums are stored on the west portion of this property. Bulk petroleum ASTs are located in secondary containment on the east portion of the property, approximately 250 feet from the site. East Willow Street is located south of the site with residences beyond. South Broadway Street is located west of the site with the Butler Public Library and Hathaway Park beyond. 2.3 Site and Site History
The central and west portions are covered with concrete and brick debris associated with former building structures. Two buildings remain partially intact on the north and east portions. Remaining areas are covered with grass, trees, and scrub vegetation. Foundry slag was observed on the north-central and northeast portions of the site in the vicinity of a former foundry building. Piles of building debris covered the central and west portions of the site. The piles generally consist of brick, concrete, scrap wood and metal, wood pallets, and roof materials. Historical review indicates the site was first developed by The Butler Manufacturing Company in 1888. The initial building was constructed in late 1888 and was used for manufacturing windmills. A second building was constructed in 1892. The property was sold in 1894 and was renamed “The Butler Company.” Expansions and reconfigurations occurred throughout the 1890’s as windmills, bicycles, buggies and mail wagons were made on-site.
An additional factory was built in 1906. A new foundry was built in 1918. Oil-bath style windmills were then constructed on-site. By the 1930s, The Butler Company site included a machine shop, foundry, paint shop, pipe shed, lumber shed, tin shop and storage building. The production of windmills ceased in 1943 when the Company went into World War II production. A major fire destroyed the three-story storage building on the southwest portion of the site in 1958. The site was then used as a distributor of plumbing, heating, and cooling parts. The building closest to the railroad track to the north of the property was used by the Carbola Chemical Company in approximately the late 1950’s and early 1960’s. The Butler Company continued as a jobber of electrical, plumbing, heating, cooling, and well drilling supplies until the facility was closed in 1997. FSPI 401K Employee Profit Sharing Plan, acquired the site at a tax sale in 2012 and subsequently sold the property on a land contract to an individual, Mr. Tom Estes, who planned to use the facility for manufacturing prefab storage buildings. A massive fire destroyed the site buildings on March 26, 2015. The City of Butler acquired the site via a tax sale in January 2020. 2.4 Surface Waters
Surface drainage at the site is directed to storm drains along South Broadway Street to the west and toward a low-lying wooded area northeast of the site. The nearest surface-water feature to the site is Big Run located approximately ¾ mile to the northeast. Two ponds are located along Big Run, approximately one mile to the northeast. A stream identified as Mason Ditch is located approximately one mile to the southwest. The most significant surface water drainage feature is the St. Joseph River, located approximately four miles southeast of the site. The St. Joseph River is the largest surface water feature in the area and flows southwest.

Remediation Work Plan BFD #4170705
Page 4
Review of a FEMA Flood Insurance Rate Map (FIRM) indicates the site is located in Zone X, an area of minimal flood hazard. A copy of the FIRM is presented in Appendix E. Surface water on the site or in its immediate vicinity is not a source of local drinking water. The site area receives water from the City of Butler. 2.5 Regional and Local Topography The Butler area topography is generally flat to gently rolling with the site located near the northern limb of the Wabash Moraine, in an area of ground moraine (hill). As previously noted, the elevation of this site is approximately 870 feet above mean sea level as shown on the Butler East, Indiana USGS 7.5-Minute Quadrangle Map (Figure 1). 2.6 Subsurface Structures
Water and sewer services are provided to the site area by the City of Butler. Natural gas is provided to the site area by NIPSCO, and electricity is provided to the site by American Electric Power. Municipal buried utility mains are located beneath right-of-ways. Service lines extending to the fire damaged building structures have been vacated. However, an active 48-inch storm sewer main extends across the north portion of the site near the north property line. Known underground utilities are depicted on Figure 4. 2.7 Geology and Hydrogeology 2.7.1 Regional A United States Department of Agriculture (USDA) Natural Resources Conservation Service (NRCS) Custom Soil Resource Report for DeKalb County, Indiana, shows soil beneath the subject site is part of the Blount silt loam and Pewamo silty clay complexes. Details concerning the specific soil types identified on the site are provided in a custom soil report presented in Appendix A. The site is located near the northern limb of the Wabash Moraine, in an area of ground moraine, characterized by till sediments. Wabash end moraine sediments (mostly till with ice contact and lake sediments) are located approximately two miles west of the site area. Valley train deposits (sand and gravel) associated with the St. Joseph River, are located approximately four miles to the southeast. Based on a cross section presented in the Hydrogeologic Atlas of Aquifers in Indiana, soil in the Butler area consists predominantly of nonaquifer till material near the surface. Two, somewhat laterally continuous aquifers are encountered at approximately ninety and 120 feet beneath the surface. The shallower aquifer is approximately ten feet thick, and the lower aquifer appears to be at least forty feet thick. Discontinuous, near surface aquifer materials are sometimes present. Depth to bedrock in the area is estimated to be 300 feet. Bedrock consists of Upper Devonian Antrim, and Lower Mississippian Ellsworth Shales. Review of State of Indiana water well logs for wells located on the north and west adjacent properties indicates soil beneath the site are generally consists of clay from the near surface to depths ranging from 18 to 57 feet. The upper clay is underlain by alternating layers of sand, gravel, and clay to a depth of 148 feet (i.e. maximum depth explored). The static groundwater level in the site area ranges from approximately 21 to 24 feet.
Remediation Work Plan BFD #4170705
Page 5
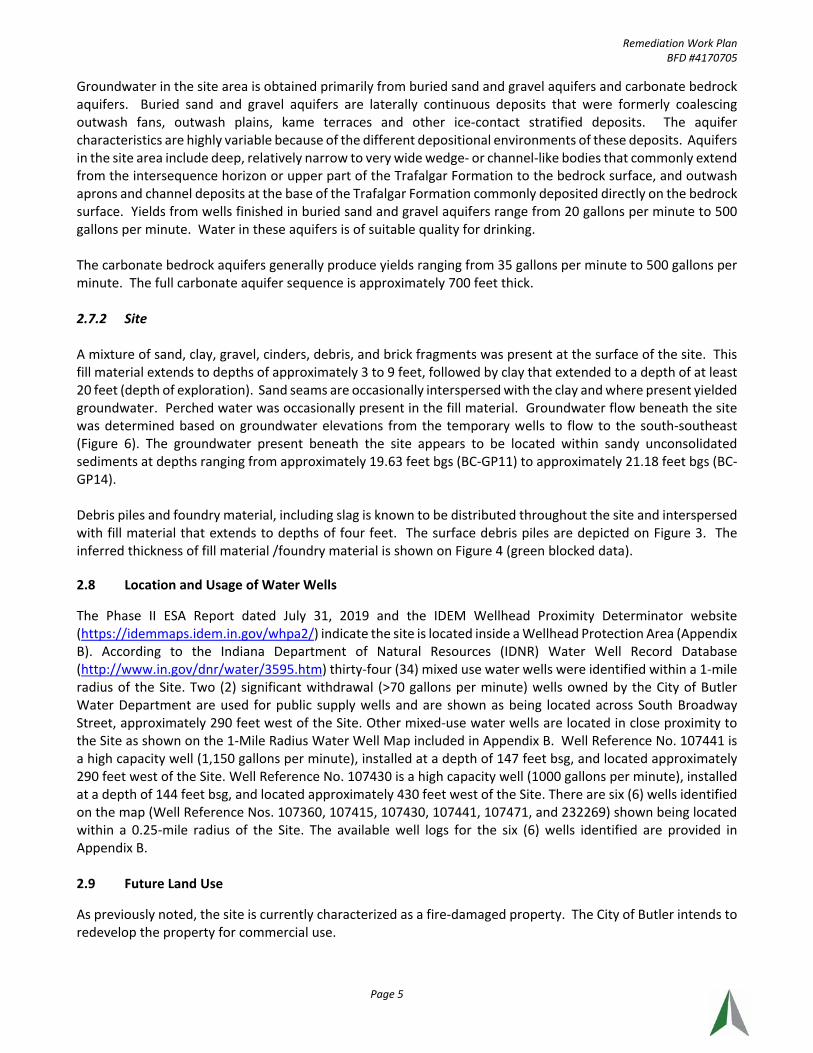
Groundwater in the site area is obtained primarily from buried sand and gravel aquifers and carbonate bedrock aquifers. Buried sand and gravel aquifers are laterally continuous deposits that were formerly coalescing outwash fans, outwash plains, kame terraces and other ice-contact stratified deposits. The aquifer characteristics are highly variable because of the different depositional environments of these deposits. Aquifers in the site area include deep, relatively narrow to very wide wedge- or channel-like bodies that commonly extend from the intersequence horizon or upper part of the Trafalgar Formation to the bedrock surface, and outwash aprons and channel deposits at the base of the Trafalgar Formation commonly deposited directly on the bedrock surface. Yields from wells finished in buried sand and gravel aquifers range from 20 gallons per minute to 500 gallons per minute. Water in these aquifers is of suitable quality for drinking. The carbonate bedrock aquifers generally produce yields ranging from 35 gallons per minute to 500 gallons per minute. The full carbonate aquifer sequence is approximately 700 feet thick. 2.7.2 Site A mixture of sand, clay, gravel, cinders, debris, and brick fragments was present at the surface of the site. This fill material extends to depths of approximately 3 to 9 feet, followed by clay that extended to a depth of at least 20 feet (depth of exploration). Sand seams are occasionally interspersed with the clay and where present yielded groundwater. Perched water was occasionally present in the fill material. Groundwater flow beneath the site was determined based on groundwater elevations from the temporary wells to flow to the south-southeast (Figure 6). The groundwater present beneath the site appears to be located within sandy unconsolidated sediments at depths ranging from approximately 19.63 feet bgs (BC-GP11) to approximately 21.18 feet bgs (BC-GP14). Debris piles and foundry material, including slag is known to be distributed throughout the site and interspersed with fill material that extends to depths of four feet. The surface debris piles are depicted on Figure 3. The inferred thickness of fill material /foundry material is shown on Figure 4 (green blocked data). 2.8 Location and Usage of Water Wells
The Phase II ESA Report dated July 31, 2019 and the IDEM Wellhead Proximity Determinator website (https://idemmaps.idem.in.gov/whpa2/) indicate the site is located inside a Wellhead Protection Area (Appendix B). According to the Indiana Department of Natural Resources (IDNR) Water Well Record Database (http://www.in.gov/dnr/water/3595.htm) thirty-four (34) mixed use water wells were identified within a 1-mile radius of the Site. Two (2) significant withdrawal (>70 gallons per minute) wells owned by the City of Butler Water Department are used for public supply wells and are shown as being located across South Broadway Street, approximately 290 feet west of the Site. Other mixed-use water wells are located in close proximity to the Site as shown on the 1-Mile Radius Water Well Map included in Appendix B. Well Reference No. 107441 is a high capacity well (1,150 gallons per minute), installed at a depth of 147 feet bsg, and located approximately 290 feet west of the Site. Well Reference No. 107430 is a high capacity well (1000 gallons per minute), installed at a depth of 144 feet bsg, and located approximately 430 feet west of the Site. There are six (6) wells identified on the map (Well Reference Nos. 107360, 107415, 107430, 107441, 107471, and 232269) shown being located within a 0.25-mile radius of the Site. The available well logs for the six (6) wells identified are provided in Appendix B. 2.9 Future Land Use As previously noted, the site is currently characterized as a fire-damaged property. The City of Butler intends to redevelop the property for commercial use.

Remediation Work Plan BFD #4170705
Page 6
2.10 Susceptible Area Evaluation
Geologically susceptible areas (e.g., surface-water bodies, karstic bedrock areas, etc.) have not been identified at or immediately surrounding the site. The nearest surface-water feature to the site is Big Run located approximately ¾ mile to the northeast. A Freshwater Forested/Shrub Wetland extends onto the northeast portion of the site and this area may be a potentially susceptible ecological area and habitat for animal species. Potentially susceptible community areas located adjacent to the site include residences to the south and recreation to the west. SES notes that offsite contamination is not known to be present. The following table describes the nearest potentially susceptible facilities to the site.
Table 1. Surrounding Land Use 325 South Broadway Street, Butler, Indiana
Facility Type Address Distance from Site (miles)
Residences 401 South Broadway Street, 108 East Willow Street, and 116 East Willow Street
Adjacent - south
Church – Butler Church of Christ 173 West Oak Street, Butler 1000 feet northwest Retirement – Laurels of Dekalb 520 West Liberty Street, Butler 1-mile northwest Park/Recreation – library and ball diamonds 340 South Broadway Street, Butler Adjacent - west Day Care – Butler Day Care Inc. 408 East Washington Street, Butler 0.6 mile - northeast School – Eastside Jr-Sr High School 603 East Green Street, Butler 0.7 mile – northeast School – Butler Elementary 1025 South Broadway Street, Butler 0.7 mile - south Hospital – Dekalb Memorial 1316 East 7th Street, Auburn 6 miles - southwest Source: Directions – Bing Maps 2.11 Constituents of Concern (COCs)
Investigation results indicate constituents of concern are limited to arsenic and lead in soil/fill; however, asbestos containing materials are identified as concerns, as well as the containerized chemicals and lead-based paint. The Phase II ESA Report dated July 31, 2019 reported the following soil and groundwater conditions: “Each of the RCRA 8 metals including copper and zinc, except silver, were detected above their respective laboratory reporting limits (LRLs) in soil samples analyzed from the site. Arsenic and lead were each detected in excess of their respective RCG Res MTGSLs, RDCSLs, and/or IDCSLs in several soil samples. Due to the elevated concentration of lead detected in BC-GP3-SS1 (1-2’), TCLP lead analysis was performed on the sample. The resulting 30.6 mg/L lead detection in the leachate reveals that the lead is leachable in the vicinity of the BC-GP3 and BC-GP16 borings. The three (3) soil samples exhibiting the highest concentrations of total chromium were also submitted for analysis of Cr (VI). The results indicate that Cr VI is not present in soil at concentrations exceeding its IDEM RCG RDCSLs. No VOCs, PAHs, or PCBs were detected at concentrations exceeding their respective IDEM RCG Res MTGSLs in any soil sample. The PFAS Perfluorooctanoic Acid (PFOA) and Perfluorooctanesulfonic Acid (PFOS) were detected in some of the samples ranging between 0.46 and 0.61 μg/kg.” “Multiple total RCRA 8 metals including copper and zinc were detected in groundwater samples; however, only barium, cadmium, and zinc were detected in the laboratory-filtered dissolved RCRA 8 metals groundwater samples. No metals detections exceeded their respective IDEM RCG Res TAP GWSLs. No VOCs, PAHs, or PCBs were detected at concentrations exceeding their respective IDEM RCG Res TAP GWSLs in any groundwater sample. PFAS compounds were detected in groundwater samples collected from BC-GP12 and/or BC-GP13 ranging from between 3.0 and 23 ng/L. Total PFAS ranged from 30.3 to 48.6 ng/L in BC-GP12 and BC-GP13, respectively.”

Remediation Work Plan BFD #4170705
Page 7
2.12 Potential Exposure Evaluation
Constituents of concern have been documented in near surface soils/fill at levels that pose an exposure risk for visitors, trespassers, and/or transient site workers and maintenance personnel. Ingestion or inhalation of wind-blown dust particles and surface runoff/erosion/soil washing migration to offsite areas and/or storm sewers are also identified as potential concerns. A Freshwater Forested/Shrub Wetland extends onto the northeast portion of the site and this area may be a potentially susceptible ecological area and habitat for animal species. Inhalation of asbestos is another potential exposure pathway and chemical containers and lead-based paint should be removed/disposal to eliminate future exposure hazards. 3.0 PREVIOUS INVESTIGATIONS
The following provides a summary of investigation information that has been reproduced from the following previous reports. Soil boring logs are provided in Appendix C. Data compilation tables are provided in Appendix D.
• SES Environmental, November 10, 2017, Phase I Environmental Site Assessment • SES Environmental, June 13, 2018, Phase II Environmental Screening Report • SES Environmental, October 2018, Phase I Environmental Site Assessment • SES Environmental, January 2019, Analysis of Brownfield Cleanup Alternatives • SES Environmental, April 10, 2020, Health and Safety Plan • SES Environmental, April 24, 2020, Sampling and Analysis Plan • SES Environmental, June 8, 2020, Field Activity Report • IDEM, January 18, 2019, BFPP Comfort Letter and Institutional Controls • IWM Consulting Group, July 31, 2019, Phase II Environmental Site Assessment Report
3.1 Phase I Environmental Site Assessment – November 2017
SES Environmental (SES) conducted Phase I Environmental Site Assessment (ESA) between October and November 2017. The ESA included a visual inspection of the site and limited observations of surrounding properties, a review of historic land use, a review of regulatory listings, and interviews with persons potentially knowledgeable concerning site conditions. SES identified the following recognized environmental conditions (RECs) associated with the site:
REC#1 Historic manufacturing operations conducted at the site from at least 1898 until 1997 included a machine shop, painting and varnishing shops, plating, a foundry, and a chemical company. Hazardous substances and petroleum products including but not limited to oil, petroleum fuels, solvents, and/or metals were likely stored and used at the site. The potential exists of releases of hazardous substances or petroleum products to have occurred during the long history of manufacturing operations at the site.
REC#2 During investigation of a petroleum release at the east adjacent bulk plant, chlorinated solvents including
trichloroethylene (TCE) were detected in a groundwater sample obtained approximately 200 feet east of the site. While IDEM issued “No Further Action” status to the petroleum release, the source and extent of chlorinated solvent impact in groundwater was not determined.
REC#3 Evidence of underground storage tanks was not observed during the site inspection; however, a 10-barrel
buried oil tank is depicted on the central portion of the site on a historical map from 1897, a gasoline tank is shown on the northeast portion of the site on a map from 1914, and a gasoline tank is shown west of the site beneath South Broadway Street on a map from 1923.
Based on the ESA findings, SES recommended a Phase II ESA to evaluate the identified RECs.

Remediation Work Plan BFD #4170705
Page 8
3.2 Screening Investigation – June 2018
A Phase II environmental screening investigation was conducted in May 2018 to further assess soil and groundwater conditions and to screen for contaminants of concern. The screening investigation consisted of advancing seven soil borings within and around former manufacturing buildings/areas. Boring locations are identified as ‘A’ through ‘G’ on Figure 4. Samples were collected at each boring location and analyzed for volatile organic compounds (VOCs), polycyclic aromatic hydrocarbons (PAHs) and metals. A sample of black peat-like material was also analyzed for polychlorinated biphenyls (PCBs). Collectively, borings were used to evaluate overall site conditions. Screening results are summarized as follows: • A mixture of sand, clay, gravel, cinders, debris, and brick fragments was present at the surface. At boring C, paint debris
and chips were observed. This fill material extended to depths of approximately 3 to 9 feet, followed by clay that extended to a depth of at least 20 feet (depth of exploration).
• Sand seams were occasionally interspersed with the clay and where present yielded groundwater, except at boring A. Perched water was also observed in the fill material. Groundwater flow direction was not assessed.
• Field evidence of contamination such as elevated PID responses and/or black staining was associated with the fill material. PID responses associated with the fill material generally ranged between 2 and 8 ppmv; however, PID responses ranged up to 56 ppmv at boring B.
• Volatile organic compounds (VOCs) were not detected in soil samples or the fill sample. Polychlorinated biphenyls (PCBs) were not detected in the collected peat-like material sample. Polycyclic aromatic hydrocarbons (PAHs) were not detected in soil or fill samples, except for a trace concentration of benzo(a)pyrene in fill at boring C. The detected benzo(a)pyrene concentration did not exceed any residential or commercial/industrial remediation screening level.
• Metals including barium, chromium, copper, lead, and zinc were detected in clay soil samples. These metals are known to occur naturally in soils and detected concentrations in clay soil samples did not exceed any residential or commercial/industrial remediation screening level.
• Metals including barium, cadmium, chromium, copper, lead, zinc, and mercury were detected in surface fill samples. The lead concentration in surface fill at boring A exceeded the migration to groundwater screening level but did not exceed direct contact screening levels. The lead concentration in near surface fill at boring C was 7,160 mg/kg and exceeded remediation screening levels that range from the most conservative 270 mg/kg to 1,000 mg/kg. Cadmium and mercury were also detected in the surface fill at boring C, along with paint chips and a potentially elevated chromium concentration. The chromium concentrations in the BC and BH samples ranged between 56 and 249 mg/kg, while the maximum concentration in all other samples was 14 mg/kg. The duplicate sample collected at boring C exhibited barium, cadmium, copper, and lead concentrations exceeding remediation screening levels.
• Volatile organic compounds (VOCs) were not detected in perched water or groundwater samples. Polycyclic aromatic hydrocarbons (PAHs) were not detected in perched water or groundwater samples. Metals including barium, chromium, copper, lead, and/or zinc were detected in groundwater samples. The total lead concentration in groundwater samples D and E exceeded the tap water screening level. However, dissolved lead was not detected in these samples.
• Metals including barium, cadmium, chromium, copper, lead, selenium, and zinc were detected in perched water samples. The total lead, selenium, copper, and/or zinc concentrations exceeded tap water screening levels. However, dissolved metal concentrations did not exceed tap water screening levels.
This screening found no evidence of chlorinated solvent contamination and no further assessment of REC #2 was recommended. The screening found no evidence of petroleum contamination (REC #3); however, this screening investigation did not rule-out the possibility of localized petroleum contamination at historical buried tank areas.
With respect to the various metals detected in native clay soil and groundwater during this screening investigation, metal concentrations in native soil were well below residential screening levels and dissolved metals were not detected in groundwater. Based on this firm’s review of native clay soil and groundwater testing results, these detected metals are consistent with naturally occurring concentrations, and therefore do not pose

Remediation Work Plan BFD #4170705
Page 9
a concern and no further inquiry is recommended, at this time. If a higher level of confidence is required, background samples and permanent monitor wells would need to be collected and installed to statistically establish naturally occurring metal concentrations. With respect to metals in surface fill material, which appears to be distributed over most of the site, the barium, cadmium, chromium, copper, lead, zinc, and mercury concentrations are evidence of contamination that poses a concern. SES recommended establishing remediation objectives, and conducting additional investigation to characterize the fill material, extent of metals (in solids and perched water), and potential exposure pathways. 3.3 Phase I Environmental Site Assessment – October 2018 SES conducted another Phase I Environmental Site Assessment (ESA) between September and October 2018 in preparation of a USEPA grant and funding opportunity number EPA-OLEM-OBLR-18-07. The ESA included a visual inspection of the site and limited observations of surrounding properties, a review of historic land use, a review of regulatory listings, and interviews with persons potentially knowledgeable concerning site conditions. SES identified the following RECs associated with the site. SES identified the following recognized environmental conditions (RECs) associated with the site during the completion of this Phase I ESA:
REC#1 Historic manufacturing operations conducted at the site from at least 1898 until 1997 included a machine shop, painting and varnishing shops, plating, a foundry, and a chemical company. Hazardous substances and petroleum products including but not limited to oil, petroleum fuels, solvents, and/or metals were likely stored and used at the site. Environmental investigation conducted in May 2018 found no evidence of petroleum or solvent contamination at the site; however, concentrations of metals, including barium, cadmium, chromium, copper, lead, zinc, and mercury, exceeded remediation screening levels in surface fill materials, which appeared to be distributed over most of the site.
REC#2 Evidence of underground storage tanks was not observed during the site inspection; however, a 10-barrel
buried oil tank is depicted on the central portion of the site on a historical map from 1897, a gasoline tank is shown on the northeast portion of the site on a map from 1914, and a gasoline tank is shown west of the site beneath South Broadway Street on a map from 1923. Environmental investigation conducted in May 2018 found no evidence of petroleum contamination; however, the screening investigation did not rule-out the possibility of localized petroleum contamination at historical buried tank areas.
SES recommended additional environmental investigation to further evaluate the identified RECs. 3.4 Analysis of Brownfield Cleanup Alternatives In preparation of a USEPA grant and funding opportunity number EPA-OLEM-OBLR-18-07, SES prepared an Analysis of Brownfield Cleanup Alternatives (ABCA). The ABCA outlined environmental cleanup alternatives that were evaluated to mitigate blight and facilitate potential redevelopment. The analysis included an evaluation of alternatives with respect to effectiveness and cost. Remediation alternatives for metals in soil included (1) isolation, (2) immobilization, (3) physical separation, or (4) extraction. Each alternative is summarized below, along with conceptual application of isolation and extraction at the site. This ABCA determined that while there may be alternative for addressing contamination at this particular site; given the known conditions, extraction and isolation/soil barrier would be the most effective corrective action alternatives. And isolation/soil barrier appeared to be the most cost effective.

Remediation Work Plan BFD #4170705
Page 10
3.5 Comfort Letter A comfort letter request package was issued to the Indiana Brownfield Program in October 2018 to confirm the City of Butler has an exemption of environmental liability. The request package included a Phase I Environmental Site Assessment dated October 2, 2018 and a Phase II Environmental Screening Report dated June 13, 2018. On December 5, 2018, Mitchell Smith (IFA) requested an affected area map with the location of boring “B” being a corner of the western most and southern most extent of the area and the northeast point of the Site boundary being another corner. On December 26, 2018, Mr. Smith indicated the proposed Environmental Restrictive Covenant (ERC) for the site will state if the soil in the affected area is not removed it will need 2 feet of cover. A BFF Comfort Letter along with an ERC was issued in correspondence dated January 18, 2019. 3.6 IWM, Phase II Assessment – July 2019
“In accordance with the Indiana Brownfields Program (IBP) and United States Environmental Protection Agency (US EPA) approved Sampling and Analysis Plan (SAP) dated April 16, 2019, Industrial Waste Management Consulting Group, LLC (IWM Consulting) conducted a Phase II Environmental Site Assessment (Phase II ESA) of The Butler Company property located at 325 South Broadway Street in Butler, DeKalb County, Indiana (Site). The objective of the investigation was to determine the presence/absence, nature, and potential extent of contamination at the Site due to historical activities/operations. The environmental investigation was completed between May 15, 2019 and June 18, 2019.” “IWM Consulting conducted Phase II ESA field activities between May 15, 2019 and June 18, 2019. During the course of this assessment the following investigative activities were completed: A geophysical survey of the Site was completed by Ground Penetrating Radar Systems Inc. (GPRS), to identify potential buried underground storage tanks (USTs) and/or other buried objects that may pose an environmental risk to the Site. An asbestos survey of the building materials contained in debris piles (previously razed building structures) and the buildings still standing on the Site. A lead paint survey of the building materials contained in debris piles and the buildings still standing on the Site was performed with a hand-held X-ray fluorescence (XRF) analyzer. A chemical inventory of potential containerized petroleum and/or hazardous substances remaining on the Site was completed. Installation of nine (9) subsurface soil borings (BC-GP1 through BC-GP9) to depths of one (1) to two (2) feet beneath previously identified fill material at depths ranging from two (2) to seven (7) feet below surface grade (bsg). The collection and analysis of eighteen (18) soil samples from the fill and underlying clay material. Installation of six (6) subsurface soil borings (BC-GP10 through BC-GP15) at depths up to 20 feet bsg to collect soil and groundwater samples for analysis. Installation of fifteen (15) shallow soil borings to a depth of two (2) feet bsg to delineate lead impacts in near surface soils in the vicinity of BC-GP3 and SES Environmental (SES) boring location “BC”. Groundwater was collected and analyzed from six (6) temporary groundwater monitoring wells installed in borings BC-GP10 through BC-GP15. Collection and analysis of five (5) soil and five (5) groundwater samples from BC-GP10, BC-GP11, BC-GP12, BC-GP13, and BC-GP14 for analysis of polyfluoroalkyl substances (PFOAs) and perfluoroalkyl substances (PFOS), collectively identified as PFAS, from areas of the Site possibly impacted from fire-fighting chemicals during previous fires at the Site. Installation of three (3) soil vapor probes adjacent to soil borings that displayed elevated vapor readings during field screening and the subsequent attempted collection of soil gas samples for laboratory analysis. A professional survey by Maxwell Surveying & Engineering to locate the horizontal position of subsurface boring locations and the horizontal and vertical location of the temporary monitoring wells.”
• A geophysical survey was performed/attempted on the Site by GPRS on May 15, 2019 to determine the presence/absence of the USTs and/or product piping on the Site. Not all areas of the Site could be scanned due to interference from debris. No buried metallic objects were detected/identified; however, two (2) areas with relic utilities were identified.

Remediation Work Plan BFD #4170705
Page 11
• For asbestos-sampling purposes, due to the conditions of the buildings at the Site, building materials were divided into five (5) primary areas (West Central Building debris, East Central Building debris, Central Shed/Kiosk, North Building, and East Building). A total of thirty (30) bulk samples of suspect asbestos-containing materials (ACMs) from each homogeneous area were collected in accordance with the requirements of 40 CFR 763.86. The suspect ACM samples included roofing materials, brick façade mortar, electrical wire insulation, transite-like panels, fire brick mortar, fire brick, window sealant, and electrical board paper backing. Roofing material samples from several locations contained between <1 and 5% chrysotile. Two (2) transite panel samples (BC-AB13 and BC-AB14) collected from the East Central Building exhaust stack debris contained 15-20% chrysotile. One (1) friable sample of paper backing (BC-AB21) collected from an electrical panel located near the East Central Building stack debris contained 40% chrysotile.
• IWM Consulting collected one (1) representative paint chip sample from the building near the east Site boundary, where the XRF instrument indicated a positive reading (>1.0%). The paint chip sample (red paint) was collected from the doorframe on the east side of the building and had a lead concentration of 18,000 parts per million (ppm), or 1.8 percent by weight.
• Several containerized chemicals including paints, dyes, and water treatment chemicals were identified within Site buildings and on exterior portions of the Site.
• IWM Consulting obtained a total of twenty-four (24) soil samples, comprised of both surface and subsurface soil samples, for the analysis Resource Conservation and Recovery Act (RCRA) 8 metals including copper and zinc and percent moisture. Additional soil samples were also submitted from each soil boring location for laboratory analysis of the toxicity characteristic leaching procedure (TCLP) RCRA 8 metals and hexavalent chromium (Cr (VI)), if necessary. Based on analytical results, Cr (VI) analysis was performed on BC-GP6-SB1 (3-4’), BC-GP8-SS1 (2-3’), and BC-GP9-SS1 (1-2’) and TCLP lead analysis was performed on BC-GP3-SS1 (1-2’). Two (2) subsurface soil samples were collected from BC-GP7-SB1 (3-4’) and BC-GP8-SB1 (3-4’) for the analysis of volatile organic compounds (VOCs), polynuclear aromatic hydrocarbons (PAHs), and polychlorinated biphenyls (PCBs) analysis. Eight (8) additional shallow soil samples collected from the vicinity of BC-GP3 and SES boring “BC” were analyzed for lead and percent moisture. No VOCs, PAHs, or PCBs were detected at concentrations exceeding their respective Indiana Department of Environmental Management (IDEM) Remediation Closure Guide (RCG) Residential Migration to Groundwater Screening Levels (Res MTGSLs) in any soil sample. Each of the RCRA 8 metals including copper and zinc, except silver, were detected above their respective laboratory reporting limits (LRLs) in soil samples analyzed from the Site. Arsenic and lead were each detected in excess of their respective RCG Res MTGSLs, Residential Direct Contact Screening Levels (RDCSLs), and/or Commercial/Industrial Direct Contact Screening Levels (IDCSLs) in several soil samples. Due to the elevated concentration of lead detected in BC-GP3-SS1 (1-2’), TCLP lead analysis was performed on the sample. The three (3) soil samples exhibiting the highest concentrations of total chromium were also submitted for analysis of Cr (VI). The results indicate that Cr VI is not present in soil at concentrations exceeding RCG RDCSLs. Due to the concentrations of lead detected in BC-GP3-SS1 (1-2’) at 3,160 milligram per kilogram (mg/kg) and SES boring “BC” (7,160 mg/kg and 28,700 mg/kg in the duplicate), shallow soil samples from depths of 1 to 2 feet bsg were collected from 5- to 10-feet in each cardinal direction of the aforementioned borings. Analytical results for the shallow soil samples identified lead at concentrations exceeding RCG Excavation Worker Direct Contact Screening Levels (EX DCSLs) in soil near these borings. Five (5) soil samples and a duplicate were collected and analyzed for PFAS from borings BC-GP10, BC-GP11, BC-GP12, BC-GP13, and BC-GP14. The PFAS Perfluorooctanoic Acid (PFOA) and Perfluorooctanesulfonic Acid (PFOS) were detected in some of the samples ranging between 0.46 and 0.61 μg/kg.
• IWM Consulting obtained a total of six (6) groundwater samples for the analysis of VOCs, PAHs, total and dissolved RCRA 8 metals including copper and zinc, PCBs, and/or PFAS. No VOCs, PAHs, RCRA 8 metals including copper and zinc, or PCBs were detected in any groundwater sample at concentrations exceeding their respective RCG Residential Tap Groundwater Screening Levels (Res TAP GWSLs). Five (5) groundwater samples and a duplicate were collected and analyzed for PFAS from borings BC-GP10, BC-GP11, BC-GP12, BC-GP13, and BC-GP14. Eight (8) different PFAS compounds were detected in groundwater samples collected from BC-GP12 and/or BC-GP13 ranging from between 3.0 and 23 ng/L. Total PFAS ranged from 30.3 to 48.6 ng/L in BC-GP12 and BC-GP13, respectively.
Remediation Work Plan BFD #4170705
Page 12
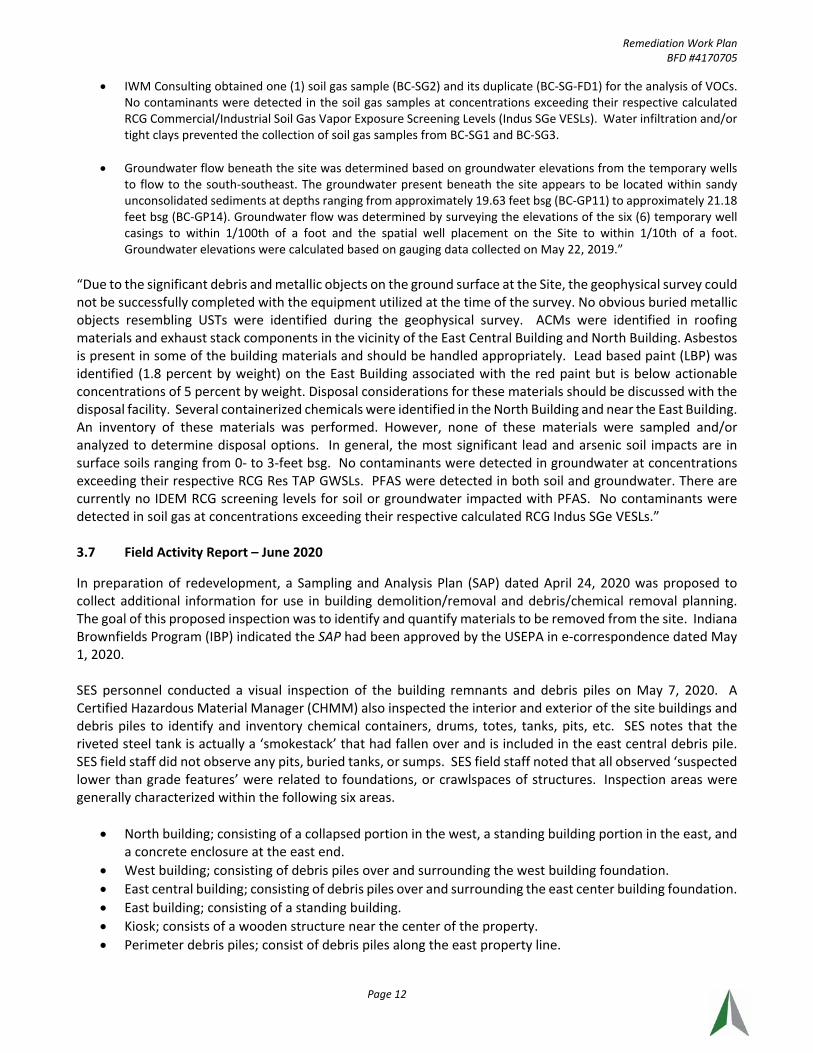
• IWM Consulting obtained one (1) soil gas sample (BC-SG2) and its duplicate (BC-SG-FD1) for the analysis of VOCs. No contaminants were detected in the soil gas samples at concentrations exceeding their respective calculated RCG Commercial/Industrial Soil Gas Vapor Exposure Screening Levels (Indus SGe VESLs). Water infiltration and/or tight clays prevented the collection of soil gas samples from BC-SG1 and BC-SG3.
• Groundwater flow beneath the site was determined based on groundwater elevations from the temporary wells to flow to the south-southeast. The groundwater present beneath the site appears to be located within sandy unconsolidated sediments at depths ranging from approximately 19.63 feet bsg (BC-GP11) to approximately 21.18 feet bsg (BC-GP14). Groundwater flow was determined by surveying the elevations of the six (6) temporary well casings to within 1/100th of a foot and the spatial well placement on the Site to within 1/10th of a foot. Groundwater elevations were calculated based on gauging data collected on May 22, 2019.”
“Due to the significant debris and metallic objects on the ground surface at the Site, the geophysical survey could not be successfully completed with the equipment utilized at the time of the survey. No obvious buried metallic objects resembling USTs were identified during the geophysical survey. ACMs were identified in roofing materials and exhaust stack components in the vicinity of the East Central Building and North Building. Asbestos is present in some of the building materials and should be handled appropriately. Lead based paint (LBP) was identified (1.8 percent by weight) on the East Building associated with the red paint but is below actionable concentrations of 5 percent by weight. Disposal considerations for these materials should be discussed with the disposal facility. Several containerized chemicals were identified in the North Building and near the East Building. An inventory of these materials was performed. However, none of these materials were sampled and/or analyzed to determine disposal options. In general, the most significant lead and arsenic soil impacts are in surface soils ranging from 0- to 3-feet bsg. No contaminants were detected in groundwater at concentrations exceeding their respective RCG Res TAP GWSLs. PFAS were detected in both soil and groundwater. There are currently no IDEM RCG screening levels for soil or groundwater impacted with PFAS. No contaminants were detected in soil gas at concentrations exceeding their respective calculated RCG Indus SGe VESLs.” 3.7 Field Activity Report – June 2020 In preparation of redevelopment, a Sampling and Analysis Plan (SAP) dated April 24, 2020 was proposed to collect additional information for use in building demolition/removal and debris/chemical removal planning. The goal of this proposed inspection was to identify and quantify materials to be removed from the site. Indiana Brownfields Program (IBP) indicated the SAP had been approved by the USEPA in e-correspondence dated May 1, 2020. SES personnel conducted a visual inspection of the building remnants and debris piles on May 7, 2020. A Certified Hazardous Material Manager (CHMM) also inspected the interior and exterior of the site buildings and debris piles to identify and inventory chemical containers, drums, totes, tanks, pits, etc. SES notes that the riveted steel tank is actually a ‘smokestack’ that had fallen over and is included in the east central debris pile. SES field staff did not observe any pits, buried tanks, or sumps. SES field staff noted that all observed ‘suspected lower than grade features’ were related to foundations, or crawlspaces of structures. Inspection areas were generally characterized within the following six areas.
• North building; consisting of a collapsed portion in the west, a standing building portion in the east, and a concrete enclosure at the east end.
• West building; consisting of debris piles over and surrounding the west building foundation. • East central building; consisting of debris piles over and surrounding the east center building foundation. • East building; consisting of a standing building. • Kiosk; consists of a wooden structure near the center of the property. • Perimeter debris piles; consist of debris piles along the east property line.

Remediation Work Plan BFD #4170705
Page 13
Historic finding regarding suspect asbestos containing building materials (ACBM) and lead based paint (LBP) were compared to current conditions. The previously identified and sampled suspect (ACBM) were located; however, in instances where additional suspect materials were identified, bulk samples of the above materials were collected in accordance with EPA guidelines. Screening for lead-based paint (LBP) was conducted utilizing a handheld and calibrated Delta Pro XRF with results reported in milligram per square centimeter. A CHMM inventoried visible chemical containers and items. Small containers were inventoried as a ‘lab pack’ for potential disposal at a Tradebe disposal facility. Universal wastes and larger containers were also inventoried, and profiles were prepared. Totes containing sand/sludge filtration material were observed inside and outside of the north building. Representative samples of the materials were obtained (one sample inside and one sample outside) for laboratory analysis and profiling purposes. The collapsed west portion of the north building could not be thoroughly inspected beyond the top layer of debris. Regulated materials could be present beneath the collapsed portion of the building, that was not readily visible during this inspection. The debris piles at the west building and the east center building appeared to have been moved from their original collapse locations. The debris piles were compact, and inspection was limited to exposed materials. Previous LBP analytical results indicated the red paint on wood at the east building as LBP with a result of 1.8 percent by weight. The corresponding XRF reading was 0.96 mg/cm2. The current XRF reading of the same paint indicated a reading of 0.83 mg/cm2. An extrapolation of XRF data to the known LBP concentration indicates all identified red paint in the north, east, and east central building are LBP. Foundry material, including slag is known to be distributed throughout the site and interspersed with fill material that extends to depths of four feet. SES recommended the following actions to be considered.
1) Complete the profiling of containerized materials and universal wastes and offsite disposal at approved, licensed facilities.
2) Abatement of the identified transite panels in debris piles at and near ‘smokestack’ following proper notifications to IDEM. Roofing tar at the north building is ACM but characterized as non-friable and will not require abatement personnel.
3) Segregation of metal for scrap metal recycling. The red colored paint is considered LBP and abatement may be necessary, unless regulatory recycling exclusion is obtained via the RCRA Scrap Metal Exemption. Regardless of recycling exclusions, this task must include building demolition and demolition notifications.
4) Segregation of red colored paint on wood surfaces and disposal at an approved, licensed facility. 5) Segregation debris into either (1) bricks for restoration and preservation; or (2) demolition debris for offsite
disposal. During debris removal an asbestos inspector must be onsite to visually inspect for suspect ACBM, as the debris piles are disturbed, and materials are segregated. This task will require building demolition and demolition notifications.
6) An abatement team will need to respond to the presence of any previously unidentified regulated materials. 7) Impacted soils will need to be addressed and groundwater monitoring will be required after the above six actions
are completed. a. Lead and arsenic along with foundry material are distributed throughout the surface fill material;
however, previous assessment has shown only three general areas where lead and/or arsenic concentrations exceed commercial/industrial direct contact screening levels. These three general areas are shown on Figure 4 and are targeted for monitoring and extraction. Approximately 4000 cubic yards of soils/fill extending from the surface to depths of 2 to 3 feet are targeted for monitoring and removal.
b. Groundwater monitoring will be conducted at up to five (5) monitor wells for two quarters to confirm contaminants in soil have not leached to groundwater. Groundwater monitor wells and groundwater monitoring will be conducted at the three previously described general areas, as well as at the northwest

Remediation Work Plan BFD #4170705
Page 14
and southeast portions of the site as shown on Figure 6 (Groundwater Monitoring Areas). The groundwater monitoring may be initiated prior to soil extraction/removal.
Bricks for restoration and preservation should be stored at an offsite location, if possible. 3.8 Contemplated Redevelopment and Cost Estimates As part of the City’s desired expansion of its storm sewer system on the south side of the City, storm sewers extending through the former Butler Company were considered. The removal and offsite disposal of fire damaged debris/structures, chemical containers, and impacted soils would be required to facilitate pipeline construction. A cost estimate for removal was prepared; however, after further review, the City determined the potential routing of a storm sewer main through this property was no longer an option, and hence, soil capping could be pursued. A cost estimate for soil capping and soil removal were presented to IBP in e-correspondence dated July 17, 2020. The estimate cost for soil capping was $158,649. However, please be advised the extended cost for clearing and grubbing was not included in this calculation and with clearing and grubbing included the estimated cost is $164,649. The estimated removal cost was $315,747. Both estimated included preparations and workplans, container removal, abatement, and groundwater monitoring. 4.0 REMEDIATION APPROACH AND RATIONALE
As a part of selecting an appropriate environmental remedy, the nature, contaminant concentrations and distribution of constituents of concern were evaluated, as well as potential exposure risk to human health and the environment. Based on this evaluation, soil barrier installation is proposed, and soil barrier installation is proposed at three areas where previous investigation results indicate lead and/or arsenic concentrations exceed industrial direct contact screening levels. Site work will also include the removal and offsite disposal of fire damaged debris/structures by City personnel with hazardous materials awareness training, the disposal of red colored lead-based paint during demolition under the supervision of SES, the removal/disposal of asbestos by a licensed abatement contractor, and the removal/disposal of chemical containers under the supervision of a CHMM. Groundwater monitoring is also proposed to confirm contaminants in soil have not leached to groundwater. Finally, a risk-based environmental remedy is anticipated to address any residual contaminants in soil/fill pursuant to the BFF Comfort Letter and Environmental Restrictive Covenant (ERC) issued in IBP correspondence dated January 18, 2019. SES anticipates IBP will prepare a revised ERC following implementation and completion of this RWP. The ERC which is incorporated with the comfort letter is provided as Appendix F. 4.1 Source and Nature of COCs Constituents of concern documented in surface and near surface soils/fill are the focus of this RWP, as well as lead-based paint, and asbestos. There has been no known illegal dumping at the site. However, the site has had a long industrial history dating from 1888 to 1997. The Butler Company site (circa 1888 to 1958) included a machine shop, foundry, paint shop, pipe shed, lumber shed, tin shop and storage building. A major fire destroyed the three-story storage building on the southwest portion of the site in 1958. A distributor of plumbing, heating and cooling parts occupied the site in the 1960s. The building closest to the railroad track to the north of the property was used by the Carbola Chemical Company in approximately the late 1950’s and early 1960’s. The Butler Company continued as a jobber of electrical, plumbing, heating, cooling, and well drilling supplies until the facility was closed in 1997.
Remediation Work Plan BFD #4170705
Page 15
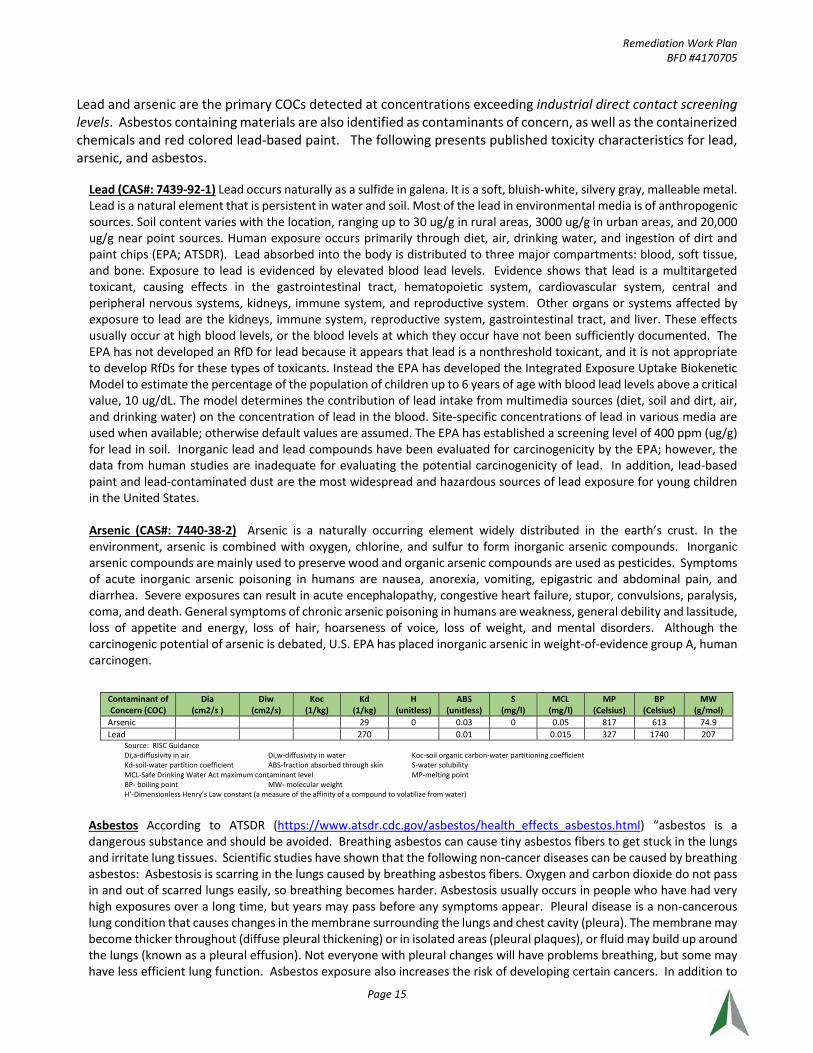
Lead and arsenic are the primary COCs detected at concentrations exceeding industrial direct contact screening levels. Asbestos containing materials are also identified as contaminants of concern, as well as the containerized chemicals and red colored lead-based paint. The following presents published toxicity characteristics for lead, arsenic, and asbestos.
Lead (CAS#: 7439-92-1) Lead occurs naturally as a sulfide in galena. It is a soft, bluish-white, silvery gray, malleable metal. Lead is a natural element that is persistent in water and soil. Most of the lead in environmental media is of anthropogenic sources. Soil content varies with the location, ranging up to 30 ug/g in rural areas, 3000 ug/g in urban areas, and 20,000 ug/g near point sources. Human exposure occurs primarily through diet, air, drinking water, and ingestion of dirt and paint chips (EPA; ATSDR). Lead absorbed into the body is distributed to three major compartments: blood, soft tissue, and bone. Exposure to lead is evidenced by elevated blood lead levels. Evidence shows that lead is a multitargeted toxicant, causing effects in the gastrointestinal tract, hematopoietic system, cardiovascular system, central and peripheral nervous systems, kidneys, immune system, and reproductive system. Other organs or systems affected by exposure to lead are the kidneys, immune system, reproductive system, gastrointestinal tract, and liver. These effects usually occur at high blood levels, or the blood levels at which they occur have not been sufficiently documented. The EPA has not developed an RfD for lead because it appears that lead is a nonthreshold toxicant, and it is not appropriate to develop RfDs for these types of toxicants. Instead the EPA has developed the Integrated Exposure Uptake Biokenetic Model to estimate the percentage of the population of children up to 6 years of age with blood lead levels above a critical value, 10 ug/dL. The model determines the contribution of lead intake from multimedia sources (diet, soil and dirt, air, and drinking water) on the concentration of lead in the blood. Site-specific concentrations of lead in various media are used when available; otherwise default values are assumed. The EPA has established a screening level of 400 ppm (ug/g) for lead in soil. Inorganic lead and lead compounds have been evaluated for carcinogenicity by the EPA; however, the data from human studies are inadequate for evaluating the potential carcinogenicity of lead. In addition, lead-based paint and lead-contaminated dust are the most widespread and hazardous sources of lead exposure for young children in the United States. Arsenic (CAS#: 7440-38-2) Arsenic is a naturally occurring element widely distributed in the earth’s crust. In the environment, arsenic is combined with oxygen, chlorine, and sulfur to form inorganic arsenic compounds. Inorganic arsenic compounds are mainly used to preserve wood and organic arsenic compounds are used as pesticides. Symptoms of acute inorganic arsenic poisoning in humans are nausea, anorexia, vomiting, epigastric and abdominal pain, and diarrhea. Severe exposures can result in acute encephalopathy, congestive heart failure, stupor, convulsions, paralysis, coma, and death. General symptoms of chronic arsenic poisoning in humans are weakness, general debility and lassitude, loss of appetite and energy, loss of hair, hoarseness of voice, loss of weight, and mental disorders. Although the carcinogenic potential of arsenic is debated, U.S. EPA has placed inorganic arsenic in weight-of-evidence group A, human carcinogen.
Contaminant of Concern (COC)
Dia (cm2/s )
Diw (cm2/s)
Koc (1/kg)
Kd (1/kg)
H (unitless)
ABS (unitless)
S (mg/l)
MCL (mg/l)
MP (Celsius)
BP (Celsius)
MW (g/mol)
Arsenic 29 0 0.03 0 0.05 817 613 74.9 Lead 270 0.01 0.015 327 1740 207
Source: RISC Guidance Di,a-diffusivity in air Di,w-diffusivity in water Koc-soil organic carbon-water partitioning coefficient Kd-soil-water partition coefficient ABS-fraction absorbed through skin S-water solubility MCL-Safe Drinking Water Act maximum contaminant level MP-melting point BP- boiling point MW- molecular weight H’-Dimensionless Henry’s Law constant (a measure of the affinity of a compound to volatilize from water)
Asbestos According to ATSDR (https://www.atsdr.cdc.gov/asbestos/health_effects_asbestos.html) “asbestos is a dangerous substance and should be avoided. Breathing asbestos can cause tiny asbestos fibers to get stuck in the lungs and irritate lung tissues. Scientific studies have shown that the following non-cancer diseases can be caused by breathing asbestos: Asbestosis is scarring in the lungs caused by breathing asbestos fibers. Oxygen and carbon dioxide do not pass in and out of scarred lungs easily, so breathing becomes harder. Asbestosis usually occurs in people who have had very high exposures over a long time, but years may pass before any symptoms appear. Pleural disease is a non-cancerous lung condition that causes changes in the membrane surrounding the lungs and chest cavity (pleura). The membrane may become thicker throughout (diffuse pleural thickening) or in isolated areas (pleural plaques), or fluid may build up around the lungs (known as a pleural effusion). Not everyone with pleural changes will have problems breathing, but some may have less efficient lung function. Asbestos exposure also increases the risk of developing certain cancers. In addition to
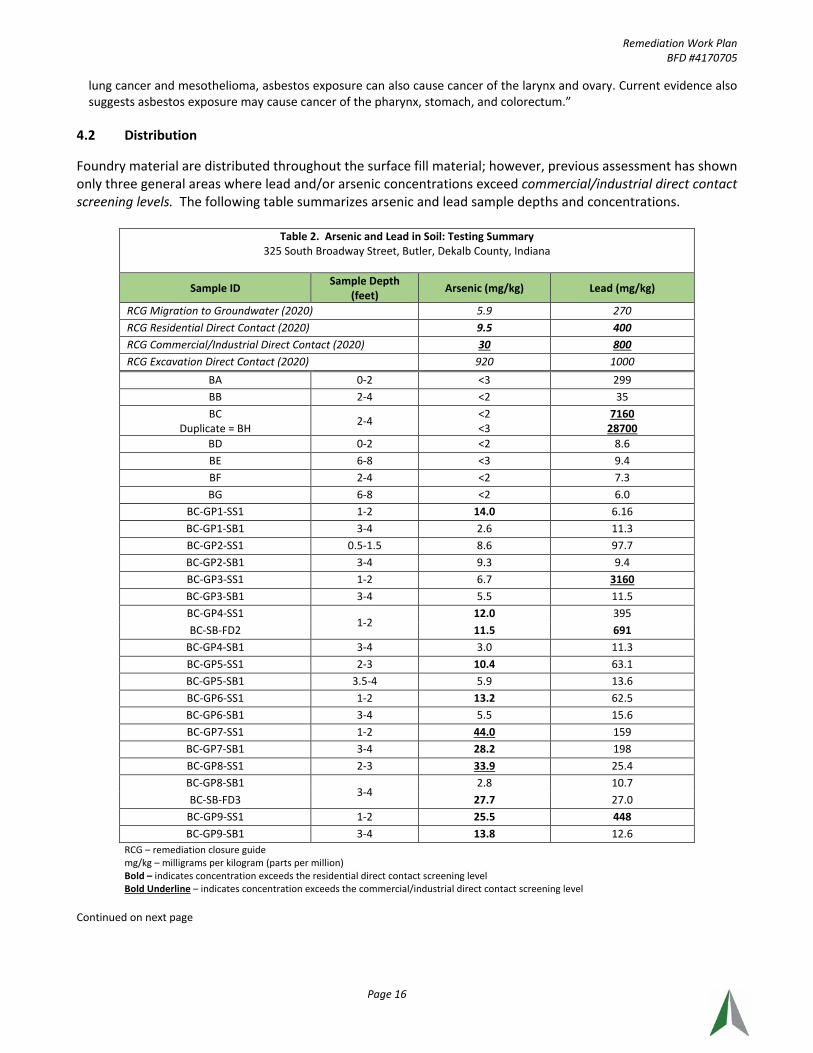
Remediation Work Plan BFD #4170705
Page 16
lung cancer and mesothelioma, asbestos exposure can also cause cancer of the larynx and ovary. Current evidence also suggests asbestos exposure may cause cancer of the pharynx, stomach, and colorectum.”
4.2 Distribution
Foundry material are distributed throughout the surface fill material; however, previous assessment has shown only three general areas where lead and/or arsenic concentrations exceed commercial/industrial direct contact screening levels. The following table summarizes arsenic and lead sample depths and concentrations.
Table 2. Arsenic and Lead in Soil: Testing Summary 325 South Broadway Street, Butler, Dekalb County, Indiana
Sample ID Sample Depth (feet) Arsenic (mg/kg) Lead (mg/kg)
RCG Migration to Groundwater (2020) 5.9 270 RCG Residential Direct Contact (2020) 9.5 400 RCG Commercial/Industrial Direct Contact (2020) 30 800 RCG Excavation Direct Contact (2020) 920 1000
BA 0-2 <3 299 BB 2-4 <2 35 BC
Duplicate = BH 2-4 <2 <3
7160 28700
BD 0-2 <2 8.6 BE 6-8 <3 9.4 BF 2-4 <2 7.3 BG 6-8 <2 6.0
BC-GP1-SS1 1-2 14.0 6.16 BC-GP1-SB1 3-4 2.6 11.3 BC-GP2-SS1 0.5-1.5 8.6 97.7 BC-GP2-SB1 3-4 9.3 9.4 BC-GP3-SS1 1-2 6.7 3160 BC-GP3-SB1 3-4 5.5 11.5 BC-GP4-SS1
1-2 12.0 395
BC-SB-FD2 11.5 691 BC-GP4-SB1 3-4 3.0 11.3 BC-GP5-SS1 2-3 10.4 63.1 BC-GP5-SB1 3.5-4 5.9 13.6 BC-GP6-SS1 1-2 13.2 62.5 BC-GP6-SB1 3-4 5.5 15.6 BC-GP7-SS1 1-2 44.0 159 BC-GP7-SB1 3-4 28.2 198 BC-GP8-SS1 2-3 33.9 25.4 BC-GP8-SB1
3-4 2.8 10.7
BC-SB-FD3 27.7 27.0 BC-GP9-SS1 1-2 25.5 448 BC-GP9-SB1 3-4 13.8 12.6
RCG – remediation closure guide mg/kg – milligrams per kilogram (parts per million) Bold – indicates concentration exceeds the residential direct contact screening level Bold Underline – indicates concentration exceeds the commercial/industrial direct contact screening level
Continued on next page

Remediation Work Plan BFD #4170705
Page 17
Table 2. Arsenic and Lead in Soil: Testing Summary 325 South Broadway Street, Butler, Dekalb County, Indiana
Sample ID Sample Depth (feet) Arsenic (mg/kg) Lead (mg/kg)
RCG Migration to Groundwater (2020) 5.9 270 RCG Residential Direct Contact (2020) 9.5 400 RCG Commercial/Industrial Direct Contact (2020) 30 800 RCG Excavation Direct Contact (2020) 920 1000
BC-GP10-SS1 1-2 11.6 158 BC-GP11-SS1 0.5-1.5 15.0 282 BC-GP12-SS1 1-2 3.1 84.7 BC-GP13-SS1
1-2 13.5 137
BC-SB-FD1 17.1 150 BC-GP14-SS1 0.5-1.5 49.2 156 BC-GP15-SS1 0.5-1 12.8 20.8 BC-GP3-N5
1-2 NA 51.7
BC-SB-FD4 NA 228 BC-GP3-E5 1-2 NA NA (XRF = 101)
BC-GP3-E10 1-2 NA 75.6 BC-GP3-W5 1-2 NA 307
BC-GP3-W10 1-2 NA NA (XRF = 12) BC-GP3-S5 1-2 NA NA (XRF = 380)
BC-GP3-S10 1-2 NA 660 BC-GP16-N5 1-2 NA 49.2
BC-GP16-N10 1-2 NA NA (XRF = 87) BC-GP16-E5 1-2 NA NA (XRF = 448)
BC-GP16-E10 1-2 NA 4470 BC-GP16-W5 1-2 NA 964
BC-GP16-W10 1-2 NA NA (XRF = 94) BC-GP16-S5 1-2 NA NA (XRF = 141)
BC-GP16-S10 1-2 NA 135 RCG – remediation closure guide11 mg/kg – milligrams per kilogram (parts per million) Bold – indicates concentration exceeds the residential direct contact screening level Bold Underline – indicates concentration exceeds the commercial/industrial direct contact screening level
Based on these tabulated results and site mapping contaminant concentrations exceed RCG Commercial/Industrial Direct Contact Screening Levels at the following three generalized areas. The areas are also depicted on Figure 5 and soil barrier construction has been selected to isolate these areas.
Area 1) Lead contamination at southwest portion of site at sampling locations BC-GP-3- SS1 (1-2) and BC-GP3-S10 (1-2).
Area 2) Arsenic contamination at east central portion of site at sampling locations BC-GP7-SS1 (1-2), BC-GP-8-SS1 (2-3) and BC-GP14-SS1 (0.5-1.5).
Area 3) Arsenic and lead contamination at northeast portion of site at sampling locations BC, BC-GP16-E10 (1-2), and BC-GP-16-W5 (1-2).
Asbestos containing materials (ACMs) were identified in the East Central Building debris pile and the North Building. ACMs included transite panels, and roofing materials. Abatement will be conducted by EMS a licensed abatement contractor with monitoring by SES. A chemical inventory of petroleum and/or hazardous substances remaining on site was completed. Totes, drums, small containers (<10 gallons) of paints, dyes, and water filtration chemicals were identified during the

Remediation Work Plan BFD #4170705
Page 18
inventory. Small containers were inventoried as a ‘lab pack’ for potential disposal at a Tradebe disposal facility. Universal wastes and larger containers were also inventoried, and profiles were prepared. Totes containing sand/sludge filtration material were observed inside and outside of the north building. Removal and disposal will be completed under the supervision of a CHMM. Segregation of metal for scrap metal recycling is proposed and the red colored paint on metal surfaces will seek regulatory recycling exclusion via the RCRA Scrap Metal Exemption. Segregation of red colored paint on wood surfaces and disposal at an approved, licensed facility are proposed. 4.3 Baseline Ecological Assessment
A baseline ecological assessment was conducted to determine if any critical habitats exist on or near the site. The assessment included a review of the U.S. Geological Survey 7.5-minute topographic map to identify features such as parks, preserves, and other special-use areas within a one-mile radius of the site; a visit to the property to identify wildlife, vegetation, and critical habitats in the near vicinity; and online database review of governmental and regulatory agencies having jurisdiction over protected species to identify state-listed and proposed endangered and threatened animal and plant species and wetlands within the area.
Topographic Map. The area approximately 500 feet to the east is identified as a marsh/wetland area. No other significant
potential ecological features were noted within the immediate site vicinity. Site Visit. The site was visually inspected and ecological habitats were not discernible due to the existing debris. The inspection revealed grass, scrub vegetation and gravel over the majority of the site surface, as well as many debris piles. The west portion of the site is wooded. Streets border the site to the west and south and railroad property is located to the north. Residential properties are located to the south and a library is located adjacent west of the site. Governmental Database. Online information was obtained from the following agencies: U.S. Forest Service, National Park Service, U.S. Department of Fish and Wildlife Service, and the Indiana Department of Natural Resources (DNR). No registered forests or parks were identified at or adjacent to the site. The U.S. Department of Fish and Wildlife Service National Wetlands Inventory (Appendix E) identified a Freshwater Forested/Shrub Wetland area to the east and extending onto the northeast portion of the site. In addition, a Freshwater Pond was identified approximately 1200 feet to the southeast. A DNR listing of endangered, threatened, and rare species for Dekalb County is provided in Appendix E. Several types of mollusk, insect, fish, amphibian, reptile, bird, mammal, and vascular plant are listed, as well as high-quality natural communities. U.S. Department of Fish and Wildlife: Environmental Conservation Online System (Appendix E) identified the bald eagle, Indiana bat, and northern long-eared bat as threatened or endangered species.
In summary, the Freshwater Forested/Shrub Wetland that extends onto the northeast portion of the site may be a potentially susceptible ecological area and habitat for animal species. Geologically susceptible areas (e.g., surface-water bodies, karstic bedrock areas, etc.) have not been identified at or immediately surrounding the site. 4.4 Identification and Evaluation of Potential Human Receptors
Human receptors that might be potentially exposed to COCs were identified by inspecting the site property and adjacent properties, and reviewing published site maps, and reports detailing site conditions. The following potential receptors were identified, and exposure risk evaluated. • Potentially susceptible areas located adjacent to the site include residences to the south and a library/recreation area
to the west. A potential exposure route through ingesting wind-blown contaminated dust currently exists.

Remediation Work Plan BFD #4170705
Page 19
• There is a risk of surface runoff/erosion/soil washing migration to offsite areas and/or storm sewers given the current fire-damaged state of the site.
• Several additional potentially susceptible areas (church, day care, and schools) occur in the outlying area. These areas are not considered at risk due to their location and distance from the site.
• Lead/arsenic occurs in surface and near surface soils/fill and a potential route of exposure through ingesting/inhaling
wind-blown contaminated dust currently exists, • Transient site workers are identified as receptors, as well as maintenance personnel and caretakers. A potential route
of exposure through direct contact or ingestion of impacted surface and near surface material currently exists. • VOCs were not detected, and vapor intrusion into adjacent building structures is not a complete exposure pathway.
• The site is located within a wellhead protection area. Lead/arsenic impact is limited to the near surface and there is
no indication groundwater has been impacted. The scenario of impacting a water supply is assigned a negligible risk. • There are no known preferential migration pathways to a receptor. • Construction workers involved with any site redevelopment are identified as receptors. Routes of exposure would
include incidental direct contact and ingestion/inhalation of impacted soil. This exposure scenario is assigned a moderate risk.
• If unrestricted access to the site is allowed, there could be an exposure risk to adults/children via direct contact, and
ingestion. This exposure scenario is assigned a moderate risk. • Under an unrestricted access scenario, offsite transport of constituents of concern through physical tracking of soil by
people, vehicles, or equipment would also be possible. This exposure scenario is assigned a negligible risk. In summary, constituents of concern have been documented in near surface soils/fill at levels that pose an exposure risk for visitors, trespassers, and/or transient site workers and maintenance personnel. Ingestion or inhalation of wind-blown dust particles and surface runoff/erosion/soil washing migration to offsite areas and/or storm sewers are also identified as potential concerns. Inhalation of asbestos is another potential exposure pathway and chemical containers and lead-based paint should be removed/disposal to eliminate exposure hazards. 4.5 Soil Barrier
Soil barrier construction is proposed to mitigate the following potential exposure risks resulting from arsenic and lead occurrence in the surface and near surface at southwest portion of site at sampling locations BC-GP-3- SS1 (1-2) and BC-GP3-S10 (1-2); at east central portion of site at sampling locations BC-GP7-SS1 (1-2), BC-GP-8-SS1 (2-3) and BC-GP14-SS1 (0.5-1.5); and at northeast portion of site at sampling locations BC, BC-GP16-E10 (1-2), and BC-GP-16-W5 (1-2).
1) Dermal contact with COCs in surface soils; 2) Ingestion of COC in surface soils; 3) Wind transport of particulates; 4) Stormwater transport of particulates; and 5) Physical tracking of COC in soil.
Soil barrier construction was selected for three areas where contaminant concentrations exceed RCG Commercial/Industrial Direct Contact Screening Levels. Soil barrier areas are depicted on Figure 5 and explained in the following narratives.

Remediation Work Plan BFD #4170705
Page 20
Area 1) Lead contamination at southwest portion of site at sampling locations BC-GP-3- SS1 (1-2) and BC-GP3-S10 (1-2). IDEM’s Technical Guidance Document titled Engineering Control: Covers created on May 26, 2009 and updated on September 20, 2017 specifies a soil barrier at least two feet in thickness would be appropriate to mitigate exposure. Since COC concentrations exceed commercial/industrial direct contact screening levels at a depth of one foot, an additional one foot of clean soil will be applied over this area to complete the soil barrier. Six inches of loam will be applied as the base material for the barrier and six inches of topsoil will be applied at the surface.
Area 2) Arsenic contamination at east central portion of site at sampling locations BC-GP7-SS1 (1-2), BC-GP-8-SS1 (2-3) and BC-GP14-SS1 (0.5-1.5). Approximately one foot of clean soil (6-inch loam base and 6-inches of topsoil) will be applied over most of this area. The south portion within the area of BC-GP14-SS1 will included 12 inches of loam base and 6 inches of topsoil.
Area 3) Arsenic and lead contamination at northeast portion of site at sampling locations BC, BC-GP16-E10 (1-2), and BC-GP-16-W5 (1-2). Approximately one foot of clean soil (6-inch loam base and 6-inches of topsoil) will be applied at this area.
Barrier construction will initiate after the removal of surface debris generated during the facility fire. Clean soil will be applied over Areas #1, #2, and #3 (Figure 5). As a standard practice and in general accordance with IBP guidance, the following task implementation sequence will be followed to ensure the protection of human health and the environment:
1. Prior to constructing the soil barrier, surface debris from the fire will be removed. 2. An XRF instrument will be utilized to assess arsenic and lead concentrations in existing soils at the perimeter of the
proposed soil barriers (XRF screening of surface material and of soils/fill at a depth of one foot). At least two samples will be collected from each area and submitted for arsenic and lead analysis in accordance with SW 846 Method 6010.
3. Dust suppression efforts will be maintained throughout the soil barrier construction period. 4. Soil to be utilized for barrier construction will be clean base materials sourced from a local cemetery (Butler
Cemetery, County Road 28). The clean base material is stockpiled at the cemetery and consists of excess spoil soils from graves. Topsoil will be obtained at Stafford Gravel Inc., (425 Co Road 79, Butler, IN 46721).
5. Soil selected for barrier construction will be screened for potential contaminants (RCRA 8 metals, SVOCs/PAHs, and VOCs). Testing will be conducted on five representative samples obtained from the cemetery source area (one sample per 500 tons of soil to be used for capping). Two representative samples of topsoil will also be obtained. Soil will be acceptable for use as a barrier if contaminant concentrations are less than residential direct contact screening levels.
6. The representative confirmation samples will be collected and submitted for laboratory VOC, SVOC/PAHs, and RCRA 8 metals analyses. Samples will be placed in laboratory provided sample containers. Containers will be properly labeled, entered into chain-of-custody documentation, and placed into an ice-filled cooler for shipment to the laboratory. All retained soil samples will be promptly delivered to a sub-contract laboratory for analyses in accordance with SW846 Methods. QA/QC samples consisting of field duplicates and MS/MSD samples will be retained per 20 samples. A level IV analytical data package will be requested from the laboratory.
7. In the event a confirmation sample exhibits contaminant concentrations exceeding residential direct contact screening levels, the sample representing the soil stockpiled area will be utilized for soil capping.
8. Accepted clean base soils be applied across Area #1, Area #2, and Area #3 until the desired barrier thickness is attained. SES will observe the application process and obtain measurements regarding barrier thickness and extent. The base soils will be placed in 6-inch loose lifts and compacted using a mechanical sheep-foot vibrating compactor to 90% Modified Proctor density. Soil will be removed from equipment tires/tracks (if applicable) before leaving the site.
a. Soil barrier surface shall slope so as to drain with no depressions to catch water. b. Around perimeter of each soil barrier area, soil will be sloped 4:1. c. Surfaces will be fine graded by raking. d. SES will approve final grade elevations before seeding or other landscaping operations begin. e. Any undulations or irregularities in the surface shall be leveled out before seeding operations begin. f. Grading and seeding operations will be conducted at all surfaces disturbed during site work, including soil
barrier areas, and traveled surfaces.

Remediation Work Plan BFD #4170705
Page 21
9. Standard fescue (grass seed) will be planted across the disturbed areas including barrier construction areas. Work shall proceed as quickly as the site or portions of the site become available and as allowed by the seasonal limitations outlined under Planting Season. Extensions of this deadline may be granted with sufficient proof shown that conditions outside the contractor’s control have prevented completion of the project.
i. Planting Season: Seeding shall be August 15 to October 30 and April 15 to June 1. 10. Seed mixtures may consist of any of the following Turf-type tall fescues, provided at least 3 varieties are mixed in
a blend, and no variety is more than forty percent (40%) of the mix. The seeding rate will be around 5 lbs per 1,000 square feet.
11. Soil barrier mapping will be conducted and a Global Navigation Satellite System (GNSS) - Geo 7X Centimeter Edition (Seiler Geospatial Division) or alternate mechanism utilized for data reproduction.
12. Soil barrier inspections will be conducted annually by City personnel or a City designated representative. A Remediation Completion Report will be prepared to document groundwater monitoring, soil barrier construction, soil sampling methods, and laboratory testing results. Site maps will be developed that clearly and accurately depict the barrier areas, monitor wells, and final sampling results. The report appendix will include characterization data, loam and topsoil documentation, photographs, and other information derived from implementation. 4.6 Groundwater Monitoring
Groundwater monitoring will be conducted at up to five (5) monitor wells for two quarters to confirm contaminants in soil have not leached to groundwater. Groundwater monitor wells and groundwater monitoring will be conducted at the three previously described general areas, as well as at the northwest and southeast portions of the site as shown on Figure 6 (Groundwater Monitoring Areas). The following task implementation sequence is anticipated:
1. Borings will be advanced using direct-push probing methods, with borings extended to a depth of approximately 28
feet. All soil samples will be visually inspected in the field by a SES geologist and classified according to color, texture, and relative moisture content in accordance with ASTM Standard D 2488. A portion of each sample interval will be equally divided and placed in a plastic container for headspace analysis using a PID instrument. Soil sample testing is not anticipated at this time. To limit the generation of soil cuttings, wells may be installed using geoprobe direct push technology and in this case pre-pack well screens will be used. A permanent groundwater monitor well will be installed at each boring location. Wells will be constructed using conventional 2-inch, PVC casing, and a 10-foot 0.010-slotted screen (pre-pack screen for geoprobe install). Well screens will be positioned between 18 and 28 feet (but subject to observed soil conditions). Washed, commercial, quartz sand pack will be placed around the screened interval to a level approximately one foot above the screen and capped with 2 feet of bentonite. Grout will then be placed from the top of the bentonite seal to the ground surface. The wells will be finished with a watertight expansion seal, and a protective steel cover set in concrete, flush with grade.
2. Following well construction, groundwater will be purged to remove fines and to improve connection with the water bearing formation. Relative elevations will then be established for the top of each point/well using standard level survey methods. Elevations will be established to an accuracy of 0.01 feet. A horizontal control survey will also be conducted to locate the position of each well relative to significant site features.
3. On a quarterly basis, for a period of two quarters, groundwater samples will be collected from the monitor well locations. Sampling will be initiated by removing the well caps, and then allowing sufficient time for groundwater levels to equalize with ambient pressure conditions. The depth to water will then be gauged at each monitor well. Gauging will be conducted using an electronic water level indicator with an accuracy of 0.01 feet. The water level indicator will be cleaned with a detergent solution and tap water rinse prior each measurement. Following gauging, groundwater samples will be collected using low flow/low stress techniques. A small-diameter low-flow bladder pump will be used to purge and sample monitor wells. The purge rate will be set not to exceed 500 milliliters per minute (ml/min). During purging, regardless of the sample type or well recovery, field indicator parameters will be monitored and documented. These parameters are measured to document that the purging procedure is adequate, and that the stagnant water in the well has been removed. These parameters will begin to stabilize as purging

Remediation Work Plan BFD #4170705
Page 22
continues and should completely stabilize at the end of well purging. Turbidity, dissolved oxygen, oxygen reduction potential (ORP), specific conductivity, pH, and temperature will be measured. After stable conditions are established, water samples will be collected using the bladder pump and discharged directly into the appropriate sample containers. The following sample collection sequence will be followed for consistency:
a) Measure water level. b) Purging with mechanical bladder pump (low flow-low stress). c) After stable field readings are attained, collect sample under low flow conditions. d) Collect sample for volatile organics. e) Collect sample for semi-volatile organics, inorganics, and then metals. f) Samples will be analyzed for VOCs, PAHs, RCRA 8 metals, copper, and zinc. These testing parameters are
consistent with the IWM Phase II Environmental Site Assessment Report. However, testing for PFAS in groundwater are not specified at this time, nor are PCBs. With Program approval, hexavalent chromium testing will be conducted to further evaluate total chromium. In addition, with Program approval, dissolved and total metals testing will be conducted if groundwater samples exhibit turbidity greater than 10 NTU.
g) Place samples into appropriate containers and follow sample preservation, packaging, and shipping procedures.
4. QA/QC samples will include a trip, equipment blank, and blind duplicate. A MS/MSD will be collected for the final
sampling event. Upon completion of a groundwater quarterly sampling event, a written report of analytical results and field activities will be submitted to the Program’s project manager for review.
5. Well abandonment activities will be conducted after obtaining Program approval.
6. As previously noted, a Remediation Completion Report will be prepared to document groundwater monitoring, soil barrier construction, soil sampling methods, and laboratory testing results.
4.7 Abatement and Disposal A chemical inventory of containers is complete and profiles for the chemical inventory will need to be issued to the selected disposal facilities. Following profile approvals, the containers may be removed from the site under the supervision of a CHMM. The containers will be transported under manifest control to the selected disposal facilities. A licensed abatement contractor will remove and dispose of asbestos-containing material (ACM) as transite panels using industry-accepted asbestos removal procedures. Roofing tar at the north building is ACM but characterized as non-friable and will not require abatement personnel. This roofing material will be disposed at a landfill during the debris removal process by City. Visually identified asbestos contaminated transite debris will be removed using methods such as vacuuming, wet wiping, wet brushing, wet scraping, and other state-of-the-art techniques or better. The selected contractor will remove and properly containerize all asbestos-contaminated debris/materials. The following general work practices are anticipated.
A. Contractor shall post “Asbestos Health Hazard" danger signs at all entrances to the work area. B. Access to the regulated work area shall be restricted to properly trained and authorized personnel. C. Critical barriers shall be installed at openings to work area and dropcloths shall be placed when ACM is not removed
substantially intact, or there is a potential for exposure above the PEL. D. Personal protective clothing and respirator protection shall be consistent with selected control methods and a
prepared HASP. E. Contractor shall remove ACM transite panels in debris piles at and near ‘smoke stack’. F. Transite panels shall be sprayed with amended water, and if applicable detached from surface without breaking
(as possible). G. As ACM is removed, simultaneously pack material in disposal bags. Twist neck of bags, bend over and seal with
minimum three wraps of duct tape. H. ACM shall remain wet until transferred to a closed receptacle.

Remediation Work Plan BFD #4170705
Page 23
I. The closed receptable will contain approved OSHA and US DOT labels, identifying the contents as asbestos materials, to each container/receptacle.
J. Prior to initiating disposal, Contractor shall prepare a special waste acceptance application on behalf of the Owner and then submit application and fee to Indiana Department of Environmental Management for review and approval.
K. Contractor shall prepare shipping papers for Owner. L. At completion of hauling and disposal of each load the Contractor will submit copy of waste manifest, chain of
custody form, and landfill receipt to Owner and Programs. M. Contractor will provide notification, in writing, that acceptable final clearance levels have been achieved.
After removal, SES will perform a complete final visual inspection of the entire work area. If any waste or chemical containers, debris or transite panel is found, Contractor will repeat the removal processes. Closeout documents shall be submitted to owner and Program at the conclusion of the project. Documents shall include but not limited to the following:
1. Copies of daily project sign-in/sign-out logs 2. Daily project log forms, 3. Equipment used, 4. Sample locations, dates, and times 5. Descriptions of unique or unusual events during the project. 6. A copy of final clearance certification, 7. Copies of waste manifests, 8. Copies of disposal application documents, 9. Visual inspection records, and 10. Any other relevant records.
4.8 Schedule
SES proposes the following task schedule. As previously noted, SES anticipates IBP will prepare a revised ERC following implementation and completion of this RWP.
Task Duration of Task (months) Remediation Work Plan Development 3 to 5 months Demolition (abatement and disposal) 2 to 3 months Soil Barrier Construction 1 to 2 months Groundwater Monitoring 6 to 7 months (install and quarterly sampling) Remediation Completion Report 1 to 2 months Agency Review and Site Closure 1 to 2 months
Total Duration 14 to 21 months 5.0 HEALTH AND SAFETY PLAN
A Health and Safety Plan was provided previously. The plan specifies a site safety coordinator, job task delegation, emergency procedures, and directions to the nearest emergency care facility. All field personnel conducting on-site activities will have completed OSHA 1910.120 40-hour Health and Safety Training, as well as annual eight-hour refresher training updates. All site personnel will be enrolled in a medical monitoring program. The site safety coordinator will review the health and safety plan with all site personnel prior to beginning work. Daily toolbox meetings will be conducted at the beginning of each day thereafter to assess unforeseen hazards and/or make modifications due to changes in site conditions. All site personnel will acknowledge participation in the safety meeting by signing and dating the health and safety plan.

Remediation Work Plan BFD #4170705
Page 24
6.0 QUALITY ASSURANCE
The overall QA objective is to develop and implement procedures for field sampling, chain of custody, laboratory analysis, and reporting that will provide results that are scientifically valid, and the levels of which are sufficient to meet Level IV DQOs. Field and quality assurance procedures are detailed in a report titled “Quality Assurance Project Plan (QAPP) – Revision 0” dated July 2020.
Remediation Work Plan BFD #4170705
Page 25
REFERENCES DeKalb County GIS Property Records EPA, Integrated Risk Information System (IRIS) Database, Office of Health and Environmental Assessment, U.S. Environmental Protection Agency. Federal Emergency Management Agency, Flood Insurance Rate Map for DeKalb County, Indiana, Panel 186 of 295, Map Number: 18033C0186E, Effective Date September 29, 2006 Google Earth™, Aerial Photograph from 2016 Gray, Henry H., Curtis H. Ault, and Stanley J. Keller, Bedrock Geologic Map of Indiana, Published 1987 Hydrogeologic Atlas of Aquifers in Indiana, U. S. Geological Survey, Water Resources Investigations Report 92-4142, 1994 Indiana Department Of Natural Resources, Division of Water, Water Well Database, 2019/2020. Indiana Department of Natural Resources, Oil and Gas Well Map Indiana Department of Environmental Management, Virtual File Cabinet Records IDEM, January 18, 2019, BFPP Comfort Letter and Institutional Controls IWM Consulting Group, July 31, 2019, Phase II Environmental Site Assessment Report Risk Assessment Information System (RAIS) Toxicity Profiles http://rais.ornl.gov/tox/profiles SES Environmental, November 10, 2017, Phase I Environmental Site Assessment SES Environmental, June 13, 2018, Phase II Environmental Screening Report SES Environmental, October 2018, Phase I Environmental Site Assessment SES Environmental, January 2019, Analysis of Brownfield Cleanup Alternatives SES Environmental, April 10, 2020, Health and Safety Plan SES Environmental, April 24, 2020, Sampling and Analysis Plan SES Environmental, June 8, 2020, Field Activity Report United States Department of Agriculture, Custom Soil Resource Report for DeKalb County, Indiana, Version
22, October 2, 2017 USGS Topographic Map, 7.5 Minute Series, Butler East, Indiana Quadrangle Map, Published 2016 U.S. Fish and Wildlife Service, Wetlands Map

Remediation Work Plan BFD #4170705
REMEDIATION WORK PLAN
FIGURES
The Butler Company 325 S Broadway St
Butler, DeKalb County, Indiana 46721 BFD #4170705

N
Butler East, Indiana 7.5 Minute Quadrangle Map (Published 2016)
SCALE 1:24000 (1”=2,000’) 1 ½ 0 1 Mile
CONTOUR INTERVAL 10 FEET
Site Boundaries Shown are Approximate Topographic Map Figure 1 The Butler Company 325 South Broadway Street Butler, DeKalb County, Indiana 46721 SES Project 2017-699
SITE


Bldg.
BC-GP14-SS1 (0.5-1.5')
2.5'
PROJECT
SCALE
DRAWN CHECKED
FILE
DATE FIGURE
LEGEND2020-295
dn gh
5/22/20 4
TITLE
LOCATION
Impact Extent and Utilities
The Butler Company325 South Broadway StreetButler, DeKalb County, Indiana
N
1" = 80' 2020295map
0 80'40'
EAST WILLOW STREET
SOU
TH B
ROAD
WAY
STR
EET
BUTLER PUBLIC
PARK
RESIDENTIAL
SEBERT OIL CO.BULK PLANT
RAILROAD TRACKS
LAUNDRY & CARWASH
(wooded)
Bldg.
Approximate site boundary
woodkiosk
Approximate former building foundations
Approximate locations of debris piles
1,775 sf
2,482 sf
7,427 sf965 sf
340 sf
6,028 sf
223 sf
SES Boring location (2018)
Fill sample location boringBC-GP1 through BC-GP9(9 locations)
Boring/temporary well locationBC-GP15 (1 location)
Attempted soil gas locationBC-SG1, BC-SG2, BC-SG3
Boring/temporary well locationwith PFAS Sampling, BC-GP10through BC-GP14 (5 locations)
LIBRARY
pp
pp
pp
pp
pp
pp
pp
pp
pp Power pole
BC-GP9
BC-GP14
BF
BC-GP15
BC-GP4
BG
BC-GP3-S10BC-GP3-S5
BC-GP3-N5 BC-GP3BC-GP3-E5
BC-GP3-E10
BC-GP3-W10BC-GP3-W5
BC-GP2
BE
BC-GP12BC-SG3
BD
BC-GP10
BA
BC-GP11
BC-GP1BC-GP5
BC-GP7
BC-SG2
BC-GP6
BB
BC-GP13
BC-GP8
BC-SG1
BC BC-GP16-N10BC-GP16-N5
BC-GP16-W5BC-GP16-W10
BC-GP16-S5BC-GP16-S10
BC-GP16-E5BC-GP16-E10
2.25'
2.5'
Notes: 1. Boring locations digitized from IWM mapping, 7/11/19
2.0'
3.0'
1.0'
2.5'
3.0'
7.0'
1.5'
1.0'
2.0'
3.0' 3.0'2.5'
2.5'
3.5'
3.75'
3.0'
4.5'
4.5'
4.0'
BC-GP7-SS1 (1-2')Arsenic 44.0
Arsenic 49.2
BC-GP3-SS1 (1-2')Lead 3160
BC-GP3-S10 (1-2')Lead 660
BC-GP8-SS1 (2-3')Arsenic 33.9
BC-GP16-E10 (1-2')Lead 4470
BC-GP16-W5 (1-2')Lead 964
BC/Duplicate (SES 2018)Arsenic 33.9Lead 28700
2. Soil testing results reported as mg/kg
ImpactArea1
Impact Area 2
ImapctArea 3
557 sf
300 sf
300 sf
494 sf
286 sf
717 sf
mh Manhole
mh
mh
48" Storm sewer
wat
er
wat
er
mh
sew
er
3. Only arsenic and lead concentrations exceeding IDSLs are shown

Bldg.
BC-GP14-SS1 (0.5-1.5')
2.5'
PROJECT
SCALE
DRAWN CHECKED
FILE
DATE FIGURE
LEGEND2020-295
dn gh
5/22/20 5
TITLE
LOCATION
SOIL BARRIER AREAS
The Butler Company325 South Broadway StreetButler, DeKalb County, Indiana
N
1" = 80' 2020295map
0 80'40'
EAST WILLOW STREET
SOU
TH B
ROAD
WAY
STR
EET
BUTLER PUBLIC
PARK
RESIDENTIAL
SEBERT OIL CO.BULK PLANT
RAILROAD TRACKS
LAUNDRY & CARWASH
(wooded)
Bldg.
Approximate site boundary
woodkiosk
Approximate former building foundations
Approximate locations of debris piles
1,775 sf
2,482 sf
7,427 sf965 sf
340 sf
6,028 sf
223 sf
SES Boring location (2018)
Fill sample location boringBC-GP1 through BC-GP9(9 locations)
Boring/temporary well locationBC-GP15 (1 location)
Attempted soil gas locationBC-SG1, BC-SG2, BC-SG3
Boring/temporary well locationwith PFAS Sampling, BC-GP10through BC-GP14 (5 locations)
LIBRARY
pp
pp
pp
pp
pp
pp
pp
pp
pp Power pole
BC-GP9
BC-GP14
BF
BC-GP15
BC-GP4
BG
BC-GP3-S10BC-GP3-S5
BC-GP3-N5 BC-GP3BC-GP3-E5
BC-GP3-E10
BC-GP3-W10BC-GP3-W5
BC-GP2
BE
BC-GP12BC-SG3
BD
BC-GP10
BA
BC-GP11
BC-GP1BC-GP5
BC-GP7
BC-SG2
BC-GP6
BB
BC-GP13
BC-GP8
BC-SG1
BC BC-GP16-N10BC-GP16-N5
BC-GP16-W5BC-GP16-W10
BC-GP16-S5BC-GP16-S10
BC-GP16-E5BC-GP16-E10
2.25'
2.5'
Notes: 1. Boring locations digitized from IWM mapping, 7/11/19
2.0'
3.0'
1.0'
2.5'
3.0'
7.0'
1.5'
1.0'
2.0'
3.0' 3.0'2.5'
2.5'
3.5'
3.75'
3.0'
4.5'
4.5'
4.0'
BC-GP7-SS1 (1-2')Arsenic 44.0
Arsenic 49.2
BC-GP3-SS1 (1-2')Lead 3160
BC-GP3-S10 (1-2')Lead 660
BC-GP8-SS1 (2-3')Arsenic 33.9
BC-GP16-E10 (1-2')Lead 4470
BC-GP16-W5 (1-2')Lead 964
BC/Duplicate (SES 2018)Arsenic 33.9Lead 28700
2. Soil testing results reported as mg/kg
SOIL BARRIER AREA 1
SOIL BARRIER AREA 2
SOIL BARRIER AREA 3
557 sf
300 sf
300 sf
494 sf
286 sf
717 sf
mh Manhole
mh
mh
48" Storm sewer
wat
er
wat
er
mh
sew
er
3. Only arsenic and lead concentrations exceeding IDSLs are shown
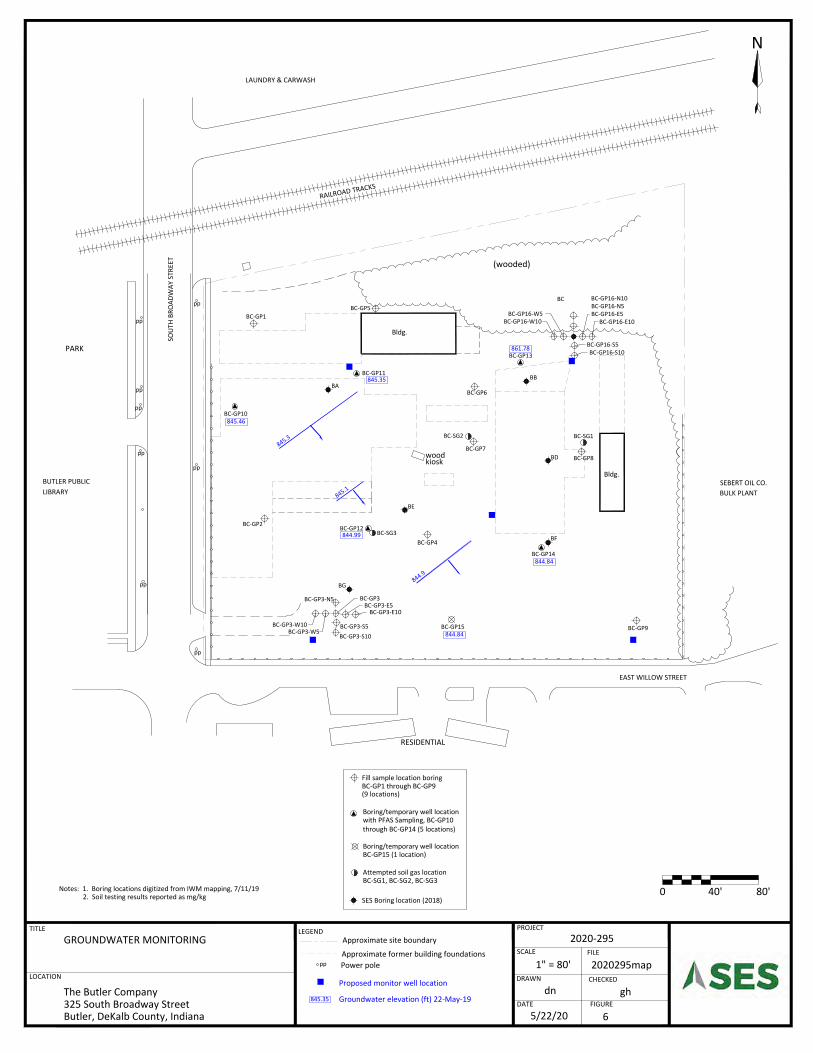
Bldg.
PROJECT
SCALE
DRAWN CHECKED
FILE
DATE FIGURE
LEGEND2020-295
dn gh
5/22/20 6
TITLE
LOCATION
GROUNDWATER MONITORING
The Butler Company325 South Broadway StreetButler, DeKalb County, Indiana
N
1" = 80' 2020295map
0 80'40'
EAST WILLOW STREET
SOU
TH B
ROAD
WAY
STR
EET
BUTLER PUBLIC
PARK
RESIDENTIAL
SEBERT OIL CO.BULK PLANT
RAILROAD TRACKS
LAUNDRY & CARWASH
(wooded)
Bldg.
Approximate site boundary
woodkiosk
Approximate former building foundations
SES Boring location (2018)
Fill sample location boringBC-GP1 through BC-GP9(9 locations)
Boring/temporary well locationBC-GP15 (1 location)
Attempted soil gas locationBC-SG1, BC-SG2, BC-SG3
Boring/temporary well locationwith PFAS Sampling, BC-GP10through BC-GP14 (5 locations)
LIBRARY
pp
pp
pp
pp
pp
pp
pp
pp
pp Power pole
BC-GP9
BC-GP14
BF
BC-GP15
BC-GP4
BG
BC-GP3-S10BC-GP3-S5
BC-GP3-N5 BC-GP3BC-GP3-E5
BC-GP3-E10
BC-GP3-W10BC-GP3-W5
BC-GP2
BE
BC-GP12BC-SG3
BD
BC-GP10
BA
BC-GP11
BC-GP1BC-GP5
BC-GP7
BC-SG2
BC-GP6
BB
BC-GP13
BC-GP8
BC-SG1
BC BC-GP16-N10BC-GP16-N5
BC-GP16-W5BC-GP16-W10
BC-GP16-S5BC-GP16-S10
BC-GP16-E5BC-GP16-E10
Notes: 1. Boring locations digitized from IWM mapping, 7/11/192. Soil testing results reported as mg/kg
Proposed monitor well location
845.35
845.46
861.78
844.99
844.84
844.84
845.35 Groundwater elevation (ft) 22-May-19
845.3
845.1
844.9
Remediation Work Plan BFD #4170705
REMEDIATION WORK PLAN
APPENDIX A. USDA SOIL REPORT
The Butler Company 325 S Broadway St
Butler, DeKalb County, Indiana 46721 BFD #4170705

United StatesDepartment ofAgriculture
A product of the NationalCooperative Soil Survey,a joint effort of the UnitedStates Department ofAgriculture and otherFederal agencies, Stateagencies including theAgricultural ExperimentStations, and localparticipants
Custom Soil Resource Report for
De Kalb County, Indiana
NaturalResourcesConservationService
November 8, 2017

PrefaceSoil surveys contain information that affects land use planning in survey areas. They highlight soil limitations that affect various land uses and provide information about the properties of the soils in the survey areas. Soil surveys are designed for many different users, including farmers, ranchers, foresters, agronomists, urban planners, community officials, engineers, developers, builders, and home buyers. Also, conservationists, teachers, students, and specialists in recreation, waste disposal, and pollution control can use the surveys to help them understand, protect, or enhance the environment.
Various land use regulations of Federal, State, and local governments may impose special restrictions on land use or land treatment. Soil surveys identify soil properties that are used in making various land use or land treatment decisions. The information is intended to help the land users identify and reduce the effects of soil limitations on various land uses. The landowner or user is responsible for identifying and complying with existing laws and regulations.
Although soil survey information can be used for general farm, local, and wider area planning, onsite investigation is needed to supplement this information in some cases. Examples include soil quality assessments (http://www.nrcs.usda.gov/wps/portal/nrcs/main/soils/health/) and certain conservation and engineering applications. For more detailed information, contact your local USDA Service Center (https://offices.sc.egov.usda.gov/locator/app?agency=nrcs) or your NRCS State Soil Scientist (http://www.nrcs.usda.gov/wps/portal/nrcs/detail/soils/contactus/?cid=nrcs142p2_053951).
Great differences in soil properties can occur within short distances. Some soils are seasonally wet or subject to flooding. Some are too unstable to be used as a foundation for buildings or roads. Clayey or wet soils are poorly suited to use as septic tank absorption fields. A high water table makes a soil poorly suited to basements or underground installations.
The National Cooperative Soil Survey is a joint effort of the United States Department of Agriculture and other Federal agencies, State agencies including the Agricultural Experiment Stations, and local agencies. The Natural Resources Conservation Service (NRCS) has leadership for the Federal part of the National Cooperative Soil Survey.
Information about soils is updated periodically. Updated information is available through the NRCS Web Soil Survey, the site for official soil survey information.
The U.S. Department of Agriculture (USDA) prohibits discrimination in all its programs and activities on the basis of race, color, national origin, age, disability, and where applicable, sex, marital status, familial status, parental status, religion, sexual orientation, genetic information, political beliefs, reprisal, or because all or a part of an individual's income is derived from any public assistance program. (Not all prohibited bases apply to all programs.) Persons with disabilities who require
2

alternative means for communication of program information (Braille, large print, audiotape, etc.) should contact USDA's TARGET Center at (202) 720-2600 (voice and TDD). To file a complaint of discrimination, write to USDA, Director, Office of Civil Rights, 1400 Independence Avenue, S.W., Washington, D.C. 20250-9410 or call (800) 795-3272 (voice) or (202) 720-6382 (TDD). USDA is an equal opportunity provider and employer.
3

ContentsPreface.................................................................................................................... 2How Soil Surveys Are Made..................................................................................5Soil Map.................................................................................................................. 8
Soil Map................................................................................................................9Legend................................................................................................................10Map Unit Legend................................................................................................ 11Map Unit Descriptions.........................................................................................11
De Kalb County, Indiana................................................................................. 13BaB2—Blount silt loam, 1 to 4 percent slopes, eroded............................... 13Pe—Pewamo silty clay................................................................................14
References............................................................................................................16
4

How Soil Surveys Are MadeSoil surveys are made to provide information about the soils and miscellaneous areas in a specific area. They include a description of the soils and miscellaneous areas and their location on the landscape and tables that show soil properties and limitations affecting various uses. Soil scientists observed the steepness, length, and shape of the slopes; the general pattern of drainage; the kinds of crops and native plants; and the kinds of bedrock. They observed and described many soil profiles. A soil profile is the sequence of natural layers, or horizons, in a soil. The profile extends from the surface down into the unconsolidated material in which the soil formed or from the surface down to bedrock. The unconsolidated material is devoid of roots and other living organisms and has not been changed by other biological activity.
Currently, soils are mapped according to the boundaries of major land resource areas (MLRAs). MLRAs are geographically associated land resource units that share common characteristics related to physiography, geology, climate, water resources, soils, biological resources, and land uses (USDA, 2006). Soil survey areas typically consist of parts of one or more MLRA.
The soils and miscellaneous areas in a survey area occur in an orderly pattern that is related to the geology, landforms, relief, climate, and natural vegetation of the area. Each kind of soil and miscellaneous area is associated with a particular kind of landform or with a segment of the landform. By observing the soils and miscellaneous areas in the survey area and relating their position to specific segments of the landform, a soil scientist develops a concept, or model, of how they were formed. Thus, during mapping, this model enables the soil scientist to predict with a considerable degree of accuracy the kind of soil or miscellaneous area at a specific location on the landscape.
Commonly, individual soils on the landscape merge into one another as their characteristics gradually change. To construct an accurate soil map, however, soil scientists must determine the boundaries between the soils. They can observe only a limited number of soil profiles. Nevertheless, these observations, supplemented by an understanding of the soil-vegetation-landscape relationship, are sufficient to verify predictions of the kinds of soil in an area and to determine the boundaries.
Soil scientists recorded the characteristics of the soil profiles that they studied. They noted soil color, texture, size and shape of soil aggregates, kind and amount of rock fragments, distribution of plant roots, reaction, and other features that enable them to identify soils. After describing the soils in the survey area and determining their properties, the soil scientists assigned the soils to taxonomic classes (units). Taxonomic classes are concepts. Each taxonomic class has a set of soil characteristics with precisely defined limits. The classes are used as a basis for comparison to classify soils systematically. Soil taxonomy, the system of taxonomic classification used in the United States, is based mainly on the kind and character of soil properties and the arrangement of horizons within the profile. After the soil
5

scientists classified and named the soils in the survey area, they compared the individual soils with similar soils in the same taxonomic class in other areas so that they could confirm data and assemble additional data based on experience and research.
The objective of soil mapping is not to delineate pure map unit components; the objective is to separate the landscape into landforms or landform segments that have similar use and management requirements. Each map unit is defined by a unique combination of soil components and/or miscellaneous areas in predictable proportions. Some components may be highly contrasting to the other components of the map unit. The presence of minor components in a map unit in no way diminishes the usefulness or accuracy of the data. The delineation of such landforms and landform segments on the map provides sufficient information for the development of resource plans. If intensive use of small areas is planned, onsite investigation is needed to define and locate the soils and miscellaneous areas.
Soil scientists make many field observations in the process of producing a soil map. The frequency of observation is dependent upon several factors, including scale of mapping, intensity of mapping, design of map units, complexity of the landscape, and experience of the soil scientist. Observations are made to test and refine the soil-landscape model and predictions and to verify the classification of the soils at specific locations. Once the soil-landscape model is refined, a significantly smaller number of measurements of individual soil properties are made and recorded. These measurements may include field measurements, such as those for color, depth to bedrock, and texture, and laboratory measurements, such as those for content of sand, silt, clay, salt, and other components. Properties of each soil typically vary from one point to another across the landscape.
Observations for map unit components are aggregated to develop ranges of characteristics for the components. The aggregated values are presented. Direct measurements do not exist for every property presented for every map unit component. Values for some properties are estimated from combinations of other properties.
While a soil survey is in progress, samples of some of the soils in the area generally are collected for laboratory analyses and for engineering tests. Soil scientists interpret the data from these analyses and tests as well as the field-observed characteristics and the soil properties to determine the expected behavior of the soils under different uses. Interpretations for all of the soils are field tested through observation of the soils in different uses and under different levels of management. Some interpretations are modified to fit local conditions, and some new interpretations are developed to meet local needs. Data are assembled from other sources, such as research information, production records, and field experience of specialists. For example, data on crop yields under defined levels of management are assembled from farm records and from field or plot experiments on the same kinds of soil.
Predictions about soil behavior are based not only on soil properties but also on such variables as climate and biological activity. Soil conditions are predictable over long periods of time, but they are not predictable from year to year. For example, soil scientists can predict with a fairly high degree of accuracy that a given soil will have a high water table within certain depths in most years, but they cannot predict that a high water table will always be at a specific level in the soil on a specific date.
After soil scientists located and identified the significant natural bodies of soil in the survey area, they drew the boundaries of these bodies on aerial photographs and
Custom Soil Resource Report
6

identified each as a specific map unit. Aerial photographs show trees, buildings, fields, roads, and rivers, all of which help in locating boundaries accurately.
Custom Soil Resource Report
7

Soil MapThe soil map section includes the soil map for the defined area of interest, a list of soil map units on the map and extent of each map unit, and cartographic symbols displayed on the map. Also presented are various metadata about data used to produce the map, and a description of each soil map unit.
8

9
Custom Soil Resource ReportSoil Map
4588
270
4588
290
4588
310
4588
330
4588
350
4588
370
4588
390
4588
270
4588
290
4588
310
4588
330
4588
350
4588
370
4588
390
4588
410
677840 677860 677880 677900 677920 677940 677960 677980 678000 678020 678040
677840 677860 677880 677900 677920 677940 677960 677980 678000 678020 678040 678060
41° 25' 39'' N84
° 5
2' 1
8'' W
41° 25' 39'' N
84° 5
2' 8
'' W
41° 25' 34'' N
84° 5
2' 1
8'' W
41° 25' 34'' N
84° 5
2' 8
'' W
N
Map projection: Web Mercator Corner coordinates: WGS84 Edge tics: UTM Zone 16N WGS840 50 100 200 300
Feet0 15 30 60 90
MetersMap Scale: 1:1,040 if printed on A landscape (11" x 8.5") sheet.
Soil Map may not be valid at this scale.

MAP LEGEND MAP INFORMATION
Area of Interest (AOI)Area of Interest (AOI)
SoilsSoil Map Unit Polygons
Soil Map Unit Lines
Soil Map Unit Points
Special Point FeaturesBlowout
Borrow Pit
Clay Spot
Closed Depression
Gravel Pit
Gravelly Spot
Landfill
Lava Flow
Marsh or swamp
Mine or Quarry
Miscellaneous Water
Perennial Water
Rock Outcrop
Saline Spot
Sandy Spot
Severely Eroded Spot
Sinkhole
Slide or Slip
Sodic Spot
Spoil Area
Stony Spot
Very Stony Spot
Wet Spot
Other
Special Line Features
Water FeaturesStreams and Canals
TransportationRails
Interstate Highways
US Routes
Major Roads
Local Roads
BackgroundAerial Photography
The soil surveys that comprise your AOI were mapped at 1:15,800.
Warning: Soil Map may not be valid at this scale.
Enlargement of maps beyond the scale of mapping can cause misunderstanding of the detail of mapping and accuracy of soil line placement. The maps do not show the small areas of contrasting soils that could have been shown at a more detailed scale.
Please rely on the bar scale on each map sheet for map measurements.
Source of Map: Natural Resources Conservation ServiceWeb Soil Survey URL: Coordinate System: Web Mercator (EPSG:3857)
Maps from the Web Soil Survey are based on the Web Mercator projection, which preserves direction and shape but distorts distance and area. A projection that preserves area, such as the Albers equal-area conic projection, should be used if more accurate calculations of distance or area are required.
This product is generated from the USDA-NRCS certified data as of the version date(s) listed below.
Soil Survey Area: De Kalb County, IndianaSurvey Area Data: Version 22, Oct 2, 2017
Soil map units are labeled (as space allows) for map scales 1:50,000 or larger.
Date(s) aerial images were photographed: Jul 1, 2011—Sep 24, 2016
The orthophoto or other base map on which the soil lines were compiled and digitized probably differs from the background imagery displayed on these maps. As a result, some minor shifting of map unit boundaries may be evident.
Custom Soil Resource Report
10

Map Unit Legend
Map Unit Symbol Map Unit Name Acres in AOI Percent of AOI
BaB2 Blount silt loam, 1 to 4 percent slopes, eroded
3.0 92.7%
Pe Pewamo silty clay 0.2 7.3%
Totals for Area of Interest 3.3 100.0%
Map Unit DescriptionsThe map units delineated on the detailed soil maps in a soil survey represent the soils or miscellaneous areas in the survey area. The map unit descriptions, along with the maps, can be used to determine the composition and properties of a unit.
A map unit delineation on a soil map represents an area dominated by one or more major kinds of soil or miscellaneous areas. A map unit is identified and named according to the taxonomic classification of the dominant soils. Within a taxonomic class there are precisely defined limits for the properties of the soils. On the landscape, however, the soils are natural phenomena, and they have the characteristic variability of all natural phenomena. Thus, the range of some observed properties may extend beyond the limits defined for a taxonomic class. Areas of soils of a single taxonomic class rarely, if ever, can be mapped without including areas of other taxonomic classes. Consequently, every map unit is made up of the soils or miscellaneous areas for which it is named and some minor components that belong to taxonomic classes other than those of the major soils.
Most minor soils have properties similar to those of the dominant soil or soils in the map unit, and thus they do not affect use and management. These are called noncontrasting, or similar, components. They may or may not be mentioned in a particular map unit description. Other minor components, however, have properties and behavioral characteristics divergent enough to affect use or to require different management. These are called contrasting, or dissimilar, components. They generally are in small areas and could not be mapped separately because of the scale used. Some small areas of strongly contrasting soils or miscellaneous areas are identified by a special symbol on the maps. If included in the database for a given area, the contrasting minor components are identified in the map unit descriptions along with some characteristics of each. A few areas of minor components may not have been observed, and consequently they are not mentioned in the descriptions, especially where the pattern was so complex that it was impractical to make enough observations to identify all the soils and miscellaneous areas on the landscape.
The presence of minor components in a map unit in no way diminishes the usefulness or accuracy of the data. The objective of mapping is not to delineate pure taxonomic classes but rather to separate the landscape into landforms or landform segments that have similar use and management requirements. The delineation of such segments on the map provides sufficient information for the development of resource plans. If intensive use of small areas is planned, however,
Custom Soil Resource Report
11

onsite investigation is needed to define and locate the soils and miscellaneous areas.
An identifying symbol precedes the map unit name in the map unit descriptions. Each description includes general facts about the unit and gives important soil properties and qualities.
Soils that have profiles that are almost alike make up a soil series. Except for differences in texture of the surface layer, all the soils of a series have major horizons that are similar in composition, thickness, and arrangement.
Soils of one series can differ in texture of the surface layer, slope, stoniness, salinity, degree of erosion, and other characteristics that affect their use. On the basis of such differences, a soil series is divided into soil phases. Most of the areas shown on the detailed soil maps are phases of soil series. The name of a soil phase commonly indicates a feature that affects use or management. For example, Alpha silt loam, 0 to 2 percent slopes, is a phase of the Alpha series.
Some map units are made up of two or more major soils or miscellaneous areas. These map units are complexes, associations, or undifferentiated groups.
A complex consists of two or more soils or miscellaneous areas in such an intricate pattern or in such small areas that they cannot be shown separately on the maps. The pattern and proportion of the soils or miscellaneous areas are somewhat similar in all areas. Alpha-Beta complex, 0 to 6 percent slopes, is an example.
An association is made up of two or more geographically associated soils or miscellaneous areas that are shown as one unit on the maps. Because of present or anticipated uses of the map units in the survey area, it was not considered practical or necessary to map the soils or miscellaneous areas separately. The pattern and relative proportion of the soils or miscellaneous areas are somewhat similar. Alpha-Beta association, 0 to 2 percent slopes, is an example.
An undifferentiated group is made up of two or more soils or miscellaneous areas that could be mapped individually but are mapped as one unit because similar interpretations can be made for use and management. The pattern and proportion of the soils or miscellaneous areas in a mapped area are not uniform. An area can be made up of only one of the major soils or miscellaneous areas, or it can be made up of all of them. Alpha and Beta soils, 0 to 2 percent slopes, is an example.
Some surveys include miscellaneous areas. Such areas have little or no soil material and support little or no vegetation. Rock outcrop is an example.
Custom Soil Resource Report
12
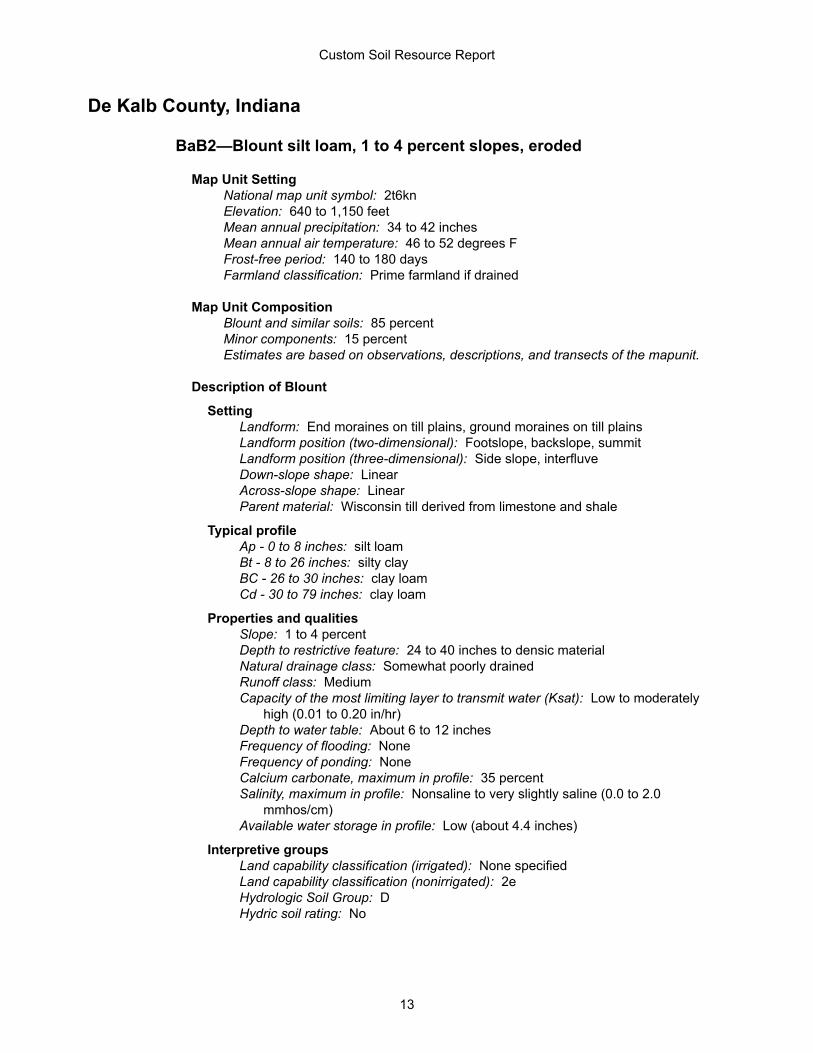
De Kalb County, Indiana
BaB2—Blount silt loam, 1 to 4 percent slopes, eroded
Map Unit SettingNational map unit symbol: 2t6knElevation: 640 to 1,150 feetMean annual precipitation: 34 to 42 inchesMean annual air temperature: 46 to 52 degrees FFrost-free period: 140 to 180 daysFarmland classification: Prime farmland if drained
Map Unit CompositionBlount and similar soils: 85 percentMinor components: 15 percentEstimates are based on observations, descriptions, and transects of the mapunit.
Description of Blount
SettingLandform: End moraines on till plains, ground moraines on till plainsLandform position (two-dimensional): Footslope, backslope, summitLandform position (three-dimensional): Side slope, interfluveDown-slope shape: LinearAcross-slope shape: LinearParent material: Wisconsin till derived from limestone and shale
Typical profileAp - 0 to 8 inches: silt loamBt - 8 to 26 inches: silty clayBC - 26 to 30 inches: clay loamCd - 30 to 79 inches: clay loam
Properties and qualitiesSlope: 1 to 4 percentDepth to restrictive feature: 24 to 40 inches to densic materialNatural drainage class: Somewhat poorly drainedRunoff class: MediumCapacity of the most limiting layer to transmit water (Ksat): Low to moderately
high (0.01 to 0.20 in/hr)Depth to water table: About 6 to 12 inchesFrequency of flooding: NoneFrequency of ponding: NoneCalcium carbonate, maximum in profile: 35 percentSalinity, maximum in profile: Nonsaline to very slightly saline (0.0 to 2.0
mmhos/cm)Available water storage in profile: Low (about 4.4 inches)
Interpretive groupsLand capability classification (irrigated): None specifiedLand capability classification (nonirrigated): 2eHydrologic Soil Group: DHydric soil rating: No
Custom Soil Resource Report
13

Minor Components
HaskinsPercent of map unit: 6 percentLandform: End moraines on till plains, ground moraines on till plainsLandform position (two-dimensional): Footslope, backslopeLandform position (three-dimensional): Side slope, interfluveDown-slope shape: LinearAcross-slope shape: LinearHydric soil rating: No
GlynwoodPercent of map unit: 5 percentLandform: End moraines on till plains, ground moraines on till plainsLandform position (two-dimensional): Footslope, backslope, shoulderLandform position (three-dimensional): Side slope, nose slopeDown-slope shape: Linear, convexAcross-slope shape: LinearHydric soil rating: No
PewamoPercent of map unit: 4 percentLandform: End moraines on till plains, ground moraines on till plainsLandform position (two-dimensional): Footslope, backslope, toeslopeLandform position (three-dimensional): Side slope, base slopeDown-slope shape: LinearAcross-slope shape: Linear, concaveHydric soil rating: Yes
Pe—Pewamo silty clay
Map Unit SettingNational map unit symbol: 5cv6Elevation: 640 to 1,150 feetMean annual precipitation: 34 to 39 inchesMean annual air temperature: 47 to 52 degrees FFrost-free period: 165 to 175 daysFarmland classification: Prime farmland if drained
Map Unit CompositionPewamo and similar soils: 100 percentEstimates are based on observations, descriptions, and transects of the mapunit.
Description of Pewamo
SettingLandform: Depressions on moraines, depressions on till plainsLandform position (two-dimensional): FootslopeDown-slope shape: ConcaveAcross-slope shape: Linear
Custom Soil Resource Report
14

Parent material: Clayey till
Typical profileAp - 0 to 10 inches: silty clayBtg1,Btg2 - 10 to 34 inches: silty clayCg1,Cg2 - 34 to 60 inches: clay loam
Properties and qualitiesSlope: 0 to 2 percentDepth to restrictive feature: More than 80 inchesNatural drainage class: Poorly drainedRunoff class: LowCapacity of the most limiting layer to transmit water (Ksat): Low to moderately
high (0.01 to 0.20 in/hr)Depth to water table: About 6 to 12 inchesFrequency of flooding: NoneFrequency of ponding: NoneCalcium carbonate, maximum in profile: 35 percentAvailable water storage in profile: Moderate (about 6.5 inches)
Interpretive groupsLand capability classification (irrigated): None specifiedLand capability classification (nonirrigated): 2wHydrologic Soil Group: C/DOther vegetative classification: Mixed/Transitional (Mixed Native Vegetation)Hydric soil rating: Yes
Custom Soil Resource Report
15
ReferencesAmerican Association of State Highway and Transportation Officials (AASHTO). 2004. Standard specifications for transportation materials and methods of sampling and testing. 24th edition.
American Society for Testing and Materials (ASTM). 2005. Standard classification of soils for engineering purposes. ASTM Standard D2487-00.
Cowardin, L.M., V. Carter, F.C. Golet, and E.T. LaRoe. 1979. Classification of wetlands and deep-water habitats of the United States. U.S. Fish and Wildlife Service FWS/OBS-79/31.
Federal Register. July 13, 1994. Changes in hydric soils of the United States.
Federal Register. September 18, 2002. Hydric soils of the United States.
Hurt, G.W., and L.M. Vasilas, editors. Version 6.0, 2006. Field indicators of hydric soils in the United States.
National Research Council. 1995. Wetlands: Characteristics and boundaries.
Soil Survey Division Staff. 1993. Soil survey manual. Soil Conservation Service. U.S. Department of Agriculture Handbook 18. http://www.nrcs.usda.gov/wps/portal/nrcs/detail/national/soils/?cid=nrcs142p2_054262
Soil Survey Staff. 1999. Soil taxonomy: A basic system of soil classification for making and interpreting soil surveys. 2nd edition. Natural Resources Conservation Service, U.S. Department of Agriculture Handbook 436. http://www.nrcs.usda.gov/wps/portal/nrcs/detail/national/soils/?cid=nrcs142p2_053577
Soil Survey Staff. 2010. Keys to soil taxonomy. 11th edition. U.S. Department of Agriculture, Natural Resources Conservation Service. http://www.nrcs.usda.gov/wps/portal/nrcs/detail/national/soils/?cid=nrcs142p2_053580
Tiner, R.W., Jr. 1985. Wetlands of Delaware. U.S. Fish and Wildlife Service and Delaware Department of Natural Resources and Environmental Control, Wetlands Section.
United States Army Corps of Engineers, Environmental Laboratory. 1987. Corps of Engineers wetlands delineation manual. Waterways Experiment Station Technical Report Y-87-1.
United States Department of Agriculture, Natural Resources Conservation Service. National forestry manual. http://www.nrcs.usda.gov/wps/portal/nrcs/detail/soils/home/?cid=nrcs142p2_053374
United States Department of Agriculture, Natural Resources Conservation Service. National range and pasture handbook. http://www.nrcs.usda.gov/wps/portal/nrcs/detail/national/landuse/rangepasture/?cid=stelprdb1043084
16
United States Department of Agriculture, Natural Resources Conservation Service. National soil survey handbook, title 430-VI. http://www.nrcs.usda.gov/wps/portal/nrcs/detail/soils/scientists/?cid=nrcs142p2_054242
United States Department of Agriculture, Natural Resources Conservation Service. 2006. Land resource regions and major land resource areas of the United States, the Caribbean, and the Pacific Basin. U.S. Department of Agriculture Handbook 296. http://www.nrcs.usda.gov/wps/portal/nrcs/detail/national/soils/?cid=nrcs142p2_053624
United States Department of Agriculture, Soil Conservation Service. 1961. Land capability classification. U.S. Department of Agriculture Handbook 210. http://www.nrcs.usda.gov/Internet/FSE_DOCUMENTS/nrcs142p2_052290.pdf
Custom Soil Resource Report
17

Remediation Work Plan BFD #4170705
REMEDIATION WORK PLAN
APPENDIX B. WATER WELL LOGS
The Butler Company 325 S Broadway St
Butler, DeKalb County, Indiana 46721 BFD #4170705

DNR Indiana Department of Natural Resources Water Well Log Search
23-Jul-2020
½ Mile 0 ½ Mile
Appendix B Water Well Mapping The Butler Company 325 S Broadway St Butler, DeKalb County, Indiana 46721 BFD #4170705 SES Project 2020-295
107430 107441
107415
107471
Blue – Pump Rate <70 GPM Red – Pump Rate >70 GPM
107360
232269 SITE
Quarter Mile Radius
One Mile Radius
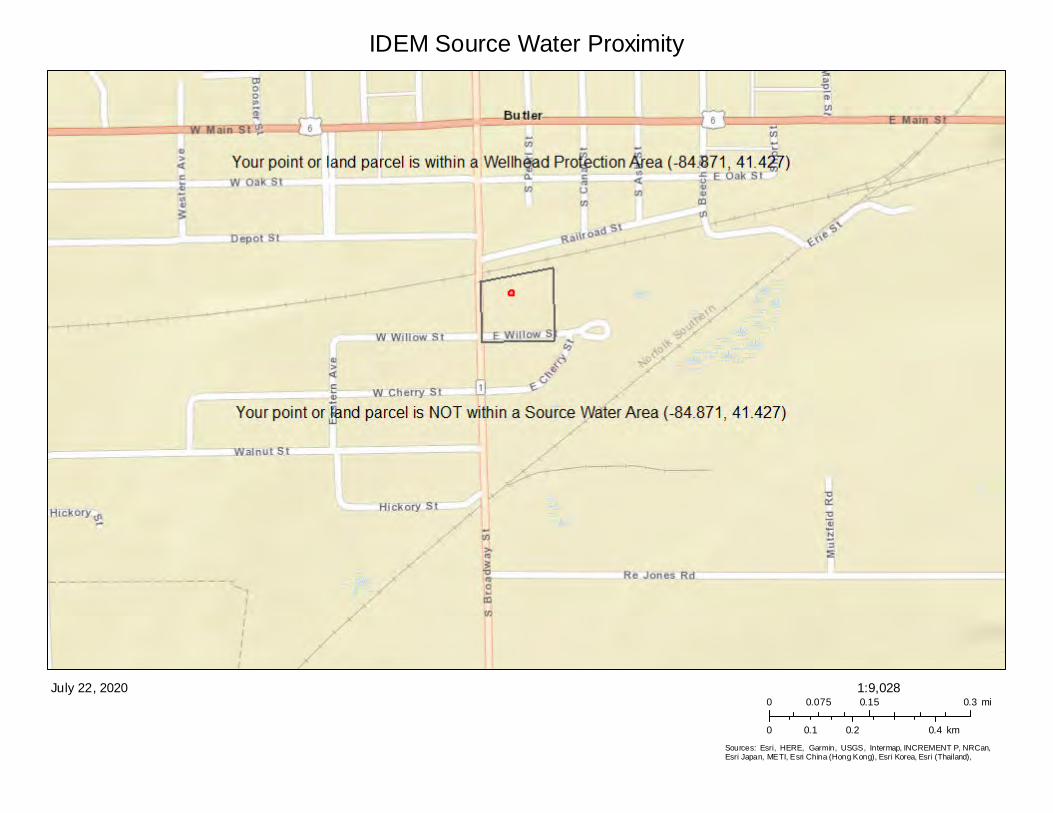
IDEM Source Water Proximity
Sources: Esri, HERE, Garmin, USGS, Intermap, INCREMENT P, NRCan,Esri Japan, METI, Esri China (Hong Kong), Esri Korea, Esri (Thailand),
July 22, 20200 0.15 0.30.075 mi
0 0.2 0.40.1 km
1:9,028

Indiana Department of Natural Resources
file:///ses-file01/...Projects/2020295%20-%20IFA%20Butler%20Company,%20Butler,%20IN/RWP/Water%20wells/107471%20(high).html[7/28/2020 10:14:47 AM]
Record of Water Well
Indiana Department of Natural Resources
Reference Number Driving directions to well Date completed107471 300' N OF PENN CENTRAL RR ON BROADWAY 1ST BLDG ON E SIDE OF
BROADWAY N OF CONRAIL TRACKS May 28, 1970
Owner-Contractor Name Address TelephoneOwner LAVON COLLINS 248 S BROADWAY BUTLERDriller G & L WELL DRILLINGOperator MARVIN GILBERT/S LALOUDE License: null
Construction Details Well Use: Industry Drilling method: Cable Tool Pump type: Depth: 142.0 Pump setting depth: Water quality:Casing Length: 116.0 Material: Diameter: 8.0Screen Length: 15.0 Material: Diameter: 8.0 Slot size: 30+25
Well Capacity Test Type of test: Test rate: 350.0 gpm for 8.0 hrs. BailTest rate: 45.0 gpm for 5.0 hrs. Drawdown: 24.0 ft. Static water level: 21.0 ft. Bailer Drawdown 0.0 ft.
Grouting Information Material: Depth: from to Installation Method: Number of bags used:
Well Abandonment Sealing material: Depth: from to Installation Method: Number of bags used:
Administrative County: DEKALB Township: 34N Range: 14E
Section: SW of the NW of the NW of Section 12 Topo map: BUTLER EAST,IN-OH
Grant Number: Field located by: BEB on: Oct 28, 1987 Courthouse location by: on: Location accepted w/o verification by: HCK on: Jun 01, 1970 Subdivision name: Lot number:
Ft W of EL: Ft N of SL: Ft E of WL:100.0 Ft S of NL: 700.0
Ground elevation: 870.0 Depth to bedrock: Bedrockelevation: Aquifer elevation: 728.0
UTM Easting: 677895.0 UTM Northing: 4588220.0
Well Log Top Bottom Formation
0.0 0.5 BLACK TOP 0.5 5.0 FILL SAND 5.0 57.0 GRAY CLAY 57.0 95.0 SANDY HARD PAN 95.0 104.0 DIRTY SAND & GRAV 104.0 120.0 GRAY CLAY & FINE GRAV 120.0 126.0 FINE SAND 126.0 142.0 CRS SAND & GRAV
Comments MC CONTACT MADE W/ OWNER WELL USED FOR LAUNDROMAT AND CAR WASH WELL LOCATEDON N SIDE OF LAUNDRY

Indiana Department of Natural Resources
file:///ses-file01/...Projects/2020295%20-%20IFA%20Butler%20Company,%20Butler,%20IN/RWP/Water%20wells/107441%20(high).html[7/28/2020 10:15:19 AM]
Record of Water Well
Indiana Department of Natural Resources
Reference Number Driving directions to well Date completed107441 450' W OF BROADWAY 200' N OF W WILLOW Sep 18, 1970
Owner-Contractor Name Address TelephoneOwner CITY WATER DEPT BUTLER, INDriller LAYNE NORTHERN CO MISHAWAKA, IN
Construction Details Well Use: Public Supply Drilling method: Other Pump type: Depth: 147.0 Pump setting depth: Water quality:Casing Length: 88.0 Material: Diameter: 38.0Screen Length: 30.0 Material: Diameter: 18.0 Slot size: 8
Well Capacity Test Type of test: Test rate: 1002.0 gpm for 28.0 hrs. BailTest rate: gpm for hrs. Drawdown: 20.0 ft. Static water level: 24.0 ft. Bailer Drawdown ft.
Grouting Information Material: Depth: from to Installation Method: Number of bags used:
Well Abandonment Sealing material: Depth: from to Installation Method: Number of bags used:
Administrative County: DEKALB Township: 34N Range: 14E
Section: SE of the NE of the NE of Section 11 Topo map: BUTLER EAST,IN-OH
Grant Number: Field located by: TMB on: Aug 01, 1973 Courthouse location by: on: Location accepted w/o verification by: on: Subdivision name: Lot number: Ft W of EL: 450.0 Ft N of SL: Ft E of WL: Ft S of NL: 1100.0
Ground elevation: 870.0 Depth to bedrock: Bedrockelevation: Aquifer elevation: 723.0
UTM Easting: 677801.0 UTM Northing: 4588080.0
Well Log Top Bottom Formation
0.0 2.0 FILL 2.0 28.0 CLAY 28.0 31.0 COARSE SAND & GRAVEL 31.0 57.0 CLAY 57.0 62.0 COARSE SAND & GRAVEL 62.0 89.0 CLAY 89.0 106.0 COARSE SAND & GRAVEL 106.0 129.0 CLAY 129.0 147.0 COARSE SAND & GRAVEL 147.0 148.0 CLAY
Comments WELL IN PUMPHOUSE W OF WATER TOWER PUMPING TEST DATA ENCLOSED

Indiana Department of Natural Resources
file:///ses-file01/...Projects/2020295%20-%20IFA%20Butler%20Company,%20Butler,%20IN/RWP/Water%20wells/107430%20(high).html[7/28/2020 10:15:32 AM]
Record of Water Well
Indiana Department of Natural Resources
Reference Number Driving directions to well Date completed107430 Dec 22, 1959
Owner-Contractor Name Address TelephoneDriller WATSON WELL DRILLING INC BRYAN, OHOperator C KIMBLE License: null
Construction Details Well Use: Public Supply Drilling method: Other Pump type: Depth: 144.0 Pump setting depth: Water quality:Casing Length: 93.0 Material: Diameter: 26.0Screen Length: 20.0 Material: Diameter: 13.5 Slot size: 7
Well Capacity Test Type of test: Test rate: 1000.0 gpm for hrs. BailTest rate: gpm for hrs. Drawdown: 17.0 ft. Static water level: 21.6 ft. Bailer Drawdown ft.
Grouting Information Material: Depth: from to Installation Method: Number of bags used:
Well Abandonment Sealing material: Depth: from to Installation Method: Number of bags used:
Administrative County: DEKALB Township: 34N Range: 14E
Section: SE of the NE of the NE of Section 11 Topo map: BUTLER EAST,IN-OH
Grant Number: Field located by: KP on: Jul 01, 1965 Courthouse location by: on: Location accepted w/o verification by: on: Subdivision name: Lot number: Ft W of EL: 350.0 Ft N of SL: Ft E of WL: Ft S of NL: 1000.0
Ground elevation: 870.0 Depth to bedrock: Bedrockelevation: Aquifer elevation: 726.0
UTM Easting: 677758.0 UTM Northing: 4588106.0
Well Log Top Bottom Formation
0.0 18.0 HARD YELLOW CLAY 18.0 38.0 SAND & GRAVEL 38.0 58.0 CLAY 58.0 64.0 GRAVEL 64.0 88.0 BLUE CLAY 88.0 105.0 GRAVEL 105.0 129.0 CLAY 129.0 144.0 GRAVEL & SAND
Comments MC WELL #3 & TEST 59A

Indiana Department of Natural Resources
file:///ses-file01/...Projects/2020295%20-%20IFA%20Butler%20Company,%20Butler,%20IN/RWP/Water%20wells/107415%20(high).html[7/28/2020 10:15:40 AM]
Record of Water Well
Indiana Department of Natural Resources
Reference Number Driving directions to well Date completed107415 AT UTILITY BLDG S SIDE JUST W OF SR 1
Owner-Contractor Name Address TelephoneOwner BUTLER WATER WORKS BUTLER
Construction Details Well Use: Public Supply Drilling method: Pump type: Depth: 147.0 Pump setting depth: Water quality:Casing Length: Material: Diameter: 10.0Screen Length: Material: Diameter: 10.0 Slot size:
Well Capacity Test Type of test: Test rate: 275.0 gpm for hrs. BailTest rate: gpm for hrs. Drawdown: ft. Static water level: 24.0 ft. Bailer Drawdown ft.
Grouting Information Material: Depth: from to Installation Method: Number of bags used:
Well Abandonment Sealing material: Depth: from to Installation Method: Number of bags used:
Administrative County: DEKALB Township: 34N Range: 14E
Section: NE of the NE of the NE of Section 11 Topo map: BUTLER EAST,IN-OH
Grant Number: Field located by: U KEP on: Jul 09, 1965 Courthouse location by: on: Location accepted w/o verification by: on: Subdivision name: Lot number: Ft W of EL: 300.0 Ft N of SL: Ft E of WL: Ft S of NL: 100.0
Ground elevation: 865.0 Depth to bedrock: Bedrockelevation: Aquifer elevation: 720.0
UTM Easting: 677744.0 UTM Northing: 4588385.0
Well Log Top Bottom Formation
Comments BUTLER 1

Indiana Department of Natural Resources
file:///ses-file01/.../2020%20Projects/2020295%20-%20IFA%20Butler%20Company,%20Butler,%20IN/RWP/Water%20wells/107360.html[7/28/2020 10:15:54 AM]
Record of Water Well
Indiana Department of Natural Resources
Reference Number Driving directions to well Date completed107360 W OF BUTLER ON SR 6 3RD HSE ON R SIDE NEW LOCATION MOVED OLD
HSE ON LOT Sep 03, 1962
Owner-Contractor Name Address TelephoneOwner MR LARROWE RRT BUTLERDriller WILFRED SCHIFFLI RRT 1 BOX 34 WATERLOOOperator WILFRED SCHIFFLI License: null
Construction Details Well Use: Home Drilling method: Jet Pump type: Depth: 52.0 Pump setting depth: Water quality:Casing Length: 48.0 Material: Diameter: 2.0Screen Length: 2.5 Material: Diameter: 1.0 Slot size: 40
Well Capacity Test Type of test: Test rate: 12.0 gpm for 2.0 hrs. BailTest rate: gpm for hrs. Drawdown: 0.0 ft. Static water level: 10.0 ft. Bailer Drawdown ft.
Grouting Information Material: Depth: from to Installation Method: Number of bags used:
Well Abandonment Sealing material: Depth: from to Installation Method: Number of bags used:
Administrative County: DEKALB Township: 34N Range: 14E
Section: SE of the SE of the SE of Section 2 Topo map: BUTLER EAST,IN-OH
Grant Number: Field located by: KEPPEL on: Jul 01, 1965 Courthouse location by: on: Location accepted w/o verification by: on: Subdivision name: Lot number: Ft W of EL: 150.0 Ft N of SL: 50.0 Ft E of WL: Ft S of NL:
Ground elevation: 865.0 Depth to bedrock: Bedrockelevation: Aquifer elevation: 813.0
UTM Easting: 677812.0 UTM Northing: 4588455.0
Well Log Top Bottom Formation
0.0 10.0 YEL CLAY 10.0 48.0 GRAY CLAY 48.0 52.0 SAND & GRAV & WATER
Comments

Indiana Department of Natural Resources
file:///ses-file01/.../2020%20Projects/2020295%20-%20IFA%20Butler%20Company,%20Butler,%20IN/RWP/Water%20wells/232269.html[7/28/2020 10:16:06 AM]
Record of Water Well
Indiana Department of Natural Resources
Reference Number Driving directions to well Date completed232269 Nov 24, 1959
Owner-Contractor Name Address TelephoneOwner CITY OF BUTLER BUTLER, INDriller GRO P REID & SON HOWE, INOperator WM REID License: null
Construction Details Well Use: Drilling method: Jet Pump type: Depth: 148.0 Pump setting depth: Water quality:Casing Length: Material: Diameter: 2.0Screen Length: 3.0 Material: Diameter: 1.0 Slot size: 60
Well Capacity Test Type of test: Test rate: gpm for hrs. BailTest rate: gpm for hrs. Drawdown: ft. Static water level: 21.0 ft. Bailer Drawdown ft.
Grouting Information Material: Depth: from to Installation Method: Number of bags used:
Well Abandonment Sealing material: Depth: from to Installation Method: Number of bags used:
Administrative County: DEKALB Township: 34N Range: 14E
Section: SE of the NE of the NE of Section 11 Topo map: BUTLER EAST,IN-OH
Grant Number: Field located by: BEB on: Oct 29, 1987 Courthouse location by: on: Location accepted w/o verification by: on: Subdivision name: Lot number: Ft W of EL: Ft N of SL: Ft E of WL: Ft S of NL:
Ground elevation: 875.0 Depth to bedrock: Bedrockelevation: Aquifer elevation:
UTM Easting: UTM Northing:
Well Log Top Bottom Formation
0.0 18.0 CLAY BLUE 18.0 32.0 SAND & GRAVEL LT GRAY 32.0 60.0 CLAY BLUE 60.0 65.0 GRAV & LT GRAY 65.0 88.0 CLAY BLUE 88.0 105.0 GRAV LT GRAY 105.0 130.0 CLAY BLUE 130.0 144.0 GRAV LT GRAY 144.0 148.0 CLAY BLUE
Comments MC USE OF WELL TEST

Remediation Work Plan BFD #4170705
REMEDIATION WORK PLAN
APPENDIX C. SOIL BORING LOGS
The Butler Company 325 S Broadway St
Butler, DeKalb County, Indiana 46721 BFD #4170705

5
10
15
20
25
30
DT0-2
DT2-4
DT4-6
DT6-8
DT8-10
DT10-12
DT12-14
DT14-16
16
16
21
21
24
24
24
24
Top soil-0.25
Black, moist-wet, debris: sinder, gravel andSAND.
-1.5Brown-grey, moist, med-stiff, mottled CLAY.
-2.13Debis: wood.
-2.63Brown-grey, moist, med-stiff, mottled, CLAYwith organics.Grey-brown, moist, stiff, mottled, CLAY, traceorganics and fine-med gravel.
As above, no organics.
Brown, moist, stiff, CLAY, trace mediumgravel.
-14.58Brown, saturated, rounded, medium gravel.
-14.67Brown, moist, stiff, CLAY with trace mediumgravel.
-16End of Boring
1.2
0.2
0.6
0.1
0
0.1
0.1
0
FILL
CLFILL
CL
GWCL
SES Environmental Boring/Well Number: BA3807 Transportation Dr.Fort Wayne, IN 46818Phone: (260)497-7645Fax: (260)497-7646
Client: City of Butler
Project Name: Former Butler Company
Project Number: 2018-364
Project Location: 325 South Broadway St. Butler, IN
Drilling Contractor: SCS Contracting Ground Elevation:
Driller Name: Philip Weaver Top of Casing Elevation:
Driller Number: 4201 GPS Coordinates:
Drilling Method: Geoprobe 7822 DT Groundwater Level:Logged By: Karsten Lehner At Time of Drilling:
Date Started: 5/22/18 Completed: 5/22/18 At End of Drilling:
Notes:
Dep
th(f
eet)
Sa
mp
le T
yp
ea
nd
Nu
mb
er
Lab Tests
Rec
ov
ery
(in
ches
)
BlowCount
Soil Description
Val
ue
PID(ppmv)
Profile
0 1000
Gra
ph
ic
US
CS
Cla
ssif
ica
tio
n
Well ConstructionBA
Project # 2018-364 BORING TEMPLATE #1 Printed 6/1/2018 Page 1 of 1

5
10
15
20
25
30
DT0-2
DT2-4
DT4-6
DT6-8
DT8-10
DT10-12
12
12
14
14
18
18
Concrete surface-0.25
Top soil and gravel.-0.83
Debris: bricksBlack, moist, SAND and debris: sinder andbricks.
-2.67Tan, wet, SAND.
-3Brown-black, wet, sinder and debris.Coarse gravel, sinder and debris.
-4.29Dark brown, moist, med-soft, peat-like soil withorganic debris.
-8.44Grey, moist, soft, SILTY SANDY CLAY.
-8.55Grey, moist, med-stiff, CLAY with tracemedium gravel.
-12End of Boring
2.3
56.2
36.5
3.8
2.0
0.8
FILL
SW
FILL
VC
CL
SES Environmental Boring/Well Number: BB3807 Transportation Dr.Fort Wayne, IN 46818Phone: (260)497-7645Fax: (260)497-7646
Client: City of Butler
Project Name: Former Butler Company
Project Number: 2018-364
Project Location: 325 South Broadway St. Butler, IN
Drilling Contractor: SCS Contracting Ground Elevation:
Driller Name: Philip Weaver Top of Casing Elevation:
Driller Number: 4201 GPS Coordinates:
Drilling Method: Geoprobe 7822 DT Groundwater Level:Logged By: Karsten Lehner At Time of Drilling:
Date Started: 5/22/18 Completed: 5/22/18 At End of Drilling:
Notes:
Dep
th(f
eet)
Sa
mp
le T
yp
ea
nd
Nu
mb
er
Lab Tests
Rec
ov
ery
(in
ches
)
BlowCount
Soil Description
Val
ue
PID(ppmv)
Profile
0 1000
Gra
ph
ic
US
CS
Cla
ssif
ica
tio
n
Well ConstructionBB
Project # 2018-364 BORING TEMPLATE #1 Printed 6/1/2018 Page 1 of 1

5
10
15
20
25
30
DT0-2
DT2-4
DT4-6
DT6-8
DT8-10
DT10-12
DT12-14
DT14-16
DT16-18
10
10
14
14
23
23
24
24
15
Black slag
Wet debris: bricks, paint chips, slag, sinder.
-4Black, moist, peat-like soil with orgaincs.
-5.14Grey, moist, med-soft, CLAY.
Grey-brown, moist, med-stiff, CLAY with tracemottling and fine gravel .
Grey, moist, stiff, CLAY with trace mediumgravel.
-18End of Boring
1.8
8.0
0.5
0.3
0.1
0.1
0.2
0.2
0.2
FILL
CL
SES Environmental Boring/Well Number: BC3807 Transportation Dr.Fort Wayne, IN 46818Phone: (260)497-7645Fax: (260)497-7646
Client: City of Butler
Project Name: Former Butler Company
Project Number: 2018-364
Project Location: 325 South Broadway St. Butler, IN
Drilling Contractor: SCS Contracting Ground Elevation:
Driller Name: Philip Weaver Top of Casing Elevation:
Driller Number: 4201 GPS Coordinates:
Drilling Method: Geoprobe 7822 DT Groundwater Level:Logged By: Karsten Lehner At Time of Drilling:
Date Started: 5/22/18 Completed: 5/22/18 At End of Drilling:
Notes:
Dep
th(f
eet)
Sa
mp
le T
yp
ea
nd
Nu
mb
er
Lab Tests
Rec
ov
ery
(in
ches
)
BlowCount
Soil Description
Val
ue
PID(ppmv)
Profile
0 1000
Gra
ph
ic
US
CS
Cla
ssif
ica
tio
n
Well ConstructionBC
Project # 2018-364 BORING TEMPLATE #1 Printed 6/1/2018 Page 1 of 1
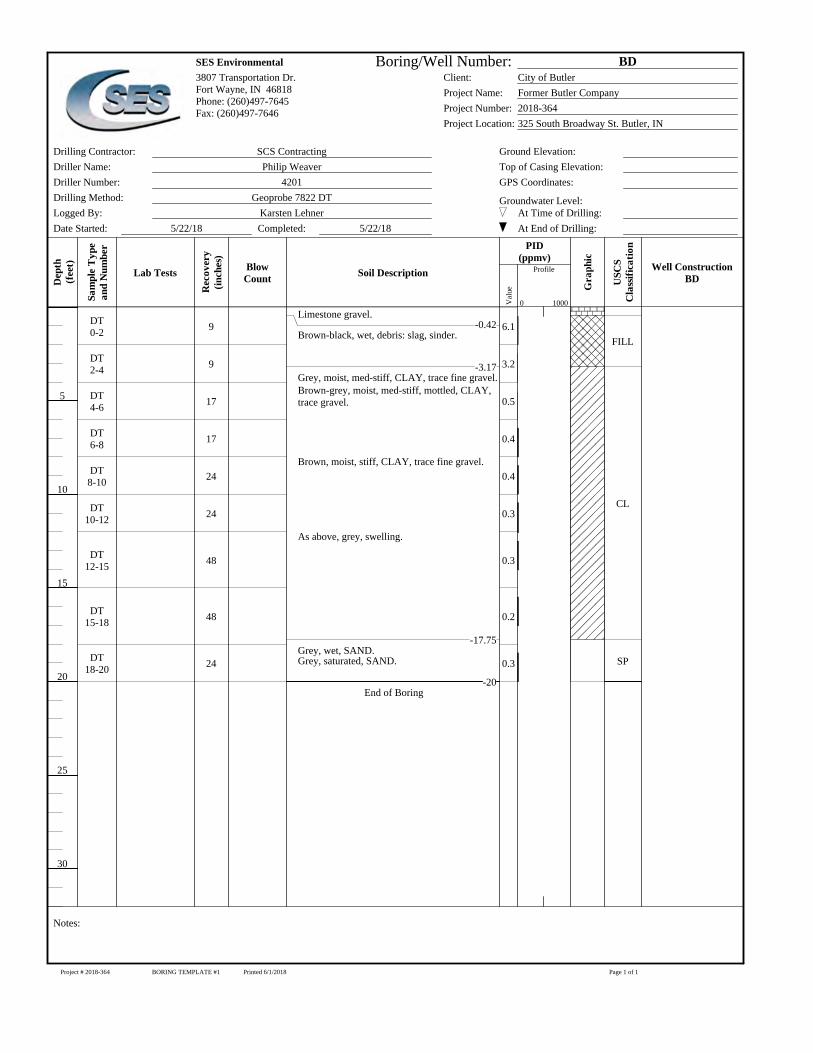
5
10
15
20
25
30
DT0-2
DT2-4
DT4-6
DT6-8
DT8-10
DT10-12
DT12-15
DT15-18
DT18-20
9
9
17
17
24
24
48
48
24
Limestone gravel.-0.42
Brown-black, wet, debris: slag, sinder.
-3.17Grey, moist, med-stiff, CLAY, trace fine gravel.Brown-grey, moist, med-stiff, mottled, CLAY,trace gravel.
Brown, moist, stiff, CLAY, trace fine gravel.
As above, grey, swelling.
-17.75Grey, wet, SAND.Grey, saturated, SAND.
-20End of Boring
6.1
3.2
0.5
0.4
0.4
0.3
0.3
0.2
0.3
FILL
CL
SP
SES Environmental Boring/Well Number: BD3807 Transportation Dr.Fort Wayne, IN 46818Phone: (260)497-7645Fax: (260)497-7646
Client: City of Butler
Project Name: Former Butler Company
Project Number: 2018-364
Project Location: 325 South Broadway St. Butler, IN
Drilling Contractor: SCS Contracting Ground Elevation:
Driller Name: Philip Weaver Top of Casing Elevation:
Driller Number: 4201 GPS Coordinates:
Drilling Method: Geoprobe 7822 DT Groundwater Level:Logged By: Karsten Lehner At Time of Drilling:
Date Started: 5/22/18 Completed: 5/22/18 At End of Drilling:
Notes:
Dep
th(f
eet)
Sa
mp
le T
yp
ea
nd
Nu
mb
er
Lab Tests
Rec
ov
ery
(in
ches
)
BlowCount
Soil Description
Val
ue
PID(ppmv)
Profile
0 1000
Gra
ph
ic
US
CS
Cla
ssif
ica
tio
n
Well ConstructionBD
Project # 2018-364 BORING TEMPLATE #1 Printed 6/1/2018 Page 1 of 1

5
10
15
20
25
30
DT0-2
DT2-4
DT4-6
DT6-8
DT8-10
DT10-12
DT12-14
DT14-16
7
7
7
7
21
21
24
24
Black, moist, debris: sinder, bricks. Poorrecovery due to debris.
-7Brown-grey, moist, stiff, mottled, CLAY.
Brown, moist, med-stiff, CLAY, trace fine-medium gravel.
-14Brown, moist, SAND and coarse gravel.
-14.04Brown, moist, med-stiff, CLAY, trace finegravel.
-16End of Boring
0.2
5.3
1.5
0.4
0.3
0.3
0.2
0.3
FILL
CL
GP-SP
CL
SES Environmental Boring/Well Number: BE3807 Transportation Dr.Fort Wayne, IN 46818Phone: (260)497-7645Fax: (260)497-7646
Client: City of Butler
Project Name: Former Butler Company
Project Number: 2018-364
Project Location: 325 South Broadway St. Butler, IN
Drilling Contractor: SCS Contracting Ground Elevation:
Driller Name: Philip Weaver Top of Casing Elevation:
Driller Number: 4201 GPS Coordinates:
Drilling Method: Geoprobe 7822 DT Groundwater Level:Logged By: Karsten Lehner At Time of Drilling:
Date Started: 5/22/18 Completed: 5/22/18 At End of Drilling:
Notes:
Dep
th(f
eet)
Sa
mp
le T
yp
ea
nd
Nu
mb
er
Lab Tests
Rec
ov
ery
(in
ches
)
BlowCount
Soil Description
Val
ue
PID(ppmv)
Profile
0 1000
Gra
ph
ic
US
CS
Cla
ssif
ica
tio
n
Well ConstructionBE
Project # 2018-364 BORING TEMPLATE #1 Printed 6/1/2018 Page 1 of 1

5
10
15
20
25
30
DT0-2
DT2-4
DT4-6
DT6-8
DT8-10
DT10-12
DT12-14
DT14-16
DT16-19
12
12
24
24
24
24
24
24
48
Gravel, debris and sinder.
-1.5Brown, moist, stiff, mottled-grey, CLAY, tracefine gravel.
As above, no mottling.
Grey, moist, stiff, swelling, CLAY.
-18.86Grey, moist, SAND. Refusal at 19'
-19End of Boring
3.9
1.1
0.6
0.5
0.6
0.5
0.5
0.5
0.2
FILL
CL
SP
SES Environmental Boring/Well Number: BF3807 Transportation Dr.Fort Wayne, IN 46818Phone: (260)497-7645Fax: (260)497-7646
Client: City of Butler
Project Name: Former Butler Company
Project Number: 2018-364
Project Location: 325 South Broadway St. Butler, IN
Drilling Contractor: SCS Contracting Ground Elevation:
Driller Name: Philip Weaver Top of Casing Elevation:
Driller Number: 4201 GPS Coordinates:
Drilling Method: Geoprobe 7822 DT Groundwater Level:Logged By: Karsten Lehner At Time of Drilling:
Date Started: 5/22/18 Completed: 5/22/18 At End of Drilling:
Notes:
Dep
th(f
eet)
Sa
mp
le T
yp
ea
nd
Nu
mb
er
Lab Tests
Rec
ov
ery
(in
ches
)
BlowCount
Soil Description
Val
ue
PID(ppmv)
Profile
0 1000
Gra
ph
ic
US
CS
Cla
ssif
ica
tio
n
Well ConstructionBF
Project # 2018-364 BORING TEMPLATE #1 Printed 6/1/2018 Page 1 of 1
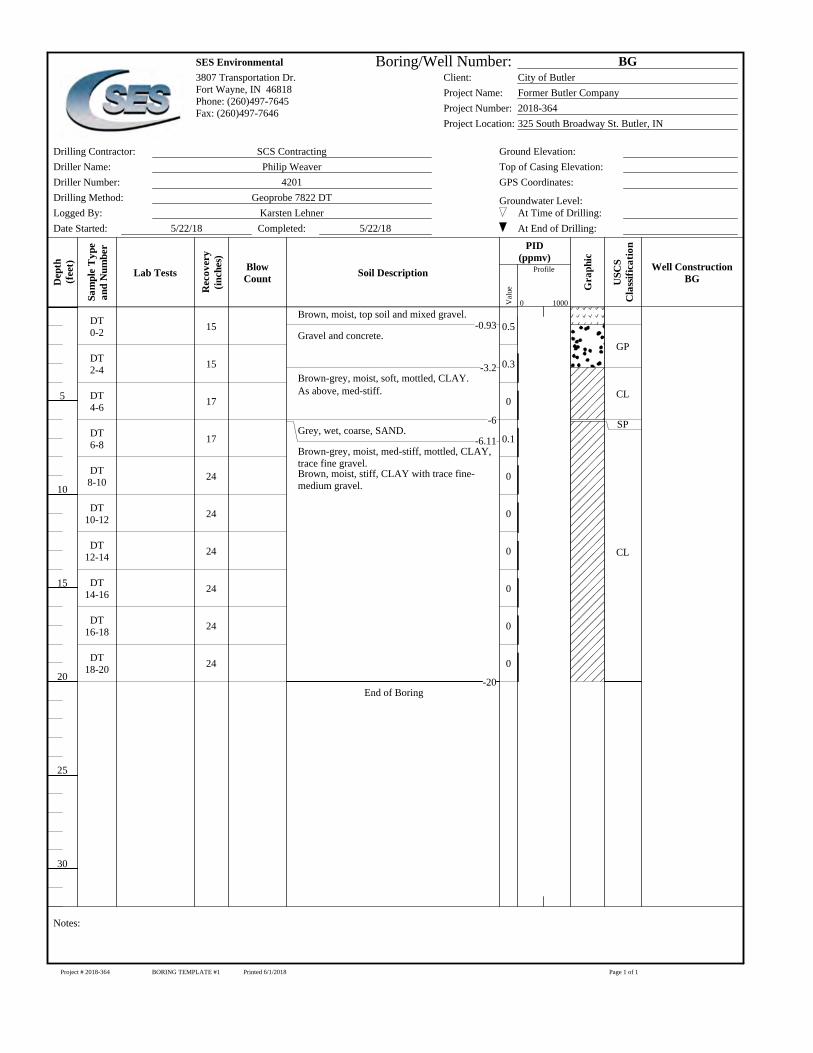
5
10
15
20
25
30
DT0-2
DT2-4
DT4-6
DT6-8
DT8-10
DT10-12
DT12-14
DT14-16
DT16-18
DT18-20
15
15
17
17
24
24
24
24
24
24
Brown, moist, top soil and mixed gravel.-0.93
Gravel and concrete.
-3.2Brown-grey, moist, soft, mottled, CLAY.As above, med-stiff.
-6Grey, wet, coarse, SAND.
-6.11Brown-grey, moist, med-stiff, mottled, CLAY,trace fine gravel.Brown, moist, stiff, CLAY with trace fine-medium gravel.
-20End of Boring
0.5
0.3
0
0.1
0
0
0
0
0
0
GP
CL
SP
CL
SES Environmental Boring/Well Number: BG3807 Transportation Dr.Fort Wayne, IN 46818Phone: (260)497-7645Fax: (260)497-7646
Client: City of Butler
Project Name: Former Butler Company
Project Number: 2018-364
Project Location: 325 South Broadway St. Butler, IN
Drilling Contractor: SCS Contracting Ground Elevation:
Driller Name: Philip Weaver Top of Casing Elevation:
Driller Number: 4201 GPS Coordinates:
Drilling Method: Geoprobe 7822 DT Groundwater Level:Logged By: Karsten Lehner At Time of Drilling:
Date Started: 5/22/18 Completed: 5/22/18 At End of Drilling:
Notes:
Dep
th(f
eet)
Sa
mp
le T
yp
ea
nd
Nu
mb
er
Lab Tests
Rec
ov
ery
(in
ches
)
BlowCount
Soil Description
Val
ue
PID(ppmv)
Profile
0 1000
Gra
ph
ic
US
CS
Cla
ssif
ica
tio
n
Well ConstructionBG
Project # 2018-364 BORING TEMPLATE #1 Printed 6/1/2018 Page 1 of 1
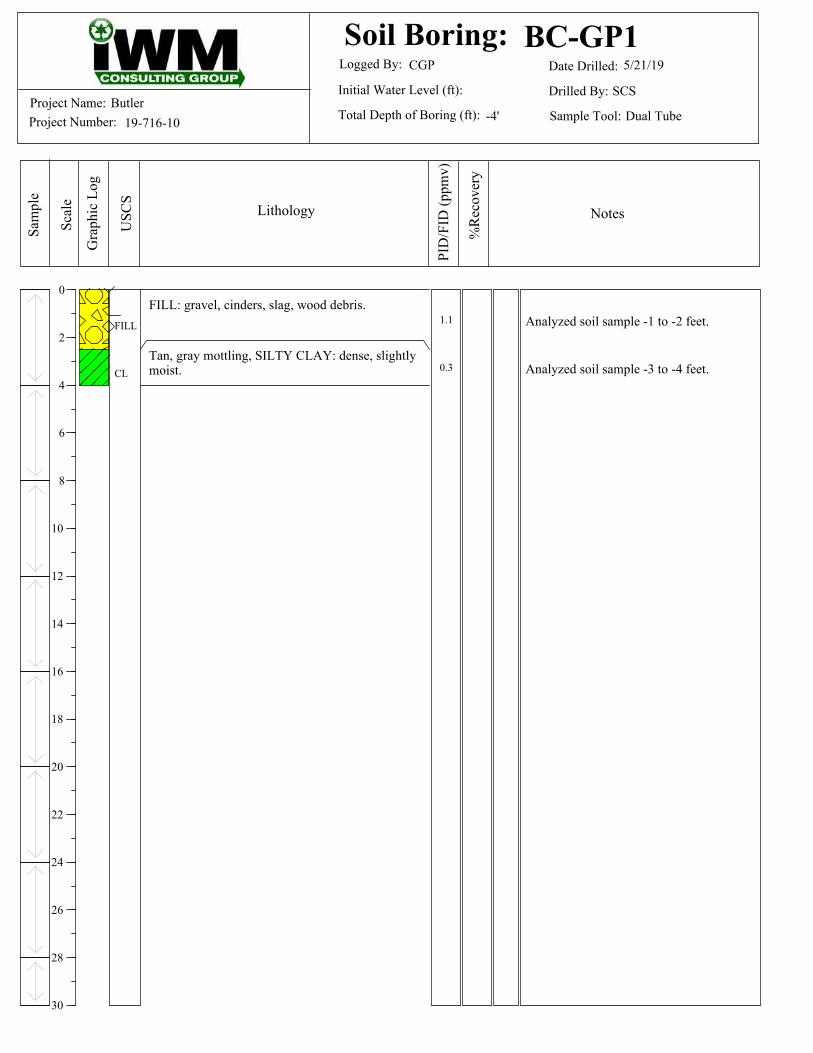
Sam
ple
Scal
e
Gra
phic
Log
USC
S
Lithology
Soil Boring:Date Drilled:Logged By:
Drilled By:
Sample Tool:
Initial Water Level (ft):
Total Depth of Boring (ft):Project Name:Project Number:
PID
/FID
(ppm
v)
Notes
%R
ecov
ery
0
2
4
6
8
10
12
14
16
18
20
22
24
26
28
30
-4'
CGP
BC-GP15/21/19
SCS
Dual TubeButler
19-716-10
FILL: gravel, cinders, slag, wood debris.
Tan, gray mottling, SILTY CLAY: dense, slightlymoist.
1.1
0.3
FILL
CL Analyzed soil sample -3 to -4 feet.
Analyzed soil sample -1 to -2 feet.

Sam
ple
Scal
e
Gra
phic
Log
USC
S
Lithology
Soil Boring:Date Drilled:Logged By:
Drilled By:
Sample Tool:
Initial Water Level (ft):
Total Depth of Boring (ft):Project Name:Project Number:
PID
/FID
(ppm
v)
Notes
%R
ecov
ery
0
2
4
6
8
10
12
14
16
18
20
22
24
26
28
30
-4'
CGP
BC-GP25/21/19
SCS
Dual TubeButler
19-716-10
Dark brown, FILL: brick, wood and cinderspresent, moist.
Gray, FILL: sandy gravel, slightly moist, no odor.
Gray, orange mottling, SILTY CLAY: tracegravel, slightly moist, no odor.
0.2
0.2
100%
FILL
CL Analyzed soil sample -3 to -4 feet.
Analyzed soil sample -0.5 to -1.5 feet.

Sam
ple
Scal
e
Gra
phic
Log
USC
S
Lithology
Soil Boring:Date Drilled:Logged By:
Drilled By:
Sample Tool:
Initial Water Level (ft):
Total Depth of Boring (ft):Project Name:Project Number:
PID
/FID
(ppm
v)
Notes
%R
ecov
ery
0
2
4
6
8
10
12
14
16
18
20
22
24
26
28
30
-4'
CGP
BC-GP35/21/19
SCS
Dual TubeButler
19-716-10
TOPSOIL: fill.
Tan, FILL: sand and gravel, poorly sorted, slightlymoist.
Dark brown, SAND: fill, with some gravel andcinders.
Gray, orange mottling, SILTY CLAY: tracegravel, slightly moist, no odor.
0.7
0.3
60%
GW
SP
CL
Fill
Fill
Analyzed soil sample -3 to -4 feet.
Analyzed soil sample -1 to -2 feet.

Sam
ple
Scal
e
Gra
phic
Log
USC
S
Lithology
Soil Boring:Date Drilled:Logged By:
Drilled By:
Sample Tool:
Initial Water Level (ft):
Total Depth of Boring (ft):Project Name:Project Number:
PID
/FID
(ppm
v)
Notes
%R
ecov
ery
0
2
-2'
CGP
BC GP3-N56/18/19
SCS
Hand AugerButler
19-716-10
TOPSOIL: organics present, moist, no odor.
Brown, GRAVELLY, CLAYEY SAND: moist, noodor.
Brown, GRAVELLY, CLAYEY SAND: somebricks, moist, no odor.
Gray, brown mottling, SILTY CLAY: slightlydense, slightly moist, no odor.
OL
SP
CL
Soil sample analyzed between-1 and -2 feet.

Sam
ple
Scal
e
Gra
phic
Log
USC
S
Lithology
Soil Boring:Date Drilled:Logged By:
Drilled By:
Sample Tool:
Initial Water Level (ft):
Total Depth of Boring (ft):Project Name:Project Number:
PID
/FID
(ppm
v)
Notes
%R
ecov
ery
0
2
-2'
CGP
BC GP3-E56/18/19
SCS
Hand AugerButler
19-716-10
TOPSOIL: organics present, moist, no odor.
Brown, GRAVELLY, CLAYEY SAND: mediumto large grained, slightly moist, no odor.
Black, SAND: foundry sand and slag, clay at -2feet.
OL
SP Soil sample analyzed between-1 and -2 feet.
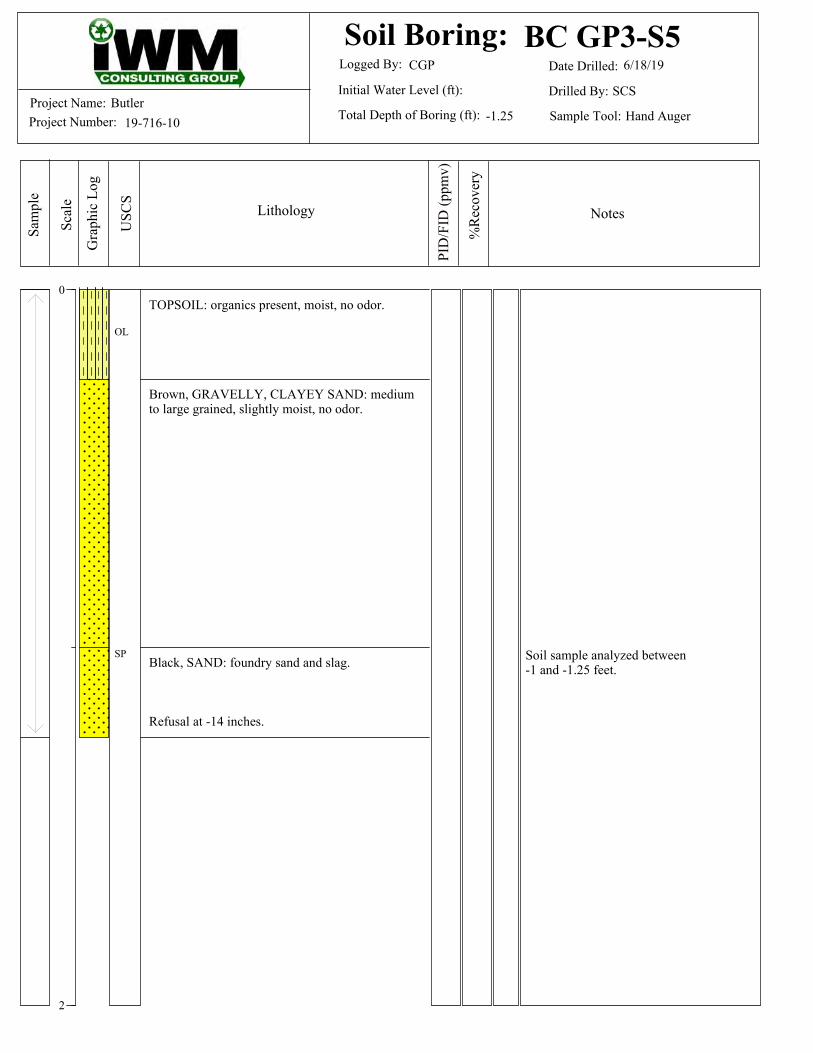
Sam
ple
Scal
e
Gra
phic
Log
USC
S
Lithology
Soil Boring:Date Drilled:Logged By:
Drilled By:
Sample Tool:
Initial Water Level (ft):
Total Depth of Boring (ft):Project Name:Project Number:
PID
/FID
(ppm
v)
Notes
%R
ecov
ery
0
2
-1.25
CGP
BC GP3-S56/18/19
SCS
Hand AugerButler
19-716-10
TOPSOIL: organics present, moist, no odor.
Brown, GRAVELLY, CLAYEY SAND: mediumto large grained, slightly moist, no odor.
Black, SAND: foundry sand and slag.
Refusal at -14 inches.
OL
SP Soil sample analyzed between-1 and -1.25 feet.
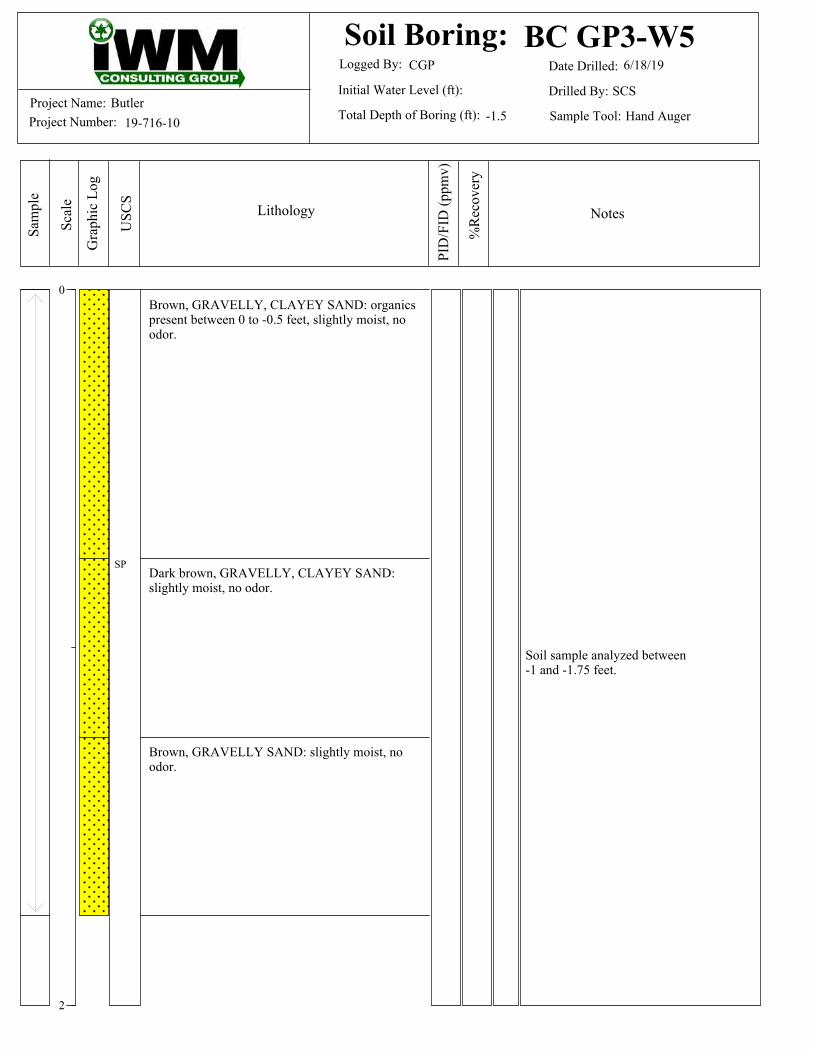
Sam
ple
Scal
e
Gra
phic
Log
USC
S
Lithology
Soil Boring:Date Drilled:Logged By:
Drilled By:
Sample Tool:
Initial Water Level (ft):
Total Depth of Boring (ft):Project Name:Project Number:
PID
/FID
(ppm
v)
Notes
%R
ecov
ery
0
2
-1.5
CGP
BC GP3-W56/18/19
SCS
Hand AugerButler
19-716-10
Brown, GRAVELLY, CLAYEY SAND: organicspresent between 0 to -0.5 feet, slightly moist, noodor.
Dark brown, GRAVELLY, CLAYEY SAND:slightly moist, no odor.
Brown, GRAVELLY SAND: slightly moist, noodor.
SP
Soil sample analyzed between-1 and -1.75 feet.

Sam
ple
Scal
e
Gra
phic
Log
USC
S
Lithology
Soil Boring:Date Drilled:Logged By:
Drilled By:
Sample Tool:
Initial Water Level (ft):
Total Depth of Boring (ft):Project Name:Project Number:
PID
/FID
(ppm
v)
Notes
%R
ecov
ery
0
2
-2'
CGP
BC GP3-E106/18/19
SCS
Hand AugerButler
19-716-10
Brown, GRAVELLY SAND: medium to largegrained, with cobbles, slightly moist, no odor.
Black, SAND: foundry sand, some slag, clay at -2feet, slightly moist, no odor.
SP Soil sample analyzed between-1 and -2 feet.

Sam
ple
Scal
e
Gra
phic
Log
USC
S
Lithology
Soil Boring:Date Drilled:Logged By:
Drilled By:
Sample Tool:
Initial Water Level (ft):
Total Depth of Boring (ft):Project Name:Project Number:
PID
/FID
(ppm
v)
Notes
%R
ecov
ery
0
2
-2'
CGP
BC GP3-S106/18/19
SCS
Hand AugerButler
19-716-10
Brown, GRAVELLY SAND: medium to largegrained, with cobbles, slightly moist, no odor.
Black, SAND: foundry sand and slag.
SP
Soil sample analyzed between-1 and -2 feet.

Sam
ple
Scal
e
Gra
phic
Log
USC
S
Lithology
Soil Boring:Date Drilled:Logged By:
Drilled By:
Sample Tool:
Initial Water Level (ft):
Total Depth of Boring (ft):Project Name:Project Number:
PID
/FID
(ppm
v)
Notes
%R
ecov
ery
0
2
-1.75
CGP
BC GP3-W106/18/19
SCS
Hand AugerButler
19-716-10
Brown, GRAVELLY, CLAYEY SAND: organicspresent between 0 to -0.5 feet, slightly moist, noodor.
Dark brown, GRAVELLY, CLAYEY SAND:slightly moist, no odor.
Brown, GRAVELLY SAND: slightly moist, noodor.
SP
Soil sample analyzed between-1 and -1.75 feet.

Sam
ple
Scal
e
Gra
phic
Log
USC
S
Lithology
Soil Boring:Date Drilled:Logged By:
Drilled By:
Sample Tool:
Initial Water Level (ft):
Total Depth of Boring (ft):Project Name:Project Number:
PID
/FID
(ppm
v)
Notes
%R
ecov
ery
0
2
4
6
8
10
12
14
16
18
20
22
24
26
28
30
-4'
CGP
BC-GP45/21/19
SCS
Dual TubeButler
19-716-10
TOPSOIL: organics present.
Dark brown, SANDY FILL: slag, cinders, wooddebris present.
Gray, orange mottling, SILTY CLAY: tracegravel, slightly moist, no odor.
0.3
0.2
60%FILL
CL Analyzed soil sample -3 to -4 feet.
Analyzed soil sample -1 to -2 feet.

Sam
ple
Scal
e
Gra
phic
Log
USC
S
Lithology
Soil Boring:Date Drilled:Logged By:
Drilled By:
Sample Tool:
Initial Water Level (ft):
Total Depth of Boring (ft):Project Name:Project Number:
PID
/FID
(ppm
v)
Notes
%R
ecov
ery
0
2
4
6
8
10
12
14
16
18
20
22
24
26
28
30
-4'
CGP
BC-GP55/21/19
SCS
Dual TubeButler
19-716-10
Tan, FILL: silty clay, brick and some gravelpresent, slag present at -3 feet.
Gray, orange mottling, SILTY CLAY: plastic,moist, no odor.
0.3
0.3
100%FILLCL
CL Analyzed soil sample -3.5 to -4 feet.
Analyzed soil sample -2 to -3 feet.

Sam
ple
Scal
e
Gra
phic
Log
USC
S
Lithology
Soil Boring:Date Drilled:Logged By:
Drilled By:
Sample Tool:
Initial Water Level (ft):
Total Depth of Boring (ft):Project Name:Project Number:
PID
/FID
(ppm
v)
Notes
%R
ecov
ery
0
2
4
6
8
10
12
14
16
18
20
22
24
26
28
30
-4'
CGP
BC-GP65/21/19
SCS
Dual TubeButler
19-716-10
TOPSOIL: organics present.
Dark brown, FILL: some sand and some gravelpresent, slag, cinders, wood debris, brick, one inchof black, fine, foundry sand at -2 feet bsg present,slightly moist, no odor.
Gray, SILTY CLAY: plastic, moist, no odor.
0.3
0.3
60%FILL
CL Analyzed soil sample -3 to -4 feet.
Analyzed soil sample -1 to -2 feet.

Sam
ple
Scal
e
Gra
phic
Log
USC
S
Lithology
Soil Boring:Date Drilled:Logged By:
Drilled By:
Sample Tool:
Initial Water Level (ft):
Total Depth of Boring (ft):Project Name:Project Number:
PID
/FID
(ppm
v)
Notes
%R
ecov
ery
0
2
4
6
8
10
12
14
16
18
20
22
24
26
28
30
-6'
CGP
BC-GP75/21/19
SCS
Dual TubeButler
19-716-10
TOPSOIL: organics present.
Dark brown, FILL: wood, slag, cinder present,some gravel, no odor.
Gray, orange/brown mottling, SILTY CLAY:dense, slightly moist, no odor.
0.3
4.5
0.3
90%
90%
FILL
CLAnalyzed soil sample -3 to -4 feet.
Analyzed soil sample -1 to -2 feet.

Sam
ple
Scal
e
Gra
phic
Log
USC
S
Lithology
Soil Boring:Date Drilled:Logged By:
Drilled By:
Sample Tool:
Initial Water Level (ft):
Total Depth of Boring (ft):Project Name:Project Number:
PID
/FID
(ppm
v)
Notes
%R
ecov
ery
0
2
4
6
8
10
12
14
16
18
20
22
24
26
28
30
-4'
CGP
BC-GP85/21/19
SCS
Dual TubeButler
19-716-10
TOPSOIL: organics present.
Dark brown, FILL: slag, wood, slag, cinderpresent some gravel, no odor.
Gray, orange mottling, SILTY CLAY: dense,slightly moist, no odor.
0.3
32.0
70%FILL
CL Analyzed soil sample -3 to -4 feet.
Analyzed soil sample -2 to -3 feet.
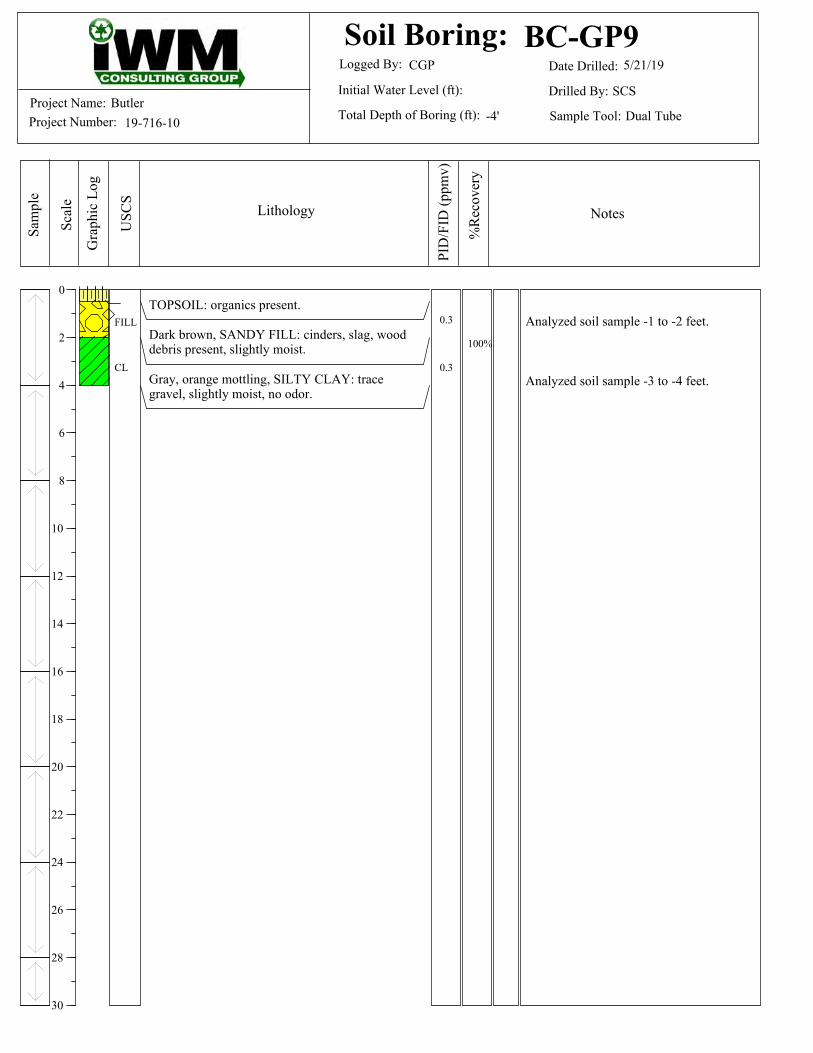
Sam
ple
Scal
e
Gra
phic
Log
USC
S
Lithology
Soil Boring:Date Drilled:Logged By:
Drilled By:
Sample Tool:
Initial Water Level (ft):
Total Depth of Boring (ft):Project Name:Project Number:
PID
/FID
(ppm
v)
Notes
%R
ecov
ery
0
2
4
6
8
10
12
14
16
18
20
22
24
26
28
30
-4'
CGP
BC-GP95/21/19
SCS
Dual TubeButler
19-716-10
TOPSOIL: organics present.
Dark brown, SANDY FILL: cinders, slag, wooddebris present, slightly moist.
Gray, orange mottling, SILTY CLAY: tracegravel, slightly moist, no odor.
0.3
0.3
100%
FILL
CLAnalyzed soil sample -3 to -4 feet.
Analyzed soil sample -1 to -2 feet.

Sam
ple
Scal
e
Gra
phic
Log
USC
S
Lithology
PID
/FID
Scal
e
Well Construction
Temporary Well:Date Drilled:
Logged By:
Drilled By:
Sample Tool:
Initial Water Level (ft):
Total Depth of Boring (ft):Project Name:Project Number:
Final Water Level (ft):
Top of Casing Elevation (ft):
%R
ecov
ery
Notes
2
0
-2
-4
-6
-8
-10
-12
-14
-16
-18
-20
-22
-24
-26
-28
-30
2
0
-2
-4
-6
-8
-10
-12
-14
-16
-18
-20
-22
-24
-26
-28
-30
BC-GP10-24'
-28''
CGP5/21/19
SCSDual Tube
Butler19-716-10
0.2
0.2
0.3
0.7
0.2
0.2
0.2
0.2
0.2
0.2
0.2
0.2
0.2
0.2
FILL
CL
SP
ML
SP
Borehole Diameter:3.25 inches
Well Diameter: 2 inch
Analyzed soil sample-1 to -2 feet.
Wet at -24 feet.
10' 10-Slot PVC Screen
Bentonite
Sand
Tan, SANDY FILL: brick, cinders and slagpresent.
Orange, gray mottling, SILTY CLAY: tracegravel, dense, moist, no odor.
Tan, gray mottling, SILTY CLAY: trace gravel,dense, moist, no odor.
Gray, tan-brown mottling, SILTY CLAY: dense,slightly moist, no odor.
Gray, SAND: fine to medium grained, two inchsand seam at -19 feet, very moist, no odor.
Gray, GRAVELLY SAND: coarse grained, verymoist, no odor.
Tan, SANDY SILT: tight, plastic, very moist, noodor.
Gray, SAND: medium grained, trace gravel, wetat -24 feet, no odor.
40%
90%
100%
100%
100%
100%
100%
100%
100%

Sam
ple
Scal
e
Gra
phic
Log
USC
S
Lithology
PID
/FID
Scal
e
Well Construction
Temporary Well:Date Drilled:
Logged By:
Drilled By:
Sample Tool:
Initial Water Level (ft):
Total Depth of Boring (ft):Project Name:Project Number:
Final Water Level (ft):
Top of Casing Elevation (ft):
%R
ecov
ery
Notes
2
0
-2
-4
-6
-8
-10
-12
-14
-16
-18
-20
-22
-24
-26
-28
-30
2
0
-2
-4
-6
-8
-10
-12
-14
-16
-18
-20
-22
-24
-26
-28
-30
BC-GP11-24'
-28'
CGP5/21/19
SCSDual Tube
Butler19-716-10
0.3
0.2
0.2
0.4
0.2
0.2
0.2
0.4
0.2
0.2
0.2
0.2
0.2
0.2
OL
FILL
FILL/CL
CL
SP
ML
SP
Borehole Diameter:3.25 inches
Well Diameter: 2 inch
Analyzed soil sample-0.5 to -1.5 feet.
Wet at -24 feet.
10' 10-Slot PVC Screen
Bentonite
Sand
TOPSOIL: organics present.
Dark brown, SANDY FILL: brick, glass and burndepris present, slightly moist, no odor.
Gray, FILL: silty clay, dense, slightly moist, noodor.
Wood debris.
Gray, SILTY CLAY: plastic, moist, no odor.
Tan, SILTY CLAY: trace gravel, dense, moist,no odor.
Gray, SILTY CLAY: trace gravel, dense, moist,no odor.
Gray, SAND: fine to medium grained, slightlydense, very moist, no odor.
Gray, GRAVELLY SAND: coarse grained, verymoist, no odor.
Tan, CLAYEY SILT: dense, very moist, no odor.
Gray, GRAVELLY SAND: medium grained,very moist to wet at -24 feet, no odor.
60%
50%
80%
100%
100%
100%
100%
70%
100%
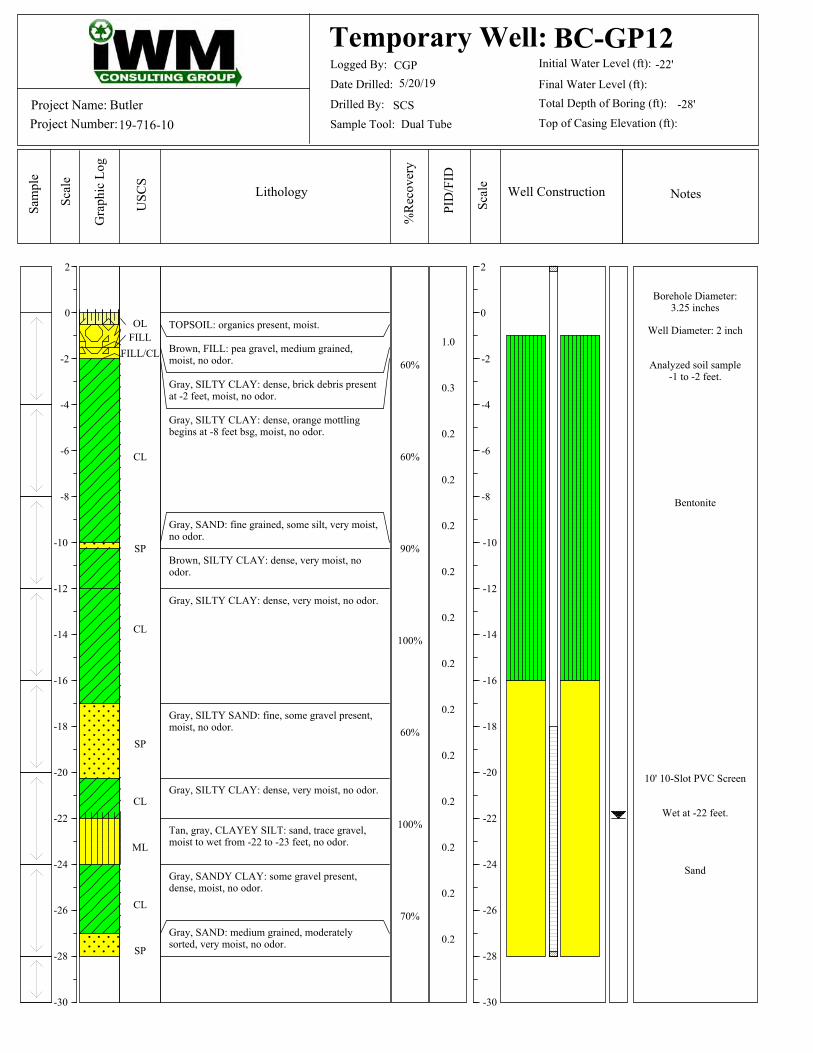
Sam
ple
Scal
e
Gra
phic
Log
USC
S
Lithology
PID
/FID
Scal
e
Well Construction
Temporary Well:Date Drilled:
Logged By:
Drilled By:
Sample Tool:
Initial Water Level (ft):
Total Depth of Boring (ft):Project Name:Project Number:
Final Water Level (ft):
Top of Casing Elevation (ft):
%R
ecov
ery
Notes
2
0
-2
-4
-6
-8
-10
-12
-14
-16
-18
-20
-22
-24
-26
-28
-30
2
0
-2
-4
-6
-8
-10
-12
-14
-16
-18
-20
-22
-24
-26
-28
-30
BC-GP12-22'
-28'
CGP5/20/19
SCSDual Tube
Butler19-716-10
1.0
0.3
0.2
0.2
0.2
0.2
0.2
0.2
0.2
0.2
0.2
0.2
0.2
0.2
OLFILL
FILL/CL
CL
SP
CL
SP
CL
ML
CL
SP
Borehole Diameter:3.25 inches
Well Diameter: 2 inch
Analyzed soil sample-1 to -2 feet.
Wet at -22 feet.
10' 10-Slot PVC Screen
Bentonite
Sand
TOPSOIL: organics present, moist.
Brown, FILL: pea gravel, medium grained,moist, no odor.
Gray, SILTY CLAY: dense, brick debris presentat -2 feet, moist, no odor.
Gray, SILTY CLAY: dense, orange mottlingbegins at -8 feet bsg, moist, no odor.
Gray, SAND: fine grained, some silt, very moist,no odor.
Brown, SILTY CLAY: dense, very moist, noodor.
Gray, SILTY CLAY: dense, very moist, no odor.
Gray, SILTY SAND: fine, some gravel present,moist, no odor.
Gray, SILTY CLAY: dense, very moist, no odor.
Tan, gray, CLAYEY SILT: sand, trace gravel,moist to wet from -22 to -23 feet, no odor.
Gray, SANDY CLAY: some gravel present,dense, moist, no odor.
Gray, SAND: medium grained, moderatelysorted, very moist, no odor.
60%
60%
90%
100%
60%
100%
70%

Sam
ple
Scal
e
Gra
phic
Log
USC
S
Lithology
PID
/FID
Scal
e
Well Construction
Temporary Well:Date Drilled:
Logged By:
Drilled By:
Sample Tool:
Initial Water Level (ft):
Total Depth of Boring (ft):Project Name:Project Number:
Final Water Level (ft):
Top of Casing Elevation (ft):
%R
ecov
ery
Notes
2
0
-2
-4
-6
-8
-10
-12
-14
-16
-18
-20
-22
-24
-26
-28
-30
2
0
-2
-4
-6
-8
-10
-12
-14
-16
-18
-20
-22
-24
-26
-28
-30
BC-GP13-4'
-16'
CGP5/20/19
SCSDual Tube
Butler19-716-10
0.3
0.3
0.2
0.2
0.2
0.2
0.2
0.2
OL
FILL
CL
Borehole Diameter:3.25 inches
Well Diameter: 2 inch
Analyzed soil sample-1 to -2 feet.
Wet at -4 feet.
5' 10-Slot PVC Screen
Bentonite
Sand
TOPSOIL: organics present.
Brown-black, SANDY FILL: glass, brick andburn debris present, moist to wet at -4 feet, noodor.
Dark brown, SILTY CLAY: soft peat, verymoist, slight organic odor.
Gray, SILTY CLAY: very plastic to dense at -7feet, very moist, no odor.
30%
50%
60%
60%

Sam
ple
Scal
e
Gra
phic
Log
USC
S
Lithology
PID
/FID
Scal
e
Well Construction
Temporary Well:Date Drilled:
Logged By:
Drilled By:
Sample Tool:
Initial Water Level (ft):
Total Depth of Boring (ft):Project Name:Project Number:
Final Water Level (ft):
Top of Casing Elevation (ft):
%R
ecov
ery
Notes
2
0
-2
-4
-6
-8
-10
-12
-14
-16
-18
-20
-22
-24
-26
-28
-30
2
0
-2
-4
-6
-8
-10
-12
-14
-16
-18
-20
-22
-24
-26
-28
-30
BC-GP14-28'
-30'
CGP5/20/19
SCSDual Tube
Butler19-716-10
0.2
0.2
0.3
-0.3
0.3
0.3
0.3
0.3
0.3
0.5
0.3
0.3
0.3
0.3
0.3
0.3
OLFILL/CL
CL
SP
CL
SP
Borehole Diameter:3.25 inches
Well Diameter: 2 inch
Analyzed soil sample-0.5 to -1.5 feet.
Wet at -28 feet.
10' 10-Slot PVC Screen
Bentonite
Sand
TOPSOIL: organics present, moist.
Brown, SILTY CLAY: trace gravel, dense, brickand burn debris present at -1 foot bsg, slightlymoist, no odor.
Brown, SILTY CLAY: trace gravel, dense,slightly moist, no odor.
Brown, gray mottling, SILTY CLAY: tracegravel, dense, slightly moist, no odor.
Gray, brown mottling, SILTY CLAY: tracegravel, dense, slightly moist, no odor.
Brown, SILTY CLAY: trace gravel, dense,slightly moist, no odor.
Gray, SILTY CLAY: trace gravel, very dense,moist, no odor.
Gray, SAND: fine to medium grained,moderately sorted, moist to slightly moist, noodor.
Gray, GRAVELLY SAND: poorly sorted, verymoist, no odor.
Gray, SILTY CLAY: trace gravel and some sandpresent, very moist at -25 to -26 feet, slightlymoist from-26 to -28 feet, no odor.
Gray, SAND: medium to coarse grained, somegravel, wet, no odor.
50%
100%
100%
100%
100%
100%
100%
100%
100%
100%

Sam
ple
Scal
e
Gra
phic
Log
USC
S
Lithology
PID
/FID
Scal
e
Well Construction
Temporary Well:Date Drilled:
Logged By:
Drilled By:
Sample Tool:
Initial Water Level (ft):
Total Depth of Boring (ft):Project Name:Project Number:
Final Water Level (ft):
Top of Casing Elevation (ft):
%R
ecov
ery
Notes
2
0
-2
-4
-6
-8
-10
-12
-14
-16
-18
-20
-22
-24
-26
-28
-30
2
0
-2
-4
-6
-8
-10
-12
-14
-16
-18
-20
-22
-24
-26
-28
-30
BC-GP15-27'
-30'
CGP5/21/19
SCSDual Tube
Butler19-716-10
0.3
0.3
0.3
0.3
0.3
0.3
0.3
0.3
0.3
0.3
0.3
0.3
0.3
0.3
0.3
OLFILL
CL
SP
ML
SP
Borehole Diameter:3.25 inches
Well Diameter: 2 inch
Analyzed soil sample-0.5 to -1 feet.
Wet at -27 feet.
10' 10-Slot PVC Screen
Bentonite
Sand
TOPSOIL: organics present.
Dark brown, SANDY FILL: gravel and cinderspresent.
Gray, orange mottling, SILTY CLAY: tracegravel, dense, slightly moist to moist, no odor.
Gray, SILTY CLAY: trace gravel, dense, brownmottling from -14 to -16 feet, slightly moist.
Gray, SAND: fine to medium grained,moderately sorted, very moist, no odor.
Gray, SANDY, CLAYEY SILT: dense, verymoist, no odor.
Gray, SAND: medium to coarse grained, somegravel, wet at -27 feet, no odor.
70%
50%
100%
100%
100%
100%
100%
100%
80%
80%
70%

Sam
ple
Scal
e
Gra
phic
Log
USC
S
Lithology
Soil Boring:Date Drilled:Logged By:
Drilled By:
Sample Tool:
Initial Water Level (ft):
Total Depth of Boring (ft):Project Name:Project Number:
PID
/FID
(ppm
v)
Notes
%R
ecov
ery
0
2
-2'
CGP
BC GP16-N56/18/19
SCS
Hand AugerButler
19-716-10
Black, SAND: foundry sand and slag prsent,slightly moist, no odor.
Brown, SAND: fine to medium grained, brickpresent, moist, no odor.
SP Soil sample analyzed between-1 and -2 feet.

Sam
ple
Scal
e
Gra
phic
Log
USC
S
Lithology
Soil Boring:Date Drilled:Logged By:
Drilled By:
Sample Tool:
Initial Water Level (ft):
Total Depth of Boring (ft):Project Name:Project Number:
PID
/FID
(ppm
v)
Notes
%R
ecov
ery
0
2
-1.75
CGP
BC GP16-E56/18/19
SCS
Hand AugerButler
19-716-10
Black, SAND: foundry sand and slag prsent,slightly moist, no odor.
Brown, SAND: fine to medium grained, brickpresent, moist, no odor.
SP Soil sample analyzed between-1 and -1.75 feet.
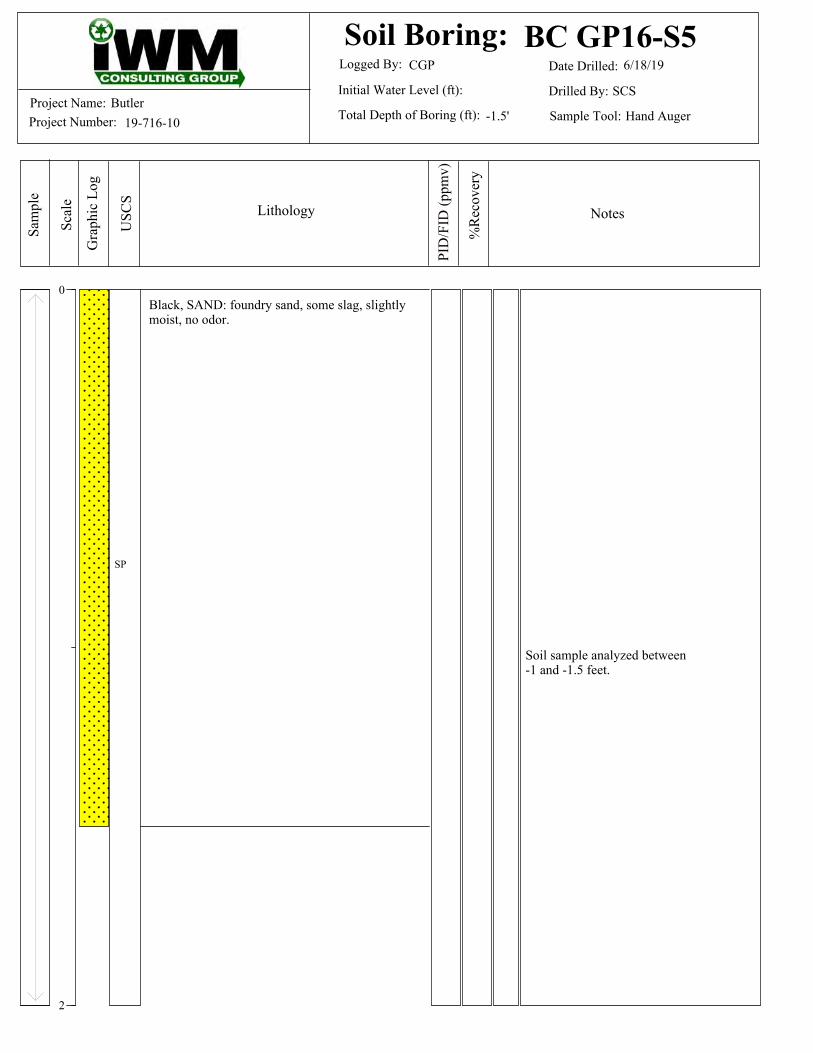
Sam
ple
Scal
e
Gra
phic
Log
USC
S
Lithology
Soil Boring:Date Drilled:Logged By:
Drilled By:
Sample Tool:
Initial Water Level (ft):
Total Depth of Boring (ft):Project Name:Project Number:
PID
/FID
(ppm
v)
Notes
%R
ecov
ery
0
2
-1.5'
CGP
BC GP16-S56/18/19
SCS
Hand AugerButler
19-716-10
Black, SAND: foundry sand, some slag, slightlymoist, no odor.
SP
Soil sample analyzed between-1 and -1.5 feet.

Sam
ple
Scal
e
Gra
phic
Log
USC
S
Lithology
Soil Boring:Date Drilled:Logged By:
Drilled By:
Sample Tool:
Initial Water Level (ft):
Total Depth of Boring (ft):Project Name:Project Number:
PID
/FID
(ppm
v)
Notes
%R
ecov
ery
0
2
-1.5'
CGP
BC GP16-W56/18/19
SCS
Hand AugerButler
19-716-10
Black, SAND: foundry sand, some slag, slightlymoist, no odor.
SP
Soil sample analyzed between-1 and -1.5 feet.

Sam
ple
Scal
e
Gra
phic
Log
USC
S
Lithology
Soil Boring:Date Drilled:Logged By:
Drilled By:
Sample Tool:
Initial Water Level (ft):
Total Depth of Boring (ft):Project Name:Project Number:
PID
/FID
(ppm
v)
Notes
%R
ecov
ery
0
2
-2'
CGP
BC GP16-N106/18/19
SCS
Hand AugerButler
19-716-10
Black, SAND: foundry sand and slag prsent,slightly moist, no odor.
Brown, SAND: fine to medium grained, brickpresent, moist, no odor.
SP Soil sample analyzed between-1 and -2 feet.

Sam
ple
Scal
e
Gra
phic
Log
USC
S
Lithology
Soil Boring:Date Drilled:Logged By:
Drilled By:
Sample Tool:
Initial Water Level (ft):
Total Depth of Boring (ft):Project Name:Project Number:
PID
/FID
(ppm
v)
Notes
%R
ecov
ery
0
2
-1.5'
CGP
BC GP16-E106/18/19
SCS
Hand AugerButler
19-716-10
Black, SAND: foundry sand, some slag and brick,slightly moist, no odor.
SP

Sam
ple
Scal
e
Gra
phic
Log
USC
S
Lithology
Soil Boring:Date Drilled:Logged By:
Drilled By:
Sample Tool:
Initial Water Level (ft):
Total Depth of Boring (ft):Project Name:Project Number:
PID
/FID
(ppm
v)
Notes
%R
ecov
ery
0
2
-2'
CGP
BC GP16-S106/18/19
SCS
Hand AugerButler
19-716-10
Black, SAND: foundry sand, some slag, slightlymoist, no odor.
SP
Soil sample analyzed between-1 and -2 feet.

Sam
ple
Scal
e
Gra
phic
Log
USC
S
Lithology
Soil Boring:Date Drilled:Logged By:
Drilled By:
Sample Tool:
Initial Water Level (ft):
Total Depth of Boring (ft):Project Name:Project Number:
PID
/FID
(ppm
v)
Notes
%R
ecov
ery
0
2
-2'
CGP
BC GP16-W106/18/19
SCS
Hand AugerButler
19-716-10
Black, SAND: foundry sand, some slag, slightlymoist, no odor.
SP Soil sample analyzed between-1 and -2 feet.

Sam
ple
Scal
e
Gra
phic
Log
USC
S
Lithology
PID
/FID
Scal
e
Well Construction
Date Drilled:
Logged By:
Drilled By:
Sample Tool:
Initial Water Level (ft):
Total Depth of Boring (ft):Project Name:Project Number:
Final Water Level (ft):
Top of Casing Elevation (ft):
%R
ecov
ery
Notes
Soil Vapor Probe:
0
-2
-4
-6
0
-2
-4
-6
-7
CGP5/21/19
SCSDual Tube
Butler19-716-10
BC-SG1
OL
FILL
CL
Borehole Diameter:2.25 inches
6' 1/4" Teflon Tubing
6" Stainless SteelScreen
Bentonite Grout
Bentonite Chips
Sand
TOPSOIL: organics present.
Dark brown, FILL: wood, slag, cinder present,some gravel, no odor.
Gray, orange/brown mottling, SILTY CLAY:dense, slightly moist, no odor.

Sam
ple
Scal
e
Gra
phic
Log
USC
S
Lithology
PID
/FID
Scal
e
Well Construction
Date Drilled:
Logged By:
Drilled By:
Sample Tool:
Initial Water Level (ft):
Total Depth of Boring (ft):Project Name:Project Number:
Final Water Level (ft):
Top of Casing Elevation (ft):
%R
ecov
ery
Notes
Soil Vapor Probe:
0
-2
-4
-6
0
-2
-4
-6
-5
CGP5/21/19
SCSDual Tube
Butler19-716-10
BC-SG2
OL
FILL
CL
Borehole Diameter:2.25 inches
4' 1/4" Teflon Tubingto grade
6" Stainless SteelScreen
Bentonite Grout
Bentonite Chips
Sand
TOPSOIL: organics present.
Dark brown, FILL: wood, slag, cinder present,some gravel, no odor.
Gray, orange/brown mottling, SILTY CLAY:dense, slightly moist, no odor.

Sam
ple
Scal
e
Gra
phic
Log
USC
S
Lithology
PID
/FID
Scal
e
Well Construction
Date Drilled:
Logged By:
Drilled By:
Sample Tool:
Initial Water Level (ft):
Total Depth of Boring (ft):Project Name:Project Number:
Final Water Level (ft):
Top of Casing Elevation (ft):
%R
ecov
ery
Notes
Soil Vapor Probe:
0
-2
-4
-6
0
-2
-4
-6
-4
CGP5/21/19
SCSDual Tube
Butler19-716-10
BC-SG3
OL
FILL
CL
Borehole Diameter:2.25 inches
3' 1/4" Teflon Tubingto grade
6" Stainless SteelScreen
Bentonite Grout
Bentonite Chips
Sand
TOPSOIL: organics present, moist.
Brown, FILL: pea gravel, medium grained,moist, no odor.
Gray, SILTY CLAY: dense, brick debris presentat -2 feet, orange mottling begins at -8 feet bsg,no odor.
Remediation Work Plan BFD #4170705
REMEDIATION WORK PLAN
APPENDIX D. DATA COMPILATION TABLES AND FIGURES
The Butler Company 325 S Broadway St
Butler, DeKalb County, Indiana 46721 BFD #4170705

Remediation Work Plan BFD #4170705
EXCERPTS FROM SES’S PHASE II SCREENING (June 13, 2018)

Office Locations
Detroit, Michigan (248) 459-7263
Grand Rapids, Michigan (616) 531-0503
Lansing, Michigan (517) 999-5800
Fort Wayne, Indiana (260) 497-7645
Indianapolis, Indiana (317) 841-8280
Louisville, Kentucky (502) 526-5179
PHASE II ENVIRONMENTAL SCREENING REPORT
The Butler Company 325 South Broadway Street
Butler, DeKalb County, Indiana
June 13, 2018
Prepared for:
City of Butler 215 South Broadway
Butler, IN 46721
Prepared By:

Phase II Environmental Screening
The Butler Company
325 South Broadway Street, Butler, Indiana
Page 4
• Samples were discharged directly into two laboratory-provided 40-ml glass sample vials containing HCl acid preservative, leaving no headspace for VOC analysis in accordance with SW846 Method 8260.
• Groundwater was then discharged into three 40-amber glass containers, containing no preservative. These samples were analyzed for PAHs in accordance with SW846 Method 8270.
• The final sample portion was discharged into one 500-mL plastic container with nitric acid preservative for metals analyses in accordance with SW846 Method 6010 and 7470. Additional sample volume was retained for dissolved metals analysis due to observed sediment in the samples. These additional samples were filtered by the laboratory using 0.45 μm membrane high capacity disposable filters
• Samples were labeled, entered chain-of-custody, placed into a cooler filled with ice, and transported to ENVision. The groundwater sampling included the collection of a duplicate sample. This duplicate sample was obtained at boring C and was identified as BH. The duplicate groundwater sample was analyzed for VOCs, PAHs, and metals. As previously noted, a trip blank accompanied investigation samples during transport to laboratory. The trip blank was analyzed for VOCs. Following completion of sampling, the sampling points were removed in general accordance with 312 IAC 13-10-2. 3.3 Screening Results
3.3.1 Soil and Groundwater Conditions
A mixture of sand, clay, gravel, cinders, debris, and brick fragments was present at the surface. At boring C, paint chips were observed. This fill material extended to depths of approximately 3 to 9 feet, followed by clay that extended to a depth of at least 20 feet (depth of exploration). Sand seams were occasionally interspersed with the clay and where present yielded groundwater, expect at boring A. Perched water was also observed in the fill material. Groundwater flow direction was not assessed. Soil conditions are depicted on boring logs provided in Appendix A.
• At boring A, groundwater was observed in sand at a depth of 15 feet. • At boring B, perched water was observed in fill material that extended to a depth of 9 feet. • At boring C, perched water was observed in fill material that extended to a depth of 5 feet. • At boring D, groundwater was observed in sand at a depth of 18 feet. • At boring E, groundwater was observed in sand at a depth of 14 feet. • At boring F, clay extended from the near surface to a depth of 19 feet and groundwater was not observed. • At boring G, groundwater was observed in sand at a depth of 6 feet.
Field evidence of contamination such as elevated PID responses and/or black staining was associated with the fill material. PID responses associated with the fill material generally ranged between 2 and 8 ppmv; however, PID responses ranged up to 56 ppmv at boring B. 3.3.2 Soil Testing Results
Five samples of fill material (borings A, B (two depth intervals), C, and D) were collected and analyzed for VOCs, PAHs, RCRA 8 metals, copper and zinc as a screening for contaminants of concern. Samples of native clay soil at borings E, F, and G were also collected and analyzed for the same parameters. Material described as dark and peat-like was observed at boring B and this material was sampled and analyzed for PCBs. A laboratory report is provided in Appendix B and soil testing results are depicted on Figure 2. Soil testing results are summarized in the following table. Remediation screening levels published in IDEM’s Remediation Closure Guide (RCG) are included for reference. IDEM’s RCG describes approaches to investigation and risk-based closure of contaminated or potentially contaminated sites. Its purpose is to

Phase II Environmental Screening
The Butler Company
325 South Broadway Street, Butler, Indiana
Page 5
provide for consistent application of Indiana Code (IC) 13-12-3-2 and IC 13-25-5-8.5, which form the statutory basis for risk-based cleanup in Indiana.
Table 1. Soil Testing Results 325 South Broadway Street, Butler, Indiana
Soil Boring ID
(depth interval) Sample
Collection Date
Detected Parameter Concentration (mg/kg)
Indiana Remediation Closure Guide Remediation Screening Levels
Residential
Direct Contact
Screening
Level
(mg/kg)
Commercial/
Industrial Direct
Contact Screening
Level
(mg/kg)
Excavation
Direct
Contact
Screening
Level (mg/kg)
Residential
Migration to
Groundwater
Screening
Level (mg/kg)
BA (0-2’)
Debris, Gravel, Sand and Cinders
5/22/2018 No VOCs Detected No PAHs Detected Detected RCRA Metals
Arsenic Barium
Chromium Copper Lead Zinc
<3 364 7.8 104 299 1210
9.5 21000
4300 400
32000
30 100000
47000
800 100000
920 100000
79000 1000
100000
5.9 1700
1,000,000 920 270
7500 BB (2-4’)
Bricks, Debris, Sand and Cinders
5/22/2018 No VOCs Detected No PAHs Detected Detected RCRA Metals
Arsenic Barium
Chromium Copper Lead Zinc
<2 26 8.9 21 35 58
9.5 21000
4300 400
32000
30 100000
47000
800 100000
920 100000
79000 1000
100000
5.9 1700
1,000,000 920 270
7500 BB (4-6’)
Peat-like material 5/22/2018 No PCBs Detected
BC (2-4’)
Bricks, Paint Chips, Cinders,
and Debris
5/22/2018 No VOCs Detected Detected PAHs Benzo(a)pyrene
Detected RCRA Metals Arsenic Barium
Cadmium Chromium
Copper Lead Zinc
Mercury
0.094
<2 549 5.6 56
617 7,160 1,790 1.23
1.5
9.5 21000
99
4300 400
32000 3.1
21
30 100000
980
47000 800
100000 3.1
500
920 100000
1900
79000 1000
100000 3.1
4.7
5.9 1700 7.5
1,000,000 920 270
7500 2.1
BD (0-2’)
Cinders and Debris
5/22/2018 No VOCs Detected No PAHs Detected Detected RCRA Metals
Arsenic Barium
Chromium Copper Lead Zinc
<2 45 6.3 6.3 8.6 29
9.5 21000
4300 400
32000
30 100000
47000
800 100000
920 100000
79000 1000
100000
5.9 1700
1,000,000 920 270
7500 BE (6-8’)
Clay
5/22/2018 No VOCs Detected Detected PAHs Detected Detected RCRA Metals
Arsenic Barium
Chromium Copper Lead Zinc
<3 75 14 15 9.4 34
9.5
21000
4300 400
32000
30
100000
47000 800
100000
920
100000
79000 1000
100000
5.9
1700 1,000,000
920 270
7500 Continued next page

Phase II Environmental Screening
The Butler Company
325 South Broadway Street, Butler, Indiana
Page 6
Table 1 Continued. Soil Testing Results 325 South Broadway Street, Butler, Indiana
Soil Boring ID
(depth interval) Sample
Collection Date
Detected Parameter Concentration (mg/kg)
Indiana Remediation Closure Guide Remediation Screening Levels
Residential
Direct Contact
Screening
Level
(mg/kg)
Commercial/
Industrial Direct
Contact Screening
Level
(mg/kg)
Excavation
Direct
Contact
Screening
Level (mg/kg)
Residential
Migration to
Groundwater
Screening
Level (mg/kg)
BF (2-4’)
Clay
5/22/2018 No VOCs Detected Detected PAHs Detected Detected RCRA Metals
Arsenic Barium
Chromium Copper Lead Zinc
<2 61 8.5 9.1 7.3 24
9.5
21000
4300 400
32000
30
100000
47000 800
100000
920
100000
79000 1000
100000
5.9
1700 1,000,000
920 270
7500 BG (6-8’)
Clay
5/22/2018 No VOCs Detected Detected PAHs Detected Detected RCRA Metals
Arsenic Barium
Chromium Copper Lead Zinc
<2 39 7.1 10 6.0 18
9.5
21000
4300 400
32000
30
100000
47000 800
100000
920
100000
79000 1000
100000
5.9
1700 1,000,000
920 270
7500 BH (6-8’)
Dup BC (2-4’)
5/22/2018 No VOCs Detected No PAHs Detected
Detected RCRA Metals Arsenic Barium
Cadmium Chromium
Copper Lead Zinc
Mercury
<3 2,220
9.5 247
2,090 28,700 2,980 1.78
9.5 21000
99
4300 400
32000 3.1
30 100000
980
47000 800
100000 3.1
920 100000
1900
79000 1000
100000 3.1
5.9 1700 7.5
1,000,000 920 270
7500 2.1
mg/kg – milligrams per kilogram (parts per million) PAH – polycyclic aromatic hydrocarbons PCB – Polychlorinated Biphenyls RCRA – Resource Conservation Recovery Act SVOC – Semi-Volatile Organic Compounds VOCs – Volatile Organic Compounds Bold – indicates concentration exceeds the migration to groundwater screening level Bold Underline – indicates concentration exceeds the residential direct contact screening level Yellow Highlighted – indicates concentration exceeds the industrial direct contact screening level Grey Shading indicates a potentially elevated concentration and evidence of contamination. Cadmium and mercury were not detected in any soil samples except sample BC. The chromium concentrations in the BC and BH samples ranged between 56 was 249 mg/kg, while the maximum concentration in all other samples was 14 mg/kg.
The tabulated soil testing results reveal the following: • Volatile organic compounds (VOCs) were not detected in soil samples or the fill sample.
• Polychlorinated biphenyls (PCBs) were not detected in the collected peat-like material sample.
• Polycyclic aromatic hydrocarbons (PAHs) were not detected in soil or fill samples, except for a trace concentration of benzo(a)pyrene (BaP) in fill at boring C. The detected benzo(a)pyrene concentration did not exceed any residential or commercial/industrial remediation screening level. In addition, BaP was not detected in the duplicate sample collected at boring C.
• Metals including barium, chromium, copper, lead, and zinc were detected in clay soil samples. These metals are known to occur naturally in soils and detected concentrations in clay soil samples did not exceed any residential or commercial/industrial remediation screening level.
• Metals including barium, cadmium, chromium, copper, lead, zinc, and mercury were detected in surface fill samples. The lead concentration in surface fill at boring A exceeded the migration to groundwater screening level
but did not exceed direct contact screening levels. The lead concentration in near surface fill at boring C was 7,160 mg/kg and exceeded remediation screening levels that range from the most conservative 270 mg/kg to 1,000 mg/kg. Cadmium and mercury were also detected in the surface fill at boring C, along with paint chips and a potentially
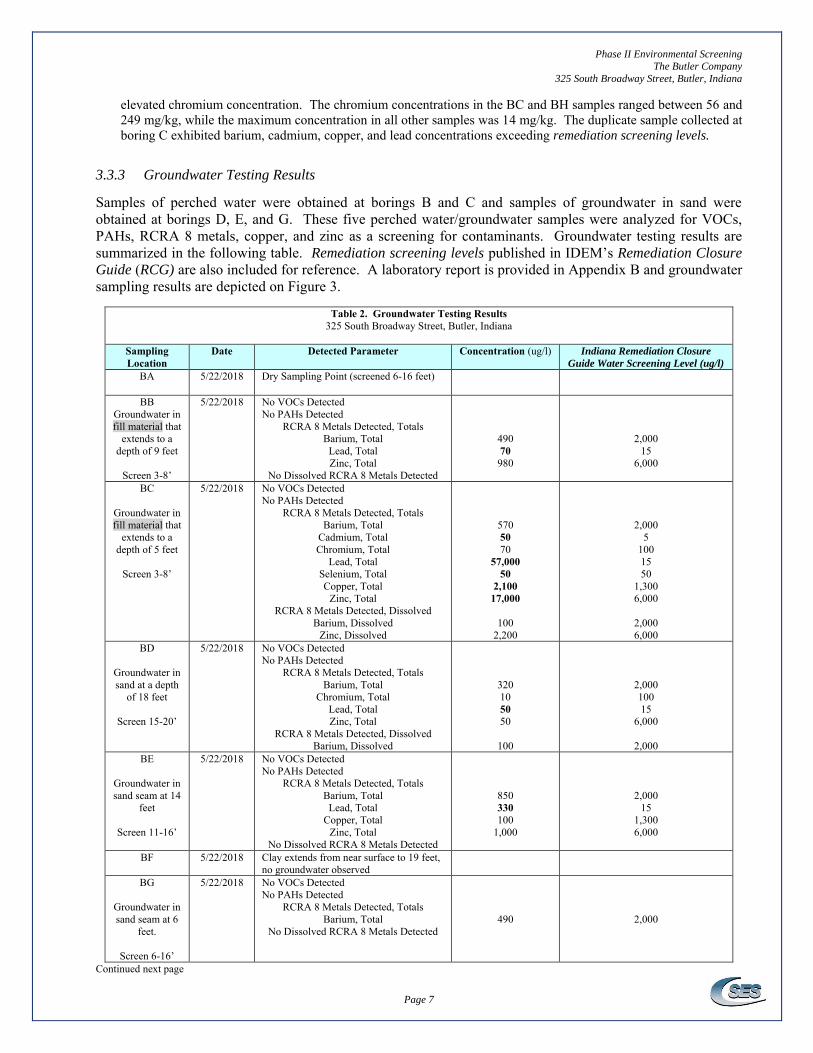
Phase II Environmental Screening
The Butler Company
325 South Broadway Street, Butler, Indiana
Page 7
elevated chromium concentration. The chromium concentrations in the BC and BH samples ranged between 56 and 249 mg/kg, while the maximum concentration in all other samples was 14 mg/kg. The duplicate sample collected at boring C exhibited barium, cadmium, copper, and lead concentrations exceeding remediation screening levels.
3.3.3 Groundwater Testing Results
Samples of perched water were obtained at borings B and C and samples of groundwater in sand were obtained at borings D, E, and G. These five perched water/groundwater samples were analyzed for VOCs, PAHs, RCRA 8 metals, copper, and zinc as a screening for contaminants. Groundwater testing results are summarized in the following table. Remediation screening levels published in IDEM’s Remediation Closure
Guide (RCG) are also included for reference. A laboratory report is provided in Appendix B and groundwater sampling results are depicted on Figure 3.
Table 2. Groundwater Testing Results 325 South Broadway Street, Butler, Indiana
Sampling Location
Date Detected Parameter Concentration (ug/l) Indiana Remediation Closure
Guide Water Screening Level (ug/l)
BA 5/22/2018 Dry Sampling Point (screened 6-16 feet)
BB Groundwater in fill material that
extends to a depth of 9 feet
Screen 3-8’
5/22/2018 No VOCs Detected No PAHs Detected
RCRA 8 Metals Detected, Totals Barium, Total
Lead, Total Zinc, Total
No Dissolved RCRA 8 Metals Detected
490 70 980
2,000 15
6,000
BC
Groundwater in fill material that
extends to a depth of 5 feet
Screen 3-8’
5/22/2018 No VOCs Detected No PAHs Detected
RCRA 8 Metals Detected, Totals Barium, Total
Cadmium, Total Chromium, Total
Lead, Total Selenium, Total Copper, Total
Zinc, Total RCRA 8 Metals Detected, Dissolved
Barium, Dissolved Zinc, Dissolved
570 50 70
57,000 50
2,100 17,000
100
2,200
2,000 5
100 15 50
1,300 6,000
2,000 6,000
BD
Groundwater in sand at a depth
of 18 feet
Screen 15-20’
5/22/2018 No VOCs Detected No PAHs Detected
RCRA 8 Metals Detected, Totals Barium, Total
Chromium, Total Lead, Total Zinc, Total
RCRA 8 Metals Detected, Dissolved Barium, Dissolved
320 10 50 50
100
2,000 100 15
6,000
2,000 BE
Groundwater in sand seam at 14
feet
Screen 11-16’
5/22/2018 No VOCs Detected No PAHs Detected
RCRA 8 Metals Detected, Totals Barium, Total
Lead, Total Copper, Total
Zinc, Total No Dissolved RCRA 8 Metals Detected
850 330 100
1,000
2,000 15
1,300 6,000
BF 5/22/2018 Clay extends from near surface to 19 feet, no groundwater observed
BG
Groundwater in sand seam at 6
feet.
Screen 6-16’
5/22/2018 No VOCs Detected No PAHs Detected
RCRA 8 Metals Detected, Totals Barium, Total
No Dissolved RCRA 8 Metals Detected
490
2,000
Continued next page
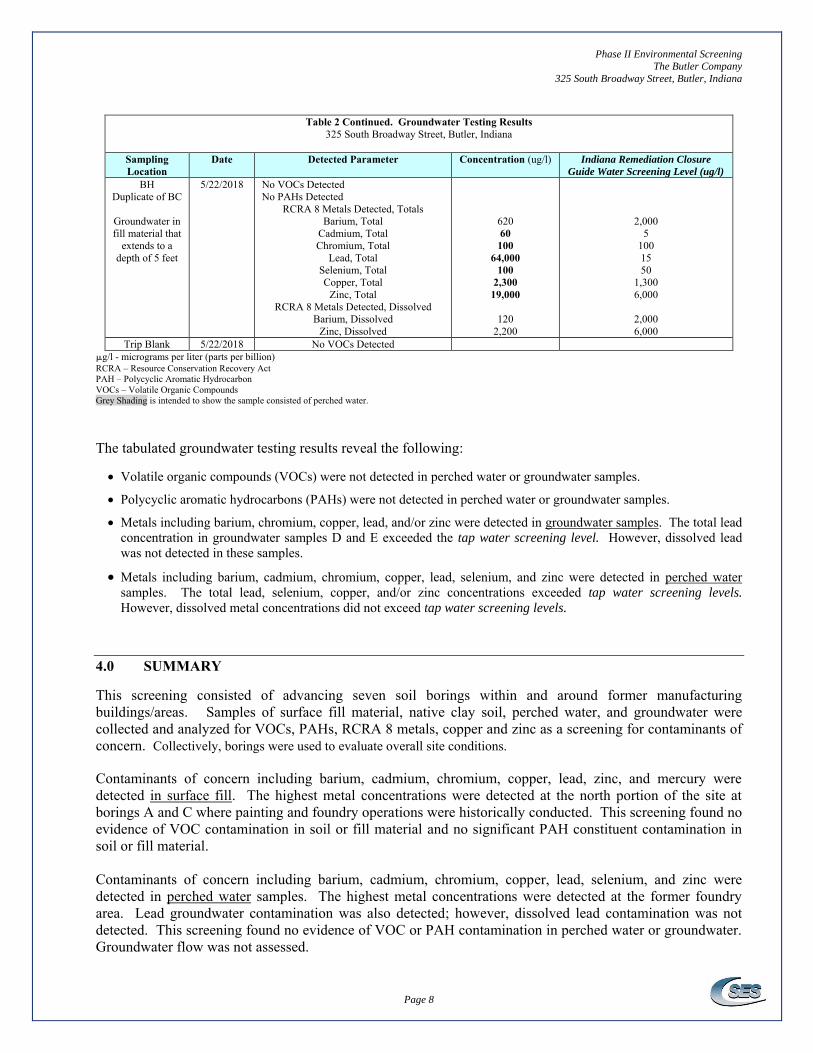
Phase II Environmental Screening
The Butler Company
325 South Broadway Street, Butler, Indiana
Page 8
Table 2 Continued. Groundwater Testing Results
325 South Broadway Street, Butler, Indiana
Sampling Location
Date Detected Parameter Concentration (ug/l) Indiana Remediation Closure
Guide Water Screening Level (ug/l)
BH Duplicate of BC
Groundwater in fill material that
extends to a depth of 5 feet
5/22/2018 No VOCs Detected No PAHs Detected
RCRA 8 Metals Detected, Totals Barium, Total
Cadmium, Total Chromium, Total
Lead, Total Selenium, Total Copper, Total
Zinc, Total RCRA 8 Metals Detected, Dissolved
Barium, Dissolved Zinc, Dissolved
620 60 100
64,000 100
2,300 19,000
120
2,200
2,000 5
100 15 50
1,300 6,000
2,000 6,000
Trip Blank 5/22/2018 No VOCs Detected g/l - micrograms per liter (parts per billion) RCRA – Resource Conservation Recovery Act PAH – Polycyclic Aromatic Hydrocarbon VOCs – Volatile Organic Compounds Grey Shading is intended to show the sample consisted of perched water. The tabulated groundwater testing results reveal the following: • Volatile organic compounds (VOCs) were not detected in perched water or groundwater samples.
• Polycyclic aromatic hydrocarbons (PAHs) were not detected in perched water or groundwater samples.
• Metals including barium, chromium, copper, lead, and/or zinc were detected in groundwater samples. The total lead concentration in groundwater samples D and E exceeded the tap water screening level. However, dissolved lead was not detected in these samples.
• Metals including barium, cadmium, chromium, copper, lead, selenium, and zinc were detected in perched water samples. The total lead, selenium, copper, and/or zinc concentrations exceeded tap water screening levels.
However, dissolved metal concentrations did not exceed tap water screening levels. 4.0 SUMMARY This screening consisted of advancing seven soil borings within and around former manufacturing buildings/areas. Samples of surface fill material, native clay soil, perched water, and groundwater were collected and analyzed for VOCs, PAHs, RCRA 8 metals, copper and zinc as a screening for contaminants of concern. Collectively, borings were used to evaluate overall site conditions. Contaminants of concern including barium, cadmium, chromium, copper, lead, zinc, and mercury were detected in surface fill. The highest metal concentrations were detected at the north portion of the site at borings A and C where painting and foundry operations were historically conducted. This screening found no evidence of VOC contamination in soil or fill material and no significant PAH constituent contamination in soil or fill material. Contaminants of concern including barium, cadmium, chromium, copper, lead, selenium, and zinc were detected in perched water samples. The highest metal concentrations were detected at the former foundry area. Lead groundwater contamination was also detected; however, dissolved lead contamination was not detected. This screening found no evidence of VOC or PAH contamination in perched water or groundwater. Groundwater flow was not assessed.

Phase II Environmental Screening
The Butler Company
325 South Broadway Street, Butler, Indiana
Page 9
5.0 OPINIONS AND RECOMMENDATIONS
Historic manufacturing operations conducted at the site from at least 1898 until 1997 (REC #1) have resulted in surface fill material being distributed over most of the site. With respect to surface fill material, the barium, cadmium, chromium, copper, lead, zinc, and mercury concentrations are evidence of contamination that poses a concern. SES recommends establishing remediation objectives, and conducting additional investigation to characterize the fill material, extent of metals (in solids and perched water), and potential exposure pathways. Once the site characterization is complete remedial efforts can be initiated. Typically, surface impact is addressed by (1) removing the impacted media, (2) by placing a barrier (pavement/clean soil) over the impact, or (3) a combination of removal and isolation.
With respect to the various other metals detected in native clay soil and groundwater during this screening investigation, metal concentrations in soil were well below residential screening levels and dissolved metals were not detected in groundwater. Based on this firm’s review of native clay soil and groundwater testing results, these detected metals are consistent with naturally-occurring concentrations, and therefore do not pose a concern and no further inquiry is recommended, at this time. If a higher level of confidence is required, background samples and permanent monitor wells would need to be collected and installed to statistically establish naturally occurring metal concentrations. This screening found no evidence of chlorinated solvent contamination and no further assessment of REC #2 is recommended at this time. This screening found no evidence of petroleum contamination (REC #3); however, this screening investigation did not rule-out the possibility of localized petroleum contamination at historical buried tank areas.
Phase II Environmental Screening
The Butler Company
325 South Broadway Street, Butler, Indiana
PHASE II ENVIRONMENTAL SCREENING REPORT
FIGURES
The Butler Company 325 South Broadway Street
Butler, DeKalb County, Indiana


Remediation Work Plan BFD #4170705
EXCERPTS FROM IWM’S PHASE II (July 31, 2019)

PHASE II ENVIRONMENTAL SITE ASSESSMENT REPORT
The Butler Company 325 South Broadway Street
Butler, DeKalb County, Indiana 128(a) Response Program Grant
Indiana Brownfields Site ID: 4170705
Prepared For:
Ms. Tracey Michael, Project Manager Indiana Brownfields Program 100 N. Senate Ave., Rm. 1275
Indianapolis, IN 46204
Prepared by:
IWM Consulting Group, LLC 1015 Production Road
Fort Wayne, Indiana 46808 (260) 497-9620
Project: 19-716-10
Date: July 31, 2019

Project 19-716-10 Page 1 of 2
TABLE 1 Summary of Bulk Asbestos Sample Laboratory Results
The Butler Company 325 South Broadway Street
Butler, DeKalb County, Indiana IBP Site No. 4170705
1 Asbestos Containing Material Classification: Friable (F), Category I (I), Category II (II). HA – Homogeneous Area; ND – None Detected
Material Description Sample ID HA Sample Location ACM
Class.1 Results
(% Asbestos)
Roofing (a) Felt (b)
BC-AB1a
1 West Central Building Debris
I ND BC-AB1b I ND BC-AB2a I ND BC-AB2b I ND
Mortar BC-AB3
2 West Central Building Debris II ND
BC-AB4 II ND BC-AB5 II ND
Electrical Wire Insulation BC-AB6
3 West Central Building Debris I ND
BC-AB7a I ND BC-AB7b I ND
Roofing (a) Shingle (b)
BC-AB8a
4 East Central Building Debris
I 2% BC-AB8b I <1% BC-AB9a I 2% BC-AB9b I <1%
Mortar BC-AB10
5 East Central Building Debris II ND
BC-AB11 II ND BC-AB12 II ND
Transite Panels BC-AB13
6 East Central Building Stack Debris II 20%
BC-AB14 II 15%
Fire Brick Mortar BC-AB15
7 East Central Building Stack Debris II ND
BC-AB16 II ND
Fire Brick BC-AB17
8 East Central Building Stack Debris II ND
BC-AB18 II ND
Fire Brick Glazing BC-AB19
9 East Central Building Stack Debris II ND
BC-AB20 II ND

Project 19-716-10 Page 2 of 2
TABLE 1 Summary of Bulk Asbestos Sample Laboratory Results
The Butler Company 325 South Broadway Street
Butler, DeKalb County, Indiana IBP Site No. 4170705
1 Asbestos Containing Material Classification: Friable (F), Category I (I), Category II (II). HA – Homogeneous Area; ND – None Detected
Material Description Sample ID HA Sample Location ACM
Class.1 Results
(% Asbestos) Paper Backing BC-AB21 10 East Central Building Debris F 40%
Window Sealant BC-AB22
11 East Central Building Debris F ND
BC-AB23 F ND
Window Sealant BC-AB24
12 Central Shed F ND
BC-AB25 F ND
Roofing (a) Felt (b), Tar (c) and Shingle (d)
BC-AB26a
13 North Building
I ND BC-AB26b I ND BC-AB26c I 2% BC-AB27b I ND BC-AB27c I 5% BC-AB27d I ND
Mortar BC-AB28
14 North Building II ND
BC-AB29 II ND BC-AB30 II ND

Project 19-716-10 TABLE 2Summary of Lead Paint Screening Results
The Butler Company325 South Broadway Street
Butler, DeKalb County, IndianaIBP Site No: 4170705
Sample Location XRF Result Lab Sample Collected Sample ID Laboratory
Results (ppm)
Handrail - Yellow Negative No NA NAHandrail - White Negative No NA NA
Grout on Bricks - Yellow Negative No NA NAGrout on Bricks - White Negative No NA NA
Windows/Doorframes - Green/Blue Negative No NA NA
Grout on Bricks - Light Blue Negative No NA NARoof Tile Glaze - Brown Negative No NA NA
Door and Doorframe - Red 0.96 ± 0.15 Yes BC-PB1 18,000Sheet Metal - Red 0.60 ± 0.10 No NA NA
Outer Wall - Yellow Negative No NA NASteps - Light Blue Negative No NA NAMetal Soffit - Red Negative No NA NA
Interior Wall - White Negative No NA NABasement Wall - White Negative No NA NA
Negative = Instrument displayed "negative" for the detection of lead
West Central Building
Central Shed
East Central Building
East Building
North Building
Page 1 of 1

Building/Area Chemical NameNo. of
Containers
Container
Volume
Container
Type
Volume of
MaterialLiquid/Solid Description
Outside - east side of site no labels 2 200-gallon tote unknown solid 200-gallon totes with residue/solid material in bottom
Outside various locations no labels and Ferric Chloride 5 55-gal drum unknown NAsteel drums used for burn barrels and plastic drums used for trash cans, one (1) plastic drum labeled Ferric Chloride
Inside North Building PCBs 4 ounces light ballast unknown NAthere are four (4) old transformers in fluorescent light ballasts with possible PCBs
Inside North Building mercury vapor 8 unknownfluorescent bulbs unknown NA fluorescent light bulbs, four (4) 4-foot and four (4) 8-foot
Inside North Building
oil based stain, water based paint, naphtha, petroleum distillates, heptane solvent, paint thinner, clear lacquer, polyurethane, acetone, toluene, methanol, methylene chloride, xylenes, trimethylbenzene, 1,2,4-trimethylbenzene, methyl 1b ketone, n-butyl acetate, petroleum oil, vegetable oil
60+ 8 ounce to 1-gallon
plastic bottles from 8-ounces to 1-gallon, metal paint cans from 8-ounces to 1-gallon, 12 ounce aerosol paint cans
varies from empty containers, solidified contents, less than 10-gallons total
both
various sized plastic and metal containers from 8-ounces to 1-gallon. Most containers have minimal amounts present, some paint materials and putty materials have soldified. Most small containers are located on plastic shelving in North Building. See photograph log in Appendix F.
Table 3 - Chemical Inventory (May 15, 2019) - The Butler Company

Project 19-716-10 TABLE 4Summary of Groundwater and Well Measurements - May 22, 2019
The Butler Company325 South Broadway Street
Butler, DeKalb County, IndianaIBP Site No. 4170705
Well Groundwater ObservationsTOC
Elevation1Depth to
GroundwaterGroundwater
Elevation1
BC-GP10 brn, mod turb, no odor, no sheen 868.22 22.76 845.46BC-GP11 brn, v sl turb, no odor, no sheen 867.16 21.81 845.35BC-GP12 lt brn, v sl turb, no odor, no sheen 866.67 21.68 844.99BC-GP13 cl, v sl turb, no odor, no sheen 866.66 4.88 861.78BC-GP14 lt brn, sl turb, no odor, no sheen 866.36 21.52 844.84BC-GP15 brn, sl turb, no odor, no sheen 865.78 20.94 844.84
Notes:1Elevation in feet based on survey data prepared by Maxwell Surveying & Engineering, May 24, 2019.Groundwater observations may include: color (cl–clear, gry–gray, blk–black, brn–brown, orn–orange), turbidity (turb), odor (gas–gasoline,
die–diesel, sep–septic), shade (lt–light, dk–dark), modifier (v–very, sl–slight, mod–moderate, sig–significant)
Groundwater Observations were made at the time the well was purged.
Page 1 of 1
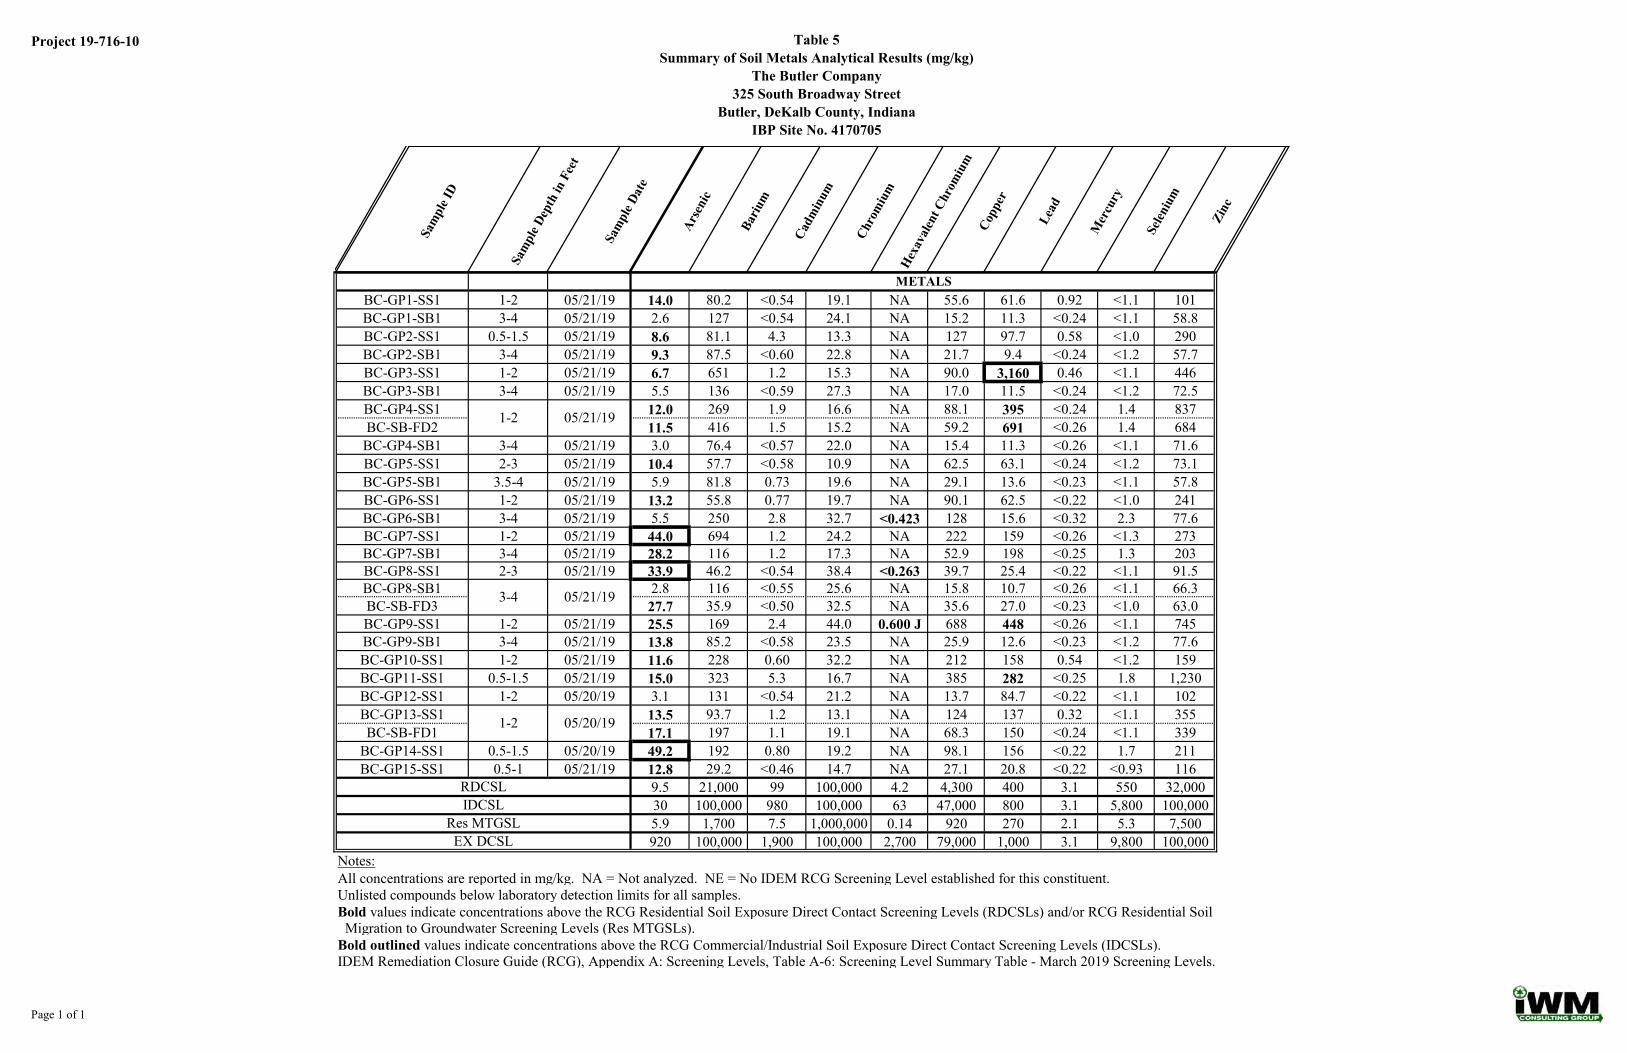
Project 19-716-10 Table 5Summary of Soil Metals Analytical Results (mg/kg)
The Butler Company325 South Broadway Street
Butler, DeKalb County, IndianaIBP Site No. 4170705
Sam
ple I
D
Sam
ple D
epth
in F
eet
Sam
ple D
ate
Arse
nic
Bariu
m
Cadm
inum
Chro
miu
mH
exav
alen
t Chr
omiu
mCo
pper
Lead
Mer
cury
Selen
ium
Zinc
BC-GP1-SS1 1-2 05/21/19 14.0 80.2 <0.54 19.1 NA 55.6 61.6 0.92 <1.1 101BC-GP1-SB1 3-4 05/21/19 2.6 127 <0.54 24.1 NA 15.2 11.3 <0.24 <1.1 58.8BC-GP2-SS1 0.5-1.5 05/21/19 8.6 81.1 4.3 13.3 NA 127 97.7 0.58 <1.0 290BC-GP2-SB1 3-4 05/21/19 9.3 87.5 <0.60 22.8 NA 21.7 9.4 <0.24 <1.2 57.7BC-GP3-SS1 1-2 05/21/19 6.7 651 1.2 15.3 NA 90.0 3,160 0.46 <1.1 446BC-GP3-SB1 3-4 05/21/19 5.5 136 <0.59 27.3 NA 17.0 11.5 <0.24 <1.2 72.5BC-GP4-SS1 12.0 269 1.9 16.6 NA 88.1 395 <0.24 1.4 837BC-SB-FD2 11.5 416 1.5 15.2 NA 59.2 691 <0.26 1.4 684
BC-GP4-SB1 3-4 05/21/19 3.0 76.4 <0.57 22.0 NA 15.4 11.3 <0.26 <1.1 71.6BC-GP5-SS1 2-3 05/21/19 10.4 57.7 <0.58 10.9 NA 62.5 63.1 <0.24 <1.2 73.1BC-GP5-SB1 3.5-4 05/21/19 5.9 81.8 0.73 19.6 NA 29.1 13.6 <0.23 <1.1 57.8BC-GP6-SS1 1-2 05/21/19 13.2 55.8 0.77 19.7 NA 90.1 62.5 <0.22 <1.0 241BC-GP6-SB1 3-4 05/21/19 5.5 250 2.8 32.7 <0.423 128 15.6 <0.32 2.3 77.6BC-GP7-SS1 1-2 05/21/19 44.0 694 1.2 24.2 NA 222 159 <0.26 <1.3 273BC-GP7-SB1 3-4 05/21/19 28.2 116 1.2 17.3 NA 52.9 198 <0.25 1.3 203BC-GP8-SS1 2-3 05/21/19 33.9 46.2 <0.54 38.4 <0.263 39.7 25.4 <0.22 <1.1 91.5BC-GP8-SB1 2.8 116 <0.55 25.6 NA 15.8 10.7 <0.26 <1.1 66.3BC-SB-FD3 27.7 35.9 <0.50 32.5 NA 35.6 27.0 <0.23 <1.0 63.0BC-GP9-SS1 1-2 05/21/19 25.5 169 2.4 44.0 0.600 J 688 448 <0.26 <1.1 745BC-GP9-SB1 3-4 05/21/19 13.8 85.2 <0.58 23.5 NA 25.9 12.6 <0.23 <1.2 77.6BC-GP10-SS1 1-2 05/21/19 11.6 228 0.60 32.2 NA 212 158 0.54 <1.2 159BC-GP11-SS1 0.5-1.5 05/21/19 15.0 323 5.3 16.7 NA 385 282 <0.25 1.8 1,230BC-GP12-SS1 1-2 05/20/19 3.1 131 <0.54 21.2 NA 13.7 84.7 <0.22 <1.1 102BC-GP13-SS1 13.5 93.7 1.2 13.1 NA 124 137 0.32 <1.1 355BC-SB-FD1 17.1 197 1.1 19.1 NA 68.3 150 <0.24 <1.1 339
BC-GP14-SS1 0.5-1.5 05/20/19 49.2 192 0.80 19.2 NA 98.1 156 <0.22 1.7 211BC-GP15-SS1 0.5-1 05/21/19 12.8 29.2 <0.46 14.7 NA 27.1 20.8 <0.22 <0.93 116
9.5 21,000 99 100,000 4.2 4,300 400 3.1 550 32,00030 100,000 980 100,000 63 47,000 800 3.1 5,800 100,0005.9 1,700 7.5 1,000,000 0.14 920 270 2.1 5.3 7,500920 100,000 1,900 100,000 2,700 79,000 1,000 3.1 9,800 100,000
Notes:All concentrations are reported in mg/kg. NA = Not analyzed. NE = No IDEM RCG Screening Level established for this constituent.Unlisted compounds below laboratory detection limits for all samples.Bold values indicate concentrations above the RCG Residential Soil Exposure Direct Contact Screening Levels (RDCSLs) and/or RCG Residential Soil Migration to Groundwater Screening Levels (Res MTGSLs).Bold outlined values indicate concentrations above the RCG Commercial/Industrial Soil Exposure Direct Contact Screening Levels (IDCSLs).IDEM Remediation Closure Guide (RCG), Appendix A: Screening Levels, Table A-6: Screening Level Summary Table - March 2019 Screening Levels.
1-2 05/20/19
RDCSLIDCSL
EX DCSLRes MTGSL
1-2 05/21/19
3-4 05/21/19
METALS
Page 1 of 1

Project 19-716-10 TABLE 6Summary of Soil PAH Analytical Results (mg/kg)
The Butler Company325 South Broadway Street
Butler, DeKalb County, IndianaIBP Site No. 4170705
Sam
ple I
D
Sam
ple D
epth
in F
eet
Sam
ple D
ate
Anth
race
ne
Benz
o(a)
anth
race
ne
Benz
o(a)
pyre
ne
Benz
o(b)
fluor
anth
ene
Benz
o(g,
h,i)p
eryl
ene
Benz
o(k)
fluor
anth
ene
Chry
sene
Fluo
rant
hene
Inde
no(1
,2,3
-cd)
pyre
ne1-
Met
hyln
apht
halen
e2-
Met
hyln
apht
halen
e
Naph
thal
ene
Phen
anth
rene
Pyre
ne
PAHBC-GP7-SB1 3-4 05/21/19 0.0081 0.015 0.011 0.011 0.017 0.013 0.017 0.024 0.012 0.079 0.11 0.10 0.043 0.027BC-GP8-SB1 <0.0063 <0.0063 <0.0063 <0.0063 <0.0063 <0.0063 <0.0063 <0.0063 <0.0063 <0.0063 <0.0063 <0.0063 <0.0063 <0.0063BC-SB-FD3 <0.0056 <0.0056 <0.0056 <0.0056 <0.0056 <0.0056 <0.0056 <0.0056 <0.0056 <0.0056 0.0071 0.019 0.0085 <0.0056
25,000 15 1.5 15 NE 150 1,500 3,400 15 250 340 53 NE 2,500100,000 210 21 210 NE 2,100 21,000 30,000 210 390 3,000 170 NE 23,000
1,200 2.1 4.7 60 NE 590 1,800 1,800 200 1.2 3.7 0.11 NE 260100000 12000 500 12000 NE 100,000 100,000 68,000 12,000 390 6,800 3,100 NE 51,000
Notes:All concentrations are reported in mg/kg. NA = Not analyzed. NE = No IDEM RCG Screening Level established for this constituent. Unlisted compounds below laboratory detection limits for all samples.Bold values indicate concentrations above the RCG Residential Soil Exposure Direct Contact Screening Levels (RDCSLs) and/or RCG Residential Soil Migration to Groundwater Screening Levels (Res MTGSLs).IDEM Remediation Closure Guide (RCG), Appendix A: Screening Levels, Table A-6: Screening Level Summary Table - March 2019 Screening Levels.
RDCSLIDCSL
EX DCSLRes MTGSL
3-4 05/21/19
Page 1 of 1

Project 19-716-10 Table 7Summary of Soil VOC and PCB Analytical Results (mg/kg)
The Butler Company325 South Broadway Street
Butler, DeKalb County, IndianaIBP Site No. 4170705
Sam
ple I
D
Sam
ple D
epth
in F
eet
Sam
ple D
ate
n-H
exan
e
PCBs
VOC PCBBC-GP7-SB1 3-4 05/21/19 0.049 <0.13BC-GP8-SB1 0.071 <0.13BC-SB-FD3 0.30 <0.11
140140210140
Notes:All concentrations are reported in mg/kg. NA = Not analyzed. Unlisted compounds below laboratory detection limits for all samples.Bold values indicate concentrations above the RCG Residential Soil Exposure Direct Contact Screening Levels (RDCSLs) and/or RCG Residential Soil Migration to Groundwater Screening Levels (Res MTGSLs).IDEM Remediation Closure Guide (RCG), Appendix A: Screening Levels, Table A-6: Screening Level Summary Table - March 2019 Screening Levels.
3-4 05/21/19
RDCSLIDCSL
EX DCSLRes MTGSL
Page 1 of 1
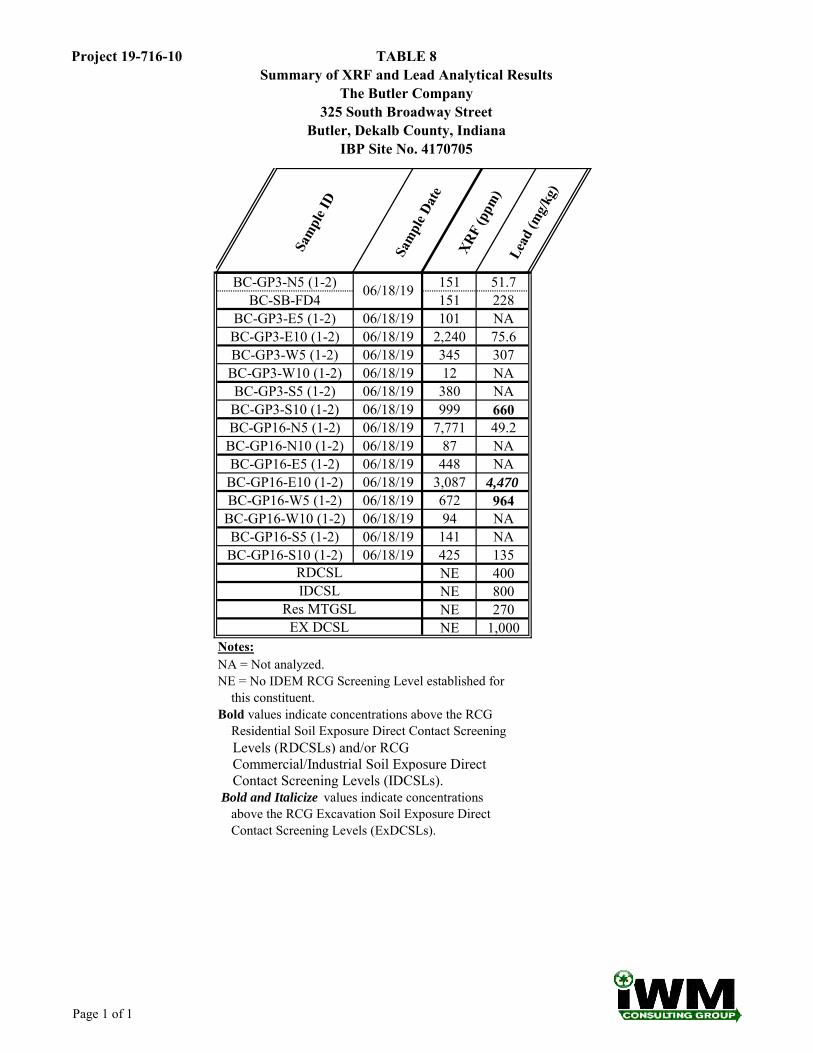
Project 19-716-10 TABLE 8Summary of XRF and Lead Analytical Results
The Butler Company325 South Broadway Street
Butler, Dekalb County, IndianaIBP Site No. 4170705
Sam
ple I
D
Sam
ple D
ate
XRF
(ppm
)Le
ad (m
g/kg
)
BC-GP3-N5 (1-2) 151 51.7BC-SB-FD4 151 228
BC-GP3-E5 (1-2) 06/18/19 101 NABC-GP3-E10 (1-2) 06/18/19 2,240 75.6BC-GP3-W5 (1-2) 06/18/19 345 307BC-GP3-W10 (1-2) 06/18/19 12 NABC-GP3-S5 (1-2) 06/18/19 380 NA
BC-GP3-S10 (1-2) 06/18/19 999 660BC-GP16-N5 (1-2) 06/18/19 7,771 49.2
BC-GP16-N10 (1-2) 06/18/19 87 NABC-GP16-E5 (1-2) 06/18/19 448 NA
BC-GP16-E10 (1-2) 06/18/19 3,087 4,470BC-GP16-W5 (1-2) 06/18/19 672 964
BC-GP16-W10 (1-2) 06/18/19 94 NABC-GP16-S5 (1-2) 06/18/19 141 NABC-GP16-S10 (1-2) 06/18/19 425 135
NE 400NE 800NE 270NE 1,000
Notes:NA = Not analyzed.NE = No IDEM RCG Screening Level established for this constituent. Bold values indicate concentrations above the RCG Residential Soil Exposure Direct Contact Screening Levels (RDCSLs) and/or RCG Commercial/Industrial Soil Exposure Direct Contact Screening Levels (IDCSLs). Bold and Italicize values indicate concentrations above the RCG Excavation Soil Exposure Direct Contact Screening Levels (ExDCSLs).
06/18/19
Res MTGSL
RDCSLIDCSL
EX DCSL
Page 1 of 1

Project 19-716-10 TABLE 9Summary of Soil PFAS Analytical Results (µg/kg)
The Butler Company325 South Broadway Street
Butler, DeKalb County, IndianaIBP Site No. 4170705
Sam
ple I
D
Sam
ple D
epth
in F
eet
Sam
ple D
ate
Perf
luor
ooct
anoi
c Acid
(P
FOA)
Perf
luor
ooct
anes
ulfo
nic
Acid
(PFO
S)
PFASBC-GP10-SS1 1-2 05/21/19 0.61 <0.24
BC-GP10-SS1(DUP) 1-2 05/21/19 0.58 <0.22BC-GP11-SS1 0.5-1.5 05/21/19 <0.23 0.54BC-GP12-SS1 1-2 05/20/19 <0.23 <0.23BC-GP13-SS1 <0.24 0.46BC-SB-FD1 <0.23 <0.22
BC-GP14-SS1 0.5-1.5 05/20/19 <0.24 <0.23BC-FRB1 05/20/19 <1.8 <1.8BC-FRB2 05/21/19 <1.9 <1.8
Notes:All concentrations are reported in µg/kg. NA = Not analyzed.
Unlisted compounds below laboratory detection limits for all samples. Field Reagent Blank (FRB) sample results presented in nanogram per liter (ug/L).
1-2 05/20/19
Page 1 of 1

Project 19-716-10 TABLE 10Summary of Groundwater Metals Analytical Results (µg/L)
The Butler Company325 South Broadway Street
Butler, DeKalb County, IndianaIBP Site No. 4170705
Sam
ple I
D
Sam
ple D
ate
Bariu
m
Diss
olve
d Ba
rium
Cadm
ium
Diss
olve
d Ca
dmiu
m
Chro
miu
m
Diss
olve
d Ch
rom
ium
Copp
er
Diss
olve
d Co
pper
Lead
Diss
olve
d Le
ad
Zinc
Diss
olve
d Zi
nc
METALSBC-GP10-GW1 05/22/19 117 72.0 <2.0 <2.0 17.4 <10.0 14.5 <10.0 <10.0 <10.0 27.6 <10.0BC-GP11-GW1 134 115 <2.0 <2.0 <10.0 <10.0 <10.0 <10.0 <10.0 <10.0 56.1 24.4BC-GPGW-FD1 133 116 <2.0 <2.0 <10.0 <10.0 10.2 <10.0 <10.0 <10.0 54.4 22.8BC-GP12-GW1 05/22/19 121 114 <2.0 <2.0 <10.0 <10.0 <10.0 <10.0 <10.0 <10.0 <20.0 <20.0BC-GP13-GW1 05/22/19 136 140 3.9 3.8 <10.0 <10.0 35.0 <10.0 <10.0 <10.0 1,610 1,570BC-GP14-GW1 05/22/19 158 123 <2.0 <2.0 10.9 <10.0 12.6 <10.0 <10.0 <10.0 22.3 <20.0BC-GP15-GW1 05/22/19 150 131 <2.0 <2.0 <10.0 <10.0 <10.0 <10.0 <10.0 <10.0 <20.0 <20.0
2,000 2,000 5 5 100 100 1,300 1,300 15 15 6,000 6,000Notes:All concentrations are reported in µg/L. NA = Not analyzed. NE = No IDEM RCG Screening Level established for this constituent.Unlisted compounds below laboratory detection limits for all samples.Bold values indicate concentrations above the RCG Residential TAP Groundwater Screening Levels (Res TAP GWSLs).IDEM Remediation Closure Guide (RCG), Appendix A: Screening Levels, Table A-6: Screening Level Summary Table - March 2019 Screening Levels.
Res TAP GWSLs
05/22/19
Page 1 of 1

Project 19-716-10 TABLE 11Summary of Groundwater PAH, VOC, and PCB Analytical Results (µg/L)
The Butler Company325 South Broadway Street
Butler, DeKalb County, IndianaIBP Site No. 4170705
Sam
ple I
D
Sam
ple D
ate
PAH
VOC
PCB
BC-GP10-GW1 05/22/19 ND ND NDBC-GP11-GW1 ND ND NDBC-GPGW-FD1 ND ND NDBC-GP12-GW1 05/22/19 ND ND NDBC-GP13-GW1 05/22/19 ND ND NDBC-GP14-GW1 05/22/19 ND ND NDBC-GP15-GW1 05/22/19 ND ND ND
Notes:All concentrations are reported in µg/L. NA = Not analyzed. ND = No detection.NE = No IDEM RCG Screening Level established for this constituent.Bold values indicate concentrations above the RCG Residential TAP Groundwater Screening Levels (Res TAP GWSLs).IDEM Remediation Closure Guide (RCG), Appendix A: Screening Levels, Table A-6: Screening Levels Summary Table - March 2019 Screening Levels.
05/22/19
Page 1 of 1
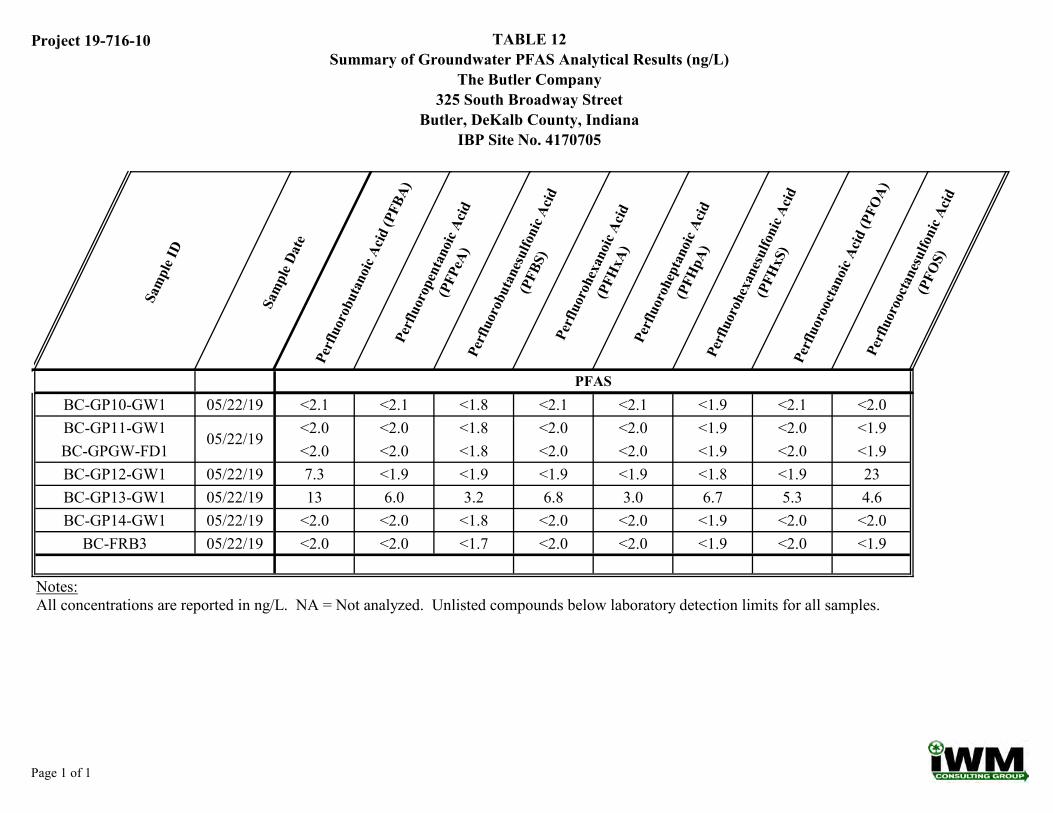
Project 19-716-10 TABLE 12Summary of Groundwater PFAS Analytical Results (ng/L)
The Butler Company325 South Broadway Street
Butler, DeKalb County, IndianaIBP Site No. 4170705
Sam
ple I
D
Sam
ple D
ate
Perf
luor
obut
anoi
c Acid
(PFB
A)Pe
rflu
orop
enta
noic
Acid
(PFP
eA)
Perf
luor
obut
anes
ulfo
nic A
cid
(PFB
S)Pe
rflu
oroh
exan
oic A
cid
(PFH
xA)
Perf
luor
ohep
tano
ic Ac
id
(PFH
pA)
Perf
luor
ohex
anes
ulfo
nic A
cid
(PFH
xS)
Perf
luor
ooct
anoi
c Acid
(PFO
A)Pe
rflu
oroo
ctan
esul
foni
c Acid
(PFO
S)
PFASBC-GP10-GW1 05/22/19 <2.1 <2.1 <1.8 <2.1 <2.1 <1.9 <2.1 <2.0BC-GP11-GW1 <2.0 <2.0 <1.8 <2.0 <2.0 <1.9 <2.0 <1.9BC-GPGW-FD1 <2.0 <2.0 <1.8 <2.0 <2.0 <1.9 <2.0 <1.9BC-GP12-GW1 05/22/19 7.3 <1.9 <1.9 <1.9 <1.9 <1.8 <1.9 23BC-GP13-GW1 05/22/19 13 6.0 3.2 6.8 3.0 6.7 5.3 4.6BC-GP14-GW1 05/22/19 <2.0 <2.0 <1.8 <2.0 <2.0 <1.9 <2.0 <2.0
BC-FRB3 05/22/19 <2.0 <2.0 <1.7 <2.0 <2.0 <1.9 <2.0 <1.9
Notes:All concentrations are reported in ng/L. NA = Not analyzed. Unlisted compounds below laboratory detection limits for all samples.
05/22/19
Page 1 of 1
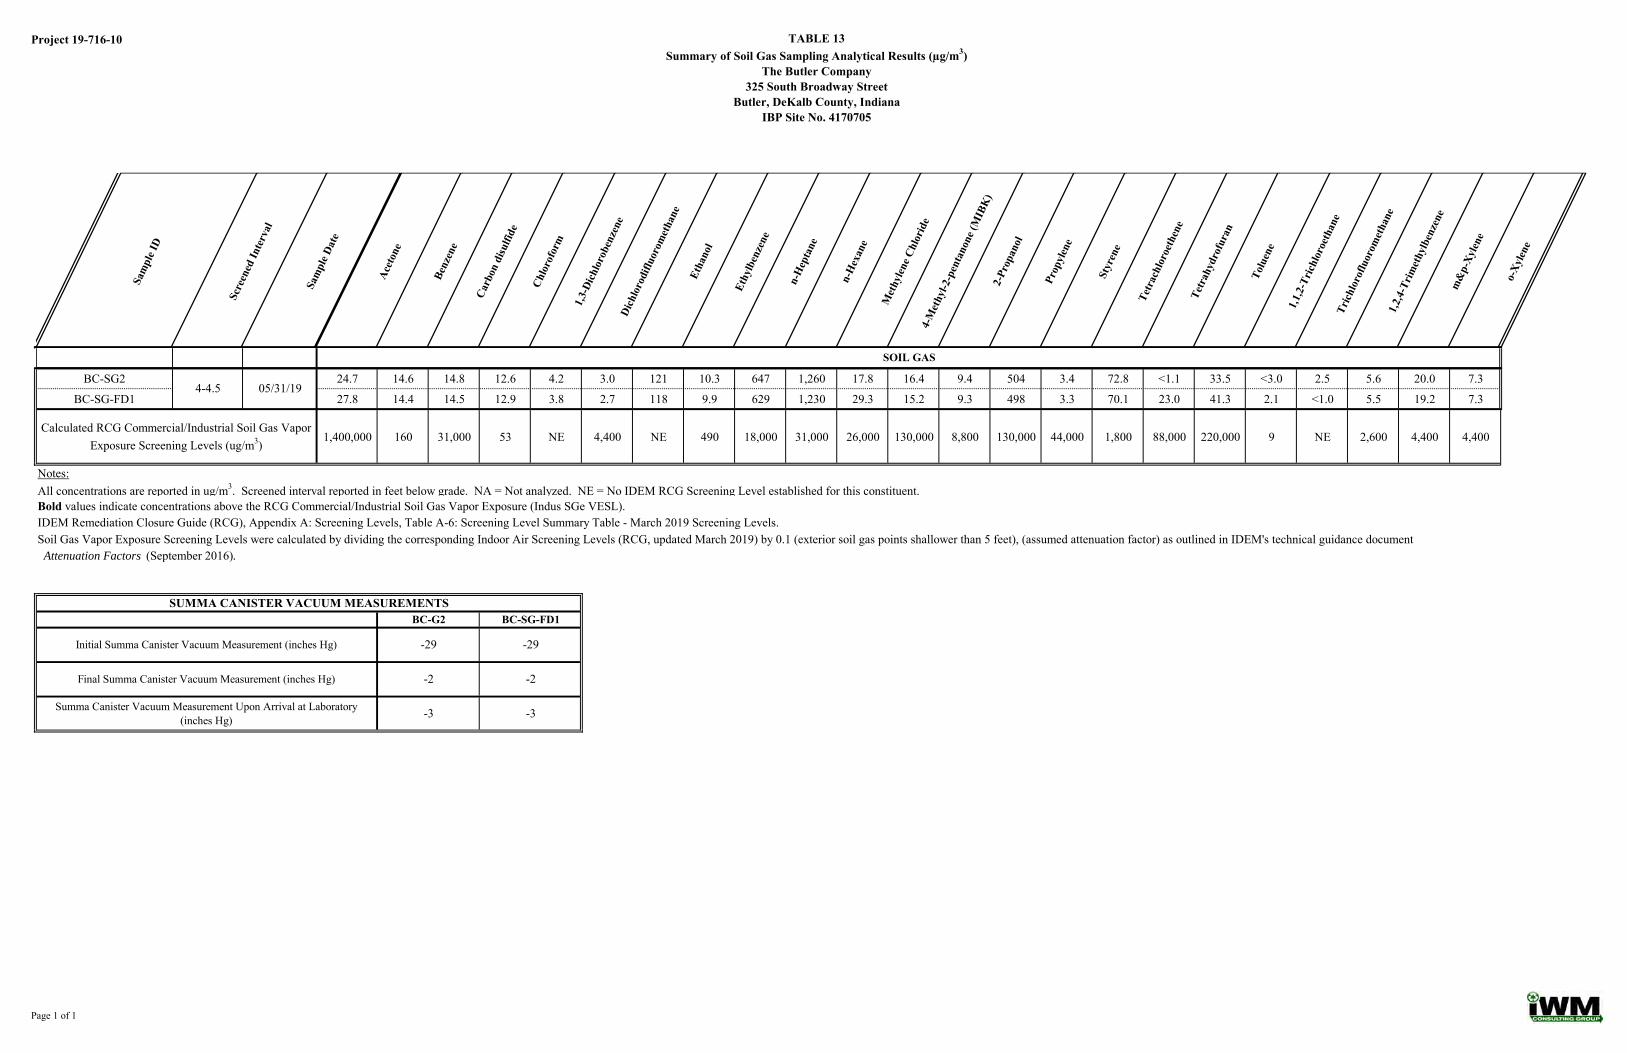
Project 19-716-10 TABLE 13Summary of Soil Gas Sampling Analytical Results (µg/m3)
The Butler Company325 South Broadway Street
Butler, DeKalb County, IndianaIBP Site No. 4170705Sa
mpl
e ID
Scre
ened
Inte
rval
Sam
ple D
ate
Acet
one
Benz
ene
Carb
on d
isulfi
de
Chlo
rofo
rm
1,3-
Dich
loro
benz
ene
Dich
loro
diflu
orom
etha
neEt
hano
l
Ethy
lben
zene
n-H
epta
ne
n-H
exan
e
Met
hylen
e Chl
orid
e4-
Met
hyl-2
-pen
tano
ne (M
IBK
)2-
Prop
anol
Prop
ylen
e
Styr
ene
Tetr
achl
oroe
then
eTe
trah
ydro
fura
n
Tolu
ene
1,1,
2-Tr
ichlo
roet
hane
Trich
loro
fluor
omet
hane
1,2,
4-Tr
imet
hylb
enze
nem
&p-
Xylen
e
o-Xy
lene
SOIL GAS
BC-SG2 24.7 14.6 14.8 12.6 4.2 3.0 121 10.3 647 1,260 17.8 16.4 9.4 504 3.4 72.8 <1.1 33.5 <3.0 2.5 5.6 20.0 7.3
BC-SG-FD1 27.8 14.4 14.5 12.9 3.8 2.7 118 9.9 629 1,230 29.3 15.2 9.3 498 3.3 70.1 23.0 41.3 2.1 <1.0 5.5 19.2 7.3
1,400,000 160 31,000 53 NE 4,400 NE 490 18,000 31,000 26,000 130,000 8,800 130,000 44,000 1,800 88,000 220,000 9 NE 2,600 4,400 4,400
Notes:All concentrations are reported in ug/m3. Screened interval reported in feet below grade. NA = Not analyzed. NE = No IDEM RCG Screening Level established for this constituent.Bold values indicate concentrations above the RCG Commercial/Industrial Soil Gas Vapor Exposure (Indus SGe VESL).IDEM Remediation Closure Guide (RCG), Appendix A: Screening Levels, Table A-6: Screening Level Summary Table - March 2019 Screening Levels.Soil Gas Vapor Exposure Screening Levels were calculated by dividing the corresponding Indoor Air Screening Levels (RCG, updated March 2019) by 0.1 (exterior soil gas points shallower than 5 feet), (assumed attenuation factor) as outlined in IDEM's technical guidance document Attenuation Factors (September 2016).
Calculated RCG Commercial/Industrial Soil Gas Vapor Exposure Screening Levels (ug/m3)
SUMMA CANISTER VACUUM MEASUREMENTS
05/31/194-4.5
-3
-29
-2
-3
Final Summa Canister Vacuum Measurement (inches Hg)
Summa Canister Vacuum Measurement Upon Arrival at Laboratory (inches Hg)
BC-G2 BC-SG-FD1
-29Initial Summa Canister Vacuum Measurement (inches Hg)
-2
Page 1 of 1

FIGURES

Project
19-716
1015 Production Road, Fort Wayne, IN 46808(260) 497-9620 Fax: (260) 470-7071
Task
10 ASize
4/11/2019Date
FIGURE 1
CLIENT
Site Location Map
The Butler Company
IBP Site No. 4170705
325 South Broadway Street
Butler, DeKalb County, Indiana
INDIANA BROWNFIELDS PROGRAM
INDIANAPOLIS, INDIANA
SITE
SOURCE: BUTLER WEST, INDIANA, USGS TOPOGRAPHIC QUADRANGLE MAP, 2016 and
BUTLER EAST, INDIANA, USGS TOPOGRAPHIC QUADRANGLE MAP, 1958 (REVISED 1994)
SCALE: 1 INCH = 2,000 FT; CONTOUR INTERVAL = 5 FT

BU
ILD
IN
G
EAST WILLOW STREET
SO
UT
H B
RO
AD
WA
Y S
TR
EE
T
ACCESS DRIVE
WOODED
BUILDING
SIDEWALK
SIDEWALK
COLLAPSED
BUILDING
BC-GP15
BC-GP3
BC-GP4
BC-GP2
BC-GP1
BC-GP12
BC-GP9
BC-GP14
BC-GP7
BC-GP6
BC-GP8
BC-GP13
BC-GP11
BC-GP10
BC-GP5
S
S
S
S
S
S
S
S
S
S
BURIED
NATURAL
GAS
MARKER
STORM
SEWER
CATCH
BASIN
RETENTION POND
BC-SG3
BC-SG1
BC-SG2
BA
BB
BD
BF
BG
BE
BC
GAS
GAS
GAS
GAS
BURIED
UTILITY LINE
SHED
SIZE
FIG. NO.TASK
TITLE:
CLIENT:
PROJECT NUMBER
1015 Production Road, Fort Wayne, Indiana 46808
(260)497-9620 fax: (260)471-7071 www.iwmconsult.com
DRAWING NUMBERDRAWN BY:
REVISED:
APPROVED BY:
DATE:
DATE:
DATE:
N
75'25' 50'0
SCALE: 1" = 50'
SITE PLAN AND SAMPLE LOCATION MAP
THE BUTLER COMPANY - IBP SITE No. 4170705
325 SOUTH BROADWAY STREET
BUTLER, DEKALB COUNTY, INDIANA
INDIANA BROWNFIELDS PROGRAM
INDIANAPOLIS, INDIANA
19-716 10 B 2
CGP 7/10/19
CGP 7/10/19
MRA7/10/19
LEGEND
PROPERTY BOUNDARY
FILL SAMPLING LOCATION
BORING, BC-GP1 THROUGH
BC-GP9 (NINE (9) LOCATIONS)
BORING/TEMPORARY WELL
LOCATION WITH PFAS SAMPLING,
BC-GP10 THROUGH BC-GP14
(FIVE (5) LOCATIONS)
BORING/TEMPORARY WELL
LOCATION, BC-GP15 (ONE (1)
LOCATION)
ATTEMPTED SOIL GAS LOCATION,
BC-SG1, BC-SG2, AND BC-SG3
SOIL BORING/TEMPORARY WELL
LOCATION. SAMPLED BY SES IN
JUNE 2018.
FORMER BUILDING FOOTPRINT
APPARENT BUILDING DEBRIS
PILE
FENCE LINE
EXPOSED CONCRETE BUILDING
PAD/FOUNDATION
SEWER
BURIED UTILITY LINE
RELIC BURIED NATURAL GAS LINE
SITE FEATURES SHOWN ARE BASED ON
DEKALB COUNTY GIS 2012 AND 2017 AERIAL
PHOTOGRAPHS.
S
GAS
BC-GP1
BC-GP11
BC-GP15
BC-SG1
BE

BU
ILD
IN
G
EAST WILLOW STREET
SO
UT
H B
RO
AD
WA
Y S
TR
EE
T
ACCESS DRIVE
WOODED
BUILDING
SIDEWALK
SIDEWALK
COLLAPSED
BUILDING
S
S
S
S
S
S
S
S
S
S
RETENTION POND
BURIED
NATURAL
GAS
MARKER
STORM
SEWER
CATCH
BASIN
GAS
GAS
GAS
GAS
BURIED
UTILITY LINE
EAST CENTRAL
BUILDING DEBRIS
WEST CENTRAL
BUILDING DEBRIS
EA
ST
NORTH
CENTRAL SHED
BC-PB1
BC-AB9
BC-AB12
BC-AB11
BC-AB13
BC-AB14
BC-AB21
BC-AB15
BC-AB16
BC-AB17
BC-AB18
BC-AB19
BC-AB20
BC-AB22
BC-AB8
BC-AB10
BC-AB23
BC-AB25
BC-AB24
BC-AB27
BC-AB26
BC-AB28
BC-AB29
BC-AB30
BC-AB5
BC-AB6
BC-AB7
BC-AB2
BC-AB4
BC-AB1
BC-AB3
SIZE
FIG. NO.TASK
TITLE:
CLIENT:
PROJECT NUMBER
1015 Production Road, Fort Wayne, Indiana 46808
(260)497-9620 fax: (260)471-7071 www.iwmconsult.com
DRAWING NUMBERDRAWN BY:
REVISED:
APPROVED BY:
DATE:
DATE:
DATE:
N
75'25' 50'0
SCALE: 1" = 50'
BULK ASBESTOS AND LEAD PAINT SAMPLE LOCATION MAP
THE BUTLER COMPANY - IBP SITE No. 4170705
325 SOUTH BROADWAY STREET
BUTLER, DEKALB COUNTY, INDIANA
INDIANA BROWNFIELDS PROGRAM
INDIANAPOLIS, INDIANA
19-716 10 B 3
CGP 7/11/19
CGP 7/11/19
MRA7/11/19
LEGEND
PROPERTY BOUNDARY
FORMER BUILDING FOOTPRINT
APPARENT BUILDING DEBRIS
PILE
FENCE LINE
EXPOSED CONCRETE BUILDING
PAD/FOUNDATION
SEWER
BURIED UTILITY LINE
RELIC BURIED NATURAL GAS LINE
ASBESTOS SAMPLE LOCATION
LEAD-BASED PAINT SAMPLE
LOCATION
SITE FEATURES SHOWN ARE BASED ON DEKALB
COUNTY GIS 2012 AND 2017 AERIAL PHOTOGRAPHS.
S
GAS
BC-AB1
BC-PB1

BU
ILD
IN
G
EAST WILLOW STREET
SO
UT
H B
RO
AD
WA
Y S
TR
EE
T
ACCESS DRIVE
WOODED
BUILDING
SIDEWALK
SIDEWALK
COLLAPSED
BUILDING
BC-GP15
BC-GP3
BC-GP4
BC-GP2
BC-GP1
BC-GP12
BC-GP9
BC-GP14
BC-GP7
BC-GP6
BC-GP8
BC-GP13
BC-GP11
BC-GP10
BC-GP5
S
S
S
S
S
S
S
S
S
S
BURIED
NATURAL
GAS
MARKER
STORM
SEWER
CATCH
BASIN
RETENTION POND
BC-SG3
SOIL GAS
SOIL GAS
BC-SG1
BC-SG2
SOIL GAS
BC-GP7-SS1 (1'-2')
ARSENIC 44.0
BC-GP8-SS1 (2'-3')
ARSENIC 33.9
BC-GP14-SS1 (0.5'-1.5')
ARSENIC 49.2
BC-GP3-SS1 (1'-2')
LEAD 3,160
2.5'
2.5'
2.5'
3.75'
2.5'
2.25'
2'
3'
3'
3'
1'
1'
3.5'
2'
4.5'
BA
2.5'
BB
4.5'
BC
4'
BD
3'
BF
1.5'
BG
3'
BE
7'
BC/DUPLICATE (SES 2018)
ARSENIC 33.9
LEAD28,7000
BC-GP3-E5(1-2)
BC-GP3-E10(1-2)
BC-GP3-S5(1-2)
BC-GP3-W10(1-2)
BC-GP3-W5(1-2)
BC-GP3-N5(1-2)
BC-GP16-N10(1-2)
BC-GP16-N5(1-2)
BC-GP16-W10(1-2)
BC-GP16-E5(1-2)
BC-GP16-S5(1-2)
BC-GP16-S10(1-2)
BC-GP3-S10 (1'-2')
LEAD 660
BC-GP16-E10 (1'-2')
LEAD 4,470
BC-GP16-W5 (1'-2')
LEAD 964
SIZE
FIG. NO.TASK
TITLE:
CLIENT:
PROJECT NUMBER
1015 Production Road, Fort Wayne, Indiana 46808
(260)497-9620 fax: (260)471-7071 www.iwmconsult.com
DRAWING NUMBERDRAWN BY:
REVISED:
APPROVED BY:
DATE:
DATE:
DATE:
N
75'25' 50'0
SCALE: 1" = 50'
SOIL ANALYTICAL RESULTS MAP
THE BUTLER COMPANY - IBP SITE No. 4170705
325 SOUTH BROADWAY STREET
BUTLER, DEKALB COUNTY, INDIANA
INDIANA BROWNFIELDS PROGRAM
INDIANAPOLIS, INDIANA
19-716 10 B 4
CGP 7/11/19
CGP 7/11/19
MRA7/11/19
LEGEND
PROPERTY BOUNDARY
FILL SAMPLING LOCATION
BORING, BC-GP1 THROUGH
BC-GP9 (NINE (9) LOCATIONS)
BORING/TEMPORARY WELL
LOCATION WITH PFAS SAMPLING,
BC-GP10 THROUGH BC-GP14
(FIVE (5) LOCATIONS)
BORING/TEMPORARY WELL
LOCATION, BC-GP15 (ONE (1)
LOCATION)
ATTEMPTED SOIL GAS LOCATION,
BC-SG1, BC-SG2, AND BC-SG3
THICKNESS OF FILL AS
IDENTIFIED IN SOIL BORING.
SES BORING LOCATION (2018)
FORMER BUILDING FOOTPRINT
FENCE LINE
SEWER
SITE FEATURES SHOWN ARE BASED ON DEKALB
COUNTY GIS 2012 AND 2017 AERIAL PHOTOGRAPHS.
ONLY SOIL ANALYTICAL RESULTS IN EXCESS OF THEIR
RESPECTIVE MARCH 2019 IDEM RCG RDCSLs, IDCSLs,
AND ExDCSLs ARE SHOWN ON THIS MAP.
S
3'
BC
BC-GP1
BC-GP11
BC-GP15
BC-SG1

BUIL
DIN
G
EAST WILLOW STREET
SOU
TH B
RO
ADW
AY S
TREE
T
ACCESS DRIVE
WOODED
BUILDING
SIDEWALK
SIDEWALK
COLLAPSEDBUILDING
BC-GP15BC-GP3FILL
BC-GP4FILL
BC-GP2FILL
BC-GP1
BC-GP12PFAS
BC-GP9
PFASBC-GP14
BC-GP7FILL
BC-GP6
BC-GP8FILL
PFAS BC-GP13
PFASBC-GP11
FILL
PFAS BC-GP10
BC-GP5
FILL
FILL
FILL
SS
SS
SS
SS
SS
BURIEDNATURAL
GASMARKER ?
STORMSEWERCATCHBASIN
RETENTION POND
BC-SG3SOIL GAS
SOIL GASBC-SG1BC-SG2
SOIL GAS
(861.78)
(845.35)
(845.46)
(844.99)
(844.84)
(844.84)
845.40
845.30
845.20
845.10
845.00
844.90
844.80
845.40
845.30
845.20
845.10
845.00
844.90
844.80
SIZE FIG. NO.TASK
TITLE:
CLIENT:
PROJECT NUMBER
1015 Production Road, Fort Wayne, Indiana 46808(260)497-9620 fax: (260)471-7071 www.iwmconsult.com
DRAWING NUMBERDRAWN BY:
REVISED:
APPROVED BY:
DATE:
DATE:
DATE:
N
75'25' 50'0SCALE: 1" = 50'
GROUNDWATER POTENTIOMETRIC MAP
THE BUTLER COMPANY - IBP SITE No. 4170705
325 SOUTH BROADWAY STREETBUTLER, DEKALB COUNTY, INDIANA
INDIANA BROWNFIELDS PROGRAMINDIANAPOLIS, INDIANA
19-716 10 B 5CGP 7/11/19
7/11/19
MRA 7/11/19
LEGENDPROPERTY BOUNDARY
FILL SAMPLING LOCATION BORING, BC-GP1 THROUGH BC-GP9 (NINE (9) LOCATIONS)
BORING/TEMPORARY WELL LOCATION WITH PFAS SAMPLING,BC-GP10 THROUGH BC-GP14(FIVE (5) LOCATIONS)
BORING/TEMPORARY WELL LOCATION, BC-GP15 (ONE (1)LOCATION)
ATTEMPTED SOIL GAS LOCATION,BC-SG1, BC-SG2, AND BC-SG3
FORMER BUILDING FOOTPRINT
FENCE LINE
SEWER
POTENTIOMETRIC CONTOUR
GROUNDWATER ELEVATIONMAY 22, 2019
GROUNDWATER FLOW DIRECTION
NOTE: BC-GP13 WAS NOT INCLUDED IN THEGENERATION OF THE MAY 22, 2019 POTENTIOMETRICMAP BECAUSE WELL WAS INSTALLED IN SHALLOW FILL.
WELL ELEVATIONS AND LOCATIONS SURVEYED BYMAXWELL SURVEYING AND ENGINEERING ON MAY 25,2019.
PFAS
S
(946.64)
CGP
Remediation Work Plan BFD #4170705
REMEDIATION WORK PLAN
APPENDIX E. EXPOSURE ASSESSMENT DATA
The Butler Company 325 S Broadway St
Butler, DeKalb County, Indiana 46721 BFD #4170705

Wetland Mapper - Butler
Source: Esri, Maxar, GeoEye, Earthstar Geographics, CNES/Airbus DS,USDA, USGS, AeroGRID, IGN, and the GIS User Community
WetlandsEstuarine and Marine Deepwater
Estuarine and Marine Wetland
Freshwater Emergent Wetland
Freshwater Forested/Shrub Wetland
Freshwater Pond
Lake
Other
Riverine
July 27, 2020
0 0.09 0.180.045 mi
0 0.15 0.30.075 km
1:5,450
This page was produced by the NWI mapper
National Wetlands Inventory (NWI)
This map is for general reference only. The US Fish and Wildlife Service is not responsible for the accuracy or currentness of the base data shown on this map. All wetlands related data should be used in accordance with the layer metadata found on the Wetlands Mapper web site.

IDEM Source Water Proximity
Sources: Esri, HERE, Garmin, USGS, Intermap, INCREMENT P, NRCan,Esri Japan, METI, Esri China (Hong Kong), Esri Korea, Esri (Thailand),
July 22, 20200 0.15 0.30.075 mi
0 0.2 0.40.1 km
1:9,028
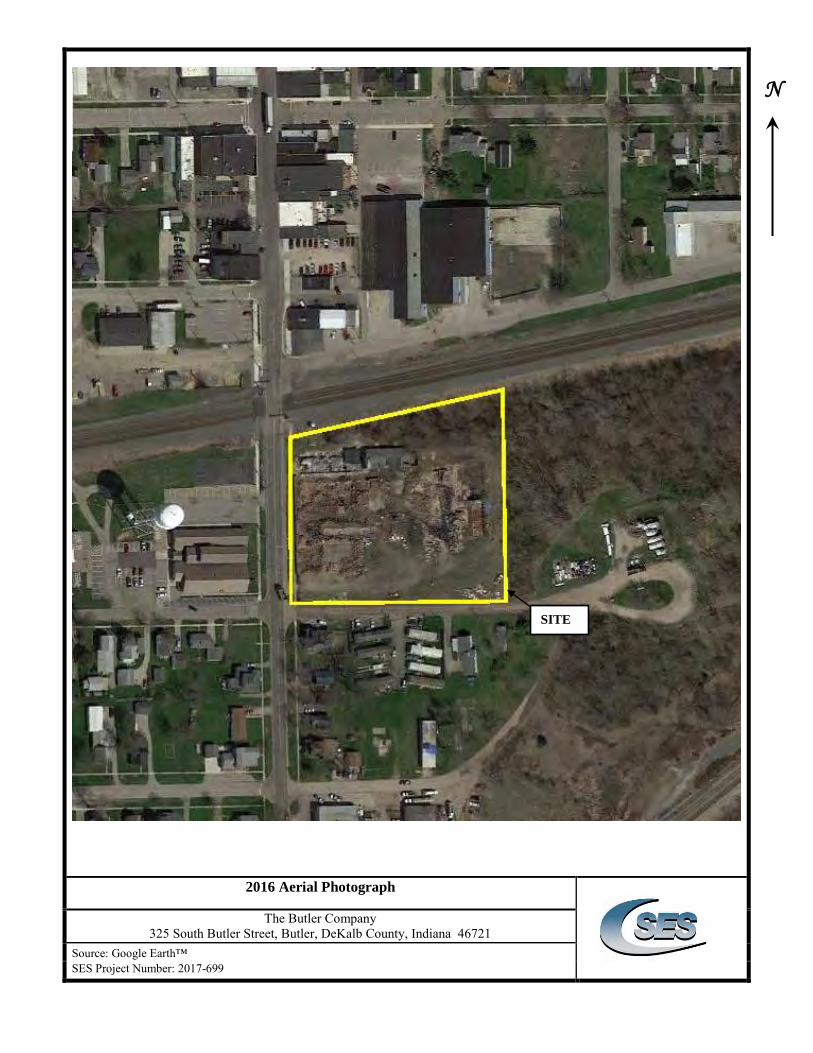
2016 Aerial Photograph
The Butler Company 325 South Butler Street, Butler, DeKalb County, Indiana 46721
Source: Google Earth™ SES Project Number: 2017-699
N
SITE

Species Name Common Name STATEFED
Page 1 of 2
03/09/2020Indiana County Endangered, Threatened and Rare Species List
GRANK SRANK
De KalbCounty:
Mollusk: Bivalvia (Mussels)Alasmidonta viridis Slippershell Mussel SSC G4G5 S3
Epioblasma obliquata perobliqua White catspaw LE SE G1 SX
Epioblasma rangiana Northern Riffleshell LE SE G1 S1
Fusconaia subrotunda Longsolid C SX G3 SX
Lampsilis fasciola Wavyrayed Lampmussel SSC G5 S3
Ligumia recta Black Sandshell SSC G4G5 S2
Obovaria subrotunda Round Hickorynut C SE G4 S1
Pleurobema clava Clubshell LE SE G1G2 S1
Ptychobranchus fasciolaris Kidneyshell SSC G4G5 S2
Simpsonaias ambigua Salamander Mussel C SSC G3 S2
Theliderma cylindrica Rabbitsfoot LT SE G3G4 S1
Toxolasma lividus Purple Lilliput C SSC G3Q S2
Villosa fabalis Rayed Bean LE SE G2 S1
Insect: Lepidoptera (Butterflies & Moths)Catocala marmorata Marbled Underwing Moth SE G3G4 S1
FishMoxostoma valenciennesi Greater Redhorse SE G4 S2
AmphibianAmbystoma laterale Blue-spotted Salamander SSC G5 S2
ReptileEmydoidea blandingii Blanding's Turtle C SE G4 S2
Thamnophis butleri Butler's Garter Snake SE G4 S1
BirdButeo platypterus Broad-winged Hawk SSC G5 S3B
Circus hudsonius Northern Harrier SE G5 S2
Cistothorus platensis Sedge Wren SE G5 S3B
Haliaeetus leucocephalus Bald Eagle SSC G5 S2
Pandion haliaetus Osprey SSC G5 S1B
Rallus limicola Virginia Rail SE G5 S3B
MammalLasiurus borealis Eastern Red Bat SSC G3G4 S4
Taxidea taxus American Badger SSC G5 S2
Vascular PlantAndromeda glaucophylla bog rosemary ST G5T5 S2
Botrychium simplex least grape-fern SE G5 S1
Carex echinata little prickly sedge SE G5 S1
Dactylorhiza viridis long-bract green orchid SE G5 S1
Glyceria grandis American manna-grass SE G5 S1
Indiana Natural Heritage Data CenterDivision of Nature PreservesIndiana Department of Natural ResourcesThis data is not the result of comprehensive county surveys.
Fed: LE = Endangered; LT = Threatened; C = candidate; PDL = proposed for delistingState: SE = state endangered; ST = state threatened; SR = state rare; SSC = state species of special concern;
SX = state extirpated; SG = state significant; WL = watch listGRANK: Global Heritage Rank: G1 = critically imperiled globally; G2 = imperiled globally; G3 = rare or uncommon
globally; G4 = widespread and abundant globally but with long-term concerns; G5 = widespread and abundant globally; G? = unranked; GX = extinct; Q = uncertain rank; T = taxonomic subunit rank
SRANK: State Heritage Rank: S1 = critically imperiled in state; S2 = imperiled in state; S3 = rare or uncommon in state; G4 = widespread and abundant in state but with long-term concern; SG = state significant; SH = historical in state; SX = state extirpated; B = breeding status; S? = unranked; SNR = unranked; SNA = nonbreeding status unranked
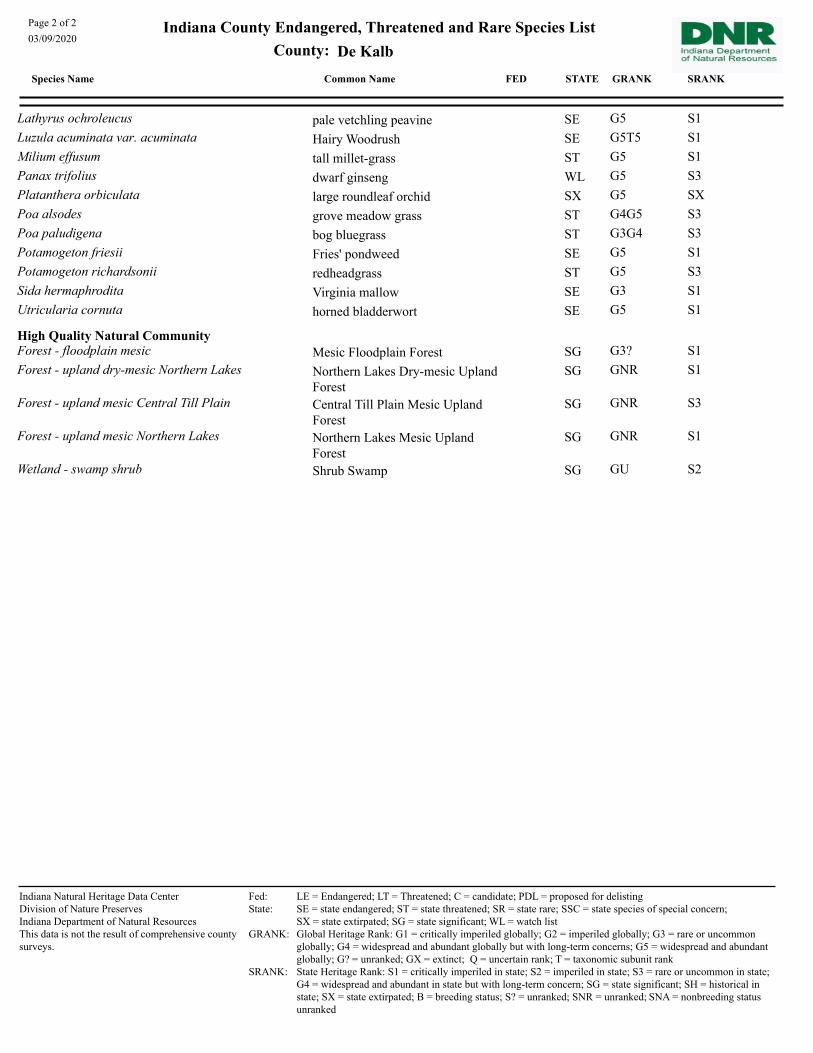
Species Name Common Name STATEFED
Page 2 of 2
03/09/2020Indiana County Endangered, Threatened and Rare Species List
GRANK SRANK
De KalbCounty:
Lathyrus ochroleucus pale vetchling peavine SE G5 S1
Luzula acuminata var. acuminata Hairy Woodrush SE G5T5 S1
Milium effusum tall millet-grass ST G5 S1
Panax trifolius dwarf ginseng WL G5 S3
Platanthera orbiculata large roundleaf orchid SX G5 SX
Poa alsodes grove meadow grass ST G4G5 S3
Poa paludigena bog bluegrass ST G3G4 S3
Potamogeton friesii Fries' pondweed SE G5 S1
Potamogeton richardsonii redheadgrass ST G5 S3
Sida hermaphrodita Virginia mallow SE G3 S1
Utricularia cornuta horned bladderwort SE G5 S1
High Quality Natural CommunityForest - floodplain mesic Mesic Floodplain Forest SG G3? S1
Forest - upland dry-mesic Northern Lakes Northern Lakes Dry-mesic Upland Forest
SG GNR S1
Forest - upland mesic Central Till Plain Central Till Plain Mesic Upland Forest
SG GNR S3
Forest - upland mesic Northern Lakes Northern Lakes Mesic Upland Forest
SG GNR S1
Wetland - swamp shrub Shrub Swamp SG GU S2
Indiana Natural Heritage Data CenterDivision of Nature PreservesIndiana Department of Natural ResourcesThis data is not the result of comprehensive county surveys.
Fed: LE = Endangered; LT = Threatened; C = candidate; PDL = proposed for delistingState: SE = state endangered; ST = state threatened; SR = state rare; SSC = state species of special concern;
SX = state extirpated; SG = state significant; WL = watch listGRANK: Global Heritage Rank: G1 = critically imperiled globally; G2 = imperiled globally; G3 = rare or uncommon
globally; G4 = widespread and abundant globally but with long-term concerns; G5 = widespread and abundant globally; G? = unranked; GX = extinct; Q = uncertain rank; T = taxonomic subunit rank
SRANK: State Heritage Rank: S1 = critically imperiled in state; S2 = imperiled in state; S3 = rare or uncommon in state; G4 = widespread and abundant in state but with long-term concern; SG = state significant; SH = historical in state; SX = state extirpated; B = breeding status; S? = unranked; SNR = unranked; SNA = nonbreeding status unranked

Beacon - DeKalb County, IN https://beacon.schneidercorp.com/Application.aspx?AppID=385&Layer...
1 of 6 11/8/2017, 2:42 PM


DNR Oil and Gas Well Records
Source: Esri, DigitalGlobe, GeoEye, Earthstar Geographics,CNES/Airbus DS, USDA, USGS, AeroGRID, IGN, and the GIS UserCommunity
November 8, 2017
IDNR 2015IDNR GIS
1:2,2570 0.04 0.080.02 mi0 0.04 0.080.02 km

Remediation Work Plan BFD #4170705
REMEDIATION WORK PLAN
APPENDIX F. IBP’S BFF COMFORT LETTER AND ENVIRONMENTAL
RESTRICTIVE COVENANT (ERC)
The Butler Company 325 S Broadway St
Butler, DeKalb County, Indiana 46721 BFD #4170705