Embed Size (px)
Citation preview
Remittances, Competition, and Financial Intermediation for Unbanked Migrants
Manuel Orozco, Inter-American Dialogue
Washington, DC
First Draft Notes presented before the
Taskforce on Remittances and Development of the Inter-American Dialogue
September 20th, 2005 Washington, DC
An earlier version was presented at the Financial DNA meeting on the unbanked, San Francisco, September 14th, 2005
1
Introduction The contemporary global landscape is organized along the lines of an interplay
between micro and macro dynamics that creates what Rosenau calls ‘distant proximities’ (Rosenau, 2003). These are experiences that simultaneously integrate and fragment relationships within and outside territorial boundaries. Immigrants are key protagonists of globalization and emblematic of distant proximities: while their lives are fragmented by the experience of migration which separates them from their families and nations, through their labor mobility, they integrate their home and host countries into the global economy in order to keep their own families together. The end result is a transnational lifestyle, characterized by both opportunities and hardships that feature this paradox of distance and closeness. Family remittances are a significant example of the impact of transationalism and its effect on the global economy. Specifically, the effects remittances have on the marketplace of transfers and on financial intermediation are of fundamental importance. This note provides an update about the global trend of money transfers, the conceptual and empirical intersection between remittances and financial intermediation.
There exist challenges and opportunities in terms of the demand for remittance transfers, the inelastic nature of these transfers, their organic relationship to financial services (banking in particular), and the importance of alternative sending methodologies (including technologies). Moreover, in addition to the importance of remittances, the mobility of international migrants has been accompanied by a demand for goods and services that encompasses, among others, purchasing home country goods, air transportation to visit families, and phone calls to keep in touch with distant family members. 1. Remittance transfers: trends and patterns
While it is unclear what the precise amount of family remittances is on a global scale, there is agreement that the volume is close to or possibly event above US$200 billion annually (Orozco 2004; Celent 2004). Estimates of remittances to Latin America and the Caribbean, for example, suggest that $45 billion were transferred in 2004. In the South East Asia region alone, remittances from Hong Kong, Japan, Malaysia, and Singapore to the Philippines and Indonesia add to three billion dollars (Orozco 2005b).
From a market perspective, these remittance transfers involve relationships of supply and demand. Remittance companies supply transfer services and migrants demand transfer services. Learning about this market structure is particularly important to facilitate successful policy and business decisions and appropriate forecasting. Suppliers need to learn about certain characteristics of senders, such as the average amounts sent, sending frequency, purposes of sending, and how long remitters have been sending money.
Although often a profitable industry, sending remittances is an increasingly competitive industry; competition is strong, diffuse, and stimulated by both new industry players and migrants’ choices. It is important to learn about the preferences of migrants and their beneficiary families in remittance sending per se, as well as in related areas like financial services and commercial goods and services. Knowing about financial services requires attention to both formal and informal players in remittance intermediation, banks and non-banking institutions, costs of transfers, and level of competition.
a) Migrant sender profiles: Frequency of sending money, length of time for sending, and average sent In the majority of cases, migrant workers send a regular amount over an extended
period of time of no less than three years. For example, like Latinos in the United States,
2
over 70 percent of Filipinos in Hong Kong, Singapore and Japan send remittances at least eight times a year. However, Indonesians in Singapore and Malaysia have a lower frequency of sending money. By contrast, Ghanaians in the United States, England, and Germany also send money with significant frequency - on average, 11 times a year (Orozco 2005c).
The length of time sending money also varies across groups and regions. Latinos in the United States send money for more an average of five years, whereas Filipinos and Indonesians in South East Asia do so for three. Again, Ghanaians in the United States, England and Germany have been sending for an average of three and half years.
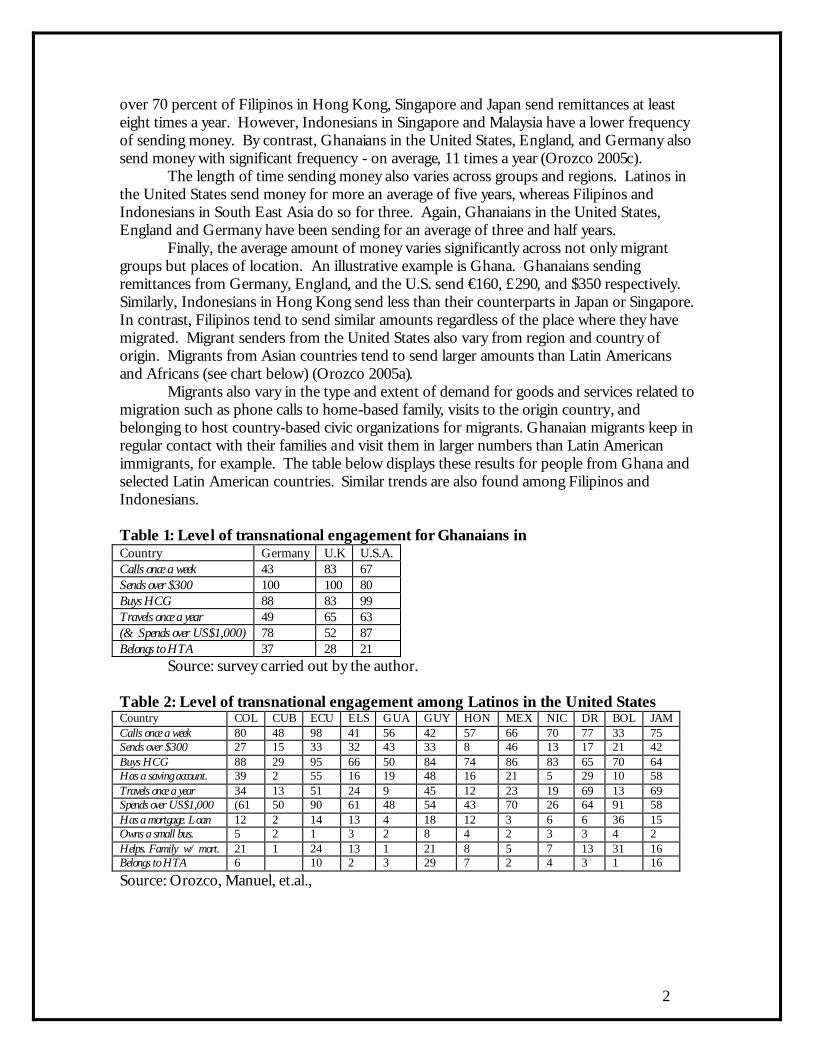
Finally, the average amount of money varies significantly across not only migrant groups but places of location. An illustrative example is Ghana. Ghanaians sending remittances from Germany, England, and the U.S. send €160, £290, and $350 respectively. Similarly, Indonesians in Hong Kong send less than their counterparts in Japan or Singapore. In contrast, Filipinos tend to send similar amounts regardless of the place where they have migrated. Migrant senders from the United States also vary from region and country of origin. Migrants from Asian countries tend to send larger amounts than Latin Americans and Africans (see chart below) (Orozco 2005a).
Migrants also vary in the type and extent of demand for goods and services related to migration such as phone calls to home-based family, visits to the origin country, and belonging to host country-based civic organizations for migrants. Ghanaian migrants keep in regular contact with their families and visit them in larger numbers than Latin American immigrants, for example. The table below displays these results for people from Ghana and selected Latin American countries. Similar trends are also found among Filipinos and Indonesians.
Table 1: Level of transnational engagement for Ghanaians in Country Germany U.K U.S.A. Calls once a week 43 83 67 Sends over $300 100 100 80 Buys HCG 88 83 99 Travels once a year 49 65 63 (& Spends over US$1,000) 78 52 87 Belongs to HTA 37 28 21
Source: survey carried out by the author. Table 2: Level of transnational engagement among Latinos in the United States Country COL CUB ECU ELS GUA GUY HON MEX NIC DR BOL JAM Calls once a week 80 48 98 41 56 42 57 66 70 77 33 75 Sends over $300 27 15 33 32 43 33 8 46 13 17 21 42 Buys HCG 88 29 95 66 50 84 74 86 83 65 70 64 Has a saving account. 39 2 55 16 19 48 16 21 5 29 10 58 Travels once a year 34 13 51 24 9 45 12 23 19 69 13 69 Spends over US$1,000 (61 50 90 61 48 54 43 70 26 64 91 58 Has a mortgage. Loan 12 2 14 13 4 18 12 3 6 6 36 15 Owns a small bus. 5 2 1 3 2 8 4 2 3 3 4 2 Helps. Family w/ mort. 21 1 24 13 1 21 8 5 7 13 31 16 Belongs to HTA 6 10 2 3 29 7 2 4 3 1 16
Source: Orozco, Manuel, et.al.,
3
Figure 1. Migrant worker average amount sent from the United States
125130140170180180190200200200210214223230238250255260280290300300300308327351370390390440
590800800
9001000
11301631
0 200 400 600 800 1000 1200 1400 1600 1800
Haiti
Nicaragua
Venezuela
Peru
Guinea
Dom. Repub.
Panama
Cape Verde
Jamaica
Uruguay
Argentina
Colombia
Honduras
Ivory Coast
Bolivia
Ghana
Malaysia
Paraguay
Chile
Burundi
Costa Rica
Ecuador
Togo
Senegal
El Salvador
Mexico
Guatemala
Kenya
Nigieria
Philippines
Brazil
China
Sri Lanka
Bangladesh
Pakistan
India
Nepal
Source: NMTA, 2005. b) Landscape of intermediation Understanding the behavior of the remittance marketplace is also significant. The
demand for remittance services is accompanied by a supply side that often is diffuse and more complex than imagined. Intermediaries of remittance transfers represent a complex array of large and small businesses that include licensed and unlicensed corporations. The operations of the formal and regulated sector are often a function of the extent to which a competitive environment exists, regulatory frameworks and the costs of regulation, and
4
remittance senders preferences for kinds of players. Many factors may influence each element of market functioning. For example, banks potentially have greater opportunities in the market because they can offer value added financial services bundles, an increasing feature of the marketplace.
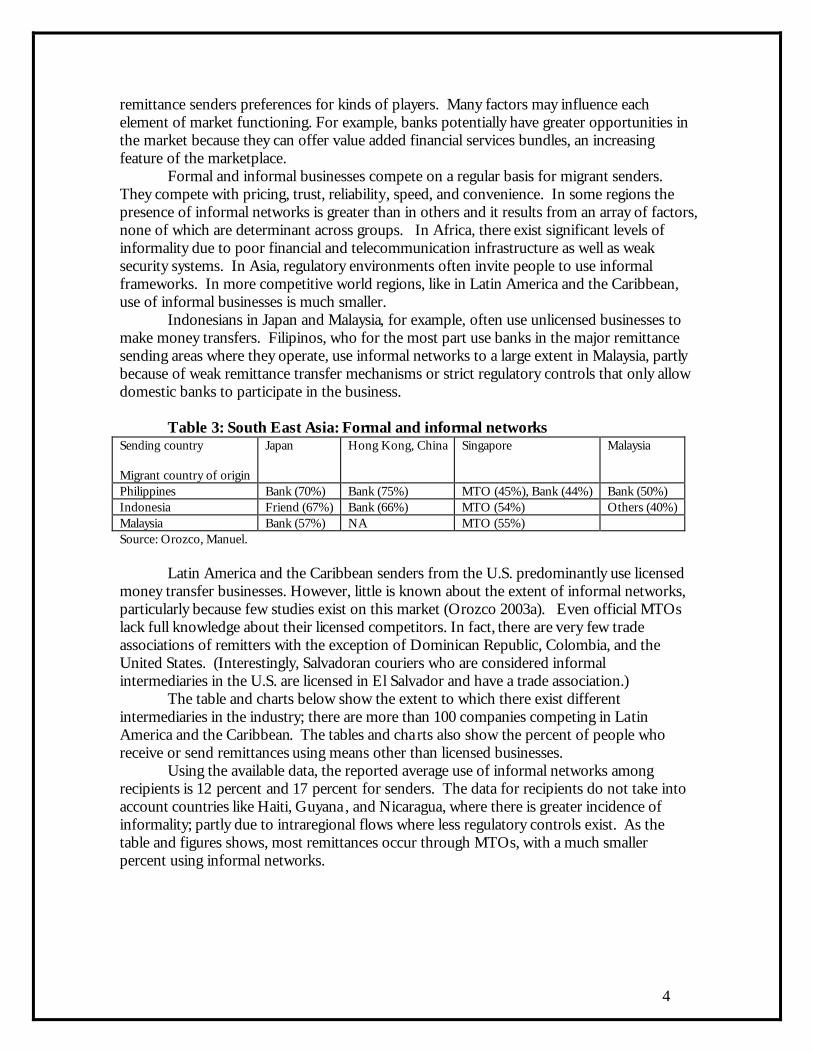
Formal and informal businesses compete on a regular basis for migrant senders. They compete with pricing, trust, reliability, speed, and convenience. In some regions the presence of informal networks is greater than in others and it results from an array of factors, none of which are determinant across groups. In Africa, there exist significant levels of informality due to poor financial and telecommunication infrastructure as well as weak security systems. In Asia, regulatory environments often invite people to use informal frameworks. In more competitive world regions, like in Latin America and the Caribbean, use of informal businesses is much smaller.
Indonesians in Japan and Malaysia, for example, often use unlicensed businesses to make money transfers. Filipinos, who for the most part use banks in the major remittance sending areas where they operate, use informal networks to a large extent in Malaysia, partly because of weak remittance transfer mechanisms or strict regulatory controls that only allow domestic banks to participate in the business.
Table 3: South East Asia: Formal and informal networks
Sending country Migrant country of origin
Japan Hong Kong, China Singapore Malaysia
Philippines Bank (70%) Bank (75%) MTO (45%), Bank (44%) Bank (50%) Indonesia Friend (67%) Bank (66%) MTO (54%) Others (40%) Malaysia Bank (57%) NA MTO (55%) Source: Orozco, Manuel.
Latin America and the Caribbean senders from the U.S. predominantly use licensed
money transfer businesses. However, little is known about the extent of informal networks, particularly because few studies exist on this market (Orozco 2003a). Even official MTOs lack full knowledge about their licensed competitors. In fact, there are very few trade associations of remitters with the exception of Dominican Republic, Colombia, and the United States. (Interestingly, Salvadoran couriers who are considered informal intermediaries in the U.S. are licensed in El Salvador and have a trade association.)
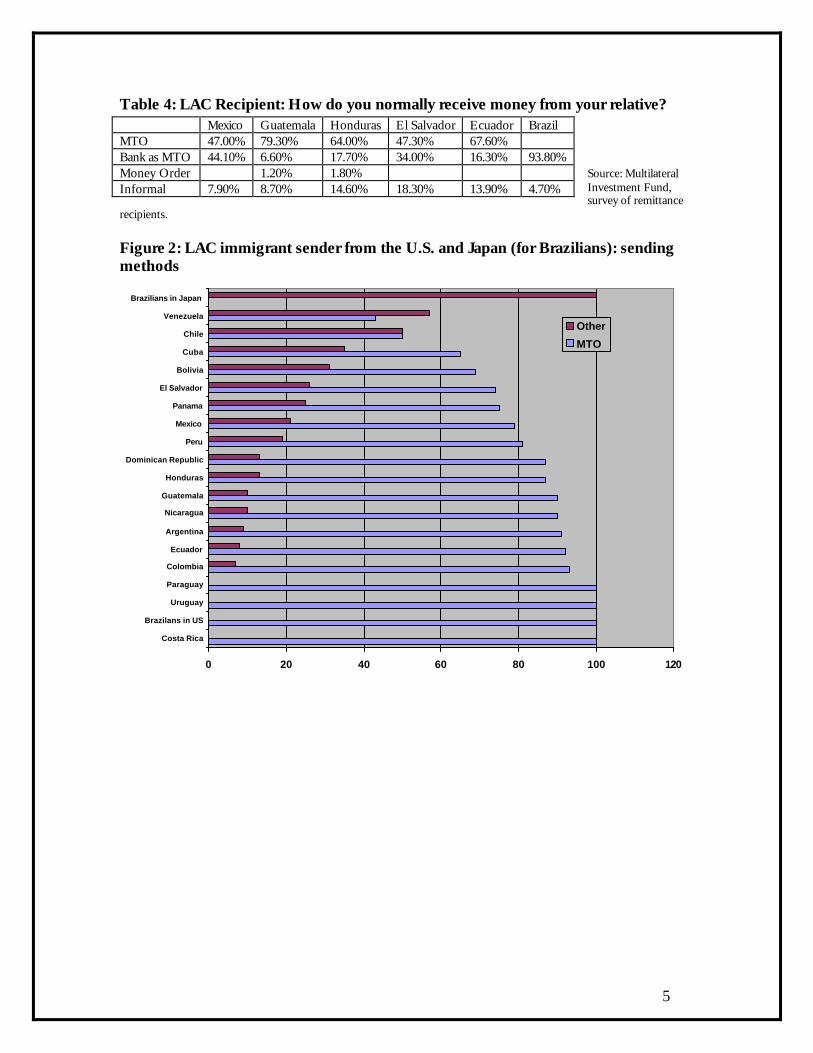
The table and charts below show the extent to which there exist different intermediaries in the industry; there are more than 100 companies competing in Latin America and the Caribbean. The tables and cha rts also show the percent of people who receive or send remittances using means other than licensed businesses.
Using the available data, the reported average use of informal networks among recipients is 12 percent and 17 percent for senders. The data for recipients do not take into account countries like Haiti, Guyana , and Nicaragua, where there is greater incidence of informality; partly due to intraregional flows where less regulatory controls exist. As the table and figures shows, most remittances occur through MTOs, with a much smaller percent using informal networks.
5
Table 4: LAC Recipient: How do you normally receive money from your relative? Source: Multilateral Investment Fund, survey of remittance
recipients. Figure 2: LAC immigrant sender from the U.S. and Japan (for Brazilians): sending methods
0 20 40 60 80 100 120
Costa Rica
Brazilans in US
Uruguay
Paraguay
Colombia
Ecuador
Argentina
Nicaragua
Guatemala
Honduras
Dominican Republic
Peru
Mexico
Panama
El Salvador
Bolivia
Cuba
Chile
Venezuela
Brazilians in Japan
Other
MTO
Mexico Guatemala Honduras El Salvador Ecuador Brazil MTO 47.00% 79.30% 64.00% 47.30% 67.60% Bank as MTO 44.10% 6.60% 17.70% 34.00% 16.30% 93.80% Money Order 1.20% 1.80% Informal 7.90% 8.70% 14.60% 18.30% 13.90% 4.70%
6
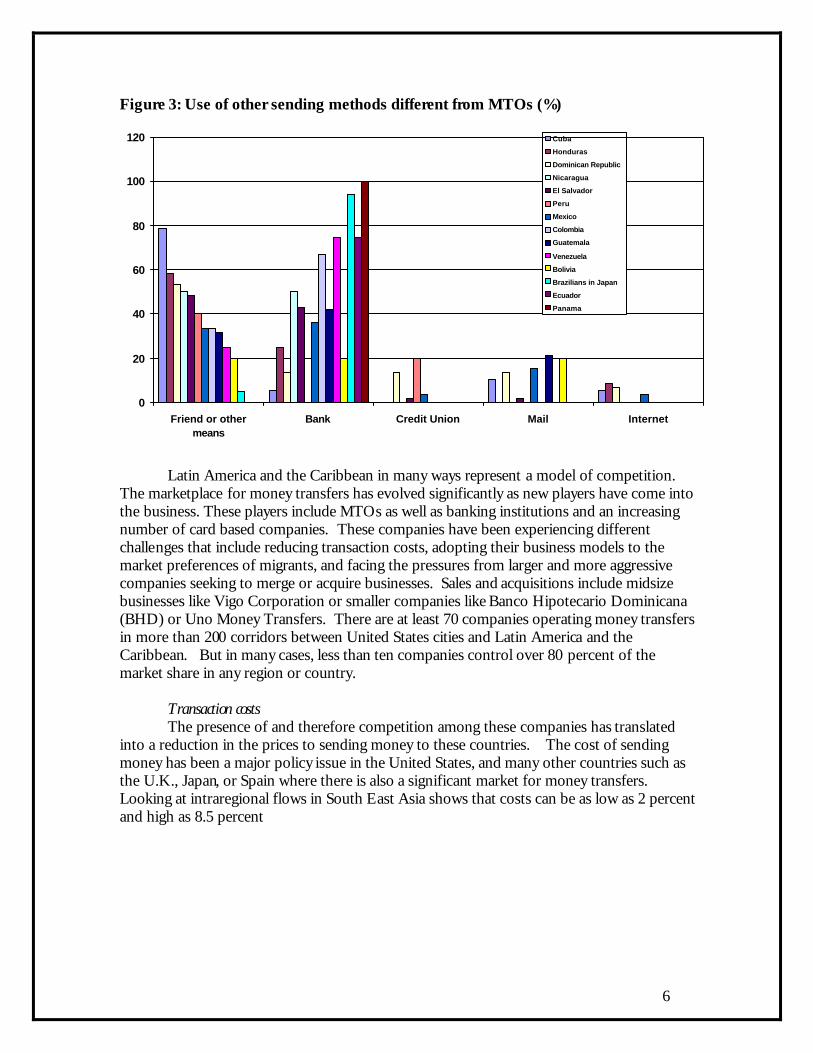
Figure 3: Use of other sending methods different from MTOs (%)
0
20
40
60
80
100
120
Friend or othermeans
Bank Credit Union Mail Internet
Cuba
Honduras
Dominican Republic
Nicaragua
El Salvador
Peru
Mexico
Colombia
Guatemala
Venezuela
Bolivia
Brazilians in Japan
Ecuador
Panama
Latin America and the Caribbean in many ways represent a model of competition.
The marketplace for money transfers has evolved significantly as new players have come into the business. These players include MTOs as well as banking institutions and an increasing number of card based companies. These companies have been experiencing different challenges that include reducing transaction costs, adopting their business models to the market preferences of migrants, and facing the pressures from larger and more aggressive companies seeking to merge or acquire businesses. Sales and acquisitions include midsize businesses like Vigo Corporation or smaller companies like Banco Hipotecario Dominicana (BHD) or Uno Money Transfers. There are at least 70 companies operating money transfers in more than 200 corridors between United States cities and Latin America and the Caribbean. But in many cases, less than ten companies control over 80 percent of the market share in any region or country.
Transaction costs The presence of and therefore competition among these companies has translated
into a reduction in the prices to sending money to these countries. The cost of sending money has been a major policy issue in the United States, and many other countries such as the U.K., Japan, or Spain where there is also a significant market for money transfers. Looking at intraregional flows in South East Asia shows that costs can be as low as 2 percent and high as 8.5 percent
7
6.90%
7.80%8.50%
7.50%
8.50%
3.60%
5.00%
3.40%3.00%
2.00%
0.00%
1.00%
2.00%
3.00%
4.00%
5.00%
6.00%
7.00%
8.00%
9.00%
Japan Malaysia Singapore Hong Kong
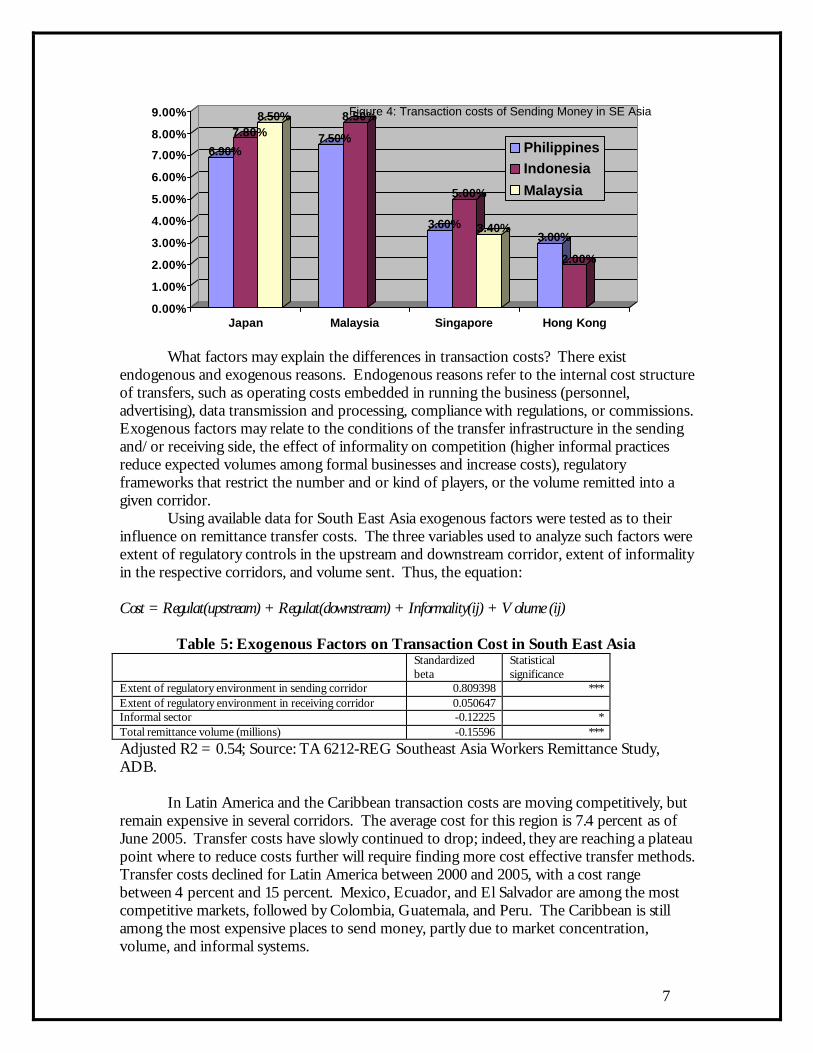
Figure 4: Transaction costs of Sending Money in SE Asia
PhilippinesIndonesia
Malaysia
What factors may explain the differences in transaction costs? There exist
endogenous and exogenous reasons. Endogenous reasons refer to the internal cost structure of transfers, such as operating costs embedded in running the business (personnel, advertising), data transmission and processing, compliance with regulations, or commissions. Exogenous factors may relate to the conditions of the transfer infrastructure in the sending and/or receiving side, the effect of informality on competition (higher informal practices reduce expected volumes among formal businesses and increase costs), regulatory frameworks that restrict the number and or kind of players, or the volume remitted into a given corridor.
Using available data for South East Asia exogenous factors were tested as to their influence on remittance transfer costs. The three variables used to analyze such factors were extent of regulatory controls in the upstream and downstream corridor, extent of informality in the respective corridors, and volume sent. Thus, the equation: Cost = Regulat(upstream) + Regulat(downstream) + Informality(ij) + Volume (ij)
Table 5: Exogenous Factors on Transaction Cost in South East Asia Standardized
beta Statistical significance
Extent of regulatory environment in sending corridor 0.809398 *** Extent of regulatory environment in receiving corridor 0.050647 Informal sector -0.12225 * Total remittance volume (millions) -0.15596 *** Adjusted R2 = 0.54; Source: TA 6212-REG Southeast Asia Workers Remittance Study, ADB.
In Latin America and the Caribbean transaction costs are moving competitively, but remain expensive in several corridors. The average cost for this region is 7.4 percent as of June 2005. Transfer costs have slowly continued to drop; indeed, they are reaching a plateau point where to reduce costs further will require finding more cost effective transfer methods. Transfer costs declined for Latin America between 2000 and 2005, with a cost range between 4 percent and 15 percent. Mexico, Ecuador, and El Salvador are among the most competitive markets, followed by Colombia, Guatemala, and Peru. The Caribbean is still among the most expensive places to send money, partly due to market concentration, volume, and informal systems.
8
0.00%
2.00%
4.00%
6.00%
8.00%
10.00%
12.00%
14.00%
16.00%
18.00%
Bolivia
Co
lom
bia
Cu
ba
Do
min
icanR
epu
blic
Ecu
ado
r
El S
alvador
Gu
atemala
Haiti
Ho
nd
uras
Jamaica
Mexico
Nicarag
ua
Peru
Ven
ezuela
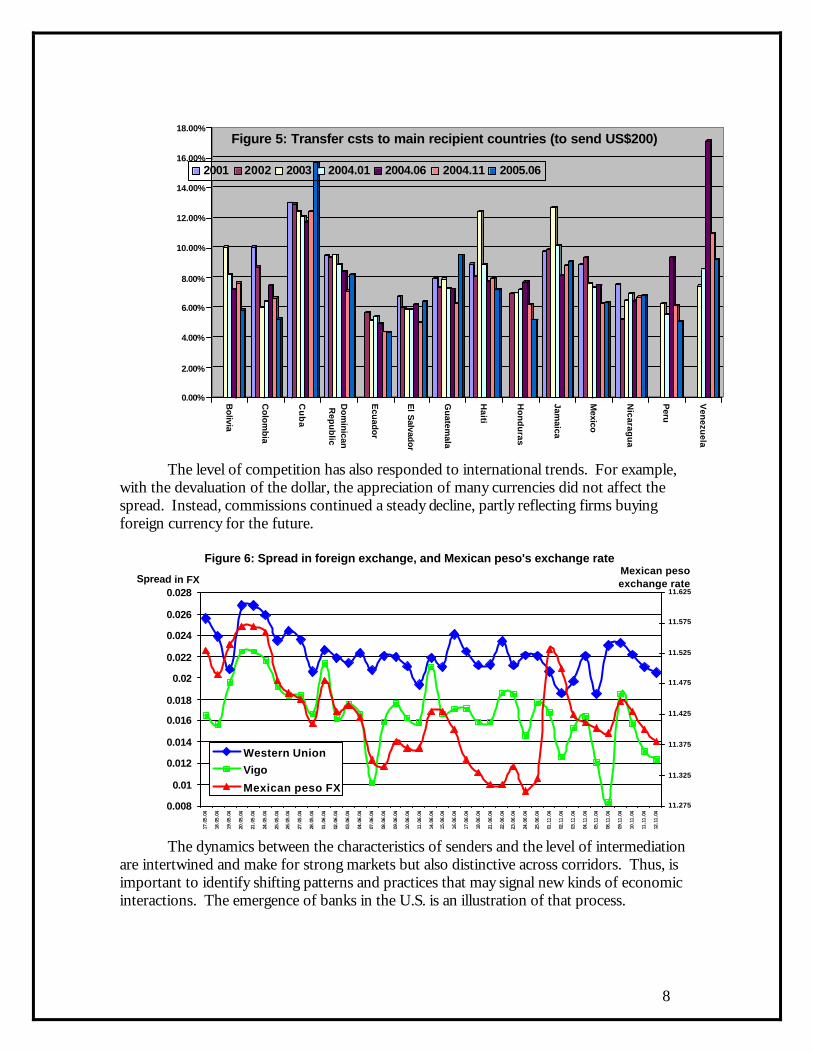
Figure 5: Transfer csts to main recipient countries (to send US$200)
2001 2002 2003 2004.01 2004.06 2004.11 2005.06
The level of competition has also responded to international trends. For example, with the devaluation of the dollar, the appreciation of many currencies did not affect the spread. Instead, commissions continued a steady decline, partly reflecting firms buying foreign currency for the future.
The dynamics between the characteristics of senders and the level of intermediation are intertwined and make for strong markets but also distinctive across corridors. Thus, is important to identify shifting patterns and practices that may signal new kinds of economic interactions. The emergence of banks in the U.S. is an illustration of that process.
Figure 6: Spread in foreign exchange, and Mexican peso's exchange rate
0.008
0.01
0.012
0.014
0.016
0.018
0.02
0.022
0.024
0.026
0.028
17.05.04
18.05.04
19.05.04
20.05.04
21.05.04
24.05.04
25.05.04
26.05.04
27.05.04
28.05.04
01.06.04
02.06.04
03.06.04
04.06.04
07.06.04
08.06.04
09.06.04
10.06.04
11.06.04
14.06.04
15.06.04
16.06.04
17.06.04
18.06.04
21.06.04
22.06.04
23.06.04
24.06.04
25.06.04
01.11.04
02.11.04
03.11.04
04.11.04
05.11.04
08.11.04
09.11.04
10.11.04
11.11.04
12.11.04
Spread in FX
11.275
11.325
11.375
11.425
11.475
11.525
11.575
11.625
Mexican peso exchange rate
Western Union
Vigo
Mexican peso FX

9
2. Banking and remittances: progress and challenges While the remittance transfer industry continues a competitive stream in the United
States and Latin America, banking financial institutions are increasingly demonstrating an interest in participating in money transfers as a vehicle to offer other banking services. a) The relevance of banking within the context of money transfers
In the past five years, a number of institutions have highlighted policy recommendations stressing the importance of linking remittances to formal financial intermediation and banking in particular as a strategy to harness the development impact of remittance transfers (IAD 2004). Financial intermediation of remittance flows, it is argued, can provide both senders and recipients with access to asset building, which – as with education and health – is essential to achieving development (Orozco and Hamilton 2005; Robinson 2003).
There is an assumption that money transferred through banks and credit unions paves the way for senders and recipients to gain access to other financial products and services, which they might not have otherwise. The provision of remittance transfer services gives banks a vehicle for reaching out to senders or recipients who are unbanked or have limited access to financial intermediation. The ensuing banking relationship potentially affords people the ability to establish credit histories, to obtain mortgages, or to take advantage of health and educational savings plans, among other investments. Intermediaries might even develop products and services that specifically cater to remittance senders and/or recipients, as discussed below.
Countries with better developed financial intermediaries positively impact the earnings of the poor even more so than the non-poor, demonstrating that financial intermediaries play an important role in reducing income inequalities (Beck, Demirgüç-Kunt and Levine 2004; Guiliano and Ruiz-Arranz, 2005). Indeed, poverty and development in Latin American is connected to low penetration and outreach of financial institutions. For example, only about a third of Mexicans, 20 percent of Guatemalans, and 10 percent of Nicaraguans have bank accounts.
Table 6: People with bank accounts (remittance recipients and non-recipients) Guatemala Honduras El Salvador Mexico Ecuador Recipients 41% 34% 31% 19% 46% Non-Recipients 17% 16% 19% 16% 34%
Source: Multilateral Investment Fund-Inter-American Development Bank, Receptores de Remesas en Mexico, Octubre 2003; Receptores de remesas en Guatemala, El Salvador y Honduras, Septiembre 2003; Receptores de Remesas en Ecuador, Mayo 2003. Washington, DC: MIF-IADB/FOMIN-BID.
There are several reasons explaining the low penetration of financial intermediaries including lack of risk among financial institutions to work with the average citizen, mistrust of the banking system, limited knowledge of how banks function and of the asset building opportunities they can offer, primitive understanding of the market preferences of migrants and their families by banking institutions, and so on.
In the United States, in economically deprived areas, where ethnic and racial minorities have much less access to financial services, they also have lesser economic opportunities (Squires 2005). The U.S. banking industry has had a lower penetration among immigrants than among other groups. For example, despite low education levels, most
10
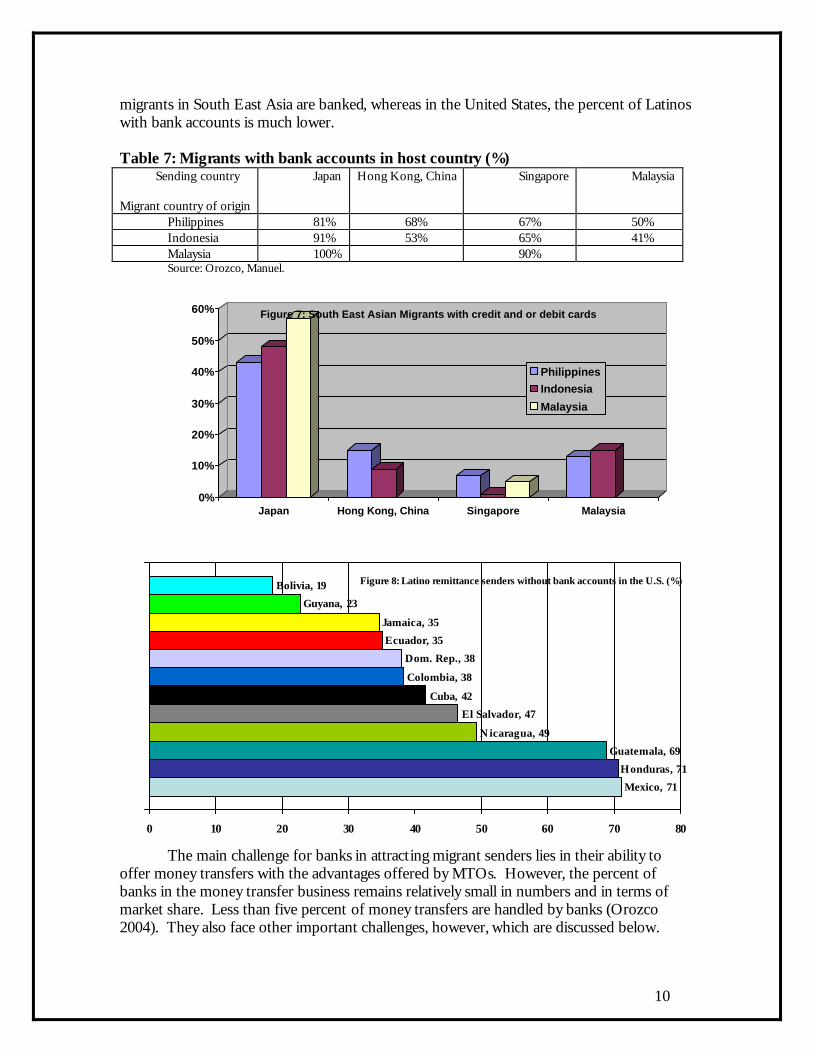
migrants in South East Asia are banked, whereas in the United States, the percent of Latinos with bank accounts is much lower.
Table 7: Migrants with bank accounts in host country (%) Sending country
Migrant country of origin
Japan Hong Kong, China Singapore Malaysia
Philippines 81% 68% 67% 50% Indonesia 91% 53% 65% 41% Malaysia 100% 90% Source: Orozco, Manuel.
0%
10%
20%
30%
40%
50%
60%
Japan Hong Kong, China Singapore Malaysia
Figure 7: South East Asian Migrants with credit and or debit cards
PhilippinesIndonesia
Malaysia
The main challenge for banks in attracting migrant senders lies in their ability to offer money transfers with the advantages offered by MTOs. However, the percent of banks in the money transfer business remains relatively small in numbers and in terms of market share. Less than five percent of money transfers are handled by banks (Orozco 2004). They also face other important challenges, however, which are discussed below.
Figure 8: Latino remittance senders without bank accounts in the U.S. (%)
Mexico, 71
Honduras, 71
Guatemala, 69
Nicaragua, 49
El Salvador, 47
Cuba, 42
Colombia, 38
Dom. Rep., 38
Ecuador, 35
Jamaica, 35
Guyana, 23
Bolivia, 19
0 10 20 30 40 50 60 70 80
11
0.00%
20.00%
40.00%
60.00%
80.00%
100.00%
GERMANY UK USA
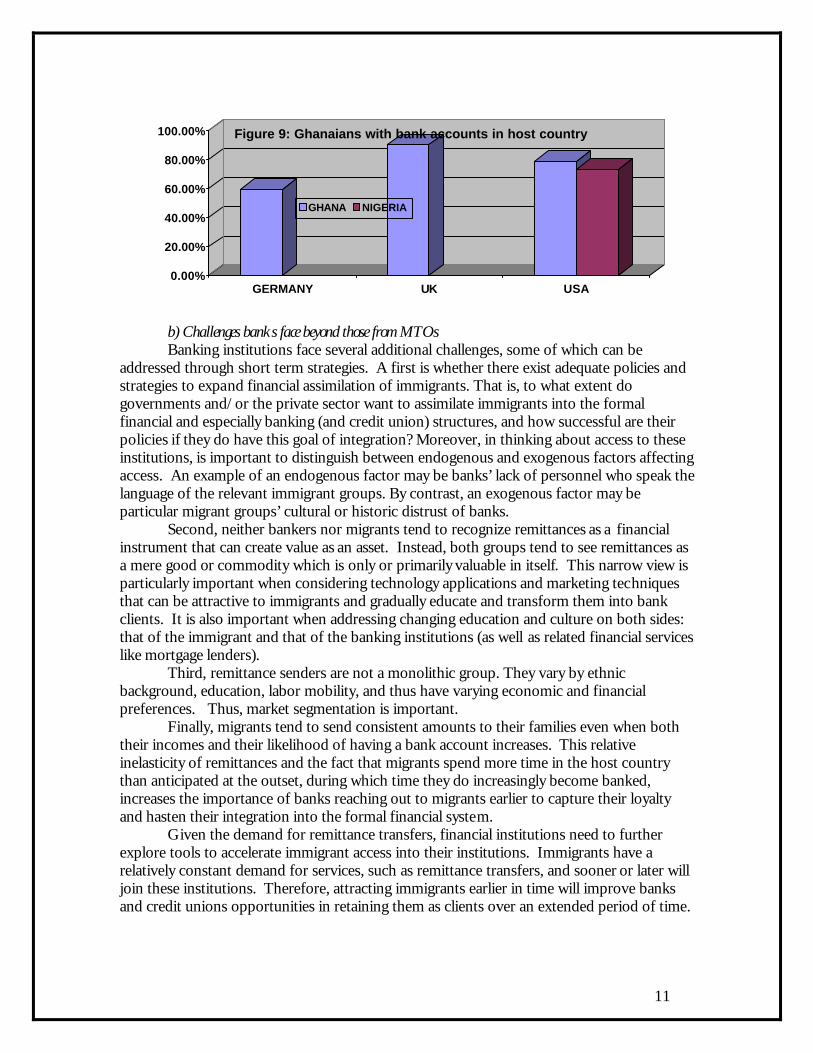
Figure 9: Ghanaians with bank accounts in host country
GHANA NIGERIA
b) Challenges banks face beyond those from MTOs
Banking institutions face several additional challenges, some of which can be addressed through short term strategies. A first is whether there exist adequate policies and strategies to expand financial assimilation of immigrants. That is, to what extent do governments and/or the private sector want to assimilate immigrants into the formal financial and especially banking (and credit union) structures, and how successful are their policies if they do have this goal of integration? Moreover, in thinking about access to these institutions, is important to distinguish between endogenous and exogenous factors affecting access. An example of an endogenous factor may be banks’ lack of personnel who speak the language of the relevant immigrant groups. By contrast, an exogenous factor may be particular migrant groups’ cultural or historic distrust of banks.
Second, neither bankers nor migrants tend to recognize remittances as a financial instrument that can create value as an asset. Instead, both groups tend to see remittances as a mere good or commodity which is only or primarily valuable in itself. This narrow view is particularly important when considering technology applications and marketing techniques that can be attractive to immigrants and gradually educate and transform them into bank clients. It is also important when addressing changing education and culture on both sides: that of the immigrant and that of the banking institutions (as well as related financial services like mortgage lenders).
Third, remittance senders are not a monolithic group. They vary by ethnic background, education, labor mobility, and thus have varying economic and financial preferences. Thus, market segmentation is important.
Finally, migrants tend to send consistent amounts to their families even when both their incomes and their likelihood of having a bank account increases. This relative inelasticity of remittances and the fact that migrants spend more time in the host country than anticipated at the outset, during which time they do increasingly become banked, increases the importance of banks reaching out to migrants earlier to capture their loyalty and hasten their integration into the formal financial system.
Given the demand for remittance transfers, financial institutions need to further explore tools to accelerate immigrant access into their institutions. Immigrants have a relatively constant demand for services, such as remittance transfers, and sooner or later will join these institutions. Therefore, attracting immigrants earlier in time will improve banks and credit unions opportunities in retaining them as clients over an extended period of time.
12
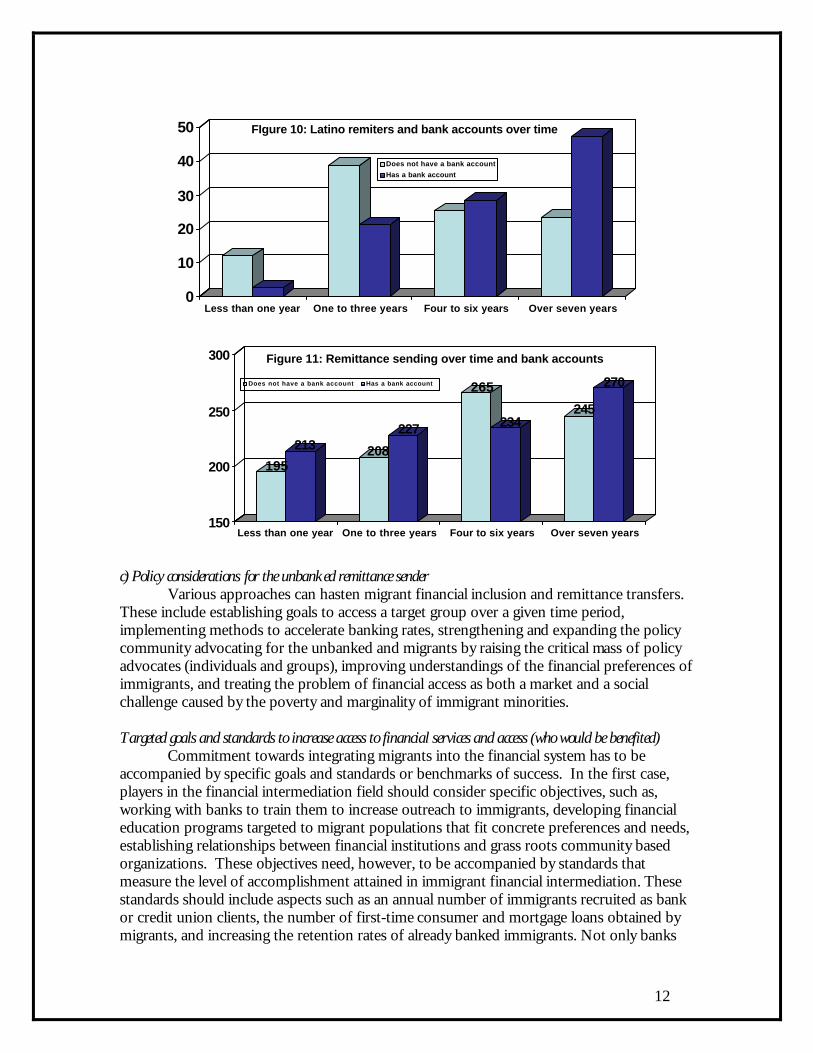
c) Policy considerations for the unbanked remittance sender
Various approaches can hasten migrant financial inclusion and remittance transfers. These include establishing goals to access a target group over a given time period, implementing methods to accelerate banking rates, strengthening and expanding the policy community advocating for the unbanked and migrants by raising the critical mass of policy advocates (individuals and groups), improving understandings of the financial preferences of immigrants, and treating the problem of financial access as both a market and a social challenge caused by the poverty and marginality of immigrant minorities. Targeted goals and standards to increase access to financial services and access (who would be benefited)
Commitment towards integrating migrants into the financial system has to be accompanied by specific goals and standards or benchmarks of success. In the first case, players in the financial intermediation field should consider specific objectives, such as, working with banks to train them to increase outreach to immigrants, developing financial education programs targeted to migrant populations that fit concrete preferences and needs, establishing relationships between financial institutions and grass roots community based organizations. These objectives need, however, to be accompanied by standards that measure the level of accomplishment attained in immigrant financial intermediation. These standards should include aspects such as an annual number of immigrants recruited as bank or credit union clients, the number of first-time consumer and mortgage loans obtained by migrants, and increasing the retention rates of already banked immigrants. Not only banks
0
10
20
30
40
50
Less than one year One to three years Four to six years Over seven years
FIgure 10: Latino remiters and bank accounts over time
Does not have a bank account
Has a bank account
195
213 208
227
265
234245
270
150
200
250
300
Less than one year One to three years Four to six years Over seven years
Figure 11: Remittance sending over time and bank accounts
Does not have a bank account Has a bank account

13
(and credit unions) need to make and measure such changes. Legislators, policy makers, and advocacy groups need to explore related legal and policy means to improve migrants’ financial condition, such as expanding identification requirements or rewarding bank outreach, assessed in part through the measures just noted. Identifying the standards is a significant task that will require understanding of specific immigrant needs. Develop methodologies to accelerate banking rates
In addition to goals and standards, methodologies to enhance immigrant financial intermediation are the critical link towards success. To that effect, financial institutions need to work with government and non-profit organizations in order to design and market financial products. Product design is important because immigrants do not necessarily share want or need typically existing financial products. A critical tool to design such products is market research about immigrant financial and economic preferences. Non-profit organizations that work with immigrants are an important asset for banks and credit unions that can help inform these institutions about conducting research and helping identify products. Banking institutions also need to strengthen and expand partnerships abroad with banking and microfinance institutions in order to ensure an effective distribution network. Taking advantage of the Mexico-USA automated clearinghouse is a critical tool to ensure success in adopting an inexpensive bank to bank money transfer.
In addition to product design is marketing. Providing a good sale of financial products is very important. Immigrants respond to marketing tools, though not necessarily to those similar to the mainstream population. Working with civil society organizations, religious groups, and consulates, among other institutions, will help improve the marketing clout of banks and other players. Increase a critical mass of the policy network
The current debate about banking the unbanked is still limited to a small number of institutions. It is even smaller group when discussing banking unbanked immigrants. At most the Federal Reserve Bank, some regional offices of the Federal Deposit Insurance Corporation, and other institutions have developed or encouraged supportive strategies, but there are many more officials, private sector groups, and, most importantly, immigrant organizations that are yet to get involved in this debate. Discussing these issues is of critical importance in establishing agendas, proposed goals, and mutually beneficial exchange of knowledge and information among various players.
This debate is also an opportunity to give immigrant groups a space to voice their needs on financial issues and to learn the range of other activities, as well as a space to NGOs close to migrant groups and communities. A first step towards increasing a critical mass of players is to begin a discussion and inquiry about what immigrants understand about financial issues and what do their financial preferences look like. A second stop is a consideration of the range of solutions available to address the limitations in banking the unbanked immigrants. This includes aspects of transnational financial services, opportunities of IT, marketplace competition and access to information about products and services. Underserved vs. marginality
Finally, it is very important to make a distinction between underserved markets and marginality of migrants. Immigrants often operate in the context of underserved markets, such as that of access into financial institutions. However, there is a social context that can
14
be neglected and is that of the marginalization of immigrants. There exist structural constraints that have prevented migrants from inserting into the economy and polity. Societal perceptions, laws, and language barriers have contributed to the marginality of immigrants. In fact, the majority of migrants live in or near poverty, which is inextricably linked to perceptions of migrants as undesirable, invisible, and/or disposable.
Keeping a practical and critical (but not romantic) perspective on migrants as marginalized minorities will help better address the problem of underserved markets in financial sectors, for example. The interplay among these four policy considerations will help contribute to achieve greater success in banking immigrants into financial institutions and thus achieving financial democracy. 3. Moving forward: technology, MFIs?
Finally, within the context of reducing transaction costs and banking the unbanked, there are increasing discussions about and attempts to implement card based monetary instruments (Jacob 2005). Businesses and some analysts argue that card based transfers represent an important step forward towards financial assimilation. Little is known, however, about their scope and impact or about prevailing benchmarks that can assess their effectiveness. In order to make a case for the utility of card based instruments, is important to identify some possible opportunities and challenges that these cards may face. a) Opportunities for card based companies
The choice of adopting in the near future card-based systems for remittance transfers may become more likely. Four factors may explain this possible shift: increased competition, shifting preferences on the demand side, changing dynamics in the receiving countries, flexible technologies and costs. These factors may be converging in the direction of developing transfer mechanisms that offer flexible, multi-service, and value added components to both ends slowly transforming a cash to cash business into one of account to account transfers. Competition
The remittance industry has gradually become more competitive. Although transfer costs have slowly continued to drop, they are reaching a plateau point where there is need to find alternative cost effective transfer methods (see Figure 5 above). Transfer costs have declined from an average of 15 percent to 7 percent for Latin America between 2000 and 2005, with a range between 4 percent and 12 percent. Mexico, Ecuador, and El Salvador are among the most competitive markets, followed by Colombia, Guatemala, and Peru. The Caribbean is still among the most expensive places to send money, partly due to market concentration, volume, and informal systems.
The competitive stream among remittance companies operating in Latin America and the Caribbean is increasing, in part because of investment and consolidation, and in part because new businesses are seeking to use innovative instruments. Some investors interested in acquiring well established companies with revenues above US$100,000,000 have considered the use of cards as part of their new business plans. Meanwhile as the banking industry explores strategies to compete in this market, they revisit old approaches, identifying potential partners and methods.

15
Table 8: Structure of firms in the remittance industry Firm size Annual Transactions Amount Annual Revenue
Large trans. 150,000,000 $ 45,000,000,000 $ 3,150,000,000 Over 10 Million transactions 10,000,000 $ 3,000,000,000 $ 210,000,000 Six to ten transactions 7,500,000 $ 2,250,000,000 $ 157,500,000 Three to six transactions 4,500,000 $ 1,350,000,000 $ 94,500,000 One to three transactions 3,000,000 $ 900,000,000 $ 63,000,000 One to half a million transactions 1,500,000 $ 450,000,000 $ 31,500,000 Under half a million transactions 500,000 $ 150,000,000 $ 10,500,000 Up to 250000 transactions 250,000 $ 75,000,000 $ 5,250,000
Notably, remittances volumes continue to increase throughout Latin America and the Caribbean, and possibly the rest of the world. In 2004 it was estimated that US$45 billion went to Latin America from the United States, Europe, Japan, and other parts of the world, representing an increase from 38 billion in 2003 (Figure 12).
Demand side
Increasingly average customers are changing their sending preferences, often significantly. Immigrant remittance senders are more likely to seek mechanisms that offer more than one product (prepaid phone cards and remittance transfer combined, or direct
Figure 12: Annual Remittance Transfers to Latin America
$0.00
$0.50
$1.00
$1.50
$2.00
$2.50
$3.00
$3.50
$4.00
1980 1981 1982 1983 1984 1985 1986 1987 1988 1989 1990 1991 1992 1993 1994 1995 1996 1997 1998 1999 2000 2001 2002 2003 2004
U.S. Billions
$0.00
$2.00
$4.00
$6.00
$8.00
$10.00
$12.00
$14.00
$16.00
$18.00Mexico, US Billions
Colombia
Dominican Rep.
El Salvador
Guatemala
Jamaica
Mexico (right axis)

16
pay deposit and remittances, or debit card and remittance transfer capability, for example). They are also increasingly looking to formalize their financial interests in their countries of origin, through investment or savings, thus exploring the use of more flexible monetary instruments than cash. The number of people with debit and credit cards is increasing or demonstrating an interest in having some form of a debit card, particularly among those in younger cohorts. Moreover, Latino household internet penetration in the U.S. increased from 30 percent in 2000 to 68 percent in 2005. Table 9: Remittance senders with debit, credit or both cards in the U.S. Debit Credit Both Colombia 38.8% 5.2% 4.4% Cuba 37.7% 9.7% 9.7% Ecuador 43.0% 16.0% 1.0% El Salvador 22.2% 4.1% 18.5% Guatemala 5.5% 4.6% 15.6% Guyana 39.0% 21.6% 4.2% Honduras 6.7% 10.7% 5.3% Mexico 9.3% 6.2% 6.0% Nicaragua 22.0% 11.3% 13.3% Dom. Rep. 22.0% 21.3% .7% Bolivia 31.4% 45.7%
Average 24.2% 9.3% 9.9% Source: Orozco, Manuel. Transnationalism and Development, 2005. Home country factors
Recipients are increasingly turning their remittances into financial instruments while an emerging group of payers gradually makes inroads for the next five years. In the first case, it is noticeable that remittance recipients are more likely to have bank accounts than those who don’t receive remittances. These individuals are further expressing a demand for financial relationships and services such as mortgages and other economic activities. Table 10: Remittance recipients with Debit, Credit or both cards in the selected Latin America and Caribbean countries
No card yet Debit, credit or both
Guatemala 86.1% 13.90% El Salvador 77.0% 23.00% Nicaragua 83.4% 16.60% Dominican Republic 67.9% 32.10% Cuba 93.3% 6.70% Ecuador 76.8% 23.20% Guyana 61.3% 38.70% Colombia 51.1% 49.00%
Eight countries 70.8% 29.20% Source: Orozco, Manuel, Transnationalism and Development, Washington, DC, 2005.
Second, second tier financial institutions, such as cooperatives and microfinance institutions, are increasingly adapting their technology and institutional capability to serve the remittance recipient market. This includes establishing contracts with various remittance companies and designing financial products to recipients and senders. Card based

17
instruments are a preferred mechanism for many of these institutions, which already provide access to ATMs and points of sales in their areas of operation. Technology
Current technologies offer four advantages to the remittance industry: functionality, value added innovative abilities, cost effectiveness, and business and development impact. The functionality of the technology is such that, whether for back or front end components, card based systems are easily enabled by the current transfer mechanisms most companies have. Although 95 percent of the leading companies remitting to Latin America and the Caribbean use agent-based cash-to-cash transfers, the increasing flexibility offered by technology provides the choice of adopting attractive transfer mechanisms for account to account transfers.
These technologies include data payment transmission systems through typical automatic clearing house (ACH) software platforms, prepaid, debit, or fully functionally multipurpose credit and debit cards, cell phones, and online transfers. These technologies provide firms with alternatives to shift and transform their business into fully electronic based transfer systems with both back and front end capabilities. Table 11: Functionality of Technology in remittance transfers Data payment transmission applications
Back end Front end
ACH Software platforms Card issuing (for closed or open networks)
Online platforms Card issuing (for closed or open networks), online costumer transfer
Payment system cards (prepaid, debit, store value)
Card issuing (for closed or open networks)
Wifi for closed and open networks NA Other (SMS, etc.)
International payment processing, settlement and data management
Data transmission through cellular phone
Costs
Finally, transaction costs for card based transfers are relatively more competitive than current MTO wire transfers. The transaction cost for card based transfers in the market, once the costs to buy the card have been factored in for the first transaction, are a little over 10 percent lower than typical wire transfers (see Figure 15). The combined potential and opportunities that these cards offer is significant. Moreover, because many of these cards are part of open ended networks with global connection to more than 300,000 ATMs and millions of points of sales, their attractiveness is underscored (Bezzard 2005). Challenges Although card based transfers are strategically positioned, it would be neglectful to disregard substantive challenges these banking technologies face. First, the challenges banking institutions face of getting migrants into their institutions are similar to those using cards: marketing and selling adequate financial products requires substantive analysis of and perhaps even immersion into migrant communities which will allow them to build trust, while providing tailored packages commensurable to their financial demands. Second, the
18
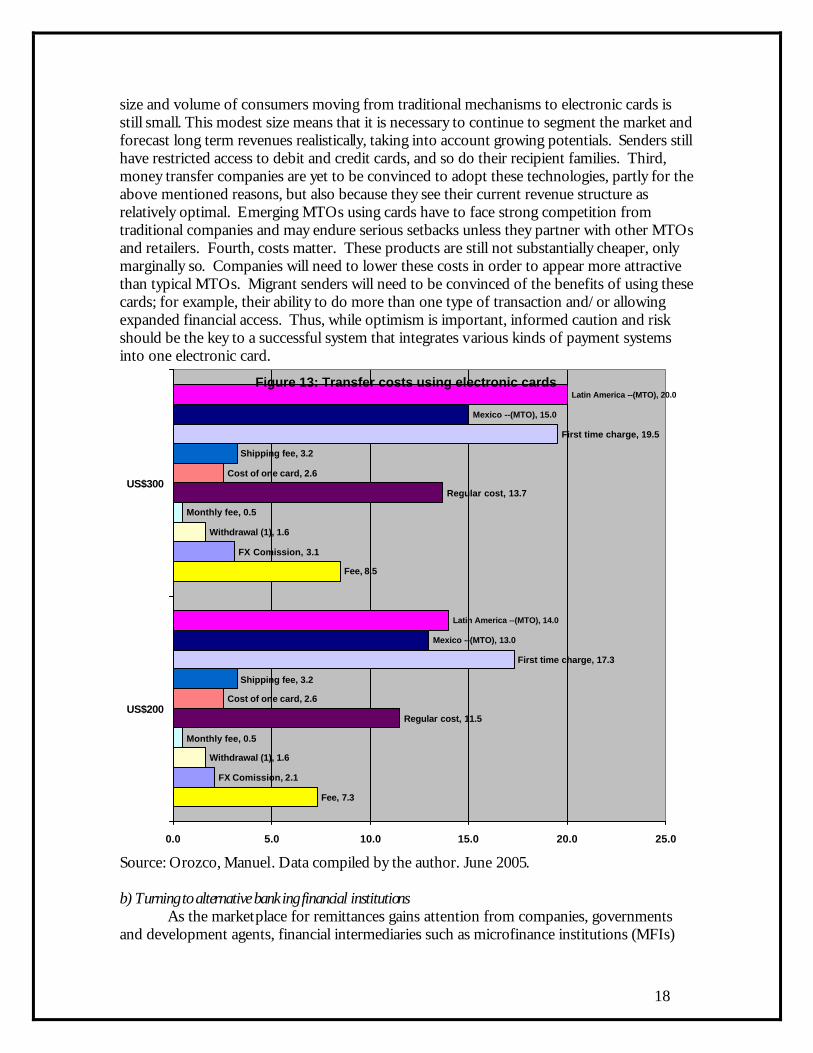
size and volume of consumers moving from traditional mechanisms to electronic cards is still small. This modest size means that it is necessary to continue to segment the market and forecast long term revenues realistically, taking into account growing potentials. Senders still have restricted access to debit and credit cards, and so do their recipient families. Third, money transfer companies are yet to be convinced to adopt these technologies, partly for the above mentioned reasons, but also because they see their current revenue structure as relatively optimal. Emerging MTOs using cards have to face strong competition from traditional companies and may endure serious setbacks unless they partner with other MTOs and retailers. Fourth, costs matter. These products are still not substantially cheaper, only marginally so. Companies will need to lower these costs in order to appear more attractive than typical MTOs. Migrant senders will need to be convinced of the benefits of using these cards; for example, their ability to do more than one type of transaction and/or allowing expanded financial access. Thus, while optimism is important, informed caution and risk should be the key to a successful system that integrates various kinds of payment systems into one electronic card.
Figure 13: Transfer costs using electronic cards
Fee, 7.3
Fee, 8.5
FX Comission, 2.1
FX Comission, 3.1
Withdrawal (1), 1.6
Withdrawal (1), 1.6
Monthly fee, 0.5
Monthly fee, 0.5
Regular cost, 11.5
Regular cost, 13.7
Cost of one card, 2.6
Cost of one card, 2.6
Shipping fee, 3.2
Shipping fee, 3.2
First time charge, 17.3
First time charge, 19.5
Mexico --(MTO), 13.0
Mexico --(MTO), 15.0
Latin America --(MTO), 14.0
Latin America --(MTO), 20.0
0.0 5.0 10.0 15.0 20.0 25.0
US$200
US$300
Source: Orozco, Manuel. Data compiled by the author. June 2005. b) Turning to alternative banking financial institutions
As the marketplace for remittances gains attention from companies, governments and development agents, financial intermediaries such as microfinance institutions (MFIs)

19
are increasingly becoming subjects of attention due to their position as financial agents with locations in areas where remittances arrive.1 These MFIs are identifying themselves as players in developing countries, which in turn can offer other financial products, including electronic cards. As interest grows, the presence of MFIs in money transfers is also growing around the world. In Latin America there may be some 100 MFIs with a network of 40 paying locales each and capacity to branch out in other partnerships with other retailers. These institutions are seeking MTO partnerships that are low cost and are willing to work on financial service delivery. The end result is the penetration of a new player in the marketplace of remittance payment while offering alternative banking services. As Table 12 shows, MFIs are offering remittance transfers and simultaneously seeking to bank individuals through the opening of savings accounts, as well as other products, including mortgage loans. Table 12: Transformation rate of remittance transfer clients into bank clients Institution New
accounts Monthly transfers
Conversion rate
Salcaja 500 1000 50% Red de la Gente 3500 35000 10% Banco Solidario 4000 5000 80% Fedecaces 4375 22000 20% Guayacan 533 5426 10% Coosadeco 529 4780 11% Acacu 3000 2703 110% Acocomet 800 2383 34% El Comercio 80 800 10% Source: Orozco, Manuel and Eve Hamilton. 4. Toward a consolidated market? The landscape of remittance transfers suggests that volumes of billions in transfers are characterized by complex micro dynamics entailing varying frequencies in sending, length of time, and amounts sent. Moreover, these individuals share in common other characteristics such as the beneficiaries are families and their amounts sent vary relatively little. Amid these differences and similarities there also exist a complex industry of money transfer operators (MTOs) composed of an array of players that include licensed and unlicensed companies, large and small operators and emerging new businesses, such as banks or store value businesses. This market is relatively competitive, expensive to consumers, and faced with different internal and external obstacles. The entrance of more than 100 U.S. banks in this business and more than 20 card based companies, signals an addition to the complexity of this competitive market. Therefore, is important to proceed with caution and measured risk in order to achieve success in the long term. The intersection between financial intermediation and remittances exists conceptually and empirically, but in order to increase its success rate and impact on business and development some strategies need to be put in place. Setting benchmarks, goals, and alliances with a wider set of partners are a first step in that direction. 1 See for example the latest issue of the newsletter MIGRANTRemittances, August 2005, V.2, N.2.
20
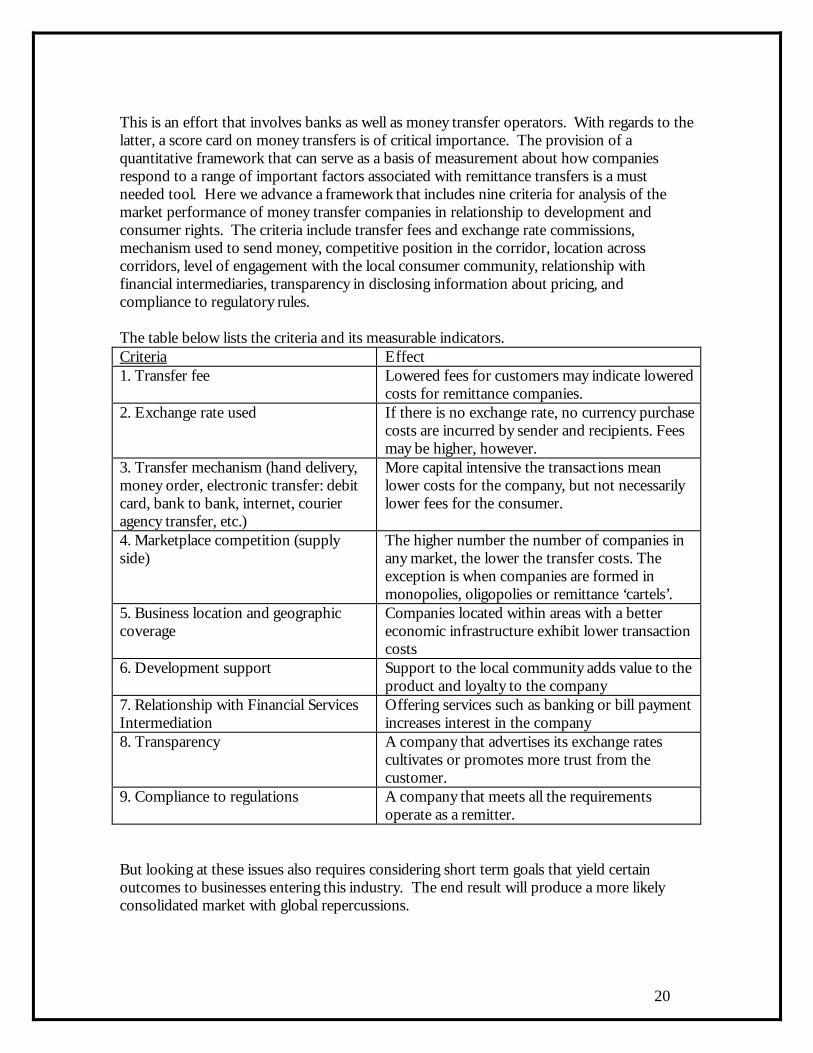
This is an effort that involves banks as well as money transfer operators. With regards to the latter, a score card on money transfers is of critical importance. The provision of a quantitative framework that can serve as a basis of measurement about how companies respond to a range of important factors associated with remittance transfers is a must needed tool. Here we advance a framework that includes nine criteria for analysis of the market performance of money transfer companies in relationship to development and consumer rights. The criteria include transfer fees and exchange rate commissions, mechanism used to send money, competitive position in the corridor, location across corridors, level of engagement with the local consumer community, relationship with financial intermediaries, transparency in disclosing information about pricing, and compliance to regulatory rules. The table below lists the criteria and its measurable indicators. Criteria Effect 1. Transfer fee Lowered fees for customers may indicate lowered
costs for remittance companies. 2. Exchange rate used If there is no exchange rate, no currency purchase
costs are incurred by sender and recipients. Fees may be higher, however.
3. Transfer mechanism (hand delivery, money order, electronic transfer: debit card, bank to bank, internet, courier agency transfer, etc.)
More capital intensive the transactions mean lower costs for the company, but not necessarily lower fees for the consumer.
4. Marketplace competition (supply side)
The higher number the number of companies in any market, the lower the transfer costs. The exception is when companies are formed in monopolies, oligopolies or remittance ‘cartels’.
5. Business location and geographic coverage
Companies located within areas with a better economic infrastructure exhibit lower transaction costs
6. Development support Support to the local community adds value to the product and loyalty to the company
7. Relationship with Financial Services Intermediation
Offering services such as banking or bill payment increases interest in the company
8. Transparency A company that advertises its exchange rates cultivates or promotes more trust from the customer.
9. Compliance to regulations A company that meets all the requirements operate as a remitter.
But looking at these issues also requires considering short term goals that yield certain outcomes to businesses entering this industry. The end result will produce a more likely consolidated market with global repercussions.
21
References Bezzard, Gwenn, Consumer Money Transfers: Powering global remittances, AITE January 2005. Schatt, Dan, Global Money Transfers: Getting the Formula Right When High-Tech Meets High-Touch CELENT, 2005 Evans, David S. and Richard Schmalensee. Paying with Plastic : The Digital Revolution in Buying and Borrowing. 2004. Giuliano, Paola and Marta Ruiz-Arranz, Remittances, Financial Development and Growth Washington, DC, IMF, July 2005 Jacob, Katy, Sabrina Su, Sherrie L.W. Rhine and Jennifer Tescher, Stored Value Cards: Challenges and Opportunities for Reaching Emerging Markets. A Working Paper for the Federal Reserve Board 2005 Research Conference. Orozco, Manuel. Remitting Back Home and Supporting the Homeland: The Guyanese Community in the U.S. Working paper commissioned by USAID (GEO Project). November, 2003. Orozco, Manuel. The Remittances Marketplace: Prices, Policy, and Financial Institutions. Washington, D.C: Pew Hispanic Center, July 2004. Orozco, Manuel International financial flows and worker remittances: best practices. Report prepared for the United Nations Population Division, New York. 2005d. Orozco, Manuel. Transnational Engagement, Remittances and their Relationship to Development in Latin America and the Caribbean. Washington, DC: Institute for the Study of International Migration, Georgetown University, July, 2005a Orozco, Manuel, with Rachel Fedewa. Regional Integration? Trends and Patterns of Remittance flows within South East Asia, TA 6212-REG Southeast Asia Workers Remittance Study, ADB, Manila, August 2005b. Orozco, Manuel and Eve Hamilton, Remittances and MFI intermediation: issues and lessons. (July 2005). Draft paper in preparation to 2005 Financial Sector Development Conference, New Partnerships for Innovation in Microfinance, June 23rd, 2005, Frankfurt. Orozco, Manuel, African Transnationalism: the Ghanaian diaspora in perspective ISIM: Washington, DC: 2005c, forthcoming report. Rosenau, James (2003). Distant Proximities: Dynamics beyond globalization. (Princeton: Princeton University Press. Squires, Gregory, Why the Poor Pay More: How to Stop Predatory Lending Praeger Publishers, 2004. Thorsten Beck, Asli Demirguc-Kunt and Ross Levine, Bank Concentration and Crises, No 9921, NBER Working Papers, 2004.
22
Data methodology About pricing datasets The methodology used to collect pricing information consists of calling or visiting MTOs in order to build pricing datasets. The datasets thus result from information about fees, foreign exchange charged as commission, interbank exchange rate, and other charges that could apply. Other data collected include mechanisms employed to make the transfer and geographic coverage of the company in the U.S., and the cost of sending the money in local or US currency. Information is collected for costs of sending US$200, US$250 and $300. The transfer cost of a remittance is generally derived from the sum of the fee and the commission on the exchange rate. The commission is estimated from the spread between the interbank exchange rate reported by the Central Bank of each recipient country and the exchange rate reported by the MTO. Comission = 1 – (fx / interbank fx). U.S. pricing data is collected for typical MTOs and include around 60 companies sending from the U.S. to fourteen Latin American and Caribbean countries. Data has also been collected for other countries in South East Asia using a similar methodology. Pricing information for electronic card based transfers included data from 20 companies. Not all were MTOs; some were typical store value card companies offering remittance transfers. Research assistance in data compilation in June 2005 was made thanks to Rachel Fedewa and Patricia Jinich.