Embed Size (px)
Citation preview

30�
Remittances in the Latin American and Caribbean Region: A Review of Its Economic Impact
Manuel Orozco Inter-American Dialogue
1. Introduction
News about remittances, the wave of money reported the world over, has particularly resonated in Latin America and the Caribbean. Worker remittances sent from the United States, Europe and �apan, among other parts of the world, totaled an estimated USD $45 billion in 2004 and are estimated to grow to $51 billion or more in 2005. The volume has important manifestations across the Western Hemisphere in terms of its share to national income or in per capita terms. This trend has significantly been influenced by a marketplace and industry that has energized these transfers. This paper provides an overview of remittances in eighteen Latin American and Caribbean countries that relates their economic characteristics to income, trade, per capita transfers, and transaction costs in the market of intermediation. The paper also addresses remittances as part of a broader process of integration in the global economy through what we term “the five Ts”: tourism, transportation, telecommunications, transfers, and trade.
2. Migration Trends in Latin America and the Caribbean
The significance of remittances in Latin America and the Caribbean has been discussed in relationship to its volume and impact in Mexico, El Salvador, or the Dominican Republic. However, as migration trends are growing within the context of transnationalism and globalization, new corridors and countries are reported to also be receiving remittances from migrants.
Although the number of Latin American and Caribbean migrants living outside their homelands is uncertain, the figure may be more than thirty million. The U.S. Census, for example, sustains that Latin America and Caribbean immigrants alone were estimated to range over sixteen million by 2000. However, the Mumford Institute estimated that this figure had a 35 percent undercount. Moreover, by 2005 this number may have increased
13
30�
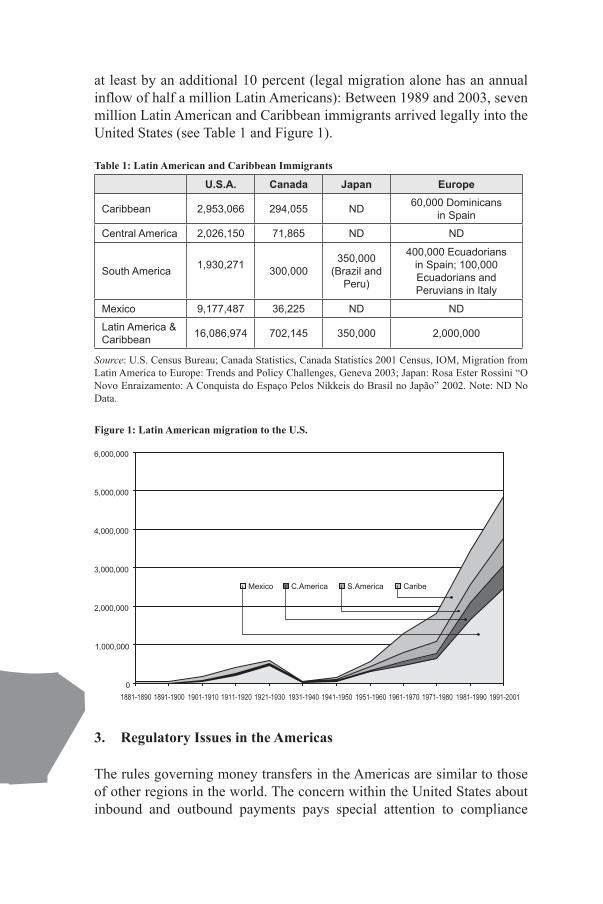
at least by an additional 10 percent (legal migration alone has an annual inflow of half a million Latin Americans): Between 1989 and 2003, seven million Latin American and Caribbean immigrants arrived legally into the United States (see Table 1 and Figure 1).
Table 1: Latin American and Caribbean Immigrants
U.S.A. Canada Japan Europe
Caribbean 2,953,066 294,055 ND 60,000DominicansinSpain
CentralAmerica 2,026,150 71,865 ND ND
SouthAmerica 1,930,271 300,000350,000
(BrazilandPeru)
400,000EcuadoriansinSpain;100,000EcuadoriansandPeruviansinItaly
Mexico 9,177,487 36,225 ND ND
LatinAmerica&Caribbean 16,086,974 702,145 350,000 2,000,000
Source: U.S. Census Bureau; Canada Statistics, Canada Statistics 2001 Census, IOM, Migration from Latin America to Europe: Trends and Policy Challenges, Geneva 2003; �apan: Rosa Ester Rossini “O Novo Enraizamento: A Conquista do Espaço Pelos Nikkeis do Brasil no �apão” 2002. Note: ND No Data.
Figure 1: Latin American migration to the U.S.
3. Regulatory Issues in the Americas
The rules governing money transfers in the Americas are similar to those of other regions in the world. The concern within the United States about inbound and outbound payments pays special attention to compliance

307
to anti-money laundering and suspicious activities. But it also addresses consumer issues concerning rights of money senders. In Latin America, the approach is broader and pays attention to compliance to rules that do not conflict with U.S. regulations.
Unlicensed businesses represent a variety of players, such as individual entrepreneurs, travel agents who have a license for airfare sales but not for financial transfers, or retail outlet stores whose agents offer “alternative” transfers to licensed businesses, though they may also have a license to provide transfers. Informal businesses typically operate in countries where flows are not particularly attractive to companies because of their small volume, where foreign currency transfers are highly regulated by the state, where technology is still inaccessible to individuals and businesses, or where customers have greater trust and preference for person-to-person delivery. However, these businesses or entrepreneurs are aware of the presence of a regulatory environment. In many instances, some informal entrepreneurs have matured and evolved into formally licensed business operations. Some of the Dominican Republic and Salvadoran companies operating today are examples of this change. Conversely, informal businesses make up over 50 percent of the total volume transferred to Haiti, Cuba, and Nicaragua.
Most transfers to Latin America today, however, take place through fully licensed businesses. Regulatory procedures monitoring the U.S.–Latin America corridor primarily occur in the United States. In order for a business to legally offer money transfers, the company has to comply with federal and state (and sometimes municipal) regulations regarding money laundering, suspicious activities, and day-to-day operations. The compliance process often involves bonding and regular audits, as well as making information available about transfers and the agents with whom the company operates.
Money transfer companies are regulated in more than forty states and municipalities as non-bank financial institutions labeled as money service businesses, with the requirement to have a license and a bond to operate. Federally, the regulatory environment of “Money Service Businesses” is managed by the Treasury Department through the Office of the Comptroller of the Currency, the Financial Crimes Enforcement Network (FinCEN), and the Office of Foreign Assets Control (OFAC), agencies that comply with the Bank Secrecy Act and the USA Patriot Act. Reporting to FinCEN focuses on preventing money-laundering practices, while reporting to OFAC involves monitoring transfers from entities or countries listed by this Office. In addition to the reports and audits, the companies need to meet several procedural legal requirements, which include a written compliance

308
handbook, a compliance officer, and implementation of an anti-money-laundering training program for staff. These regulations put businesses’ compliance on the same footing as banks and other financial institutions in the United States.
Remittances and the Informal Sector in Cuba:
Cuban remittances occur predominantly in an informal context. The majority of Cubans choose to send remittances through informal mechanisms, particularly through mulas.
Mulas are entrepreneurs – men and women, Cuban Americans and foreign nationals (Mexicans and Colombians among others) – who can and do travel with ease and frequency to the island. They carry both money and packages of goods to the sender’s relatives in Cuba for relatively inexpensive fees. They are known through word of mouth, through the references of relatives, acquaintances, and friends who recommend them as “reliable” people to send packages of any kind.
Mulas go to Cuba predominantly as tourists, as they are informal entrepreneurs without a license to operate as a business. However, they have a well-established network of contacts from Miami residents and businesses, to customs officials in Cuba, and to the distributors of goods.
There is no single type of mula and their numbers may run into the thousands. Some mulas are salaried and employed by a particular entrepreneur who hires them to travel back and forth to Cuba. There are also mulas who are sole proprietors of their informal remittance businesses and who work with family networks in the United States and Cuba. Depending on the business size, some of these sole proprietorships have an informal financial infrastructure in Cuba, which they utilize to have their distribution operations active at any time. Carrying a significant pool of thousands of dollars, and using a fax machine, these individuals transmit messages to their Cuban counterparts with the coordinates of where to deliver money and to whom. In other cases, the individuals who have less capital available travel with greater frequency and arrange the money to be delivered by their relatives. In general, regular mulas tend to travel to Cuba twice a month.

30�
Finally, mulas may be sporadic travelers or entrepreneurial travelers. The sporadic traveler is a person who is approached by an entrepreneur to arrange delivery of money. Instead of earning a salary for the operation, their trip is paid for in exchange for carrying money and in-kind remittances. There are many individuals, particularly low-income Cubans and the elderly, who find this to be a practical and useful means to enable them to visit their relatives in Cuba. These sporadic or occasional mulas may only conduct such operations once a year.
It is also important to stress that many of the formal money transfer businesses make use of the mulas as their distribution network in Cuba. The main reason for this is that, given the regulatory constraints as well as the capital investment requirements to establish agencies in Cuba, it is more convenient for the licensed business to rely on the mula to deliver the money. In this sense, there is a semi-formal money-transfer process in place.
Central to the existence of mulas is trust. People who send remittances to Cuba rely on mulas because of their reputation, low cost, and relative efficiency in delivering the money within a reasonable amount of time (no more than three days following arrival to the country, unless outside Havana). The popular consensus of the work performed by a mula is shared widely in the community, further reinforcing their reputation. Mulas as well as sporadic travelers are intertwined in social networks of various kinds, from neighborhood links to work connections to national bonds.
Source: Orozco 2002a.
In order to ensure efficient reporting, companies have developed database records containing customer information, including recipient’s data. Moreover, companies monitor transactions that exceed a typical amount sent by an immigrant, usually over $1,000. The requirement that immigrants provide full identification and contact information for both the sender and the recipient, which puts the burden on the sender, is key to regulating transfers. Despite company compliance, there are still challenges in preventing money laundering. Because not all remittance companies are fully interconnected, an individual could visit different agencies to send

310
money separately and above the $10,000 limit. In response to this situation, a clearinghouse company, Enforcement Compliance Officer, based in New �ersey, was created to share information from nearly thirty businesses about daily transactions and to spot suspicious activities. This clearinghouse operates independently from each company’s compliance system.
The regulatory environment in Latin America is minimal. In some countries, money transfer institutions and their distributor counterpart are required to hold a license. They are also required to report transfers above $10,000. However, because most transactions are below $300, little reporting occurs. Moreover, in some countries companies do not report any kind of information about their business, nor are they required to do so. This situation not only adds to uncertainty about the amounts received and recorded by the Central Bank, but also raises risks of potential illicit activities. A positive aspect in money transfers in Latin America and the Caribbean is that outbound transfers are allowed and thus facilitate intraregional flows through licensed businesses.
The regulatory system, particularly in the United States, has increased monitoring but also has increased costs for companies that provide training for and implement oversight programs. Businesses are concerned not only about increased operating costs but are also worried that the stringent identification requirements for both senders and recipients will lead to greater utilization of informal services by individuals who would rather use an unlicensed business than provide extensive information.
4. Sending Patterns in Latin America and the Caribbean
From the perspective of volume, remittances have experienced an outstanding increase. The volume of these flows rose from less than $3 billion in 1980 to $45 billion in 2004 (see Figure 2). The increase is owed to a number of factors that include reactions to economic downturns in Latin America and the Caribbean, strengthened ties between the United States and Latin America, improved competition in money transfers, increased contact among members in transnational families, and improved accounting of the money received. For example, in 1980 only seventeen countries reported flows on remittances; by 2004 the number was thirty. Even these figures reported by Central Banks are considered to be conservative estimates.
Remittance flows have had an economic impact in several of these economies. The most important corridor from which remittances flow is the United States, channeling over seventy percent of the money moving to this region. However, in the past few years an increasing volume of money

311
has left from countries in Western Europe, such as Spain, as well as from �apan. In general terms, the sheer volume has become an important source of foreign savings that helps address foreign currency reserves.
Figure 2: Annual Remittance flows to Latin America and the Caribbean
In the broader Latin American and Caribbean context, remittances are increasingly taking on an important share of the national income. Although remittances represent only 2 percent of gross domestic product, their impact varies across countries and regions, and is greater in smaller economies.
Remittances are significant for at least five reasons. First, they represent an obligation and commitment to family needs. Second, remittances result in the distribution of finances to households and sectors of the country that tend to be economically disadvantaged. Third, remittances have a macroeconomic impact and tend not to decrease with economic downturns. Consequently, they may offset or stabilize the ups and downs of financial cycles. Fourth, these large financial transfers have the potential and capacity to generate wealth in the home and the community where they are sent. Fifth, remittances have multiplying effects, in part through furthering the “five Ts” of global economic integration mentioned above.

312
Figure 3: Remittances to Latin America and the Caribbean as % of GDP
Variation in remittances’ significance, associated with GDP (gross domestic product), per capita GDP, and the cost of sending the money. For example, Haiti, Honduras, Nicaragua, El Salvador, �amaica, and the Dominican Republic are countries whose remittances received represent more than 10 percent of the total GDP. However, not all of these countries have the highest per capita receipt of remittances. Of the thirteen countries that receive more than $100 per capita, those with the highest rate are �amaica, Barbados, El Salvador, Belize, the Dominican Republic, and Grenada. These differences are also noted in the averages sent as well as in the relationship between the annual amount sent and per capita income in these countries. These differences can be observed in the table below. Although the average amount sent is in the $270 per month range, when that figure is compared to per capita GDP again results vary. Recipients in Haiti, Honduras, and Bolivia, for example, receive amounts that are nearly three times per capita GDP. The cost of sending money also varies across countries and may be associated to volume; the lower the volume entering a country, the more expensive the transfers will be.
Differences in these trends are a function of specific country conditions as well as the history of migration. For example, although Central America, the Caribbean, and Mexico have a historical relationship of migration to the United States, each migratory pattern and its subsequent remittance flows respond to the different realities of these countries. Thus, Salvadorans and Dominicans may receive similar volumes of remittances, but their migrant populations differ in size and timing due to varying dynamics: In the case of El Salvador, the civil war and its post-conflict process; and in the case of the Dominican Republic, a longer historical tradition beginning with the exile of communities escaping the Trujillo dictatorship.

313
Table 2: Remittances and Key Economic Indicators
Remittancetransfers…
Country as%ofGDP
Percapita
Costas%oftransfer
Remittances/GDPper
capitaAveragetransfer Annualvolume
Mexico 2.3% 162 6.88% 0.73 351.00 16,613,000,000Brazil 0.6% 34 8.13% 1.85 541.00 5,928,000,000Colombia 3.9% 87 7.45% 1.31 220.00 3,857,000,000Guatemala 8.7% 218 7.22% 2.60 363.00 2,681,000,000ElSalvador 14.3% 390 6.18% 1.91 339.00 2,548,000,000
DominicanRepublic 14.1% 279 10.39% 0.87 176.00
2,438,000,000Ecuador 5.7% 134 4.94% 2.57 293.00 1,740,000,000Jamaica 17.2% 566 8.11% 0.79 209.00 1,497,000,000Peru 1.4% 50 6.48% 0.95 169.00 1,360,000,000Honduras 12.4% 163 7.67% 2.91 225.00 1,134,000,000Haiti 27.8% 122 7.72% 3.17 123.00 1,026,000,000Nicaragua 10.8% 146 6.93% 2.07 133.00 800,000,000Paraguay 3.7% 89 9.11% 2.24 263.00 500,000,000Bolivia 1.6% 48 7.19% 2.77 235.00 422,000,000CostaRica 1.8% 80 9.46% 0.82 301.00 320,000,000Argentina 0.2% 7 9.02% 0.36 212.00 270,000,000Panama 0.7% 77 10.50% 0.56 196.00 231,000,000Guyana 8.6% 186 10.14% 2.27 179.00 143,000,000Barbados 4.3% 418 11.66% 0.29 220.00 113,000,000
TrinidadandTobago 0.8% 30 10.41% 0.45 200.00 100,000,000
Uruguay 0.3% 71 11.28% 0.22 198.00 93,000,000Belize 1.7% 281 8.78% 0.73 220.00 77,000,000Suriname 2.1% 114 10.17% 1.17 220.00 50,000,000Grenada 5.2% 220 ND 0.6838 220.00 23,000,000
Venezuela,RB 0.0% 1 17.10% 0.41 138.00 21,000,000
Chile 0.0% 1 8.90% 0.64 279.00 13,000,000
AntiguaandBarbuda 1.5% 140 ND 0.29 220.00 11,000,000
Dominica 1.5% 56 ND 0.77 220.00 4,000,000
St.KittsandNevis 1.2% 86 ND 0.36 220.00 4,000,000
St.Lucia 0.6% 25 ND 0.63 220.00 4,000,000
St.VincentandtheGrenadines
0.8% 27 ND 0.81 220.00 3,000,000
Source: Central Banks of each country, World Bank Development Indicators, data collected by the author.

314
A look at these flows in the Latin American and Caribbean region shows three distinct groups of countries in which remittances have strong, medium, or low impacts. One group is represented by those countries whose flows have an effect in most, if not all, of the indicators mentioned above. This means that remittances have an important presence in the country’s national and per capita incomes and provide recipient households at least twice the average per capita income. In the second group, a positive effect is felt in half of these indicators, and in the third group, the impact of remittances.
Table 3: Impact of Remittances on Latin American and Caribbean Economies
ImpactofRemittances
Strong(3) Medium(2) Low(1)
Guatemala,Ecuador,Nicaragua,ElSalvador,Haiti,Honduras,Bolivia,Guyana,Jamaica,Mexico
••••••••••
Paraguay,Colombia,Peru,DominicanRepublic,Brazil,Suriname,CostaRica,Belize,Grenada,Barbados
••••••••••
Dominica,Panama,AntiguaandBarbuda,St.VincentandtheGrenadines,Chile,TrinidadandTobago,Argentina,St.KittsandNevis,Uruguay,St.Lucia,Venezuela,RB
••••
•••••••
Ratio of remittances: 1: < 0.66; 2:0.67–1.5; 3: > 1.51; Remittances as % of GDP: 1: < 1%; 2: 1 to 4%; 3: > 4%; Remittances per capita: 1 < 36; 2: 37–100; > 100; Remittances cost: 1: > 7.5; 2: 7.6–9.5; 3: < 9.5.
4.1 Benefits to Households
One reason people emigrate is to address family economic and financial needs. The result is the development of transnational obligations to pay for the upkeep of the home, debts, and other obligations. On average, immigrants commit themselves to send over $3,000 on an annual basis, an amount that tends to represent 10 percent or more of the immigrant’s income.1 On average, immigrants in the United States send $280 in remittances at least twelve times a year, but these amounts vary depending on the country of origin. Among Latin Americans, Mexicans, Brazilians, and Costa Ricans send the most, while Peruvians, Haitians, and Nicaraguans send the least. Mexican immigrants on aggregate send about 22 percent (nearly $400 a month) of their income.
Figure 4: Average Monthly Amount Sent by Immigrants
1 According to the 2000 U.S. Census, over 40 percent of Latinos earn less than $20,000 a year and over 70 percent earn less than $35,000 a year (U.S. Census Bureau 2000).

31�
Source: National Money Transmitters Association 2005.
In both urban and rural areas, recipient households spend the vast majority of remittances on basic needs; that is, everyday expenditures and consumption. Most households use the money to cover living expenses. The resources go to immediate family members. Specifically, siblings and parents are most likely to receive the money. They are not the only beneficiaries but are rather the main administrators of foreign income.
Table 4: Administration of Remittances
Typeofexpense Guatemala Honduras ElSalvador Mexico Ecuador
LivingExpenses(mortgage,rent,food,utilities)
68% 77% 84% 70% 60%
Savings 11% 4% 4% 7% 8%BusinessInvestment 10% 4% 4% 1% 8%Education 7% 10% 4% 6% 2%OtherItems 3% 3% 2% 3% 18%PropertyPurchase 1% 2% 1% 1% 4%Unknown/LeftBlank 0% 0% 2% 11% 1%Total 100% 100% 100% 100% 100%
31�
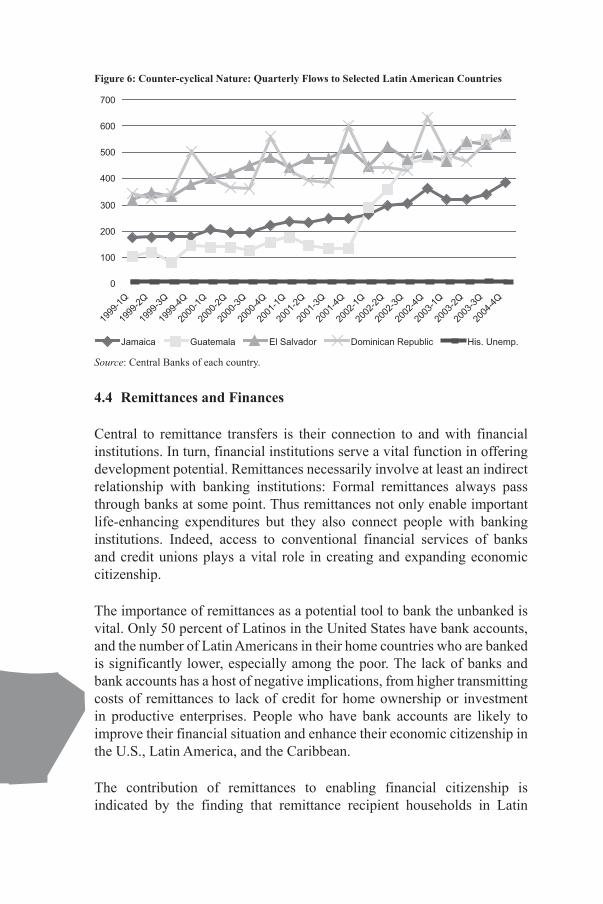
Table 5: Remittance Beneficiary
Guatemala Honduras ElSalvador Mexico Ecuador
Children 12% 16% 15% 11% 14%
Sibling 42% 32% 31% 35% 28%
Spouse 9% 9% 6% 9% 13%
Parent 19% 27% 27% 19% 29%
Other 19% 16% 22% 17% 15%
Unknown/LeftBlank 0% 0% 0% 10% 1%
Total 100% 100% 100% 100% 100%
Source: Multilateral Investment Fund Inter-American Development Bank, Receptores de Remesas en Mexico, Octubre 2003; Receptores de remesas en Guatemala, El Salvador y Honduras, September 2003; Receptores de Remesas en Ecuador, May 2003, MIF-IADB/FOMIN-BID, Washington, D.C.
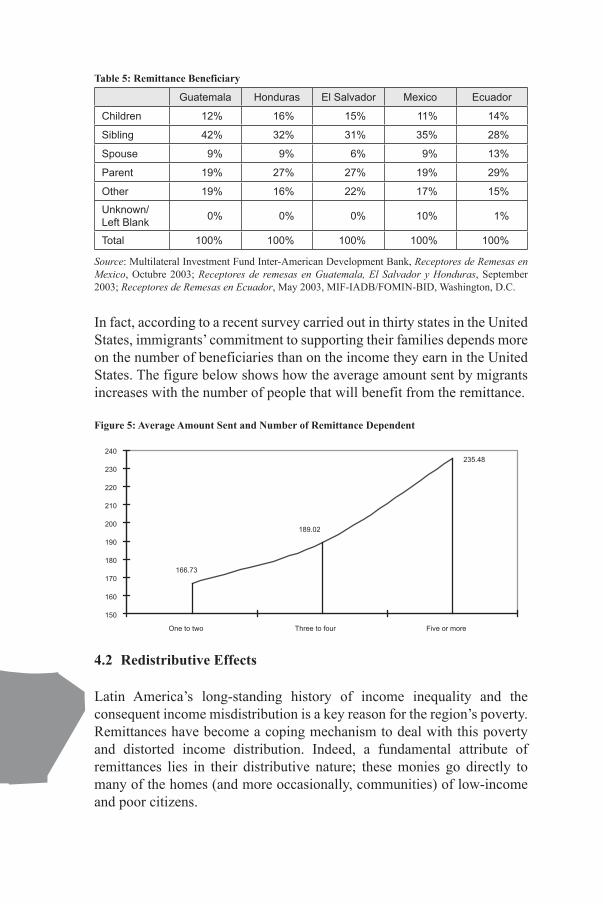
In fact, according to a recent survey carried out in thirty states in the United States, immigrants’ commitment to supporting their families depends more on the number of beneficiaries than on the income they earn in the United States. The figure below shows how the average amount sent by migrants increases with the number of people that will benefit from the remittance.
Figure 5: Average Amount Sent and Number of Remittance Dependent
4.2 Redistributive Effects
Latin America’s long-standing history of income inequality and the consequent income misdistribution is a key reason for the region’s poverty. Remittances have become a coping mechanism to deal with this poverty and distorted income distribution. Indeed, a fundamental attribute of remittances lies in their distributive nature; these monies go directly to many of the homes (and more occasionally, communities) of low-income and poor citizens.

317
One way this redistributive effect can be seen is by comparing the incomes of households receiving remittances to average national incomes. Homes that receive remittances generally receive the equivalent of the gross domestic product per capita in Latin America. Given that less than 20 percent of Latin Americans receive the equivalent of per capita GDP, immigrants are dramatically improving the condition of their relatives, who may represent over 10 percent of the population.
Table 6: Per Capita GDP, Income Distribution, and Per Capita Remittances
CountryAnnualper
capitaGDP($)
GDPpercapitaofpoorest
20%($)
GDPpercapitaofpoorest40%
($)
Remittancespercapitaa($)
Panama 4020 181 390 440ElSalvador 2113 112 218 361DominicanRepublic 2514 85 206 257
Paraguay 1167 61 125 177Guatemala 1755 81 163 176Nicaragua 714 30 64 147Mexico 5922 420 640 132Ecuador 1489 77 153 129Honduras 929 43 86 127CostaRica 4074 204 428 78Colombia 1820 64 153 70Bolivia 902 44 81 39Brazil 2834 94 204 30Venezuela 4079 175 408 10Argentina 4220 219 388 6
Source: World Bank, World Development Indicators, Washington, D.C., 2003, various years in late
1990s.
Another indication of the redistributive nature of remittances is seen in its geographic scope. At least 30 percent of the money arrives in rural Latin America, where the population is overwhelming poor. In the Mexican case, ten predominantly rural Mexican states account for the majority of emigration. The Encuesta sobre Migración en la Frontera Norte de México (EMIF), published in 1994, showed that over 75 percent of all migrants leaving Mexico originated from ten states (El Colegio 2003). Similarly, the top ten remittance-receiving states – Guanajuato, �alisco, Michoacán, San Luis Potosí, Guerrero, Zacatecas, el Distrito Federal, el Estado de México, Chihauhua, and Durango – receive over two-thirds of all remittances sent to Mexico, as shown in Table 7 (Torres 2001).

318
Table 7: Top Ten Migrant-sending States and Top Ten Remittance-receiving States in Mexico
State PercentageofTotalMigrantsa PercentageofRemittancesb
Guanajuato 17.9 13.7
Michoacan 10.9 11.2
DistritoFederal 7.5 4.5
SanLuisPotosi 7.4 5.8
Jalisco 6.9 11.4
Coahuila 6.3 ..
Durango 5.7 3.4
Chihuahua 5.2 3.6
Zacatecas 4.5 4.5
Guerrero 3.5 4.9
EstadodeMexico .. 3.8
Total 75.8 66.8
Sources: El Colegio de la Frontera Norte, “Problemas y Perspectivas de las Remesas de los Mexicanos y Centroamericanos en Estados Unidos,” Unpublished Manuscript, El Colegio de la Frontera Norte: Departamento de Estudios Económicos, Mexico, 2002, 30; Torres, Federico, “Las Remesas y el Desarrollo Rural en las Zonas de Alta Intensidad Migratoria en México,” Naciones Unidas: Comisión Económica para América Latina y El Caribe (CEPAL), Mexico, 2001, 3, 27-28. a 1993–1994; b 2000.
In El Salvador, the departments that lose the highest percentages of their populations to migration – San Vicente, Cabañas, Chalatenango, Morazán, La Unión, and Sonsonante – share characteristics with their Mexican counterparts. Notably, they are predominantly rural, are the most ecologically deteriorated, have the lowest standards of living, and lack significant infrastructure. Significantly, the geographic distribution of the remittance receiving households in Mexico and El Salvador is similar. Thus, rural households in each country make up a significant percentage of all remittance recipients.
Table 8: Percentage of Remittance-receiving Households in Rural and Urban Areas, 1996
Mexico ElSalvador
Urban 54.3% 60.5%
Rural 45.7% 39.5%
Sources: El Colegio de la Frontera Norte, “Problemas y Perspectivas de las Remesas de los Mexicanos y Centroamericanos en Estados Unidos,” Unpublished Manuscript, El Colegio de la Frontera Norte, Departamento de Estudios Económicos, Mexico, 2002, 36; García, �uan �osé “Las Tendencias de la Migración en El Salvador,” FUSADES-PNUD, 1998, 10.
Migration and remittance patterns in Nicaragua are also worth noting. Nicaraguan migrants from Managua predominantly move to the United States, and those from rural parts of the country mostly move to Costa Rica. In a nationwide study conducted in �une 2001, 42 percent of those living in
31�
Managua reported having a relative abroad, compared to 35 percent in the Pacific region and 29 percent from north-central Nicaragua. The majority of those reporting outside Managua had relatives working in Costa Rica, whereas those living in Managua had relatives primarily migrating to the United States (Orozco 2003a).
4.3 Macroeconomic and Counter-cyclical Effects
From the macroeconomic point of view, remittances have acquired as much importance as exports, traditionally considered the most important rubric of GDP. In some years, remittances to El Salvador have exceeded total exports, and in the Dominican Republic and Nicaragua remittance volumes have been more than half the value of exports. El Salvador has come to depend heavily on remittances and has executed national policies to attract them. Even in large economies like Mexico’s, remittances are of singular importance; they are equivalent to 6 percent of total exports and over 72 percent of foreign direct investment (Orozco 2002b).
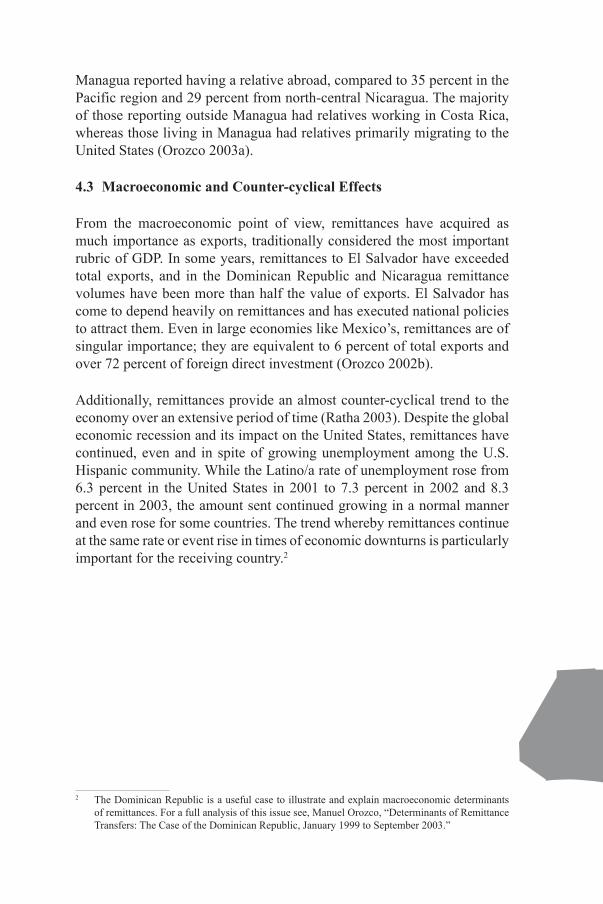
Additionally, remittances provide an almost counter-cyclical trend to the economy over an extensive period of time (Ratha 2003). Despite the global economic recession and its impact on the United States, remittances have continued, even and in spite of growing unemployment among the U.S. Hispanic community. While the Latino/a rate of unemployment rose from 6.3 percent in the United States in 2001 to 7.3 percent in 2002 and 8.3 percent in 2003, the amount sent continued growing in a normal manner and even rose for some countries. The trend whereby remittances continue at the same rate or event rise in times of economic downturns is particularly important for the receiving country.2
2 The Dominican Republic is a useful case to illustrate and explain macroeconomic determinants of remittances. For a full analysis of this issue see, Manuel Orozco, “Determinants of Remittance Transfers: The Case of the Dominican Republic, �anuary 1999 to September 2003.”
320
Figure 6: Counter-cyclical Nature: Quarterly Flows to Selected Latin American Countries
Source: Central Banks of each country.
4.4 Remittances and Finances
Central to remittance transfers is their connection to and with financial institutions. In turn, financial institutions serve a vital function in offering development potential. Remittances necessarily involve at least an indirect relationship with banking institutions: Formal remittances always pass through banks at some point. Thus remittances not only enable important life-enhancing expenditures but they also connect people with banking institutions. Indeed, access to conventional financial services of banks and credit unions plays a vital role in creating and expanding economic citizenship.
The importance of remittances as a potential tool to bank the unbanked is vital. Only 50 percent of Latinos in the United States have bank accounts, and the number of Latin Americans in their home countries who are banked is significantly lower, especially among the poor. The lack of banks and bank accounts has a host of negative implications, from higher transmitting costs of remittances to lack of credit for home ownership or investment in productive enterprises. People who have bank accounts are likely to improve their financial situation and enhance their economic citizenship in the U.S., Latin America, and the Caribbean.
The contribution of remittances to enabling financial citizenship is indicated by the finding that remittance recipient households in Latin

321
America have a higher rate of having bank accounts than non-remittance-recipient households. One explanation for this trend may be that when households accumulate savings, they seek more efficient ways to mobilize these and resort to financial institutions. Another possible explanation is the influence of families in the United States who are now more familiar with financial institutions. Other studies have also shown that remittance-recipient households save more than those who do not receive remittances (Andrade-Eeckoff 2003). This observation underscores the importance of appropriate policies to promote banking so that savings rates would likely increase and opportunities for lending could be made available in local communities.
4.5 Multiplying Effect of Remittances
Remittances also have a multiplying effect on the economy. In practice, this means that the increased flow of money into the economy from remittances contributes more than its actual or original value when remittances are spent (usually), saved, or invested (less often), more money is available throughout the economy, leading to an overall expansion in economic health. In other words, the multiplier effect creates a positive and disproportionate enhancement in spending and financial flows.
In order to measure the particular effects of remittance flows on employment and economic productivity, economists explore the portion of expenditures of remittances spent on household consumption. In German Zarate’s study of remittances and the Mexican economy, he concludes that remittances seem to flow to mostly small rural municipalities that are linked to more dynamic economies through the goods and labor markets, where the main beneficiaries are urban and rural businesses. Therefore in the macroeconomic perspective, rural areas that receive remittance flows tend to have ripple effects on the urban economic centers as consumption increases and demand is boosted for goods and services produced in urban areas.3 An earlier study by Massey and Durrand arrived at similar conclusions, stressing that the multiplier effect could be as high as $4. That is, every “migradollar” that enters a local economy generates $4 in demand of goods and services (Durrand and Massey 1996).
3 German Zarate “The Multiplier Effect of Remittances” 2004.

322
5. Remittances as Part of a Process: Globalization and the five Ts4
Remittances constitute a significant component of how countries are inserted into the global economy through their migrant communities. Remittances are not only about the behavior of individual migrants but are also part of the process whereby nations are further integrated into the global economy. In addition to sending remittances, migrants also sustain contact with their families and homelands through other related activities, the five Ts, which also have significant economic and developmental implications: transportation, tourism, telecommunications, trade, and transfers. Migrants’ tourism back home and their purchase of consumer products made in their communities or countries of origin may have the most direct economic impacts and multiplier effects, but telecommunications, transportation, and the process of remittance transfers can make indirect contributions. In this current wave of migration, immigrants are agents globalizing their home countries. Their activities have opened business and investment opportunities that have expanded trade and investment.
6. Air transportation
Migrants’ use of air transport is of great economic importance. Grupo Taca, an airline which operates in Central America, has fifteen daily flights from the United States to El Salvador, and more than 70 percent of its passengers are Central Americans. There are at least two direct flights a day from Chicago to Zacatecas, from New York to Puebla, and from Los Angeles to various interior Mexican cities. Air traffic has increased extensively among those countries; there are many airlines operating in the region and competing among themselves. From �FK airport alone, annual flights transport some 140,000 people from Santo Domingo and another 95,000 Dominicans arrive via Miami.
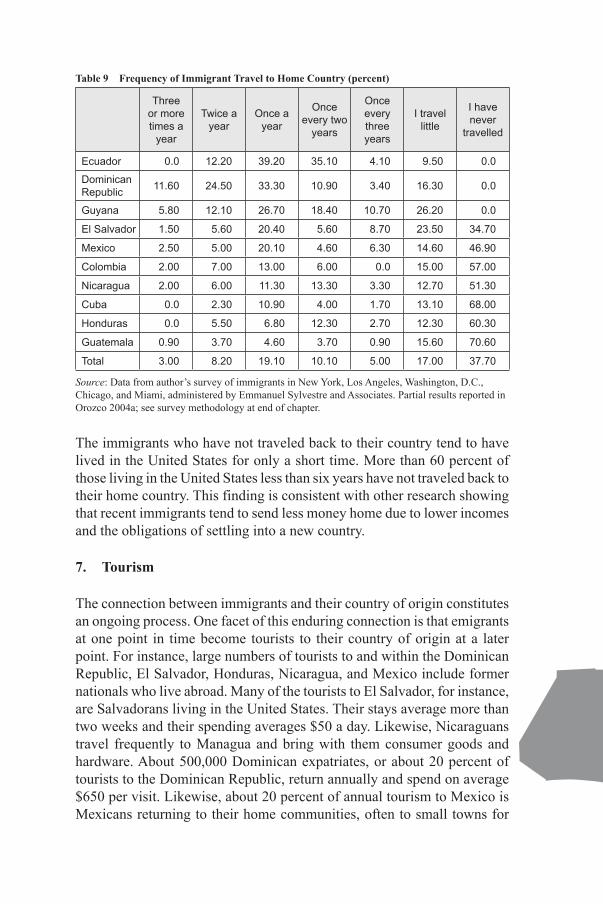
A survey conducted by the author shows that 30 percent of remittance-sending immigrants indicate travel to their home country at least once a year. Immigrant groups vary in terms of travel, with Ecuadorans, Dominicans, and Guyanese traveling more often than other immigrants (Table 10). Ecuadorans are among the most frequent travelers to their country, with 12 percent traveling twice a year and 40 percent once a year. More than one in ten Dominicans travels three times a year, two in ten travel twice, and one in three travels once a year.
4 Parts of this section appeared in the report “Transnationalism and Development” prepared by the author.
323
Table 9 Frequency of Immigrant Travel to Home Country (percent)
Threeormoretimesa
year
Twiceayear
Onceayear
Onceeverytwo
years
Onceeverythreeyears
Itravellittle
Ihavenever
travelled
Ecuador 0.0 12.20 39.20 35.10 4.10 9.50 0.0
DominicanRepublic 11.60 24.50 33.30 10.90 3.40 16.30 0.0
Guyana 5.80 12.10 26.70 18.40 10.70 26.20 0.0
ElSalvador 1.50 5.60 20.40 5.60 8.70 23.50 34.70
Mexico 2.50 5.00 20.10 4.60 6.30 14.60 46.90
Colombia 2.00 7.00 13.00 6.00 0.0 15.00 57.00
Nicaragua 2.00 6.00 11.30 13.30 3.30 12.70 51.30
Cuba 0.0 2.30 10.90 4.00 1.70 13.10 68.00
Honduras 0.0 5.50 6.80 12.30 2.70 12.30 60.30
Guatemala 0.90 3.70 4.60 3.70 0.90 15.60 70.60
Total 3.00 8.20 19.10 10.10 5.00 17.00 37.70
Source: Data from author’s survey of immigrants in New York, Los Angeles, Washington, D.C., Chicago, and Miami, administered by Emmanuel Sylvestre and Associates. Partial results reported in Orozco 2004a; see survey methodology at end of chapter.
The immigrants who have not traveled back to their country tend to have lived in the United States for only a short time. More than 60 percent of those living in the United States less than six years have not traveled back to their home country. This finding is consistent with other research showing that recent immigrants tend to send less money home due to lower incomes and the obligations of settling into a new country.
7. Tourism
The connection between immigrants and their country of origin constitutes an ongoing process. One facet of this enduring connection is that emigrants at one point in time become tourists to their country of origin at a later point. For instance, large numbers of tourists to and within the Dominican Republic, El Salvador, Honduras, Nicaragua, and Mexico include former nationals who live abroad. Many of the tourists to El Salvador, for instance, are Salvadorans living in the United States. Their stays average more than two weeks and their spending averages $50 a day. Likewise, Nicaraguans travel frequently to Managua and bring with them consumer goods and hardware. About 500,000 Dominican expatriates, or about 20 percent of tourists to the Dominican Republic, return annually and spend on average $650 per visit. Likewise, about 20 percent of annual tourism to Mexico is Mexicans returning to their home communities, often to small towns for

324
patron saint festivals, Christmas, and other commemorations. In all, these visits involve spending or leaving billions of dollars in the countries of origin (Orozco 2002c).
Table 10 Tourism in Dominican Republic, Jamaica, and Mexico, and National Origin of Tourists
Nationals Percentage YearDominicanRepublic 523,588 15 2003Jamaica 57428 6 2004Mexico 2,203,100 0.22495 1997
Source: Banco Central, Republica Dominicana, http://www.bancentral.gov.do/; Bank of �amaica, Statistical Digest, October 2004; �amaican government officials stress that the percentage reported is at least half of the actual trend: �aimaicans living overseas do not fill out the forms as nonresident �amaicans, so statistical records underestimate their actual volume. Banco de Mexico, www.mexico-travel.com.
Visiting the home country entails more than staying with relatives. Immigrants who return home to visit are also tourists who spend considerable amounts on entertainment with their families. The visits take place on various occasions, from Christmas and New Year to Easter and other religious holidays. Other immigrants go on special trips to their hometown for weddings, birthdays, deaths, or other emergencies.
Immigrants typically spend at least $1,000 per stay. Ecuadorians again are the most notable group, in that they not only travel more often but also spend the most. Other Latinos tend to spend similar amounts, around $1,000 to $2,000.
Table 11 How Much Do You Spend Per Trip? (percent)
Lessthan$1,000perstay
Lessthan$2,000perstay
Over$3,000perstay
Colombia 82.9 17.1 0.0
Cuba 50.0 26.9 23.10
Ecuador 9.6 39.7 50.70
ElSalvador 43.6 48.2 8.20
Guatemala 51.6 35.5 12.90
Guyana 45.8 41.1 13.10
Honduras 56.7 33.3 10.00
Mexico 33.9 38.4 27.70
Nicaragua 72.7 21.2 4.50
DominicanRepublic 35.8 50.7 13.40
Total 43.9 38.9 17.00
Source: Same as Table 10.

32�
Guyana offers an interesting example. More than 40 percent of Guyanese who send remittances visit the home country at least once a year. This number represents a potentially lucrative and relatively untapped market. Guyanese immigrants visiting their home country spend on average $1,000 a stay. This adds up to at least $25 million left in the country. Thus, the contributions to the economy of home visits add significantly to that of their remittances, which are estimated at over $100 million (Orozco 2004b).
8. Telecommunications
Telephone calls are another fundamental aspect of the connectivity that affects the countries’ economies. Immigrants make around 120 minutes per month in calls to relatives abroad. These amounts translate into millions of dollars that benefit the companies and the telecommunication infrastructure. Between 50 to 80 percent of earnings generated through telephones come from home-to-home calls made by immigrants (Orozco 2004b).
Home-to-home phone calls may be responsible for most of the revenue generated in international long-distance telecommunications. Central Americans living in the United States maintain significant contact with their home countries – and telephone calls are a major form of transnational family contact. Over 60 percent of Central Americans call at least once a week and spend at least 30 minutes a week on the phone with relatives abroad, totaling 120 minutes a month (Tables 13 and 14).
Table 12. Frequency of International Long-distance Telephone Calls Made to Home-country Relatives (percent)
Twoormoretimes
aweek
Onceaweek
Onceeverytwo
weeks
Onceamonth
Iseldomcall
Colombia 39.0 38.0 16.0 6.0 1.0Cuba 11.9 35.7 32.1 16.7 3.6Ecuador 55.0 43.0 2.0 [zero?] [zero?]ElSalvador 23.8 34.3 27.6 11.4 2.9Guatemala 21.1 34.9 26.6 12.8 4.6Guyana 16.6 25.3 30.4 20.7 6.9Honduras 23.0 33.8 25.7 10.8 6.8Mexico 28.3 44.4 14.3 9.0 3.9Nicaragua 29.1 40.5 20.3 8.1 2.0DominicanRepublic 60.7 16.7 11.3 8.0 3.3Total 29.1 34.7 21.3 11.2 3.7
Source: Same as Table 10.

32�
Table 13. Average Length of International Long-distance Telephone Calls Made to Home-country Relatives (percent)
Lessthan5minutes
6–10minutes
11–20minutes
20–30minutes
Morethan30minutes
Colombia 2.0 10.0 15.0 32.0 40.0Cuba 4.6 21.1 39.4 21.1 9.7Ecuador 0.0 4.0 45.0 37.0 13.0ElSalvador 0.5 4.3 11.4 22.4 59.0Guatemala 0.0 1.8 9.2 18.3 64.2Guyana 3.4 15.3 39.0 22.0 7.6Honduras 4.0 14.7 20.0 25.3 29.3Mexico 2.5 3.2 7.8 29.4 55.7Nicaragua 0.7 9.3 24.7 36.0 26.0DominicanRepublic 0.7 6.7 13.3 35.3 44.0Total 2.0 8.9 22.0 27.3 35.7
Source: Same as Table 10.
Immigrant contacts account for a substantial share of telephone companies’ revenues on service between the United States and Latin America. Half of the call minutes from the United States to Central America and the Dominican Republic, for example, are household to household.
Table 14. Phone Calls between the United States and Selected Central American Countries
Country Totalminutes(2002) U.S.revenue Paymentto
country
Household-to-household
minutes(2003)
Nicaragua 62,243,684 $28,440,239 $15,878,883 120,280,413ElSalvador 659,528,740 $185,825,580 $68,190,716 492,510,153Guatemala 909,056,312 $300,132,848 $77,585,373 305,441,973Honduras 338,475,478 $108,026,709 $77,177,514 169,417,799DominicanRep. 1,005,737,128 $149,761,218 $41,348,782 660,806,085
Note: Computation based on an average of four calls a month at 5, 8, 15, 25, and 30 minutes per call . Formula wa� ∑of phone call� = annual minute� x percent calling x immigrant percent remitting (from 2000 U.S. Census).
Source: Same as Table 10; U.S. Census Bureau; 2000, 200�, 2002 International Telecommunications Data, Federal Communications Commission, December 2001 and �anuary 2003.
9. Nostalgic Trade
Many migrants engage in nostalgic trade. Around 70 percent of immigrants consume traditional products from their country of origin: tortillas, coffee, rum, tamales, and sweets, among others. The volume of nostalgic products exported to the United States from various countries of Latin America has come to represent some 10 percent of total exports.

327
In addition to exports of these goods, remittance-recipient households also demand and receive U.S. goods. The values and information transmitted by immigrants to relatives translates into imports.
Purchasing nostalgic goods is a way of maintaining cultural traditions from the home country, which generates revenue. In the comparative survey carried out by the author, Latinos were asked whether they buy products from home. The large majority answered positively. Only Cubans offered a low response rate, due to the fact that they travel less, have much less contact with Cuban institutions, and the U.S. embargo hampers the acquisition of home-country goods. However, more than 70 percent of other Latinos reported that they bought goods from their country of origin.
The magnitude of these dynamics has macroeconomic effects. According to the Ministry of Economy of El Salvador (Batres-Marquez 2001), these products are estimated to represent at least 10 percent or $450 million of total exports from El Salvador to the United States. Salvadoran foods such as tortilla flour, red beans, loroco, semita, cheese, and horchata are important exports (Batres-Marquez et al. 2001). The Batres-Marquez study and other experiences encouraged the government to seek to bring these items into the trading agenda during negotiations on the proposed Central American Free Trade Agreement (CAFTA). In fact, El Salvador was the only government with an agenda that explicitly included its ethnic market. Exports to the United States of El Salvadoran beer ballooned from $1 million to $3.5 million between 1999 and October 2001 (USTR 2002). Many home-country producers have established businesses in the United States to cater to the migrant community.
U.S. imports of Guyanese goods in the past five years reflect the positive and consistent relationship that exists between the two countries. Guyanese-Americans show a great demand for goods such as rum, fish, and tea; profits from such products represent an important share of total exports. Imports of spices, for example, which more than 60 percent of immigrants reported buying from Guyana, have grown substantially in the past five years, from less than $1,000 to $35,000 (Orozco 2004b).
Healthy demand for nostalgic goods has induced migrants to invest in home-country manufactures of foodstuffs such as cheese, fruits, and vegetables. Migrants residing in the United States have set up businesses back in their home countries to establish stores of various kinds. An example is Roos Foods, Inc., a food manufacturer that produces and sells processed milk products in Central America and to Central Americans and Mexicans living in the United States. Roos operates in the United States but has franchises

328
in Nicaragua and El Salvador. This trend of migrant investment in home countries is likely to continue.
10. Transfers: Market Conditions in the United States
The value of remittances has not yet been fully realized because of a series of problems in both the United States and Latin America. Some of the problems are distinct to the U.S., some are distinct to the Latin American region, and others overlap between the U.S. and Latin America. These problems include the high cost of remittances, underutilization of savings and credit institutions, limited competition, lack of accounting, and inadequate leveraging of remittances in local communities. These are impediments of a transnational nature; that is, they affect both sender and recipient in countries of origin and of destination. Importantly, however, these problems can and should be addressed through a series of policy changes.
Costs: While the greatest cost of migration is almost certainly emotional and familial, the financial cost of sending monies is also extremely important. As explained above, immigrants frequently send significant amounts of money, generally once a month, and typically in amounts ranging from $150 to $400. These amounts are a considerable percentage of income for migrants who are mostly low-wage workers.
To get this money to their families, most immigrants use some form of intermediation, whether formal or informal. These intermediaries include money transfer agencies, small businesses, banks, or even individual entrepreneurs. Using intermediaries, a necessity for most senders, has costs associated with it. Costs of sending typically range between 4 and 10 percent of the value sent. This cost is expensive, especially considering that more economic and value-added options exist, such as the use of savings and credit institutions or debit cards, as noted later in the discussion of policy alternatives.
The cost of sending remittances generally reflects two components: a fee to send the money plus a commission on the exchange rate of the quantity converted into local currency. The former is mostly U.S. policy, and the latter by policy considerations in Latin America and the Caribbean. The figures below show total average transfer costs to send remittances to twenty-three Latin American and Caribbean countries from the United States. The numbers refer to information based on data gathered from the fifty largest companies operating in the different countries in the Western

32�
Hemisphere. Figure 7 refers to the cost of sending $200 (about 40 percent of immigrants send $200), and Figure 8 shows the cost of sending the average remittance sent for particular countries.
Figure 7: Cost to send $200 from the U.S. to Home Country
Source: Data compiled by the author. See methodology at end of document.

330
Figure 8: Cost to Send from the U.S. Average Amount to Home Country
Source: Data compiled by the author. See methodology at end of document
Figure 9: Commission in the Exchange Rate as Percent of Total Costs (June 2004)
Source: Data compiled by the author. See methodology at end of document
Historically, the U.S. remittance-sending market was built on whatever was available to immigrants, including money transfer companies, especially Western Union, or informal methods of remitting. People paid higher sending costs because there either were no viable alternatives or they had no means (e.g., transport and bank accounts) of accessing those

331
alternatives. Five years ago, it was more difficult and more costly than it is now to send money to relatives; some companies charged up to 20 percent of the principal sent, and in many cases they did it through a very unfavorable exchange rate of the dollar against national currency.
It is worth emphasizing that the costs of sending money have been falling slowly over the last five years. Competition, legal demands, consumer protests, a Congressional investigation in the United States into abuses against immigrants, criticism from the Inter-American Development Bank, and the work of some research centers have worked together to result in a reduction in the costs of sending money.
Competitors are increasing in number and are seeking market share by lowering prices. One way to measure competition in remittance transfers is by looking at variations in prices among companies. Where companies compete through pricing, the variance between the highest and lowest number usually is closer to the mean value. The chart below shows the standard deviation of prices (as a percentage of the $200, on average, sent) among various companies remitting to four Latin American and Caribbean countries. As the chart shows, the standard deviation has decreased and most companies offer similar fees for sending to the same country. The Dominican Republic is an exception and reflects the foreign-currency crisis in the country rather than increased manipulation by companies.
Figure 10: Standard Deviation of Foreign Exchange Commission among Companies
Source: Data compiled by the author. For the methodology see the Appendix at the end of the chapter.
Savings and credit: Although there may be an inherent relationship between remittances and finance institutions, the participation of financial institutions, traditional or non-traditional, is still limited. It is important
332
to recognize that at least 50 percent of immigrants in the United States lack access to banking due to problems of language, education, the lack of offers to bank the unbanked, and discrimination, some migrants think they don’t need banks because they expect to return to their home country. The effect is that individuals are kept outside the financial environment without access to savings, credit, and opportunities for investment, large or small. The poor as much as the rich want to save and have access to credit, but poor people and ethnic minorities suffer from lack of access to financial services. Thus, banking the unbanked is a fundamental element of personal development (Orozco 2004c).
11. Sending Remittances: Market Conditions in Latin America and the Caribbean
Costs and limited competition: Conditions in both the United States and in Latin America and the Caribbean influence the price of sending money. An important reason for high transfer costs from the United States is the lack of competition in the international money-transfer market. Latin America and the Caribbean can be classified into three different market sectors in relationship to their competitive position, namely, mature, consolidating, and underdeveloped. The classification depends on different factors such as a company’s level of market concentration, efficiency in transfers, its regulatory position, the diversity of players, and company costs.
Transfer markets in most Latin American countries are still in a consolidating or underdeveloped stage, except perhaps for Mexico. In Mexico, remittance market competition has lowered costs significantly; there is capital for investment, no regulatory problems exist, and old and new players coexist in the market. (There is a significant balance between supply and demand.)
In a consolidating market, three trends are observed: expansion, consolidation, and innovation. Traditional players face shifting dynamics as the sending market becomes increasingly concentrated and consolidated. Concentration occurs mostly from the consolidation resulting from firm expansion or purchase of existing businesses or agents. The demand side still faces an industry seeking to offer a more cost-efficient transfer, and investment is driven into market innovations such as offering store value cards, debit cards, and wireless internet technology. The majority of Latin American and Caribbean countries are in the embryonic stages of competition. Markets are relatively informal, governments do not regularly enforce the laws requiring business to report their transactions, market

333
concentration is pronounced, innovation is perceived as risky by investors, and small firms have few chances to compete (Orozco 2004c).
In addition to the fees charged to send money, the exchange rate commission is a significant cost incurred by immigrants and their relatives. In some countries, particularly when foreign-currency crises or shortages in foreign currency occur, the commission may represent a large part of the cost, such as the case for remittances from the Dominican Republic to Haiti, Costa Rica to Nicaragua, Argentina to Bolivia, and Venezuela to Colombia (Fagen and Bump 2005). For example, costs to send remittances to Nicaragua from Costa Rica are about 10 percent (Orozco 2003a, 2003b). In addition to the problem of costs is the lack of consumer protection if senders or recipients face abusive practices by the intermediaries. In particular, in most of the Western Hemisphere there is no consumer-rights institution investigating sending or receiving money transfers.
Savings and credit: Banking the unbanked is also a serious challenge in Latin America. For example, less than 20 percent of Mexican adults have access to bank accounts. In most of the world, banks are reluctant to cultivate the poor as customers. There are many reasons for this dearth of banking the poor: relatively low profit margins, perceptions – often unrealistic – of risk, and a lack of government incentives or requirements. This general trend is exacerbated in Latin America, where banks traditionally concentrate on serving the agro-exporting elite, many of whom created their own banks. An Inter-American Development Bank study found that “financial markets are subdeveloped in Latin America and the blame goes beyond the history of inflation and financial instability. Weak institutions that support credit are also to blame.” In fact, the study maintains that less than 5 percent of small businesses receive loans from commercial banks. Even small savings and credit cooperatives and microfinance institutions that have emerged to fulfill the demand for financial services do not have a sufficiently comfortable portfolio: it is 1 percent below what commercial banks possess in Latin America (IPES 1999). The final result has been that average citizens, and especially those with low income, have not had access to financial services, nor have banks sought them out. In fact, the deficiencies in financial institutions constitute a principal source of inequality.
Turning to alternative banking financial institutions: As the marketplace for remittances gains attention from companies, governments, and development agents, financial intermediaries such as microfinance institutions (MFIs) are increasingly becoming subjects of attention due to their position as

334
financial agents with locations in areas where remittances arrive.5 These MFIs are identifying themselves as players in developing countries, which in turn can offer new financial products, including electronic cards.
The presence of MFIs in money transfers is growing around the world. In Latin America, there may be some 100 MFIs, each with a network of forty paying locales and the capacity to branch out in partnerships with other retailers. These institutions are seeking partnerships with money-transfer organizations that are low cost and are willing to work on financial service delivery. The end result is the penetration of a new player in the marketplace of remittance payment that also offers alternative banking services. As Table 16 shows, MFIs are offering remittance transfers and simultaneously seeking to bank individuals through the opening of savings accounts, as well as other products, including mortgage loans.
Table 15: Transformation Rate of Remittance Transfer Clients into Bank ClientsInstitution New accounts Monthly transfers Conversion rate
Salcaja 500 1000 50%ReddelaGente 3500 35000 10%BancoSolidario 4000 5000 80%Fedecaces 4375 22000 20%Guayacan 533 5426 10%Coosadeco 529 4780 11%Acacu 3000 2703 110%Acocomet 800 2383 34%ElComercio 80 800 10%
Source: Orozco, M. and E. Hamilton.
12. Conclusions and Recommendations
This paper has explored the various interactions between remittances, migrants, and economic impacts. The effect on development is also addressed within the various lines of analysis. Here we want to address the relationship between remittances and development policy.
The discussion of the development impact of remittances is sometimes obscured by assumptions about development and economic growth that are not necessarily accurate. For example, for many years some argued that remittances needed to have a productive use because consumption expenditure was assumed to be detrimental to growth. Regardless, no one provided a yardstick by which to measure what proportion of a person’s income should be productive. There seemed to be an assumption that
5 See for example the latest issue of the newsletter MIGRANTRemittances, August 2005, 2(2).

33�
remittance recipients have a higher propensity to consume, but in fact the opposite is true; remittance recipients save and invest more, and are more likely to have more bank accounts than non-recipients.
In practical terms, the social and productive base of an economy significantly defines the ways in which remittances will effectively function in that economy. Remittances need to be understood exactly as what they are: foreign savings. And as any other source of foreign savings, like aid, trade, or investment, remittances interact with the structure of the local economy. The extent to which that structure absorbs those savings is the first-order question for development practitioners. This means we need to analyze a local economy with regard to its productivity forces, what its efficiency level is, how modern it is, what level of diversification/concentration of production exists within various sectors, how entrepreneurship operates and is enabled, what technology tools exist or are missing, and to what extent the government provides an enabling environment to motivate an interaction between investment and production.
Performing such analysis will give cues about the extent to which a local economy provides substantive opportunities for the productive deployment of remittances. If an economy is unable to produce in a competitive context, its labor force will be depressed and eventually a portion will migrate to take care of their families. But even once they are away and send money, the families may only be able to do so much with that money insofar as the local economy provides an effective supply to the demand of services and products.
Consumers demand a range of commodities and services (economic and financial), and what they can obtain depends on the efficiency of market information and the responsiveness of businesses to their interests. Some of these interests involve savings, credit, and other financial services, but there are other interests such as basic consumption and investment in education and health. If the productive base of the local economy cannot provide for that demand, imports of goods will then ensue. None of this is a situation created by remittances, but rather by the structure of the local economy and its connection to the global context.
The development challenge for practitioners consists in enabling an environment in which remittances can have a transformative role in a local economy. How can policies leverage remittances to effectively and positively impact their absorption in the local economy and thus promote development? Once practitioners know how the productive base operates, policy intervention comes to play to alleviate failures or weaknesses of the local economy.

33�
Within this context, there exist three areas of work for institutions working on economic development in Latin America. First, analysts need to integrate remittances within the economy of a country. This means exploring the interaction between the local productive base of an economy and the cause-and-effect roles of remittance and other migrant transfers. Second, it is important to explore the macroeconomic behavior of remittances, specifically their influence on productive engines like investment or trade. This means paying close attention to the effect that price increases, foreign exchange-rate fluctuations, interest rates, or unemployment have on remittance sending. Third, another macroeconomic analysis is required to determine the impact of remittances on growth. This is particularly important in those countries where remittances have a strong impact vis-à-vis national income.
337
Data Methodology on Pricing
The methodology used to collect pricing information consists of calling or visiting MTOs in order to build pricing datasets. The datasets thus result from information about fees, foreign exchange charged as commission, interbank exchange rate, and other charges that could apply. Other data collected include mechanisms employed to make the transfer and geographic coverage of the company in the U.S., and the cost of sending the money in local or U.S. currency. Information is collected for costs of sending $200, $250, and $300.
The transfer cost of a remittance is generally derived from the sum of the fee and the commission on the exchange rate. The commission is estimated from the spread between the interbank exchange rate reported by the Central Bank of each recipient country and the exchange rate reported by the MTO. Commission = 1 – (fx / interbank fx).
U.S. pricing data is collected for typical MTOs and include around sixty companies sending from the U.S. to fourteen Latin American and Caribbean countries. Data has also been collected for other countries in Southeast Asia using a similar methodology.
Pricing information for electronic card-based transfers included data from twenty companies. Not all were MTOs; some were typical store value-card companies offering remittance transfers. Research assistance in data compilation in �une 2005 was made thanks to Rachel Fedewa and Patricia �inich.
Appendix

338
References
Andrade-Eeckoff, K.
2003 Mitos y realidades: Un análisis de la migración internacional de las zonas rurales de El Salvador, Facultad Latinoamericana de Ciencias Sociales, San Salvador.
Banco Central, Republica Dominicana
http://www.bancentral.gov.do/
Banco de Mexico
www.mexico-travel.com
Bank of Jamaica
2004 Statistical Digest, October 2004, Bank of �amaica, Kingston.
Batres-Marquez, S.P., H.H. Jensen, and G.H. Brester
2001 Salvadoran consumption of ethnic foods in the United States, Working Paper 289, Center for Agricultural and Rural Development, Iowa State University, Aimes, IA.
Durrand, J., E.A. Parrado, and D. Massey
1996 “Migradollars and development: A reconsideration of the Mexican case,” International Migration Review 30(2).
El Colegio de la Frontera Norte
2002 Problemas y perspectivas de las remesas de los Mexicanos y Centroamericanos en Estados Unidos, Unpublished Manuscript, El Colegio de la Frontera Norte, Departamento de Estudios Económicos, Mexico.

33�
Fagen, P., and M. Bump
2005 “Remittances regionally,” in D.F. Terry and S.R. Wilson (eds.), Beyond small change: Making migrants’small change: Making migrants’ remittances count, Inter-American Development Bank/ Harvard University Press, Washington, D.C.
Federal Communications Commission
2000, 2001, International Telecommunications Data, Washington,2002 D.C.
García, J.J.
1998 Las tendencias de la migración en El Salvador, FUSADES-PNUD, El Salvador.Salvador.
IPES
1999 �998/�999: Facing up to inequality in Latin America, Inter-American Development Bank, Washington, D.C.Development Bank, Washington, D.C.
Multilateral Investment Fund, Inter-American Development Bank
2004 Survey of Latino remittances from the United States to Latin America by U.S. state, MIF, IADB, Washington, D.C., May 2004.
Orozco, M.
2002a “Challenges and opportunities of marketing remittances to Cuba,” Inter-American Dialogue, Washington, D.C., �uly 2002.
2002b “Globalization and migration: The impact of family remittances to Latin America,” inAmerica,” in Latin American Politics and Society, Summer, 44(2).
2002 Attracting remittances: Market, money and reduced costs, Working paper, Multilateral Investment Fund, Inter-American Development Bank, Washington D.C.

340
2003a Family remittances to Nicaragua: Opportunities to increase the economic contributions of Nicaraguansthe economic contributions of Nicaraguans living abroad, Report commissioned by the USDA, Inter American Dialogue, Washington, D.C.
2003 Oportunidades y estrategias para el desarrollo y el crecimiento a trav�s de las remesas familiares aa trav�s de las remesas familiares a Nicaragua, Inter-American Dialogue, Washington, D.C.
2003c Worker remittances, transnationalism and development, Paper presented at the Migrant Remittances, Development Impact, Opportunities for the Financial Sector and Future Prospects Conference, 9 and 10 October, London, England.
2004a Determinants of remittance transfers: The case of the Dominican Republic, January �999 to September 2003Republic, January �999 to September 2003, Unpublished manuscript, Inter-American Dialogue, Washington, D.C.
2004b Distant but close: Guyanese transnational communities and their remittances from the United Statesremittances from the United States, Inter-American Dialogue, Washington, D.C.
2004 The remittance marketplace: Prices, policy and financial institutions, Pew Hispanic Center, Washington, D.C., Spanish version published in Revista Sin Fronteras, no.12 (Abril-Mayo).
2005 “Transnationalism and development: Trends and opportunities in Latin America; A survey of transnational communities,” in S. Munzele Maimbo and D. Ratha (eds.), Remittances: Development impact and future prospects, The World Bank, Washington, D.C., pp. 347-377.
Pew Hispanic Center and Bendixen and Associates
2003 Receptores de remesas en Centroam�rica, Multilateral Investment Fund, Inter-American Development Bank, Ciudad de Guatemala, Guatemala.

341
2003 Receptores de remesas en Ecuador: Una investigación del mercado, Multilateral Investment Fund, Inter-American Development Bank, Quito, Ecuador.
Ratha, D.
2003 “Worker remittances: An important and stable source of external development finance,” Global Development Finance, The World Bank, Washington, D.C.
Rossini, R.E.
2002 O novo enraizamento: A conquista do espaço pelos nikkeis do Brasil no Japão, Paper presented at XIII Encontro da Associação Brasileira de Estudos Populacionais, November, Ouro Preto, Brazil.
The World Bank
2003 World development indicators (CD-Rom), The World Bank, Washington, D.C.
Torres, F.
2001 “Las remesas y el desarrollo rural en las zonas de alta intensidad migratoria en México,” Comisión Naciones Unidas: Comisión Económica para América Latina y El Caribe (CEPAL), Mexico.
U.S. International Trade Commission, Interactive Tariff and Trade DataWeb
U.S. Census Bureau
2000 Census 2000, U.S. Bureau of the Census, Washington, D.C.
Zarate, G.
2004 The multiplier effect of remittances, Unpublished.


Afterword