Embed Size (px)
DESCRIPTION
- PowerPoint PPT Presentation
Citation preview

Table 1San Francisco MSA Employment by Sector (000)
1991 1992 1993 1994 1995 1996 1997 Sept-98
Total Nonagricultural 939.6 914.4 908.3 903.7 916.5 948.2 985.6 1,011.2% Change -0.8% -2.7% -0.7% -0.5% 1.4% 3.5% 3.9% 1.7%
Construction 30.4 27.4 26.1 26.6 27.7 31.0 35.2 39.4% Change -3.5% -9.9% -4.7% 1.9% 4.1% 11.9% 13.5% 6.2%
Manufacturing 78 75.2 75 73.2 72.9 75.6 76.7 76.8% Change 0.0% -3.6% -0.3% -2.4% -0.4% 3.7% 1.5% -0.3%Durable Goods 28.8 27.6 26.6 26.4 26.8 29.3 31.1 31.1
% Change -1.7% -4.2% -3.6% -0.8% 1.5% 9.3% 6.1% -1.3%Nondurable Goods 49.2 47.6 48.3 46.7 46.1 46.3 45.5 45.7
% Change 0.8% -3.3% 1.5% -3.3% -1.3% 0.4% -1.7% 0.4%T.P.C.U. 76.8 77.9 76.4 75.1 74.2 76.4 79.2 79.9
% Change 0.8% 1.4% -1.9% -1.7% -1.2% 3.0% 3.7% -0.2%Water Transportation 2.9 3.7 3.4 3.2 3.1 3.1 3.2 3.4
% Change -6.5% 27.6% -8.1% -5.9% -3.1% 0.0% 3.2% 6.2%Transportation by Air 29.3 29.1 28 26.2 26.0 29.0 28.9 29.5
% Change 4.6% -0.7% -3.8% -6.4% -0.8% 11.5% -0.3% 0.7%Trade 205.4 195.4 192 194.1 198.0 200.6 207.7 209.2
% Change -3.0% -4.9% -1.7% 1.1% 2.0% 1.3% 3.5% -0.1%Wholesale Trade 54.9 51.1 47.3 47.4 48.3 47.4 48.7 49.0
% Change -5.0% -6.9% -7.4% 0.2% 1.9% -1.9% 2.7% -0.4%Retail Trade 150.5 144.3 144.7 146.7 149.7 153.2 159.0 160.2
% Change -2.2% -4.1% 0.3% 1.4% 2.0% 2.3% 3.8% 0.0%F.I.R.E. 104.8 101.3 100.6 98.8 95.9 98.1 102.1 105.9
% Change 0.4% -3.3% -0.7% -1.8% -2.9% 2.3% 4.1% 3.1%Finance 56.6 54.1 54.7 54.1 52.6 55.1 58.3 61.5% Change -1.0% -4.4% 1.1% -1.1% -2.8% 4.8% 5.8% 4.4%
Services 304.8 303.4 308.2 308.1 322.0 341.8 359.8 377.0% Change -0.4% -0.5% 1.6% -0.0% 4.5% 6.1% 5.3% 3.4%Business Services 73.7 73.7 78 75.5 82.6 96.7 105.3 112.2
% Change -3.3% 0.0% 5.8% -3.2% 9.4% 17.1% 8.9% 4.0%Engin. & Mgmt. Svcs. 45 42.6 42.3 43.1 45.9 48.2 49.3 51.3
% Change 1.4% -5.3% -0.7% 1.9% 6.5% 5.0% 2.3% 2.4%Health Services 48.2 49.1 48.9 48.5 48.7 48.5 50.4 55.6
% Change 2.8% 1.9% -0.4% -0.8% 0.4% -0.4% 3.9% 10.5%Hotels & Lodging Plcs. 25 23.7 23.4 23.9 23.8 23.5 24.5 25.0
% Change 3.7% -5.2% -1.3% 2.1% -0.4% -1.3% 4.3% 0.8%Total Government 138.8 133.3 129.4 127.1 125.0 124.1 124.4 122.5
% Change -0.1% -4.0% -2.9% -1.8% -1.7% -0.7% 0.2% 0.1%
Sources: Bureau of Labor Statistics, Rosen Consulting Group (RCG)

Table 2Nation's Largest Law Firms with Principal Office in San Francisco
Number of LawyersRank* Name In S.F. Firmwide
17 Morrison & Foerster LLP 189 55921 Pillsbury Madison & Sutro LLP 230 52440 Graham & James LLP 73 40643 Brobeck Phleger & Harrison LLP 152 39845 Orrick, Herrington & Sutcliffe 132 38474 Heller Ehrman White & McAuliffe 142 31176 Cooley Godward Castro Huddleson & Tatum 86 30984 Littler, Mendelson, Fastiff, Tichy & Mathiason 84 28096 Sedgwick, Detert, Moran & Arnold 104 262
*Out of largest 100 law firms in U.S.
Source: The National Law Journal, September 1996

Table 3San Francisco MSA Largest Employers
Employees
1 City and County of San Francisco 25,3482 United Airlines 17,4533 United States Federal Government 13,4134 University of California, San Francisco 13,2005 Bank of America 7,9276 Pacific Gas and Electric 7,0007 San Francisco Unified School District 6,8688 State of California 6,2039 Wells Fargo 5,90010 Oracle 5,53011 UCSF Stanford Health Care 5,40012 County of San Mateo 4,74913 ABM Industries 4,57514 California Pacific Medical Center 3,65015 Charles Schwab 3,45116 Genentech 3,17017 Pacific Bell 3,00018 United States Postal Service 2,93719 Raychem 2,90020 San Francisco State University 2,85121 Macy's West 2,80022 Fireman's Fund 2,50023 Franklin Resources 2,50024 Levi Strauss & Co. 2,40025 Bechtel 2,300
Source: San Francisco Business Times, November 1997

Table 6Top Ten National Office Markets Ranked by Second Quarter 1998 Vacancy Rates
Overall Market Downtown Market
1 Austin-San Marcos, TX 4.3% 1 Seattle-Bellevue-Everett, WA 4.8%2 Seattle-Bellevue-Everett, WA 5.0% 2 San Francisco, CA 4.9%3 San Francisco, CA 5.7% 3 Stamford-Norwalk, CT 5.2%4 Columbus, OH 5.9% 4 Columbus, OH 5.5%5 San Jose, CA 6.1% 5 Boston, MA 6.1%6 Raleigh-Durham-Chapel Hill, NC 6.1% 6 Austin-San Marcos, TX 6.2%7 Minneapolis-St. Paul, MN-WI 7.0% 7 San Jose, CA 6.3%8 Kansas City, MO-KS 7.0% 8 Nashville, TN 7.4%9 Nashville, TN 7.3% 9 Minneapolis-St. Paul, MN-WI 7.6%
10 Boston, MA 7.7% 10 Portland-Vancouver, OR-WA 8.0%10 Orlando, FL 8.0%
Sources: Various brokers, RCG.

Table 7San Francisco Downtown Historical Office Market Trends
1987 1988 1989 1990 1991 1992 1993 1994 1995 1996 1997 2Q98
Overall Downtown
Total Stock SF(000) 39,258 40,578 40,928 41,718 41,858 41,858 41,858 41,858 41,858 41,858 41,911 41,911
New Construction SF(000) 1,350 1,320 350 790 140 0 0 0 0 0 0 0
Net Absorption SF(000) 246 684 951 847 37 419 -544 1,088 335 1,465 1,593 -671
Occupied Stock SF(000) 33,604 34,288 35,239 36,086 36,123 36,542 35,998 37,086 37,421 38,886 40,528 39,858
Vacancy Rate 14.4% 15.5% 13.9% 13.5% 13.7% 12.7% 14.0% 11.4% 10.6% 7.1% 3.3% 4.9%
Class A Downtown
Total Stock SF(000) --- --- --- 32,185 32,325 32,325 32,325 32,325 32,325 32,325 32,684 32,684
New Construction SF(000) --- --- --- 790 140 0 0 0 0 0 0 0
Net Absorption SF(000) --- --- --- --- 251 162 -226 905 65 1,067 1,111 -458
Occupied Stock SF(000) --- --- --- 27,968 28,219 28,381 28,155 29,060 29,125 30,191 31,638 31,180
Vacancy Rate --- --- --- 13.1% 12.7% 12.2% 12.9% 10.1% 9.9% 6.6% 3.2% 4.6%
Cl. A Dir. Ask. Rt. Per SF $22.71 $23.94 $25.05 $26.71 $25.31 $23.70 $22.62 $23.70 $25.07 $29.35 $36.27 $45.60
Rent Growth -3.4% 5.4% 4.6% 6.6% -5.2% -6.4% -4.6% 4.8% 5.8% 17.1% 23.6% 29.6%
Sources: Cushman & Wakefield of California, RCG.

2%
4%
6%
8%
10%
12%
14%
Vac
ancy
Rat
e
-10%
-5%
0%
5%
10%
15%
20%
25%
30%
Ren
t G
row
th
92 93 94 95 96 97 2Q98
Rent Growth Vacancy Rate
Vacancy Rate vs. Rent GrowthClass A Downtown San Francisco
Source: Cushman & Wakefield

-1000
-500
0
500
1000
1500
2000
SF
(00
0)
86 88 90 92 94 96 2Q98
Calculated Net AbsorptionDowntown San Francisco Office Market
Source: Cushman & Wakefield

Table 8Downtown San Francisco Class A Office Market
Economic Rents in 1998 ($/SF)
Land $50.72Hard Costs (Core & Shell) 150.00Soft Costs 63.43Tenant Improvements 40.00Leasing Commissions 10.00
Total Development costs $314.16
NOI Necessary to Achieve 10% Return 31.42Plus: Stabilized Vacancy (5%) 2.29Plus: Expenses 12.00
Effective Rent Necessary to Achieve 10% Return $45.70
1998 Downtown Class A Asking Office Rent $45.12
Increase in Class A Rental Rates Necessary $0.58to Reach Economic RentPercentage Increase in Class A Rental Rates Necessary 1.3%to Reach Economic Rent
Sources: Cushman & Wakefield, Plant Construction, Local brokers and developers, RCG Estimates

Table 9Downtown San Francisco New Construction Pipeline
Estimated
Address Submarket Developer Size (sq. ft.) Completion Comments
101 Second Street SOMA Myers Corporation 352,100 1999 Under construction, Arthur Andersen anchor
275 Sacramento NOMA Patson Development 60,000 1999 Under construction
199 Fremont Street SOMA Fremont Properties 425,800 2000 Under construction, PriceWaterhouse anchor
150 California Street NOMA Equity Office Properties 205,000 2000 Under construction
GAP Headquarters SOMA GAP/William Wilson 540,000 2001 Under construction
One Second Street SOMA Jaymont Properties 359,000 2002 Waiting for approval, looking for anchor
524 Howard Street SOMA Anvil Int'l Properties 200,000 2002 Waiting for approval
65-77 Battery Street NOMA Asian Ownership 160,000 2002 Waiting for approval, inferior site with problems
Sources: Cushman & Wakefield of California, other local developers and brokers, RCG.

Table 11Downtown San Francisco Forecasted Office Market Trends (000, Except Percent)
Base Case Scenario Recession Scenario
1997 1998f 1999f 2000f 2001f 2002f 1998f 1999f 2000f 2001f 2002f
Overall DowntownNew Construction 0 0 352 650 540 700 0 352 650 540 0Net Absorption 1,593 -820 390 410 480 520 -820 -60 10 180 240Vacancy Rate 3.3% 5.3% 5.1% 5.6% 5.7% 6.0% 5.3% 6.2% 7.6% 8.3% 7.8%
Class A MarketNew Construction 0 0 352 650 540 700 0 352 650 540 0Net Absorption 1,111 -730 340 370 430 460 -730 -50 10 160 210Vacancy Rate 3.2% 5.4% 5.4% 6.1% 6.4% 6.9% 5.4% 6.6% 8.4% 9.3% 8.7%Class A Rent(psf) $36.27 $45.34 $46.62 $48.37 $50.33 $52.08 $45.34 $46.44 $47.56 $48.69 $49.59Rent Growth 23.6% 25.0% 2.8% 3.7% 4.1% 3.5% 25.0% 2.4% 2.4% 2.4% 1.8%
Sources: Bureau of Labor Statistics, Rosen Consulting Group (RCG)

-6%
-4%
-2%
0%
2%
4%
86 87 88 89 90 91 92 93 94 95 96 97 98 99f00f01f02f
New York U.S.
Employment GrowthNew York MSA vs. U.S.
Sources: Bureau of Labor Statistics, RCG

-200
-150
-100
-50
0
50
100
(Th
ou
sa
nd
)
72 74 76 78 80 82 84 86 88 90 92 94 96 98
-34 -27
-104
-158
-23
3
52 57
34
65
-12
15
85
50 47 51
5
-3
-52
-199
-97
4
43 40 49
69
95
Absolute Change in Private EmploymentNew York MSA
Source: Bureau of Labor Statistics

New York MSA Employment by Sector (000)
1989 1990 1991 1992 1993 1994 1995 1996 1997 1998
Total Nonagricultural 4138.0 4093.8 3878.8 3772.5 3772.6 3803.2 3820.3 3857.2 3,919.4 4,010.0% Change 0.1% -1.1% -5.3% -2.7% 0.0% 0.8% 0.4% 1.0% 1.6% 2.3%
Construction & Mining 152.4 144.3 123.8 107.8 106.4 110.6 112.1 114.1 117.5 124.2% Change -0.7% -5.3% -14.2% -12.9% -1.3% 3.9% 1.4% 1.8% 3.0% 5.7%
Manufacturing 435.6 410.6 377.1 358.1 348.8 337.6 328.9 320.3 316.9 316.7% Change -3.3% -5.7% -8.2% -5.0% -2.6% -3.2% -2.6% -2.6% -1.1% -0.1%Apparel & Textiles 102.3 96.4 89.7 86.5 83.9 79.3 76.1 74.6 75.0 74.7
% Change -1.1% -5.8% -7.0% -3.6% -3.0% -5.5% -4.0% -2.0% 0.6% -0.5%Printing & Publishing 98.0 94.5 86.9 82.0 81.9 82.2 82.2 81.6 81.1 81.8
% Change -2.5% -3.6% -8.0% -5.6% -0.1% 0.4% 0.0% -0.7% -0.6% 0.8%T.C.P.U. 242.9 255.9 245.1 230.8 230.0 228.2 228.9 230.8 232.6 235.5
% Change -0.9% 5.4% -4.2% -5.8% -0.3% -0.8% 0.3% 0.8% 0.8% 1.3%Communications* 23.7 75.8 74.8 70.7 69.6 68.6 68.7 70.3 73.5 75.3
% Change -69.5% 219.8% -1.3% -5.5% -1.6% -1.4% 0.1% 2.3% 4.5% 2.6%Trade 751.7 726.3 676.2 652.9 645.4 653.6 667.6 676.5 690.4 710.0
% Change -0.8% -3.4% -6.9% -3.4% -1.1% 1.3% 2.1% 1.3% 2.1% 2.8%Wholesale Trade 262.2 253.0 234.9 225.7 219.2 218.9 220.8 217.7 220.1 224.0
% Change -1.8% -3.5% -7.2% -3.9% -2.9% -0.1% 0.9% -1.4% 1.1% 1.8%Retail Trade 489.5 473.3 441.3 427.2 426.3 434.7 446.9 458.8 470.4 486.1
% Change -0.3% -3.3% -6.8% -3.2% -0.2% 2.0% 2.8% 2.7% 2.5% 3.3%General Merchandise 64.0 58.7 53.8 49.2 46.0 43.5 44.2 46.5 46.2 47.0
% Change -5.7% -8.3% -8.3% -8.6% -6.5% -5.4% 1.6% 5.2% -0.8% 1.9%Apparel & Accessories 54.1 53.9 50.0 48.9 50.1 51.0 52.8 52.1 52.8 54.1
% Change 3.0% -0.4% -7.2% -2.2% 2.5% 1.8% 3.5% -1.3% 1.2% 2.5%Eating & Drink. Places 155.5 152.2 140.5 138.1 139.7 145.0 150.0 155.9 162.5 170.0
% Change 0.1% -2.1% -7.7% -1.7% 1.2% 3.8% 3.4% 3.9% 4.2% 4.6%F.I.R.E. 566.4 555.6 528.1 508.0 505.0 513.3 505.5 501.0 504.1 512.2
% Change -1.9% -1.9% -4.9% -3.8% -0.6% 1.6% -1.5% -0.9% 0.6% 1.6%Depository Institutions 179.7 175.8 163.9 148.3 142.3 139.2 134.0 127.8 121.9 120.6
% Change -2.9% -2.2% -6.8% -9.5% -4.0% -2.2% -3.7% -4.6% -4.6% -1.0%Security Brokers 147.7 139.5 131.5 133.2 137.8 148.6 147.5 149.1 158.5 165.7
% Change -4.8% -5.6% -5.7% 1.3% 3.5% 7.8% -0.7% 1.1% 6.3% 4.5%Services 1304.8 1309.6 1252.9 1249.0 1275.1 1310.5 1350.6 1400.3 1,450.5 1,508.5
% Change 2.5% 0.4% -4.3% -0.3% 2.1% 2.8% 3.1% 3.7% 3.6% 4.0%
Total Private 3453.9 3402.3 3203.2 3106.6 3110.7 3154.0 3193.8 3242.9 3312.0 3407.1% Change -0.1% -1.5% -5.9% -3.0% 0.1% 1.4% 1.3% 1.5% 2.1% 2.9%
Government 684.1 691.5 675.6 665.9 661.9 649.2 626.5 614.3 607.5 602.9% Change 0.9% 1.1% -2.3% -1.4% -0.6% -1.9% -3.5% -1.9% -1.1% -0.8%
Local Government 528.2 532.5 524.5 516.9 515.9 503.4 483.4 477.0 473.7 471.5% Change 1.6% 0.8% -1.5% -1.4% -0.2% -2.4% -4.0% -1.3% -0.7% -0.5%

Table 3New York City Top Employers
Rank Firm Employees Sector
1 Citigroup 30,671 Insurance/Financial2 Bell Atlantic 25,859 Telecommunications3 Chase Manhattan Corp. 25,465 Banking4 New York University 13,372 Education5 Consolidated Edison of NY 13,229 Utility6 Time Warner, Inc. 11,500 Media7 Morgan Stanley Dean Witter 10,500 Financial Services8 Merrill Lynch & Company 9,679 Financial Services9 Columbia University 9,233 Education10 Bank of New York 8,795 Banking11 AMR Corp. 8,462 Airline12 J.P. Morgan & Company 7,457 Financial Services13 Bankers Trust New York 6,932 Banking14 American Express 6,412 Financial Services15 Goldman Sachs 6,000 Financial Services16 Bear Stearns 5,991 Financial Services17 Prudential Securities 5,731 Financial Services18 Lefrak Organization 5,700 Real Estate Developer19 Walt Disney Company 5,500 Entertainment20 Equitable Companies 5,272 Insurance/Financial
Source: Crain's New York Business

-60
-40
-20
0
20
40
60
(Thousand)
72 74 76 78 80 82 84 86 88 90 92 94 96 98
11 14
-2
-12
1
18
41 43 39
44
20
29
41 40 43
38
17
32
5
-57
-4
26
35 40
50 50
58
Absolute Change in Services EmploymentNew York MSA
Source: Bureau of Labor Statistics

800
900
1000
1100
1200
1300
1400
1500
1600
(Thousand)
70 72 74 76 78 80 82 84 86 88 90 92 94 96 98
Services EmploymentNew York MSA
Source: Bureau of Labor Statistics

Table 5New York MSA Services Sector Employment (000)
1989 1990 1991 1992 1993 1994 1995 1996 1997 1998
Services 1304.8 1309.6 1252.9 1249.0 1275.1 1310.5 1350.6 1400.3 1450.5 1,508.5% Change 2.5% 0.4% -4.3% -0.3% 2.1% 2.8% 3.1% 3.7% 3.6% 4.0%Business Services 292.6 278.6 243.0 233.9 240.2 248.4 254.7 275.9 297.6 320.2
% Change 1.2% -4.8% -12.8% -3.7% 2.7% 3.4% 2.5% 8.3% 7.9% 7.6%Health Services 295.0 305.2 318.6 328.7 338.9 346.3 356.6 361.3 363.8 368.8
% Change 3.0% 3.5% 4.4% 3.2% 3.1% 2.2% 3.0% 1.3% 0.7% 1.4%Social Services 135.7 142.3 146.0 153.3 159.6 166.0 169.4 172.0 177.4 182.0
% Change 3.7% 4.9% 2.6% 5.0% 4.1% 4.0% 2.0% 1.5% 3.1% 2.6%Engin. & Mgmt. Svcs. 114.0 113.7 100.9 98.4 100.3 102.9 106.0 110.4 114.9 120.2
% Change 4.0% -0.3% -11.3% -2.5% 1.9% 2.6% 3.0% 4.2% 4.1% 4.6%Educational Services 114.3 115.0 111.3 109.7 110.6 114.2 121.5 129.5 134.3 139.6
% Change 1.4% 0.6% -3.2% -1.4% 0.8% 3.3% 6.4% 6.6% 3.7% 4.0%Legal Services 79.8 80.9 76.5 74.6 74.4 73.8 72.7 72.5 73.5 74.9
% Change 6.5% 1.4% -5.4% -2.5% -0.3% -0.8% -1.5% -0.3% 1.4% 2.0%Membership Orgs. 63.1 63.5 61.6 61.1 61.7 62.1 63.0 64.7 66.6 68.2
% Change 1.1% 0.6% -3.0% -0.8% 1.0% 0.6% 1.4% 2.7% 2.9% 2.3%Hotels & Lodging 39.3 38.8 35.7 35.7 35.1 35.7 36.7 37.4 38.6 39.6
% Change 2.9% -1.3% -8.0% 0.0% -1.7% 1.7% 2.8% 1.9% 3.2% 2.6%Amusement & Recr. 54.1 55.4 51.1 51.3 47.7 45.5 47.9 49.8 52.7 55.8
% Change 4.8% 2.4% -7.8% 0.4% -7.0% -4.6% 5.3% 4.0% 5.8% 5.8%Motion Pictures 24.6 25.9 25.2 21.9 25.9 34.2 38.2 40.3 41.7 46.7
% Change 3.8% 5.3% -2.7% -13.1% 18.3% 32.0% 11.7% 5.5% 3.5% 11.9%
Source: Bureau of Labor Statistics

420
440
460
480
500
520
540
560
580
600
(Thousand)
70 72 74 76 78 80 82 84 86 88 90 92 94 96 98
FIRE EmploymentNew York MSA
Source: Bureau of Labor Statistics

60
80
100
120
140
160
180
(Thousand)
75 76 77 78 79 80 81 82 83 84 85 86 87 88 89 90 91 92 93 94 95 96 97 98
Securities EmploymentNew York MSA
Source: Bureau of Labor Statistics

0
2000
4000
6000
8000
10000
12000
SF
(000)
1991 1992 1993 1994 1995 1996 1997 1998
Gross Leasing ActivityDowntown Manhattan
Source: Cushman & Wakefield

0
5000
10000
15000
20000
SF
(000)
1991 1992 1993 1994 1995 1996 1997 1998
Gross Leasing ActivityMidtown Manhattan
Source: Cushman & Wakefield

-4000
-2000
0
2000
4000
6000
SF
(0
00
)
86 87 88 89 90 91 92 93 94 95 96 97 98
Calculated Net AbsorptionDowntown Manhattan
Sources: Cushman & Wakefield, RCG

-4000
-2000
0
2000
4000
6000
SF
(0
00
)
86 87 88 89 90 91 92 93 94 95 96 97 98
Calculated Net AbsorptionMidtown Manhattan
Sources: Cushman & Wakefield, RCG

Table 10Office New Construction Pipeline in Manhattan
SizeAddress Developer or Project SF(000) Status Est. Compl. Type
Four Times Square The Durst Organization 1500 under constr. 1999 speculativeThree Times Square Rudin Management 820 under constr. 2001 speculative383 Madison Sterling, Hines and Fred Wilson 850 under constr. 2002 build-to-suitColiseum site The Related Companies 750 planned 2003 build-to-suitRockefeller Plaza West Rockefeller Group Development --- planned 2001 build-to-suitBroad Street for New York Stock Exchange --- planned 2004 speculativeBroadway b/w 44th-45th for Bertelsmann AG 600 proposed --- build-to-suittwo Times Square sites Boston Properties 2000 proposed --- ---
Source: Rosen Consulting Group (RCG).

Table 11Manhattan Office Market
Total Office Units 1990 1991 1992 1993 1994 1995 1996 1997 1998
Total Stock SF (000) 354,536 355,626 357,956 358,167 358,337 360,078 358,628 357,928 357,998
New Construction SF (000) 4,188 1,090 2,330 211 170 1,741 -1,450 -700 70
Net Absorption SF (000) -3,156 -456 -411 3,465 5,722 5,604 4,914 10,778 4,938
Occupied Stock SF (000) 292,938 292,482 292,072 295,537 301,259 306,863 311,777 322,554 327,493
Vacancy Rate 17.4% 17.8% 18.4% 17.5% 15.9% 14.8% 13.1% 9.9% 8.5%
Gross Rent Per SF $38.04 $35.75 $33.76 $32.25 $32.45 $32.48 $34.00 $36.49 $43.82
% Change -4.1% -6.0% -5.6% -4.5% 0.6% 0.1% 4.7% 7.3% 20.1%
Downtown 1990 1991 1992 1993 1994 1995 1996 1997 1998
Total Stock SF (000) 108,027 108,027 108,067 108,067 108,067 109,808 108,358 107,658 107,658
New Construction SF (000) 0 0 40 0 0 1,741 -1,450 -700 0
Net Absorption SF (000) -1,296 -864 -1,805 540 324 849 1,660 5,021 3,122
Occupied Stock SF (000) 88,582 87,718 85,913 86,454 86,778 87,627 89,287 94,308 97,430
Vacancy Rate 18.0% 18.8% 20.5% 20.0% 19.7% 20.2% 17.6% 12.4% 9.5%
Gross Rent Per SF $32.99 $31.80 $32.31 $30.12 $29.79 $30.10 $30.89 $31.46 $38.70
% Change -6.6% -3.6% 1.6% -6.8% -1.1% 1.0% 2.6% 1.8% 23.0%
Midtown 1990 1991 1992 1993 1994 1995 1996 1997 1998
Total Stock SF (000) 246,509 247,599 249,889 250,100 250,270 250,270 250,270 250,270 250,340
New Construction SF (000) 4,188 1,090 2,290 211 170 0 0 0 70
Net Absorption SF (000) -1,859 408 1,394 2,925 5,398 4,755 3,254 5,756 1,816
Occupied Stock SF (000) 204,356 204,764 206,158 209,083 214,481 219,236 222,490 228,246 230,062
Vacancy Rate 17.1% 17.3% 17.5% 16.4% 14.3% 12.4% 11.1% 8.8% 8.1%
Gross Rent Per SF $40.26 $37.47 $34.38 $33.17 $33.60 $33.53 $35.34 $38.65 $46.02
% Change -3.2% -6.9% -8.2% -3.5% 1.3% -0.2% 5.4% 9.4% 19.1%
Sources: Cushman & Wakefield, Rosen Consulting Group (RCG)
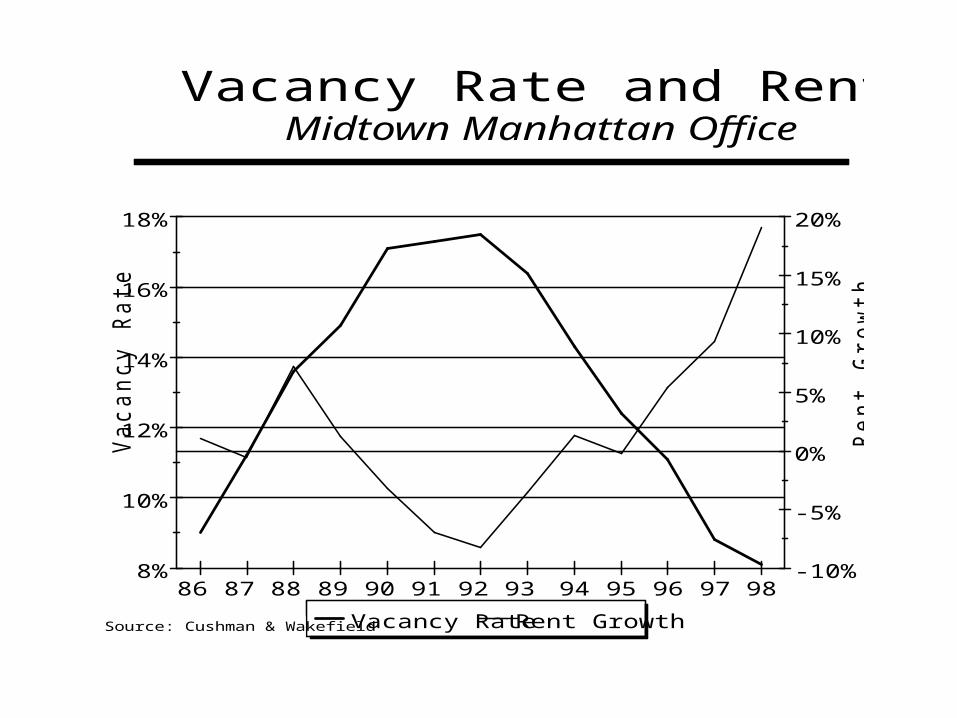
8%
10%
12%
14%
16%
18%
Va
ca
ncy R
ate
-10%
-5%
0%
5%
10%
15%
20%
Re
nt G
row
th
86 87 88 89 90 91 92 93 94 95 96 97 98
Vacancy Rate Rent Growth
Vacancy Rate and Rent GrowthMidtown Manhattan Office
Source: Cushman & Wakefield

-10%
-5%
0%
5%
10%
15%
20%
25%
86 87 88 89 90 91 92 93 94 95 96 97 9899f00f01f02f
Downtown Midtown
Office Rent GrowthManhattan
Sources: Cushman & Wakefield, RCG

(500)
0
500
1,000
1,500
2,000
2,500
Th
ou
san
ds
of
Sq
uar
e F
eet
0%
5%
10%
15%
20%
Vac
ancy
Rat
e
92 93 94 95 96 97 2Q98 98f 99f 00f 01f
Construction Absorption Vacancy Rate
Total Silicon Valley Office MarketConstruction and Net Absorption Trends
Sources: BT Commercial, Colliers Parrish, RCG
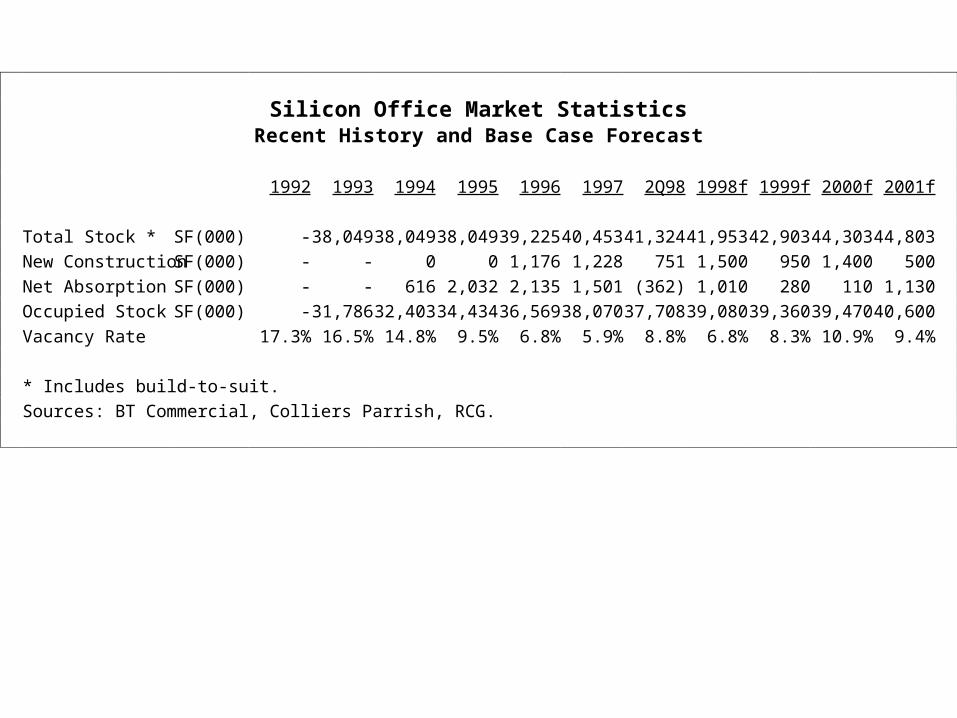
Silicon Office Market StatisticsRecent History and Base Case Forecast
1992 1993 1994 1995 1996 1997 2Q98 1998f 1999f 2000f 2001f
Total Stock * SF(000) - 38,049 38,049 38,049 39,225 40,453 41,324 41,953 42,903 44,303 44,803
New Construction SF(000) - - 0 0 1,176 1,228 751 1,500 950 1,400 500
Net Absorption SF(000) - - 616 2,032 2,135 1,501 (362) 1,010 280 110 1,130
Occupied Stock SF(000) - 31,786 32,403 34,434 36,569 38,070 37,708 39,080 39,360 39,470 40,600
Vacancy Rate 17.3% 16.5% 14.8% 9.5% 6.8% 5.9% 8.8% 6.8% 8.3% 10.9% 9.4%
* Includes build-to-suit.
Sources: BT Commercial, Colliers Parrish, RCG.

Vacancy RatesBy Submarket
Base Case vs. Recession Scenarios
Forecasted VacancyRate, 2001
Vacancy Rates Base Recessio
Market 1996 1997 1Q98 2Q98 Case Scenario
Silicon Valley 6.8% 5.9% 6.1% 8.8% 9.4% 10.0%
Palo Alto 2.7% 1.4% 1.7% 2.8% 1.6% 4.1%San Jose 8.8% 4.5% 3.7% 2.9% 6.3% 11.8%Santa Clara 8.1% 6.9% 7.0% 9.7% 9.8% 11.8%Airport/North First 10.0% 17.6% 19.4% 20.5% 14.4% 35.7%Cupertino 4.9% 6.7% 4.2% 1.4% 4.0% 8.3%Mountain View 1.9% 4.6% 9.5% 9.6% 7.7% 15.1%
Sources: BT Commercial, Colliers Parrish,RCG


