Embed Size (px)
Citation preview

Document technical content created by M J Maytum
2014 Copyright of M J Maytum
For licence permissions contact [email protected]
i
Remote Radio Unit (RRU) DC Feed 1
protection 2
3
Document technical content created by M J Maytum
2014 Copyright of M J Maytum
For licence permissions contact [email protected]
ii
Abstract: Distributed Base Stations (DBS) split the traditional Radio Base Station 1 (RBS) antenna tower base equipment into two locations; a Base Band Unit 2 (BBU) at the tower base and a Remote Radio Unit (RRU) mounted on the top of 3 the tower. Normally the BBU and the RRU would be connected by a fibre optic 4 cable to carry the signals and a DC feed to power the RRU. Towers are likely to 5 be struck with lightning and so some form of protection is necessary to prevent 6 damage to the DC powering feed and connected equipment. Several example 7 protection methods and a worked example are given. Feed cable currents and 8 protection stress levels are calculated for negative and positive lightning flashes. 9 Clause 1 describes the DBS configuration with term definitions in clause 2. 10 Clause 3 shows three possible protection configurations and clause 4 determines 11 the circuit parameters. Clauses 5 through to 7 calculate DC feed cable currents 12 and the Surge Protective Device (SPD) energy for four variants of lightning 13 stroke. Clause 8 outlines two other forms of DC feed protection. Finally clause 9 14 summarises and comments on the results. 15
Keywords: DBS, RRU, RRH, BBU, SPD, DC powering feed, protection, lightning stroke, positive 16 lightning, negative lightning 17
18
Document technical content created by M J Maytum
2014 Copyright of M J Maytum
For licence permissions contact [email protected]
iii
Contents 1
1. Introduction ........................................................................................................................................................ 1 2 1.1 RRH Configuration ..................................................................................................................................... 1 3 1.2 History ......................................................................................................................................................... 2 4
2. Definitions and abbreviations............................................................................................................................ 2 5 2.1 Definitions ................................................................................................................................................... 2 6 2.2 Abbreviations .............................................................................................................................................. 3 7
3. Protection configurations ................................................................................................................................... 3 8
4. Circuit component values .................................................................................................................................. 5 9 4.1 Resistances .................................................................................................................................................. 5 10 4.2 Inductances .................................................................................................................................................. 6 11 4.3 Equivalent experimental tower circuit ....................................................................................................... 6 12
5. Tower voltage during a negative lightning flash.............................................................................................. 7 13 5.1 First stroke ................................................................................................................................................... 8 14 5.2 Subsequent strokes .................................................................................................................................... 12 15
6. Tower voltage during a positive lightning stroke .......................................................................................... 14 16 6.1 Positive stroke ........................................................................................................................................... 14 17
7. Tower voltage during an extreme positive lightning stroke .......................................................................... 16 18 7.1 Extreme positive stroke ............................................................................................................................ 17 19
8. Alternative protection arrangements ............................................................................................................... 18 20 8.1 Gas Discharge Tube (GDT) reference bonding ...................................................................................... 18 21 8.2 Shielded DC feed ...................................................................................................................................... 19 22
9. Lightning stroke results and comments .......................................................................................................... 19 23
Annex A (informative) Bibliography................................................................................................................. 23 24
25
26
Document technical content created by M J Maytum
2014 Copyright of M J Maytum
For licence permissions contact [email protected]
1
Remote Radio Unit (RRU) DC Feed 1
protection 2
1. Introduction 3
1.1 RRH Configuration 4
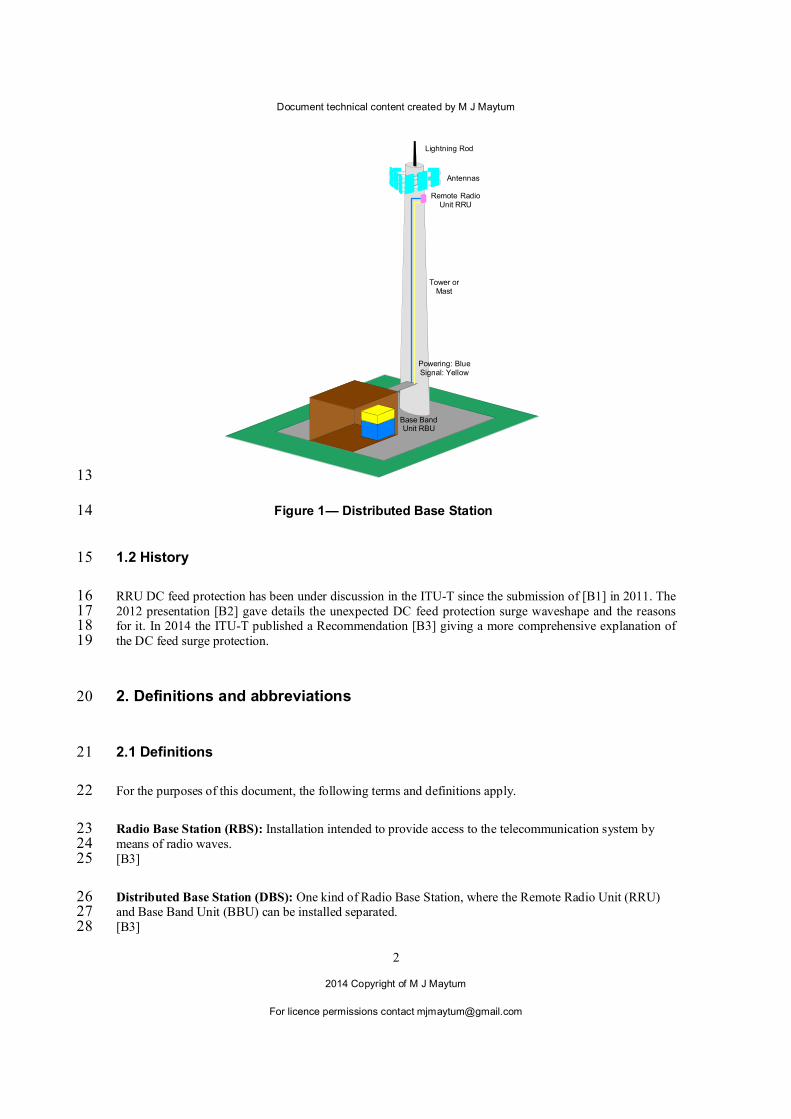
Traditionally Radio Base Stations (RBS) had the bulk of the equipment at the base of the antenna tower or 5 mast. Distributed Base Stations (DBS) split the equipment into two sections; a Base Band Unit (BBU) at 6 the tower or mast base and a Remote Radio Unit (RRU) mounted at the top of the tower or mast. Normally 7 the BBU and the RRU would be connected by a fibre optic cable to carry the signals and a DC feed to 8 power the RRU, see Figure 1. The RRU is also called a Remote Radio Head (RRH). To harmonize with 9 [B3] the acronym RRU will be used in this document. 10
Where a tower exists, such as power distribution pylons, the RRU may be mounted at an intermediate level 11 rather than at the tower top. 12
Document technical content created by M J Maytum
2014 Copyright of M J Maytum
For licence permissions contact [email protected]
2
Remote RadioUnit RRU
Antennas
Powering: BlueSignal: Yellow
Lightning Rod
Base BandUnit RBU
Tower orMast
13
Figure 1 — Distributed Base Station 14
1.2 History 15
RRU DC feed protection has been under discussion in the ITU-T since the submission of [B1] in 2011. The 16 2012 presentation [B2] gave details the unexpected DC feed protection surge waveshape and the reasons 17 for it. In 2014 the ITU-T published a Recommendation [B3] giving a more comprehensive explanation of 18 the DC feed surge protection. 19
2. Definitions and abbreviations 20
2.1 Definitions 21
For the purposes of this document, the following terms and definitions apply. 22
Radio Base Station (RBS): Installation intended to provide access to the telecommunication system by 23 means of radio waves. 24 [B3] 25
Distributed Base Station (DBS): One kind of Radio Base Station, where the Remote Radio Unit (RRU) 26 and Base Band Unit (BBU) can be installed separated. 27 [B3] 28
Document technical content created by M J Maytum
2014 Copyright of M J Maytum
For licence permissions contact [email protected]
3
Remote Radio Unit (RRU): 29 (Syn. Remote Radio Head (RRH)) 30 The radio frequency module of Radio Base Station which can be installed separately. Optical fibre is 31 commonly used to connected radio frequency module and base band unit of Radio Base Station. 32 [B3] 33
Base Band Unit (BBU): The base band module of Radio Base Station which can be installed separately. 34 Optical fibre is commonly used to connected base band module and radio frequency module. 35 [B3] 36
surge reference equalizer: A surge protective device used for connecting equipment to external systems 37 whereby all conductors connected to the protected load are routed, physically and electrically, through a 38 single enclosure with a shared reference point between the input and output ports of each system. 39 [B4] 40
2.2 Abbreviations 41
BBU Base Band Unit 42
DBS Distributed Base Station 43
RBS Radio Base Station 44
RRU Remote Radio Unit 45
RRH Remote Radio Head 46
RTN Return 47
SPC Surge Protective Component 48
SPD Surge Protective Device 49
3. Protection configurations 50
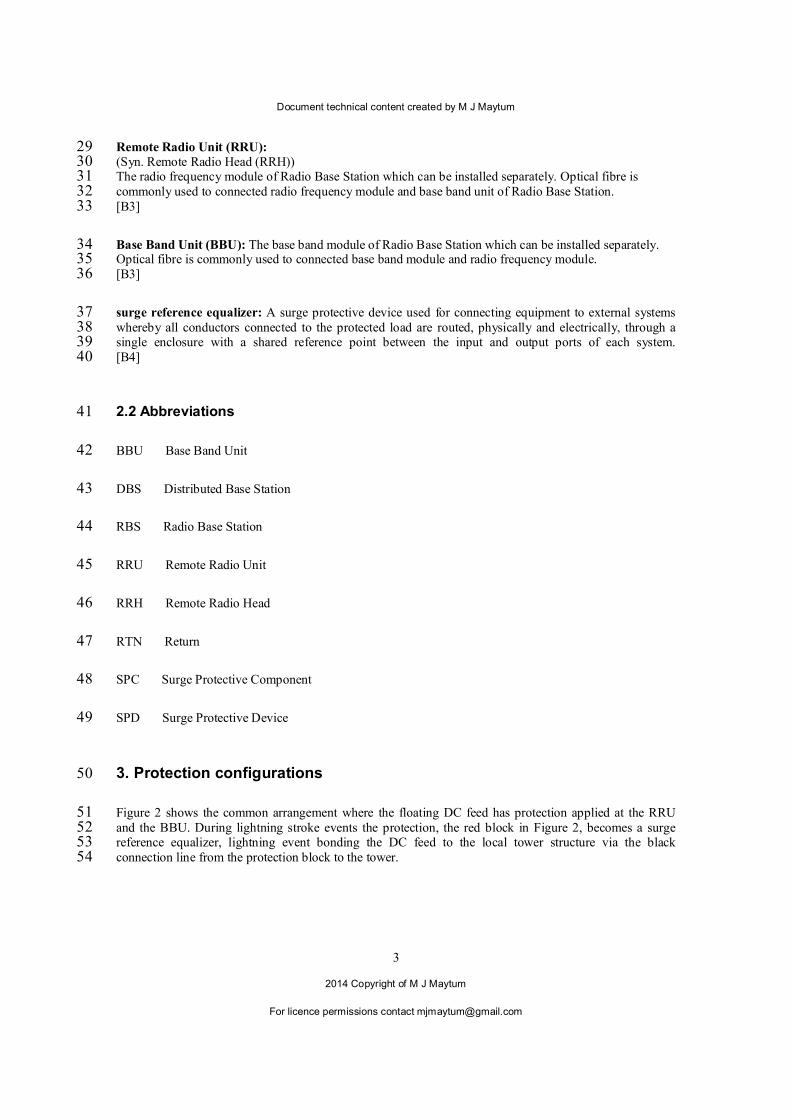
Figure 2 shows the common arrangement where the floating DC feed has protection applied at the RRU 51 and the BBU. During lightning stroke events the protection, the red block in Figure 2, becomes a surge 52 reference equalizer, lightning event bonding the DC feed to the local tower structure via the black 53 connection line from the protection block to the tower. 54
Document technical content created by M J Maytum
2014 Copyright of M J Maytum
For licence permissions contact [email protected]
4
Remote RadioUnit RRUProtection
Powering: BlueSignal: Yellow
Lightning Rod
Base BandUnit RBU
Tower orMast
Protection
55
Figure 2 — Protection (red block) applied to DC powering feed at tower base and top 56
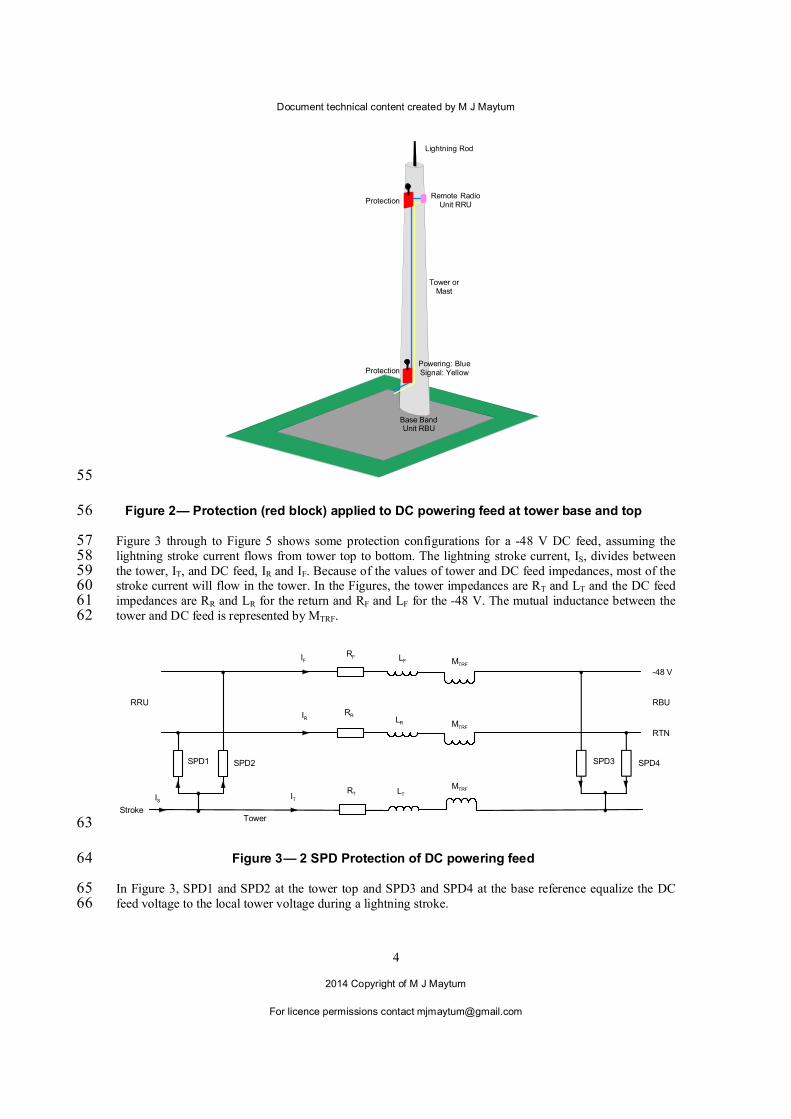
Figure 3 through to Figure 5 shows some protection configurations for a -48 V DC feed, assuming the 57 lightning stroke current flows from tower top to bottom. The lightning stroke current, IS, divides between 58 the tower, IT, and DC feed, IR and IF. Because of the values of tower and DC feed impedances, most of the 59 stroke current will flow in the tower. In the Figures, the tower impedances are RT and LT and the DC feed 60 impedances are RR and LR for the return and RF and LF for the -48 V. The mutual inductance between the 61 tower and DC feed is represented by MTRF. 62
-48 V
RTN
SPD4SPD3
SPD2SPD1
RBURRU
TowerStroke
IS IT
RR
RT
LR
LT
MTRF
IR
RF LFIF
MTRF
MTRF
63
Figure 3 — 2 SPD Protection of DC powering feed 64
In Figure 3, SPD1 and SPD2 at the tower top and SPD3 and SPD4 at the base reference equalize the DC 65 feed voltage to the local tower voltage during a lightning stroke. 66
Document technical content created by M J Maytum
2014 Copyright of M J Maytum
For licence permissions contact [email protected]
5
SPD1
SPD2
SPD3
-48 V
RTN
SPD4
SPD5
SPD6
RBURRU
TowerStroke
IS IT
RR
RT
LR
LT
MTRF
IR
RF LFIF
MTRF
MTRF
67
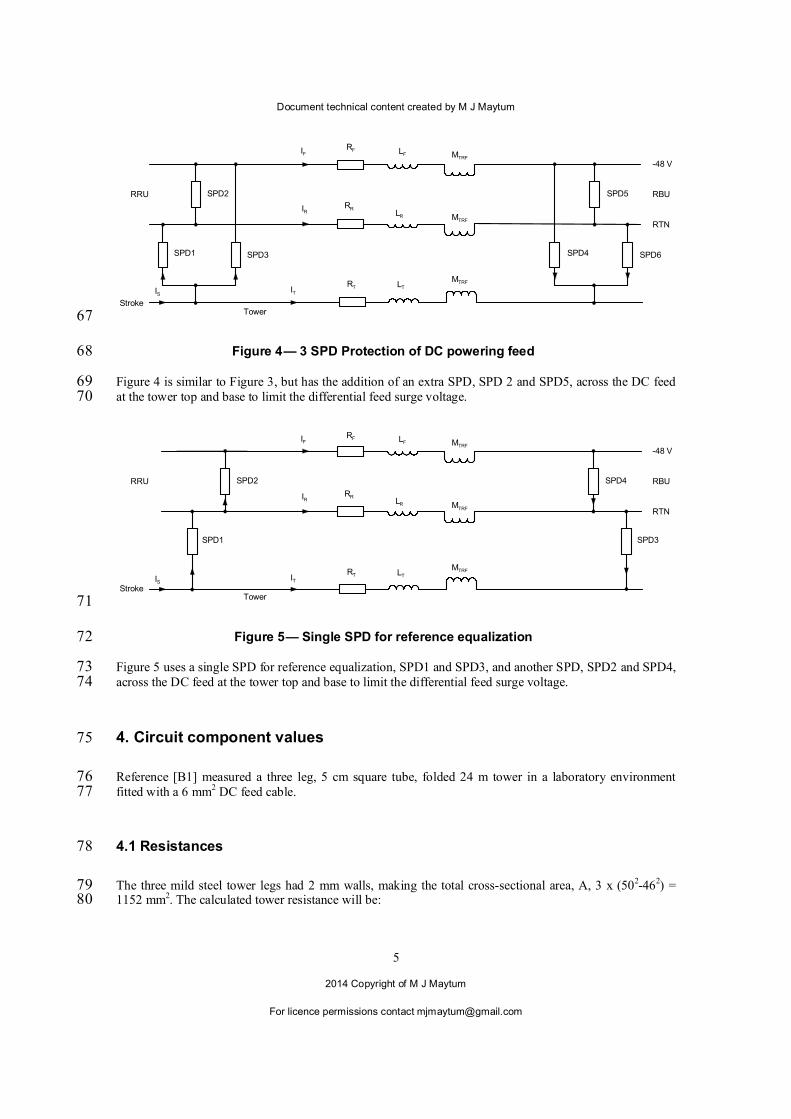
Figure 4 — 3 SPD Protection of DC powering feed 68
Figure 4 is similar to Figure 3, but has the addition of an extra SPD, SPD 2 and SPD5, across the DC feed 69 at the tower top and base to limit the differential feed surge voltage. 70
SPD1
SPD2
-48 V
RTN
SPD3
SPD4 RBURRU
TowerStroke
IS IT
RR
RT
LR
LT
MTRF
IR
RF LFIF
MTRF
MTRF
71
Figure 5 — Single SPD for reference equalization 72
Figure 5 uses a single SPD for reference equalization, SPD1 and SPD3, and another SPD, SPD2 and SPD4, 73 across the DC feed at the tower top and base to limit the differential feed surge voltage. 74
4. Circuit component values 75
Reference [B1] measured a three leg, 5 cm square tube, folded 24 m tower in a laboratory environment 76 fitted with a 6 mm2 DC feed cable. 77
4.1 Resistances 78
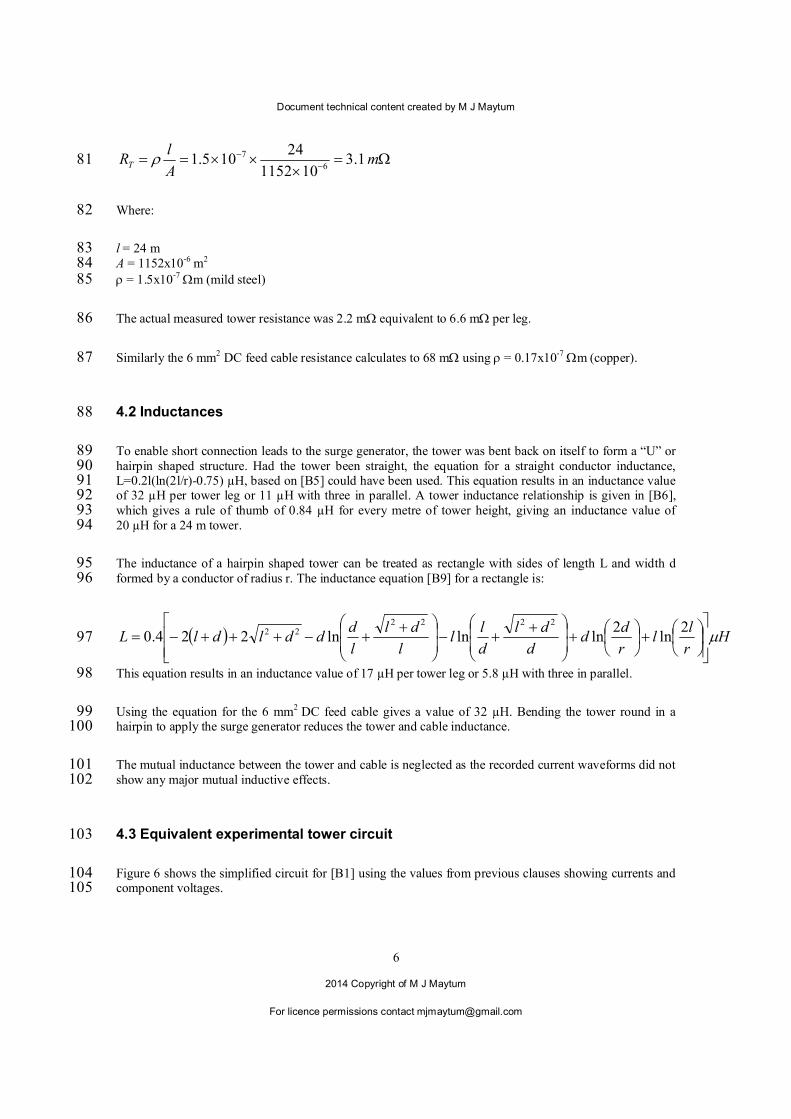
The three mild steel tower legs had 2 mm walls, making the total cross-sectional area, A, 3 x (502-462) = 79 1152 mm2. The calculated tower resistance will be: 80
Document technical content created by M J Maytum
2014 Copyright of M J Maytum
For licence permissions contact [email protected]
6
mA
lRT 1.3
101152
24105.1
6
7 81
Where: 82
l = 24 m 83 A = 1152x10-6 m2 84 = 1.5x10⁻⁷ m (mild steel) 85
The actual measured tower resistance was 2.2 m equivalent to 6.6 m per leg. 86
Similarly the 6 mm2 DC feed cable resistance calculates to 68 m using = 0.17x10⁻⁷ m (copper). 87
4.2 Inductances 88
To enable short connection leads to the surge generator, the tower was bent back on itself to form a “U” or 89 hairpin shaped structure. Had the tower been straight, the equation for a straight conductor inductance, 90 L=0.2l(ln(2l/r)-0.75) µH, based on [B5] could have been used. This equation results in an inductance value 91 of 32 µH per tower leg or 11 µH with three in parallel. A tower inductance relationship is given in [B6], 92 which gives a rule of thumb of 0.84 µH for every metre of tower height, giving an inductance value of 93 20 µH for a 24 m tower. 94
The inductance of a hairpin shaped tower can be treated as rectangle with sides of length L and width d 95 formed by a conductor of radius r. The inductance equation [B9] for a rectangle is: 96
Hr
ll
r
dd
d
dl
d
ll
l
dl
l
dddldlL
2ln
2lnlnln224.0
22222297
This equation results in an inductance value of 17 µH per tower leg or 5.8 µH with three in parallel. 98
Using the equation for the 6 mm2 DC feed cable gives a value of 32 µH. Bending the tower round in a 99
hairpin to apply the surge generator reduces the tower and cable inductance. 100
The mutual inductance between the tower and cable is neglected as the recorded current waveforms did not 101 show any major mutual inductive effects. 102
4.3 Equivalent experimental tower circuit 103
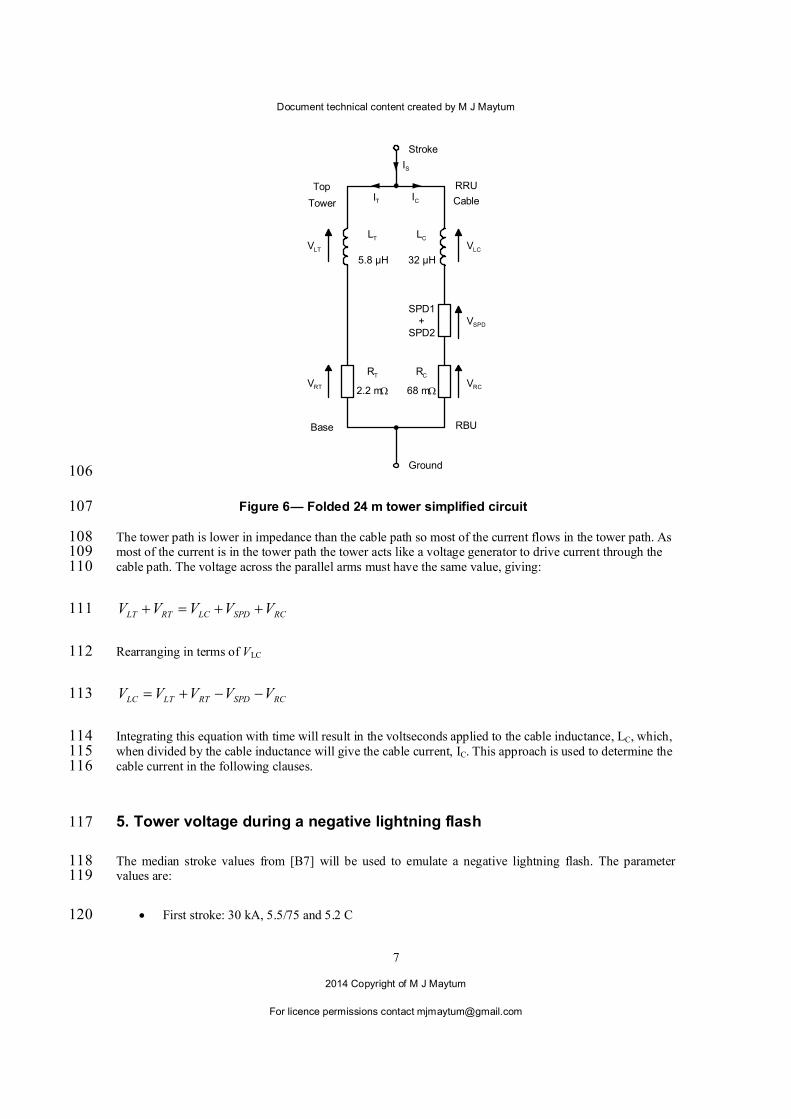
Figure 6 shows the simplified circuit for [B1] using the values from previous clauses showing currents and 104 component voltages. 105
Document technical content created by M J Maytum
2014 Copyright of M J Maytum
For licence permissions contact [email protected]
7
SPD1+
SPD2
RBU
RRUTop
Stroke
LC
IT
32 µH
Cable
LT
5.8 µH
IC
RT RC
68 m2.2 m
VLC
Base
VLT
VRCVRT
VSPD
Tower
IS
Ground 106
Figure 6 — Folded 24 m tower simplified circuit 107
The tower path is lower in impedance than the cable path so most of the current flows in the tower path. As 108 most of the current is in the tower path the tower acts like a voltage generator to drive current through the 109 cable path. The voltage across the parallel arms must have the same value, giving: 110
RCSPDLCRTLT VVVVV 111
Rearranging in terms of VLC 112
RCSPDRTLTLC VVVVV 113
Integrating this equation with time will result in the voltseconds applied to the cable inductance, LC, which, 114 when divided by the cable inductance will give the cable current, IC. This approach is used to determine the 115 cable current in the following clauses. 116
5. Tower voltage during a negative lightning flash 117
The median stroke values from [B7] will be used to emulate a negative lightning flash. The parameter 118 values are: 119
First stroke: 30 kA, 5.5/75 and 5.2 C 120
Document technical content created by M J Maytum
2014 Copyright of M J Maytum
For licence permissions contact [email protected]
8
Subsequent strokes: 12 kA, 1.1/32 and 1.4 C 121
Inter-stroke interval: 60 ms 122
Subsequent stroke number: 3 to 5 123
5.1 First stroke 124
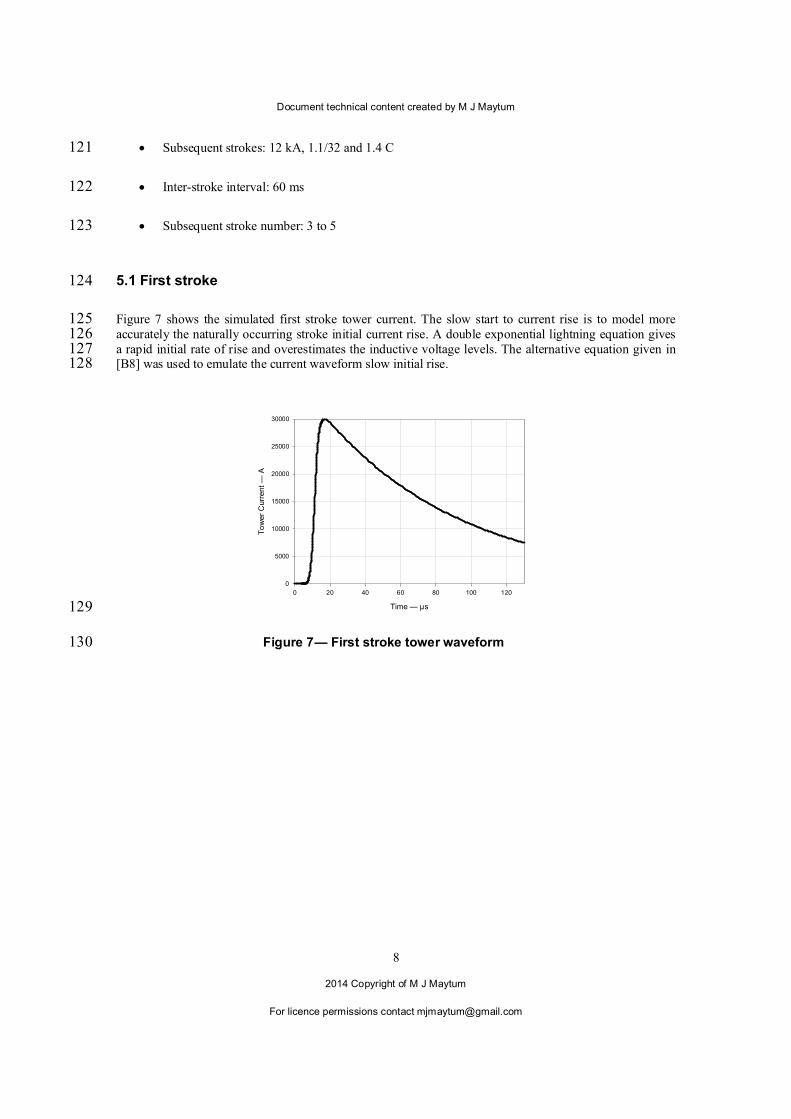
Figure 7 shows the simulated first stroke tower current. The slow start to current rise is to model more 125 accurately the naturally occurring stroke initial current rise. A double exponential lightning equation gives 126 a rapid initial rate of rise and overestimates the inductive voltage levels. The alternative equation given in 127 [B8] was used to emulate the current waveform slow initial rise. 128
Time — µs
0 20 40 60 80 100 120
To
wer
Curr
en
t —
A
0
5000
10000
15000
20000
25000
30000
129
Figure 7 — First stroke tower waveform 130
Document technical content created by M J Maytum
2014 Copyright of M J Maytum
For licence permissions contact [email protected]
9
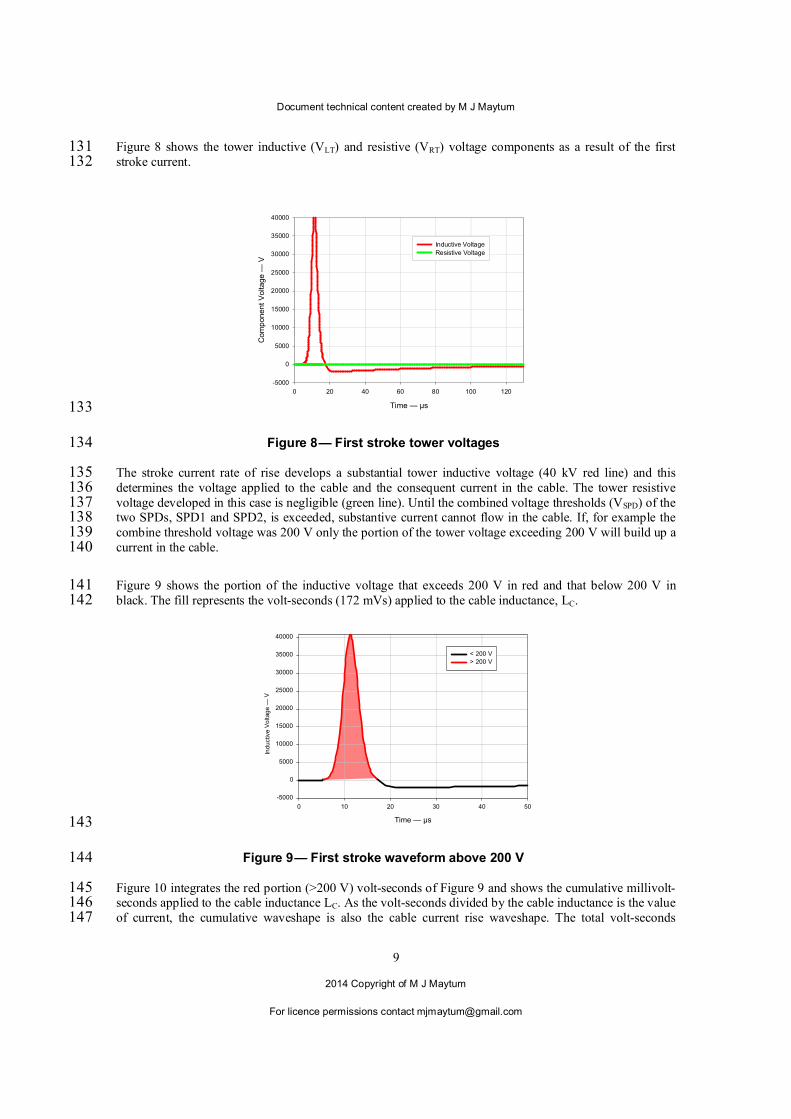
Figure 8 shows the tower inductive (VLT) and resistive (VRT) voltage components as a result of the first 131 stroke current. 132
time µ vs i
Time — µs
0 20 40 60 80 100 120
Com
ponent
Volta
ge —
V
-5000
0
5000
10000
15000
20000
25000
30000
35000
40000
Inductive Voltage
Resistive Voltage
133
Figure 8 — First stroke tower voltages 134
The stroke current rate of rise develops a substantial tower inductive voltage (40 kV red line) and this 135 determines the voltage applied to the cable and the consequent current in the cable. The tower resistive 136 voltage developed in this case is negligible (green line). Until the combined voltage thresholds (VSPD) of the 137 two SPDs, SPD1 and SPD2, is exceeded, substantive current cannot flow in the cable. If, for example the 138 combine threshold voltage was 200 V only the portion of the tower voltage exceeding 200 V will build up a 139 current in the cable. 140
Figure 9 shows the portion of the inductive voltage that exceeds 200 V in red and that below 200 V in 141 black. The fill represents the volt-seconds (172 mVs) applied to the cable inductance, LC. 142
Time — µs
0 10 20 30 40 50
Ind
uctiv
e V
oltag
e —
V
-5000
0
5000
10000
15000
20000
25000
30000
35000
40000
< 200 V
> 200 V
143
Figure 9 — First stroke waveform above 200 V 144
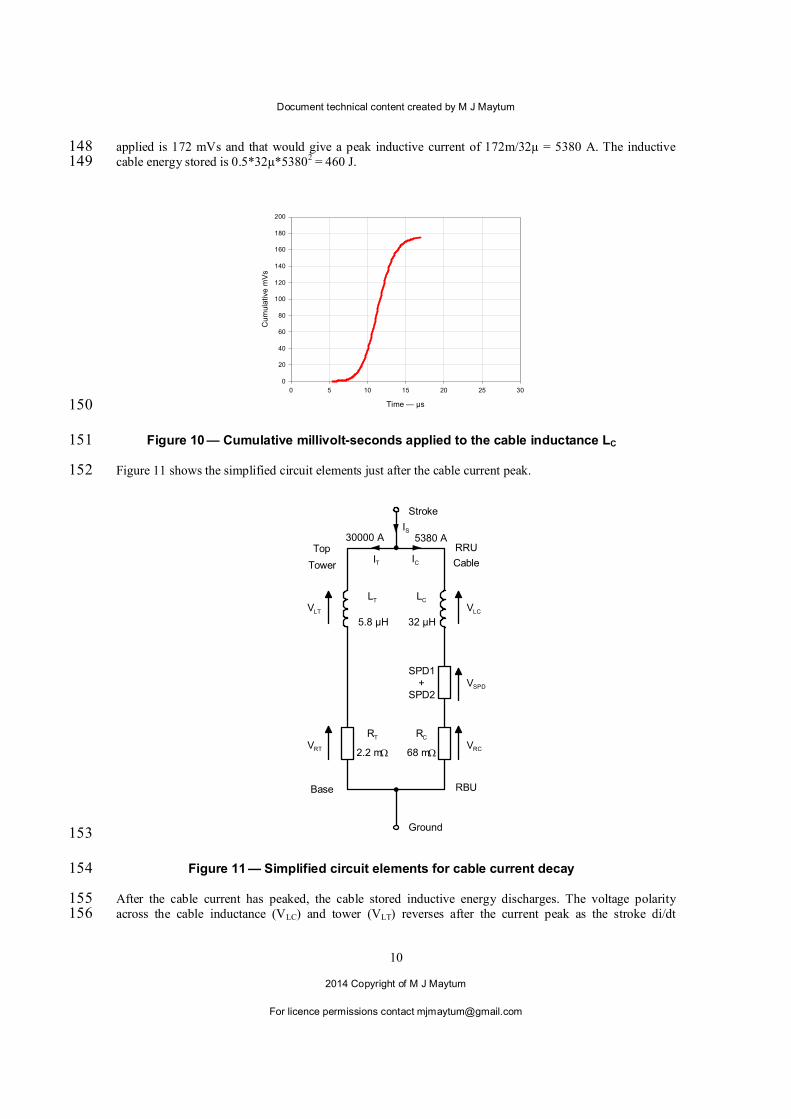
Figure 10 integrates the red portion (>200 V) volt-seconds of Figure 9 and shows the cumulative millivolt-145 seconds applied to the cable inductance LC. As the volt-seconds divided by the cable inductance is the value 146 of current, the cumulative waveshape is also the cable current rise waveshape. The total volt-seconds 147
Document technical content created by M J Maytum
2014 Copyright of M J Maytum
For licence permissions contact [email protected]
10
applied is 172 mVs and that would give a peak inductive current of 172m/32µ = 5380 A. The inductive 148 cable energy stored is 0.5*32µ*53802 = 460 J. 149
Time — µs
0 5 10 15 20 25 30
Cu
mula
tive
mV
s
0
20
40
60
80
100
120
140
160
180
200
150
Figure 10 — Cumulative millivolt-seconds applied to the cable inductance LC 151
Figure 11 shows the simplified circuit elements just after the cable current peak. 152
SPD1+
SPD2
RBU
RRUTop
Stroke
LC
IT
32 µH
Cable
LT
5.8 µH
IC
RT RC
68 m2.2 m
VLC
Base
VLT
VRCVRT
VSPD
Tower
IS
Ground
5380 A30000 A
153
Figure 11 — Simplified circuit elements for cable current decay 154
After the cable current has peaked, the cable stored inductive energy discharges. The voltage polarity 155 across the cable inductance (VLC) and tower (VLT) reverses after the current peak as the stroke di/dt 156
Document technical content created by M J Maytum
2014 Copyright of M J Maytum
For licence permissions contact [email protected]
11
becomes negative. The voltage across the cable inductance will essentially be the combined SPD clamping 157 voltages of SPD1 and SPD2 (200 V) and the tower voltage. The previous voltage equation becomes 158
RCSPDRTLTLC VVVVV 159
The modified equation shows that the combined SPD voltage now adds to the tower voltage instead of 160 subtracting from it, so reducing the time for the cable inductive energy to discharge. 161
Time — µs
25 50 75 100 125 150 175 200
Tow
er
+ S
PD
vo
ltag
e a
fte
r cu
rre
nt p
ea
k —
V
-2500
-2000
-1500
-1000
-500
0
162
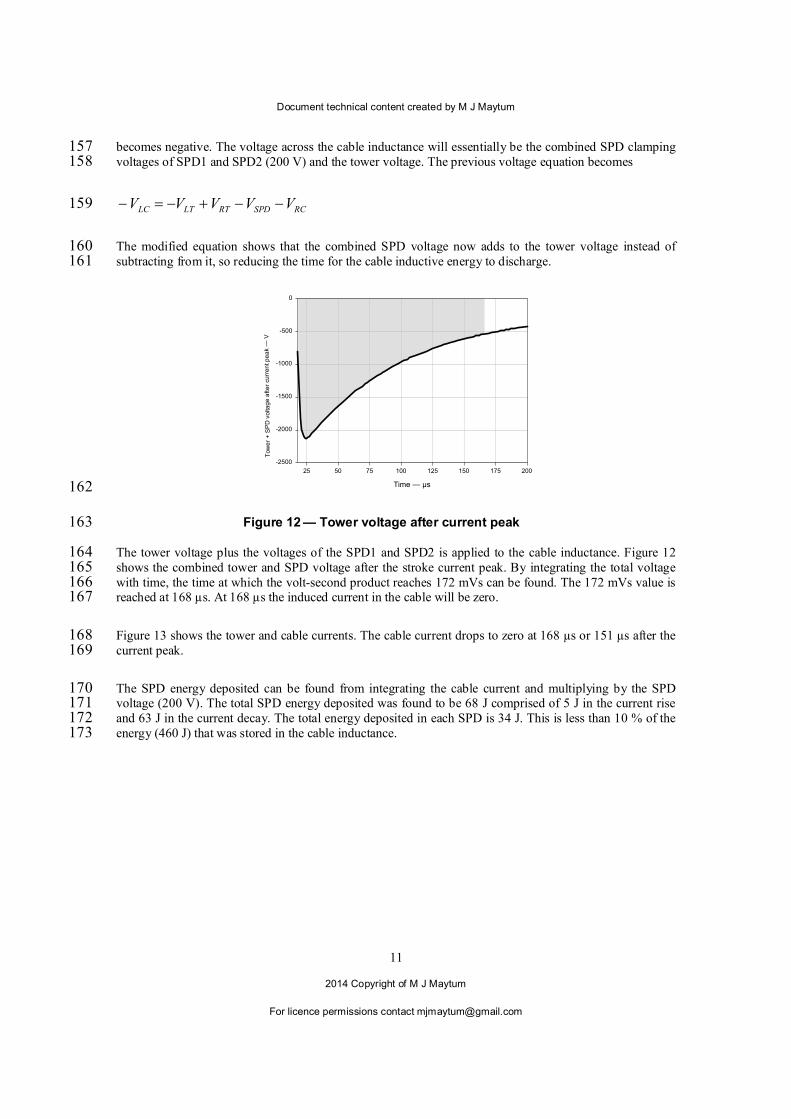
Figure 12 — Tower voltage after current peak 163
The tower voltage plus the voltages of the SPD1 and SPD2 is applied to the cable inductance. Figure 12 164 shows the combined tower and SPD voltage after the stroke current peak. By integrating the total voltage 165 with time, the time at which the volt-second product reaches 172 mVs can be found. The 172 mVs value is 166 reached at 168 µs. At 168 µs the induced current in the cable will be zero. 167
Figure 13 shows the tower and cable currents. The cable current drops to zero at 168 µs or 151 µs after the 168 current peak. 169
The SPD energy deposited can be found from integrating the cable current and multiplying by the SPD 170 voltage (200 V). The total SPD energy deposited was found to be 68 J comprised of 5 J in the current rise 171 and 63 J in the current decay. The total energy deposited in each SPD is 34 J. This is less than 10 % of the 172 energy (460 J) that was stored in the cable inductance. 173
Document technical content created by M J Maytum
2014 Copyright of M J Maytum
For licence permissions contact [email protected]
12
Time — µs
0 50 100 150 200 250
First
str
oke t
ow
er
curr
ent
— A
0
5000
10000
15000
20000
25000
30000
Cable
Cu
rrent —
A
0
1000
2000
3000
4000
5000
6000
First stroke tower current
Cable current
174
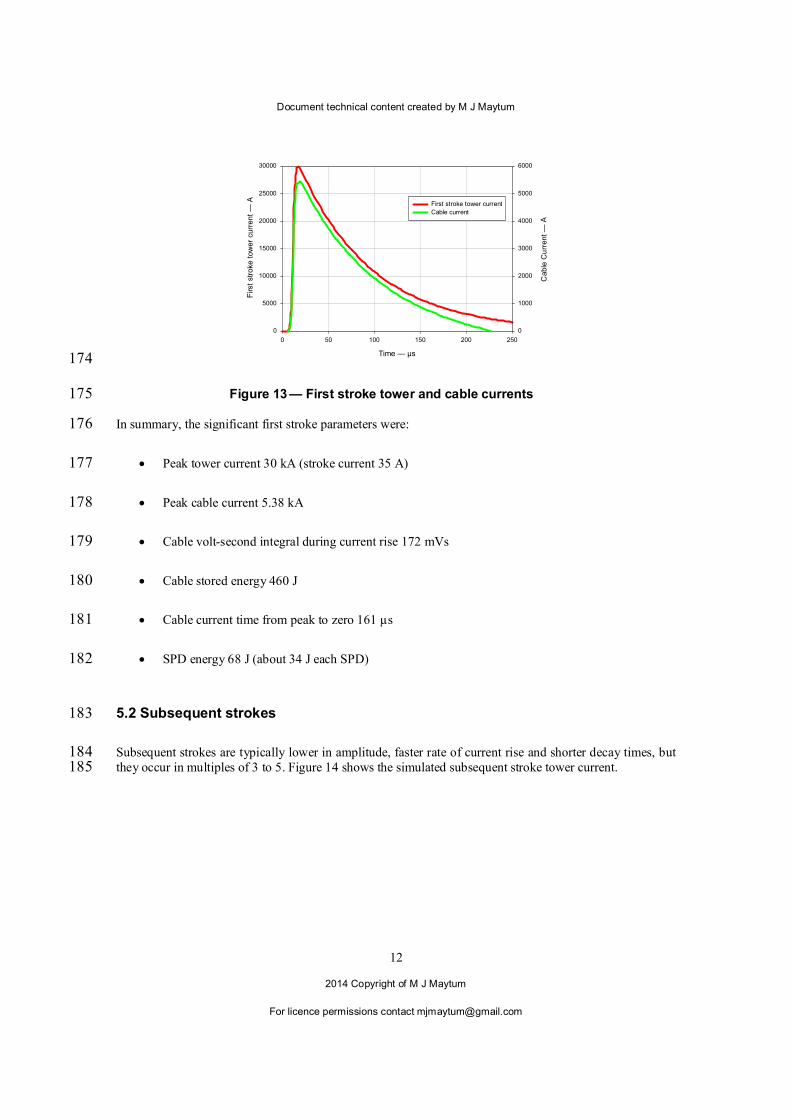
Figure 13 — First stroke tower and cable currents 175
In summary, the significant first stroke parameters were: 176
Peak tower current 30 kA (stroke current 35 A) 177
Peak cable current 5.38 kA 178
Cable volt-second integral during current rise 172 mVs 179
Cable stored energy 460 J 180
Cable current time from peak to zero 161 µs 181
SPD energy 68 J (about 34 J each SPD) 182
5.2 Subsequent strokes 183
Subsequent strokes are typically lower in amplitude, faster rate of current rise and shorter decay times, but 184 they occur in multiples of 3 to 5. Figure 14 shows the simulated subsequent stroke tower current. 185
Document technical content created by M J Maytum
2014 Copyright of M J Maytum
For licence permissions contact [email protected]
13
Time — µs
0 10 20 30 40 50 60 70 80 90 100
Subsequ
ent str
oke tow
er
curr
ent
— A
0
1000
2000
3000
4000
5000
6000
7000
8000
9000
10000
11000
12000
13000
186
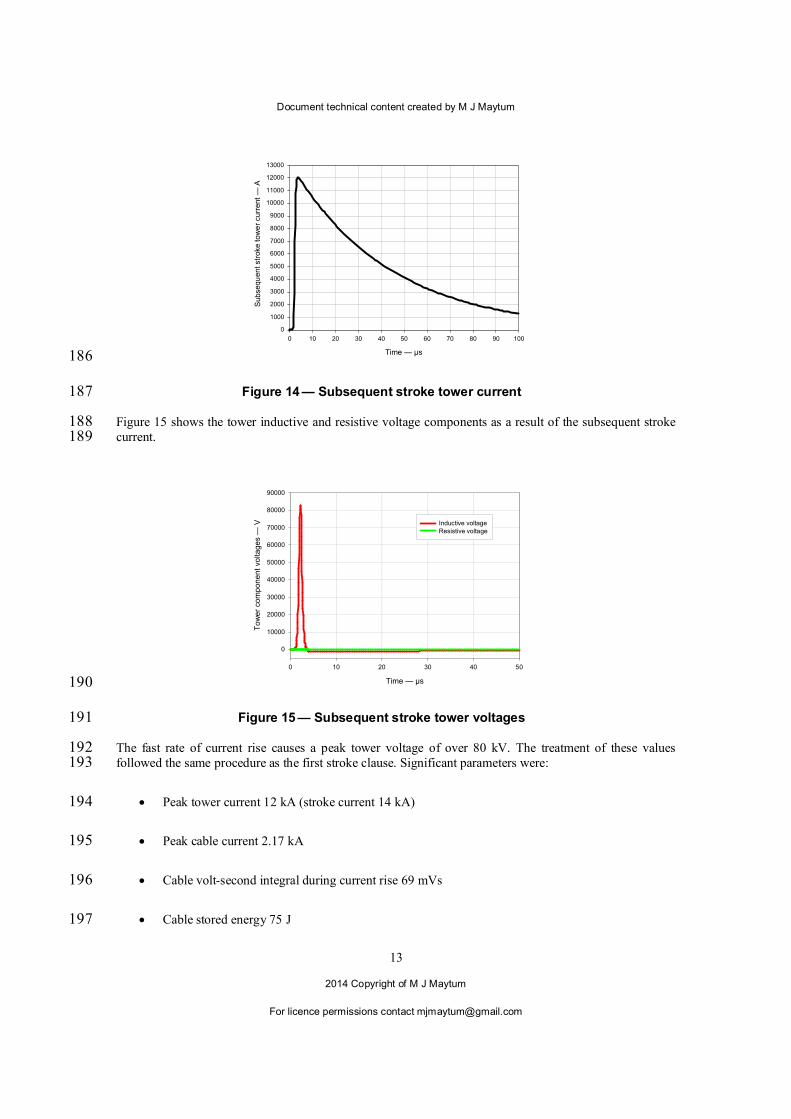
Figure 14 — Subsequent stroke tower current 187
Figure 15 shows the tower inductive and resistive voltage components as a result of the subsequent stroke 188 current. 189
Time — µs
0 10 20 30 40 50
To
we
r co
mp
on
en
t vo
ltag
es
— V
0
10000
20000
30000
40000
50000
60000
70000
80000
90000
Inductive voltageResistive voltage
190
Figure 15 — Subsequent stroke tower voltages 191
The fast rate of current rise causes a peak tower voltage of over 80 kV. The treatment of these values 192 followed the same procedure as the first stroke clause. Significant parameters were: 193
Peak tower current 12 kA (stroke current 14 kA) 194
Peak cable current 2.17 kA 195
Cable volt-second integral during current rise 69 mVs 196
Cable stored energy 75 J 197
Document technical content created by M J Maytum
2014 Copyright of M J Maytum
For licence permissions contact [email protected]
14
Cable current time from peak to zero 70 µs 198
SPD energy 13 J (about 7 J each SPD) 199
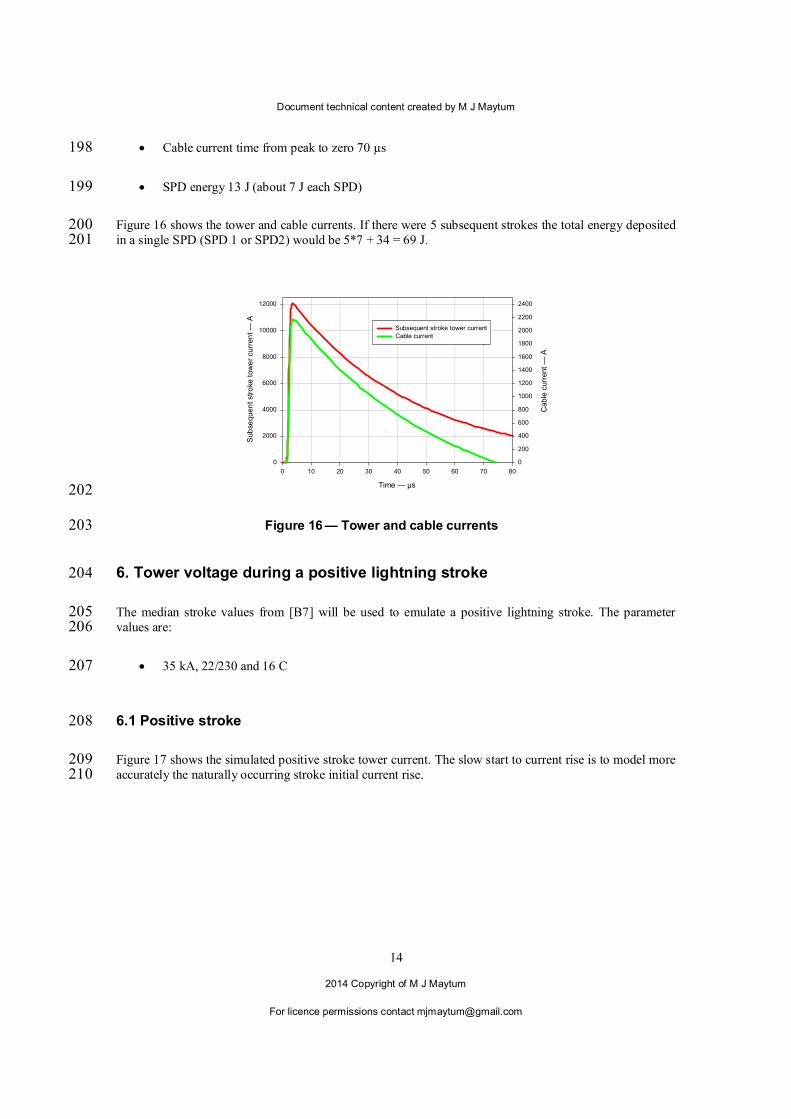
Figure 16 shows the tower and cable currents. If there were 5 subsequent strokes the total energy deposited 200 in a single SPD (SPD 1 or SPD2) would be 5*7 + 34 = 69 J. 201
Time — µs
0 10 20 30 40 50 60 70 80
Sub
sequen
t str
oke
tow
er
curr
en
t —
A
0
2000
4000
6000
8000
10000
12000
Cab
le c
urr
ent
— A
0
200
400
600
800
1000
1200
1400
1600
1800
2000
2200
2400
Subsequent stroke tower current
Cable current
202
Figure 16 — Tower and cable currents 203
6. Tower voltage during a positive lightning stroke 204
The median stroke values from [B7] will be used to emulate a positive lightning stroke. The parameter 205 values are: 206
35 kA, 22/230 and 16 C 207
6.1 Positive stroke 208
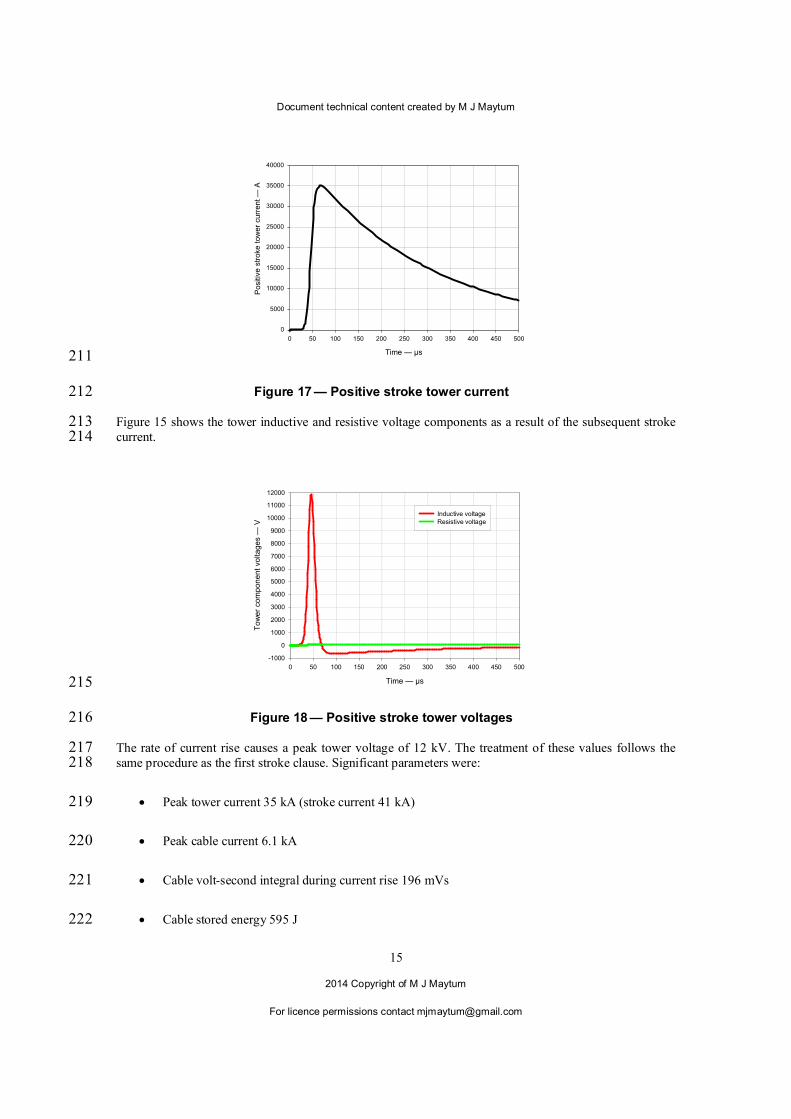
Figure 17 shows the simulated positive stroke tower current. The slow start to current rise is to model more 209 accurately the naturally occurring stroke initial current rise. 210
Document technical content created by M J Maytum
2014 Copyright of M J Maytum
For licence permissions contact [email protected]
15
Time — µs
0 50 100 150 200 250 300 350 400 450 500
Positiv
e s
troke t
ow
er
curr
ent —
A
0
5000
10000
15000
20000
25000
30000
35000
40000
211
Figure 17 — Positive stroke tower current 212
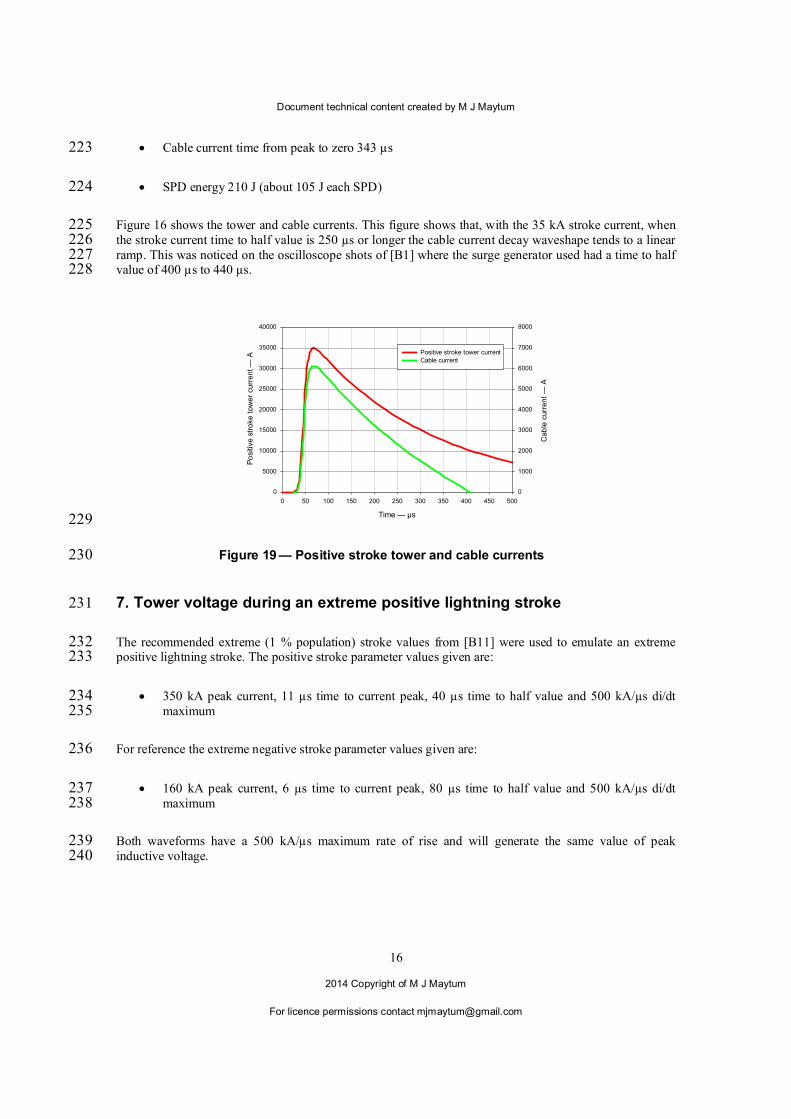
Figure 15 shows the tower inductive and resistive voltage components as a result of the subsequent stroke 213 current. 214
Time — µs
0 50 100 150 200 250 300 350 400 450 500
To
we
r co
mp
on
en
t vo
ltag
es
— V
-1000
0
1000
2000
3000
4000
5000
6000
7000
8000
9000
10000
11000
12000
Inductive voltageResistive voltage
215
Figure 18 — Positive stroke tower voltages 216
The rate of current rise causes a peak tower voltage of 12 kV. The treatment of these values follows the 217 same procedure as the first stroke clause. Significant parameters were: 218
Peak tower current 35 kA (stroke current 41 kA) 219
Peak cable current 6.1 kA 220
Cable volt-second integral during current rise 196 mVs 221
Cable stored energy 595 J 222
Document technical content created by M J Maytum
2014 Copyright of M J Maytum
For licence permissions contact [email protected]
16
Cable current time from peak to zero 343 µs 223
SPD energy 210 J (about 105 J each SPD) 224
Figure 16 shows the tower and cable currents. This figure shows that, with the 35 kA stroke current, when 225 the stroke current time to half value is 250 µs or longer the cable current decay waveshape tends to a linear 226 ramp. This was noticed on the oscilloscope shots of [B1] where the surge generator used had a time to half 227 value of 400 µs to 440 µs. 228
Time — µs
0 50 100 150 200 250 300 350 400 450 500
Po
siti
ve s
troke t
ow
er
curr
ent —
A
0
5000
10000
15000
20000
25000
30000
35000
40000
Cab
le c
urr
ent
— A
0
1000
2000
3000
4000
5000
6000
7000
8000
Positive stroke tower current
Cable current
229
Figure 19 — Positive stroke tower and cable currents 230
7. Tower voltage during an extreme positive lightning stroke 231
The recommended extreme (1 % population) stroke values from [B11] were used to emulate an extreme 232 positive lightning stroke. The positive stroke parameter values given are: 233
350 kA peak current, 11 µs time to current peak, 40 µs time to half value and 500 kA/µs di/dt 234 maximum 235
For reference the extreme negative stroke parameter values given are: 236
160 kA peak current, 6 µs time to current peak, 80 µs time to half value and 500 kA/µs di/dt 237 maximum 238
Both waveforms have a 500 kA/µs maximum rate of rise and will generate the same value of peak 239 inductive voltage. 240
Document technical content created by M J Maytum
2014 Copyright of M J Maytum
For licence permissions contact [email protected]
17
7.1 Extreme positive stroke 241
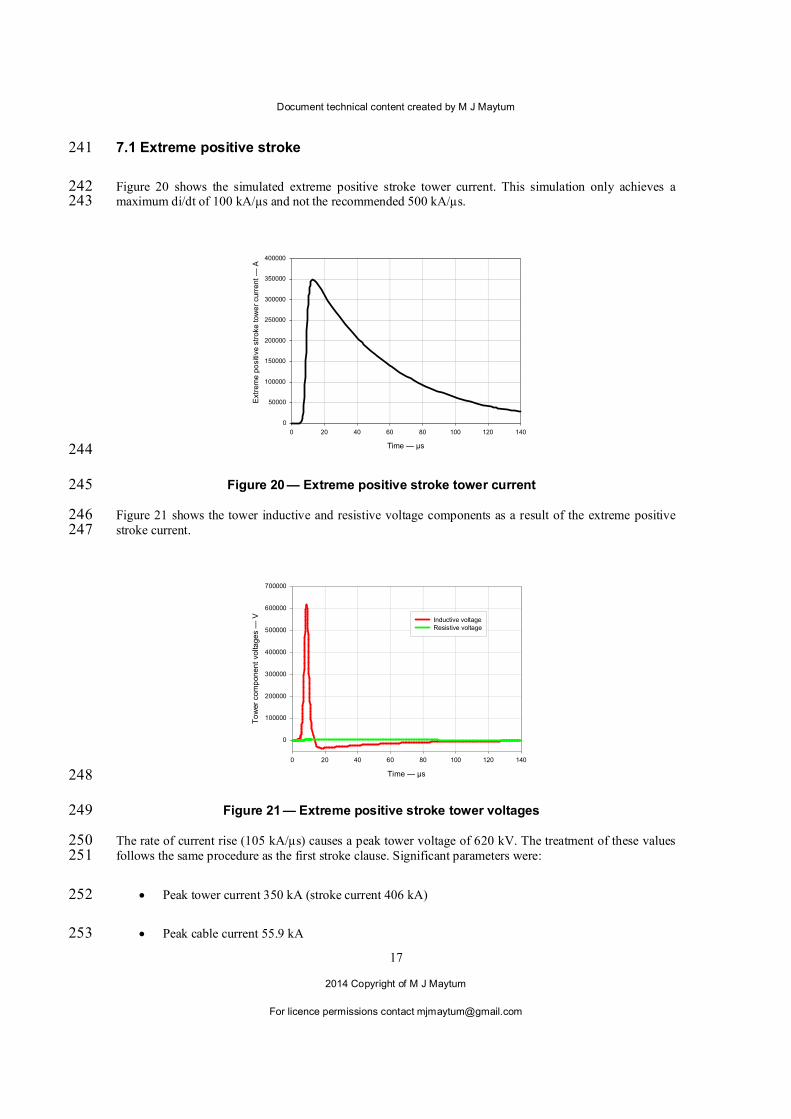
Figure 20 shows the simulated extreme positive stroke tower current. This simulation only achieves a 242 maximum di/dt of 100 kA/µs and not the recommended 500 kA/µs. 243
Time — µs
0 20 40 60 80 100 120 140
Extr
em
e p
ositi
ve s
troke tow
er
curr
ent
— A
0
50000
100000
150000
200000
250000
300000
350000
400000
244
Figure 20 — Extreme positive stroke tower current 245
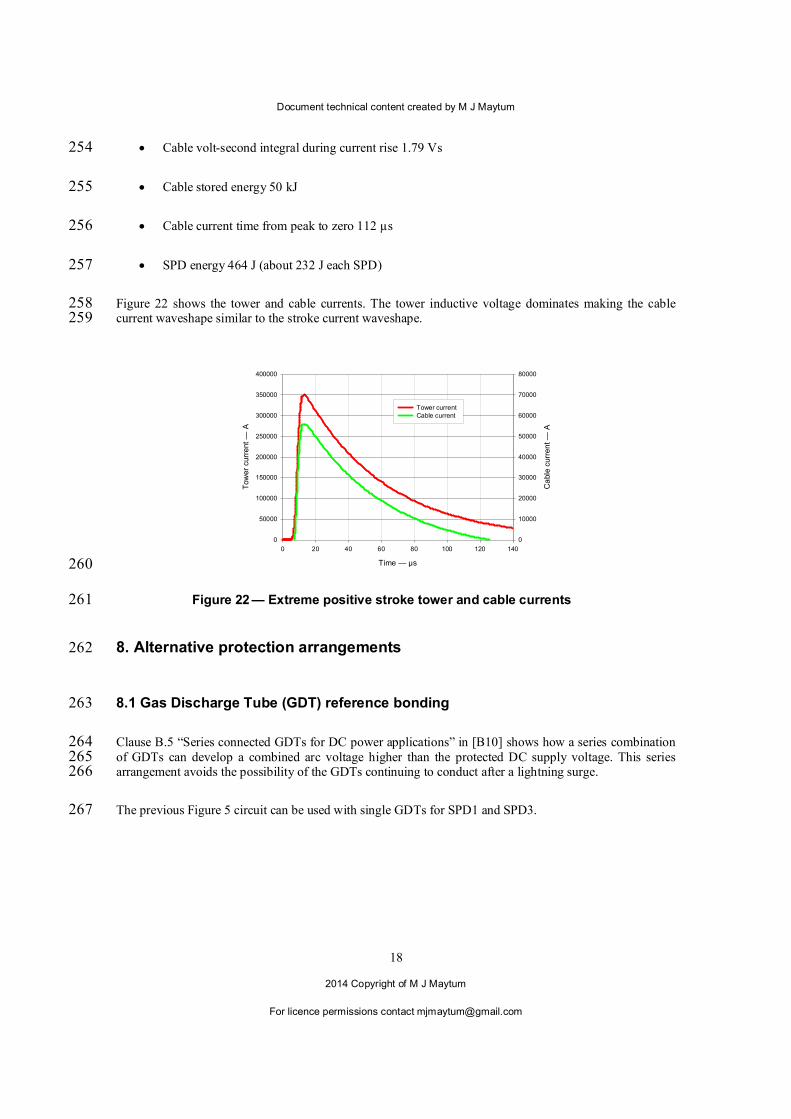
Figure 21 shows the tower inductive and resistive voltage components as a result of the extreme positive 246 stroke current. 247
Time — µs
0 20 40 60 80 100 120 140
To
wer
com
ponent
volta
ges
— V
0
100000
200000
300000
400000
500000
600000
700000
Inductive voltageResistive voltage
248
Figure 21 — Extreme positive stroke tower voltages 249
The rate of current rise (105 kA/µs) causes a peak tower voltage of 620 kV. The treatment of these values 250 follows the same procedure as the first stroke clause. Significant parameters were: 251
Peak tower current 350 kA (stroke current 406 kA) 252
Peak cable current 55.9 kA 253
Document technical content created by M J Maytum
2014 Copyright of M J Maytum
For licence permissions contact [email protected]
18
Cable volt-second integral during current rise 1.79 Vs 254
Cable stored energy 50 kJ 255
Cable current time from peak to zero 112 µs 256
SPD energy 464 J (about 232 J each SPD) 257
Figure 22 shows the tower and cable currents. The tower inductive voltage dominates making the cable 258 current waveshape similar to the stroke current waveshape. 259
Time — µs
0 20 40 60 80 100 120 140
Tow
er
curr
ent —
A
0
50000
100000
150000
200000
250000
300000
350000
400000
Ca
ble
curr
ent —
A0
10000
20000
30000
40000
50000
60000
70000
80000
Tower current Cable current
260
Figure 22 — Extreme positive stroke tower and cable currents 261
8. Alternative protection arrangements 262
8.1 Gas Discharge Tube (GDT) reference bonding 263
Clause B.5 “Series connected GDTs for DC power applications” in [B10] shows how a series combination 264 of GDTs can develop a combined arc voltage higher than the protected DC supply voltage. This series 265 arrangement avoids the possibility of the GDTs continuing to conduct after a lightning surge. 266
The previous Figure 5 circuit can be used with single GDTs for SPD1 and SPD3. 267
Document technical content created by M J Maytum
2014 Copyright of M J Maytum
For licence permissions contact [email protected]
19
SPD1
SPD2
-48 V
RTN
SPD3
SPD4 RBURRU
TowerStroke
IS IT
RR
RT
LR
LT
MTRF
IR
RF LFIF
MTRF
MTRF
268
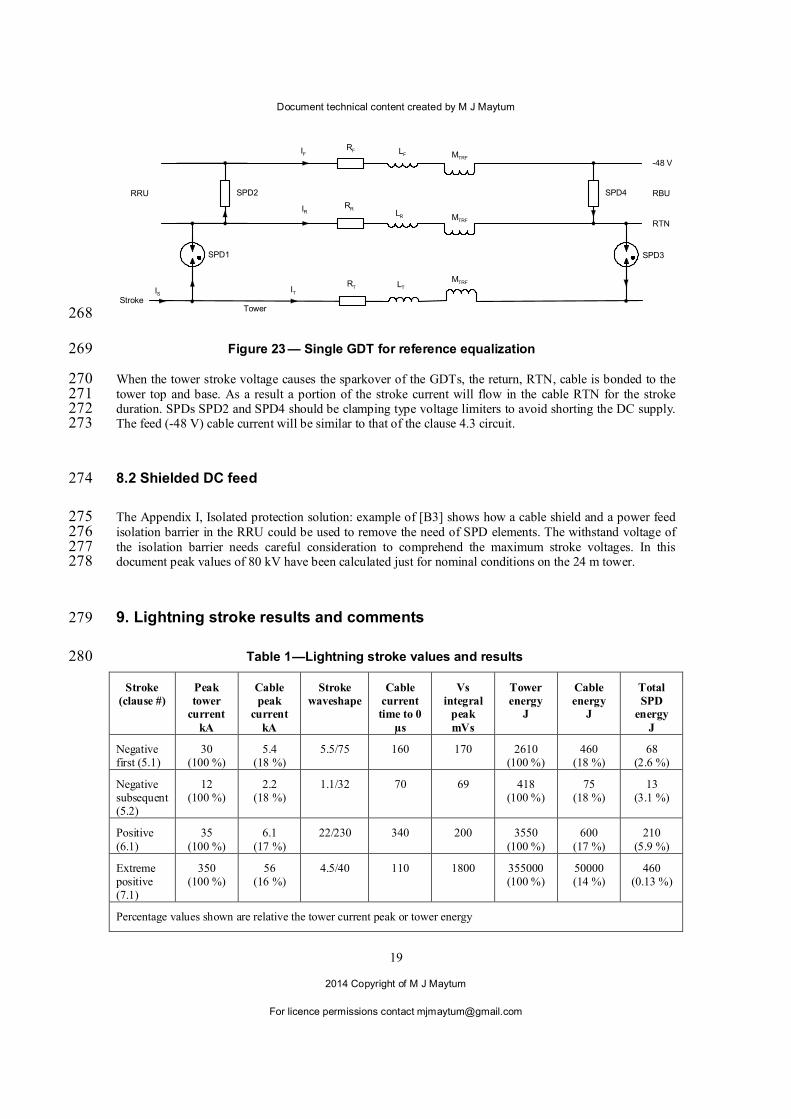
Figure 23 — Single GDT for reference equalization 269
When the tower stroke voltage causes the sparkover of the GDTs, the return, RTN, cable is bonded to the 270 tower top and base. As a result a portion of the stroke current will flow in the cable RTN for the stroke 271 duration. SPDs SPD2 and SPD4 should be clamping type voltage limiters to avoid shorting the DC supply. 272 The feed (-48 V) cable current will be similar to that of the clause 4.3 circuit. 273
8.2 Shielded DC feed 274
The Appendix I, Isolated protection solution: example of [B3] shows how a cable shield and a power feed 275 isolation barrier in the RRU could be used to remove the need of SPD elements. The withstand voltage of 276 the isolation barrier needs careful consideration to comprehend the maximum stroke voltages. In this 277 document peak values of 80 kV have been calculated just for nominal conditions on the 24 m tower. 278
9. Lightning stroke results and comments 279
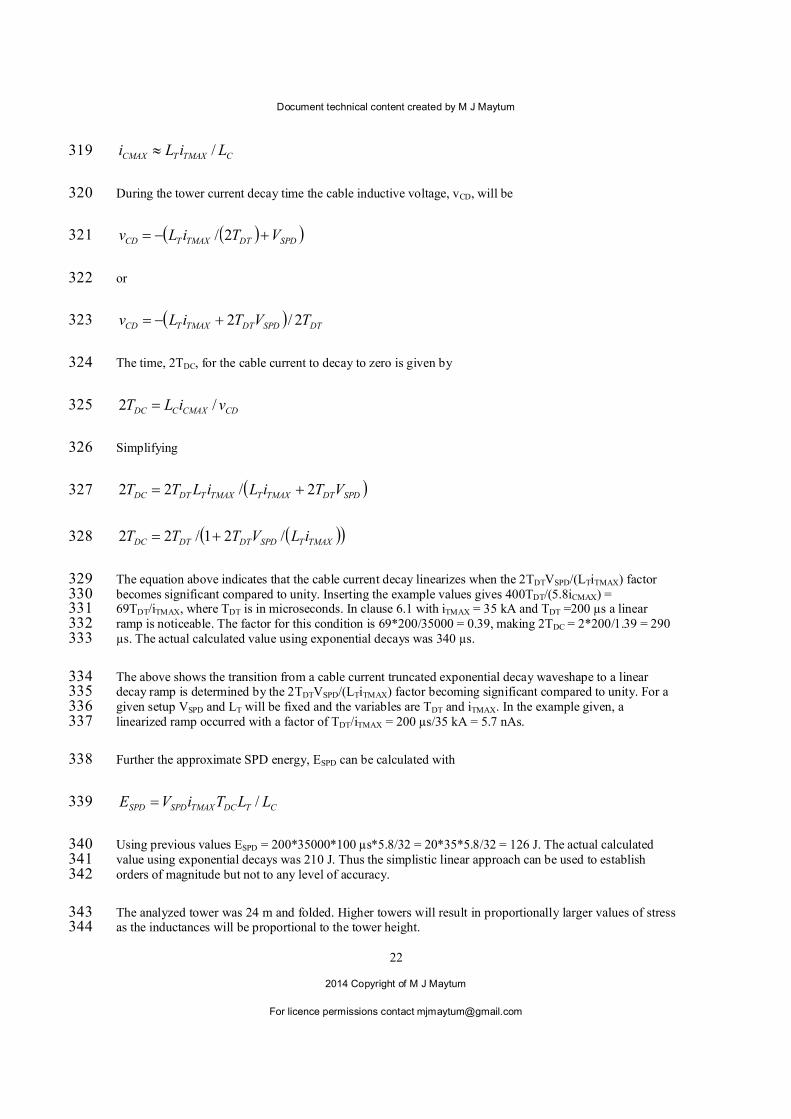
Table 1 —Lightning stroke values and results 280
Stroke (clause #)
Peak tower
current kA
Cable peak
current kA
Stroke waveshape
Cable current time to 0
µs
Vs integral
peak mVs
Tower energy
J
Cable energy
J
Total SPD
energy J
Negative first (5.1)
30 (100 %)
5.4 (18 %)
5.5/75 160 170 2610 (100 %)
460 (18 %)
68 (2.6 %)
Negative subsequent (5.2)
12 (100 %)
2.2 (18 %)
1.1/32 70 69 418 (100 %)
75 (18 %)
13 (3.1 %)
Positive (6.1)
35 (100 %)
6.1 (17 %)
22/230 340 200 3550 (100 %)
600 (17 %)
210 (5.9 %)
Extreme positive (7.1)
350 (100 %)
56 (16 %)
4.5/40 110 1800 355000 (100 %)
50000 (14 %)
460 (0.13 %)
Percentage values shown are relative the tower current peak or tower energy
Document technical content created by M J Maytum
2014 Copyright of M J Maytum
For licence permissions contact [email protected]
20
Table 1 results were obtained by the following procedure: 281
1) Estimate the inductive and resistive components of the tower and DC feed cable. 282
2) Define the lightning stroke waveform applied to the model. 283
3) Assume most of the stroke current flows in the tower 284
4) Calculate the tower voltage from the stroke current and the tower inductance and resistance. 285
(in this example the resistive voltage was negligible) 286
5) Subtract the nominal SPD voltage from the result of 4). 287
6) Integrate the result of 5) with time to give a cumulative Vs waveform. 288
7) Divide the result of 6) by the cable inductance to give the SPD current versus time waveform. 289
8) Multiply the result of 7) by the nominal SPD voltage to give the SPD power versus time waveform. 290
9) Integrate the result of 8) for the cable current duration time to give the SPD cumulative energy. 291
Only a nominal value of SPD clamping voltage was used. A further refinement of this procedure would be 292 to incorporate a model for the SPD clamping voltage versus current. 293
The lightning parameters used for analysis of the first three table data rows were median stroke values from 294 [B7]. The forth extreme positive stroke row used recommendations from [B11], which represents the more 295 stressful values occurring in the field. For a given amplitude of stroke current, the energy deposited into the 296 SPD increases with increasing time to half value of the stroke. Longer times, over about 250 µs, to half 297 value cause the SPD current decay waveshape to approach a linear ramp. 298
The transition from a truncated stroke waveshape to a linear ramp warrants further investigation. The 299 following (simplistic) approach provides some indication of the transition region. The actual tower current, 300 iT, can be approximated to: 301
TC
CST LLL
ii 302
Where: 303
iS = Peak stroke current 304 LT = Tower inductance 305 LC = Cable inductance 306
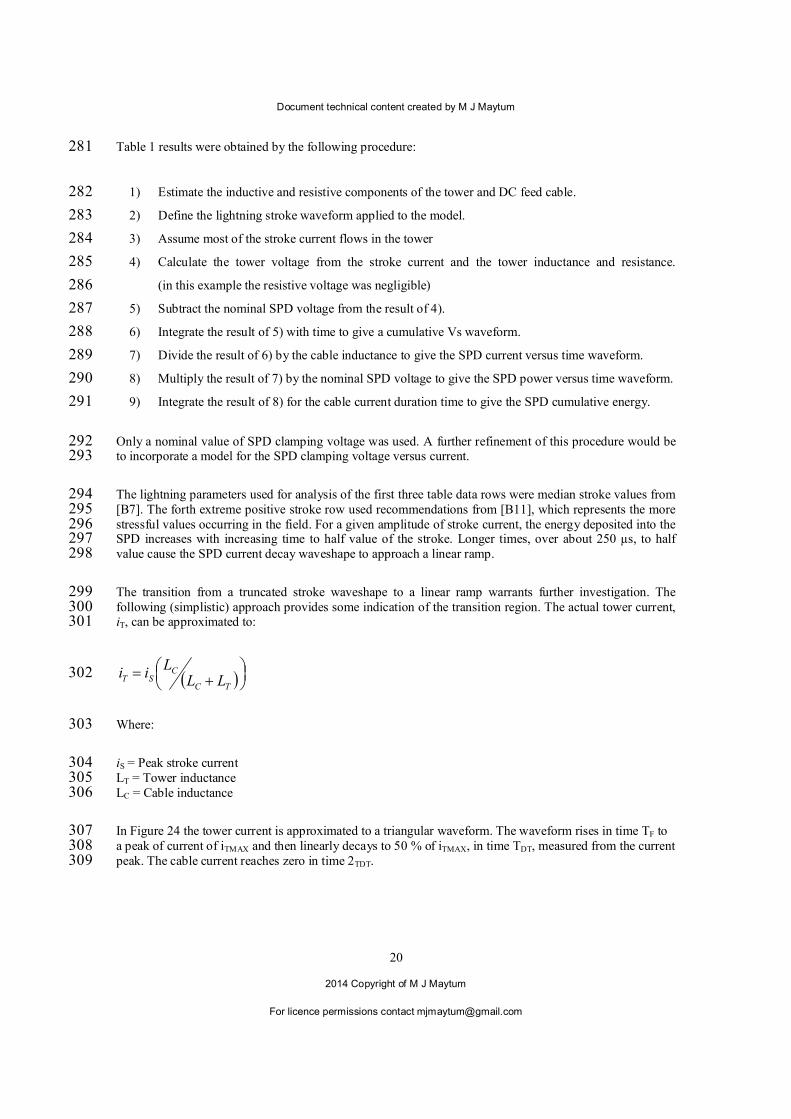
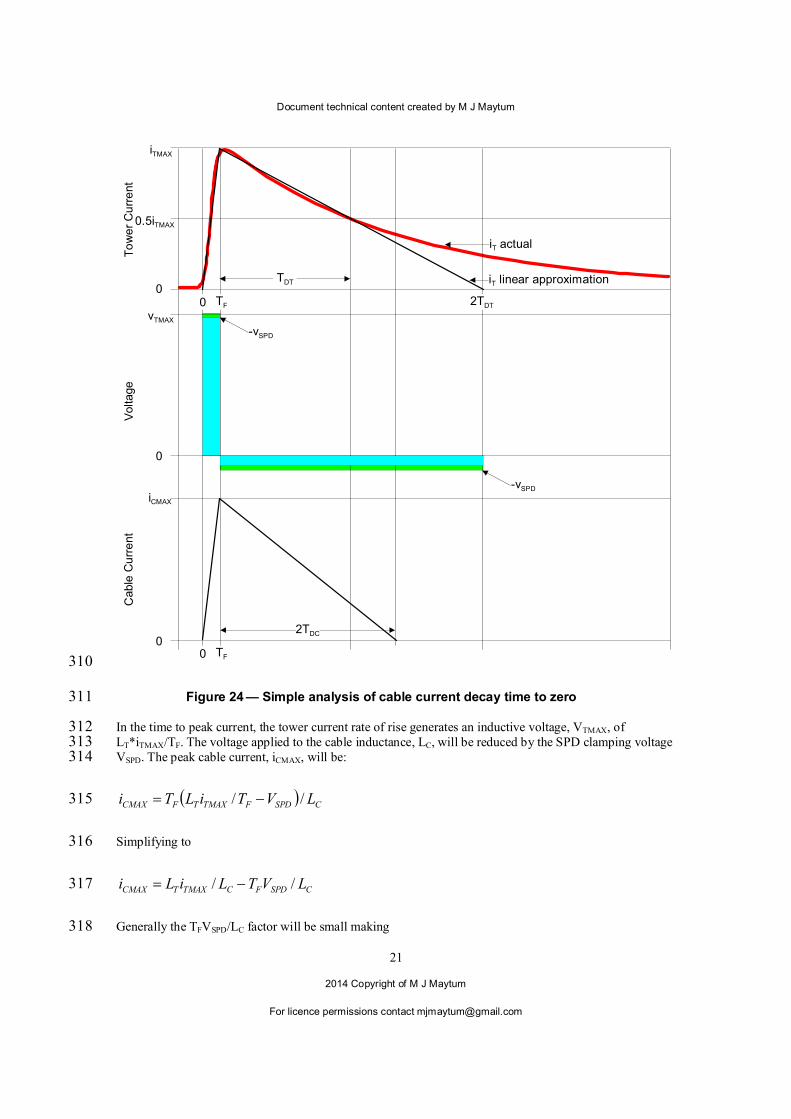
In Figure 24 the tower current is approximated to a triangular waveform. The waveform rises in time TF to 307 a peak of current of iTMAX and then linearly decays to 50 % of iTMAX, in time TDT, measured from the current 308 peak. The cable current reaches zero in time 2TDT. 309
Document technical content created by M J Maytum
2014 Copyright of M J Maytum
For licence permissions contact [email protected]
21
Voltage
To
we
r C
urr
ent
Cable
Cu
rre
nt
0
0
0
iCMAX
iTMAX
vTMAX
-vSPD
-vSPD
0.5iTMAX
2TDTTF0
TF0
iT actual
iT linear approximationTDT
2TDC
310
Figure 24 — Simple analysis of cable current decay time to zero 311
In the time to peak current, the tower current rate of rise generates an inductive voltage, VTMAX, of 312 LT*iTMAX/TF. The voltage applied to the cable inductance, LC, will be reduced by the SPD clamping voltage 313 VSPD. The peak cable current, iCMAX, will be: 314
CSPDFTMAXTFCMAX LVTiLTi // 315
Simplifying to 316
CSPDFCTMAXTCMAX LVTLiLi // 317
Generally the TFVSPD/LC factor will be small making 318
Document technical content created by M J Maytum
2014 Copyright of M J Maytum
For licence permissions contact [email protected]
22
CTMAXTCMAX LiLi / 319
During the tower current decay time the cable inductive voltage, vCD, will be 320
SPDDTTMAXTCD VTiLv 2/ 321
or 322
DTSPDDTTMAXTCD TVTiLv 2/2 323
The time, 2TDC, for the cable current to decay to zero is given by 324
CDCMAXCDC viLT /2 325
Simplifying 326
SPDDTTMAXTTMAXTDTDC VTiLiLTT 2/22 327
TMAXTSPDDTDTDC iLVTTT /21/22 328
The equation above indicates that the cable current decay linearizes when the 2TDTVSPD/(LTiTMAX) factor 329 becomes significant compared to unity. Inserting the example values gives 400TDT/(5.8iCMAX) = 330 69TDT/iTMAX, where TDT is in microseconds. In clause 6.1 with iTMAX = 35 kA and TDT =200 µs a linear 331 ramp is noticeable. The factor for this condition is 69*200/35000 = 0.39, making 2TDC = 2*200/1.39 = 290 332 µs. The actual calculated value using exponential decays was 340 µs. 333
The above shows the transition from a cable current truncated exponential decay waveshape to a linear 334 decay ramp is determined by the 2TDTVSPD/(LTiTMAX) factor becoming significant compared to unity. For a 335 given setup VSPD and LT will be fixed and the variables are TDT and iTMAX. In the example given, a 336 linearized ramp occurred with a factor of TDT/iTMAX = 200 µs/35 kA = 5.7 nAs. 337
Further the approximate SPD energy, ESPD can be calculated with 338
CTDCTMAXSPDSPD LLTiVE / 339
Using previous values ESPD = 200*35000*100 µs*5.8/32 = 20*35*5.8/32 = 126 J. The actual calculated 340 value using exponential decays was 210 J. Thus the simplistic linear approach can be used to establish 341 orders of magnitude but not to any level of accuracy. 342
The analyzed tower was 24 m and folded. Higher towers will result in proportionally larger values of stress 343 as the inductances will be proportional to the tower height. 344
Document technical content created by M J Maytum
2014 Copyright of M J Maytum
For licence permissions contact [email protected]
23
Annex A 345 346
(informative) 347 348
Bibliography 349
These bibliographical references provide background information, but do not need to be consulted to 350 understand this document. 351
[B1] Mr Politis Zafiris, Lightning current through MOV based SPDs in RRH applications, Raycap SA 352
[B2] Mick Maytum, Towering Powering protection problem on Remote Radio Head (RRH) cellular 353 systems, PEG 2012 Conference 354
[B3] ITU-T Recommendation K.97 (02/2014): Lightning protection of distributed base stations 355
[B4] IEEE Std 1100-1999 - IEEE Recommended Practice for Powering and Grounding Electronic 356 Equipment 357
[B5] IEEE Std 518-1982 - IEEE Guide for the Installation of Electrical Equipment to Minimize Electrical 358 Noise Inputs to Controllers from External Sources 359
[B6] E. A. Williams, G. A. Jones, D. H. Layer, T. G. Osenkowsky, National Association of Broadcasters 360 Engineering Handbook, Focal Press 361
[B7] CIGRÉ (Council on Large Electric Systems) Technical Bulletin (TB) 549 (2013), Lightning 362 Parameters for Engineering Applications 363
[B8] F. Heidler, Z. Flisowski, W. Zischank, C. Mazzetti, Parameters of lightning current given in IEC 364 62305 – Background, Experience and Outlook, 29th International Conference on Lightning Protection, 365 23rd – 26th June 2008 – Uppsala, Sweden 366
[B9] Rectangular loop inductance, 367 http://www.cvel.clemson.edu/emc/calculators/Inductance_Calculator/rectgl.html, Clemson University, 368 retrieved 2014-10-28 369
[B10] IEEE PC62.42.1 - Draft Guide for the Application of Surge-Protective Components in Surge 370 Protective Devices and Equipment Ports - Gas Discharge Tubes (GDTs) 371
[B11] W. R. Gamerota, J. O. Elisme, M. A. Uman and V. A. Rakov, Current Waveforms for Lightning 372 Simulation, IEEE Transactions on Electromagnetic Compatibility, Vol. 54, No. 4, August 2012, pp 880-888 373