Embed Size (px)
Citation preview
REMOTE SENSING AND CIS FOR ASSESSING THE IMPACT OF
INTEGRATED WATERSHED MANAGEMENT
Dissertation work submitted in partial ti~llill~ncnt of'
Requirement for the award o f dcgree 01'
MASTER 01 'fECHNO1,OGY
in
F<NVIRONMENTAL MANAGIJILII<N 1
Ry
L,eya Sathyan
T 63581 CENT RE FOR ENVIRONM'N 1 Institute of Science and Technology
.IAWAI IARLAI, NEHRU TECt-(NOI,OGICAL IJNIVI.RS1 I Y Kukatpally, tlyderabad-500 072
2005
International Crops Research Institute for the Semi-Arid Tropics Headquarters: Palancheru 502 324, Andhra Prddosh Indl3 4 T d 4. 4030 l l3071 Fax +Ql 40 30713074 +.I UO 307l30,5 Emdl crts8t@cg~arorg '? '. ?
ICRISAT ~la lsan Oftrce-CG Centers Rlork NASC Co~nplcx ~ c v Prokacn Shsstri ~ a r q N?.V Drlhl 110 012 1hdi.i 7',rri .
To1 191 1 1 25H48552'2584255Yi5R49554 Fax 191 1 1 25811784
aad lCll l I I IL8lrnlrr LIII I IUIPYI' , C i , S i ' NaliOl, ICRII IT*IM.. I L,,,UII~*,I,I"It","PCY nil",." Y O I N l ll &l.FP,IIN":)*. (n.PDn*,*YllEl*, , ~ * , o " * * Y I * C I ,
Pl sV. lo*, ,WI MI"- O,.lm,l, , _ PIR,. I I* hilObl "8ibii(
3@ wun wrurnqv %",,>, h,,-> N,*r,".,lur 7-1 .a5 l iii:,,ll,lm,,w I* .nBI1YITLI I., . , A . ,,. ., r*, .>I? ,=,a >?>.,,
A Far ,zb2 > TOflB8 r.. - M 1 ( 6 1 1 * 1 r.. .I., 1 5 , ( , I Far 12,181119 I",.,, u,r,lr*"quj,n"( Im . , lu .~ r~"nn , r " ,a , l , m., , , .,, ,.,. c - I r n . l ~ C " l l l . C ~ ~ I I L I I
CGl AR Cent~r W i t US at www.lcnrat.org --
CENTRE FOR ENVIRONMENT INSTITUTE OF SCIENCE 8 TECHNOLOGY
JAWAHARLAL NEHRU TECHNOLOGICAL UNIVERSITY Kukatpally. Hyderabad - 500 072
Dr.P.MNKATESWARLU Ph.0.
Associate Professor
C E R T I F I C A T E
Thls is to certify that the dissertation work enbtled " REMOTE SENSING P.ND
GIs FOR ASSESSING THE IMPACT OF INTEGRATED WATERSHED
MANAGEMENT " submitted by LEYA SATHYAN in partla1 fulfillment for the award of
Master of Technology in Environmental Management to JAWAHARLAL NEHRU
TECHNOLOGICAL UNIVERSITY, Hyderabad. It IS a record of bonafide work carr~ed
out by her under my Internal Guidance Her work is found to be satisfactory
The result embodied In this d~ssertation have not been submitted to any
University or Institute for the award of any degree or diploma
INSTITUTE OF SCIENCE 8 TECHNOLOGY
JAWAHARLAL NEHRU TECHNOLOGICAL UNNERSITY
Kukatpally, Hyderabad - 500 072
I / Wu ccrtil) that t l ~ c di>\eTtiltio~i worh untitled "REMOTE SENSING AND GIs
FOR ASSESSING THE IMPACT OF INTEGRATED WATERSHED MANAGEMENT"
suhmittcd hy 1.E:YA S A T l l Y A N in partial l'ullillmcnt thc M;~\tcr <>I-
I'cchnolog> 1)cga-cc of the I)cpnrtincrit i, n hori:ilidc \ \ (~rh . and #nay be placcd
hcfbrc the I.xaani~ialic)n Isoard li,r their c<,n>ideratic)n.
'fhc dissel-tation work entitled "IZEM<)I'E SENSING A N D <;IS FOR
ASSESSING T H E IMI'A<:.I' OF INTEGRATED WATEIZSHEI)
MANAGEMENT" has been carried out by mc at I<'I<ISA.I',
I':rtancl~cru,llytlcraI~ad, Indi:~ and NItSA, 13alanagar, llytlclabatl, Indi:~.
I'llis work is original and Iias bccn submitted to any university or inst i t~~tc
fbr the award of any degree.
Wit11 deep sonsc o f hc;lrtlLll gratitude. I \\auld like to acknoaledgc I)r.S.P.WANI, I'rincipal Scientist (Watersheds), ICIIISA'I', I 'a lascl iar~~. Hytlcrabad I;I~ giving mc the opportu~~ity. his hilid help. ~ ~ ~ l ~ o h l c SUFFCS~~OIIZ . CIIO~ITIOLIS P;II~CIICC :III~ ablo gt~id;l~lce throughout this work.
I sincerely thaok I'rof.M.AN.II REDDY. Hc:ld, ccIItrc for E t ~ v i r o t ~ ~ i i ~ n t . .J.N.'l'.IJ. Hyderahad Ibr lhis able. scliolnrly guid;~ncc and eticour;~ge~ncnl :I( every le\,cl during the period ol'study.
1 . .~~hno\vledgi- . . my hinoere and soul l i~ l gratitude to. I)r.I'.VENKATESII\VAI<LIJ, Associate I'rofessor Ccntrc for Envirosnlent, .J.N.I'.II. Hyderabatl Ihr lhis help. st~ggcstions and cncot~ragc~hicrit during the project ~ 5 n r l pcric~d. WIIO wit11 hi, l inicly ;idvicc pmvidcd a r ig l~ t direction to 111y Ilioughts.
I si~hccrcly 111a11k Ilr. It.S.I)WIVI<I)I, I lead o f Agl.icaltsre and Soils (;roep, NRSA. 1Sal;111agar, I l y c l c r a l ~ d IIII~ 1)r. K.V.I<AMANA. Scie~~t is t , NItSA, Ilalanagar. l iw tlicir timely adi'ice, enorm~ius patielice and pcrrn~vhio~~ t i 1 avail the sol'i\v;~re. Il:lrd\<nrc and other hcil i l ies avail:~hlc in thc prestigious center ol 'NRSA.
I am very ~ i iuch thatiklul to Irsl iad A l io~e t l (Scict~ l i f ic Officer) ;ant1 M.tl.Rl(~isuddie (Assoeialc (;IS), ICRISAT, I';~l:~ncl~aro, I lydr~. ;~ l~at l Ibr their coc~peratiol~ th~-ouyl~out tlic study period.
I \vi>li to ~pI;~ce o t ~ record rn? deep >cn>c 0 1 z l - , ~ t ~ ~ t ~ d c to I)r.SatisI~ ( ' l~andra, Visitis:: Scictltist (lCI1ISAI'). h l n d l ~ u s ~ i d l i a ~ l ~ , h1:ldllya 1'1-adcsh. . l i tandcr Gedani, Visit ing Scientist (I('I<ISA'r'),llu~~di,l(ajastl~;~~ :and tlic IIICIII~I~~S o f I M I F Ibr t l ie~r coopcrntiri~h. aupport and 11cll1 during tllc l icld visit .
ABSTRACT
The ever-growing population and the resultant demand led to over
exploitation of the finite natural resources in most of the parts of India in general and
in Madllya I'radesh and Rajasthan in particular. The Indian economy is largely a
rural one, hence the development of rural areas depends upon the optimum
management ot natural resources particularly the water resources. A drainage basin
or ;.:ate; shed wn be considered as a preferable unit for initiating water conservation
and management practices. Watershed management is an integration of technology
wit11 in the natural boundaries of a drainage basin for land, hydrological, biotic and
\,cgctativc resources development to f~~lfill the population needs on sustainable basis.
In the present work an attempt is made to create resource information system and to
make an impact assessment study of watershed activities in selected watersheds
spread in two states of India using the satellite data interpretation technique and GIs
toolh. 111 the s t ~ ~ d y area (ICKISAT) Intcrnational Crop Kesearcli Institute of Scmi Arid
Tn1pic.s in association with (BAIF) Bhartiya Agro Industrirs Foundation have
initi'ltcd home \vatershed treatment activities in the year 1998 consisting of structures
like earthcn chcck dam, permanent check dam, farm ponds and stcip dams. This
wo~-k created databasc both spatial and non-spatial with the lielp of (501) Survey of
Indid t ~ i p < ~ . ; h ~ ; t ~ and In~lian ~emotc sensing satellite imageries for the period
3004.l'hc data b,lrc~ consisteci ot drainage map (representing all tlic streams up to 4th
order, Idnd~~sc/landco~~er map etc. All the thematic layerc arc integrated with sncio-
c i<~n(~ ln i c attribulc intormation detailing about the socio-economic slatus of the area
1'0 cvaluatc the impact of the structures constructed the Remote Sensing technology
(EKDAS Sottwarc 8.7) and CIS tools (Arc-Info 8.0) are used to create the (NDVI)
Norrnalized Differential Vegetative Index to understand the change in terms of
vegetative indices. Satellite imageries of 1997 that is before the commencement of
watershed treatment activities and imageries o f 2004 that is attcr five years uf
initiation of watershed treatment, arc interpreted adopting digital ilnagc processirrg
concept to generate the N13VI. The positive and negative impact:. can bc. clearly
established with this approach. In terms of socio-economic statuh also the imp,rct
created is examined considering the parameter, basic amenitirs, literacy rate,
migration of labour, per capita income etc for tlie same periods.
The cursory examination of the water level data along with change in number
of wells says that as a whole in spite of significant increase in the number o i open
wells, tube wells and hand pumps from 1997-2004, there is an remarked increase in
the groundwater table level though there is no con.;idcr.rblc chdngc in tlie ~lvcragc
annual rainfall. The NUVl study also reveals that there is a significant dritt towards
the positive value corlveying an increased grceriness index. l 'he yield impacts ot
certain identified crops like jowar, maize and hajara express an average ilrcrease from
five to ten quintals per hectare
The impact assessment indicators developrd in this study will serve as a
model to adopt clsewlrere under similar e~lvironm~.nts.
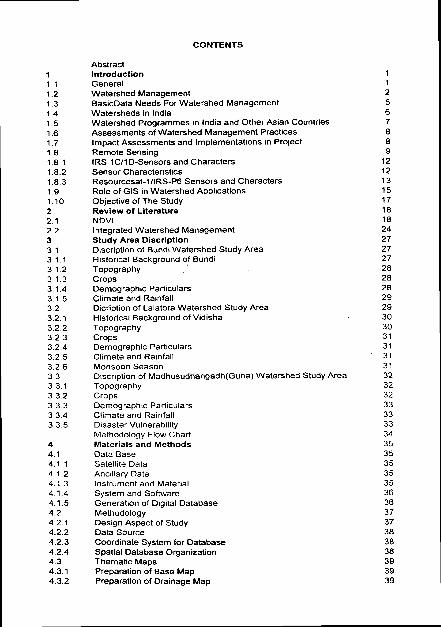
CONTENTS
Abstract Introduction General Watershed Management BaslcData Needs For Watershed Management Watersheds In lndla Watershed Programmes In lndla and Other AsIan Countries Assessments of Watershed Management Practices Impact Assessments and lrnplementat~ons In Project Remote Senslng IRS 1C/l D-Sensors and Characters Sensor Characterlstlcs Resourcesat-1IIRS-P6 Sensors and Characters Role of GIs In Watershed Appllcatlons Objective of The Study Revlew of Ltterature NDVl Integrated Watershed Management Study Area Dlscrlptlon Dlscrlptlon of Bundl Watershed Study Area Hlstorlcal Background of Bundl Topography Crops Demographlc Partlculars Cllmate and Ramfall Dlcr~pt~on of Lalatora Watershed Study Area Hlstorlcal Background of Vldlsha Topography Crops Dernographlc Pattlculars Cllmate and Ramfall Monsoon Season Dlscrlptlon of Madhusudhangadh(Guna) Watershed Study Area Topography Crops Demograph~c Particulars Cllmate and Ramfall D~saster Vulnerablltty Methodoloqy Flow Chart Materials and Methods Data Base Satellite Data Ancillary Data Instrument and Materlal System and Software Generation of Dlgltal Database Methodology Deslgn Aspect of Study Data Source Coordinate System for Database Spatlal Database Organ~zatlon Thematlc Maps Preparat~on of Base Map Preparation of Dramage Map
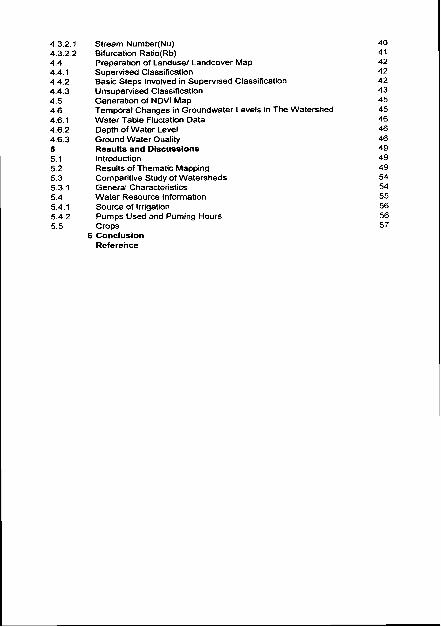
Stream Number(Nu) Bifurcation Ratio(Rb) Preparation of Landusel Landcover Map Supervised Class~ficatlon Basic Steps Involved in Supervised Classlfiwtlon Unsupervised Class~fication Generation of NDVl Map Temporal Changes in Groundwater Levels In The Watershed Water Table Fluctation Data Depth of Water Level Ground Water Quality Results and Discussions Introduction Results of Thematic Mapping Compantive Study of Watersheds General Characteristics Water Resource Information Source of lrrigatlon Pumps Used and Puming Hours Crops
6 Conclusion Reference
LlST OF TABLES IRS IC I ID Sensor Characters and Speclficatlons IRS P6 Sensor Characters and Speclf~catlons The Details of Remote Sensing Data Used LanduselLandcover Classification System Mean Water Column In The Wells Mean Pumping Duration From The Wells Effects of Watershed lnterventlons Dur~ng Different Seasons General Dlscrlptlon Different Source of Water Source of Irrigation Types of Crops Yield From Crops Well Locations of Mill1 andGuna Watersheds Groundwater Level Observation(Feburary 2004) Groundwater Level ObsewationlAor~l 2004) Groundwater Level Observat~on(July 2004) Groundwater Level Observatlon(Oct0bar 2004) Water Quality Analysts for the Month of Feburary Water Qual~ty Analysls for the Month of Aprll Water Qual~ty Analys~s for the Month of July Water Qual~ty Analys~s for the Month of Octobar Standards for Domest~c Water Quallty Pumplng Capaclty and Pumping Hours of Wells
LlST OF FIGURES Locat~on Map Base Map of Bundl Base Map of Guna Base Map of M~II~(Lalatora) Dralnage Map of Bundl Dralnage Map of Guna Dralnage Map of M~II~(Lalatora) Compar~tlve LanduselLandcover Map of Bundl Comparttlve LanduselLandcover Map of Mllll LanduselLandcover Map of Guna Satell~te Imagery of Bundl Watershed NDVl Map of Bundl Watershed Satell~te Imagery of Mlll~ Watershed NDVl Map of MIIII Watershed Satellite Imagery of Guna Watershed Well Locat~on Map of Bundl Watershed Well Locatlon Map of Guna Watershed Well Locatlon Map of Mllll Watershed Improved Vegetative Cover In Bundl Watershed
LlST OF GRAPHS Trend In water qual~ty In three watersheds Trend In water level In three watersheds

1. INTRODUC'TION 1 . 1 GENERAL
World oceans cover about three fourth of earth's surface. Accorciing to the UN
estimates, the total amount of water on earth is about 1400 million cubic kilometers
(m.cu.km), which is cnoicgh to cover the earth with a layer of 3000 meters depth.
However the trcsh watcr constitutes a very sniall proportion ot thi5 enormous
quantity. About 2.7 per cent lies frozen in Polar Regions and another 22.6 per cent is
present as groundwater. The rest is a\lailablc in lakes, rivers, atmosphere, muisture,
soil and vegetation. What is effectively available for consumption and other uses is a
small proportion of the quantity available in rivers, lakes ,ind groicncIn.dter, Thr
crisis about watcr resources developnicnt and management thus ariscs h ( ~ i C i t ~ ~ c most
of the water is not available tor use dnd secondly it is characteri~ed by ~ t s highly
uneven spatial distribution. Accordingly, the importance of water has been
recognized and greater emphasis is being laid nn its c,conomic i ~ s c and better
nianagemcnt.
The importance ot water resources managenlent througl~ adequate \vatershed
rehabilitation and conservation is increasing. \Vatershed dcvclopmznt and
management is evolving as a useful n~eclianisni to c i J d r ~ ~ ~ the two 111051 conin~on
water resource ~n )b lcms in India. Firstly, it aims to address the problem ot alatcr
availability resulting from an increased demand on a resource I-endel-cd tragile due
to irregular and erratic rainfall. I~iowevcr, thc watershed dcvclop~iirnt n~odcl also
o i t e~s an ettectii~i~ ~nedium to tackle larger natur'il resources ~nanagrnient j~rohlcms
arising crut of a armpctition for the limited wsource.; that ottcn results in conflict at
various levels. U'ater is required for food production, for hydroelectric energy, and
tor domestic and industrial use of country's large population. \Vatershcd
management is required to mitigate the effects of Rood and drnught and to provide a
livelihood for the large number of ethnic minority groups living in the country.
The present study signifies the efixtive use of Remote and CIS tor
watershed monitoring and impact assessmolt studies on the watershed program.
The present approach essentially aim at understanding physical framework of
watershed with the help of remote sensing data, field data and link this information
to existing cadastral informatiori in order to assess the impact of watershed program
in remote villages of Madhya I'radesh and eastern Ilajasthan.
1.2. WATERSHED MANAGEMEN'I': -
"Watershed is a gco-hydrological unit draining run-off water at a common point
and it could be deniarcatcd based on ridge and gully lines".
The tcrni "watershc.d" refers to.tlic divide separating one drainage basin from
another and derived from Greek word "wacsercheid". However, over the years, the
use of tern1 watershed to signify a drainage basin or catchments area has coriie to
stay. I-lydrologically watcrslieci could be defined as an area from which runoff drains
through a particular point in a drainage systcni or it is also dcfined as a hydrologic or
geornorplic~logic area of land that drains to a particular outlet.
Since water follows a definite flow course watershed becomes an idcally
I~ydrologic unit for carrying out devclopnlental activity rclatcd with water
managemrnt. Waten;licd ayproach tor optimal planning, development and
managcmcnt aims at hnmcssing all natural resources for sustainable development
and hrttcr living. fllc tnctol-s that pl,y a grealcr role in planning and devclopnient
pr(>cess of a wrltcrsIic~1 arc its sire, s h a ~ e , td~ysiograpliy, slope, climate, drainage,
gconiorphology, soils, soil erosion zones, land use/land cover and groundwater ctc.
Watershed management is an integration of technology within the natural
boundaries of a drainage area for optimuni development of land, hydrological,
biotic, vegetative resources to meet the basic minimum needs of population in a
sustainable state. Every watershed in this world is unique and shall be dealt
according to its environment, natural resources and requirement. There are no hard
and tast guidelines common in all for developnient.
Watershed management is unique approach for development of rain-fed area
on sustainable basis. In India 35% of irrigated land produces SS'X, of total production
while 65% of rained lands produce 45% food produce. Therefore it is clear indication
that the rain-fed area shall be emphasized for development by watershed
development management.
The watershed exists naturally and due to human intervention for agricultural
pi~rposes tlie cl~anged ecology and management practices affect tlie well-equilibrated
ecologies. I t watersheds are not managed properly then natural rcsources are
degraded rapidly and in due course cannot be used for betterment of humans. Soil
water and vegetation are the most important natural resources for the survival of
human beings and animals. . The poor in the rural areas, who are struggling for
survival, cannot bc expected to pay, adapt to conservation strategies, unless their
daily needs of food, tiber and fuel are met. A still more urgent need is for assured
work and full employment for all. Integration of many scattered progralil of soil
conservation, afforestation, minor irrigation, and other devclopmcnt activities into
well prepared micro watershed projects based on a study of climate, land, water and
plant resources on the land and Iiuman and aninla1 resources, otters scope for
bringi~ig about sustained natural resources developmcnt. ICRISAT in pal-tnersliip
c\rilh National Agricultural Ilescarch Syslcnls (NAIIS) have developed all innovative
and upscaldblc ~ i~ode l ol participatory integrated watershed ~ii~i~iagemcnt (Wani et al
,2002b). Thus this model convergence oi different activity, community participation
from planning to monitoring stage, technical backstoppi~ig by the consortium of
government, non-government organization (NGO'S), national and international
research institutions arc important components. Further, watershed management or
water management is used as an entry point activity and such programs are m ~ i i e as
livelihood improvcnicnt program i n tlic rural areas. (Wani ct a1.2003)
The main source of water is by rain, most o i i t drains of and only a little
percolates i n ground. India receives 400 million-hectare meters (mliam) of raintall per
annum, out of i t only 50 niham filters down, while 115 mham are lost to sea i n torn1
of run-off and rest is evaporated. This groundwater is exploited tor irrigation
purposes year round for water mostly for intensive cropping. I'unjab 98'%1, klaryana
80%, Tamilnadu 60% are i n race for groundwater exploitation and its ill cticct rcsr~lt
i n acute depletion ot groundwater Icvcl. The groundwater is similar to bank account,
unless one saves, i t is not be available i n hour of need. I t tak's years to rep lm~sh and
to replace tlic exploited grot~ndwater to i i i ininiuni Icvcl, 'ifter lollowing watcr.;licd
nianagemcnt techniques. t'heretore raiil-icd region, planning and water nian,lgcmcnt
techniques can save and store water resource during rainy season for optimal util ity
and which also increases groundwatcr aquifer level.
India has 15')A of world's cattle population, 46% of world's buffalo 17% of goat
and first largest producer of mi lk in the world but average Indian child suffer from
mal-nutrition, even the per capita nii lk co~~sumption is very lcss wlii lc coniparcd to
few under dcvcloped countries. The rcsourcr managcn1cnt is just going in
unorganircd ancl neglected. 'rl ic contribution of livestock-hascd activity to cconolny
is far lcss co~nya~-cd to small countries 01 that ot, Ncrv Zc,~lanJ, S~v i t~cr land and
othcr counlries i n pastoral and dairy produce.
'I'lic nahcr'il resources i n the semi-arid tropics (SKI) are the "litr line" o i l-w'al
livelihood, the kc)! occupation being agricc~lturc. Tlicsc dry cco-region.; Jrc
predominantly rain-fed, m'irginal and fragile and prone Lo severe land degradation.
Unpredictable wcatlicr, linlited and erratic rainfall wi th long intervals of dry spells,
and intense rainfall causing runoff and severe soil erosion characterize these dry
regions. The over exploitation and reduced recharge of groundwater, along with low
rainwater use efficiency is another serious threat to scarce water resource in dry
regions. Low level of soil organic matter, accompaiiied by high ratrs of organic
matter degr'idation aggravated by low literacy and poverty are the major cause of
low productivity and depleting natural resource base in the dry regions (Wani et al
2003). The challenge, therefore, is to develop sustainable and environmental friendly
option to manage natural resources in this fragile ecosystem to increase the
productivity and incomes of millions of poor farmers who are dependent on the
natural resources tor their st~rvival. 'The way forward to address this gigantic task is
by sustainable management ot natural resources in a manageable land unit, which is
a watershed.
1.3. BASIC DATA NEEDS I;OR WATERSHED MANAC;L:MF.NT
I'liysical data such as location, physiography, drainage, soil, vegetation,
geology, and climate, hydrologic and other relevant site characteristics. . Watershed is a basic unit of management, a proper framework of
delineation of watershed at macro and micro level.
I'resent land use, nature and extent.
Socio-economic, cultural and traditional system.
[.and tenure systems, legislation, by-laws, land facets anti its problems
(arable, non-arable and drainage line ~ t c . )
1:sisting stage of development and infrastructure.,
Economics of dt~vclopmrnt ,ictivities, ralcs of return, willingness and
acccptancc of program hy local pcaplc, any impediments ' to
implemcntati(>n, operalional con\,cniences and dilficulties etc.
Technology available on conservation 'ind production and its
application.
The above information ought to be collected for identified watershed
area by undertaking various types of land resources and socio-
economic surveys.
1.4. WATERSHEDS IN INDIA
Approximately 170 million hectares in India are classiticd as degraded land,
roughly half of which falls in undulating semi-arid areas where rain-ted tarniing is
practiced. Long- term experiments by a number of research organizations in India in
the 1970s and 1980s confirmed that the introduction of appropriate physical barriers
to soil and water flows, together with re vegetation, could generate considerable
increases in the resource productivity. These, in turn, sti~iiulated the iorniulation of a
number of government projects, schemes and programme5 in support oi micro-
watershed development.
In India, micro-watersheds arc generally defined a tailing in the range 500-
1000 ha. A macro-watershed is equivalent to a river basin and may encompass many
thousands of hectares. The micro-watershed concept aims to 'establish an enabling
environment for the integrated use, reg~ilatio~i and treatment ot water and land
resources of a watershed-based ecosystem to accomplish resource conservation and
biomass production objectives' (Jensen et a1.1996)
Altliough a macro-watc'rslicd may be a scnsiblc plri~itiinp ~uiit fro111 a
biophysical perspective, many would argue against the appropriateness oi such a
unit lor rural devclopmcnt. Snc~al inslitutio~ls to proniotc cooperation-ncedcd to
pnltect and rehabilitate private and common-pool reso~~rccs-arc ubitally viUagc3
based. Oltcli, however, biophysical and socio-politic,~l houn~l.il-~ch 'lo not coi~icide.
'L'lic' majority of project docs not, theretore, sirictly cnt,lil the devek)pment of 'a
watershed'; rather they adopt an approach to rural development i~icorporating
principles from the watershed approach.
1.5. WATERSHED I'ROGKAMMES IN INDIA ANI>OTHL<R ASIAN COUNTRIES
In India about 35 percent ui the agricultural land is under assured irrigat~on
while remaining 105 million hectares are depended on raintall. It is esti~liatcd that
generally about 30-35 percent of the rainwater is being utilized for crop prodnction,
while tlie rcniaining 65-70 percent is lost as runoff, d c ~ p drainage and evaporation.
In this process of water runoff, a lii~gc volume of topsoil is also washed away. 'l71e
estimated annual loss of fcrtilc soil in India is 1.2 billion tones. With this over 8.9
niillion tones of mineral nutrients are also lust trom the tield annually, wliicli is
equivalent to tlie total quantity ot tertilizcr produced in the country. Hypothetically,
our agricultural production can be managed witliout any chemical fertilizer, it we
can prevent soil erosion. This can bc icliieved by watershed management. (I legd' et
al., 1998)
Central and state govcrnnicnts, donors and NGOs have all been involved in
implementing watershed programmes in India. Altliougli the details vary with
diiferent projects, the basic institutional strc~ctnres are similar. Money ilows to a
project implenienting agency (either a g(ivernnient or non-government organiration)
which works closely with a village-level body, a \\,atcrslicd committee- to design and
iniplement project activities.
Natural resources through out tlie world, particularly in Asia wlicre
demographic pressures are v e ~ y high, arc under severe threat. l 'h r n ~ v d to improvc
the management of natuml resource for meeting the food, iccd dnd il~cl needs or the
cvcr-increasing population is urgenl
ICRISAT along with its stakeholders have cstablinhcd benchmark watersheds
in India, Thailand, Vietnam and China.
The stakeholders include scientific organization, agricultural universities, non-
government organizations and farmers.
1.6. ASSESSMENT OF THE WATERSHED MANAGEMENT PRACTICES
The watershed programs are undertaken for managing natural resources and
iniproving agricultural productivity thereby improving the rural livelihoods.
Ilowever, the expected benefits from these investments arc not re'~lized most of the
times which is mainly due to lack of peoples participation (as people and livestock
,>re an integral part of watershed community and should be given utmost
importance.), lack of scientific inputs, conipartmentalized approach with maximum
emphasis on construction of rainwater harvesting structures (many ot which arc ot
poor quality) lack of tangible econo~iiic bcneiits to individuals, involvement ol
contractors for executing works, and non involvenient of landless families and
marginal land holders.(Farri~igto~~ and t.obo 1997,Kcrr et al 2000, Wani ct a1.2002a,
2002b).
1.7. IMPACT ASSESSMENTS AND IMP1,EMENTATION IN PROJECT "Etivironmental impact assessnient" can be defined as the systematic
identification and evaluation of the potential impacts (cticcts) ot proposed projects,
plans, programs or legislative actions relative to the physical, biological, cultural and
socioeconomic components of the tolal enviro~~mcnt (I.auy W.Canter Environmental
i~npact assessment).
Soon after the i~nplemcntation of the suggcstcd project or action plan, the arca
i~ndergoc"ransforn~ation, wl~ich is monilored rcgi~larly. Such a n cxercisc not o!ily
helps in studying the impact of thc program, hut also e~lables resorting to mid-course
col-rections, if required. I1ar.tnictcrs included under monitoring activities are land use
I land cover, extent of irrigated area, vegetation density and condition, fluctuation of
groundwater level, well density and yield, cropping pattern and crop yield,
occurrence of hazards and socioeconomic conditions.
The major concern of watershed development efforts has been attaining
sustainable impacts on poverty and the environment after the end ot interventions.
For sustaining the benefits of convergence through watershed nianagement approach
beyond the project period, it is essential to identify the mechanisms that build the
capacity of the community for self-regulation and management.
The need for projcct monitoring and impact assessment becomes clear as it
helps in mid-course corrections. The project strategy being evolutionary and based
on lesso~is learned during implementation, experience from current project would
benefit other parallel projects working in the same modr. Also cross-site lessons can
be learned and experie~ices would benefit to improve project implenientation. I'rojcct
monitoring and impact assessment will assist decision makers and policy makers to
evaluate the project objktively.
The strategic approach for project monitoring and impact assessmelit begins
with the prcparation of inventory baseline data covering socioeconomic, natural
resource base, and inputs and outputs for each watershed. 'This is tollowed by
continuous monitoring and documentation by the I'rojcct Implementing Agencies
(PIAs). The approach also encompasses impact assessment before project completion
and process docunicntatioti. The key instruments are participatory rapid appraisals,
stratified sampling, detailed surveys, objective verifiable indicators (qualitative and
quantitative), GIs based analysis, fccdback from the I'IAs tliroi~gli regular repul-ts,
tour notes fro111 pr~jvct staft, feedback evaluation trom cxperts/vis~tors, and ili1pac.t
assessment reports.
1 .X. REMOTE SENSING
I<eniote sensing is broadly defined as collecting and interpreting information
about a target without being in physical contact with the object. (Sabi~is, 1987).
Remote sensing is the examination of, obtaining information about an object or
phenonicca at a distance from it, without physical contact with it, particularly by a
device based on the ground, by sensors carried aboard ships or aircrafts or
spacecrafts or satellites orbiting the earth, which gather data at a distance from there
source (landsat, Skylab, space shuttle spot)(Clark, 1989)
Remote sensing is a science and art of obtaining information about an obj~r t ,
area or phenomena through the analysis of data acquired by a device that is not in
contact with the object area or phenomena under investigation. (Lilesand and Kiefer,
1994), Dcmus (1997) also defined Remote srnsing as 'the observation of objects or
group of objects, normally at a distance, most often with the use of some form of
mechanical or electronic device for latcr rctri~val. All such methods often relay on
sensing devices far remoycd from the observer and are tlicrefore collectively called
Rernotc sensing.
I<emote sensing has bccornc an integral part of information teclinology and
provides solution to facilitate ~ustainable development of especially the natural
resources and conservation of cnvirnnn~ents at varying scales. The greater distance
between the sensing platfomis and its objects allow the satellite to view large area
synoptically at each instant. In addition, because satellite-sensing devices are orbiting
the earth, they are able to sense niuch of the planets in fraction of time that would be
needed by a conventional air borne sensing dcviccs.
For optimal ~~tilization of nati~rill rcsoi~rces, inforniation on tlieir ~ ld t i~ r (~ ,
extent and spatial distribi~tio~i is a ~>rrrcquisitc. Until the 1920s such inforniation had
been u~llected by conventional su~-\~cys, which are labour-intensive, cost- proliibitlve
and arc impl-actical in the inho<pilahle tcrl-ain. During the 1920s and cdrly 19705,
aerial phorographs were used for deriving information on various natural including
land subject to degradation by various processes (Bushne111929, USDA 1951, Howard
1965, Iyer et.a1.,1975).
Since the launch of the Earth Resource Technology Satellite (ERTSI), later
renamed as LandSat-1 in 1972, followed by Landsat-2, 3.4 and5, SI'CIT -1, 2, 3a1id -1
and the Indian Remote Sensing Satellites (IRSIA, 1B. 1C and ID) with linear Imaging
SelkScanning sensors (LISS-I, 11, Ill and IV), space borne multispectral data collected
in thc optical region of the electromagnetic spectrum have been extensively nsed in
conjunction with the aerial photograph and other relevant information supported by
ground truth, for deriving information on geological, geomorphological and hydro-
geomorphological features (Rao et a1,1996a, Iceddy et a1.1996); soil resources (Singh
and Dwivedi 1986) landuse/landcover (Landgrebe 1979, Raghavaswamy eta1.1992,
Rao,et al.1996b);forest resources (Dodge and Bryant 1976, Unni 1992, Roy ct al 1996)
Furthermore, space borne multispcctral data has bccn operationally used for
integrated assessment of natural resources and subsequent generation oi action plans
for land and water resources develojment and for assessment of the impact of their
implementation.
Biomass has been used as a surrogate measure to evaluate the impact of the
iniplcmentation of action plan for land and water resources cicvelopment. High
absorption of incident sunlight in the visible red (600-700 nm) portion and strong
reflectance in the near infrared (750-1350 nni) portion of electro magnetic spectnlm
11'1s bccn irscd to derive vegetation indices, which indicate the abundance and
condition oi biomass. The index is typically a scene, difference ratio, or other linear
combination oi rctlectancc tactor or radiance observations from two or more
wavelength intervals. ' h e vegetation indices thus dcvclopcd arc highly correlated
with the vegetation density or cover, photo syntlieticallp active biomass (lltckcr
1979, 12iicgand and Ricliardson 1984); leaf area index (Weigand et a1.1979) (;rccbnlcat
ciensity ('fucker et a1.1985); photosynthesis rate (Sellers 1987); and amount oi plioto
synthetically active tissue (Wiegand and Richardson 1987, Dwivedi et. al., 2003)
Indian Remote Sensing Satellite IRSID, lC, P6, LISS It1 and LISS IV data have
been used for deriving NDVI and Differential NDVI to assess the impact in the
watersheds.
National Remote Sensing Agency (NRSA), Hydcrabad, India provided tlic
Indian Remote Sensing Satellite (IRS-LC, 1D,P6) data for developing and managing
watershed efficiently as well as ior monitoring the impact of various interventions
made in the watershed.
IRS-1CIlD-Sensors and Characters:
IRS 1C and ID ,we characteri~ed by improved spatial resolution, extended
spectral bands, stereo vic\\,ing a n ~ l faster re-visit capability.
IRS lC/lD satcllitc oper'ltcs in '1 circul.ir, sun synsl~ronous, near polar orbit
with an inclination of 98:)h drgrccs, ,lt an altitude of 817 km in tlic descending nod('
'The satellite takes 101.3; minutes to completc one rcvoli~tion around the earth anti
completes about 14 orbits prr day. l'hc entire earth is covcred by 341 orbits during a
24-day cycle.
The mean equatorial crossing ti~iie in the dcscending node is 10.30 hrs + 3
minutes. Vie orbit adjust system is used to attain the required orbit initially and is
nlaintaincd tl\n>ughout tlic. ~nission period. Tlic ground trace pattern is controlled
with 2 5 km of the rcfereiiic jironnd trace pattern.
Sensor Cl~aractcristics:
IRS-IC/lD .;atcllitc c,11-1ics three sensor%, which are c1iaractc1-izcd by enhanced
rel;olutio~i and coverage c,~pabiliti~b.; \\.it11 a rcpc,>tnbility pcrioci of 22 days. l'ablc
sho\vs tlic specific,ition and 1r~so1~1lio11 ot ,711 the tllrce S C ' I ~ S O ~ ~ .
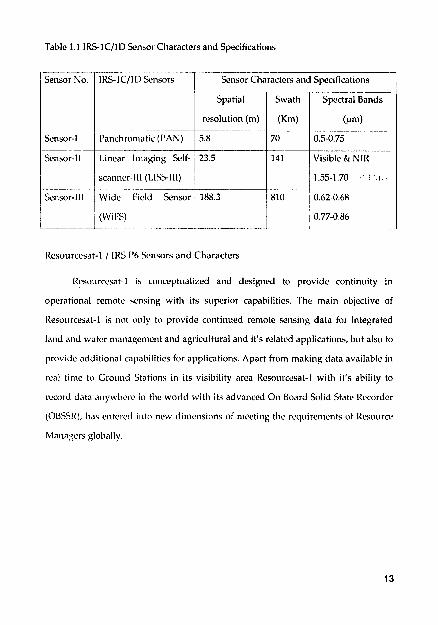
Table 1.1 II<S-lC/111 Se~isor Characters and Specifications
/ sensor NO. / IRS-IC/ID ~ e n s o r s I Sensor Characters and Specifications
1 1 1 w a t 1 l Spectral Bands
resolut~on (m) (Kni) (~111)
( 6 - - 1 70 0 5-0 75 I
Sensor-I1 Linear Imaging Self- 23.5
scanner-Ill (LISS-Ill) -. .
Field Sensor 188.3 0.62-0.68
Resourcesat-1 I IRS 1'6 Sensors and Cliaractcrs
Kcsourcesat-1 is co~~ceptualized and designed to providc continuity in
operational remote sensing with its superior capabilities. The main objective of
I<csourcesat-1 is not only to provide continued remote sensing data for integrated
land and water ma~iagcment and agricultural and it's related applications, but also to
provide additional capabilities for applications. Apart from making data available in
real time to Ground Stations in its visibility area Rcsourccsat-l with it's ability to
recorci data anywhere in the world with its advanced On Board Solid State I<ca)rder
(OBSSR), lias entel.cd i n t o ncw dimiwsio~is of meeting the r~~quircments of Kcsc~urce
Managvrs globally.
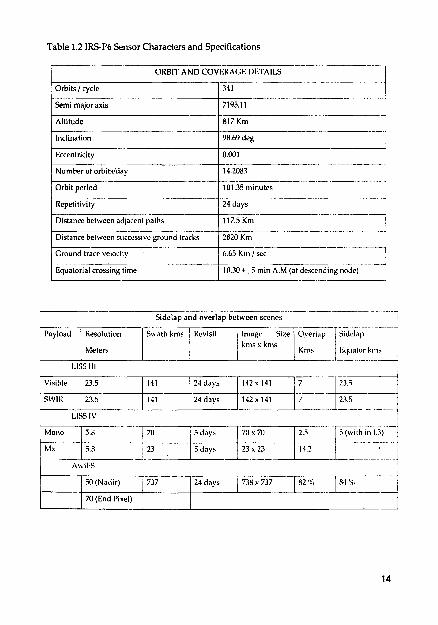
Table 1.2 IRSI'6 Sensor Characters and Specifications
Repetitivity
Distance between adjacent paths 117.5 Km
Distance between succcsaive ground tracks 2820 Km ~ .. ~
Ground trace velocity 6.65 Km I sec -- - ~ ~ . . --- . - ~- Equatorial crossing time 10.30 t-5 min A.M (at descending nodc)
ORRIT A N D COVERACE I>I':TAII.S
-- - -. -. ........ .- ... ... Sidelap and overlap between scenes
-. Payload Resolution Swath kms Revisit Image Size Overlap Sidclap -Tpl km5: "Is 1 Knls
,;q~~ator k n ~ s -- .... -. . -. .... -
I.ISS Ill
..... ...
.. ... LlSS IV
. . M x S.8 --
Awil:S
Orbits I cycle . -- - -
Semi major axis
341 .-........ .
7195.11 - . --
Altitude
Inclination
Eccentricity
Numher of orbitslday
$17 Kin -- -~
98.69 deg --
0.001 .
14.2083 - - - - .......... 4 . I .... ....-
Orbit period 101 35 minutes '- 1
1.9. ROLE OF GEOGRAPHIC INFORMATION SYSTEM IN W ATtiRSHED APPLICATIONS
Geographic lntorniation System is a system for capturing, storing, checking,
manipulating, analyzing and displaying data, which are spatially referenced to tlic
earth. (DOE, 1987.1'-132). GIS is any manual or computer based set of procedures
used to store and manipulate geographically referenced d.lta. (Aronoft, 1989,r'-39)
GIs can play an important role in inventory and data handling activities of
land use and land cover. A CIS accepts, organize, analyze statistically and display
various types of spatial information. These variables are achieved in a computer
compatible digital formula as a reference or database. Database represents various
kinds of aerial intormation e.g.; terrain description, soil and lithology types, land
cover and land use, population density and climate etc.
Elements: Thcre are five basic technical elements in a CIS, v i~ . , encoding, data
input, data management, manipulative operations and output products.
The spatial inh)rmation is encoded as points, litics or polygons. These
indexing systems are called as (i) grid cell or raster coding and (ii) polygon or vector
coding. The for111c.r is basically a matrix system where tlic iniorrnatio~i can be
collcctcd by a systematic array of grid square or grid cclls. Thrir grid cclls are
functionally identical to the pixels or picture elements, which compose a digital
image. In the scalnd syslem (vector coding) each acrial unit containin}; tli? desired
attl-ibute data is ~ligitally encoded and stored. This is also known as polygon coding.
Thcre is a digiti~er that converts the map data (analog info^ mation) to cligital
11umber. Ih t a management helps in thc successtul operation ot a varirty ot data in
GIs. Tlic data nianagement systeni perfor~iis data entry, storage, retrieval and
maintenance through its computer.
GIS are capable of performing the surface analysis and overlay analysis.
Surface analysis for instance, comprises of the inclusion of soil categories, their
analysis and labeling according to agricultural value. In thc automated overlay
analysis, the GIs overlay two or more data plains and explicit their relationships.
Finally the GIs can retrieve and display data in tabular or graphic form or both. The
system can produce hard copies, charts, scatter diagram, tables and maps.
1.10. OBJECTIVE OF THE STUDY
The overall goal of this study is to enhance the benefits of integrated
watershed management programs by using GIS and Remote Sensing data for
assessing the impact. The specific objectives are:
1. To prepare spatial database and attributes for the selected three micro
watersheds viz; Bundi watershed in Rajasthall and I.alatora in Vidisha and
Guna watersheds in Madhya pradesh.
2. To apply GIS and satellite imageries for assessing impact of various
interventions in the watershed on vegetation, water availability and
groundwater quality.
2.REVIE W OF LITERATURE
2. REVIEW OF LITERATURE
The impact assessment studies of a particular watershed to answer the
following:
What has been the role of watershed projects in achieving the objectives of
improving natural resource management, agricultural development and
livelihoods of different groups of rural people?
What approaches to watershed development have worked best to achieve
these objectives?
What other factors besides watershed projects help determine the achievement
oi tlicse objectives?
Assessing the performance of watershed projects requires examining the
determinants of agricultural and rural development from a broader perspective.
Regardless of the efforts of any given development project, conditions in rural areas
are determined by a variety of other factors, such as infrastructurc, access to markets,
social institutions in the villages, and agro-ecological conditions. Because watershed
projects do not operate in isolation from other forces.
2.1 NORMALIZED DIFFERENTIAL VEGETATION INDEX (NDVI)
'l'he NDVI is commonly uscd vegetation index in remote sensing studics
bccausc it is roughly correlated with green plant biomass. The NDVl is based on the
relative spectral (i.e., height) reflectance values in the red and ncar infrared (NIR)
Vegctation indices are commonly used to reduce effects of atmospheric
conditions or different soil backgrounds on spectral reflectance values. The amount
of red solar energy reflected by vegetation cover depends primarily on chlorophyll
content, whereas the amount of near infrared energy reflected by vegetation is
affected by the amount and condition of green biomass, leaf tissue structure and
water content. (Jensen, 1996)
The remote sensing data is used extensively for large area vegetation
monitoring. Typically the spectral bands used for this purpose are visible and near IK
bands. Various mathematical combinations of these bands have bwn used for the
computation of NDVI, which is an indicator of the presence and condition ol green
vcgetation. These matliematical quantities are referred to as Vegetation Indic~s.
There arc three such indices, Simple Vegetation Indices, Rational Vegetation Indices,
and Normalized Differential Vegetation Indices.
These indices arc computed from the equations
VI = N E A R IR - R E D
KVI =RED / NEAR IR
NDVI = (NEAII 1K - RED) / (NEAR IR +RED)
Land surfaces are characterized by a high degree of spatial heterogeneity of
surface cover. These types have associated references in emissivity, thermal
properties and reflectance characteristics (Mathews and Rossow, 1987). Satellite
studies show that the soil moisture and vegetation parameter like vegetation status,
leaf area density and pliotosyntlletic activity are not independent. Naturally,
vogetatcd surfaces can till moisture fro111 within the soil and may show signs oi stress
rather tlian adjacent arablc land. Therefore thcl-e is close relationship betrveen
meteorological drought indicators and satellite hascd indices of vegetdti<~n activify
(Walsh, 1987).
I'liotosyntl1ctic.illy active vegetation typically has a reflectance of < 205 in the
narrow band visible (0.5- 0.71im) but a much higher reflectance up to 60'k in the near
IR (0.7 -1.3mm).
The NDVI is bounded ratio that ranges between -1 to +I.clouds, snow, and
water have tne negative NDVl since they am more reflective in visible than near IR
wavelengths. Soil and rock have a broadly higher reflectance giving NDVl close to
'0'. Only active vegetation has a positive NDVl typically between about 0.1 and 0.6
values at a higher end of the range indicating increased photosynthetic activity and a
greater density of the canopy (Tarpley et a1 1984).
Musa et.al., (1998) used integration of R.S and GIS to produce map that
classified groundwater potential zone to either very high, high, moderate, low or
very low in terms of groundwater yield in Langat Basin. It was concluded that
almost all alluvial plains have a high potential for groundwater occurrence.
Meanwhile in the hard rock area groundwater potential is in the high-density
lineament zones.
Rasmussen (1998) developed siniplc operational, consistent NDVI-Vegetation
models by applying environmental and climatic information. Millet yield was
assessed using AVHRR NDVl data. Two years data showed that on linear regression
line between grains yield and integrated NDVl could be statistically justified.
Khan et.al (1999) in their case study "Watershed prioritization using remote
sensing and geographical information system, worked 011 of selecting watersheds to
under take soil and water conservation measures using remote sensing and
Geographical Information System (CIS) techniques. Using the terrain information
derived from gcocodcd satellite data and 1:50,000 topographic maps, 68 watersh(~d.;
wcrc assessed on the basis ot their erosivity and sediment-yield index values.
Thcmdtic maps of landform, land-use and land-cover, and slope were digitized using
AKC/lNFO. On the basis oi sedi~uent yield index values the watersheds were
grouped into very high, high, moderate and low priorities. High priority watersheds
with very high SYI value (>150) need immediate attention for soil and water
conservation whereas, low priority watershed having good vegetative cover and low
SYI value (<50) may not need immediate attention for such treatments
Dwivedi et.al., (2001) in their case study "evaluation of impact of
implementation of soil conservation measure in Ghod catchments, Maharastra"
discussed the changes in biomass of the catcl~ments over a period of time by
generating temporal NDVl for kharif and rabi seasons. Discussed the changes in the
agricultural land use, crop cmver, cropping pattern, crop production etc as well as
change in soil erosion, land degradation, change in groundwater table, irrigation area
etc. The study has vividly brought out the impact of soil conservation measures
employed in the catchnlents in terms of developnlent of biomass changes in
agricultural land use by improvement in eroded lands and groundwater recharge.
Dwivedi et a1.,(2001) carried out resource inventory tor Adarsli watershed,
impact assessment using temporal satellite data.
Khan and ~ o h a i a n a (2002) conducted studies to delineate and characterize
grc>undwater prospect zones using K.S and GIs. The information on lithology,
structure, geomorphology and hydrology werc generated and integrated to prepare
groundwater map for a region in western Rajasthan. The information on nature and
type of aquifer, type of wells, depth range, yield range, success rate and
sustainability were s~~pplenlcntcd to form a good database for identification of
favorable zones. CIS was used to prepare database on the above layers. Four
categc~rics of groundwater prospect zones high, modcratc, low and very low are
delineated.
Jayakunlar and Arocklasamy (2002) made an attempt to study the land ~ ~ s e l
land cover and change dctcction analy.;is in Kolli hill, p,irl (Ii 1;astern Ghats oi Tajnil
Nadu using R.S and GIs. They obscrvccl 467 112 increase in single crop category and
434 ha decrease in the land with or without scrub category. L.esser cllangcs werc
noticed in double crop plantation and barren/ rocky categories. Suggestion was given
to use the identified wasteland for agriculture, to improve the economy of the
people.
Lini and Kafatos (2002) developed new methods to study and monitor
changes in the distribution of vegetation in North America. NDVI, which is a level 3
data product from channel 1 and 2 of NOAAIAVHRR pathfinder, was used.
Frequency analyses for uniformly divided NDVI range was used to study inter
annual trends in vegetation greenness levels and Southern Oscillation Indices (SOIS).
Long term increase in vegetation greeMCSS on decadal time scale for some region in
North America is suggested.
Jaiswal et.al. (2003) in their case study " Kole of K.S. and GIs techniques for
the generation of groundwater prospect zones towards rural development .... an
approach" extracted intormatic~n on lithology, geological structures, land forms,
landuse/landcover from remotely sensed data and drainage networks. Soil
cliaracteristics and slope of tlie terrain using conventional methods and then
integrated in a GIS environment to depict village wise groundwater prospect zones.
This study was carried for the Goma sub-basin a part of the Son watershed, Madhya
Pradesh, India.
Tottrup and Rasniussen(2002) did study for mapping long-term changes in
savannah crop productivity in Scnegal through trend analysis of time series of
remote sensing data. Implementation of tlie United Nations Convention on
Combating Desertification (CCD) requires an identification of areas where vegetative
production is consistently declining. Time series of renivte sensing data are well
suited to this task, and methods have been developed for assessing long-tern1 trends
in savannah net primaly production (N1'1') or biomass and crop yields, using flnie
series of NOAA AVHRK normalized difference vegetation index (NDVI) data. In this
study, trend analysis is used to identify areas within the Peanut Basin in Senegal
with apparent positive or negative trends in agricultural productivity. Having
identified such areas, in-depth analysis is undertaken to determine whether long-
term changes in agricultural productivity are mainly a function of rainfall patterns or
are due to anthropogenic influences. The trends observed cannot be solely explained
by rainfall data, and there seems to be a significant correlation with changes in land
cover and land use. It is concluded that NDVl trend analysis may be used to
investigate long-term and wide-scale environmental changes, and that by
pinpointing areas of major change it can serve as a starting point for local-level
analysis or action.
Dwivedi et al, (2004) carried out the impact assessment of soil and water
conservation method using temporal data in kothapally watershed /
Adarshwatershed, Rangareddy Dist, Andhra I'radesh.
Gundimeda (2004) worked on how 'sustainable' is the 'sustainable dcvclopnient
objective' of CDM in developing countries like India? Tlie rural poor and landlcss
require resilient, sustainable livelihood systems that are flexible in the short term due
to dependence on multiple products. Tlie Kyoto Protocol requires that Clean
Development Mechanism (CDM) projects result in long-term benefits related to tlie
mitigation of climate change. This long-term requirement to keep carbon in storage
may conflict with the short-term needs of the poor. The objective of this paper is to
examine the potential implications of tlic Land use change and forestry (LUCF)
projects to the rural livelihoods in India. For this purpose the paper uses a linearised
version of the almost ideal deliland system (LA-AIDS) to analyse data collected from
69 206 rural households in India. Bascd on the analysis, the paper concludes that ior
CDM to be sustainable and result in sustainable development of the local people,
three i~iiportant criteria shoold bc satistied: (1) Integrating the energy substitutlon
possibilities in the objectives of carbon sequestration; (2) Management of tlie CI'K
lands by the rural poor through proper design of the rules for sustenance of user
groups; and (3) Ensuring that the maxiniu~~i revenue iron1 carbon sequestration is
channeled to the rural poor. Otherwise CDM would just result in either leakage of
carbon benefits or have negative welfare implications for the poor.
2.2. INTEGRATED WATERSHED MANAGEMENT: ICRISAT'S INNOVATIVE CONSORTIUM MODEL
ICRISAT'S 'small is beautiful' approach and partnership methodology have
sown seeds of agrarian renewal in many semi-arid regions of India and elsewhere.
Most of the rain-fed areas in developing countries suffer from one or another form of
land degradation. Due to variation in seasonal rains during the crop-growing period,
crop may face drought and sometimes water logging due to torrential down pours
causing runoff. In order to conserve the rainwater, minimize land degradation,
improve rainwater recharge, and increase crop intensity and crop productivity a
watershed management approach is adopted. (Kerr et a1.2000; Samra 1997;Wani ct
a1.2002)
Watershed programs in India so far have mainly focused on natural resource
conservation and interventions such as soil and rainwater conservation and to some
extent afforestation in the government forestlands. Sufficient emphasis and efforts
were not targeted to build up stakes of the coniniunity for sustainable dr\'clopmcnt
[it the natural resources and issue5 c~t gender equity have not hccn aJdrc.;scd
adequately. Natural rcsource managcnicnt progresh has largcly rcmninrii .I \v,ltrr
storage structure-driven invrstnlc~it giving only wage labor bc~i~-fitc ti) Jcprivcd
section5 ot tlic society whicll is (it ,i v t y tr'in5ient nature. I:.n~pt!zhi> en c-ttiiirb~il \valer
management, sus~ainability, monitoring and evaluation has not ht-(.~r . lJt~quLit~~.
I-lo~vcvcr, it is a well-known fact that waterslicJ proiccts slaiuld rnoiSr. firm purely
soil ancl ~nc~is t i~rc zon.;cl-\,'ilirin 'ind \vatc-r 11'1rvcsting inlc,r\,cmlir~~i\ to '1 wl~olc.so~nc
community-bnwJ inlcgrdlcsJ i \~n l~~ l -~hcd mdnagclncnl a p p n i , ~ h , \\hi<-h c~c.ltcs a
voice and stake tor tlic landless, poor and women. I'ovcrly allcviatioti through
processes that evolvr and empowcr the poor and women will atstain. I'coplc-
centered developlnent requires conr~ergence of initiatives and efforts to Lw
accompanied by decentralization of decision-making (Wani et al. 2003). For
establishing a successful watershed program it is necessary to involve the primary
stakeholders right from the beginning and build up their capacities to take the
program towards a sustainable initiative. The interventions in the project design
should aim at empowerment of the community.
A new farmer participatory consortium model for efficient managmient of
natural resource emerged from the lessons learnt from long-term watershed based
research led by the ICRISAT and national partners. The important partners are the
Central liesearch Institute for Dryland Agriculture (CRIDA), National Remote
Sensing Agency (NLISA), and District Water Management Agency (DWMA) in
Hyderabad, Andlira Pradesh. The important components of the new model, which
are distinctly different from earlier models, are described by Wani ct al. (2002, 2003).
The new model is distinctly different model as it has brought the farmer in the center
of the initiative. This farmer-centric integrated watershed management model has the
components of use of new science tools for development where there is effective
continuous transfer of knowledge and technology from on-station to on-farm. The
approach is holistic participatory based on farming systems and diversified
livelihood opportunities to cater to the needs of socially marginalized and landless
along with dryland farmers. Tlie interventions are so designed recognizing the needs
of individual farmers. The in situ conservation that brings tangible benefits to
farmers precedes the community-based interventions, which enhance the scope of
participation. Continuous monitoring and evaluation provides space tor reflection,
refinement and development of need based, concurrent technologies that aims at the
enipclwerliicnt of community and stakel~olders. Hen: on the institutional front a
consortium is put in place con~prising research organizations, university,
developnient workers, policy makers and farmers. This veliicle provides the required
technical backstopping in the model.
The new science-based farmer participatory co~lsortium model for efficiait
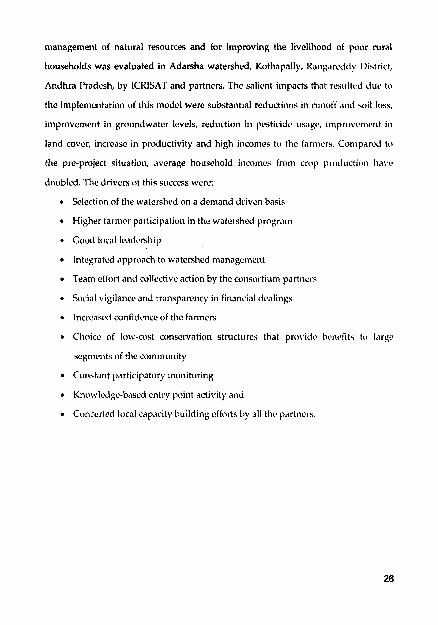
managmelit of natural resources and for improving the livelihood of poor rural
households was evaluated in Adanha watershed, Kothapally. lianjinrc~idv 1)ictric.t.
Andhra I'radesh, by ICRISAT and partners. The salient impacts that resilltcd J u r to
thc inlplcnientation of this model wcrc substatltial reductions in r ~ ~ n o f l and \oil loss,
improvement in groundwater levels, reduction in pesticide usage, i rnproven~c~~t in
land cover, i~icreasc in productivity and high incomes tr) the farnicrs. ConipC~rcd to
the pre-project situation, average household incomes from cnjp pr~>lluctio~i Ilavc.
doubled. The drivers ijt this success were:
Selection of the watershed on a demand driven basis
I-[ighcr tarmcr participation in tlic watershed prclgratn
Good local lcadcrship
Integrated approach to watcrshcd nianagc~nent
Team effort and collective action by tlic consortium partncl-s
Social vigilance and transparency in financial di,alings
Increased confidcncr of the fanners
Choice of low-cost conservation structure3 that pro\.idr hcncfit5 to largc
segments of the community
Constant participatory monitoring
Knowlcdgc-b'ised entry point activity and
Concerted local sdpacity building efforts by all tlic p~trtncrs
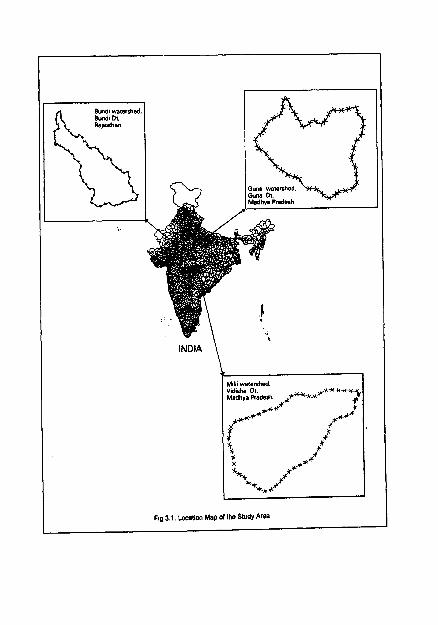
~ i g 3.1. Location Map of the Study Area
3.STUDY AREA DISCRIPTION
3. STUDY AREA DESCRIPTION
The present study is comprises of three different watershed arcas named
BUNDI, MADHUSUDHANGADH (GUNA), LALATORA (MILLI).
3.1 DESCRIPTION OF BUNDI WATERSHED STUDY AREA: -
The present study area is located in the Bundi district of Rajasthan at 24"
16'0ON and 77"30' 15"E covering a total area of 4,500 ha. Bundi district is situated in
the southeastern part of Rajasthan. It is bounded in the north by Tonk, in the west by
Bhilwara and on the southwest by Chittorgarh districts.
Bundi ciistrict comprises of four Tchsils named as Bundi, Keshoraipatan,
Nainwa and Hindoli. The river chnnibal tor~iis the soutlieni and castern boundaries
separating the Bundi and Kota territories. Tlie southern tehsils of Bundi forms a
wedge between Bhilwara and Kota and also touchcs Chittorgarh district. The study
area comprises of two villages named as Tliana and Goverdhanpuraa under Hindoli
Tehsil of Bundi District.
The Bundi watershed is extended between two villages; Thana (250 32'
21.40"N and 770 27'37. BYE) with an area of 1347 hectares and the other one is
Covcrdhanpuraa (250 33' 22.2S"N and: 75" 23' 58.04"E) with an area of 409 hectares.
3.1.1 I-Iistorical Background of Bund~: -
The region o[ Bundi has a glorious past with the inception ot tlic priiicely state
In Bundi by I-lades, a branch of celebrated Sharvnecs, I<ajput nlonuments in the form
of fort and palaces came into existence. Bundi artists have played a prominent rolc in
the evolution of early Rajasthani paintings.
Bundi is located in a narrow valley called Bandu-Ka- Naal and is said to be
have been named after Bundu, a Meena chieftain. Around 1342 Ad.Rao Dewa (Dwi
Singh) H;da is reported to have conquered this territoly from Meenas and named it
"Hadoti"(Haroti). I-le established his Kingdom here by erecting the city of Bundi in
the center of the valley. Rao Dewa (Devi Singh) was founder of the present Bundi,
who was followed by 24 rulers in the erstwhile princely state who ruled over the
territory.
3.1.2. Topography:
The topography of the present watershed study area is gently undulating.
And two major soil types are found in the region viz; silt clay and sandy clay. The
soil depths found in the study are ranged from 30 to130.
Since these lands are shallow/poor having low moisture retention capacity,
with scanty rains, mostly poor type of vegetation is observed. Agriculture lands too
became unproductive, as results of edaphic factors and biotic-interference, resulting
into continuos process of erosion.
Kharif crops Maize, Jawar, bajara, and seasame
Black gram and green gram
Rabi Wheat, chickpea, mustard and Safflower.
3.1.4.L)cmography particulars:
It is estimated that the population in Bundi District is 7,70,248 and in the two
villages 'Thana and Goverdhapura (where the watershed situated) are respectively
1,333 and 3,921 as per District Statistical abstract, 2001.
3.1.5.Climate and rainfall:
The climate in tlie Bundi District can be considered as arid. The study area
experience rail1 during monsoon or in winter season, and annual average rainfall is
600 mm.
Summer Season: The skies are mostly clear, highest temperature records in
summer season during March to May. Tanks, nearly dry up during summer season.
Temp varies from 35O-48"c.
Winter Season: The cold winter season during Dece~nber to February has
scanty precipitation and only dew in early hours support vegetative and vegetable
crops. Temperature varies from 4"- 8"c.
The region in total gets averagb rainfall of 60 cms per annum
3.2 DESCRIPTION OF LALATORA WATERSHED STLlDY AREA: -
The present study area is located in Vidisha District of Madhya I'radesh at 24"
16'00"N and 77" 30' 15"E covering a total area of 10,525 ha. Tlic district extends
between Latitude 23" 21' and24O 22' North and Longitude 77" 15' 30" and 78" 18' East
with an area of 7371 sq kms.
The watershed includes ten different villages namely Bandipur, Rajpur,
Lalatora, Anandpur, Shapur, Kolapur, Fazalpur, Khaitkhcdi~atliar, Khairkhcdi and
Gotklied. Tlic study area coniprisc oi one village named Lalatora, which is about 725
ha in area and is sub-watershed of Milli wstershed having total area of about 16525
ha.
Vidisha district is situated in tlie eastern part of the fertile Malwa Region. The
shape of the district is more or less Elliptical and the longer axis lies from North West
to South East with slight projections on the North, Northwest, South and Southwest.
Its greatest length from Northwest to Southeast is about 133.6 km and the greatest
width from Northeast to Southwest is about 96 kni. The tropic of Cancer passes
through the Southern stretch of the district about 2 km south of tlie district head
quarters. It is bounded in the North by Cuna district in the south by Kaiscn district
and in the east by Sagar district.
3.2.1. Historical back ground of Vidisha:
The District derives its name from the head quarter's town of Vidisha .The
earliest reference of Vidisha is contained in Ramayana by Valmiki. It is stated that
Shstrughana's son Shatrughati was placed in charge of Vidisha. Later it was ruled by
the Mauryas, tlie Sungas, the Kanvas, the Nagas, the Vakatakas, the Guptas, the
Kalchuris of Mahislim$i the I'armars, tlie Clialukyas, the Mugals, Marathasand
I'eshwas and thereafter became a part of the Sciendia's Gwalior State.
In 1904 Vidisha was raised to a district having two tehsils of Vidisha and
Basoda till the formation of Madhya Bharat in 1948. The district was enlarged in 1949
by the liierger of small states of Kurwai. The Sironji Sub division, which was
formerly in Kvta district of Rajasthan state and small pargana of Piklone belonging to
tlie Bhopal state, were added to the District with the formation of new Madhya
I'radcsh. At thc same time, the town and tlie district were rcnanied as Vidislia.
'I'lic topography of the present watershed study area is gently ntidulating.
And the major soil tound in tlie region is Vertisol with poor internal drainage.
3.2.3. Crops: -
Kharif crops: The major crops taken in kharif season arc soyabean and
jowar .
Rabi crops: The major crops taken in Rabi season are Wheat and
Chickpea.
3.2.4. Demographic particulars:
As per 1991 census, the district Vidisha had a populatio~i of 9.70388 lakh's
with an area of 7371sq kms. And the total population in tlie given watershed area
(Lalatora village) is 36tonly.
3.2.5. Climate and rain fall:
The climate in the Vidisha District can be considered as arid. The study area i.;
experience rain during southwest monsoon or in winter season
3.2.6.Monsoon season:
The monsoon is generally during Junc and continues till the end of
September. The total year is divided into tour seasons. The cold season fwm
December to February is h~llowed by hot season till mid-June. The period from mid-
Junc to about the end of Scptcmbcr constitutes the southwest monsoon. October and
Noven~ber considered as the post monsoon or retreating monsoon. The maximum
temperature is noticed 41°C during suniliicr and tlie minimum temperature is
noticed as 24°C during winter.
The average rainfall ranging from 1028mm.
3.3. DESCRIPTION OF MADHUSUDHANGADH (GUNA) WATERSHED
The present study area is located in Guna district of Madhya Pradesh at 23U 57'
48.50"N and 79O 16' 06.99"E. And the district extends bctwccn Latitudc of 23" 53'
and25u 6'55" North and Longitude of 76" 48' 30" and 78" 16'70" East with an area ot
6484.63 Sq.Km.
The watershed includes three different villages namely Bajaribarri (23" 57'
48.50"N 79O 16' 6.99" E), Kailaspura (23O 58' 50.03"N and 79" 16' 26.03"E), and
Barodakalan (23O 58' 29.13"N and 23O 58' 29.13"N).
Guna gateway of Malwa and Chambal is located on the north-castcm part of
Malwa Platuc, between Parbati and the Bctwa. The wcstcni boundary of the district
is wcll defined by the river. The I'arbati is thc main river flawing along thc western
boundary touching Rajgarh district of Madhya I'radesh and Jhalawarh and Kota
districts of Rajasthan.Shivpuri and Kota arc located in north where as Vidisha,
Bhopal and Rajgarh lies to the south.
The topography of the present watershed study area is gently undulating.
And the major soil groups found in the region are Vcrtisols with poor internal
drainage.
Since these lands are shallow/poor having low moisture retention capacity,
with scanty rains, mostly poor type of vegetation is observed. Agriculture lands too
became unproductive, as results of edaphic factors and biotic-interference, resulting
into continuous process of erosion.
Kharif crops: The major crops taken in kharif season are Soyabean, Maize,
jowar, Sesame.
Rabi crops : The major crops taken in Rabi season are Wheat and Chickpea.
3.3.3.Climate and rain fall: -
The climate in the Bundi District can be considered as arid. The study area is
experience rain during monsoon or in winter season.
Summer Season: The skies are mostly clear, highest temperature records in
summer season during March to May. The tanks, nearly dry up during summer
season. Temp varies from 35°-410c.
Winter Season: The cold winter season during December to February has
scanty precipitation and only dew in early hours support vegetative and vegetable
crops. Temperature varies from 18"24"cc.
The average rainfall in the study area ranges from 839 mm.
3.3.4.Demographic particulars: -
The present water shed study area extends over three villages namely
Bajaribarri witli an area of 300 ha, Kailsapura witli an area of 500 ha and the third
village Braodakalan with an arca of 500 ha. As pcr census 1991, the population in
Guna district was estilnatcd as 83.8926 and in Guna block i t was 1.34314 1akhs.
3.3.5.Ilisaster Vulnerability:
As mentioned above the soil groups in the study area have less poor internal
drainage and the watershed area fully depends upon southwest monsoon. So, this
area can be considered as disaster prone area.
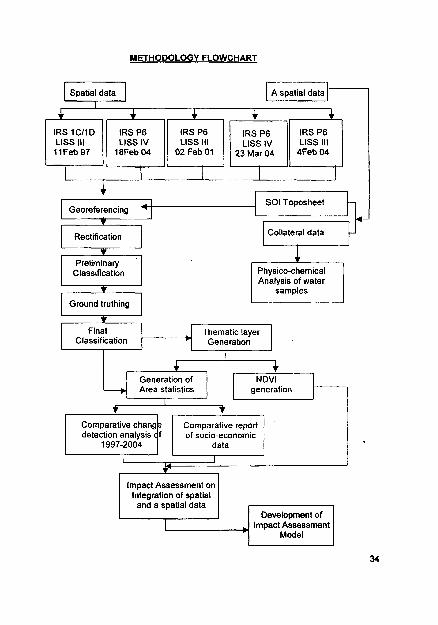
METHODOLOGY FLOWCHART
I
4 4 4 + -- 4 - IRS l C l l D IRS P6 IRS P6 IRS P6 IRS P6 LlSS Ill LlSS IV LlSS Ill LlSS IV LlSS Ill 1 lFeb 97 18Feb 04 02 Feb 01 23 Mar 04 4Feb 04
1 I
SO1 Toposheet
Rectification Collateral data
t Preliminany
Classification
t Ground truthing
t Final
Classification
1 Physico-chemical Analysis of water
samples
Thematic layer Generation
I + C Generation of Area statistics
NDVl generation
I + * Comparative change detection analysis
1997-2004 cf
Comparative report of socio-economic
data
I I P - -
Impact Assessment on Integration of spatial and a spatial data
Development of Impact Assessment
Model

4.MATERIALS AND METHODS
4. MATERIALS AND METHODS
4.1 DATA BASE:
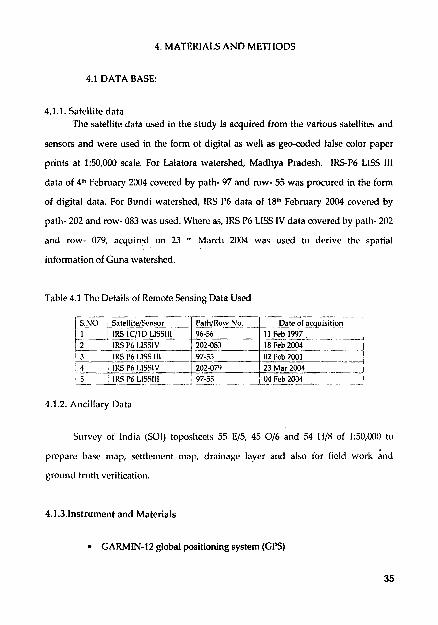
4.1.1. Satellite data The satellite data used in the study is acquired from the various satellites and
sensors and were used in the form of digital as well as geo-coded false color paper
prints a t 1:50,000 scale. For Lalatora watershed, Madhya Pradesh. IKS-1'6 LISS I11
data of 4Ih February 2004 covered by path- 97 and row- 55 was procured in the form
of digital data. For Bundi watershed, IRS P6 data of 18Ih February 2004 covered by
path- 202 and row- 083 was used. Where as, 1RS P6 LISS IV data covered by path- 202
and row- 079, acquired on 23 "' March 2004 was used to derive thc spatial
information of Guna watershed.
Table 4.1 The Details of Remote Sensing Data Used
S . s _ ~c!li~e/Scnsor Path/Row&: Date of __ acquisition -
1 IRS lC/lD LlSSlll 96-56 I 1 Feb 1997 2 IRS 1'6 LISSIV 202-083 18 Feb 2004 3 IRS 1'6 1.1SS Ill 97-55 - 02 Fcb 2001
--p - 4 IRS P6 LISSIV 202-079 23Mar2004 -
N R S P6 LISSIII - 97-55 04 Feh 2004 -.
4.1.2. Ancillary Data
Survey oi India (SO[) toposheets 55 G/5, 45 016 and 54 HI8 of 1:5O,OOO to
prepare base map, settlemrnt Inat>, drainage layer and also tor field work and
groi111d truth vcritication.
4.1.3.1nstrument and Materials
GARMIN-12 global positioning system (GPS)
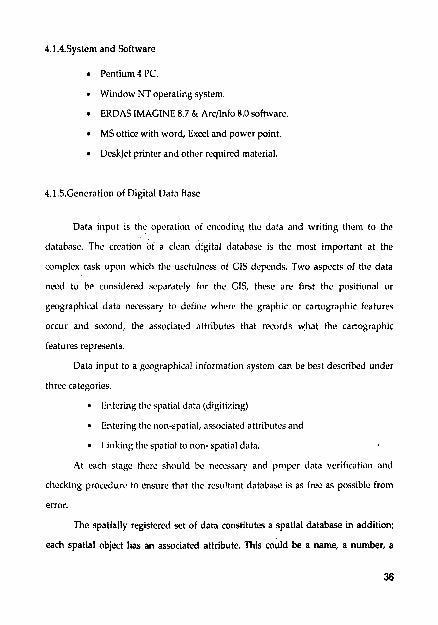
4.1.4.System and Software
Pentium 4 PC.
Window NT operating system.
ERDAS IMAGINE 8.7 & Arcllnfo 8.0 software.
MS office with word, Excel and power point.
Deskjet printer and other required material.
4.1.5.Generation of Digital Data Base
Data input is the operation of encoding the data and writing them to the
database. The creation of a clean digital database is thc niost important at the
complex task upon which tlie usctulness of CIS depcnds. Two aspects of the data
need to be considered separately for the CIS, these are first the positional or
geographical data necessary to define wherc tlie graphic or cartographic features
occur and second, the associated attributes that records what the cartographic
features represents.
Data input to a geographical information system can be best described under
three categories.
Entcring tlie spatial data (digitizing)
Entering the nun-spatial, associated attributes and
Linking the spatial to noli- spatial data.
At each stage there s l io~~ld be necessary and proper data vcritication and
checking procedure to ensure that the resultant database is as frec as possible froni
error.
The spatially registered set of data constitutes a spatial database in addition;
each spatial object has an associated attribute. This could be a name, a number, a
range of values, etc., tor example, contour has a number, and a road has a name.
Such attributes also form a part of database. Further, there may be other data sets
associated with the demographic data.
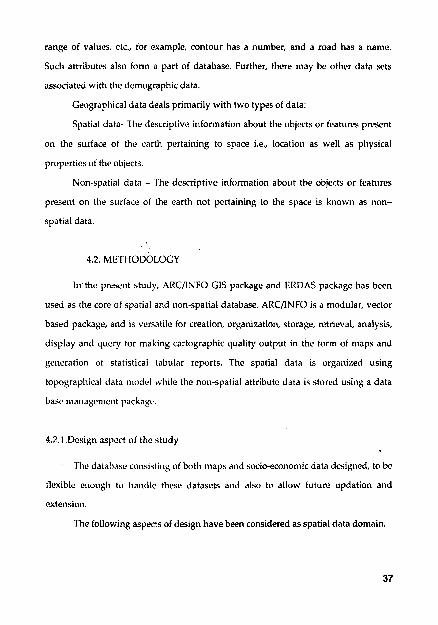
Geographical data deals primarily with two types of data:
Spatial data- The descriptive information about the objects or features present
on the surface of the earth pertaining to space i.e., location as well as physical
properties of the objects.
Non-spatial data - The descriptive information about the objects or feahlres
present on the surface ot the earth not pertaining to the space is known as non-
spatial data.
4.2. METHODOLOGY
In the present study, ARCIINFO CIS package and ERDAS package has been
used as the core of spatial and non-spatial database. ARCIINFO is a modular, vector
based package, and is versatile tor creation, organization, storage, retrieval, analysis,
display and query for making cartographic quality output in the form of maps and
generation ot statistical tabular reports. The spatial data is organized using
topographical data model while the non-spatial attribute data is stored using a data
base management packagc.
4.2.1.Design aspect of the study
Tlie database consisting of both maps and socio-economic data designed, to bc
flexible enongli to handle these datasets and also to allow future updatio~i and
The following aspects of design have been considered as spatial data domain.
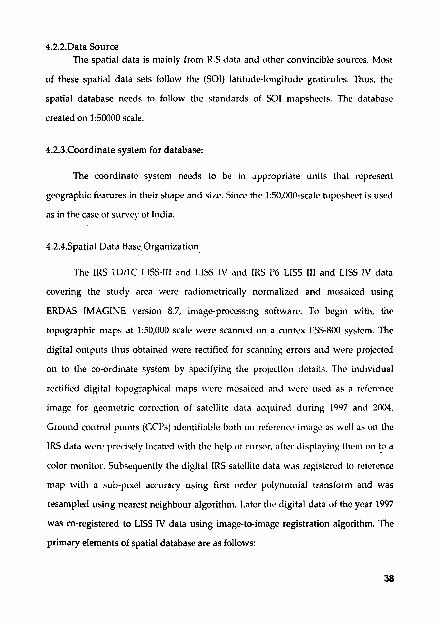
4.2.2.Data Source The spatial data is mainly from R.S data and other convincible sources. Most
of these spatial data sets follow the (501) latitude-longitude graticules. Thus, the
spatial database needs to follow the standards of SO1 mapshc~ts. The database
created on 1:50000 scale.
4.2.3.Coordinate system for database:
The coordinate systcni needs to be in appropriate units that represent
geographic features in their shape and size. Since thc 1:50,000-scale toposheet is used
as in the case ot survey ot India.
4.2.4.Spatial Data Base Organization
The IRS ID/IC LISS-111 and LISS IV and IRS 1'6 LISS I11 and LISS IV data
covering the study area were radiometrically normalized and niosaiced using
ERDAS IMAGINE version 8.7, image-processing software. 7'0 begin with, the
topographic maps at 1:50,000 scale were scanned on a contex FSS-ROO system. n7e
digital outputs thus obtained were rectified for scanning errors and were projected
on to the co-ordinate systcni by specifying the projection details. 'lhc individual
rectified digital topographical maps were mosaiced and were used as a reference
image for geometric correction of satellite clata acquired during 1997 and 2004.
Ground control points (GCl's) identifiable both on rctcrcnce imagc '1s well as on the
IRS data were precisely located with the liclp oi cursor, alter ~iisplayiir(: thenr 011 t!> a
color monitor. Subsequently the digital IRS satellite data was regislered to reference
map with a sub-pixel accuracy using first order polynomial transform and was
resanipled using nearest neighbour algorithnl. Later the digital data of the year 1997
was co-registered to LlSS IV data using image-to-image registration algorithm. The
primaly elements of spatial database are as follows:
4.3. TI-IEMATIC MAPS
Maps illustrating tlic theme behind them are called thematic maps. Various
thematic maps depict various surface features of tlic land. A thenlatic map contain
only identical features through out the map ignoring all the other features, thus
reducing the confusion prevailing because of other features. 'niematic maps arc.
prepared for specific purpose.
4.3.1.Preparation of Base Map:
Base map is an outline map on whicli thematic details are incorporated. Thc
nature of thematic map will not be the same; it depends o n tlie purpose oi map.
Toposheet will act as one of the input in the base map preparation, especially in the
use of remote sensing data. In the process of preparation of base map, the scanned
toposheets that cover tlie study area are required. Placing the trace paper o n the
toposheet, the major features like settlements, roads, rivers, water bodies, forest
boundaries etc are traced out. Thus, traced out sheet was considered as base map.
Tlie base map thus prepared from toposl~cet was used tor overlayi~ig on the
satellite imagery in order to prepare various thematic maps.
' h e base maps tor the three watersheds Bundi, Guns, I.alatord (M~lli) are
shown in fig 4.1,4 2 and 4.3.
4.3.2.Prcparation of [hainage Map:
Drainage map co~~ipriscs ot various streams and rivers tliat are flowing ill the
area. Drainage patterns and textures are dissection signatures and very important
terrain recognition elements, used as criteria for identification of geological and
geomorphological phenomena.
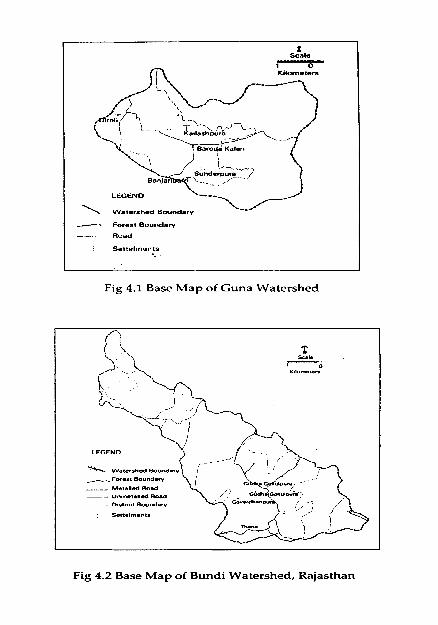
F i g 4.1 Base Map o f Guna Watershed
Fig 4.2 Base Map of Bundi Watershed, Rajasthan
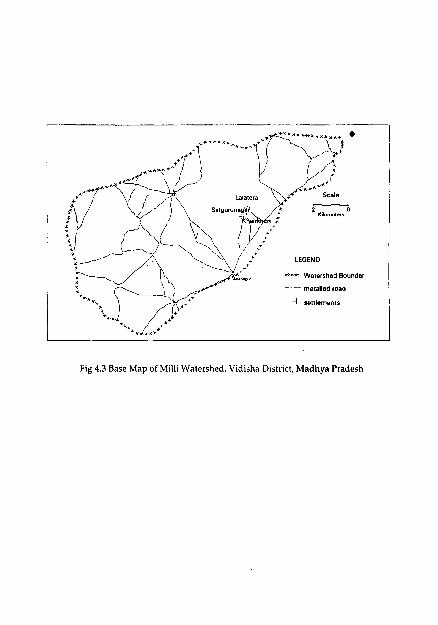
Fig 4.3 Base Map of Milli Watershed, Vidisha District, Madhya Pradesh
The drainage pattern truly reflects the hidden structural characteristics and
points out the tectonic history of an area. Various landforms and bedrocks depict six
most common drainage patterns. Drainage pattern is usually classified as
Dendritic
Rectangular
Trellis
I'arallcl
Sub parallel
Radial
Centripetal and
Deranged.
Stream order
'The first step in drainage basin analysis is order designation. The smallest finger-type
tributaries are designated orderl; where two first order channels join, a channel
segment of order 2 is formed; where two channels of order 2 join, a segment of order
3 is formed and so forth. When a higher order stream joins with a lowest order
strealns, the order of resulting stream is same as that of higher ordcr stream. 'The
trunk stream through which all discharge of water and scdi~llcnt passes is therefore
t l~c stream scgiuent ot higher order.
4.3.2.1.Stream number (Nu)
Tile number of stream segments present in each order is counted and
recorded. Graphical presentation of this data on semi-log paper yields straight-line
plots.
4.3.2.2.Bifurcation ratio (Rb)
The ratio between the number of stream segments of a given order (Nu) to the
number of segments of the next higher order (Nutl) is termed as biturcation ratio.
The bifurcation ratio is not same from one order to the next order because of
possibility of changes in the watershed geometry and lithology, but tends to be
consistent through out the series. Bifurcation ratio characteristics range between 3
and 5 for watersheds in which the geologic structi~res do not distort with drainage
patteni. High bifurcation ratio expected in the regions of steeply dipping rock, strata
where narrow strike vallrys are confined between ridges.
The drainage layer of the study area was prepared by digitizing the streams
from the Suwey of India (SOI) toposhects of 1:50000 scale. Thc drainage pattern of
the study area is dendritic to sub-dendritic.
The drainage network map for the thrcv watersheds Biuidi, Guna and
Lalatora(Mil1i) are shown in fig 4.4, 4.5 and 4.6.
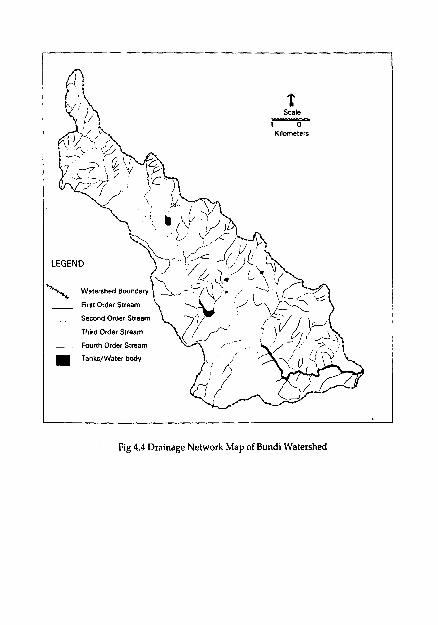
Scale
1 r - - r
I
Fig 4.4 Drainage Network Map of Bundi Watershed
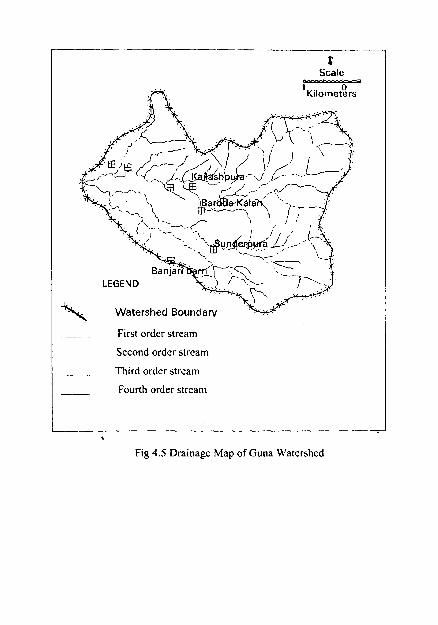
First order stream
Second order stream
Third order stream
Fourth order stream
Fig 4.5 Drainage Map of Guna Watershed
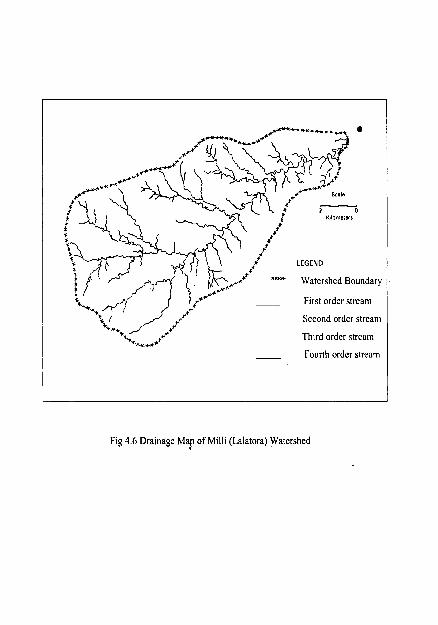
Fourth ordcr stream -
Fig 4.6 Drainage Map of Milli (Lalatora) Watershed
4.4. PREPARATION OF LANDUSE 1 LANDCOVER MAP
Satellite remote sensing techniques are of immense value for preparing
accurate landusc/landcover map and monitoring changes at regular provided
intervals of time.
Digital interpretation: Image classification is the process of categorizing (all
pixels in an image into land cover classes or themes) tlie rcniotely sensed data into
land cover classes or information. Normally, multi-spectral data are used to pertorm
the classification i.c., different feature types manifest different combinations of (DN
values) Digital Numbers based on their inherent spectral reflectance and emitt'ince
properties. Spectral pattern recognition rcfcrs to thr family oi classiiication
procedures that utilizes this pixel-by -pixel spectral intor~iiation as the basis tor
automated land cover classification.
4.4.1.Supcrvised classification
111 this classification the image analyst "supervises" the pixel categorization
proc~5s by specifying, to the computer algorithm, representative sample 4tes of
known cover type, called training arcas, as u ~ d to compile a numerical
"interpretation key" that describes the spectral ottrihutes for each feature type of
interest. Each pixel in the data sct is thcn compared numerically to each category in
the interpretation key and labels with tlie name of the catcgory it "look most like".
4.4.2.Basic steps involved in supervised classification.
The analyst identifies representative training areas and develops a numerical
description of the spectral attributes of each land cover type of interest in the stage.
Each pixel in the image data set is categorized in to land cover class, it most
closely resembles. If the pixel is insufiiciently similar to the training datasct it is
usually labeled 'unknown'.
Being digital in character, the result may be used in a number of different
ways. Output products are thematic maps; tables of full scenes or sub scene are a
statistics for various land cover classes, and digital data files amenable to inclusion in
a GIs. In the later case the classification "output" becomes a GIS input
The training stage: the training effort required in supervised classification is
both an art and science. It requires close interaction between the i m a g analyst and
the image data. It also requires substantial reference data and a tlirough knowledge
of the geographic area to which the data apply. Most iniportantly the quality of the
training processes determines the success of the classification stage and therefore the
value of information generated from the entire classification effort.
The overall objective of the training process is to assemble a set of statistics
that describe the spectral response pattern for each land over type to be classified in
an image.
4.4.3.Unsupervised classification
The fundamental difference between these techniques is that supervised
classification involves a training stcp followed by classification step. In the
unsupcrvisd approach tlic image data arc first classified by aggregating then into
the natural spectral grouping or clusters present in the scene. 'l'hcn, the image atlalyst
determines thc land cover identity of these spectral gnlilps by comparing the
classified data to ground refereucc data.
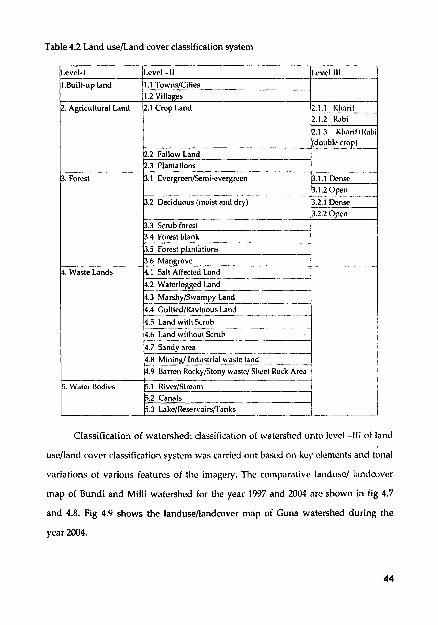
Table 4.2 Land usenand cover classification system
Level-l
1.Built-up land
(double crop) 2.2 Fallow Land -+---I
2. Agricultural land
2.3 Plantations _' 1.2 Villages 2.1 Crop land 2.11 %arc- _
2.1.2 Ihbi -i 2.1.3 Kharif+l<ab!
I. Forest 3.1 Evergrwn/kmi-evergreen
~
3.2 Deciduous (moist and dry) C I. Waste Ldnds
4.6 Land n~itl~out Scrub
- -. -. .-
Classification of watershed: classification of watershed unto level -111 ot land
use/Iand cover classification system was carried out based on key clements and tonal
variations of various features ot the imagery. The coluparative landuse/ landcover
niap of Bundi and Milli watershed for the year 1997 and 2004 arc sliown in fig 4.7
and 4.8. Fig 4.9 shows the landuse/landcover map of Guna watershed during the
year 2004.
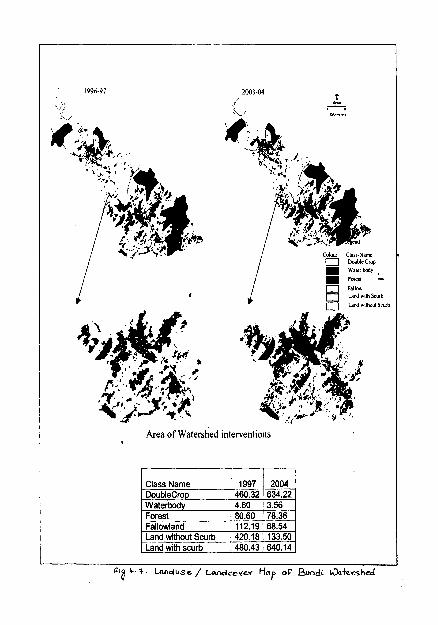
Area of watershed interventions
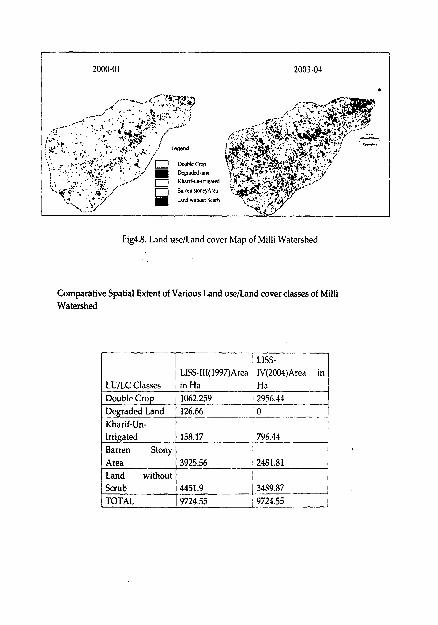
Fig4.8. Land use/Land cover Map of M~lli Watershed
Comparative Spatial Extent of Various Land usenand cover classes of Milli Watershed
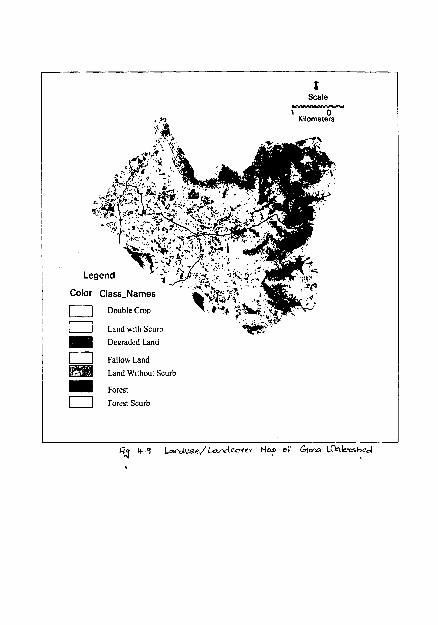
I Scale
Color Class-Names
0 Double C r o ~
Land with Scurh
De~raded Land
Fallow Land
Land Without Scurb
Forest a Forest Scurb
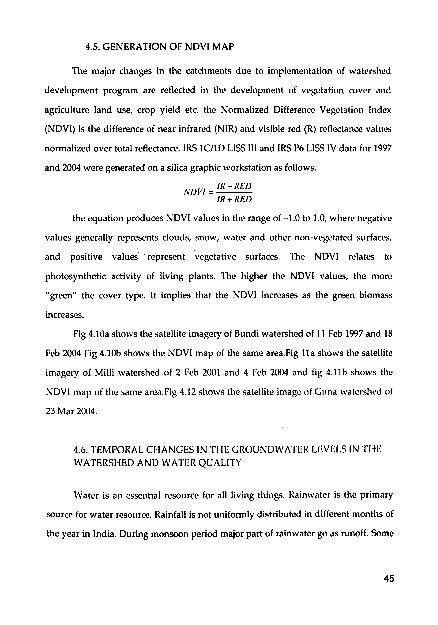
4.5. GENERATION OF NDVl MAP
The major changes in the catchments due to implenientation of watcrshcd
development program are reflected in the development of vegetation mver and
agriculture land use, crop yield etc. the Normalized Difference Vegetation Index
(NDVI) is the difference of near infrared (NIR) and visible red (R) reflectance valt~es
normalized over total reflectance. IRS lC/lD LlSS 111 and IRS 1'6 LlSS IV data for 1997
and 2004 were generated on a silica graphic workstation as follows.
IR - RED NDVl = -
IR + RED
the equation produces NDVl values in the range of -1.0 to 1.0, where negative
values generally represents clouds, snow, water and other non-vegetated surfaccs,
and positive valucs represent vegetative surfaces. The NDVI relates to
photosynthetic activity of living plants. The higher the NDVl values, the more
"green" the cover type. It implies that the NDVl increases as the green biomass
increases.
Fig 4.10a shows the satellite imagery of Bundi watershed of 11 Feb 1997 and 18
Feb 2004 Fig 4.10b shows the NDVl map of the same area.Fig l l a shows the satellite
imagery of Milli watershed of 2 Fcb 2001 and 4 Fcb 2004 and fig 4.11b shows the
NDVI map of the sanic area.I:ig 4.12 shows thc satellite image (11 Lund watcrsheci (lf
23 Mar 2004.
4.6. TEMPORAI. Cl-IANGI<S IN 'rl-lli GROUNDWATER I.I:VEl.S IN TIfE WATIiRSIIED ANI) WATER QUALITY
Water is an essential resource for all living things. Rainwater is the primary
source for water resource. Rainfall is not uniformly distributed in different months of
the year in India. During monsoon period major part of rainwater go as runoff. Some
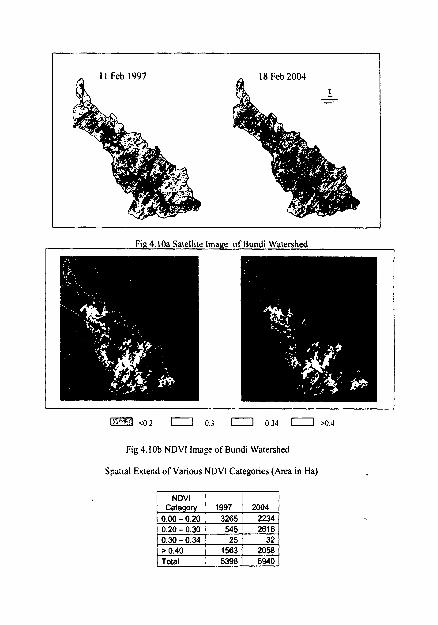
FIE 4.10a Satellite Image o f Bundi Watershed
c0.2 0 0 Oj 0 0.34 1 10.4
F I ~ 4 . l ob NDVl Image of Bundi Watershed
Spatial Extend o f Various NDVl Categories (Area in Ha)
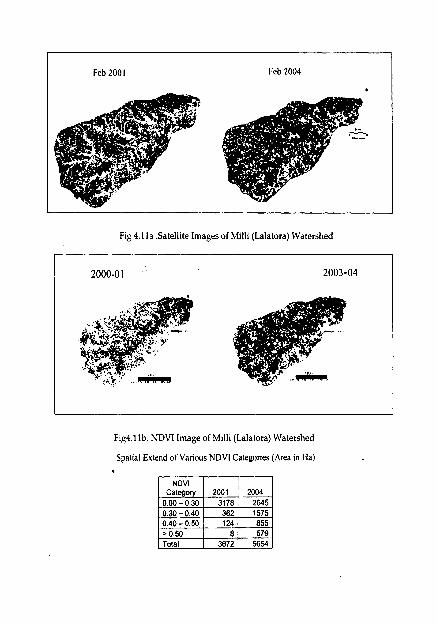
Feb 200 1 Fcb 2004
F I ~ 4.11a .Satellite Images of M~lli (Lalatora) Watershed
2000-01 2003-04
Fig4.llb. NDVI Image of Milli (Lalatora) Watershed
Spat~al Extend of Various NDVI Categories (Area In Ila)
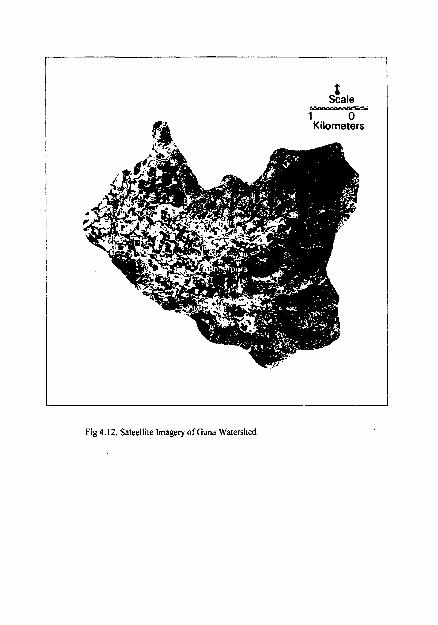
T Scale
Fig 4.12. Sateellite Imagery of Guna Watershed
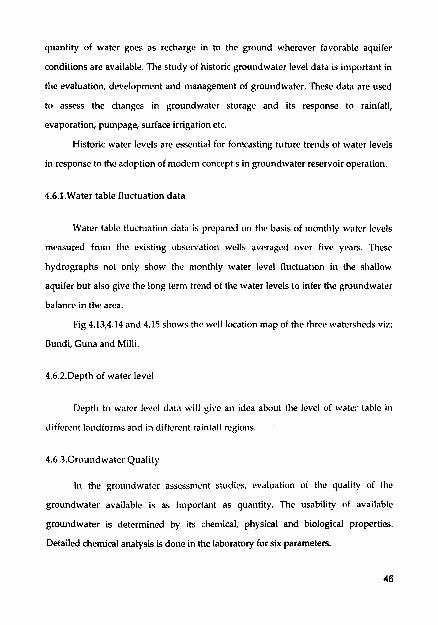
quantity of water goes as recharge in to the ground wherever favc~rablc aquifer
conditions are available. The study of historic groundwater level data is important in
the evaluation, development and management ot groundwater. These data are used
to assess the changes in groundwater storage and its response to rainfall,
evaporation, pumpage, surface irrigation etc.
Historic water levels are essential for forecasting future trends ot water levels
in response to the adoption of modern concept s i n groundwater reservoir operation.
4.6.1.Water table fluctuation data
Water tablc fluctuation data i.; prepared on tlic basis of monthly water levels
measured from the existing observation wells averaged over five years. These
hydrographs not only show the monthly water level fluctuation in the shallow
aquifer but also give the long term trend of the water levels to infer the groundwater
balance in the area.
Fig 4.13,4.14 and 4.15 shows the well location map of the three watersheds viz;
Bundi, Guns and Milli.
4.6.2.Depth of water level
Depth to water level data will give an idea about the level of watci. table in
difierent landfor~us and in diftcrent mintall regions.
4.6.3.Groundwatcr Quality
111 the groundwater asscssnlcnt studies, evaluation of tllc quality of the
groundwater available is as important as quantity. The usability of available
groundwater is determined by its chemical, physical and biological properties.
Detailed chemical analysis is done in the laboratory for six parameters.
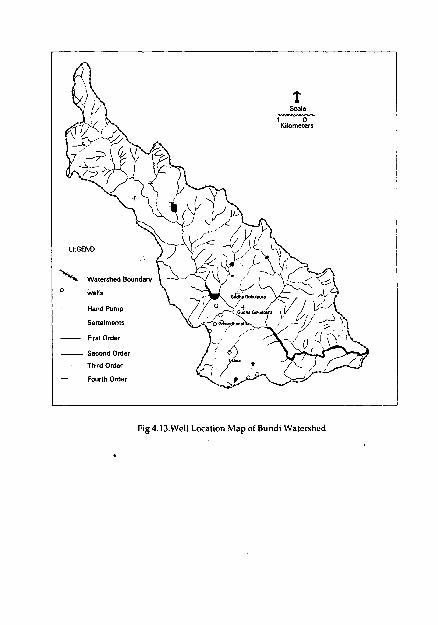
Fig 4.13.Well Location Map of Bundl Watershed
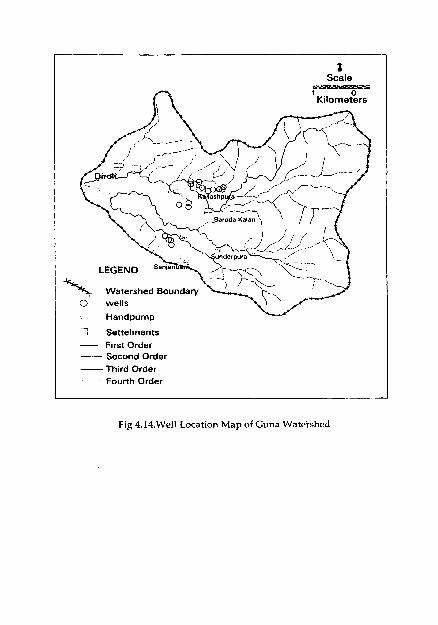
; Settelrnents -- F~rst Order
Second Orde~ - Third Order
Fourth Order
Fig 4.14.Well Location Map of Guna Watershed
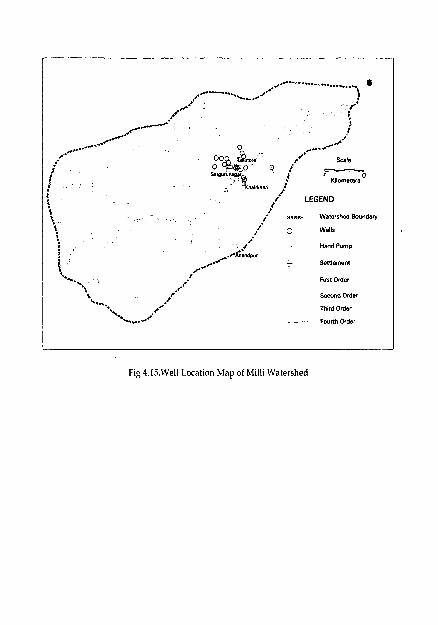
Fig 4.15.Well Location Map of Milli Watershed
Groundwater is used tor irrigation, drinking (human & livatock) and
industrial purposes. Certain quality standards have been established for evaluating
suitability of water for drinking, other domestic usage, irrigation and industrial use.
The suitability of water for irrigation has been based on electrical conductivity
(EC) and TDS. For various crops different proportion of EC and 'TDS are classified
based on tolerance capacity of different crops and soil types.
For the purpose of drinking water, WHO standards are referred.
pH
pH is negative logarithni of hydrogen ion concentration. Fresh distilled water
has a pH of 7.Acidic watcr havc a pH of 0 to 7, where as alkaline water havc pH
ranging from 7 to 1.l.pH nieter is calibrated using distilled water and further
calibrated using the standard butter solution of pH 4 and 7.The pH electrode is
washed with distilled water after calibration and then dipped into the beaker
containing sample watcr, whose pH is to be found .
Electric Conductivity
Conductivity is the capacity of the water to carry an electrical current and
varies both with number and types of ions the solution contains, which in turn is
related to the concentration of ionized substance in the watcr. Conductivity meter is
calibrated using distilled watcr and i~1rI1i~r calibrated using U.1M I'otassium
Chloride. 7'hc clcctrode is washed with distilled water aRer calibration and then
dipped into the beaker contai~iing saniple watcr, whose conductivity is to be found.
I'hosphates
1'hoqphatc.s pn:scsllr in water under acidic conditions react with ammonium
molybdate to form molybdophosphoric acid .This is reduced to molybdenuni blue by
adding reducing agent such as stannous chloride. The intensity of blue colored
complex is measured which is directly proportional to the concentration of
phosphate present in the sample.
Fluoride
Fluorides present in water under acidic condition react with zirconium
SPADNS solution and the color of SL'ADNS reagent gets bleached due the formation
of zirconium hexa fluoride and this result in bleaching of the reddish color of
zirconium and alizarian combination. The decrease in intensity of color is directly
proportional to fluoride concentration.
Nitrate
Nitrate is the most highly oxidized form of nitrogen compounds colnmonly present
in natural waters, because it is the product of the aerobic decomposition of organic
nitrogenous matter. Water sa~nplc with boric acid and Dcvarda's alloy is distillated
in Kjdledal distillation unit a ~ i d it is further titratcd with sulphuric acid in auto
titrator.
Total Dissolved Solids TDS in water sample is found by mixing the waters sa~nplc thoroughly and filtering
the sample through Wattman filter paper. The filtered sample is evaporated on a hot
plate. The hot dried sample is dried in a desicator.The weight of the saniplc is
measured.

5.RESULTS AND DISCUSSIONS
5.RESULTS AND DISCUSSION
5.1 INTRODUCTION
The major changes in the catchments due to implementation of integrated
watershed development programs are having reflections in the development of
vegetation cover agricultural land use, groundwater table and crop yield
Proper utilization and management of natural resources depends on tlie
development of effective resource information database and remote sensing and CIS
are one of the key tools which have capability to provide real time information that
makes it possible to have meaningful repetitive surveys which can show tlie changrs
that have taken place. Satellite image interpretation has enabled to use an objective
assessment of monitoring oi agricultural land use and vegetation.
5.2 RESULTS OF THEMATIC MAPPING
All the resource themes generated by the thematic mapping are discussed
below:
T l~e drainage network map with the water bodies and streams are identified
for the three watersheds.The drainage pattern and streams are identified for the tI1rc.e
watersheds Bundi, Guna, and Milli and are found to be dendritic pattern and coarsr
texture.
The dcndritic pattern is the most common type of pattern found by a main
strean1 with tributary branching and rebranching truly in all the possible directions.
It is generally de~vloped up on homogenous rocks of uniform resistance sucll ah
horizontally bedded sedinielitaly rocks, n~assive igneous rocks and completely
metamorphosed rocks.
In the three watersheds Bundi, Guna and Milli (Lalatora) the drainage
network is coming up to 4Ih order stream the bifurcation ratio is below 4. l'his
indicates less soil erosion in these areas and the geological formation is not disttirbed.
In order to study the change in biomass and its temporal behavior in the
watershed NDVl images are generated for the two watersheds (Lalatora and Bundi)
from satellite data.
For Bundi watershed NDVl images from satellite data of 11 Feb 1997 and 18
Feb 2004 are generated to study the impact of watershed development programs on
the study area. Fig 4.10a shows the satellite data of the watershed during the period
and fig 4.10b shows the corresponding NDVI images. Change in colours indicates an
increasing trend in NDVI values from 0.05 to 0.4 and above.
Fig 5.1 shows improved vegetation cover in Bundi watershed as sccn under
temporal satellite data. Fig 5.la. shows thc efforts which have been made by thc
implementing agency to educate thc people to minimize the human and livestock
interference with the natural species as seen in the satellite data, bunding has been
carried out and allowed the natural species to restore/n~aintain the biodivrrsity of the
region. Fig 5.lb.iniproved vegetation cover seen in different crowns of red colour,
can be observed in the year 2003.Similarly in the Fig 5.lc and 5.ld to the south -west
of the image improved vegetation cover can be sccn.
Similar NDVl images were generated tor Lalatora (Milli) watershed .Fig 4.11a
shows satellite image of Lalatora watershed for 2 I:eb 2001 and 4 Pcb 2004 and fig
4.11b shows NIIVI images for same data. Progressive dcvelopment in biomass iovcr
in terms of NDVI could be seen as yellow, Magenta, Red, Green and dark green
colour indicating an increasing trend ill NUVl valites from 0.05 to 0.4 and abovib.
For Guna watershed comparative NDVI image could not be generated due to
non-availability of data. Fig 4.12 shows the Satellite data of Guna watershed of 23
Mar 2004.
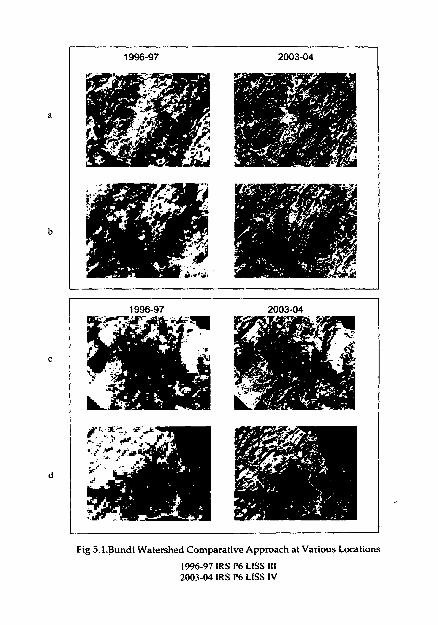
Fig 5.l.Bundi Watershed Comparative Approach at Various Locations
1996-97 IRS P6 LlSS 111 2003-04 IRS P6 LlSS IV
A comparison of biomass for Bundi and Lalatora Watersheds during the years
1997-2004 and 2001-2004 clearly brings out positive changes that have taken place
during the last seven years.
I'reliminary interpretation of satellite data has been carried out using visual
interpretation. Apart from NDVI, a change in agricultural landuse has been used to
study the impact of watershed program.
The various landuse/landcover classes delineated in these watersheds include
agricult.~ral land, wastelands, water bodies, forests etc.
Comparative landuse/landcover map for Bundi and Lalatora are shown in Fig
4.7 & 4.8 and watershed wise area statistics is furnished. Land Use/land cover map of
Guna watershed for 2004'ib shown in Fig 4.9
During tlie process of well inventory water quality monitoring was carried out
on selected wells in the three watersheds (Bundi, Guna and Lalatora)
The locations of these wells are mapped. Fig 4.13, 4.14&4.15 shows the well
location map of these watersheds. Only those wells are shown in the map from
which the water samples were collected. Table 5.5 shows the details of number of
wells present in the watershed. The geographic coordinate's latitude/longitude of all
wells of Guna & Milli watershed is given in table 6 for further Stndy.Thc location of
wells arc cool.dinated with stream order and land use/land cover pattern of tlie
particular watersheds.For Guna and Milli watershed the wells are mainly located on
second, third and fourth order streams .Where as in Bundi the sample wells are
located inside the village away from the stream. The bifurcation ratio is below 4 in
the three watersheds.
Water quality analysis was carried out for four months Febmaly, April, July
and October 2004 from selected wells in the three watersheds. The groundwater
levels of these wells were also monitored. Ten samples from Bundi watershed,
twenty samples from Guna watershed and sixteen samples from Lalatora watershed
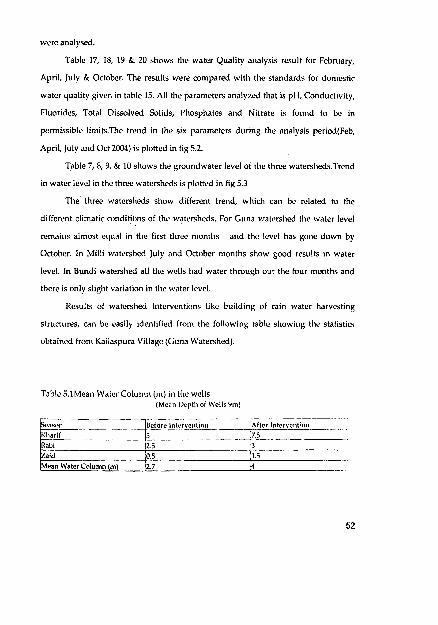
were analysed.
Table 17, 18, 19 & 20 shows the water Quality analysis result for February,
April, July & October. The results were compared with the standards for domestic
water quality given in table 15. All the parameters analyzed that is pH, Conductivity,
Fluorides, Total Dissolved Solids, Phosphates and Nitrate is found to bc in
permissible limits.Thc trend in the six parameters during the analysis period(Fcb,
April, July and Oct 2004) is plotted in tig 5.2.
Table 7, 8, 9, & 10 shows the groundwater level of the three watt*rsheds.Trend
in water Ievel in the three watersheds is plotted in fig 5.3
The three watersheds show different trend, which can be related to the
different climatic conditions of the watersheds. For Guna watershed the water level
remains almost equal in the first three months and the level has gone down by
October. In Milli watershed July and October months show good results in water
level. In Bundi watershed all the wells had water through out the four months and
there is only slight variation in the water level.
Results of watershed Interventions likc building of rain water harvesting
structures, can be easily identified from the tollowing table showing the statistics
obtained from Kailaspura Village (Guna Watershed).
Table 5.1 Mean Watcr Column (m) in the wells (Mcan I>rptll of Wcll,9m)
Sraron -- -. Kharii Itabi Zaid
Mean Water Column (m)
llefore Inlrrve~~lion - .-
2.5 0.5
2.7
Afler Inlervrnl-on ~- ..~ ~
7 . L . 3 -- 1.5 -. --
4 . .
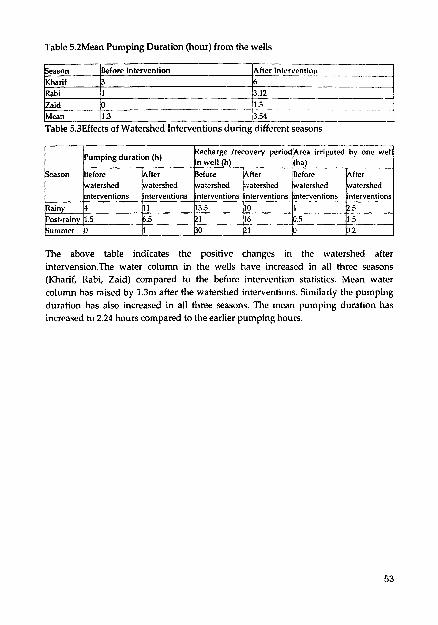
Table 5.2Mean Pumping Duration (hour) from the wells
umpingduration(h) echarge /recovery pcriodArca irrigated by one well
n well fhb ha) 1
Season Khar~f
Rab~
?!%-.-!-- Mean
Uefore lnterventlon After lntervenl~on 3 1
-__ -.lr -- 1 3 3 54
The above table indicates the positive changes in the watershed after
Table 5 3Effects of Watershed Interventions during different seasons
Season
Rainy
intervension.The water column in the wells have increased in all thrce seasons (Kharif, Rabi, Zaid) compared to the before intervention statistics. Mean water
\ , ,> ,
column has raised by 1.3m after the watenhed interventions. Similarly the pumping
Before watershed interventions
4
duration has also increased in all three seasons. The mean pumping duration has increased to 2.24 hours compared to the earlier pumping hours.
After '*:atershed interventions
11
before watershed interventions
13.5
After wstershed interventions
. . - 2 _ _ _ _ _ .5
After before watershed 'nterventions
10
watershed interventions
I
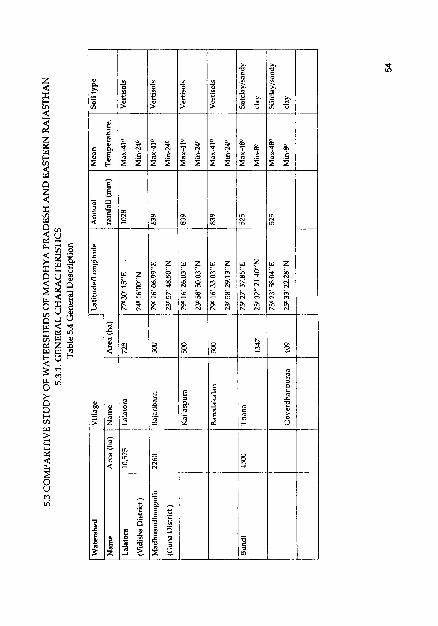
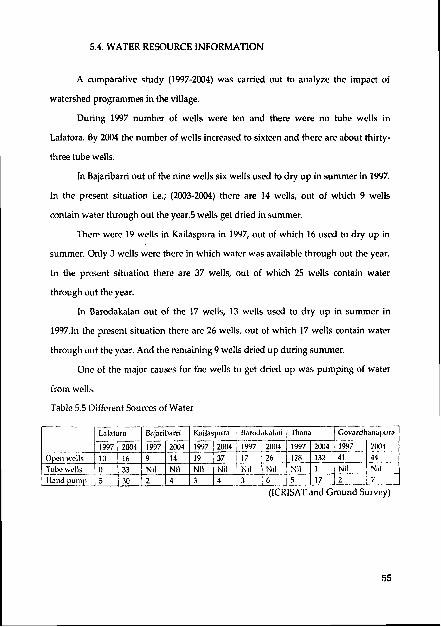
5.4. WATER RESOURCE INFORMATION
A comparative study (1997-2004) was carried out to analyze the impact of
watershed programmes in the village.
During 1997 number of wells wcre ten and there wcre no tube wells in
Lalatora. By 2004 the number of wells increased to sixteen and there are about thirty-
three tube wells.
In Bajaribarri out of the nine wells six wells used to dry up in summer in 1997.
In the present situation i.e.; (2003-2004) there are 14 wells, out of which 9 wells
contain water through out the year.5 wells get dried in summer
There were 19 wells in Kailaspura in 1997, out of which 16 used to dry up in
summer. Only 3 wells were there in which water was available through out the year
In the present situation there are 37 wells, out of which 25 wells contain water
through out the year.
In Barodakalan out of the 17 wells, 13 wells used to dry up in summer in
1997.111 the present situation there are 26 wclls, out of which 17 wells contain water
through out the year. And the remaining 9 wells dried up during summer.
One of the major causes for the wells to jict drled up was pumping of water
from wells.
Table 5.5 Different Sourccs of Water
(ICRISAT and Ground SU.;:~) $?:
Ilnrodakalan 'fhana Govardltd~~,>~tt~rn
;-; 2004 199'7 2W4- 1 %
N!l- 17.
0 >cn ~ ~ l l s 'l'ttbc wells . I i a n d ~ i l > .. .
Bqaribarri Kailaspura
33 30
1-
9 Nil 2
1997
19 Nil 3
2004
14 I Nil 4
2044
37 Nil 4 - 3
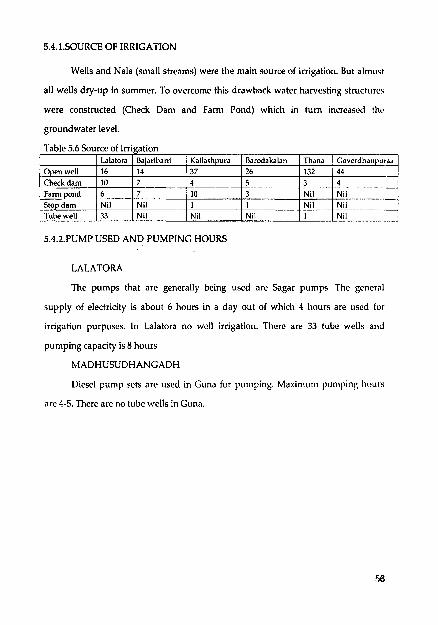
5.4.1.SOURCE OF IRRIGATION
Wells and Nala (small streams) were the main source of irrigation. But almost
all wells dty-up in summer. To overcome this drawback water harvesting structures
were constructed (Check Dam and Farm Pond) which in turn increased thc
groundwater level.
5.4.2.PUMP USED AND PUMPING HOURS
LALATORA
The pumps that are generally being used are Sagar pumps. The general
supply of electricity is about 6 hours in a day out of which 4 hours are uscd tor
irrigation purposes. In Lalatora no wcll irrigation. There are 33 tube wells and
pumping capacity is 8 hours
MADHUSUDHANGADH
Diesel pump sets are used in Guna for pumping. Maximum puniplng h~wr.;
arc 4-5. There arc no tube wells in Guna.
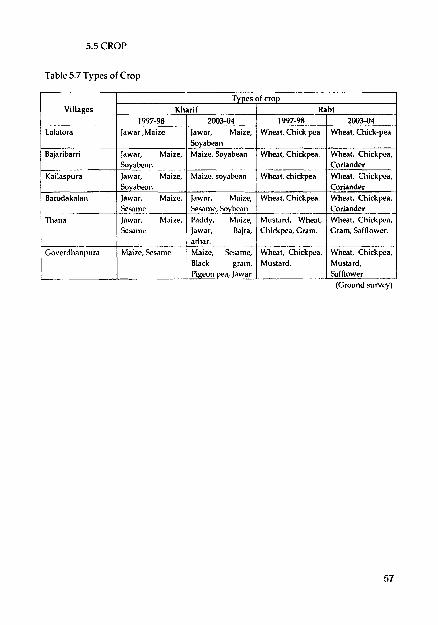
Table 5.7 Types of Crop
1 Soyabeati Bajaribarri I Jawar, Maize, I Maize. Soyabean I Wheat, Chickpea. I Wheat, Chickpea,
V~l lages
-- Lalatora
Types of crop
1 Soyabean
Sesame _ - Sesame, %yhan , 1 , 1 Coriander --ti;=,,, Thana M& Mustard Wheat Wheat, Cl i idp-a,
Kl iar i f 1997-98 1 2003-04
Jawdr ,Maize I Jawar, Maize,
I 1 Coriander
I Soyabean
I sesame I jaw;. I1ajra. / Chickpea, Gram. I ram, safflower.
Kabi 1997-98 1 2003-04
Wheat, Chick pea 1 Wheat, Chick-pea
Kailaspura 1 Jawar, Maize, I Maize, myabean / Wheat, chickpea I Wheal, Cliickpea, 1 Coriander
Coverdhanpura Maize, Scwme Maize. Sesat~ic, Wheat. Chickpea, Wheat, Chickpea. ~ - i i ~ ~ ~ l Mustard, Pi eon a, Jawar Safflower. -
(Ground survey)
Harodakalan ( Jawar, Maize, I Jawar. Maize. I Wheat, Chickpea. 1 Wheat, Chickpea.
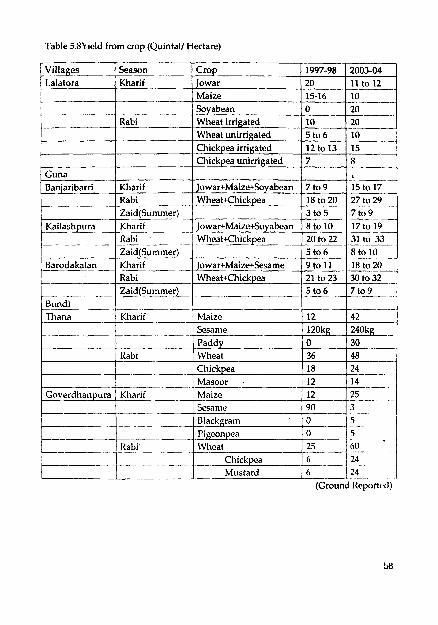
Table 5.8Licld from crop (Quintall Hectare)
Villages Lalatora
-.
Season Kharif
Guna Banjaribarri
.- - -. - .-
Rabi
Kailashpura
- -
-- Barodakalan
- Bundi Thana
Kharif Rabi - -- -.
ZaidfSummerl
Rabi - - -
- ..
2003-04 11 to 12 in
Crop Jowar Maize Soyabean Wheat irrigated Wheat unirrigated Chickpea irrigated Chickpea unirrigated
1997-98 20 15-16
]owar+Maize+Soyabean Wheat+Chickpea _
17 to 19 31 to 33 8to10 18 to 20 30 to 32
7 t 0 9 -
42 240kg
Kharif Rabi ~ a i d ( ~ u m n l e r ) Kharif Rab~
Za~d(S=r) -.
Kharif --
Paddy Wheat Chickpea Masoor
0 10 5 t o 6 12to13 7
20 20 10 15 8
7 to 9 18 to 20 3 t o 5
Jowar+Maize+Soyabean Wheat+Chickpea '
Jowar+Maize+Sesame WheatKhickpea
Mawe Sesame
0 36 18 12
Govcrdhanpura -
--
15 to 17 27 to 2 9 ~ -
7 t o 9 8 to 10 20 to 22 5 t o 6 9 to 11 21 to 23 5 t o 6
12 120kg
(Ground I<eporf(*l)
30
48 ____ 24-_ '4 -
12 90 0 0
25 6 6
-. 25 3
5 _ _ _ 5 .__ . 6[!--
24 24
Khar~f
-- -
Maize Sesaiiie Blackgram
3 z o n p e a Wheat
-- Chickpca Mustard
- --
--
- Ilab~ _-
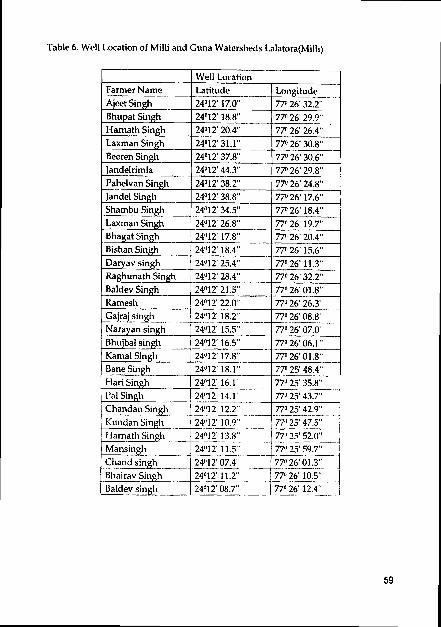
Table 6. Well Location of Milli and Guna Watersheds Lalatora(Mil1i)
Daryav singh Raghunath Singh Baldev Singh IZamesh Gajraj singh - - -.-A
Narayan singh Bhujbal sing11 Kamal Sing11 Bane Singh I-lati Singh - Pal Singh C h a n d a n ~ i
- - .
24U12' 25.4" 24012' 28.4" 24"12' 21.5" 24O12' 22.0" 24f11"l.2" .-
24"12' 15.5'
77O 26' 11.3" 77O 26' 32.2" 77O 26' 01.8" 77" 26' 26.3" 77" 26' 08.8"
--
77V6' 07.0"
Kundan Singh 24"12' 10.9" . -- .-
24O12' 16.5" - 24"12' 17.8" 24O12' 18.1': 24"12' 16.1" -- 24"lT 14.1'------ 24"12' 12.2
~
77" 26' 06.1" 77" 26' 01.8" _-
77" 25' 48.4" 77" 25' 35.8" .- ~~
77" 25' 43.7"
77n 25'429 ~ -
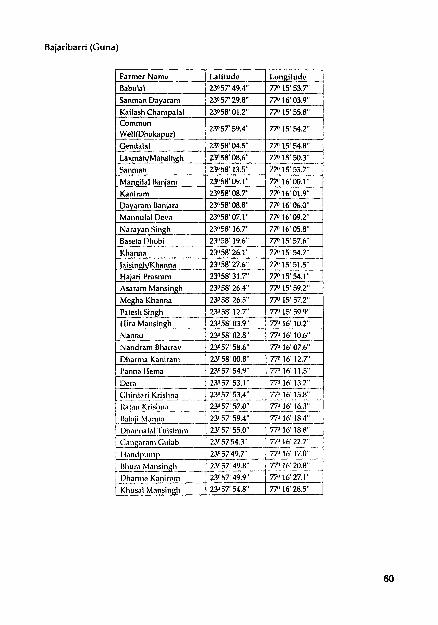
Bajaribarri (Guna)
Kailash Champalal 1 23O58' 01.2" 1 77' 15'55.8.'
ParmerNamn _ - Babulal
Sanman Davaram
Common ]23057'59I '15'542- Well(Dhokapur) - - - I Cendalal 23058' 04.Y 770 15' 54.8" LaxmanIMansin h 23°58'08.6 770 15' 50.3
Sanman 23"58' 13.5" 77' 15' 53.7
Man ilal Ran'ara 23t1S8'UY.l" 1 7P 16'00.1"
Latitude -- 23'57' 49 .4 --- 2305T 29.8"
1)harnia Kaniram
Longitude
770 15' 53.T' 77J 16'03.9"
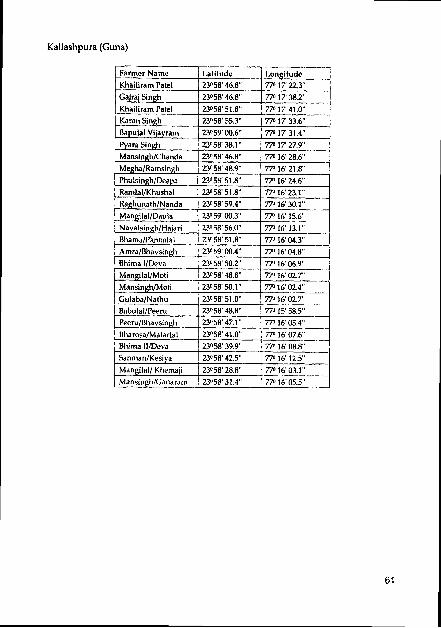
Kailashpura (Guna)
Bhama/Pannalal Amra/Bhavsingh Bhima IIDeva -
23'ISR. $18 23"59' 00.4
23"5R' 5 5
- 7 7 y 6 . 0 4 7 -
77 16' 04.8"
i"P 1626.9'1- -
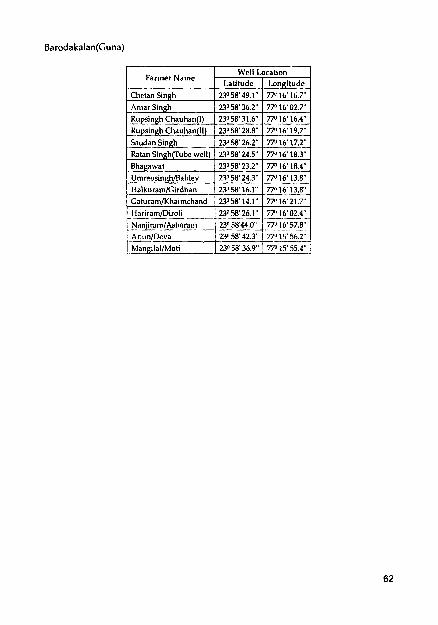
Farmer Name
Saudan Singh 1 230 58' 26 .2 1 77" 16' 17.2" Ratan Singh(Tube well) ( 230 58' 24.5.' 1 77" 1618.3'.
Rhagawat Umr?osingh/Baldev Iialkuram/Girdhan
23Q58'23.2
21"58'24.3 23"58' 16.1"
77" 16' 1 R . 4
77' 16' 13.8"
77" 16' 13.8"
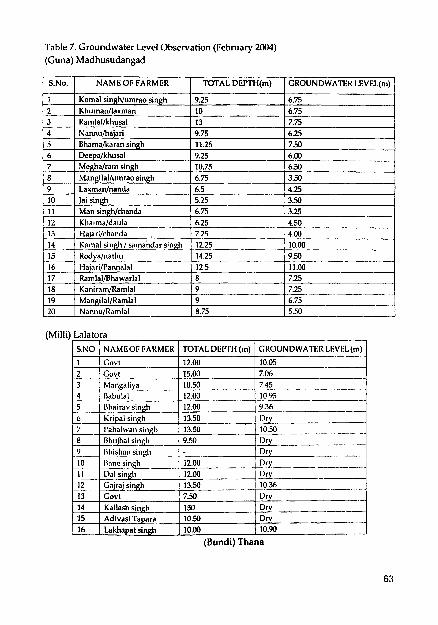
Table 7. Groundwater Level Observation (February 2004) (Guna) Madhusudangad
6 -tripal s~ngh 13.50 Dry 7 I'ahalwan ~ingh 13.50 10.50 S Illrujbul sinfill 9.50 Ilry .- .- 9 Blri$ashll Dry 10 Ilanc s x 12.00 Dry -- 11 l).~l ~ i t i f i l ~ 12.00 Dry
I 2 Gajraj sin& 13.50 lo." - -. .. --- -- 13 Govt 7.50 Dry 14 Kailasli sing11 150 Dry 15 Adivasi Tapara 10.50 Dr 16 Lakhapat singh 10.00 10.90
(Bundi) Thana
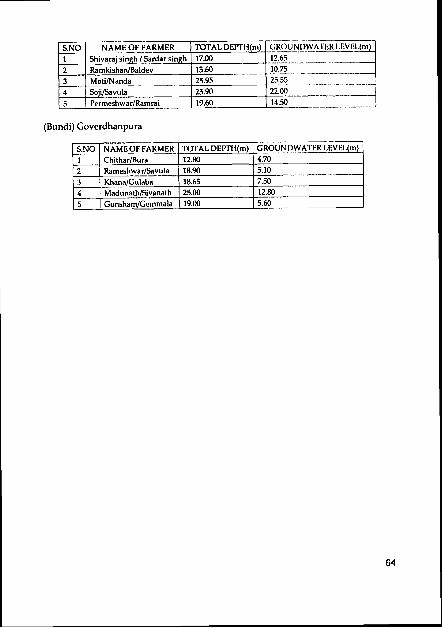
(Bundi) Goverdhanpura
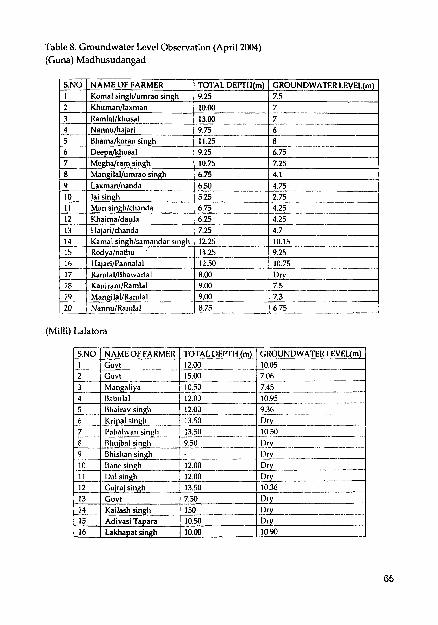
Table 8. Groundwater Level 0bservat;on (April 2004) (Guna) Madhusudangad
(Milli) Lalatora
S.NO NAME0I:I:ARMER 1 Govt 12.00 2 Govt 1500 - 1 '.Oh .
l3hnjbnl singlr
15 Adivasi Tapara 10.50 Dry 16 Lakhapat singh 10.00 10.90
9 10
Tl-._-. 12 13
IjhisIra11 si~rph -- Ilane sing11
singh Gajrajsingh Covt
.
'_2!!L 12.00 13.50 7.9
I ) r ,
Dry _. -. .. -- . .. .
10.36
Dry
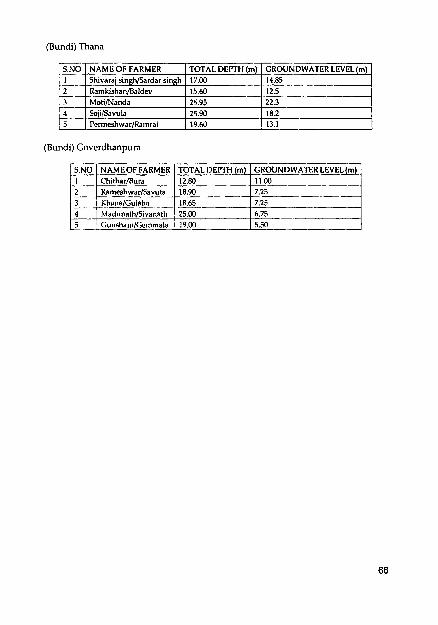
(Bundi) Thana
(Bundi) Goverdhanpura
S.NO 1 2 3 4
5
NAMEOF FARMER ChitharIBura Rameshwar/Savula KhanalGulaba Madunath/Sivanath GunshamIGemmala
TOTAL DEITH (m) 12.88 18.90 18.65 25.00 19.00
GROUNDWATER LEVEL@) 1 1.00 7.25 7.25 6.75 5.50
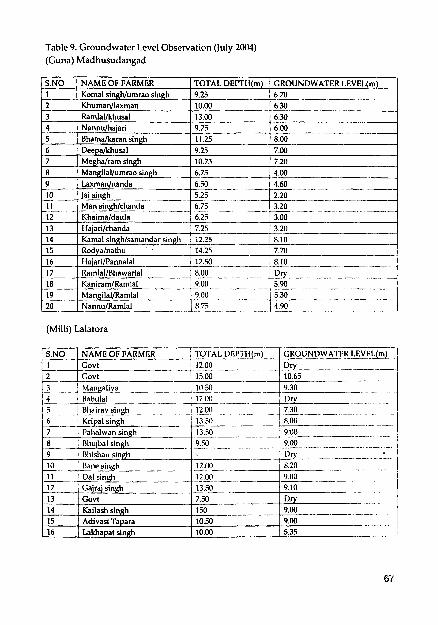
Table 9. Groundwater Level Observation (July 2004) (Guna) Madhusudangad
RamlaUkhusal 13.00 9.75 11.25
10.75 6.75 4.00
Laxmadnanda 6.50
2.20 11 ( Man singhlchanda .- 12 1 Khaimaldaula 13 I Hajarilchanda 1 7.25
S N O 1 2
TOTAL DEPTH@)
9 25 - _-_ 10 00
N A M E OF FARMFR Komal singhlumrao s~ng l i Khumadlaxman
(Milli) Lalatora
GROUNDWATER I EVFL(m)
670- _ -- _ __ 6 30 ---
14 15
16
-- S.NO N A M E OF FARMER TOTAL DI:.i'I'H(m) GROUNUWA'TEKLEVF.l.(m) 1 Govt .- 12.!OO~ Y- o r 2 Covt 15.00 lo,65 ___-_
Kamal s 1 n g h / s a n i a n $ a r 3 k ~ Rodyalnathu IIalar~IPamalal
12 25 _ - 14 25 12 50
- - -:: 8 10
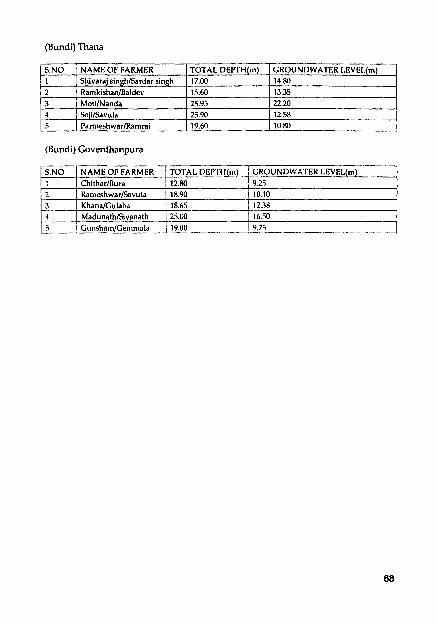
(Bundi) Thana
(Bundi) Goverdhanpura
$.NO I 2 3 4 5
NAMEOI: FARMER Shivaraj singlilSardar singh
RamkishadBaldev MotilNanda SojiISavula I'armeshwar/Ramrai
S.NO
1 2 3 4
TOTAL DEIrI'H(m) 17.00 15.60 - 25.9.5 - 25.90 19.60
NAMEOF FARMER ChitharIBura RameshwarISavuta KhanaIGulaba MadunathISivanath G u n s h a m l C e
TOTAL DBPTll(rn) I GROUNDWATER LEVEL@)
12.80 3~
<:KOUNIIWATEK I.I<VEl.(m) 14-80 13.35 22.20 12.58 10.80
18.90 18.65 25.00 19.00 --
10.10 12.38 16 50 . 9.2i
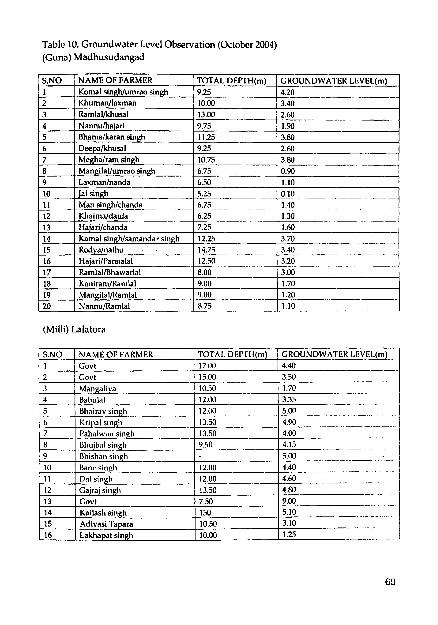
Table 10. Groundwater Level Observation (October 2004) (Guna) Madhusudangad
(Milli) Lalatora
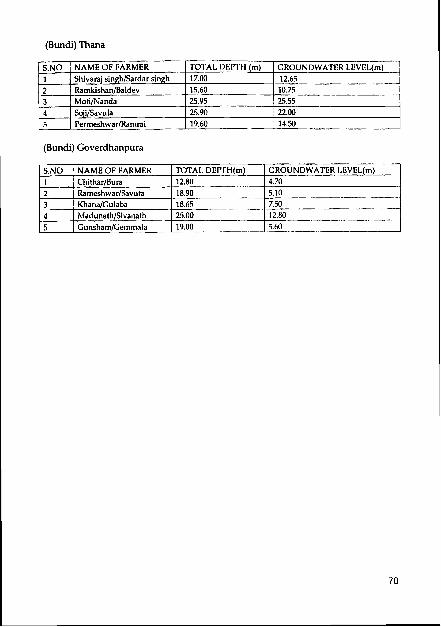
(Bundi) Thana
(Bundi) Goverdhanpura
S.NO 1 2 3 4 5
TOTAL DEPTH (m) 17.00 15.60 25.95 25.90 19.60
NAME OF FARMER Shivaraj singhlsardar singh Ramkishanmaldev MotiINanda SojilSavula PermeshwarIRammi
CROUNDWATER I.EVlil.(m) 12.65 10.75 25.55 22.00 14.50
S.NO 1 2 3 4
TOTAETH(m)
1 2 . 8 0 -. 18.90 18.65 25.00 __ G ? "
NAME OF FARMER ChitharlBura RameshwarISavuta KhanaIGulaba MadunalhISivanath
-- GROUNDWATER I.EVEl.(rn) 4.70 5.10 7.50
80____-_- ~-
-_ - 5.64 -
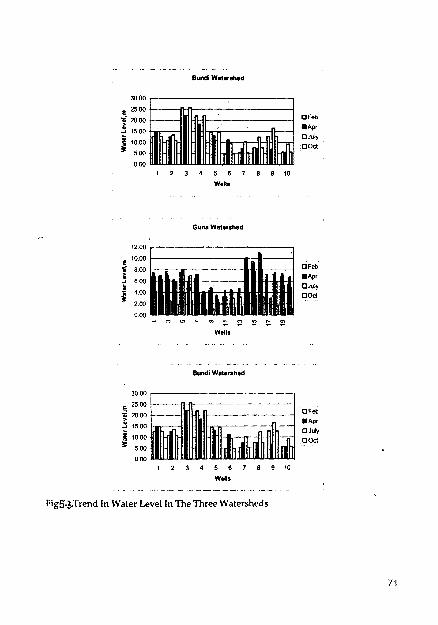
Bundi Watershed
Guna Watershed
B u d Watershed
25 00
5; 2000 OF*
1500 8 A W OJuly
2. tom nod ' 500 OW
1 2 3 4 5 6 7 8 9 1 0
W.11.
Fig5.3Trend In Water Level In The Three Watersheds
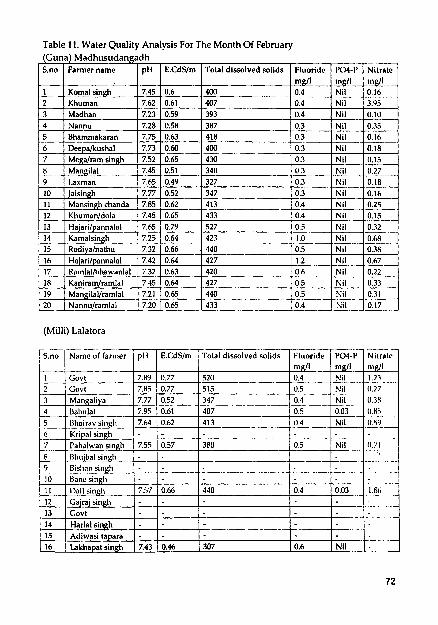
Table 11. Water Quality Analysis For The Month Of February (Guna) Madhusudangadh
I S.no 1 Farmer name I DH I E.CdS/m I Total dissolved solids I Fluoride TPCM-I] FTIGJ
1 Kom+~gh 745 0 6 400 2 Khuman 762 061 407 0 4 NII 395
(Milli) Lalatora
18 19
2!L
Kaniramlramlal Mangilallramlal
- N ' " " u ~ _
7.45 7.21
7 . 2 0
0.64 0.65
0.65
427 440
a_.. -. --
0.5 0.5 0.4 . ~_
N i l Nil
-.A!!. -
0.33- - . 0.31
-!.?.!L
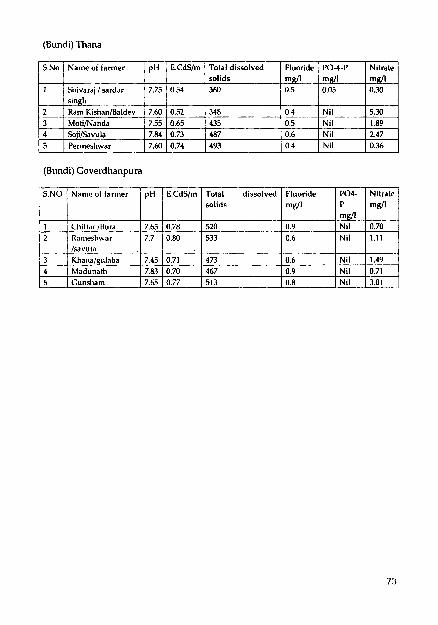
(Bundi) Thana
(Bundi) Goverdhanpura
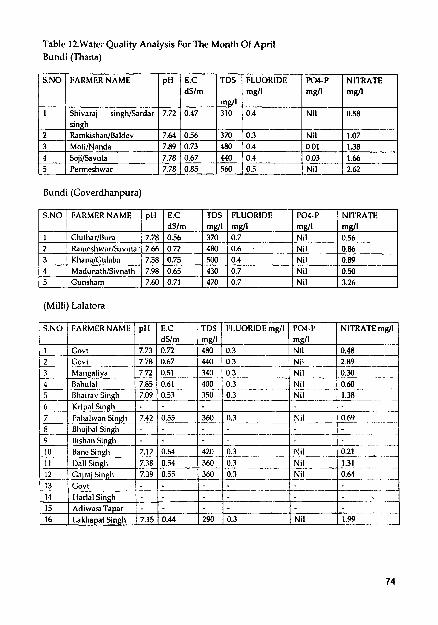
Table lZ.Wate;.QuaIity Analysis For The Month Of April Bundi (Thana)
Bundi (Goverdhanpura)
~ ~ T ' F A R M E R NAME I OH I E.C 1 TDS I FLUORIDE- I P04-I' I NII'RA'TE 1
1 5 1 Gunsham 1 7.60 1 0.71 1 470 ( 0.7 1 Nil 1 3.26
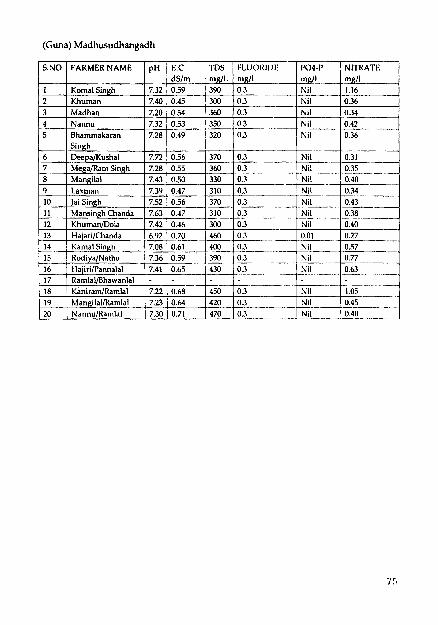
(Guna) Madhusudhangadh
I K11;;l; 7.42 0.46 3 1 133 Nil 0.40 Ha-arilchanda 6.92 0.70 460 0 01 0.27 Kamal Sin h . 7.08 0.61 400 0.3 Nil 0.57
15 Rodi aINatlru 7.36 0 59 390 0.3 Nil 0.77 Nil 0.63 16 Ha'iri/Panna@ 7.41 0.65- 430 3.3. - - - - -
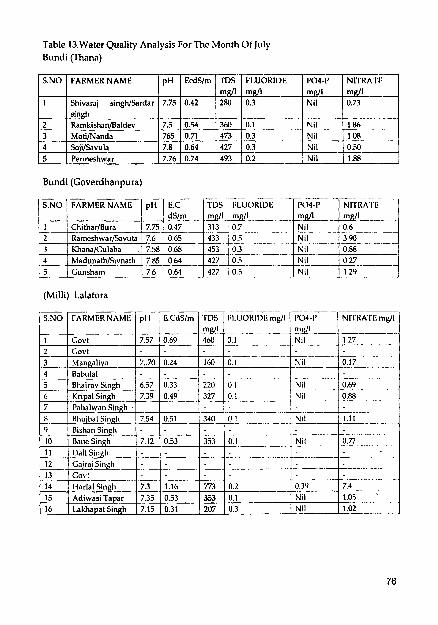
Table 13.Water Quality Analysis For The Month Oi July Bundi (Thana)
Bundi (Goverdhanpura)
3.90 Nil 0.88
Gunsham 1.29
(Milli) Lalatora
-- . - .. . . . - . . -. . - .. - -
. -- - -
. - . . !3_- SF!.- .- - - _ _ _ . . . . . - ~
14
15 16
Harlal Singh Adiwasi Tapar Lakliapal Singh
7.3 7.35 7.15
1.16 0.53 0.31
773 353 207
0.2 - -- 0.1 0.3
&-i. Nil Nil
7.4 .- .. .
I.'!S- I.0? . . i
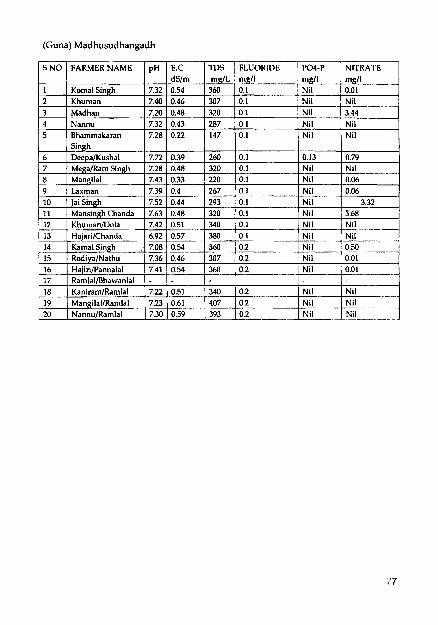
(Guna) Madhusudhangadh
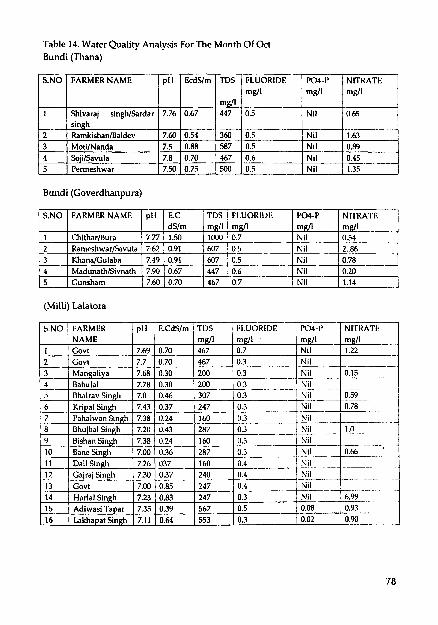
Table 14. Water Quality Analysis For The Month Of Oct Bundi (Thana)
S.NO
1
Bundi (Goverdhanpura)
2 3 4 5
dSlm mgll mgll 1 ChitharIBura 7.77 1.50 1000 0.7 Nil - 2 R a ~ n s l i w a r / u t a 0 . 9 607 0.5 Nil
FARMERNAME
Shivaraj singWSardar singh RarnkishanlBaldev MotiINanda SojilSavula Permeshwar
(Milli) Lalatora
-- -. .
pH
7.76
3
4
5
7.60 7.5 7.8 7.50
EcdSIrn
0.67
KhanaIGulaba MadunathISivnath Gunsham
TUS
mgll 447
0.54 0.88 0.70 0.75
7.49 7.90 7.60
Nil Nil Nil Nil
FLUORIDE mgll
0.5
360 5R7 467 .KKJ
. 1.63 0.89 0.45 - 1.35
0.91 0.67 0.70
Nil 0.65
0.5 0.5 0.6 0.5
607 447 467
0.5 0 6 0.7
Nil Nil Nil
0.78 0.20
I L . . .
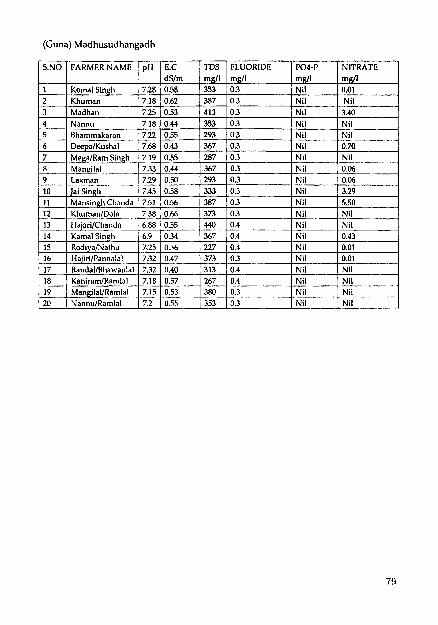
(Guna) Madhusudhangadh
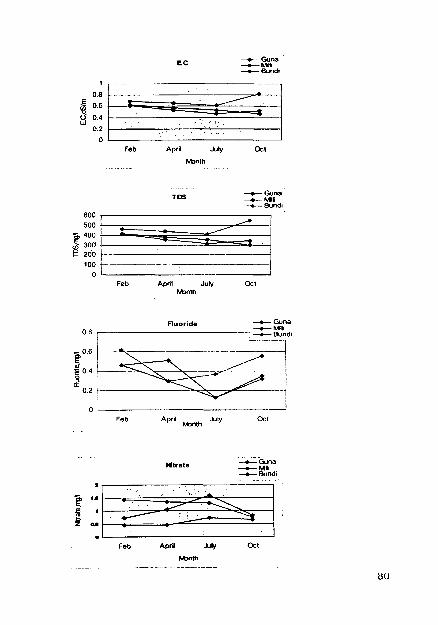
E C --e Guna --C Mlh t Bundl
1
0 8 5 0 6
0 0 4 ul
0 2
0 Feb Aprl Juk
mnth
Oct
t Guna -C Mlll t Bundl
lo: , Feb Aprl July Ocl
mnth
Fluor~ds --c Guna --c Mill
I 7-- --
0 I Feb Aprd
mnth Ocl
--
wtrat* t Guna --c ML -+- Bundl
t '- s 1
g , .
- A - 1
7 I\ <--A -3
Feb April Juhl Oct
m n m - - - - ..--
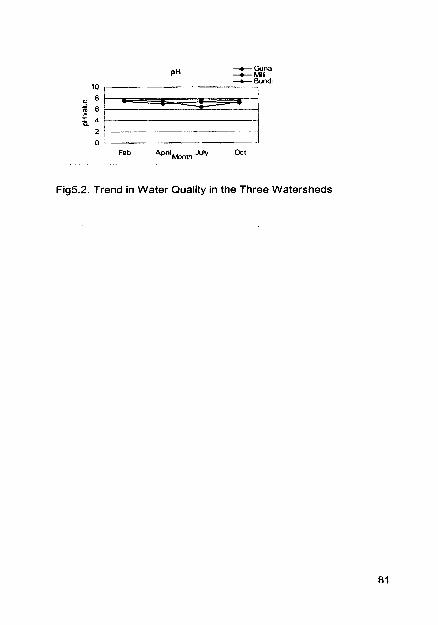
Feb AwlMnth Juhl Oct
Fig5.2. Trend in Water Quality in the Three Watersheds
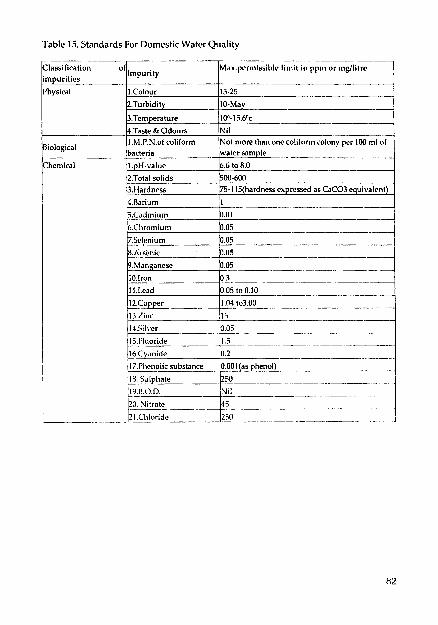
Table 15. Standards For Domest ic Water Quality
lassification Impurity
i m urities
-. - - - -, Max.permissible l i n ~ i t in ppnl or rngllitrc
Physical
Biological
Chemical
1 1 .Colour
2.Turbidity
3.Temperature
4.Taste & Odours 1.M.P.N.of coliform bacteria
I.pli-value
2 Total solids
3.Hardness
4.Barium
5.Cadmium
6 Chromium - 7.SeJ?nium - 8 Arsenic
15-25
10-May .-
1@'-15.@'c
N i l Not more than one colifnr~ir colony pcr 100 m l of water sample
6.6 to 8.0
500-600 - - - - - . . - - - 75-1 15(hardness expressed as CaC03 equivalent)
1
0.01
0.05 .- - - -- - - 0.05 -- -- 0.05
9.Manganese
I0.lron
1l.l.ead
12.Copper
13 Zinc
14.51I\.er - 1j.l:luoride
16.Cvanide
17.Phenolic substance
1 K . S w e - 19 I( O.D. -- 2Llltr3c
0.05 .- - .-
0 3
0.05 to 0.10 .~
1.04 to3.00 -- 15 -. - . - - . - -- - .- 0.05 -- -- - - -- -.
1.5 ~
0.2 _ _ _ _ - . . -. .- -. . - . . . O.OOl(as phenol)
250 ~ ~ - -
N i l .pp-.-pp..---.-. ~
45 -. .- .
2.50 ~ .
1
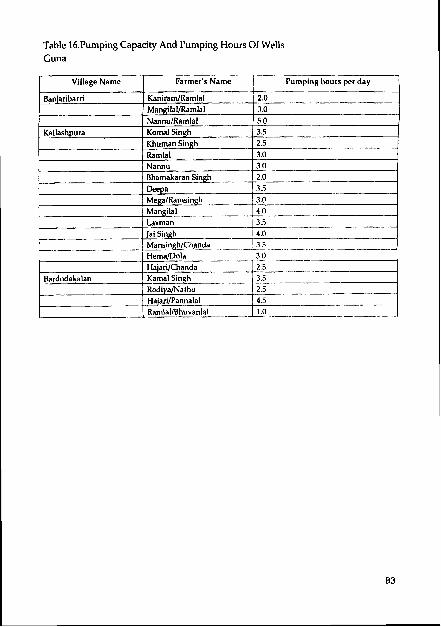
Table 16.Pumping Capacity And Pumping Hours Of Wells Guna
Village Name 1 Farmer's Name Pumping hours per day -1
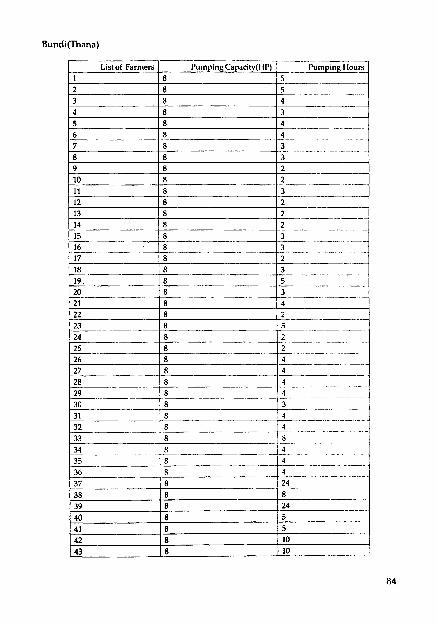
l'umping I lours
. -- ---
- -- .- -. - -
-. . . - . -.
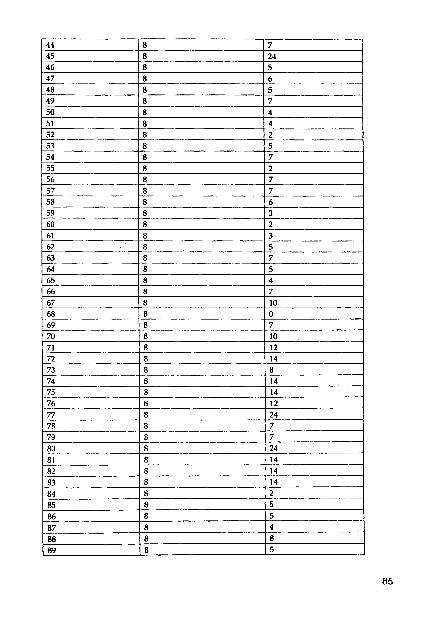
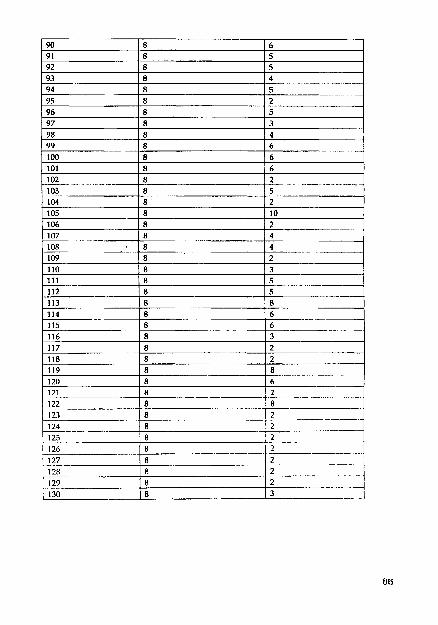
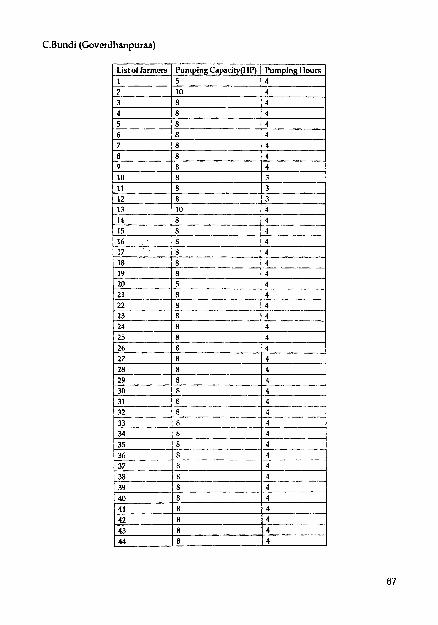
C.Bundi (Goverdhanpuraa)
List of farmers I Pumping Capacity(l4l') I Pumping Hours I c I I
6. CONCLUSIONS
In view of the global village concept the responsibilities of the governance and the civic
of the developing countries have increased to ensure the pmper. scientific use of the
limited tinancial resources to maintain and monitor the natural resources in general and
the water resources in particular to emulate the living standards of its countrymen.
Governments have been spending crores of rupees to conserve and augment the water
resources. There is every need to have a rational and scientific approach to measure the
impact of the steps taken.
Since the better advantages in terms of spatial and temporal aspects of Remote Sensing
Technology aided with GIS tool can be preferred as a substitute for the time taking,
harduous, high cost, traditionallconservative approaches.
In the development of performance indicators to assess the impact the approach adopted
in this study is by considering the vegetative change through the measurement of lnfra
Red and Red band signals (NDVI) besides the Socio-economic components may be
considered as a scientific and rational approach towards the impact assessment of
integrated watershed management.
The model developed in this study may be applied elsewhere under similar environments
for impact assessment of watersheds.
REFERENCES
Anji Reddy M(2001) - "A Text Book of Remote Sns ing & G I s , 2"+dition, B.S.Publications, Hyderabad.
= A.K De, Datta N.C, et.a1.(1998) -"Sustainable Development and Environment", Vol-l(Cosmo Publications, India)
= Aronoff (1989)- "Geographic Information System: A Management Perspective", WDL Publications, Ottawa Canada.
Barrett E.C and Curitus L.F (1982) - "Introduction to Environmental Remote sensing",2'~dition (USA by Chapman and Hall)
Clark, A.N.(1989) - "Longman Dictionary of Ccography - Human & Physical Geography Terms Explained",(Longman Group UK Limited, Harlo, Essex.)
- C.Lim and M.Kafatos (2002)- International Journal of Remote Sensing:Volumc
= 23-No: 17
Demus,M.N.(1997)-" Fundamentals of Geographic Information Systems", John Wiley and Sons.lnc.
Dwivedi R.S, Ramana K.V., Wani S.P., and Phatak.1' (2001) Use of satellite data for watershed management and impact assessment. " proc of ADl3- ICRISAT-IWMI project review and planning meeting" December 10-14, 2001 Hanoi, Vietnam.
Dwivedi R.S., Raii~ana K.V., Wani S.P., lZcgo T.J.(2004), Impact assessment of soil and water cc)nservation measures Rcmote Sensing presented at tllr ADB review and planning meeting, ICIIISAT, May 6 to 8, 2004: Iiyderabad, India.
Haripriya Gundimeda (2004) - Forest Policy and Economics, Volume 6, Issue 3-4.
= Landgrebe,D.1979. Monitoring the earth's resources from space-can you really identify crops by satellite? Presented at the National Computer Conference, New York City, USA, June7,1979.
M.A.Khan, V.P.Gupta and P.C.Moharana- Journal of Arid Environments, Volume 49. Issue 3.
Murali Krishna I.V, "-1992,1996,2001 editions, CSIT, JNTU, Hyderabad.
Murthy 1.V.S (1998) - "Watershed Management", 2nJ edition (New Age International Publishers, India)
= M.S. Rasmussen - International Journal of Remote Sensing, Volume:19, Number:15.
I'orwal M.C (1997) -"IZemote Sensing Analysis of Environmental Resources for Planning and Development ", (APH Publishing Corporation, New Delhi)
= Rao, D.P., Gautam, N.C., Nagaraja, Ram Mohan 1996b. IKS-IC applications in land use mapping and planning, Current Science (Special Section:IRS-1C)
R.K.Jaiswa1, S.Mukhejee, J.Krishnamurthy, R.Saxena -International Journal of Remote Sensing, Volume:24, Number: 5
9 Sabins F.E (1997) - "Remote Sensing I'rinciples and Interpretation", (John Willy and Sons)
= Sellcrs,P.J.1987.Canopy reflectance, photosynthesis and !ranspi?ztion: I'hc role of biophysics in the linearity of their interdcpendence .Re~notc~ Sensing of Environment 21:143-183.
S.Jayakuniar and D.1.arockiasaniy-Journal of Indian Society ~i Kcmolc! Semsing, Vo1.31, No:4,2003.
Thomas M. Lillesand and Ralph W. Kiffer (1994) -" Remote Sensing and Image Interpretation", 3"edition (John Wily & Sons, Inc., New York)
Tucker, C.J., Townshend, J.R.C., and Goff, T.E..1985. Akrica land cover classification using satellite ddta.Science 227:.%9-375.
Wani,S.P., Pathak, P., Tam, H.M., Ramakrishna, A.,Singh, P., and Sreedevi, T.K.2002a.Integrated watershed management for minimizing land degradation and sustaining productivity in Asia. I'ages 207-230 in Integrated land management in dry areas: proceedings of a Joint UNU- CAS International Workshop, 8-13 September 2001, Beijing, China (Zafar Adeel, ed.). Tokyo, Japan: United Nations University.
Wani, S.P., Sreedevi, T.K., Pathak, P., Rego, T.J., Ranga Rao, G \I,, Jangawad, L.S., Pardhasaradhi, G., and Shailaja R !yer. 2n03. Minimizing land degradationand sustaining productivity by integrated watershed management: Adarsh watershed, Kothapally, India.l'roceedings of the ADB-ICRISAT-IWMI Project Review and Planning Meeting.
Wani, S.P., Sreedevi, T.K., Singh, H.P., Pathak, I'., and Kcgo, T.J. 2002b. Innovative farmer participatory integrated watershed management model: Adarsha watershed , Kothapally, India- Asuccess story!.
Wiegand C.L. and Richardson, A.J.,1987, Spectral component analysis. Rationale and results for three crops. International Journal of Remote Sensing. Agronomy Journa1,B.
Wiegand C.L., Richardson, A.J., and Kanemasu, E.T.1979.Leaf area index estimates for wheat from LANDSAT and their implications for evapotranspiration and crop modeling. Agronomy Journal 71 :336-342.
Web Sites : www.google.coni www.yahoosearch.com www.gisdevelopnient.com www.rajasthaninfo.com www.nic.com www.icrisat.org www.nrsa.gov.in