Embed Size (px)
Citation preview
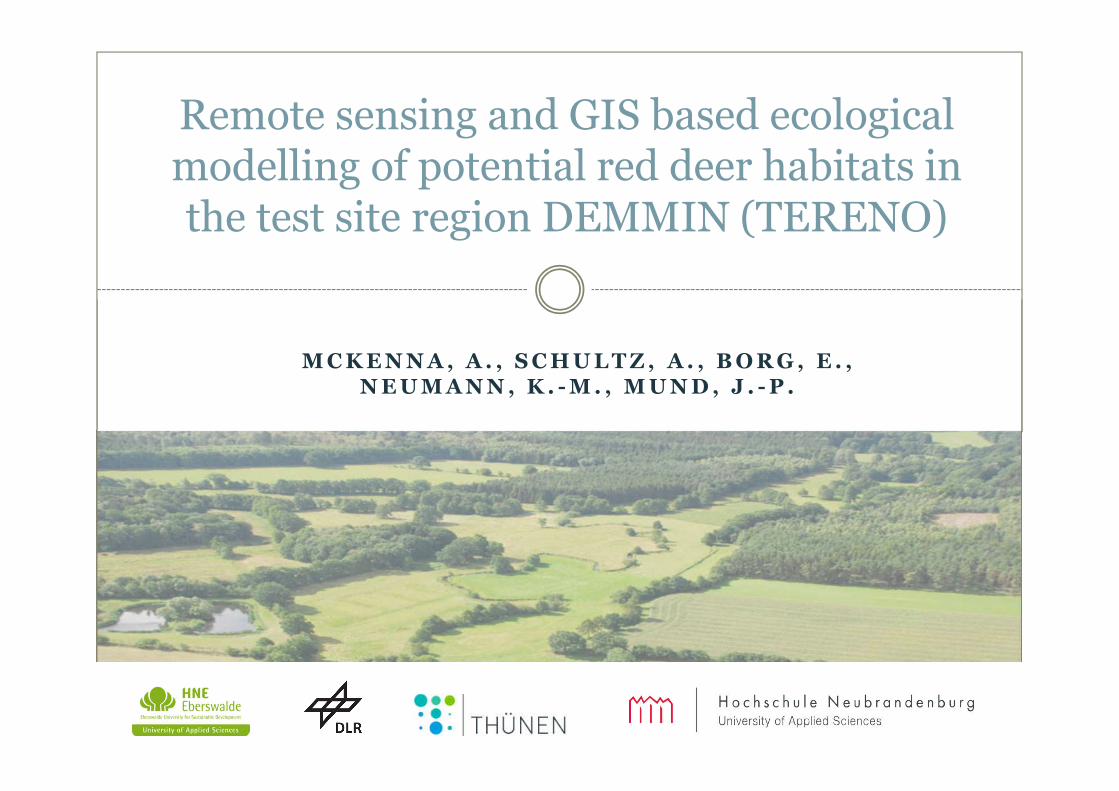
M C K E N N A , A . , S C H U L T Z , A . , B O R G , E . , N E U M A N N , K . - M . , M U N D , J . - P .
Remote sensing and GIS based ecological modelling of potential red deer habitats in the test site region DEMMIN (TERENO)
5/4/2020
1
Background
• The TERENO Initiative aims to study climate and land use changes as well as their regional impacts in order to formulate a sustainable socio-economic framework and estimate its ecological consequences (e.g. Heinrich et al., 2018, Bogena et al., 2019).
• In both cases, the strategic aim is to optimize the sustainable use and extraction ofnatural resources in order to protect natural capacities. In particular, the conservationand enhancement of biodiversity requires increasing attention.
• The above-mentioned land use change is more or less pronounced on different spatial and temporal scales (e.g. Schönwiese, 2008; Büntgen et al., 2013).
• The scientific community responded to the challenges by developing experiments and monitoring platforms (e.g. Osmond et al., 2004; Knorr et al., 2005, Mollenhauer, 2018).
• Recording biodiversity at regional and superregional levels under changing environmental conditions requires comprehensive monitoring based on sound concepts. Yet, the provision of extensive data sets, required for such monitoring, is cost and resource intensive.
• In the absence of specific quantitative datasets it is necessary to use every suitable and available data source to create as full a picture as possible of the complex interactions within ecosystems. In the following study, we will use an example to show how conclusions about the distribution of large mammals in a landscape dominated by humans can be derived from spatially and temporally uncertain data.
Background
Processing of data
Statistical analysis
Results
Discussion
Literature
Material and Methods
5/4/2020
2
Objectives
The main objectives of the project are:
Target-oriented pre-processing of uncertain and incomplete spatial ecological observation data (hunting data reports) and identification of correlated landscape structure metrics based on precise RS data (Global Forest Change)
Development of a binary classifier for the prediction of habitat suitability of Red Deer
Implementation and evaluation of the derived binary classifier within the test site region DEMMIN (TERENO)
Background
Processing of data
Statistical analysis
Results
Discussion
Literature
Material and Methods
5/4/2020
3
Material and MethodsBackground
Processing of data
Statistical analysis
Results
Discussion
Literature
Material and Methods
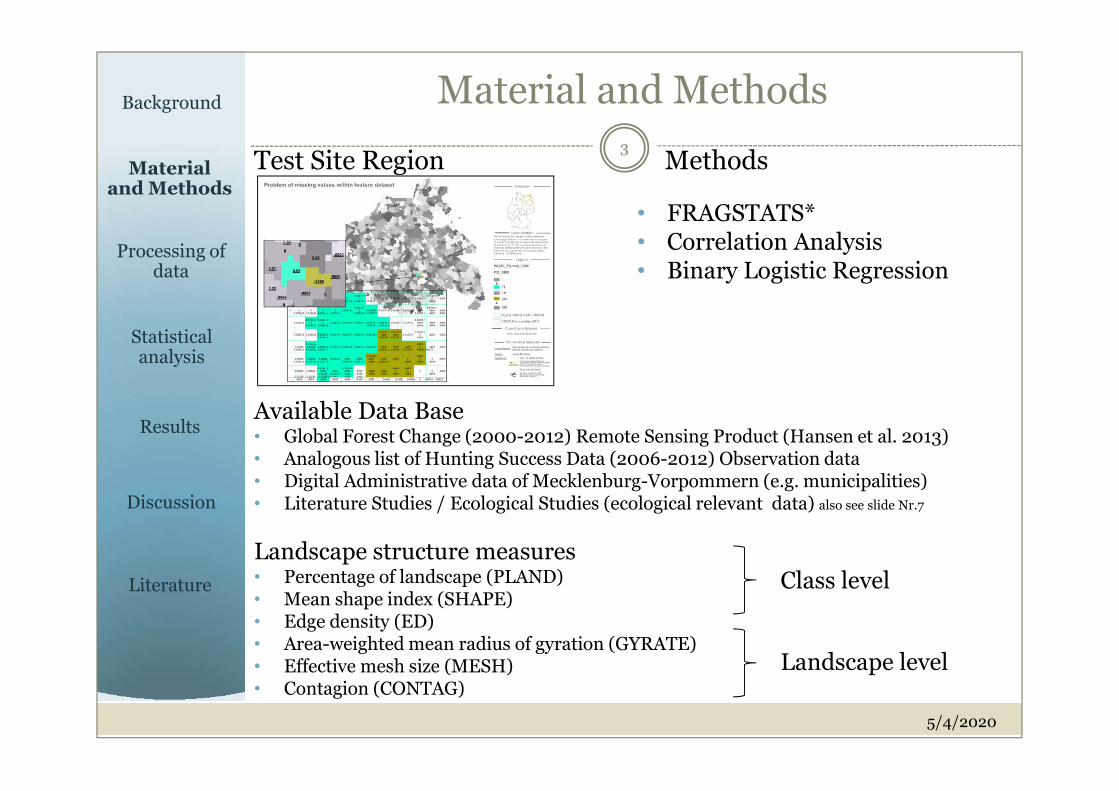
Test Site Region Methods
• FRAGSTATS*• Correlation Analysis • Binary Logistic Regression
Available Data Base• Global Forest Change (2000-2012) Remote Sensing Product (Hansen et al. 2013)• Analogous list of Hunting Success Data (2006-2012) Observation data• Digital Administrative data of Mecklenburg-Vorpommern (e.g. municipalities)• Literature Studies / Ecological Studies (ecological relevant data) also see slide Nr.7
Landscape structure measures• Percentage of landscape (PLAND)• Mean shape index (SHAPE)• Edge density (ED)• Area-weighted mean radius of gyration (GYRATE)• Effective mesh size (MESH)• Contagion (CONTAG)
Landscape level
Class level
5/4/2020
4
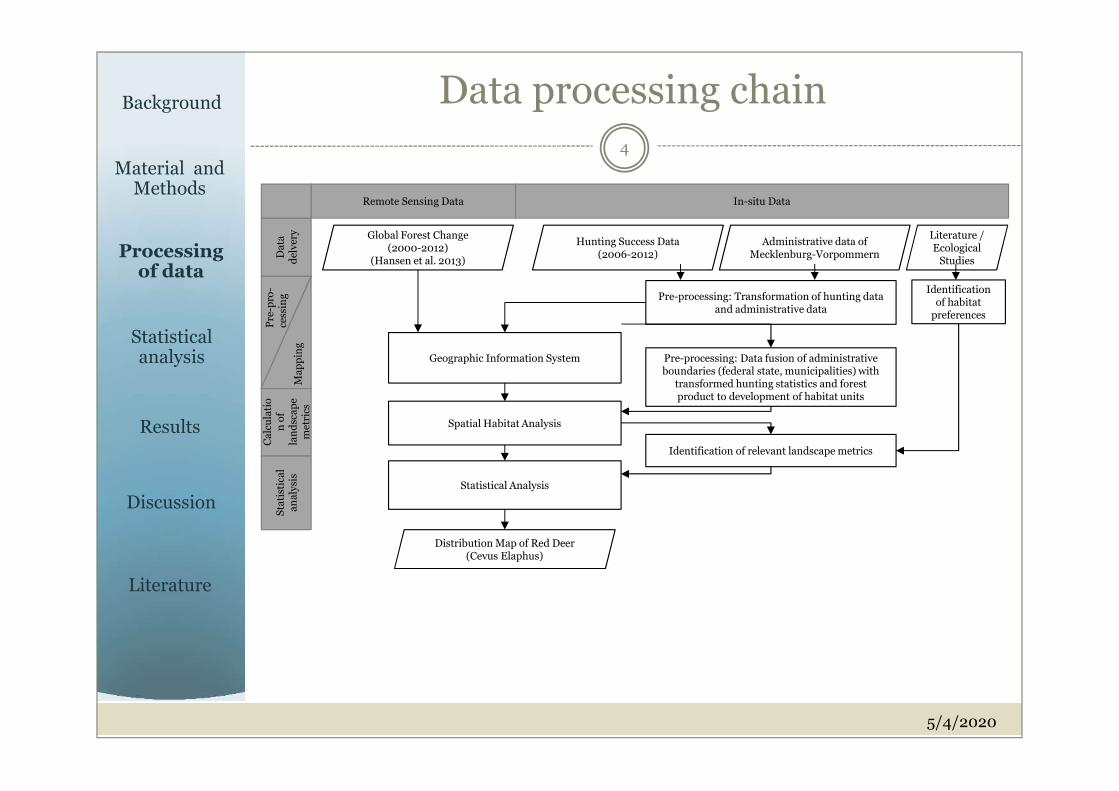
Data processing chain
Pre-processing: Transformation of hunting data and administrative data
Identification of habitat
preferences
Geographic Information System
Spatial Habitat Analysis
Statistical Analysis
Distribution Map of Red Deer(Cevus Elaphus)
Pre-processing: Data fusion of administrative boundaries (federal state, municipalities) with
transformed hunting statistics and forest product to development of habitat units
Identification of relevant landscape metrics
Remote Sensing Data In-situ Data
Sta
tist
ica
l a
na
lysi
s
Ca
lcu
lati
on
of
lan
dsc
ap
e m
etri
cs
Da
ta
del
very
Ma
pp
ing
Pre
-pro
-ce
ssin
g
Global Forest Change (2000-2012)
(Hansen et al. 2013)
Hunting Success Data (2006-2012)
Administrative data of Mecklenburg-Vorpommern
Literature / Ecological
Studies
Background
Processing of data
Statistical analysis
Results
Discussion
Literature
Material and Methods
5/4/2020
5
Binary classifier
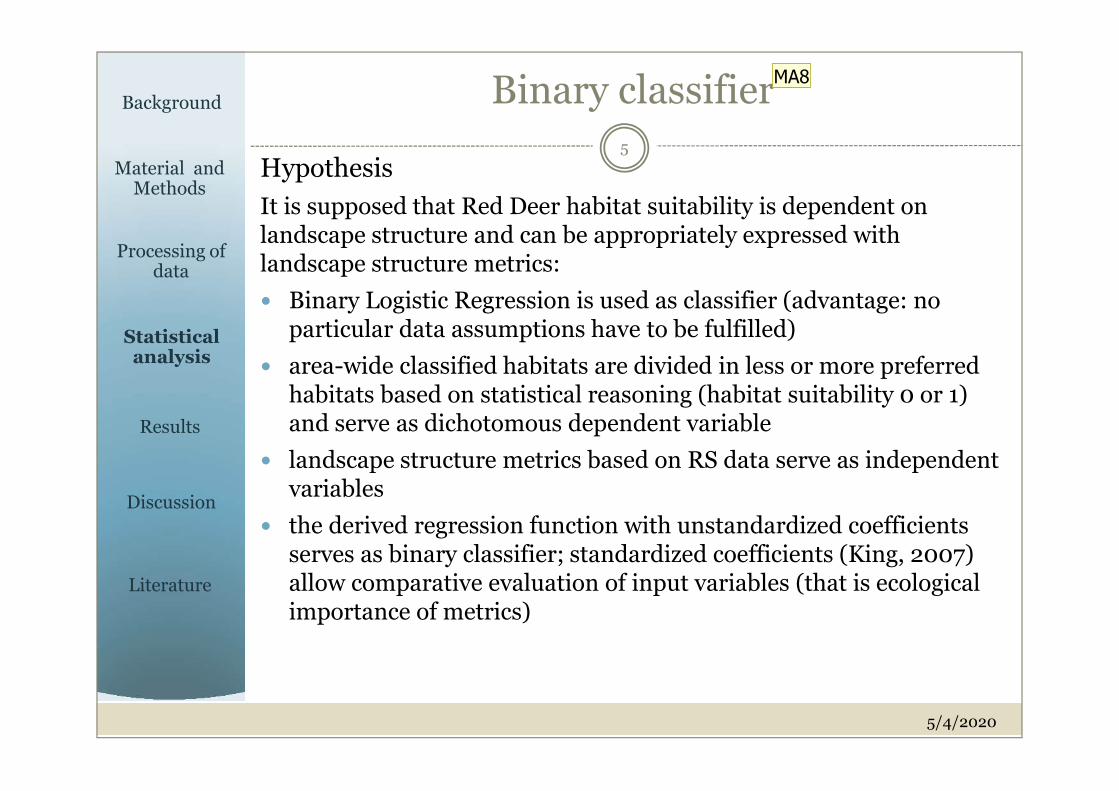
Hypothesis
It is supposed that Red Deer habitat suitability is dependent on landscape structure and can be appropriately expressed with landscape structure metrics:
Binary Logistic Regression is used as classifier (advantage: no particular data assumptions have to be fulfilled)
area-wide classified habitats are divided in less or more preferred habitats based on statistical reasoning (habitat suitability 0 or 1) and serve as dichotomous dependent variable
landscape structure metrics based on RS data serve as independent variables
the derived regression function with unstandardized coefficients serves as binary classifier; standardized coefficients (King, 2007) allow comparative evaluation of input variables (that is ecological importance of metrics)
Background
Processing of data
Statistical analysis
Results
Discussion
Literature
Material and Methods
MA8
Folie 6
MA8 Folie 6 und 7 zusammenfassen!Alfred schickt mir Inhalt zur statistik Folie!McKenna, Amelie; 01.05.2020
5/4/2020
6
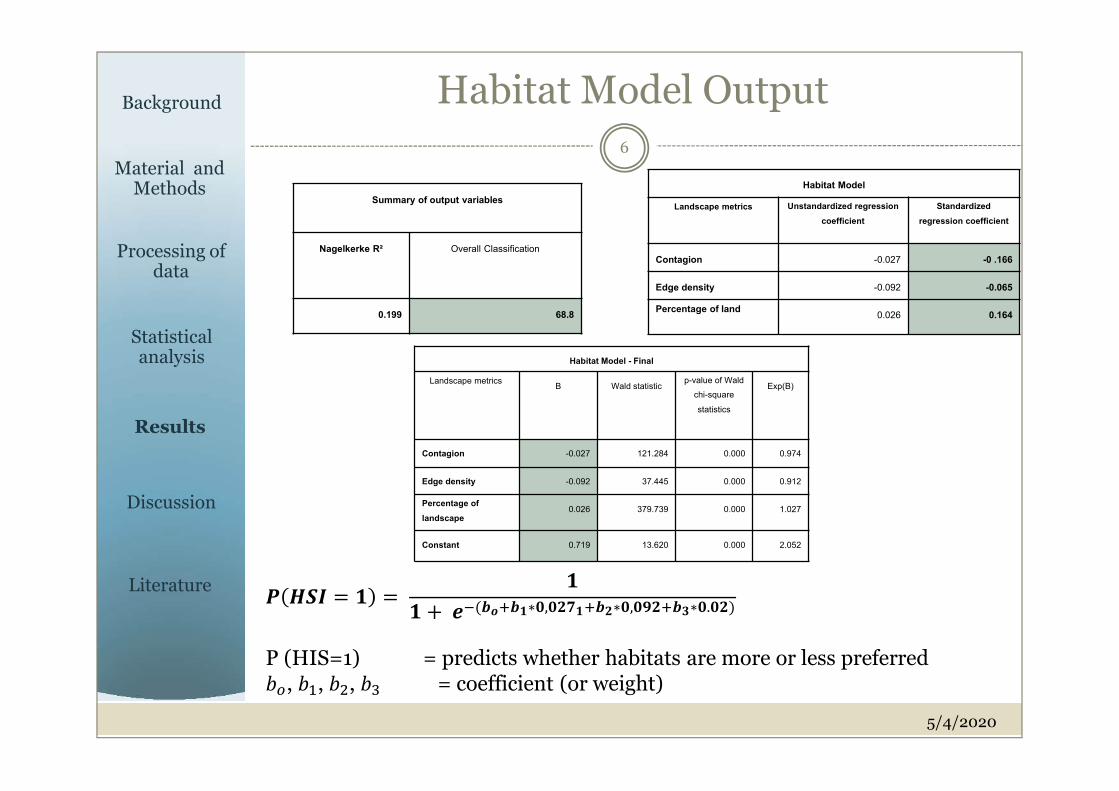
� ��� = � = �
� +��(�����∗�,�������∗�,������∗�.��)
P (HIS=1) = predicts whether habitats are more or less preferred��, ��, ��, �� = coefficient (or weight)
Habitat Model Output
Habitat Model - Final
Landscape metrics B Wald statistic p-value of Wald chi-square statistics
Exp(B)
Contagion -0.027 121.284 0.000 0.974
Edge density -0.092 37.445 0.000 0.912
Percentage of landscape
0.026 379.739 0.000 1.027
Constant 0.719 13.620 0.000 2.052
Background
Processing of data
Statistical analysis
Results
Discussion
Literature
Material and Methods
Summary of output variables
Nagelkerke R² Overall Classification
0.199 68.8
Habitat Model
Landscape metrics Unstandardized regression coefficient
Standardized regression coefficient
Contagion -0.027 -0 .166
Edge density -0.092 -0.065
Percentage of land 0.026 0.164
5/4/2020
7
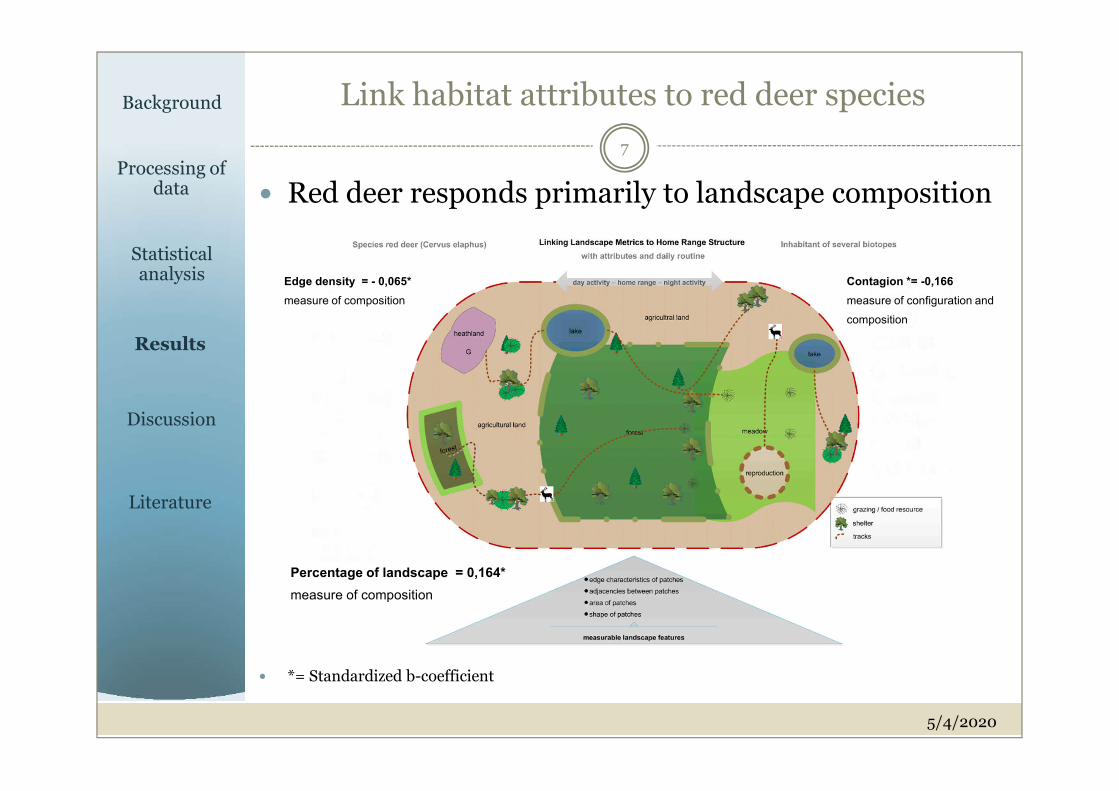
Link habitat attributes to red deer species
Red deer responds primarily to landscape composition
*= Standardized b-coefficient
Edge density = - 0,065*measure of composition
Contagion *= -0,166measure of configuration and composition
Percentage of landscape = 0,164*measure of composition
Background
Processing ofdata
Statistical analysis
Results
Discussion
Literature
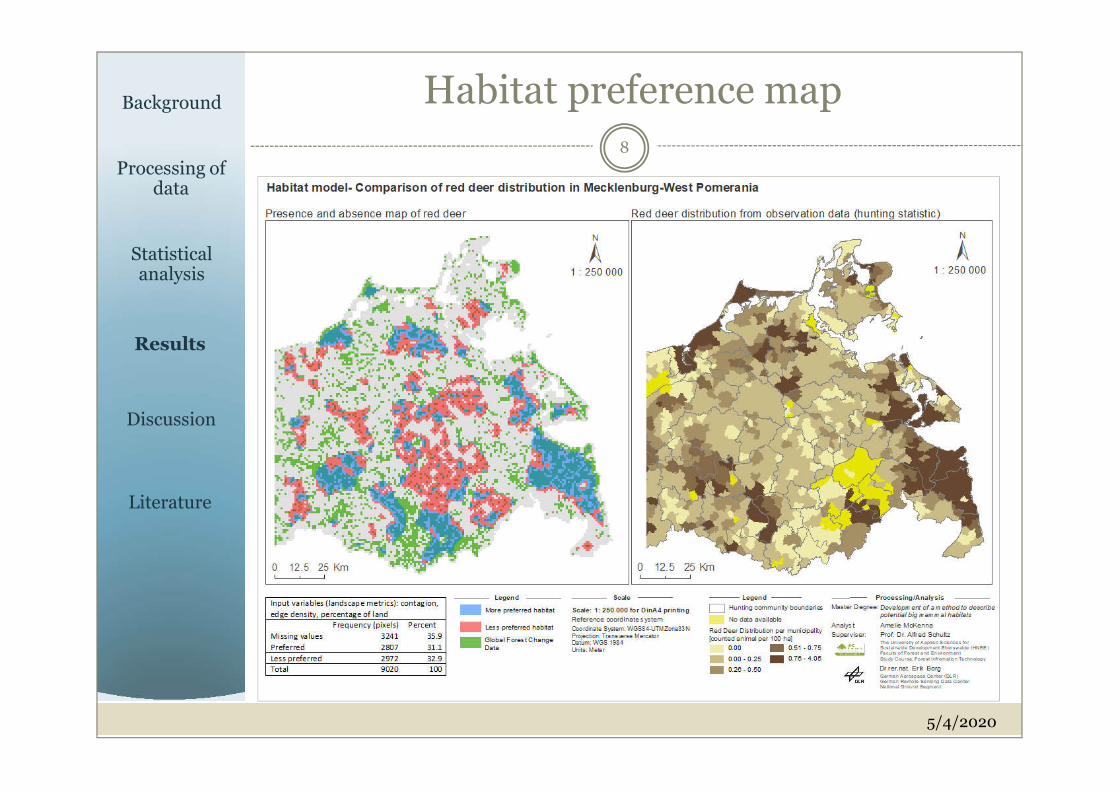
Habitat preference map
5/4/2020
8
Background
Processing ofdata
Statistical analysis
Results
Discussion
Literature
7/8/2020
9
Discussion - Consequences
Core results A binary classifier for the prediction of red deer habitat suitability using logistic
regression was developed and provided acceptable classification results
Simple models can be derived by using spatio-temporal incomplete and uncertain in-situ-observation data and remote sensing based landscape metric data of high quality
Calculation of standardized coefficient allowed better comparison, interpretation and evaluation of landscape metrics
Red deer habitat preferences are successful described using landscape metric (CONTAG index, ED index, PLAND index), certainly the approach is adoptable to other big mammals with similar habitat preferences
Conclusions In order to achieve exactable results a great variety of different classification
approaches have to be simulated
The observation dataset is vulnerable to bias as it has limited spatio-temperalcharacter and thus the assignment and averaging to municipalities lead to estimates rather than a fact
The authors are certain that quantitative accuracy could be improved if detailed biotope data were provided with greater explicitness and further ecological parameters
Quality of species observation data could be improved including other public data e.g. on traffic and accident
Background
Processing of data
Statistical analysis
Results
Discussion
Literature
Material and Methods
MA15

Folie 10
MA15 Bitte um Überprüfung der folieMcKenna, Amelie; 04.05.2020
5/4/2020
10
LiteratureBackground
Processing of data
Statistical analysis
Results
Discussion
Literature
Material and Methods BOGENA, H.R. ET AL. (2019): TERENO – A decade of long-term observatory based terrestrial research in Germany,
PA13B-0990. - AGU 100 Fall Meeting San Francisco, CA 9-13 Dec 2019.
BORGES, F. ET AL. (2017): Assessing the habitat suitability of agricultural landscapes for characteristic breeding bird guildsusing landscape metrics. Environmental monitoring and assessment 189, (4), p.166.
BÜNTGEN, U., ET AL. (2013): Filling the Eastern European gap in millennium-long temperature reconstructions. Proc NatlAcad Sci USA. 110:1773-1778.
GUSTAFSON, E., PARKER, G. (1992): Relationships between landcover proportion and indices of landscape spatial pattern.Landscape Ecology 7, (2), 101–110.
Hansen, M. C. et al. (2013): High-Resolution Global Maps of 21st-Century Forest Cover Change. Science 342 (15November): 850–53. Data available on-line from: http://earthenginepartners.appspot.com/science-2013-global-forest.
HEINRICH, I., ET AL. (2018): Interdisciplinary Geo-ecological Research across Time Scales in the Northeast GermanLowland Observatory (TERENO-NE). - Vadose Zone Journal, 17, 1. DOI: http://doi.org/10.2136/vzj2018.06.0116
KING, J. (2007): RUNNING HEAD: Standardized Coefficients in Logistic Regression – Jason E. King. Baylor College ofMedicine. Paper presented at the annual meeting of the Southwest Educational Research Association, San Antonio, Texas,Feb. 7–10, 2007. AVAILABLE: http://www.ccitonline.org/jking/homepage
KNORR, W. ET AL. (2005): Long-term sensitivity of soil carbon turnover to warming. Nature 433:298-301.
MCGARIGAL, K. (2015): FRAGSTATS Help, p.182. Amherst. AVAILABLE:http://dx.doi.org/http://www.umass.edu/landeco/research/fragstats/documents/fragstats_documents.html
MCGARIGAL, K., ENE, E. (2014): FRAGSTATS 4.2 – Spatial Pattern Analysis Program for Categorical and ContinuousMaps, University of Massachusetts, Massachusetts.
MOLLENHAUER, H., ET AL. (2018): Long-term environmental monitoring infrastructures in Europe: observations,measurements, scales, and socio-ecological representativeness.- Science of The Total Environment 624:968-978,10.1016/j.scitotenv.2017.12.095
OSMOND, B. ET AL. (2004): Changing the way we think about global change research: scaling up in experimentalecosystem science. Global Change Biology 10:393-407.
NEUMANN, M., ET AL. (2014): Untersuchungen zur Bewirtschaftung von Rot-, Dam-, Muffel, Reh- und Schwarzwild inWildschwerpunktgebiete MV 2014 Thünen Institut Eberswalde.
SCHÖNWIESE, C.D. (2008): Klimatologie. Ulmer, Stuttgart.
TOTTEWITZ, F., NEUMANN, M., (2010): Untersuchungen zur Lebensraumnutzung des Rotwildes (Cervus elaphus L.) aufder Halbinsel Darß/Zingst im Nationalpark Vorpommersche Boddenlandschaft durch GPS-Satelliten-Telemetrie, Beiträgezur Jagd- und Wildforschung, pp.15–31.
5/4/2020
Thank you for your attention!