Embed Size (px)
Citation preview

This article was downloaded by: [Institute of Remote Sensing Application]On: 12 February 2014, At: 00:15Publisher: Taylor & FrancisInforma Ltd Registered in England and Wales Registered Number: 1072954 Registeredoffice: Mortimer House, 37-41 Mortimer Street, London W1T 3JH, UK
International Journal of Digital EarthPublication details, including instructions for authors andsubscription information:http://www.tandfonline.com/loi/tjde20
Remote sensing-based global cropmonitoring: experiences with China'sCropWatch systemBingfang Wua, Jihua Menga, Qiangzi Lia, Nana Yana, Xin Dua & MiaoZhanga
a Institute of Remote Sensing and Digital Earth, Chinese Academyof Sciences, Beijing, ChinaAccepted author version posted online: 03 Jul 2013.Publishedonline: 05 Sep 2013.
To cite this article: Bingfang Wu, Jihua Meng, Qiangzi Li, Nana Yan, Xin Du & Miao Zhang (2014)Remote sensing-based global crop monitoring: experiences with China's CropWatch system,International Journal of Digital Earth, 7:2, 113-137, DOI: 10.1080/17538947.2013.821185
To link to this article: http://dx.doi.org/10.1080/17538947.2013.821185
PLEASE SCROLL DOWN FOR ARTICLE
Taylor & Francis makes every effort to ensure the accuracy of all the information (the“Content”) contained in the publications on our platform. However, Taylor & Francis,our agents, and our licensors make no representations or warranties whatsoever as tothe accuracy, completeness, or suitability for any purpose of the Content. Any opinionsand views expressed in this publication are the opinions and views of the authors,and are not the views of or endorsed by Taylor & Francis. The accuracy of the Contentshould not be relied upon and should be independently verified with primary sourcesof information. Taylor and Francis shall not be liable for any losses, actions, claims,proceedings, demands, costs, expenses, damages, and other liabilities whatsoever orhowsoever caused arising directly or indirectly in connection with, in relation to or arisingout of the use of the Content.
This article may be used for research, teaching, and private study purposes. Anysubstantial or systematic reproduction, redistribution, reselling, loan, sub-licensing,systematic supply, or distribution in any form to anyone is expressly forbidden. Terms &Conditions of access and use can be found at http://www.tandfonline.com/page/terms-and-conditions

Remote sensing-based global crop monitoring: experiences with China’sCropWatch system
Bingfang Wu*, Jihua Meng, Qiangzi Li, Nana Yan, Xin Du and Miao Zhang
Institute of Remote Sensing and Digital Earth, Chinese Academy of Sciences, Beijing, China
(Received 20 November 2012; accepted 27 June 2013)
Monitoring the production of main agricultural crops is important to predict andprepare for disruptions in food supply and fluctuations in global crop marketprices. China’s global crop-monitoring system (CropWatch) uses remote sensingdata combined with selected field data to determine key crop productionindicators: crop acreage, yield and production, crop condition, cropping intensity,crop-planting proportion, total food availability, and the status and severity ofdroughts. Results are combined to analyze the balance between supply anddemand for various food crops and if needed provide early warning aboutpossible food shortages. CropWatch data processing is highly automated and theresulting products provide new kinds of inputs for food security assessments. Thispaper presents a comprehensive overview of CropWatch as a remote sensing-based system, describing its structure, components, and monitoring approaches.The paper also presents examples of monitoring results and discusses thestrengths and limitations of the CropWatch approach, as well as a comparisonwith other global crop-monitoring systems.
Keywords: CropWatch; crop monitoring; remote sensing; crop production
1. Introduction
Disruptions in food supply have a marked effect on the well-being of populations
and countries. Climate change-related extreme weather events, competition for
water resources, energy needs, and a growing population are increasing the risk of
food shortages (FAO 2007). To ensure national food security, timely, reliable, and
objective predictions of crop conditions and production, both within countries and
globally, are needed to plan crop imports, exports, and prices (Li et al. 2007). Brown
(2005) also describes the urgent need for a comprehensive, systematic, and accurate
global agricultural monitoring system.
Several countries and organizations, including the United States, the European
Commission, the Food and Agriculture Organization of the United Nations (FAO),
China, Brazil, Canada, and India, currently employ crop-monitoring systems to
monitor their own countries’ or regional and global crop production. In the United
States, the U.S. Department of Agriculture (USDA) Foreign Agricultural Service
(FAS) (http://www.fas.usda.gov/default.asp) provides crop monitoring as part of its
Global Agricultural Monitoring (GLAM) program (Becker-Reshef et al. 2010). The
European Commission operates its AGRI4CAST program implemented by the
*Corresponding author. Email: [email protected]
International Journal of Digital Earth, 2014
Vol. 7, No. 2, 113�137, http://dx.doi.org/10.1080/17538947.2013.821185
# 2013 Taylor & Francis
Dow
nloa
ded
by [
Inst
itute
of
Rem
ote
Sens
ing
App
licat
ion]
at 0
0:15
12
Febr
uary
201
4

European Commission Joint Research Center under the Monitoring Agricultural
Resources (MARS) program (Supit, Hooijer, van Diepen 1994; Vossen and Rijks
1995; Genovese 2001; Genovese, Fritz, and Bettio 2006; Duveiller, Lopez-Lozano,
and Baruth 2013), while the FAO established the Global Information and Early-
Warning System (GIEWS) (http://www.fao.org/giews/english/index.htm), which
focuses on food and agriculture at the global scale. India, Canada, and Brazil
operate a Crop Acreage and Production Estimation (CAPE; SAC 1995), the Crop
Condition Assessment Program (CCAP; Reichert and Cassiy 2002), and the
Geosafras program (Fontana et al. 2006), respectively.China’s global crop monitoring began in 1998 with the development of the China
CropWatch System. CropWatch is designed specifically to use remote sensing data to
assess national and global crop production and related indicators. While all global
crop monitoring systems rely on remote sensing data to a certain extent, CropWatch
is unique in that it has significantly reduced the reliance on ground assessments and
field monitoring. Currently in its 15th year of operation, CropWatch provides
production estimates for wheat, maize, rice, and soybean and covers most of the
prominent food-producing countries in the world (Wu 2000).
CropWatch results have been calibrated and verified, and its methods and models
have been presented and discussed in many publications (Fang et al. 1997; Wu 2000;
Jiang et al. 2002; Fan et al. 2003; Zhang et al. 2003, 2004; Meng, Li, and Wu 2004;
Wu et al. 2004a; Wu, Meng, and Li 2010a; Wu,Tian, and Li 2004b; Wu and Li 2004,
2012; Zeng et al. 2004; Mu, Yan, and Wu 2005; Xu et al. 2008; Du et al. 2009a,
2009b; Jia et al. 2010, 2011; Li et al. 2011). What has not been presented � and what
this paper sets out to do � is a comprehensive overview of CropWatch as a remote
sensing-based system, describing its structure, components, and monitoring
approaches. The paper also presents examples of monitoring results and discusses
the strengths and limitations of the CropWatch approach, as well as comparison with
other existing systems.
2. CropWatch structure and methodology
2.1. Overview
CropWatch uses high- (30 m and above) and low-resolution (250�1000 m) remote
sensing data, combined with selected field data, to calculate and present various
crop-monitoring indicators. After pre-processing of acquired remote sensing data,
system components carry out crop condition monitoring, drought monitoring, crop
acreage monitoring, crop yield prediction, food production estimation, and cropping
intensity monitoring (Figure 1). Information on crop acreage and crop yield
predictions is combined to estimate crop production. Next, the available information
on crop condition, droughts, production, and cropping intensity is combined to
determine the balance in supply and demand for food and, if necessary, provide early
warning of risks to the food supply. Drought monitoring, food production
monitoring, and early warning are provided only for China, whereas crop condition
monitoring, crop acreage estimation, and estimates of crop yield and production are
performed at the global scale. The crop acreage estimation is implemented only for 6
countries (United States, Argentina, Brazil, France, Germany, and Ukraine), while
114 B. Wu et al.
Dow
nloa
ded
by [
Inst
itute
of
Rem
ote
Sens
ing
App
licat
ion]
at 0
0:15
12
Febr
uary
201
4

the other global monitoring indicators are computed for all the 31 major food-
producing countries.
The following sections provide more detail on the system’s remote sensing inputs,
components, model calibration and validation, and data management.
2.2. Pre-processing of remote sensing data
CropWatch uses remote sensing data from various sources. As necessary, data is
acquired from satellites, downloaded, and, if needed, immediately pre-processed
using internationally established methods (Table 1). Data is stored in a central
database where it can be automatically accessed by the various CropWatch
components.
Data quality is one of primary factors that influence the accuracy of derived crop
information on condition, yield, acreage, etc. While the initial objective of data pre-
processing is to provide consistent data-sets (both temporally and spatially) for crop
monitoring, techniques will also be developed for removing noise and improving data
quality.
2.3. Monitoring crop condition
Information about the condition of crops in early crop-growing stages (before
harvest) can help indicate potential food surpluses and shortages and support related
decision-making (Meng and Wu 2008). CropWatch crop condition monitoring is
based on a multi-year comparison of the Normalized Difference Vegetation Index
(NDVI) (Rao, Ayyangar, and Rao 1982; Wu 2000; Meng et al. 2007) and combines
both current crop condition monitoring and a monitoring of the crop growth (Meng,
Wu, and Li 2008; Wu, Meng, and Li 2010a). For current crop condition monitoring,
two NDVI images representing comparable periods from the current and previous
Figure 1. CropWatch components and structure (modified from Wu et al. 2010b).
International Journal of Digital Earth 115
Dow
nloa
ded
by [
Inst
itute
of
Rem
ote
Sens
ing
App
licat
ion]
at 0
0:15
12
Febr
uary
201
4

Table 1. CropWatch remote sensing data and data pre-processing procedures.
Target
area Data Source
Spatial
Resolution Pre-processing Data Products Usage*
China FY-3a MERSI 250 m/1000 m Geometric correction, calibrating DN images to TOA
reflectance, atmospheric correction, cloud identification, and
masking
NDVI, LST, bands
reflectance
1, 2, 6
TERRA/AQUA
MODIS
250 m/1000 m Geographic correction; radiation calibration; image resizing;
mosaic, cloud identification; and atmospheric correction
NDVI, albedo, LST 1, 2, 3, 4, 5, 6
ENVISat ASAR 30 m Geometric correction, radiance calibration, and speckle
reduction
Backscattering
coefficient, texture
3
Radarsat-1 30 m Geometric correction, radiance calibration, and speckle
reduction
Backscattering
coefficient, texture
3
Global Landsat TM/
ETM
30 m Geometric correction, calibrating DN images to TOA
reflectance, atmospheric correction, cloud identification, and
masking
bands reflectance 3, 5
HJ-1 CCD 30 m Geometric correction, calibrating DN images to TOA
reflectance, atmospheric correction, cloud identification, and
masking
bands reflectance 2, 3, 5
IRS P6 AWIFS 56 m Geometric correction, calibrating DN images to TOA
reflectance, atmospheric correction, cloud identification, and
masking (Johnson 2008)
bands reflectance 3, 5, 6
TERRA/AQUA
MODIS
1000 m Download (http://reverb.echo.nasa.gov), mosaic, re-project NDVI, FPAR, LST 1, 3, 4
NOAA AVHRR 1000 m Cloud identification and masking; calibration; atmospheric
correction; retrieving LST from thermal bands; and geometric
correction
NDVI, NDVI, LST 1, 2, 4, 5, 6
*1: crop condition monitoring, 2: drought monitoring, 3: crop acreage estimation, 4: crop yield estimation, 5: grain production estimation, 6: cropping-index monitoring.Note: DN �digital number; FPAR �fraction of photosynthetically active radiation; NDVI �normalized difference vegetation index; LST �land surface temperature;TOA �top of atmosphere.
11
6B
.W
uet
al.
Dow
nloa
ded
by [
Inst
itute
of
Rem
ote
Sens
ing
App
licat
ion]
at 0
0:15
12
Febr
uary
201
4

years are compared to identify areas where crop conditions are poorer, better, or
similar (Wu 2000; Esquerdo, Zullo, and Antunes 2011).
Monitoring of crop growth is also based on NDVI images, but this time, a time
series of NDVI images across the growing season is used to develop crop-growthprofiles, based on the statistical average of the NDVI (weighted for the percentage of
farmland) in a region or country compared to those from previous years (Meng, Wu,
and Li 2008; Wu, Meng, and Li 2010a). The process uses counties as the basic unit
for the extraction and reconstruction of crop-growing profiles, as an analysis on a
larger scale would be more likely to incorporate incorrect information as a result of
the spatial heterogeneity of crop patterns. To remove the noise from the NDVI time-
series caused by clouds and atmospheric conditions, harmonic analysis (HANTS)
(Roerink and Menenti 2000) and S-G methods (Savitzky and Golay, 1964) are used.Selected descriptors including peak value, average value, and rate of increase are
extracted to provide a quantitative evaluation of crop condition (Brown et al. 1982).
The crop profile method has been extended to a new method of non-parametric crop
forecasting, which compares minimum, average, and maximum crop-growing profiles
of the last five years to evaluate the current crop conditions, with similar crop-
growing profiles interpreted to indicate similar crop conditions (Gommes 2007).
After removing data from non-farmland areas (using cropland masks), the crop
condition results of both assessments � the current crop condition and crop growth �are combined with information about phenophase, agro-meteorological conditions,
and variations in crop proportion for a comprehensive analysis and assessment of
crop condition. The crop condition monitoring of China is based on county data-
sets, and that of other countries depends on the farmland area of the country. For
major producers such as United State and India, the monitoring is implemented
based on province or state data, while for other countries, the monitoring is
implemented directly at nation scale.
The inter-annual variabilities of phenology and crop rotation are a main sourceof uncertainty. The result is that the crop condition variation information is mixed
with variation in crop phenophase and crop types. Introduction of explicit crop
phenophase and crop type information will help to solve or at least alleviate the
problem.
2.4. Monitoring agricultural droughts
Agricultural drought � a natural disaster that occurs when water supply isinsufficient to satisfy the demand from crops � is recognized as the biggest natural
threat to food security (Wang, Lou, and Wang 2007). The drought evaluation model
of CropWatch uses different indicators for different zones and times of the year,
based on a zonal map for agricultural drought monitoring that takes topography,
climate, soil type, and crop-planting patterns into account (Mu et al. 2005, Mu 2006).
Used indicators include the crop vegetation health index (VHI, Kogan 1998),
temperature condition index (TCI), and vegetation condition index (VCI, Kogan
1995), which all are calculated based on remote sensing-derived NDVI, land surfacetemperature (LST), and soil-moisture data. A look-up table (LUT) was built for
selecting the best indicator for different regions in different months. This LUT can be
calibrated and updated as necessary. The model predicts and estimates the severity of
drought for China and generates maps to illustrate the degree and status of droughts.
International Journal of Digital Earth 117
Dow
nloa
ded
by [
Inst
itute
of
Rem
ote
Sens
ing
App
licat
ion]
at 0
0:15
12
Febr
uary
201
4

During a drought, maps can be released every ten days to inform decision makers
about the drought’s severity and likely impacts.
The drought model is particularly useful at the national scale. It relies on data
series covering several years and performs better where phenology and rotationremain stable over time. This situation cannot be taken for granted, all the more so,
since climate change scenarios predict an increase of the frequency of droughts in the
future. This is why the drought model needs improving to better apprehend spatial
inhomogeneity; this will be achieved by combining data from different sensors and
satellites (multi-resource, high resolution).
2.5. Estimating crop acreage
Total crop production depends on both crop yield and the total area where the crop
is grown. To estimate crop acreage, CropWatch combines remote-sensing-based
estimate of the crop-planting proportion (cropped area to arable land) with a crop
type proportion (specific type area (like wheat) to cropped area). This crop plantingand type proportion (CPTP) method combines satellite data with sampled field data
(Wu and Li 2004, 2012).
For China, the planting proportion is estimated based on an unsupervised
classification of high-resolution satellite images from Landsat TM, IRS P6 AWIFS,
and HJ-1 CCD, with an accuracy above 95% (Li and Wu 2004). The crop-type
proportion for China, however, is not based on remote sensing but estimated by
combining GPS, video, and GIS data (collectively referred to as GVG) from field
transects (Wu and Li 2004). The specifically developed GVG instrument collectsthousands of field photos that are used to estimate the proportion of different crop
types with an accuracy above 98% (Wu, Tian, and Li 2004b; Wu and Li 2012). The
GVG instrument also provides data on the relative contributions of all food crops to
the planted area, which is cropping structure, a fundamental variable for food
production estimation. Because the planting proportion and crop-type proportion
are estimated at late stages of crop-growing season, we assume the all existing crops
at that stage will survive to the time of harvest. The acreage of a specific crop can
then be computed by multiplying farmland acreage, planting proportion, and crop-type proportion of the crop.
Crop acreage estimation outside China � to estimate crop acreage for wheat,
soybean, maize and rice � relies on various techniques to identify crops based on
remote sensing data sources (described in Jia et al. 2010, 2011; Li et al. 2011).
To further reduce reliance on field data, a new technique is currently under
development to use indicators from satellite data. The crop identification method
would also be suitable for global crop acreage estimation. The method uses
multifrequency SAR data to classify crops, and has been shown to be effective fordifferent agricultural landscapes with accuracies above 90% for most major crops
(Chen et al. 2007; Karjalainen, Kaartinen, and Hyyppa 2008; Jia et al. 2011).
2.6. Estimating crop yield and production
Global and national crop yields for rice, wheat, soybean, and maize are estimated
using three separate methods, the results of which are integrated to reduce
uncertainty. The first method uses an agro-meteorological yield model that accounts
118 B. Wu et al.
Dow
nloa
ded
by [
Inst
itute
of
Rem
ote
Sens
ing
App
licat
ion]
at 0
0:15
12
Febr
uary
201
4
for yield trend (influenced by agricultural technology and field management) and
meteorological yield (sensitive to changes in weather conditions during the growing
season; Meng et al. 2004). The second method is an analysis of remote sensing-based
yield indicators. The yield estimation model for this method was developed byidentifying relevant remote sensing indicators and their relationship with yield
through a regression analysis (Li, Steven, and Clark 1990; Benedetti and Rossini
1993).The third method is a recently developed crop biomass and harvest index
method (Du et al. 2009a; Meng, Du, and Wu 2013), which estimates crop biomass
based on the crop’s photosynthesis and water stress during the growing season, and
then estimates the harvest index of crops from their growth parameters (Du et al.
2009b). This new model is independent of statistical data and, after calibration with
field observed crop biomass and harvest index, can be applied to different regionsacross the globe.
Once established, crop yield information is combined with crop acreage estimates
to determine crop production. Crop production estimates are made one month
before harvest and revised immediately after harvest.
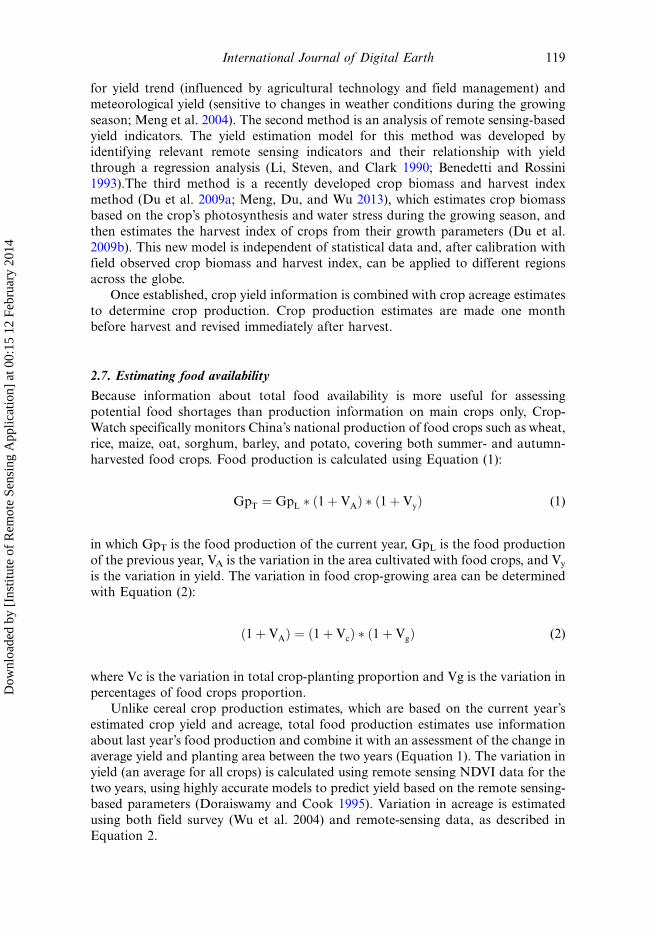
2.7. Estimating food availability
Because information about total food availability is more useful for assessing
potential food shortages than production information on main crops only, Crop-
Watch specifically monitors China’s national production of food crops such as wheat,
rice, maize, oat, sorghum, barley, and potato, covering both summer- and autumn-
harvested food crops. Food production is calculated using Equation (1):
GpT ¼ GpL � ð1þ VAÞ � ð1þ VyÞ (1)
in which GpT is the food production of the current year, GpL is the food production
of the previous year, VA is the variation in the area cultivated with food crops, and Vy
is the variation in yield. The variation in food crop-growing area can be determined
with Equation (2):
ð1þ VAÞ ¼ ð1þ VcÞ � ð1þ VgÞ (2)
where Vc is the variation in total crop-planting proportion and Vg is the variation in
percentages of food crops proportion.
Unlike cereal crop production estimates, which are based on the current year’s
estimated crop yield and acreage, total food production estimates use information
about last year’s food production and combine it with an assessment of the change in
average yield and planting area between the two years (Equation 1). The variation inyield (an average for all crops) is calculated using remote sensing NDVI data for the
two years, using highly accurate models to predict yield based on the remote sensing-
based parameters (Doraiswamy and Cook 1995). Variation in acreage is estimated
using both field survey (Wu et al. 2004) and remote-sensing data, as described in
Equation 2.
International Journal of Digital Earth 119
Dow
nloa
ded
by [
Inst
itute
of
Rem
ote
Sens
ing
App
licat
ion]
at 0
0:15
12
Febr
uary
201
4

2.8. Estimating cropping intensity
Cropping intensity is the ratio of total crop acreage of all planting seasons in a year
to the total area of arable land, an indication of the extent to which the food-
producing potential of an area is realized. CropWatch estimates the cropping
intensity using a NDVI time-series from meso- or low-resolution satellite images
(Fan and Wu 2004, Meng et al. 2011). After using a HANTS algorithm to
reconstruct the NDVI profile for each pixel (Zhang et al. 2004), the number of
peaks in the NDVI profiles can be counted, with each peak (if above a certain value
and at least two months from a previous peak) representing a crop-growing season.
The number of peaks per pixel is then converted to cropping intensity, with values
of 1, 2, and 3 to illustrate areas with one, two, or three crop seasons respectively
(Fan and Wu 2004). Results are reported at regional, provincial, and national
scales.
2.9. Monitoring the food supply�demand balance and providing early warning
Using CropWatch outputs, a separate model combines the various CropWatch
monitoring indicators with statistical information to analyze the food supply-
demand balance for China. Balancing food supply and demand is a key element of
macro-economic adjustment of the food market, and CropWatch can indicate areas
in China where food production is greater than, nearly equal to, or less than the
demand. By using remote-sensing-derived data on food production, which can be
acquired in a spatially distributed manner (Zeng et al. 2004), CropWatch has been
able to improve the capacity on early warning of food supply and demand
imbalances.
CropWatch food supply early warning is currently only carried out for China, but
the intent is to move toward a continuously updated outlook on global food demand
and supply.
2.10. Calibration and validation
Calibration and validation are critical for accurate and credible remote sensing
products (Justice and Townshend 1994), and CropWatch models are all individually
calibrated and validated at the time of development. Calibration and validation is
done for different agricultural systems and regions in China, based on information
from 15 experimental sites across the country. Results indicate the accuracy is 80%
for crop condition monitoring, 95% for crop acreage estimation of major crops, 94%
for crop yield prediction, 82% for drought monitoring, 92% for food production
estimation, and 90% for cropping intensity monitoring (Li and Wu 2004; Zhang et al.
2004; Li 2008; Wu et al. 2012).
Validation of CropWatch on a global scale is currently (2012�2014) being
implemented within the framework of the Group on Earth Observations (GEO) and
Joint Experiment for Crop Assessment and Monitoring (JECAM), comparing
CropWatch and other existing systems for calibration and validation. Plans are also
to collect additional data through a literature review (especially on crop yield and
production) for model calibration and to validate CropWatch results outside China.
120 B. Wu et al.
Dow
nloa
ded
by [
Inst
itute
of
Rem
ote
Sens
ing
App
licat
ion]
at 0
0:15
12
Febr
uary
201
4

2.11. Data management
The CropWatch operational system consists of its monitoring algorithms and
models, a graphic interface, a database, and a batching process to access and process
the files. The system is highly systematized and acquired data � including remote
sensing, meteorological, spatial, statistical, and validation data � is automatically
processed, stored, and managed by the database, with general system operation
supported by just three full-time staff. The database is developed with Oracle
database and ArcSDE as the spatial data management engine. The monitoring
technologies of CropWatch were developed into softwares with Graphical User
Interface (GUI) through the Interactive Developing Language (IDL) tools from ITT
Corporation.
3. Results
By relying primarily on remote sensing data, CropWatch is able to generate several
crop-monitoring indicators that previously were not easily available on a regional or
global scale. Examples are estimates of global crop production, crop conditions on a
regional scale, regional drought monitoring, regional crop-planting proportions and
crop acreage, and China’s cropping intensity index.
3.1. Global crop production estimates
As part of its global crop monitoring, CropWatch tracks the production of wheat,
rice, maize, and soybean in 31 major food-producing countries. According to
CropWatch results, in 2012, these target countries contributed about 85.94% of the
global wheat production, 82.3% of the global rice production, 77.5% of the global
maize production, and 92.7% of the global soybean production.
Figure 2 shows CropWatch results for global crop production in 2012, compared
to 2011, for wheat, rice, maize, and soybean. Global wheat production was 561.68
million tons, a decrease of 3.25% compared to the previous year. The results
specifically show a decrease in the production of wheat in Australia, Pakistan,
Turkey, United Kingdom, Germany, Russia, Ukraine, Kazakhstan, Spain, Romania,
Poland, and Belarus, while production increased in other wheat-producing countries.
According to the CropWatch data, global maize production was 731.21 million tons,
0.37% below the previous year. Maize production decreased in the United States,
Argentina, France, Italy, Romania, Hungary, Spain, and India, but increased in
other major producing countries. Global rice production was 49.78 million tons,
1.07% lower than the previous year, with rice production decreasing in India,
Bangladesh, Vietnam, and Burma and increasing in the other major rice-producing
countries. Finally, global production of soybean was 22.57 million tons, a reduction
of 8.22% compared to previous year.
3.2. Crop condition on a country scale
As an example of crop condition monitoring, Figure 3 shows CropWatch results for
crop condition in Romania in 2012.
International Journal of Digital Earth 121
Dow
nloa
ded
by [
Inst
itute
of
Rem
ote
Sens
ing
App
licat
ion]
at 0
0:15
12
Febr
uary
201
4

Figure 3a shows the spatial heterogeneity of crop condition. The cyan and blue
areas on the crop condition map indicate that compared to the five-year average,
crop conditions across the country have deteriorated. Figure 3b shows the temporal
variation (trend) in crop condition. The crop growth profiles confirm the poor crop
condition and show that in 2012, the crop NDVI profile is much below both the five-
year average and the 2011 profiles, indicating a relatively poor crop condition for the
period. The poor crop condition in August is the result of the continuous drought
that started in June (MARS bulletin, 2012).
Because Romania is a relatively small country, a profile can be generated as a
single curve for the entire country. For larger countries such as the United States or
India that cover different climate zones, separate curves are generated for different
areas.
3.3. Regional drought monitoring � Monitoring China’s severe 2009 drought
In the spring of 2009, China experienced a severe drought. Figure 4 illustrates the
development of the drought from late January to late February, using TERRA
MODIS satellite data.
The drought mainly occurred across northern China, where normally at that time
of year winter, wheat is growing. In the period between January 20 and February 16,
Figure 2. CropWatch estimates of global crop production of wheat, rice, maize, and soybean
in 2012, compared to 2011.
Note: Only target countries are shown; white areas are non-target countries for a particular
crop.
Source: CropWatch bulletin in 2011 and 2012.
122 B. Wu et al.
Dow
nloa
ded
by [
Inst
itute
of
Rem
ote
Sens
ing
App
licat
ion]
at 0
0:15
12
Febr
uary
201
4

Figure 3. Crop condition map (a) and crop-growing profile (b) for Romania, August, 2012.
Source: CropWatch bulletin in August 2012.
Intern
atio
na
lJo
urn
al
of
Dig
ital
Ea
rth1
23D
ownl
oade
d by
[In
stitu
te o
f R
emot
e Se
nsin
g A
pplic
atio
n] a
t 00:
15 1
2 Fe
brua
ry 2
014

the drought had two key characteristics. The first was its relatively large extension
throughout North China Plain (circled area). Across five provinces, the drought area
on average (temporal average) involved 45% of the cultivated land (the highest
percentage of drought area per cultivated land was 89% at the end of January). The
second characteristic of the drought was its severity. In particular at the end of
January (Figure 4a), a large number of areas are experiencing ‘moderate drought’ or
‘heavy drought.’ In February, both the extent of the drought and its levels decrease,
toward a level rated mainly as ‘light’ and ‘moderate drought’ (Figure 4b, c, d).
According to meteorological data, the number of consecutive days without
precipitation in the north, northwest, and central areas in that period from winter to
early February was up to 80 days, and in some areas even as high as one hundred
days, clearly constituting a drought. As the maps show, starting around February 16,
the extent and severity of the drought decreased, with the affected areas decreasing
from the highest value of 89% to as low as 29%. Meteorological information also
confirms this change and showed precipitation in the north in late February
(especially after February 25) effectively counterbalanced the effects of the drought.
By analyzing the CropWatch data, decision makers were able to assess the severity of
the drought and take appropriate measures.
Figure 4. CropWatch drought maps for China in 2009, (a) January 21�31, (b) February 1�10,
(c) February 11�16, and (d) February 17�22.
Source: CropWatch bulletin in 2009.
124 B. Wu et al.
Dow
nloa
ded
by [
Inst
itute
of
Rem
ote
Sens
ing
App
licat
ion]
at 0
0:15
12
Febr
uary
201
4

3.4. Crop acreage and crop-planting proportions
As a result of free data access to satellite image distribution centers, it is now possible
for CropWatch to use HJ-1 satellite data to cover the entire planting area for major
food crops in China. Figure 5 shows areas in China with and without crops planted
for the summer harvest season in winter-wheat-planting areas of China in 2010
estimated using an unsupervised classification method for HJ-1 CCD data. Based on
the classification results, the crop-planting proportion (CPP) can be estimated as the
proportion of cropped arable land to total arable land.
Figure 6 presents results of the CropWatch assessment of crop type proportions
by transect sampling, GVG, and a visual interpretation of crop type proportion
in collected pictures (Wu and Li 2012). The map shows the proportion of winter
wheat in 363 winter-wheat-planting counties in 2010. Winter-wheat acreage can be
calculated by multiplying CPP and the proportion of winter wheat of the cropped
land area for different counties and combining these numbers to arrive at a
provincial or national total, using the information from Figures 5 and 6.
Table 2 shows the 2010 crop type proportion of the autumn cropping season for
major crop-producing provinces in China. Using the GVG system, results not only
include the planting proportion of crops such as maize and soybean, but also those
of cash crops such as cotton and tobacco. As a result, the ratios of food crops to total
crops or food crops to cash crops can be generated. The results from GVG present
cropping structure in the autumn cropping season, which is essential in agricultural
decision-making.
Figure 5. Map of cropped farmland in north China in 2010.
Source: CropWatch data in 2010.
International Journal of Digital Earth 125
Dow
nloa
ded
by [
Inst
itute
of
Rem
ote
Sens
ing
App
licat
ion]
at 0
0:15
12
Febr
uary
201
4
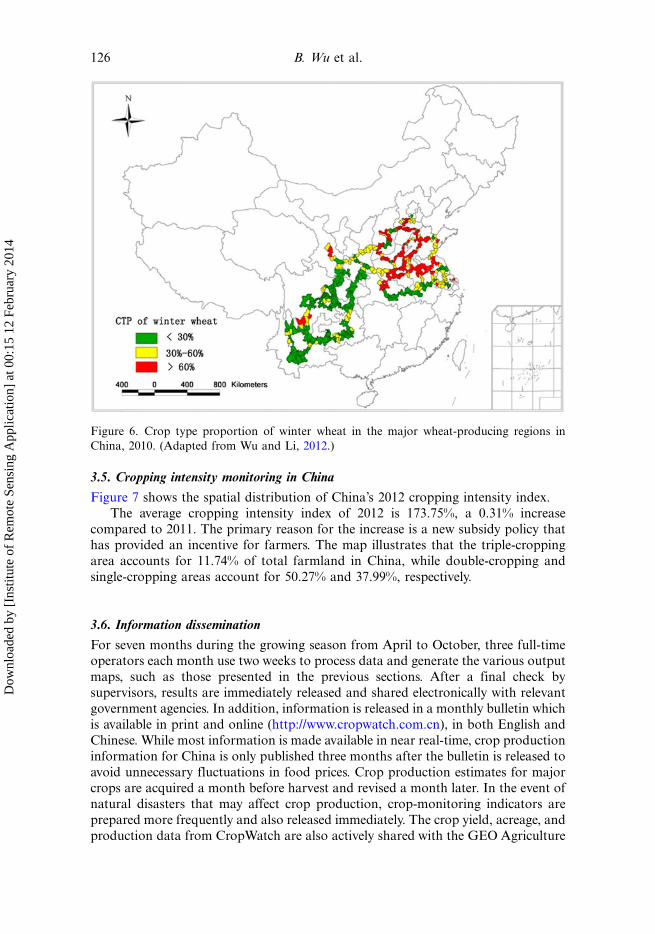
3.5. Cropping intensity monitoring in China
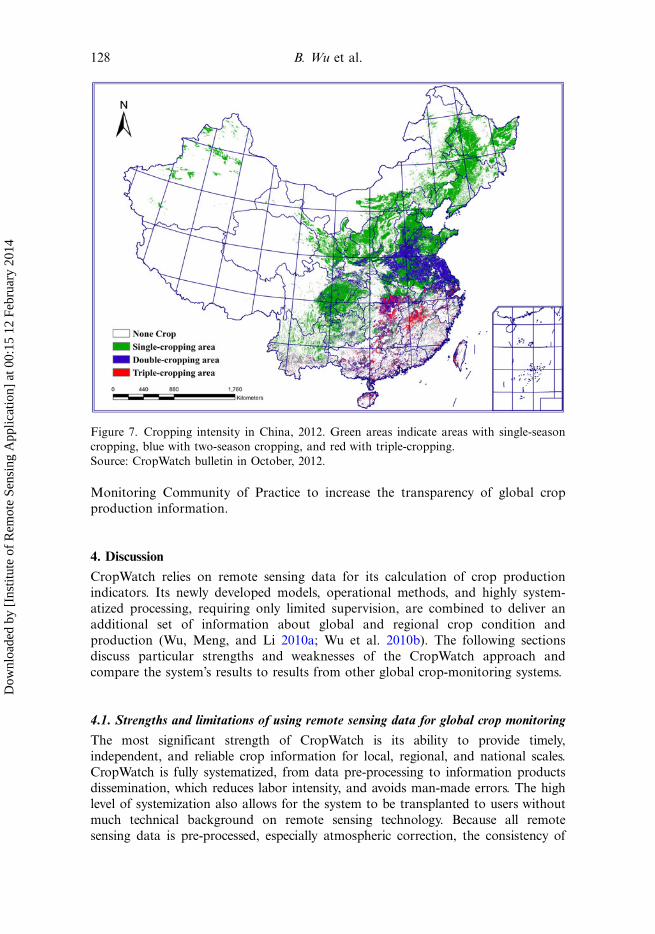
Figure 7 shows the spatial distribution of China’s 2012 cropping intensity index.
The average cropping intensity index of 2012 is 173.75%, a 0.31% increase
compared to 2011. The primary reason for the increase is a new subsidy policy thathas provided an incentive for farmers. The map illustrates that the triple-cropping
area accounts for 11.74% of total farmland in China, while double-cropping and
single-cropping areas account for 50.27% and 37.99%, respectively.
3.6. Information dissemination
For seven months during the growing season from April to October, three full-timeoperators each month use two weeks to process data and generate the various output
maps, such as those presented in the previous sections. After a final check by
supervisors, results are immediately released and shared electronically with relevant
government agencies. In addition, information is released in a monthly bulletin which
is available in print and online (http://www.cropwatch.com.cn), in both English and
Chinese. While most information is made available in near real-time, crop production
information for China is only published three months after the bulletin is released to
avoid unnecessary fluctuations in food prices. Crop production estimates for majorcrops are acquired a month before harvest and revised a month later. In the event of
natural disasters that may affect crop production, crop-monitoring indicators are
prepared more frequently and also released immediately. The crop yield, acreage, and
production data from CropWatch are also actively shared with the GEO Agriculture
Figure 6. Crop type proportion of winter wheat in the major wheat-producing regions in
China, 2010. (Adapted from Wu and Li, 2012.)
126 B. Wu et al.
Dow
nloa
ded
by [
Inst
itute
of
Rem
ote
Sens
ing
App
licat
ion]
at 0
0:15
12
Febr
uary
201
4

Table 2. Proportion of major crops of autumn cropping season in major crop-producing provinces in China, 2010 (percentages,%).
ProvinceSpringwheat
Singlerice
Laterice
Springmaize
Summermaize Durra Soybean Potato
Sweetpotato Pesnut Rapeseed Sunflower Cotton Tobacoo
Vegetableand fruit Others
Grainproportion
Hebei 63.97 2.21 1.36 6.21 14.16 7.46 4.63 67.54Shanxi 57.72 4.55 11.49 2.76 1.13 8.63 1.37 6.21 6.14 73.76Inner
Mongolia11.13 38.82 2.35 15.51 11.33 5.16 0.15 0.38 15.17 79.14
Liaoning 18.76 69.73 6.61 2.78 1.52 0.6 95.1Jilin 19.06 70.68 7.36 0.15 0.52 0.82 1.41 97.1Heilongjiang 0.93 26.75 34.59 32.73 0.33 0.15 0.73 0.52 1.01 2.26 95Jiangsu 68.13 13.23 9.17 1.11 2.15 4.03 2.18 90.53Zhejiang 24.13 57.45 3.65 0.21 9.25 5.31 85.44Anhui 32.45 16.12 24.59 19.63 1.33 1.27 1.68 3.93 92.79Fujian 13.05 17.86 34.62 34.47 30.91Jiangxi 10.69 48.69 5.03 1.46 12.43 21.7 59.38Shandong 66.58 7.03 1.11 10.93 3.53 9.12 1.7 74.72Henan 12.76 60.93 10.36 5.88 3.94 4.15 1.98 84.05Hubei 50.83 11.42 6.43 1.41 1.55 11.69 5.64 11.03 70.09Hunan 17.42 71.53 2.73 6.88 1.02 0.42 91.68Chongqing 44.92 23.53 1.61 1.01 8.15 20.78 68.45Sichuan 53.52 27.19 1.69 0.32 5.78 11.5 80.71Guizhou 43.14 49.18 1.01 3.69 2.98 92.32Yunnan 33.37 38.02 1.45 0.89 0.53 15.13 7.43 3.18 74.26Shaanxi 3.63 2.99 28.01 2.86 3.52 1.23 2.37 5.33 50.06 42.24Gansu 11.86 0.7 25.93 0.21 0.73 2.96 0.78 2.83 7.46 46.54 42.39Ningxia 6.13 9.13 31.03 0.26 5.56 0.93 13.87 33.09 52.11
Source: CropWatch data in 2010.
Intern
atio
na
lJo
urn
al
of
Dig
ital
Ea
rth1
27D
ownl
oade
d by
[In
stitu
te o
f R
emot
e Se
nsin
g A
pplic
atio
n] a
t 00:
15 1
2 Fe
brua
ry 2
014
Monitoring Community of Practice to increase the transparency of global crop
production information.
4. Discussion
CropWatch relies on remote sensing data for its calculation of crop productionindicators. Its newly developed models, operational methods, and highly system-
atized processing, requiring only limited supervision, are combined to deliver an
additional set of information about global and regional crop condition and
production (Wu, Meng, and Li 2010a; Wu et al. 2010b). The following sections
discuss particular strengths and weaknesses of the CropWatch approach and
compare the system’s results to results from other global crop-monitoring systems.
4.1. Strengths and limitations of using remote sensing data for global crop monitoring
The most significant strength of CropWatch is its ability to provide timely,
independent, and reliable crop information for local, regional, and national scales.
CropWatch is fully systematized, from data pre-processing to information productsdissemination, which reduces labor intensity, and avoids man-made errors. The high
level of systemization also allows for the system to be transplanted to users without
much technical background on remote sensing technology. Because all remote
sensing data is pre-processed, especially atmospheric correction, the consistency of
Figure 7. Cropping intensity in China, 2012. Green areas indicate areas with single-season
cropping, blue with two-season cropping, and red with triple-cropping.
Source: CropWatch bulletin in October, 2012.
128 B. Wu et al.
Dow
nloa
ded
by [
Inst
itute
of
Rem
ote
Sens
ing
App
licat
ion]
at 0
0:15
12
Febr
uary
201
4

interpretation among different remote sensing images is guaranteed, which is essential
for crop monitoring. As a result of its systematization, CropWatch monitoring
approaches have also been successfully implemented for other purposes, such as for
drought monitoring at both the Information Center of China’s Ministry of Water
Resources and the National Disaster Relief Center of China, as well as for provincial
crop-monitoring systems in the provinces of Anhui, Hubei, Jiangxi, and Shaanxi.
In addition, technology and systems for global crop monitoring have been transferredto Chinagrain†web for operation to support key information related to food-futures.
Other strengths of the CropWatch system are its cost-effectiveness and reliance
on independent data. By limiting the use of field data, CropWatch does not require
the use of expensive field offices, and its data processing and checking require few
staff. Results are only based on objective data and not influenced by intentional or
unintentional overestimates or underestimates of production. The data is also
independent of the information about global crop production that is available from
agricultural agencies and food management, statistical analysis, and market
departments. As such, CropWatch can act as an independent source of global
crop-monitoring information. Ongoing development and recent upgrades to the
CropWatch system, such as the development of the biomass harvest index model for
yield prediction or the use of remote sensing data to determine crop type
proportions, further strengthen the independence of CropWatch monitoring results.
The heterogeneity (both spatially and temporally) of agricultural areas also
points to an advantage of using a remote sensing-based system. Remote sensing is
the most effective tool for large-area crop monitoring. Unlike other approaches,remote sensing methods act as an independent information source that can reveal the
crop condition at a certain stage without knowing the reason. This is a quite different
approach from the more traditional, field-based and ‘personal’ monitoring, but one
that is already greatly contributing to our current understandings of global crop
production and condition.
Finally, the remote sensing-based outputs on crop condition, drought situation,
cropping intensity, food production, crop yield, and crop acreage, that CropWatch
can now easily generate, provide new kinds of input for food security assessments.
As described for the individual components, research on new methods and
additional calibration and validations continue. For each monitoring component, first
research is carried out, to make the theory and methods mature enough, after which
the new method is incorporated into the system. When making the monitoring method
operational, the heterogeneity of the agricultural landscape, climate, planting practices,
and crop proportions, among other aspects, are taken into account. Intensive
validation has been done for each monitoring component in CropWatch, including
drought monitoring (2006�2013), crop condition monitoring (2005�2011), cropacreage estimation (2002�2013), cropping intensity monitoring (2004�2010), crop
yield and production estimation (2003�2013), and food production estimation. The
validation of these monitoring themes was implemented at both experimental site
(usually 5 km *5 km) and region scales.
Challenges in the use of CropWatch relate mostly to the accuracy for results
outside China and to data availability. Extensive validations have been done in China,
using experimental sites, but outside China, validation is much harder as the ‘actual’
crop parameter values for large areas are difficult to acquire. Another major challenge
to the expanded use of CropWatch is the uncertainty related to the availability of
International Journal of Digital Earth 129
Dow
nloa
ded
by [
Inst
itute
of
Rem
ote
Sens
ing
App
licat
ion]
at 0
0:15
12
Febr
uary
201
4

satellite images at the necessary spatial, temporal, and spectral resolutions. Weather
conditions, as well as other factors such as conflicts in satellite programming, can lead
to the absence of remote sensing images in certain regions at certain periods. Budget
limitations will likely further intensify this issue of data availability.
4.2. CropWatch results compared to other global monitoring systems
CropWatch provides crop-monitoring services independent from those of other key
global monitoring systems, such as GIEWS, GLAM, and the EU’s JRC’s MARS
Program. With all systems having different focus areas and using different data
sources and models, the availability of multiple estimates on global crop production
and other key indicators will increase transparency and enable an enhancedunderstanding of global crop developments.
Figure 8 compares United States’ maize production (Figure 8a) and inter-annual
variations (Figure 8b) as reported by USDA (USDA-FAS 2003�2012), FAO
(FAOSTAT 2003�2011), and CropWatch.
For 2005�2009, the production numbers reported by CropWatch are higher than
those reported by the USDA and FAO, while in 2004 and 2010�2012 they are lower.
Reported inter-annual variations are consistent (positive or negative) among the
systems for 2005�2012, although differences in variation amplitude are observed.Take the inter-annual change between 2003 and 2004 for example, the reported maize
production variations by CropWatch and USDA/FAO are opposite, with FAO and
USDA describing an increase and CropWatch a decrease. In 2010, CropWatch shows
a much larger inter-annual change than the other two systems. While USDA and
FAO only reported a production reduction of 5% in that year, CropWatch reported a
much higher reduction.
Another example of how the use of multiple global monitoring systems can
enhance transparency and increase insight into a situation: Figures 9, 10, and Figure 11illustrate USDA FAS and CropWatch results for crop conditions in Russia in the
summer of 2010. That summer, Russia � the world’s third largest producer of wheat �was experiencing severe weather conditions: Droughts destroyed one-fifth of its wheat
production.
Both maps illustrate that crop conditions in 2010 are significantly worse than
normal in nearly every major crop-production region in Russia and Kazakhstan
(orange and red areas in Figures 9 and 10). The Volga, Ural, and Siberian Districts,
all are experiencing worse crop conditions as a result of the drought, and thepersistent drought and excessive heat are reducing yield prospects for all crops. The
CropWatch data shows that more than one third of cropland in Russia is
experiencing crop conditions worse than those in 2009 (orange and red areas in
Figure 10); only 5.3% of cropland showed a better condition (green and dark green
areas), while the rest maintained a similar condition. The crop-growing profile in
Figure 11 also shows that the crop-growing profile for 2010, based on NDVI data, in
April and May, is still similar to the five-year average, but that starting in June the
profile drops, reflecting a slowdown of crop growth due to the continuous drought.This would indeed predict a decrease in crop yield.
A direct comparison of wheat production estimates for Russia for 2009, 2010,
and 2011 from USDA (USDA-FAS 2003�2012), FAO (FAOSTAT 2003�2011), and
CropWatch monitoring systems is presented in Table 3.
130 B. Wu et al.
Dow
nloa
ded
by [
Inst
itute
of
Rem
ote
Sens
ing
App
licat
ion]
at 0
0:15
12
Febr
uary
201
4

Figure 8. United States’ maize production figures (1, 000 ton) (a) and maize production inter-annual variation in percentages (b).
Source: USDA FAS (www.fas.usgs.gov/wap_arc.asp), FAOSTAT (http://faostat3.fao.org/home/index.html), and CropWatch (CropWatch bulletin).
Intern
atio
na
lJo
urn
al
of
Dig
ital
Ea
rth1
31D
ownl
oade
d by
[In
stitu
te o
f R
emot
e Se
nsin
g A
pplic
atio
n] a
t 00:
15 1
2 Fe
brua
ry 2
014

Figure 9. Crop condition monitoring results for Russia by USDA FAS, showing MODIS
NDVI data, departure from mean, July 11�27, 2010. (Adapted from USDA FAS, August,
2010).
Figure 10. CropWatch crop condition map of Russia for the end of July 2010. The crop
condition map shows the condition of the crop compared to previous years.
Source: CropWatch Bulletin in 2010.
Figure 11. Crop-growing profile chart for Russia from CropWatch in 2010
Source: CropWatch bulletin in 2010.
132 B. Wu et al.
Dow
nloa
ded
by [
Inst
itute
of
Rem
ote
Sens
ing
App
licat
ion]
at 0
0:15
12
Febr
uary
201
4

All three systems observed a reduction in wheat production for 2010, followed by
an increase in 2011. The relative decrease in production between 2009 and 2010 is
similar for the three systems (decreases of �31.12%, �28.09%, and �32.77% for
USDA, CropWatch and FAO, respectively), but the increase in production between
2010 and 2011 varies (increases of 34.94%, 22.28%, and 32.5% for USDA,
CropWatch, and FAO, respectively). Also, the production numbers from FAO and
USDA are close, while those from CropWatch are much smaller, which can be
explained by the also much lower yield estimate. This is mainly because different
systems use different methods in estimating yields.
While CropWatch is able to provide a new and independent source of crop-
monitoring information, the system is more limited than other global systems in
providing postharvest analysis and supporting decision-making. USDA FAS’ Crop
Explorer, for example, presents a comprehensive overview of food production for the
entire globe as well as for major food-producing countries by integrating remote
sensing monitoring with information from local agricultural production reports,
providing a complete description of agricultural production for international or local
food trade markets. The professional and in-depth postanalysis of its monitoring
result is an important reason for the huge number of web visits (more than 70000 in
2008) to the Crop Explorer site (http://www.pecad.fas.usda.gov/cropexplorer). The
postharvest analysis of CropWatch needs to be enhanced for providing further value-
added information services.
5. Conclusion and outlook
China’s CropWatch, currently in its 15th year of operation, provides independent,
remote sensing-based information on global crop condition and crop yield and
production. In addition, the system provides information on droughts, cropping
intensity, and early warning for food supply and demand balance in China. By almost
exclusively relying on remote sensing and statistical data, CropWatch provides
information that previously was not available on this large scale in a timely manner in
China. CropWatch-systematized processing has reduced the uncertainty in the results,
as well as labor intensity and cost. In addition, CropWatch adds to the global base of
Table 3. Comparison of wheat production estimates from different systems; data for Russia,
2009�2011.
Yield estimate(tons per
hectare)
Production estimate(Million
tons)
Year USDA CropWatch FAO USDA CropWatch FAO
2009 2.15 1.54 � 61.7 44.3 61.7
2010 1.59 1.19 � 42.5 31.9 41.5
2011 2.15 1.50 � 56.0 39.0 55.0
Variation (2009�2010) �26.05% �22.70% � �31.12% �28.09% �32.77%
Variation (2010�2011) 37.82% 25.15% � 34.94% 22.28% 32.5%
� data not available.Source: World agricultural production report by USDA FAS, FAOSTAT (http://faostat3.fao.org/home/index.html#DOWNLOAD), and CropWatch (CropWatch bulletin.)
International Journal of Digital Earth 133
Dow
nloa
ded
by [
Inst
itute
of
Rem
ote
Sens
ing
App
licat
ion]
at 0
0:15
12
Febr
uary
201
4
agricultural information a new set of crop data independent of field reports. Several of
CropWatch monitoring models ensure the independency of the monitoring result.Looking forward, CropWatch will continue to upgrade its system and work to
strengthen analysis of repercussions of the food production. In particular, the
expected availability of crop-monitoring data from new high-resolution sensors will
be important for the development of CropWatch. As the use of the CropWatch
system and data analysis is being transferred to various users, research will focus on
exploring the suitability, capacity, and potential of the new data becoming available
and determining appropriate methods for their use, to achieve a higher accuracy in
crop estimations. As more data can be accessed and acquired free of charge, costs of
large-scale crop monitoring are going down and it will become more affordable for
systems to use satellite data and use it more frequently and from multiple sources,
allowing for more real-time data to be processed. New methodologies will likely need
to be developed and tested to include this new data into the system.
Acknowledgements
The development of CropWatch and its operation was supported by grants from MajorPrograms of the Chinese Academy of Sciences during the 9th Five-Year Plan period (KZ951-A1-302-02[1998�2000]), the Key Program of the Chinese Academy of Sciences (KZ95T-03-02[1998�2000]), the Knowledge Innovation Programs of the Chinese Academy of Sciences(KZCX2-313[2000�2002], KZCX3-SW-338-2[2003�2007], KSCX1-YW-09-01[2008�2010]),the National Key Technologies Research and Development Program of China during the10th Five-Year Plan Period (2001BA513B02[2001�2003]), the National High-Tech Researchand Development Program of China (2003AA131050[2003�2005], 2012AA12A307[2012�2014],2013AA12A302[2013�2015]), the National Extension Program for Main Achievements(KJSX0504[2005�2007]), and the Conversion Program for Technical Achievements inAgriculture (GQ050006[2005�2007]) by the Ministry of Science and Technology of China.We gratefully appreciate the helpful comments of the anonymous reviewers, which helpedto improve the quality of this paper. We also acknowledge Rene Alex GOMMES forrevising the language of the paper. The authors would like to thank all the other studentsand staff who contributed to the manuscript.
References
Becker-Reshef, I., C. Justice, M. Sullivan, E. Vermote, C. Tucker, A. Anyamba, J. Small, et al.2010. ‘‘Monitoring Global Croplands with Coarse Resolution Earth Observations: TheGlobal Agriculture Monitoring (GLAM) Project.’’ Remote Sensing 2 (6): 1589�1609.doi:10.3390/rs2061589.
Benedetti, R., and P. Rossini. 1993. ‘‘On the Use of NDVI Profiles as a Tool for AgriculturalStatistics: The Case Study of Wheat Yield Estimate and Forecast in Emilia Romagna.’’Remote Sensing of Environment 45 (3): 311�326. doi:10.1016/0034-4257(93)90113-C.
Brown, L., 2005. Outgrowing the Earth. Washington, DC: Earth Policy Institute.Brown, R. J., M. Bernier, G. Fedosejevs, and L. Skretkowicz. 1982. ‘‘NOAA-AVHRR Crop
Condition Monitoring.’’ Canadian Journal of Remote Sensing 8: 107�117.Chen, E. X., Z. Y. Li, Y. Pang, and X. Tian. 2007. ‘‘Quantitative Evaluation of Polarimetric
Classification for Agricultural Crop Mapping.’’ Photogrammetric Engineering and RemoteSensing 73 (3): 279�284. https://eserv.asprs.org/PERS/2007journal/mar/2007_mar_279-284.pdf.
Doraiswamy, P. C., and P. W. Cook. 1995. ‘‘Spring Wheat Yield Assessment using NOAAAVHRR Data.’’ Canadian Journal of Remote Sensing 21 (1): 43�51.
134 B. Wu et al.
Dow
nloa
ded
by [
Inst
itute
of
Rem
ote
Sens
ing
App
licat
ion]
at 0
0:15
12
Febr
uary
201
4

Du, X., B. F. Wu, Q. Z. Li, J. H. Meng, and K. Jia. 2009a. ‘‘A Method to Estimated WinterWheat Yield with the MERIS Data.’’ In Progress in Electromagnetics Research Symposium(PIERS) Proceedings. Beijing, China. March 23�27.
Du, X., B. F. Wu, J. H. Meng, and Q. Z. Li. 2009b. ‘‘Estimation of Harvest Index of WinterWheat Based on Remote Sensing Data.’’ In 33rd International Symposium on RemoteSensing of Environment Proceedings. Stresa, Italy. May 4�8.
Duveiller, G., R. Lopez-Lozano, and B. Baruth. 2013. ‘‘Enhanced Processing of 1-km SpatialResolution fAPAR Time Series for Sugarcane Yield Forecasting and Monitoring.’’ RemoteSensing 5 (3): 1091�1116. doi:10.3390/rs5031091.
Esquerdo, J. C. D. M., J. J. Zullo, and J. F. G. Antunes. 2011. ‘‘Use of NDVI/AVHRR Time-Series Profiles for Soybean Crop Monitoring in Brazil.’’ International Journal of RemoteSensing 32 (13): 3711�3727. doi:10.1080/01431161003764112.
Fan, J. L., Q. Y. Meng, B. F. Wu, and X. T. Zhou. 2003. ‘‘Development of Crop YieldForecasting System.’’ Chinese Journal of Agrometeorology 24 (2): 46�51. doi:10.3969/j.issn.1000-6362.2003.02.014.
Fan, J. L., and B. F. Wu. 2004. ‘‘Methodology of Cropping Index Retrieval from NDVIProfile.’’ Sinic Journal of Remote Sensing 8 (6): 628�636. doi:10.11834/jrs.20040613.
Fang, H. L., B. F. Wu, H. Y. Liu, and X. Huang. 1997. ‘‘Using NOAA AVHRR and LandsatTM to Estimate Rice Area Year-by-year.’’ Remote Sensing Technology and Application12 (3): 23�26. doi:10.1080/014311698216134.
FAO, 2007. Adaptation to Climate Change in Agriculture, Forestry and Fisheries: Perspective,Framework and Priorities. Rome, Italy: UN FAO, Interdepartmental Working Group onClimate Change, 24 pp.
FAOSTAT, 2003�2011. Statistical Database, FAO. http://faostat3.fao.org/home/index.html#DOWNLOAD.
Fontana, D. C., R. W. Melo, A. P. L. Wagner, E. Weber, and A. Gusso. 2006. ‘‘Use of RemoteSensing for Crop Yield and Area Estimates in the Southern of Brazil.’’ Paper presented inWorkshop Remote Sensing Support to Crop Yield and Area Estimates, Stresa, Italy: JRC/ISPRS.
Genovese, G. 2001. Introduction to the MARS Crop Yield Forecasting System, Document of theWorking Party of the Statistics of crop products from the Agriculture Statistics Committee,EUROSTAT Doc ASA/PE/630, SPI.02.46 EC. October 4�5.
Genovese, G. P., S. Fritz, and M. Bettio. 2006. ‘‘A Comparison and Evaluation ofPerformances among Crop Yield Forecasting Models Based on Remote Sensing: Resultsfrom the Geoland Observatory of Food Monitoring. Proceedings of the ISPRS WG VIII/10Workshop 2006 � Remote Sensing Support to Crop Yield Forecast and Area Estimates.’’International Archives of the Photogrammetry, Remote Sensing and Spacial InformationSciences, 36(8/W48), 71�77.
Gommes, R. 2007. ‘‘Non-parametric Crop Yield Forecasting, a Didactic Case Study forZimbabwe.’’ ISPRS Archives XXXVI-8/W48 Workshop proceedings: Remote sensing supportto crop yield forecast and area estimates, pp. 79�84. Stresa, Italy.
Jia, K., Q. Z. Li, Y. C. Tian, B. F. Wu, F. F. Zhang, and J. H. Meng. 2010. Crop ClassificationBased on Fusion of Envisat ASAR and HJ CCD Data. In Dragon 2 programme middleresults (2008�2010) proceedings. Guilin, China. May 17�21.
Jia, K., B. F. Wu, Y. C. Tian, Y. Zeng, and Q. Z. Li. 2011. ‘‘Vegetation Classification Methodwith Biochemical Composition Estimated from Remote Sensing Data.’’ InternationalJournal of Remote Sensing 32 (24): 9307�9325. doi:10.1080/01431161.2011.554454.
Jiang, X. Z., R. Zhao, Q. Z. Li, B. F. Wu, and L. H. He. 2002. ‘‘Extraction of Crop AcreageUsing GVG System and Its Precision Analysis.’’ Journal of Nanjing Institute of Meteology25 (1): 78�83. doi:10.3969/j.issn.1674-7097.2002.01.010.
Johnson, D. M. 2008. ‘‘A Comparison of Coincident Landsat-5 TM and Resourcesat-1 AWiFSImagery for Classifying Croplands.’’ Photogrammetric Engineering and Remote Sensing74 (11): 1413�1424. http://www.asprs.org/a/publications/pers/2008journal/november/2008_nov_1413-1423.pdf.
Justice, C. O., and J. R. G. Townshend. 1994. ‘‘Data Sets for Global Remote Sensing: LessonsLearnt.’’ International Journal of Remote Sensing 15 (17): 3621�3639. doi:10.1080/01431169408954347.
International Journal of Digital Earth 135
Dow
nloa
ded
by [
Inst
itute
of
Rem
ote
Sens
ing
App
licat
ion]
at 0
0:15
12
Febr
uary
201
4

Karjalainen, M., H. Kaartinen, and J. Hyyppa. 2008. ‘‘Agricultural Monitoring Using EnvisatAlternating Polarization SAR Images.’’ Photogrammetric Engineering and Remote Sensing74 (1): 117�128. http://www.asprs.org/a/publications/pers/2008journal/january/2008_jan_117-126.pdf.
Kogan, F. N. 1995. ‘‘Application of Vegetation Index and Brightness Temperature for DroughtDetection.’’ Advances in Space Research 15 (11): 91�100. doi:10.1016/0273-1177(95)00079-T.
Kogan, F. N. 1998. ‘‘Global Drought and Flood-Watch from NOAA Polar-orbitting Satellites.’’Advances in Space Research 21 (3): 477�480. doi:10.1016/S0273-1177(97)00883-1.
Li, Q. Z. 2008. ‘‘Validation and uncertainty analysis of large area crop acreage estimation withremote sensing.’’ Ph D. diss., Institute of Remote Sensing Applications, Chinese Academyof Sciences.
Li, A. N., S. L. Liang, A. S. Wang, and J. Qin. 2007. ‘‘Estimating Crop Yield from Multi-temporal Satellite Data using Multivariate Regression and Neural Network Techniques.’’Photogrammetric Engineering and remote sensing 73 (10): 1149�1159. http://dam.itpcas.ac.cn/pdf/Li2007PERS.pdf.
Li, Y. Z., M. D. Steven, and J. A. Clark, eds. 1990. ‘‘Estimating Production of WinterWheat by Remote Sensing and Unified Ground Network. II. Nationwide Estimation ofWheat Yields.’’ In Applications of remote sensing in agriculture, 149�158. London, UK:Butterworths.
Li, Q. Z., and B. F. Wu. 2004. ‘‘Accuracy Assessment of Planted Area Proportion UsingLandsat TM Imagery.’’ Journal of Remote Sensing 8 (6): 581�587. doi:10.11834/jrs.20040607.
Li, Q. Z., B. F. Wu, K. Jia, Q. H. Dong, H. Eerens, and M. Zhang. 2011. ‘‘Maize AcreageEstimation Using ENVISAT MERIS and CBERS-02B CCD Data in the North ChinaPlain.’’ Computers and Electronics in Agriculture 78 (2): 208�214. doi:10.1016/j.com-pag.2011.07.008.
MARS bulletin. 2012. European Commission, Joint Research Centre. Accessed August 27.http://mars.jrc.ec.europa.eu/mars/Bulletins-Publications/Mars-Bulletin-Vol.-20-No.-08-Crop-Monitoring-in-Europe-27-August-2012.
Meng, J. H., X. Du, and B. F. Wu. 2013. ‘‘Generation of High Spatial and TemporalResolution NDVI and its Application in Crop Biomass Estimation.’’ International Journalof Digital Earth 6 (3): 203�218. doi:10.1080/17538947.2011.623189.
Meng, J. H., and B. F. Wu. 2008. ‘‘Study on the Crop Condition Monitoring Methods withRemote Sensing.’’ The International Archives of the Photogrammetry, Remote Sensing andSpatial Information Sciences Vol. XXXVII. Part B8: 945�950.
Meng, J. H., B. F. Wu, and Q. Z. Li. 2008. ‘‘A Global Crop Growth Monitoring System Basedon Remote Sensing.’’ The International Archives of the Photogrammetry, Remote Sensing andSpatial Information Sciences Vol. XXXVII. Part B7: 1695�1698. http://www.bulletin.cas.cn/gkml/2004d3q/CG/201203/P020120331522432253910.pdf.
Meng, J. H., B. F. Wu, Q. Z. Li, and L. Zhang. 2007. ‘‘An Operational Crop GrowthMonitoring System by Remote Sensing.’’ Sinic High Technology Letters 17 (1): 94�99.
Meng, J. H., B. F. Wu, Q. Z. Li, L. M. Niu, F. F. Zhang, and X. Du. 2011. ‘‘IntegratedProvincial Crop Monitoring System Using Remote Sensing.’’ Transactions of the CSAE27 (6): 169�175. doi:10.3969/j.issn.1002-6819.2011.06.031.
Meng, Q. Y., Q. Z. Li, and B. F. Wu. 2004. ‘‘Operational Crop Yield Estimating Method forAgricultural Statistics.’’ Sinic Journal of Remote Sensing 8 (6): 602�610. doi:10.11834/jrs.20040610.
Mu, L. L., 2006. ‘‘Suitability and uncertainty analysis of agricultural drought indicator withremote sensing.’’ Ph D. diss., Institute of Remote Sensing applications, Chinese Academy ofSciences.
Mu, L. L., N. N. Yan, and B. F. Wu. 2005. ‘‘Developing Drought Monitoring Methods andSystem.’’ In China Digital Agriculture and Rural Information Academic Research Symposiumproceedings. Beijing, China. March 19�20.
Rao, M. V. K., R. S. Ayyangar, and P. P. N. Rao. 1982. ‘‘Role of Multi-spectral Data inAssessing Crop Management and Crop Yield.’’ In Machine Processing of Remote SensedData Symposium proceedings, 1103�1112. Indiana, US. July 7�9.
136 B. Wu et al.
Dow
nloa
ded
by [
Inst
itute
of
Rem
ote
Sens
ing
App
licat
ion]
at 0
0:15
12
Febr
uary
201
4

Reichert, G. C., and D. Caissy. 2002. A Reliable Crop Condition Assessment Program (CCAP)Incorporating NOAA AVHRR Data, a Geographical Information System and the Internet.http://proceedings.esri.com/library/userconf/proc02/pap0111/po111.htm.
Roerink, G. J., and M. Menenti. 2000. Time Series of Satellite Data: Development of NewProducts. BCRS-report NRSP-2 99�33, Delft, The Netherlands, 1�68.
SAC. 1995. Manual for Crop Production Forecasting Using Remotely Sensed Data, a JointProject of Space and Ministry of Agriculture, Govt. of India, Technical Note, RSAF/SAC/CAPE-II/TN/46/95. Ahmedabad, India: Space Applications Centre,.
Savitzky, A., and M. J. Golay. 1964. ‘‘Smoothing and Differentiation of Data by SimplifiedLeast Squares Procedures.’’ Analytical Chemistry 36 (8): 1627�1639. doi:10.1021/ac60214a047.
Supit, I., A. A. Hooijer, C. A. van Diepen, eds. 1994. System Description of the Wofost 6.0Crop Growth Simulation Model Implemented in cgms. Volume 1: Theory and Algorithms.EUR 15956 EN, 144. Luxembourg: Office for Official Publications of the EU.
USDA-FAS. 2003�2012. World Agricultural Production, USDA, FAS. http://usda.mannlib.cornell.edu/MannUsda/viewDocumentInfo.do?documentID�1860.
Vossen, P., and D. Rijks. 1995. Early Crop Yield Assessment of the EU Countries: The SystemImplemented by the Joint Research Centre. EUR 16318 EN, 180. Luxembourg: Office forOfficial Publications of the EU.
Wang, C. Y., X. L. Lou, and J. L. Wang. 2007. The Research Progresses of Major AgriculturalMeteorological Disasters. Beijing: China Meteorological Press.
Wu, B. F. 2000. ‘‘Operational Remote Sensing Methods for Agricultural Statistics.’’ ActaGeographica Sinica 55 (1): 23�35. http://www.geog.com.cn/fileup/PDF/20000103.pdf.
Wu, B. F., J. L. Fan, Y. C. Tian, Q. Z. Li, L. Zhang, Z. L. Liu, G. L. Zhang, et al. 2004a.‘‘A Method for Crop Planting Structure Inventory and its Application.’’ Sinic Journal ofRemote Sensing 8 (6): 618�627. doi:10.11834/jrs.20040612.
Wu, B. F., and Q. Z. Li. 2004. ‘‘Crop Acreage Estimation Using Two Individual SamplingFrameworks with Stratification.’’ Sinic Journal of Remote Sensing 8 (6): 551�569.doi:10.11834/jrs.20040605.
Wu, B. F., and Q. Z. Li. 2012. ‘‘Crop Planting and Type Proportion Method for Crop AcreageEstimation of Complex Agricultural Landscapes.’’ International Journal of Applied EarthObservation and Geoinformation 16 (2012): 101�112. doi:10.1016/j.jag.2011.12.006.
Wu, B. F., J. H. Meng, and Q. Z. Li. 2010a. ‘‘An Integrated Crop Condition MonitoringSystem with Remote Sensing.’’ Transactions of the ASABE (American Society ofAgricultural and Biological Engineers) 53 (3): 971�979.
Wu, B. F., J. H. Meng, Z. Q. Li, F. F. Zhang, X. Du, and N. N. Yan. 2010b. ‘‘LatestDevelopment of CropWatch*A Global Crop Monitoring System with Remote Sensing.’’Advances in Earth Science 25 (10): 1013�1022. http://www.adearth.ac.cn/EN/Y2010/V25/I10/1013.
Wu, B. F., Y. C. Tian, and Q. Z. Li. 2004b. ‘‘GVG, a Crop Type Proportion SamplingInstrument.’’ Sinic Journal of Remote Sensing 8 (6): 570�580. doi:10.11834/jrs.20040606.
Wu, B. F., N. N. Yan, J. Xiong, W. G. M. Bastiaanssen, W. W. Zhu, and A. Stein. 2012.‘‘Validation of ETWatch Using Field Measurements at Diverse Landscapes: A Case Studyin Hai Basin of China.’’ Journal of Hydrology 436�437: 67�80. doi:10.1016/j.jhydrol.2012.02.043.
Xu, X. G., B. F. Wu, J. H. Meng, and Q. Z. Li. 2008. ‘‘Design and Implementation of CropYield Forecasting System.’’ Computer Engineering (in Chinese) 34 (9): 283�285.
Zeng, L., Y. Zhang, X. Zhang, and B. F. Wu. 2004. ‘‘A Short-term Model of Grain Supply andDemand Balance Based on Remote Sensing Monitoring and Agriculture Statistical Data.’’Sinic Journal of Remote Sensing 8 (6): 645�654. doi:10.11834/jrs.20040615.
Zhang, F., B. F. Wu, H. P. Huang, and M. M. Li. 2003. ‘‘Study of Ploughed Field InformationExtraction in Rice Area of Thailand.’’ Journal of Natural resources 18 (6): 766�772. http://www.jnr.ac.cn/EN/Y2003/V18/I6/766.
Zhang, F., B. F. Wu, C. L. Liu, Z. M. Luo, S. W. Zhang, and G. L. Zhang. 2004. ‘‘A Method toExtract Regional Crop Growth Information with Time Series of NDVI Data.’’ Sinic Journalof Remote Sensing 8 (6): 515�528. doi:10.11834/jrs.20040603.
International Journal of Digital Earth 137
Dow
nloa
ded
by [
Inst
itute
of
Rem
ote
Sens
ing
App
licat
ion]
at 0
0:15
12
Febr
uary
201
4