Embed Size (px)
Citation preview
Photonirvaehak Journal of the Indian Society of Remote Sensing, Vol. 24, No. 4, 1996
Remote Sensing Data Acquisition, Platforms and Sensor Requirements
Study team: R R NAVALGUND, V JAYARAMAN*, A S KIRAN KUMAR, TARA SHARMA, KURIEN MATHEWS and K K MOHANTY
Additional contributors: V K DADHWAL, M B POTDAR, T P SINGH, R GHOSH, V TAMILARASAN and T T MEDHAVY
Space Applications Centre (ISRO), Ahmedabad - 380053 * ISRO Head Quarters, Bangalore - 560094
The study was undertaken by the study group constituted by the Executive Council of ISRS. The findings of the stud), team (assisted by scientists from SAC) are reported here.
tJ Z
t-.
Remote Sensing Data Acquisition, Platforms and Sensor Requirements
iiii ~ i ~ i i i ~ i i ~ i i ~ i i ~ i ~ iii~ii~i i ~i~iiiii::ii i!iii!!iiiiiiiiiii::iiiii iiii!:: iliill ili;ii! i~i iiiiiiiiiiiiiiiiiiiiiiiiiiiiiiii!ii~i ill iil i !ii!~iii! !iiiiiiiiiiiiiiiiii iii iii iiiiii! i:::::ii::ii: iiiiiiii: iiiiiiiii iiiii iii i!!i!ii
........................... �9 : .~. ................... !.i::...~ ...................... i:..~ ............... ~ .............................. ~ ............. ~ ............................................... ~ ............................. ~::..., ......................... " ............................................................
:::::::::::::::::::::::::: i ~ D i : : : f i ~ : : ~ : : ~ a ~ j ~ l ~ i ~ : ~ 2 m : ~ ~ a ~ a : : : ~ : ~ o m ~ : : ~ ~ : i " ~ i ~ : ~ t ~ d i ~e~aiil~::~::~::~ : : : : : : . : : : : : : : : : : . . :. : : : : : . : : : . . . : . . . . : : : : . . . . . . . .~ . . . . : : : . : .~- : . . . . . . . . . . . . . . . : : : . . : - . :....:..:........-:-..:.....::: .::..::::-...........: :: ' . . . .-. . . .: . . . . .:" .::$5... . . . . . . . .-. . . . . . .: . . . . . . . . . . . . . . . . . . . .: . . .:;:. . . . . . . . . . . . . .-.-. :: : . ~ . . . . . . . 5 " %:.. . . . . . . : : : : . . . . . : . : . . : . . . . . . . . . . : . -:-. :.. . . . . . .-.-... .:.:.:.:
i~ i ~! i !i:;::~iiii.ii~ii~i~i .::!~i~i::::~iiii!~| ! iiiiiiiiiiiiiiii?.il ii: i::::ii:: ::~i::iiiii::iii::iiiiiiii!i:.ii::i::::::iiii::iiii iiiili~iiiiiiiiiiiiiiiiiiii!i i i :: iiiiiiiiiii::i~i:::::i i iii~iiiiiiiiiiiii i i i::i i::iiiiiii ::::iiiiili i:ii: :iiiiiiiiiiiii ::!!::::
i::i::i::::;:i;~::: .::~:!:!~::ii!n~rsto6ii~is~i::i::i::i::i::i::i:::::: ~i~i !:::i:::!:.iiiiiiiiii::iii::i::i::i::i::i~::i::. ::.i:. i i::i:.::::::::i::i:.::::~::i:: ! : :: ~!~!!:!~i~i::~::iiiiiiiii~!i!::iii~::::~:::::::::~.~?::.:~!:~i::!:i::::::i::i::i::iii::ii::̀iii~ :!! ii !i!?.ii!::i::iiiiiii::i::iiiiiiii~i.iii::~:i~ ii::::~i::ili::iii::i::i::iiiii;ii:
ii ii ~:: i! ~! :.! ::i :.i ::. !! !: !! !! ii!~ i~i ::~ ::! ii ~:: :.! i~:~ !iii i iii ii i iii i i i iii iii il !ii! ::! i i i i!iiiiiii!ii !ii!iiii!i!i!!! !i!i!iiiii ii ii ii iii:: ii ii ii ii ii ii ii i! i! i! !i !iii ii ii ii ii ii ii ii ii il ii il :i ii !i i iii ii ii iiiii ii ii ii ii ii ii ii ii ii ii ii ii i! !! !! !iil i ii i! il ii ii ii ii ii ii ii ii ii ii il ii ii i! il iiiiiiiiiiiiiiiiiiiiiiiiiiiiiiiiiiii:.ii i i! ii !i i! ii ii :.iii ii:iii!iii ii ii il i! il i l i! :::: :i i i
209
1. Introduction
T h e h i s to ry o f sa te l l i te r e m o t e s ens ing began wi th the l a u n c h o f T I R O S - 1 s p a c e c r a f t in 1960 c a r r y i n g a s ing le band T V c a m e r a w h i c h sen t b a c k f irst c l o u d i m a g e s o f the ear th . S u c c e s s f u l l a u n c h i n g o f the Ear th R e s o u r c e s T e c h n o l o g y Sate l l i te ( E R T S - 1 ) in 1972, la ter r e n a m e d as L A N D S A T h e r a l d e d b e g i n n i n g o f the era o f sa te l l i te r e m o t e s e n s i n g for natura l r e s o u r c e s s u r v e y and m o n i t o r i n g . S ince then , the re has been t r e m e n d o u s p rog re s s in d e v e l o p i n g n e w ear th o b s e r v a t i o n p l a t f o r m s
w i t h a w i d e va r i e ty o f r e m o t e s e n s i n g i n s t r u m e n t s . Th is , t o g e t h e r w i th the p r o g r e s s m a d e in da ta p r o c e s s i n g and da t a i n t e rp re t a t i on t e c h n i q u e s has c o n s i d e r a b l y w i d e n e d the s c o p e o f r e m o t e s e n s i n g app l i c a t i ons . T h e ea r th o b s e r v a t i o n s y s t e m s p r o g r a m m e in Ind ia has been a p p l i c a t i o n s d r iven . W h i l e B h a s k a r a I & II sa te l l i t es l a u n c h e d in late s e v e n t i e s and ea r ly e igh t i e s p r o v i d e d an e x p e r i e n c e in the d e s i g n and d e v e l o p m e n t o f spacec ra f t , da ta p r o c e s s i n g t e c h n i q u e s and a p p l i c a t i o n p a c k a g e s , the s u c c e s s f u l l aunch o f I R S - I A in 1988, IRS- i B in 1991 and I R S - P 2 in 1994 h e r a l d e d the
210 R.R. Navalgund et al.
era of operational remote sensing programme and provided the confidence to launch second generation satellite IRS-IC at the end of 1995 which will cater to local and international users.
Although data available from various earth observation systems have been used routinely in many areas of resources applications, there have been gaps, and data needs of applications at different levels of details have not been met. There is a growing demand for availability of data at higher repetivity, at higher spatial resolution, in more and narrower spectral bands etc.
In view of this, President, ISRS, constituted a study group to examine detailed observational requirements of agriculture, agrometeorology, forestry, hydrology, geological and mineral resources, cartography, marine and coastal applications and global changes. Observational requirements have been translated in terms of sensor parameters to suggest a group of sensors/earth observation systems. The study group also undertook a survey to get a feedback on the user needs, by circulating a questionnaire to more than 800 users of remote sensing technology. The feedback received was analysed to get a perception of data needs to meet their application requirements. Details of this analysis are given separately in Annexure-I.
2. Satellite Systems: Present and Immediate Future Scenario
2.1 btternational scenario
Depending on envisaged applications, the current satellite remote sensing
programme can be grouped into two broad categories:
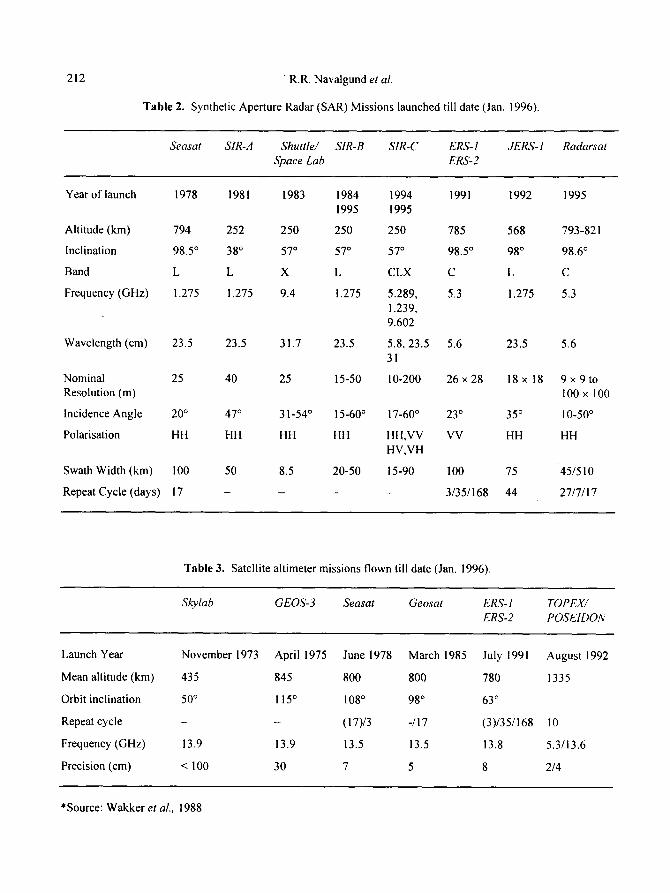
i) Earth observation systems for the management and regional inventory of renewable and non-renewable resources: This includes regional monitoring of vegetation, deforestation, soil, minerals, inland water bodies, snow/ice cover, urban sprawl, coast lines etc. and monitoring calamity zones like flood plains, volcanoes etc. Remote sensing missions like LANDSAT, SPOT, MOS and JERS belong to this category. There are also Space Shuttles Missions which carried microwave payloads. ERS-I and RADARSAT are those developed for microwave remote sensing. Details of these missions are given in Tables 1,2,3.
ii) Environmental missions to study the dynamics of land-ocean-atmospheric interactive system to have a predictive knowledge about the evolution of earth's environment, climate patterns etc. This requires global monitoring of a large number of geophysical, chemical and biological parameters of the earth system over a long period of time. Thus environmental missions, in general, involve measurement of a large number of parameters using various kinds of imaging and non-imaging sensors operating in a wide range of electromagnetic spectrum. Remote sensing programmes like POES/ NOAA, UARS/NOAA, ERS/ESA etc. and all operational meteorological satellite programmes may be grouped under this category. Here it has to be emphasized that satellite missions for earth resource applications have also contributed much to the understanding of environmental
Remote Sensing Data Acquisition, Platforms and Sensor Requirements 211
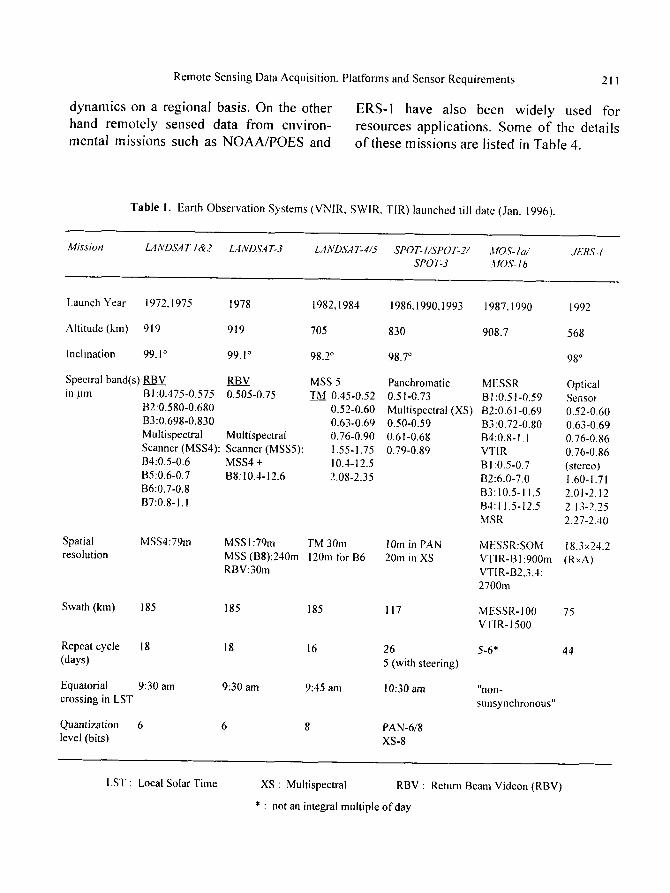
dynalnics on a regional basis. On the other hand remotely sensed data from environ- mental missions such as NOAA/POES and
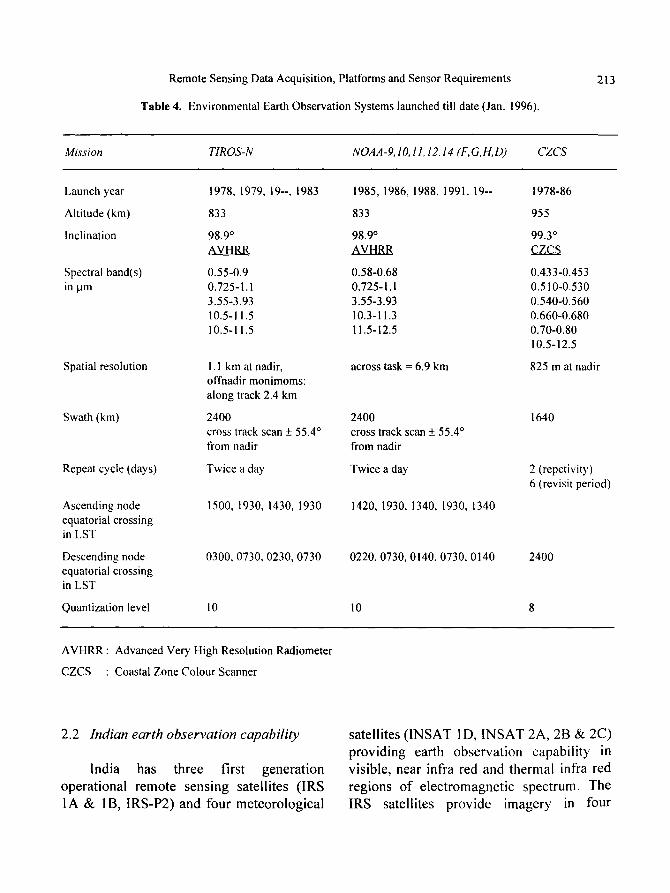
ERS-I have also been widely used for resources applications. Some of the details o f these missions are listed in Table 4.
Table I. Earth Observation Systems (VNIR, SWIR, TIR) launched till date (Jan. 1996).
Mission LANDSAT l&2 L,4NDSAT-3 L,4NDS,4T-4/5 SPOT-~/SPOT-2/ MOS-/a/ JERS-/
SPO T-3 ,~ lOS- I b
Launch Year
Altitude (loll)
Inclination
Spectral band(s) _ _ in ~tm
Spatial resolution
1972,1975 1978 1982,1984 1986,1990,1993 1987.1990 1992
919 919 705 830 908.7 568
99. I ~ 99,1 ~ 98.2 ~ 98.7 ~ 98 ~
RBV RBV MSS 5 Panchromatic MESSR B1:0.475-0.575 0,505-0.75 T M 0.45-0.52 0.51-0.73 B1:0.51-0.59 B2:0.580-0,680 0.52-0.60 Multispectral (XS) B2:0.61-0.69 B3:0.698-0.830 0.63-0.69 0.50-0.59 B3:0.72-0.80 Multispectral Multispectral 0.76-0.90 0.61-0.68 B4:0.8-I, 1 Scanner (MSS4): Scanner (MSS5): 1.55-1.75 0.79-0.89 VTIR tt4:0.5-0.6 MSS4 + 10.4-12.5 B 1:0.5-0.7 [35:0.6-0.7 B8:10.4-12.6 2.08-2.35 [32:6.0-7.0 B6:0.7-0.8 B3:10.5-11.5 B7:0.8-1,1 B4:I 1.5-12.5
MSR
MSS4:79m MSSI:79m TM 30m 10m in PAN MESSR:SOM MSS (B8):240m 120m tbr B6 20m ill XS VTIR-BI:900m RBV:30m VTIR-B2,3,4:
2700m
Swath (km) 185 185 185 117
Repeat cycle (days)
Equatorial crossing in LST
Quantization level (bits)
18 18 16
9:30 am 9:30 am 9:45 am
6 6 8
26 5 (with steering)
10:30 am
PAN-6/8 XS-8
MESSR-100 VTIR- 1500
5-6*
" n o n -
sI .Ulsynchronous '~
Optical Sellsor 0.52-0.60 0.63-0.69 0.76-0.86 0.76-0.86 (stereo) 1.60-1.71 2.01-2.12 2.13-2.25 2.27-2.40
18.3• (R•
75
44
LST : Local Solar Time XS : Multispectral RBV : Return Beam Videon (RBV)
* : not an integral multiple of day
212 �9 R.R. Navalgund et al.
Table 2. Synthetic Aperture Radar (SAR) Missions launched till date (Jan. 1996).
Seasat SIR-A Shuttle/ SIR-B SIR-C ERS- 1 JERS- 1 Radarsat Space Lab ERS-2
Year of launch 1978 1981 1983 1984 1994 1991 1992 1995 1995 1995
Altitude (km) 794 252 250 250 250 785 568 793-82 I
Inclination 98.5 ~ 38 ~ 57 ~ 57 ~ 57 ~ 98.5 ~ 98 ~ 98.6 ~
Band L L X L CLX C L C
Frequency (GHz) 1.275 1.275 9.4 1.275 5.289, 5.3 1.275 5.3
1.239, 9.602
Wavelength (cm) 23.5 23.5 31.7 23.5 5.8, 23.5 5.6 23.5 5.6 31
Nominal 25 40 25 15-50 10-200 26 • 28 18 x 18 9 • 9 to Resolution (m) I00 x 100
Incidence Angle 20 ~ 47 ~ 31-54 ~ 15-60 ~ 17-60 ~ 23 ~ 35 ~ 10-50 ~
Polarisation HH HH HH HH HH,VV VV HH HH HV,VH
Swath Width (km) 100 50 8.5 20-50 15-90 100 75 45/510
Repeat Cycle (days) 17 . . . . 3/35/168 44 27/7/17
Table 3. Satellite altimeter missions flown till date (Jan. 1996).
Skylab GEOS-3 Seasat Geosat ERS- I TOPEX/ ERS-2 POSEIDON
Launch Year November 1973 April 1975 June 1978 March 1985 July 1991 August 1992
Mean altitude (km) 435 845 800 800 780 1335
Orbit inclination 50 ~ I 15 ~ 108 ~ 98 ~ 63 ~
Repeat cycle - - (17)/3 -/17 (3)/35/168 10
Frequency (GHz) 13.9 13.9 13.5 13.5 13.8 5.3/13.6
Precision (cm) < 100 30 7 5 8 2/4
*Source: Wakker et aL, 1988
Remote Sensing Data Acquisition, Platforms and Sensor Requirements
Table 4. Environmental Earth Observation Systems launched till date (Jan. 1996).
213
Mission TIROS-N NOAA-9,io, I I, I2,14 (F,G,H,D) CZCS
Launch year 1978, 1979, 19--, 1983 1985, 1986, 1988, 1991. 19-- 1978-86
Altitude (km) 833 833 955
Inclination 98.9 ~ 98.9 ~ 99.3 ~ AVHRR AVHRR CZCS
Spectral band(s) 0.55-0.9 0.58-0.68 0.433-0.453 in ~m 0.725-1.1 0.725-1.1 0.510-0.530
3.55-3.93 3.55-3.93 0.540-0.560 10.5-11.5 10.3-11.3 0.660-0.680 10.5-11.5 I i.5-12.5 0.70-0.80
10.5-12.5
Spatial resolution 1. I km at nadir, across task = 6.9 km 825 m at nadir offnadir monimoms: along track 2.4 km
Swath (km) 2400 2400 1640 cross track scan + 55.4 ~ cross track scan + 55.4 ~ from nadir from nadir
Repeat cycle (days) Twice a day Twice a day 2 (repetivity) 6 (revisit period)
Ascending node equatorial crossing in LST
Descending node equatorial crossing in LST
1500, t930,1430,1930
0300,0730,0230,0730
1420,1930,1340,1930,1340
0220,0730,0140,0730,0140 2400
Quantization level I 0 I 0 8
AVHRR : Advanced Very, High Resolution Radiometer
CZCS " Coastal Zone Colour Scanner
2.2 Indian earth observation capability
India has three first genera t ion
operat ional remote sens ing satellites ( IRS
I A & IB, IRS-P2) and four meteoro log ica l
satellites ( I N S A T 1D, I N S A T 2A, 2B & 2C)
provid ing earth observa t ion capabi l i ty in
visible, near infra red and thermal infra red
regions o f e l ec t romagne t i c spectrum. The
IRS satellites p rov ide imagery in four
214 R.R. Navalgund et al.
spectral bands (BI 0.45-0.52, 132 0.52-0.59, B3 0.62-0.68 and B4 0.77-0.86 microns) with a ground resolution of 36 metres using LISS-2 cameras and 72 metres using LISS-1 cameras covering a swath of 140 kiiometres across track at a repetivity of 22 days. The satellite provides imagery over the Indian sub-continent and the United States of America using the data reception facilities at the National Remote Sensing Agency (NRSA), Hyderabad and Norman- Oklahoma, U.S.A. The data received at NRSA is marketed by NRSA Data Centre, while the same at Norman is being marketed by EOSAT company. IRS-P2 was launched by one of India's launcher, the Polar Satellite Launch Vehicle (PSLV), on October 15, 1994. This satellite provides earth observation capability in the same four spectral bands as in IRS 1A and IB with a spatial resolution of about 37 metres covering a swath of 140 kilometres across track
The INSAT VHRR instrument provides visible and thermal infra red imageries of the earth disc with a spatial resolution of 2 kilometres for visible (0.55- 0.75 micron) and 8 kilometres for thermal infra red (10.5-12.5 micron) wavelengths from INSAT 2A @ 74 degree E, INSAT 2B @ 93 degree E and INSAT 1D @ 83 degree E. The earth observation can be carried out in three different modes namely full scan mode (this mode covers full earth disc and takes 33 minutes for providing one image), normal scan mode (this mode covers 50 degree north to 40 degree south and takes 23 minutes to provide one image) and sector scan mode (this mode covers approximately one fourth of the earth disc in the north- south direction and takes about 7.2 minutes
to provide one image. It enables quick coverage of any specific region and enables tracking of cyclones etc.). The data reception facilities exist at MCF (Master Control Facility), Hassan, Space Applications Centre, Ahmedabad and India Meteorological Department (IMD), New Delhi. IMD has the responsibility of data dissemination.
India has launched its second generation operational satellite of IRS series namely IRS IC on December 28, 1995. This satellite provides a significant improvement in earth observation capability as it provides three tier imaging capability. It has a high resolution stereo imaging capability through a single band Panchromatic (0.5-0.75 micrometre) camera. LISS-3 a muitispectral sensor (B2, B3, B4 bands: 23m resolution and B5 SWIR band 70.5m resolution) and a wide field sensor operating in red and near infra red bands (B3, B4) providing 188m resolution and 5-day repetivity are the other two sensors. The data from this satellite is being received at NRSA ground station at Shadnagar near Hyderabad, EOSAT Norman U.S.A. and is also expected to be received at other international ground stations.
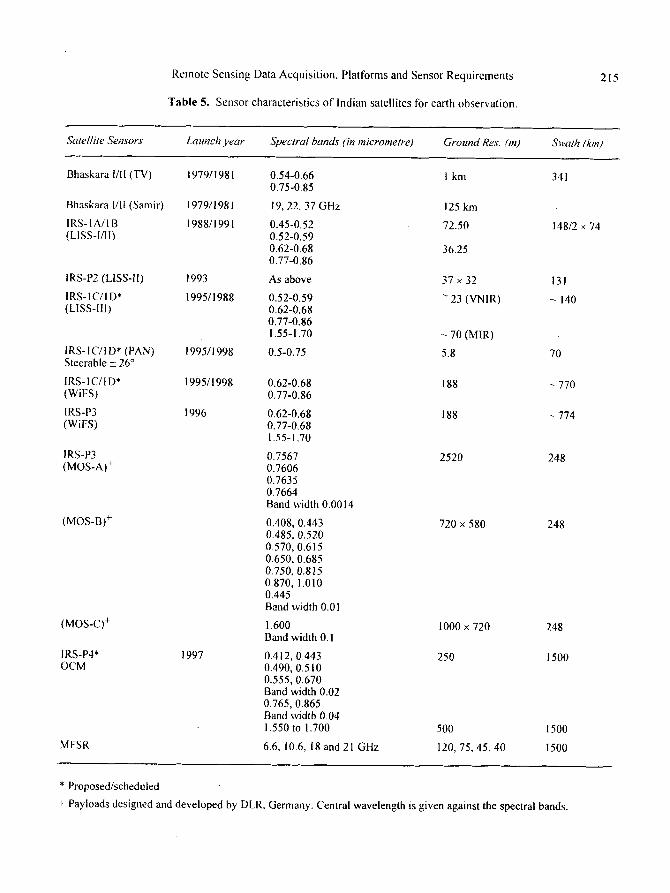
On March 21, 1996, India launched IRS P3 satellite from its own PSLV launcher (PSLV-D3 flight). This satellite carries wide field sensor covering B5 band in addition to B3 and B4 bands available in the WiFS of IRS IC satellite. This satellite also carries MOS (Multispectral Opto- electronic Scanner) payloads built by DLR Germany, which caters to ocean and atmospheric studies. Table 5 summarizes the sensor characteristics of Indian Earth Observation systems.
Remote Sensing Data Acquisition, Platforms and Sensor Requirements
Table 5. Sensor characteristics of Indian satellites for earth observation.
215
Satellite Sensors Launch year Spectral bands (in micrometre) Ground Res. (m) Swath (kin)
Bhaskara I/It (TV)
Bhaskara [/11 (Samir)
IRS-IA/I B (LISS-I/II)
IRS-P2 (LISS-II)
IRS-IC/ID* (L1SS-II1)
IRS- I C/t D* (PAN) Steerable _+ 26 ~
IRS-IC/ID* (WiFS)
IRS-P3 (WiZS)
IRS-P3 (MOS-A) +
(MOS-B) +
(MOS-C) +
IRS-P4* OCM
MFSR
1979/1981 0.54-0.66 I km 0.75-0.85
1979/1981 19, 22, 37GHz 125 km
1988/1991 0.45-0.52 72.50 0.52-0.59 0.62-0.68 36.25 0.77-0.86
1993 As above 37 x 32
1995/1988 0.52-0.59 ~ 23 (VNIR) 0.62-0.68 0.77-0.86 1.55-1.70 ~ 70 (MIR)
1995/1998 0.5-0.75 5.8
1995/1998 0.62-0.68 188 0.77-0.86
1996 0.62-0.68 188 0.77-0.68 1.55-1.70
0.7567 0.7606 0.7635 0.7664 Band width 0.0014
0.408, 0.443 0.485, 0,520 0.570,0.615 0.650,0.685 0.750, 0.815 0.870,1.010 0.445 Band width 0.01
1.600 Bandwidth 0.1
1997 0.412, 0.443 0.490, 0.510 0.555, 0.670 Band width 0.02 0.765,0.865 Band width 0.04 1.550 to 1.700
6.6, 10.6, 18 and21GHz
341
148/2 • 74
131
140
70
770
774
2520 248
720 • 580 248
1000 • 720 248
250 1500
500 1500
120,75,45,40 1500
* Proposed/scheduled
+ Payloads designed and developed by DLR, Germany. Central wavelength is given against the spectral bands.
216 R.R. Navalgund et al.
3. Thrust Areas in Applications
Various application projects have been carried out using the present national as well as international earth observation systems. Yet, in the Indian context following areas are likely to receive more attention in immediate future:
�9 Management of natural resources to ensure sustainable increase in agri- cultural production.
�9 Study the state of the environment, its monitoring and assessment of the impact of developmental actions.
�9 Updating and generation of large scale topographical maps.
�9 Exploration of marine and mineral resources.
�9 Operational meteorology and moni- toring of land and oceanic processes to predict climatic changes.
3.1 Management of natural resources to ensure sustainable increase in agricultural production
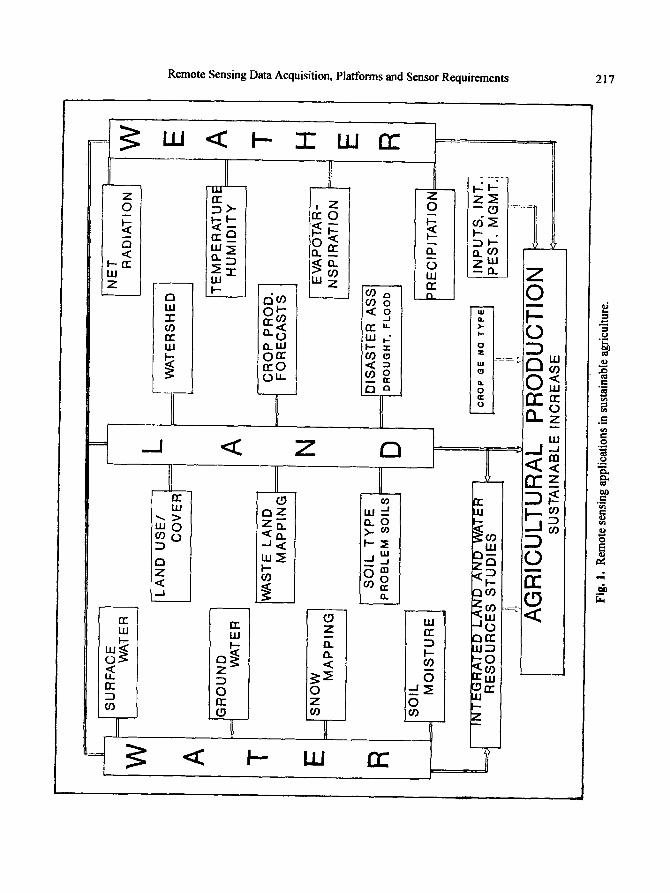
The world population is increasing at an alarming rate and is expected to reach a figure of 11.2 billion around the year 2100 before stabilizing around 11.6 billion beyond 2100. Meeting the needs of food, fiber and shelter of this growing population is a major concern. On a finite earth, population cannot grow indefinitely and it is important to recognize that today's developmental prospects should not deprive the future generation its legitimate needs. As food is the most critical requirement of a human being, agricultural sustainability
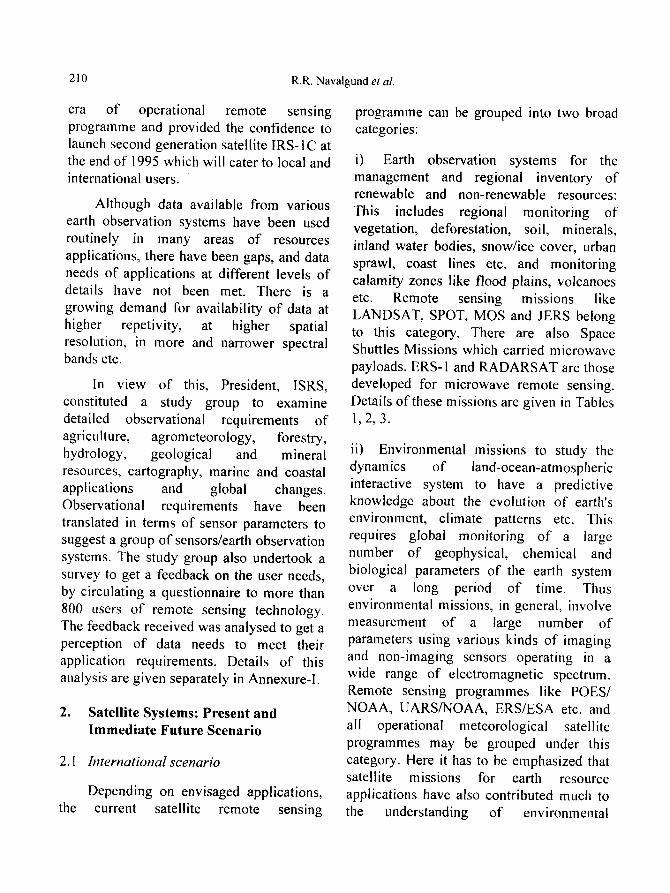
assumes the topmost priority in sustainable development. Fig. 1 shows different aspects involved in achieving a sustainable increase in agricultural production (Navalgund, 1991). Increase in production is possible by bringing more areas under cultivation, improving crop yields, increasing cropping intensities and through integrated nutrient and pest management. Sustainable agricultural production would call for identification of problems and optimal land- use planning at watershed level, and adoption of proper soil and water conservation measures. Watershed characterization requires information on parameters like size, shape, topography, drainage, soils, landuse, landcover, climate and socio-economic data. Each of the applications mentioned above require different observational requirements which are summarized in the next section.
3.2 Study the state of the environment, its monitoring and assessment o f the impact of development actions
Environmental impact may be defined as any alteration of environmental conditions or creations of a new set of environmental conditions, adverse or beneficial, caused or induced by the action or set of actions under consideration. Development programs have been and continue to be conceived, planned and executed, often causing detrimental effect on the environment. The rapid industrialization, urbanization and commer- cialization are responsible for increasing amounts of CO 2 and other green house gases, air pollution and water and degrading lands. Deforestation trends have caused
ii w4
A
SU
R~C
E
WAT
ER
T
GR
OU
ND
W
ATER
E H
SN
O w
MA
PP
ING
R
FLAN
D U
SE
/ C
OV
EF
WAS
TE L
AND
M
APPI
NE
SO
IL T
YP
E
PRO
BLEM
SO
ILS
t SOIL
M
IS
TUR
E
==~
INTE
GR
ATED
LAN
D A
ND
-WAT
ER
RES
OU
RC
ES
STU
DIE
S
N
"ER
SHED
ET RAD
IATI
ON
TEM
PE
RA
TUR
E~.
�9
HU
MID
ITY
[
)P P
RO
D.
~EC
ASTS
EVAP
OTA
R-
NSP
IRAT
ION
~TER
ASS
I I
"HT'
FLO
OD
I I
I
t R
ECIP
ITAT
ION
j-----
-I
l o.o
.o..o
.Y..l
,N
POTS
,NT!
5|
i! PE
ST.
MG
MT.
I j!
;i
AGRI
CULT
URAL
PR
ODUC
TION
1
SUST
AIN
ABLE
IN
CR
EASE
E A
H
E I
R
Fig.
1.
Rem
ote
sens
ing
appl
icat
ions
in
sust
aina
ble
agric
ultu
re.
0 8"
r~
s > .= ,-o
E.
B
'4
218 R.R. Navalgund et al.
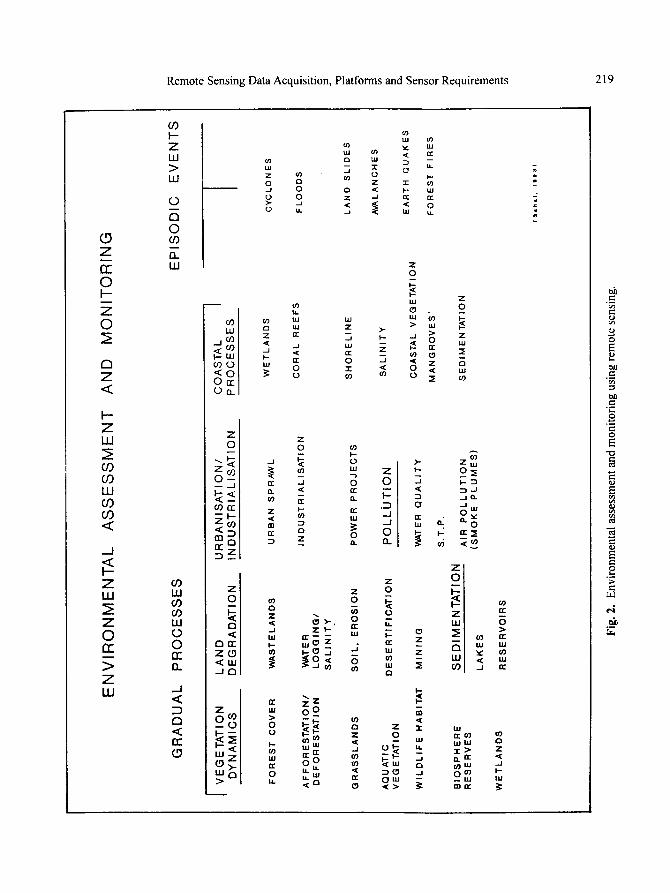
serious effects on global climate, soil erosion, water resources and food production. River valley projects, thermal power generation, mining, tourism etc. cause extensive damage to our ecosystem. Impact analysis and assessment needs to be done to minimize adverse effects. The choice of impacts to be considered in performing an environmental impact analysis generally varies according to the type of project, development or action under evaluation. There are numerous bio-physical and socio-economic parameters which need to be measured before a project is cleared from environment angle and which need to be monitored after commissioning of the project. Various applications which need to be considered are given in Figure 2 (Sahai, 1993).
3.3 Updating and generation of large scale topographical maps
The need for high quality topographic data have long been realized in various fields. In addition to the problem of producing good topographic maps at 1:25000 scale, there is a need for updating the existing information on Survey of India maps. Detection of changes in cultural features such as buildings and communi- cation links are yet to be achieved. Any topographic map consists information on content, position and elevation. In case of undulating regions, the tilted view of sensors leads to significant distortions in geometry due to terrain relief. In order to rectify these distortions, Digital Elevation Models (DEM) of the terrain need to be used to generate orthoimages. Hence, it will be desirable to derive thematic information
and digital elevation models using spaceborne data.
3.4 Exploration of marine and mineral resources
India has a long coastline of about 7500 km including its island territories. Exploitation of its marine resources including living and non-living resources is a dire necessity to meet the food and fuel demands of the increasing population. Fisheries, aquaculture, seaweed harvesting, petroleum exploration etc. are some of the fields which are being explored. An understanding of photosynthetic processes (primary production) is required to assess the marine biological resources of the globe, including pelagic and demersal fisheries, shellfish and even organic sedimentary deposits. Determining accurately the concentrations of photosynthetic pigments and the rates of photosynthetic carbon fixation in the surface euphotic layer lead to improved estimates of primary production in the ocean. Global information on geographical and seasonal variations in primary production will allow a more complete assessment of secondary production processes in the oceans.
Unlike other surface phenomena, mineral resources are generally sub- surfacial in nature. Occurrences of petroleum/mineral deposits are never haphazard. All the mineral/petroleum deposits follow certain mineralisation/ structural patterns with various surfaciai indicators/guides which help in their identification. Although many such guides exist in the conventional geological/
EN
VIR
ON
ME
NT
AL
A
SS
ES
SM
EN
T
AN
D
MO
NIT
OR
ING
GR
AD
UA
L
VE
GE
TA
TIO
N
DY
NA
MIC
S
PR
OC
ES
SE
S
LA
ND
U
RB
AN
ISA
TIO
N/
CO
AS
TAL
DE
GR
AD
AT
ION
IN
DU
ST
RIA
LIS
AT
ION
P
RO
CE
SS
ES
FO
RE
ST
C
OV
ER
AF
FO
RE
ST
AT
ION
/ D
EF
OR
ES
TA
TIO
N
GR
AS
SL
AN
DS
AQ
UA
TIC
V
EG
ET
AT
ION
WIL
DL
IFE
H
AB
ITA
T
BIO
SP
HE
RE
R
ES
ER
VE
S
WE
TL
AN
DS
WA
ST
EL
AN
DS
U
RB
AN
S
PR
AW
L
WE
TL
AN
DS
WA
TE
R
IND
US
TR
IAL
ISA
TIO
N
CO
RA
L
RE
EF
S
LO
GG
ING
/ S
AL
INIT
Y
SO
IL,
ER
OS
ION
P
OW
ER
P
RO
JE
CT
S
SH
OR
EL
INE
DE
SE
RT
IFIC
AT
ION
P
OL
LU
TIO
N
SA
LIN
ITY
MIN
ING
W
ATE
R
QU
AL
ITY
C
OA
ST
AL
VE
GE
TA
TIO
N
MA
NG
RO
VE
S"
S.T
.P.
SE
DIM
EN
TA
TIO
N
AIR
P
OL
LU
TIO
N
SE
DIM
EN
TA
TIO
N
(SM
OK
E
PL
UM
ES
) L
AK
ES
RE
SE
RV
OIR
S
EP
ISO
DIC
E
VE
NT
S
I C
YC
LO
NE
S
FL
OO
DS
LA
ND
S
LID
ES
AV
AL
AN
CH
ES
EA
RT
H
QU
AK
ES
FO
RE
ST
F
IRE
S
(SeP
al.
1003
)
7o
O
tj~
t~
>
c-
O
"-I 7o
e~
t-
-i 3 t~
Fig
. 2.
E
nvir
onm
enta
l ass
essm
ent
and
mon
itor
ing
usin
g re
mot
e se
nsin
g.
220 R.R. Navalgund et al.
geophysical method of prospecting, all of them cannot be followed in toto through airborne/space-borne remote sensing. Main limitation in usage of remote sensing for mineral/petroleum exploration is due to the fact that the mineral deposits are often relatively small targets located at considerable depths. The petroleum basins are in general highly deep-seated with limited surfaciai expressions. These limitations restrict the usage of remote sensing only to reconnaissance level, providing input to further detailed ground- based geological/geophysical investigations.
3.5 Operational meteorology and monitoring of land and oceanic processes to predict climate changes
Operational meteorology is concerned with forecasting the weather over all geographical scales and for the periods upto a week or even a month. A number of measurements are required on a regular basis for operational meteorology. Temperature and humidity profiles, wind fields, cloud cover and temperature, cloud heights, liquid water content, precipitation, ocean topography etc. are some of the parameters that need to be measured not only for operational meteorology but also for climate monitoring and predictions.
Climatic changes are affected by biological and geophysical processes. Oceans, forests and human activities, over the year have control over global climate. Earth's environment is the cumulative result of various biogeochemical interactions within the land-ocean-atmospheric system as well as energy-mass transfer between the
earth and planetary space. A predictive knowledge about the environment require elaborate observation capabilities with adequate temporal and spatial resolution so that regional and global variations in geophysical, chemical and biological state of the earth system can be monitored. Various phenomena which influence the environment and thus have to be monitored include:
- Energy, mass exchange between space and earth
- Energy, momentum and mass exchange between earth and atmosphere
- Biological activities on land and near surface water
- Atmospheric chemistry and atmos- pheric dynamics
- Precipitation, lightening etc.
- Ocean dynamics, sea surface temp- erature etc.
- Sea ice dynamics
- Surface geology, tectonic plate motion, tides, geologic faults etc.
4. A p p l i c a t i o n g o a l s a n d O b s e r v a t i o n
r e q u i r e m e n t s
As a thrust area would consist of many themes which are to be addressed in a multi- disciplinary manner, all the thrust areas have been examined on the basis of major application themes. Theme-wise require- ments in terms of objectives, the parameters to be measured and the sensor specifications required for these studies are given in this section.
Remote Sensing Data Acquisition, Platforms and Sensor Requirements 221
4.1 Agriculture, Landuse, Soils
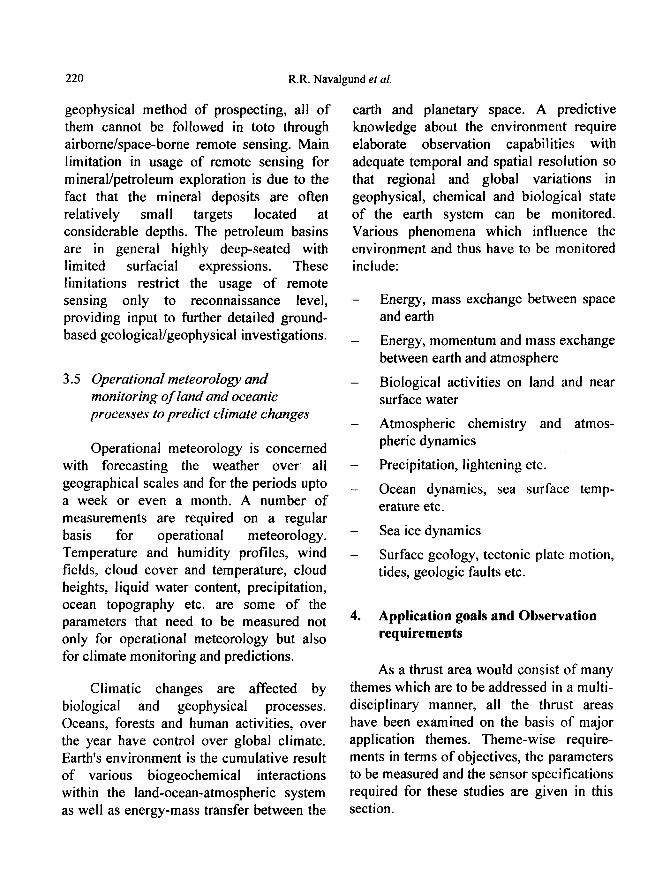
At present, remote sensing is operationally used for acreage estimation of crops in single crop dominated regions. Remote sensing based yield relationships have been shown to be useful for crop yield predictions in some areas. However, crop production forecasting is yet to be established for areas with multiple cropping patterns. Fragmented holdings, different crop calendars and different management practices adopted by farmers continue to pose a challenge to remote sensing. A sample study ill Gujarat suggests that the field size varies from 0.047 to 4.14 ha with a mean area of 0.61 ha where 50 per cent of the fields have areas greater than 0.4 ha (Sahai et al., 1988). Identification of crop varieties, field level monitoring of crops at different growth stages, early warning of disease, early detection of stress for irrigation management and estimation of soil moisture with accuracies greater than 95% are some of the major problems which need to be studied using RS techniques. Table 6 shows the needs and sensor requirements to meet some of these objectives. A three-tier sensor system would be required to fulfill the observation needs at regional level, district level and field level. For crop monitoring a spatial resolution of 150-300m with a high repetivity (2 days) would be sufficient but for detection of disease/pest attack and yield forecasting, it will be desirable to image at moderate resolutions of 20-40m and a repetivity of 4-6 days while in regions of small field sizes and mixed cropping, crop identification will require a high resolution data of 5-10m. In general, a spectral bandwidth of 60-80 nm is required in VIS &
NIR, MIR & TIR bands but disease and stress detection will require specific narrow spectral bands of few nm bandwidth (Table 7). Use of microwave data is envisaged particularly during kharif season when optical data availability is reduced. Two incidence angles or two polarizations may be used to get extra dimensions in the data which may compensate for the lack of multi spectral dimension here.
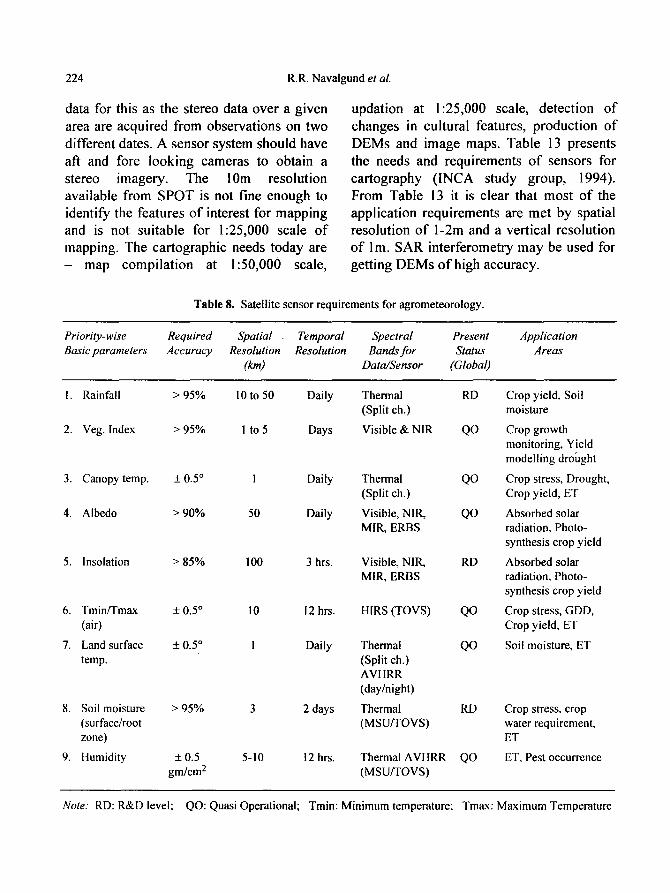
Agrometeorological parameters are important inputs for studying crop growth processes and crop yield modelling. As of now, parameters such as soil moisture and albedo have been attempted to some extent. However, validation of agromet spectral yield models would require many other parameters such as rain fall, insolation, land surface temperature etc. to be measured at higher accuracies. Table 8 shows the agrometeorological requirements of satellite sensors.
Remote sensing data have contributed greatly to landuse mapping, monitoring and planning by providing landcover information. Regional perspective planning requires mapping at scale of 1:250,000, while detailed planning requires mapping at 1:50,000 scale. However, implementation of these plans requires mapping at much larger scale e.g. 1:10,000 for indicating the field ownership limits. Table 9 gives the sensor requirements for agriculture landuse and soils. Very high spatial resolution with increased spectral resolutions will be desirable for discriminating more cover types.
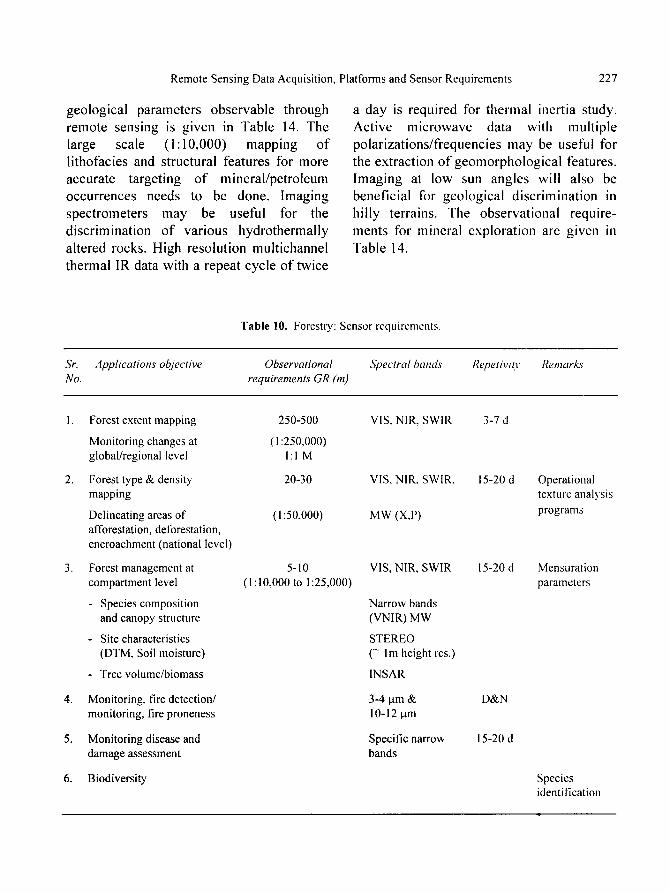
4.2 Forestry
Space-borne data have proved useful
222 R.R. Navalgund et al.
for forest mapping, inventory and monitoring. Discrimination between closed and open forests and wooded shrub land is possible in many cases. Also, coniferous and deciduous forests can be distinguished from satellite data. Distribution of forest types and information on stand characteristics mainly related to timber volume and growth is required for estimating production potential. Forest management would require information on species composition and canopy structure, site characteristics such as terrain and soil moisture and stresses in forest due to
disease, insect infestation etc. High spatial resolution of few metres and imaging in narrow spectral bands (Table 10) is required to meet these objectives. Stereo images would help in determining stand characteristics based on tree heights. Bio- diversity studies would require species identification which is possible only through high resolution data. Fire is the major single factor o f vegetation transformation in the tropical areas. Detection and monitoring of fires and identifying fire prone areas would require thermal infrared images during day and night time.
Table 6. Agricultural Applications: Crop Production Forecasting.
S.No. Application objective Required physical quantities Issues
i.1 Crop VIS, NIR, MIR at 20-40m, 4-6 days - identification different growth stages 5-10m, 8-12 days
1.2
1.3
1.4
Monitoring crop health on regional scale
Crop yield forecasting
Disease, Pest attack, Nutrient stress
Backscattered MW intensities
Polarised Radiance
VIS, NIR and MIR, Thermal indices, Red edge (position of the inflection point) and Red slope (670-760nm)
VIS, NIR, MIR and TIR data at different growth stages in absolute units - Narrow bands, Red edge
Data at different sun/ view angles
Back scattered MW intcnsities
Specific narrow bands
20-40m, X, Ku bands Two incidence angles/polarisations (plant morphology)
150-300m, 2 days
20-40m, 4-6 days
C, X, Ku
20-40m, 4-6 days Idb
20-40m
Infrequent repetivity Lack of data during l~harif Small field size Operational processing techniques (Multidate, Sensor, Texture)
Stress manifests through TIR indices earlier
Infrequent repetivity - In absolute units
(multi sensors) - Lack of validated Agromet
spectral yield models - Agromet parameters such as
soil moisture, ET, albedo, insolation
Post-event assessment only
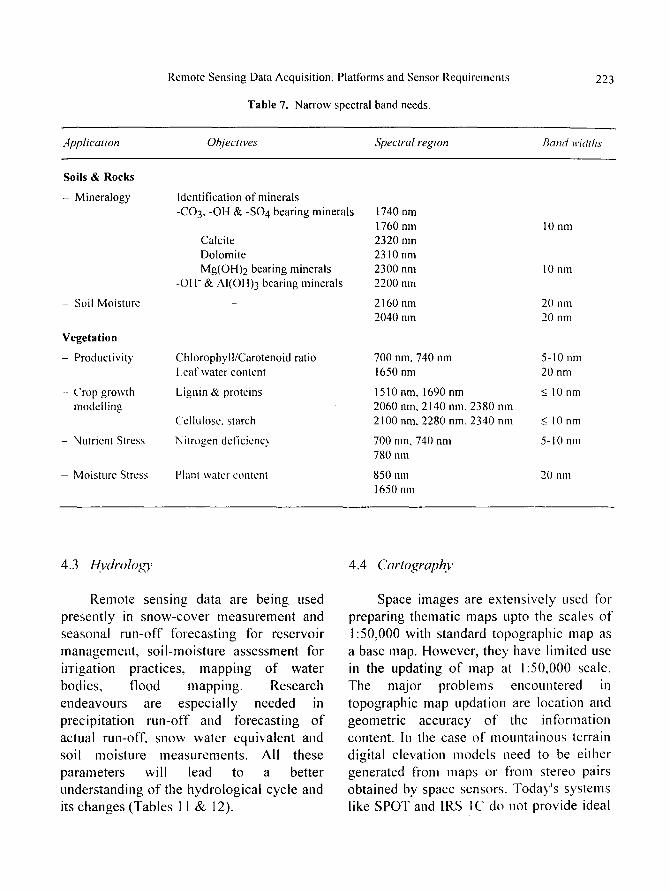
Remote Sensing Data Acquisition, Platforms and Sensor Requirements
Table 7. Narrow spectral band needs.
223
Application Objectives Spectral region Band widths
Soi ls & R o c k s
- Mineralogy
- Soil Moisture
V e g e t a t i o n
- Productivity
- Crop growth modelling
- Nutrient Stress
- Moisture Stress
Identification of minerals -CO 3, -OH & -SO 4 bearing minerals
Calcite Dolomite Mg(OH)2 bearing minerals
-OH- & AI(OH)3 bearing minerals
Chlorophyll/Carotenoid ratio l.eaf water content
Lignin & proteins
Cellulose. starch
Nitrogen deficiency
Phmt water content
1740 nm 1760 nm 10 nm 2320 nm 2310nm 2300 nm 10 nm 2200 nm
2160 nm 20 nm 2040 nm 20 nm
700 nm, 740 nm 5-1011111 1650 nm 20 nm
1510 nm, 1690 nm _< 10 nm 2060 nm, 2140 ran, 2380 nm 2100 nm, 228(I nm. 2340 nm <_ 10 nm
700 nm, 740 nm 5-10 nm 780 mn
850 nm 20 nm 1650 nm
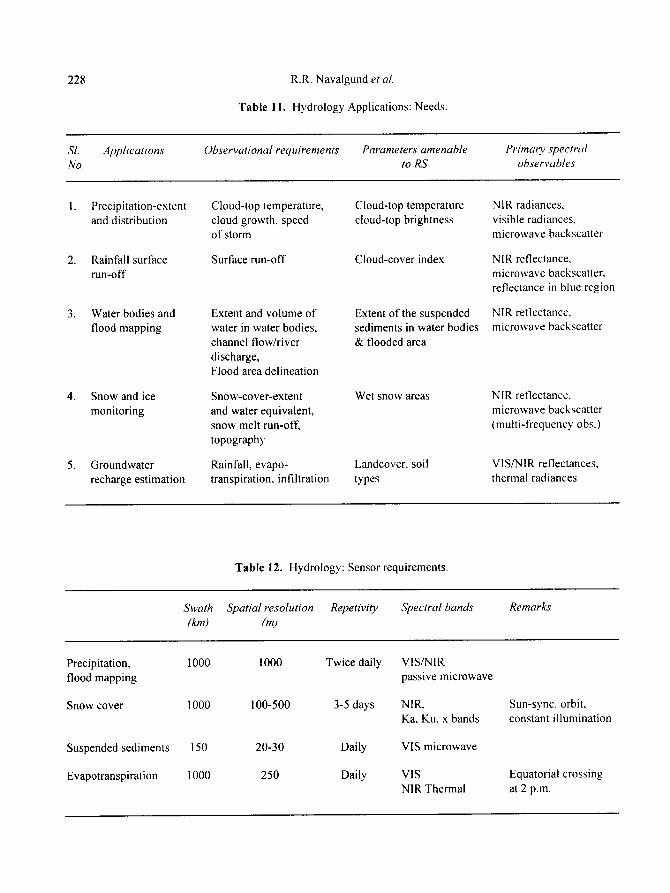
4.3 Hydrology
Remote sensing data are being used
present ly in s n o w - c o v e r m e a s u r e m e n t and
seasonal run -o f f fo recas t ing for reservoir
managemen t , so i l -mois ture assessment for
irrigation practices, m a p p i n g o f water
bodies, f lood mapping . Research
endeavours are espec ia l ly needed in
precipi tat ion r t tn-off and forecas t ing o f
actual run-off , snow water equivalent and
soil mois ture measurements . All these
parameters will lead to a better
t tnderstanding o f the hydro log ica l cyc le and
its changes (Tables 1 1 & 12).
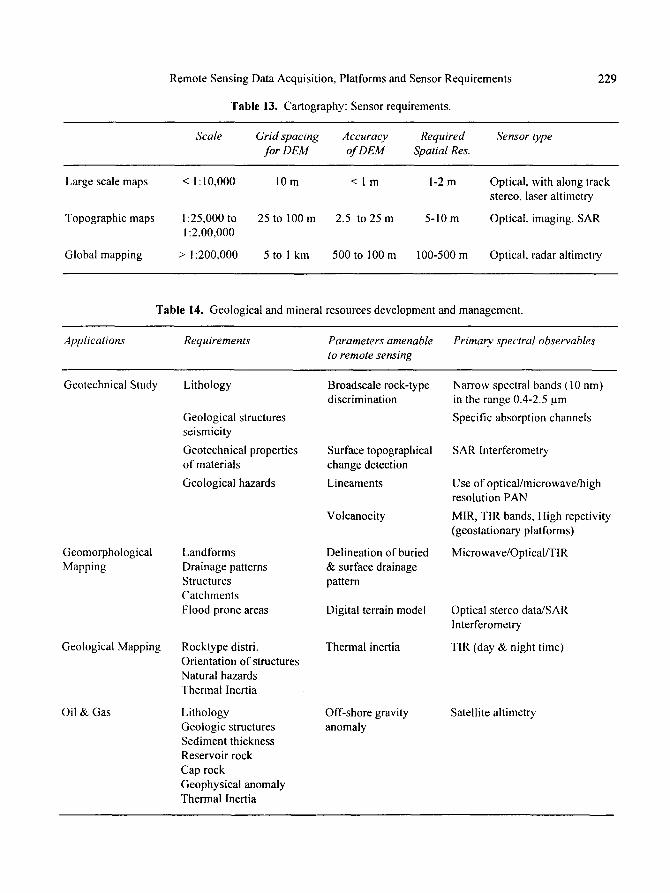
4.4 Cartography
Space images are ex tens ive ly used for
prepar ing themat ic maps upto the scales o f
1:50,000 with s tandard topograph ic map as
a base map. However , t hey have limited use
in the updat ing o f map at 1:50,000 scale.
The major p rob lems encountered in
topograph ic map updat ion are locat ion and
geometr ic accu racy o f the informat ion
content . In the case o f moun ta inous terrain
digital elevation mode l s need to be either generated fiont maps or fi 'om stereo pairs
obtained by space sensors. Today ' s sys tems
like S P O T and IRS IC do not provide ideal
224 R.R. Navalgund et al.
data for this as the stereo data over a given area are acquired from observations on two
different dates. A sensor system should have aft and fore looking cameras to obtain a stereo imagery. The 10m resolution available from SPOT is not fine enough to identify the features o f interest for mapping and is not suitable for 1:25,000 scale o f mapping. The cartographic needs today are - map compilat ion at 1:50,000 scale,
updation at 1:25,000 scale, detection o f changes in cultural features, production o f DEMs and image maps. Table 13 presents the needs and requirements o f sensors for car tography (INCA study group, 1994). From Table 13 it is clear that most o f the application requirements are met by spatial resolution o f l -2m and a vertical resolution o f l m. SAR interferometry may be used for getting DEMs o f high accuracy.
T a b l e 8. Satellite sensor requirements for agrometeorology.
Priority-wise Required Spatial Temporal Spectral Present Application Basic parameters Accuracy Resolution Resolution Bands for Status Areas
(kin) Data~Sensor (Global)
1. Rainfall > 95% 10 to 50 Daily Thermal RD Crop yield, Soil (Split oh.) moisture
2. Veg. Index > 95% 1 to 5 Days Visible & NIR QO Crop growth monitoring, Yield modelling drought
3. Canopy temp. + 0.5 ~ 1 Daily Thermal QO Crop stress, Drought, (Split ch.) Crop yield, ET
4. Albedo > 90% 50 Daily Visible, NIR, QO Absorbed solar MIR, ERBS radiation, Photo-
synthesis crop yield
5. Insolation > 85% 100 3 h r s . Visible, NIR, RD Absorbed solar MIR, ERBS radiation. Photo-
synthesis crop yield
6. Tmin/Tmax + 0.5 ~ 10 12 hrs. HIRS (TOVS) QO Crop stress, GDD, (air) Crop yield, ET
7. Land surface + 0.5 ~ I Daily Thermal QO Soil moisture, ET temp. (Split ch.)
AVHRR (day/night)
8. Soil moisture > 95% 3 2 days Thermal RD Crop stress, crop (surface/root (MSU/TOVS) water requirement, zone) ET
9. Humidity + 0.5 5-10 12 hrs , Thermal AVHRR QO ET, Pest occurrence gm/cm 2 (MSU/TOVS)
Note: RD: R&D level; QO: Quasi Operational; Tmin: Minimum temperature; Tmmx: Maximum Temperature
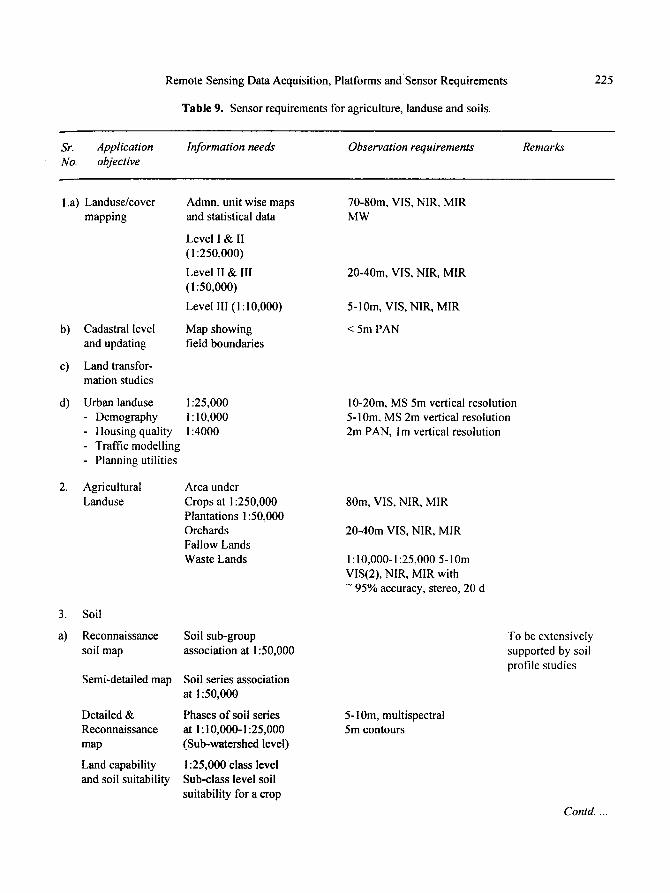
Remote Sensing Data Acquisition, Platforms andSensor Requirements
Table 9. Sensor requirements for agriculture, landuse and soils.
225
Sr. Application No. objective
Information needs Observation requirements Remarks
l.a) Landuse/cover mapping
b) Cadastral level and updating
c) Land transfor- mation studies
d) Urban landuse - Demography - Housing quality - Traffic modelling
Planning utilities
2. Agricultural Landuse
3. Soil
a) Reconnaissance soil map
Semi-detailed map
Detailed & Reconnaissance map
Land capability and soil suitability
Admn. unit wise maps and statistical data
Level I & II (I :250,000)
Level II & III (1:50,000)
Level III (! : I 0,000)
Map showing field boundaries
1:25,000 I : I 0,000 1:4000
Area under Crops at 1:250,000 Plantations ! :50,000 Orchards Fallow Lands Waste Lands
Soil sub-group association at 1:50,000
Soil series association at 1:50,000
Phases of soil series at 1:10,000- ! :25,000 (Sub-watershed level)
1 : 2 5 , 0 0 0 class level Sub-class level soil suitability for a crop
70-80m, VIS, NIR, MIR MW
20-40m, VIS, NIR, MIR
5-10m, VIS, NIR, MIR
< 5m PAN
10-20m, MS 5m vertical resolution 5-10m, MS 2m vertical resolution 2m PAN, i m vertical resolution
80m, VIS, NIR, MIR
20-40m VIS, NIR, MIR
I : I 0,000- 1:25,000 5-10m VIS(2), NIR, MIR with
95% accuracy, stereo, 20 d
5-10m, multispectral 5m contours
To be extensively supported by soil profile studies
Contd....
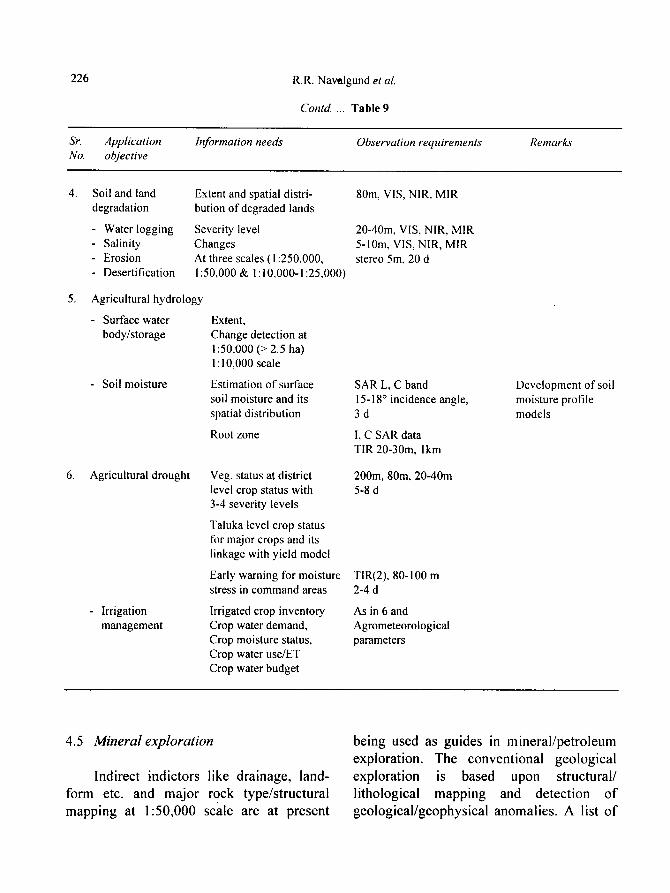
226 R.R. Navalgund et al.
Contd ... Table 9
Sr. Application Information needs Observation requirements Remarks No. objective
4. Soil and land Extent and spatial distri- 80m, VIS, NIR, MIR degradation bution of degraded lands
Water logging Severity level 20-40m, VIS, NIR, MIR - Salinity Changes 5-10m, VIS, NIR, MIR - Erosion At three scales (1:250,000, stereo 5m, 20 d ~ Desertification l:50,000& 1:10,000-1:25,000)
5. Agricultural hydrology
Surface water Extent, body/storage Change detection at
1:50,O00 (> 2.5 ha) I: 10,000 scale
Estimation of surface soil moisture and its spatial distribution
Soil moisture
6. Agricultural drought
Irrigation management
Root zone
Veg. status at district level crop status with 3-4 severity levels
Taluka level crop status fur maior crops and its linkage with yield model
Early warning for moisture stress in command areas
Irrigated crop inventory Crop water demand, Crop moisture status, Crop water use/ET Crop water budget
SAR L, C band 1 5 - 1 8 ~ incidence angle, 3d
I, C SAR data TIR 20-30m, Ikm
200m, 80m, 20-40m 5-8 d
TIR(2), 80-100 m 2-4 d
As in 6 and Agrometeorological parameters
Development of soil moisture profile models
4.5 M i n e r a l e x p l o r a t i o n
Indirect indictors like drainage, land-
form etc. and ma jo r rock type/s t ructural
mapp ing at 1 :50,000 scale are at present
being used as guides in minera l /pe t ro leum
explorat ion. The conven t iona l geo log ica l
explora t ion is based upon structural /
l i thological m a p p i n g and detec t ion o f
geo log ica l /geophys ica l anomal ies . A list o f
Remote Sensing Data Acquisition, Platforms and Sensor Requirements 227
geological parameters observable through remote sensing is given in Table 14. The large scale (1 : 10,000) mapping o f lithofacies and structural features for more accurate targeting o f mineral/petroleum occurrences needs to be done. Imaging spectrometers may be useful for the discrimination o f various hydrothermally altered rocks. High resolution multichannel thermal IR data with a repeat cycle o f twice
a day is required for thermal inertia study. Active microwave data with multiple polarizations/frequencies may be useful for the extraction o f geomorphological features. Imaging at low sun angles will also be beneficial for geological discrimination in hilly terrains. The observational require- ments for mineral exploration are given in Table 14.
Table 10. Forestry: Sensor requirements.
St. Applications objective No.
Observational requirements GR (m)
Spectral bands Repetivi O' Remarks
1. Forest extent mapping
Monitoring changes at global/regional level
2. Forest type & density mapping
Delineating areas of afforestation, deforestation, encroachment (national level)
3. Forest management at compartment level
Species composition and canopy structure
Site characteristics (DTM, Soil moisture)
Tree volume/biomass
4. Monitoring, fire detection/ monitoring, fire proneness
5. Monitoring disease and damage assessment
250-500
(1:250,000) I:IM
20-30
(1:50,000)
5-10 (1:10,000 to 1:25,000)
VIS. NIR, SWIR
VIS, NIR, SWIR,
MW (x,e)
VIS, NIR, SWIR
Narrow bands (VNIR) MW
STEREO (- I m height res.)
INSAR
3-4 p.m & 10-12 ~tm
Specific narrow bands
3-7 d
15-20 d
15-20 d
D&N
15-20 d
Operational texture anal5 sis programs
Mensuration parameters
6. Biodiversity Species identification
228 R.R. Navalgund et al.
Table 1 I. Hydrology Applications: Needs.
Sl. Applications No.
Observational requirements Parameters amenable to RS
Primary spectral observables
I. Precipitation-extent and distribution
2. Rainfall surface run-off
3. Water bodies and flood mapping
4. Snow and ice monitoring
5. Groundwater recharge estimation
Cloud-top temperature, cloud growth, speed of storm
Surface run-off
Extent and volume of water in water bodies, channel flow/river discharge, Flood area delineation
Snow-cover-extent and water equivalent, snow melt run-off, topography
Rainfall, evapo- transpiration, infiltration
Cloud-top temperature cloud-top brightness
Cloud-cover index
Extent of the suspended sediments in water bodies & flooded area
Wet snow areas
Landcover, soil types
NIR radiances, visible radiances, microwave backscatter
NIR reflectance. microwave backscatter. reflectance in blue region
NIR reflectance, microwave backscatter
N [R reflectance. microwave backscatter (multi-frequency obs.)
VIS/NIR reflectances, thermal radiances
Table 12. Hydrology: Sensor requirements.
Swath Spatial resolution Repetivity Spectral bands (km) (m)
Remarks
Precipitation, flood mapping
Snow cover
1000 1000 Twice daily VIS/NIR passive microwave
1000 100-500 3-5 days NIR, Ka, Ku, x bands
Suspended sediments 150
Evapotranspiration 1000
20-30 Daily
250 Daily
VIS microwave
VIS NIR Thermal
Sun-sync. orbit, constant illumination
Equatorial crossing at2 p.m.
Remote Sensing Data Acquisition, Platforms and Sensor Requirements
Table 13. Cartography: Sensor requirements.
229
Scale Grid spacing Accuracy Required Sensor type for DEM of DEM Spatial Res.
_< 1:10,000 10 m < I m I-2 m Optical, with along track stereo, laser altimetry
1:25,000 to 25 to 100 m 2.5 to 25 m 5-10 m Optical. imaging, SAR 1:2,00,000
> 1:200,000 5 to I km 500 to 100 m 100-500 m Optical, radar altimetry
Large scale maps
Topographic maps
Global mapping
Table 14. Geological and mineral resources development and management.
Applications Requirements Parameters amenable Primal' spectral observables to remote sensing
Geotechnical Study Lithology Broadscale rock-type Narrow spectral bands ( 10 nm) discrimination in the range 0.4-2.5 p.m
Specific absorption channels Geological structures seismicity
Geotechnical properties of materials
Geological hazards
Geomorphological Landforms Mapping Drainage patterns
Structures Catchments Flood prone areas
Geological Mapping
Oil & Gas
Rocktype distri. Orientation of structures Natural hazards Thermal Inertia
Lithology Geologic structures Sediment thickness Reservoir rock Cap rock Geophysical anomaly Thermal Inertia
Surface topographical change detection
Lineaments
Volcanocity
Delineation of buried & surface drainage pattern
Digital terrain model
Thermal inertia
Off-shore gravity anomaly
SAR Interferometry
Use of optical/microwave/high resolution PAN
MIR, TIR bands, High repetivity (geostationary platforms)
Microwave/Optical/TIR
Optical stereo dataJSAR Interferometry
TIR (day & night time)
Satellite altimetry
230 R.R. Navalgund et al.
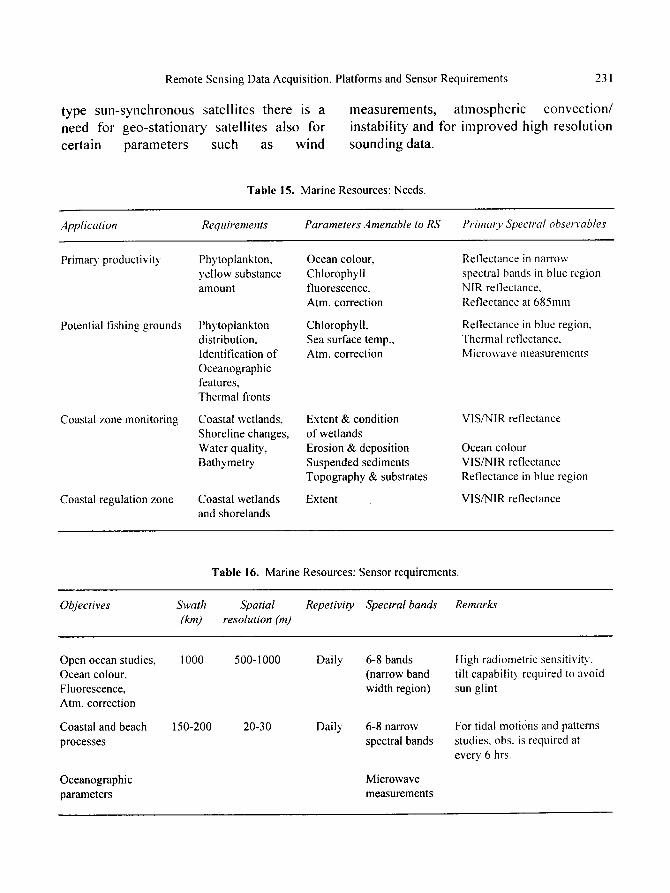
4.6 Marine resources
Sea-surface temperature charts generated from NOAA-AVHRR thermal data are being used for predicting potential fishing zones from dynamic features such as thermal fronts, eddies etc. Ocean colour is another parameter which has been studied for phytoplankton distribution. However, in absence of any colour sensor at present, extensive studies have not been possible. Besides this, fishery forecast models require information on winds, internal waves and other oceanic paralneters which will require radars, altimeters and scatterometer measurements.
Inventory and monitoring of coastal features such as tidal wetlands, coastal land forms, mangroves, sea grass meadows, estuary dynamics, shoreline changes etc. have been done using space-borne data. However, improved spatial resolution with medium spectral resolution capabilities in a sensor are desirable for studying sediment transport and other coastal processes (Table 15 & 16).
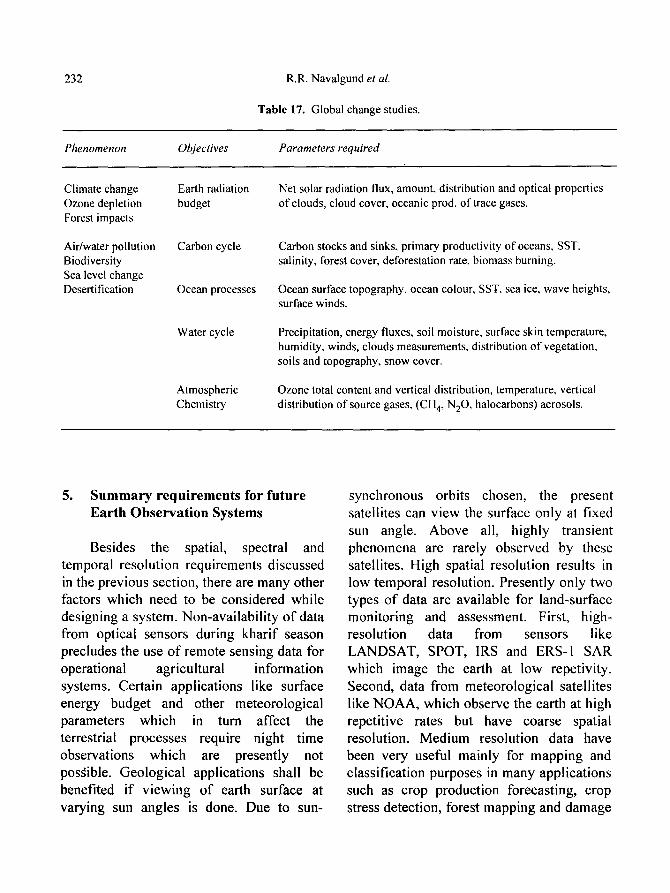
4.7 Climatology~global change
To study global changes one has to study various processes such as hydrological cycle, earth radiation budget, atmospheric chemistry, ocean processes, land surface, sea level c h a n g e s and biodiversity etc. (Table 17). As obvious monitoring of environment requires the measurement of a large number of parameters at different spatial and time scales which necessitate the use of various kinds of sensors. This includes a large variety of active and passive sensors which
make measurements in the X-ray, ultra- violet, visible, infrared and microwave region of the electromagnetic spectrum as well as non-electromagnetic sensors like particle detectors, magnetometers, gravity gradiometers etc. The spatial and temporal sampling of measurement vary with the observed phenomena and in general sensors with different spatial resolution and coverage has to be employed. Simultaneous measurement of different parameters which may be a pre-requisite for monitoring many geophysical phenomena require different kinds of sensors boarded oil the same observation platform. Also, frequent measurement of many quantities on global scale may require tile simultaneous operation of many satellite platforms.
Some of tile derived parameters used for global-change studies are net radiation flux, precipitation, soil mo'isture, evaporation, etc. These are derived from various meteorological parameters like insolation, surface temperature, temperature and water profiles, cloud top temperatures, wind speed etc, Various sounders are presently used to derive temperature and humidity profiles. While temperature information is possible for 15 layers, humidity measurements are presently possible for only 3 layers. Precipitation and rain rates are being derived using visible/infrared and microwave data. Soil moisture can be detected in the surface layers by means of microwave absorption and emission. The total net radiation input to the land-surface determines the heat fluxes at the surface. Atmospheric structural parameters derived from sounders are used for determining it. While most of these measurements are possible from NOAA
Remote Sensing Data Acquisition, Platforms and Sensor Requirements 23 I
t ype s u n - s y n c h r o n o u s sa te l l i t e s there is a m e a s u r e m e n t s , a t m o s p h e r i c c o n v e c t i o n /
need for g e o - s t a t i o n a r y sa te l l i t e s a l so for ins tab i l i ty and for i m p r o v e d high r e so lu t ion
cer ta in p a r a m e t e r s such as w i n d s o u n d i n g data.
Table 15. Marine Resources: Needs.
Application Requirements Parameters Amenable to RS Prima O, Spectral obsela'ables
Primary productivity
Potential fishing grounds
Coastal zone monitoring
Coastal regulation zone
Phytoplankton, yellow substance amount
Phytoplankton distribution, Identification of Oceanographic features, Thermal fronts
Coastal wetlands, Shoreline changes, Water quality, Bathymetry
Coastal wetlands and shorelands
Ocean colour, Chlorophyll fluorescence, Atm. correction
Chlorophyll, Sea surface temp., Atm. correction
Extent & condition of wetlands Erosion & deposition Suspended sediments Topography & substrates
Extent
Reflectance in narrow spectral bands in blue region NIR reflectance, Reflectance at 685mm
Reflectance in blue region, Thermal reflectance, Microwave measurements
Vl S,q',,rl R reflectance
Ocean colour VIS/NIR reflectance Reflectance in blue region
VIS/NIR reflectance
Table 16. Marine Resources: Sensor requirements.
Objectives Swath Spatial Repetivity Spectral bands Remarks (km) resolution (m)
Open ocean studies, 1000 Ocean colour, Fluorescence, Atm. correction
Coastal and beach 150-200 processes
500-1000 Daily 6-8 bands (narrow band width region)
20-30 Daily 6-8 narrow spectral bands
High radiometric sensitivity, tilt capabili b required to avoid sun glint
For tidal motions and patterns studies, obs. is required at every 6 hrs.
Oceanographic Microwave parameters measurements
232 R.R. Navalgund et al.
Table 17. Global change studies.
Phenomenon Objectives Parameters required
Climate change Earth radiation Ozone depletion budget Forest impacts
Air/water pollution Carbon cycle Biodiversity Sea level change Desertification Ocean processes
Water cycle
Atmospheric Chemistry
Net solar radiation flux, amount, distribution and optical properties of clouds, cloud cover, oceanic prod. of trace gases.
Carbon stocks and sinks, primary productivity of oceans, SST, salinity, forest cover, deforestation rate, biomass burning.
Ocean surface topography, ocean colour, SST, sea ice, wave heights, surface winds.
Precipitation, energy fluxes, soil moisture, surface skin temperature, humidity, winds, clouds measurements, distribution of vegetation, soils and topography, snow cover.
Ozone total content and vertical distribution, temperature, vertical distribution of source gases, (CH4, N20, halocarbons) aerosols.
5. Summary requirements for future Earth Observation Systems
Besides the spatial, spectral and temporal resolution requirements discussed in the previous section, there are many other factors which need to be considered while designing a system. Non-availability of data from optical sensors during kharif season precludes the use of remote sensing data for operational agricultural information systems. Certain applications like surface energy budget and other meteorological parameters which in turn affect the terrestrial processes require night time observations which are presently not possible. Geological applications shall be benefited if viewing of earth surface at varying sun angles is done. Due to sun-
synchronous orbits chosen, the present satellites can view the surface only at fixed sun angle. Above all, highly transient phenomena are rarely observed by these satellites. High spatial resolution results in low temporal resolution. Presently only two types of data are available for land-surface monitoring and assessment. First, high- resolution data from sensors like LANDSAT, SPOT, IRS and ERS-I SAR which image the earth at low repetivity. Second, data from meteorological satellites like NOAA, which observe the earth at high repetitive rates but have coarse spatial resolution. Medium resolution data have been very useful mainly for mapping and classification purposes in many applications such as crop production forecasting, crop stress detection, forest mapping and damage
Remote Sensing Data Acquisition, Platforms and Sensor Requirements 233
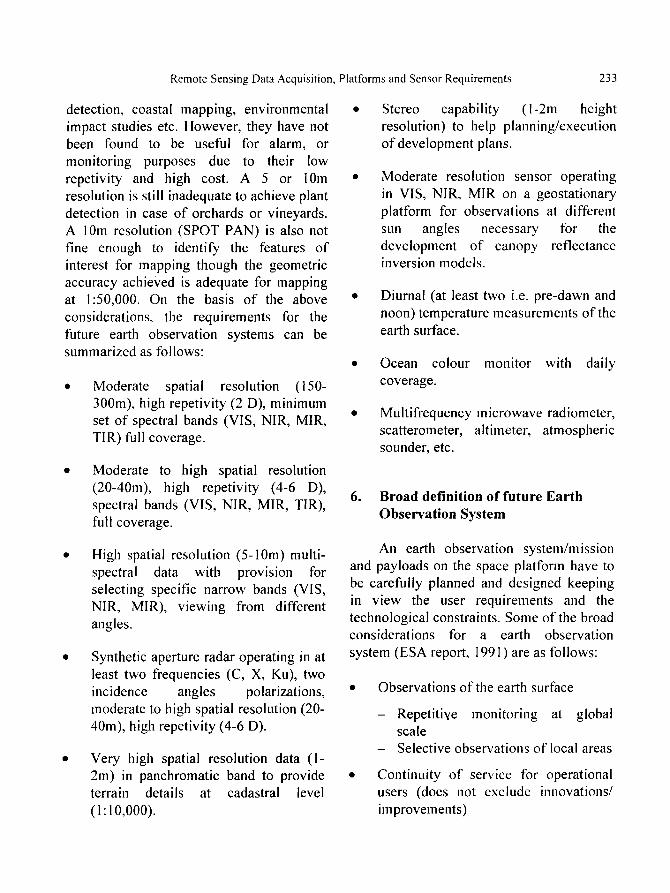
detection, coastal mapping, environmental �9 impact studies etc. However, they have not been found to be useful for alarm, or monitoring purposes due to their low repetivity and high cost. A 5 or 10m �9 resolution is still inadequate to achieve plant detection in case of orchards or vineyards. A 10m resolution (SPOT PAN) is also not fine enough to identify the features of interest for mapping though the geometric accuracy achie~ced is adequate for mapping at 1:50,000. On the basis of the above �9 considerations, the requirements for the future earth observation systems can be summarized as follows:
Moderate spatial resolution (150- 300m), high repetivity (2 D), minimum set of spectral bands (VIS, NIR, MIR, TIR) full coverage.
Moderate to high spatial resolution (20-40m), high repetivity (4-6 D), spectral bands (VIS, NIR, MIR, TIR), full coverage.
High spatial resolution (5-10m) multi- spectral data with provision for selecting specific narrow bands (VIS, NIR, MIR), viewing from different angles.
Synthetic aperture radar operating in at least two frequencies (C, X, Ku), two incidence angles polarizations, moderate to high spatial resolution (20- 40m), high repetivity (4-6 D).
Very high spatial resolution data (l- 2m) in panchromatic band to provide terrain details at cadastral level (1:10,000).
Stereo capability ( l-2m height resolution) to help planning/execution of development plans.
Moderate resolution sensor operating in VIS, NIR, MIR on a geostationary platform for observations at different sun angles necessary for the development of canopy reflectance inversion models.
Diurnal (at least two i.e. pre-dawn and noon) temperature measurements of the earth surface.
Ocean colour monitor with daily coverage.
Multifrequency microwave radiometer, scatterometer, altimeter, atmospheric sounder, etc.
6. Broad definition of future Earth Observation System
An earth observation system/mission and payloads on the space platform have to be carefully planned and designed keeping in view the user requirements and the technological constraints. Some of the broad considerations for a earth observation system (ESA report, 1991 ) are as follows:
�9 Observations of the earth surface
- Repetitive monitoring at global scale
- Selective observations of local areas
Continuity of service for operational users (does not exclude innovations/ improvements)
234 R.R. Navalgund et al.
�9 Calibration o f sensors
�9 Synergy between sensors
�9 Atmospheric corrections: facilitates the use of data at different times/ observation conditions
�9 Timely access of data : ground acqui- sition / processing / distribution infra- structure
�9 Supporting activities : simulations, campaigns and modelling efforts.
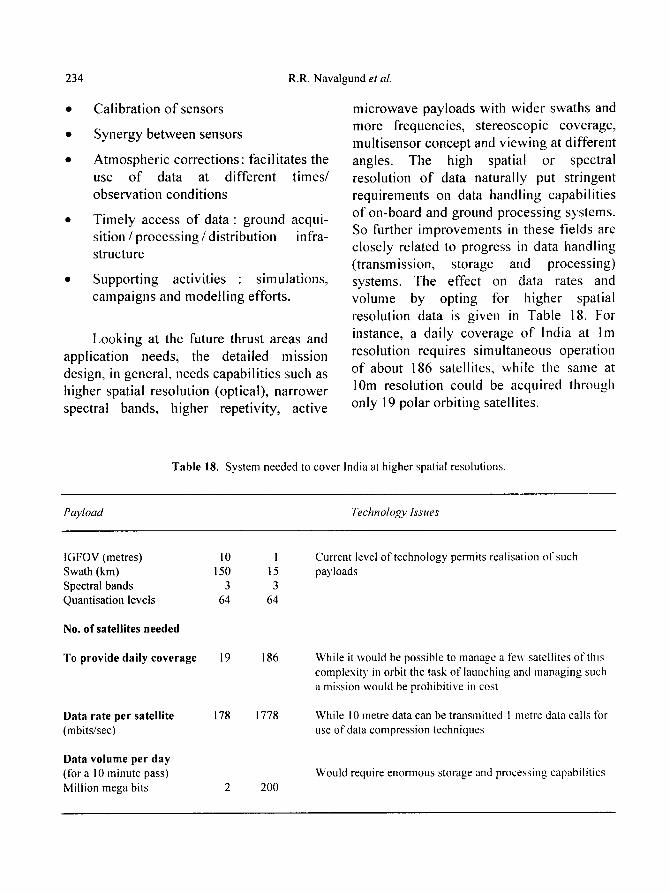
Looking at the future thrust areas and application needs, the detailed mission design, in general, needs capabilities such as higher spatial resolution (optical), narrower spectral bands, higher repetivity, active
microwave payloads with wider swaths and more frequencies, stereoscopic coverage, multisensor concept and viewing at different angles. The high spatial or spectral resolution of data naturally put stringent requirements on data handling capabilities of on-board and ground processing systems. So further improvements in these fields are closely related to progress in data handling (transmission, storage and processing) systems. The effect on data rates and volume by opting for higher spatial resolution data is given in Table 18. For instance, a daily coverage o f India at lm resolution requires simultaneous operation of about 186 satellites, while the same at 10m resolution could be acquired through only 19 polar orbiting satellites.
Table 18. System needed to cover India at higher spatial resolutions.
Payload Technology' Issues
IGFOV (metres) I 0 I Swath (km) 150 15 Spectral bands 3 3 Quantisation levels 64 64
No. of satellites needed
To provide daily coverage 19 186
Data rate per satellite 178 1778 (mbits/sec)
Data volume per day (lbr a 10 minute pass) Million mega bits 2 200
Current level of technology permits real isation of such payloads
While it would be possible to manage a few satellites of fills complexity in orbit the task of launching anti managing such a mission would be prohibitive in cost
While 10 metre data can be transmitted 1 metre data calls for use of data compression techniques
Would require enormous storage and processing capabilities
Remote Sensing Data Acquisition, Platforms and Sensor Requirements 235
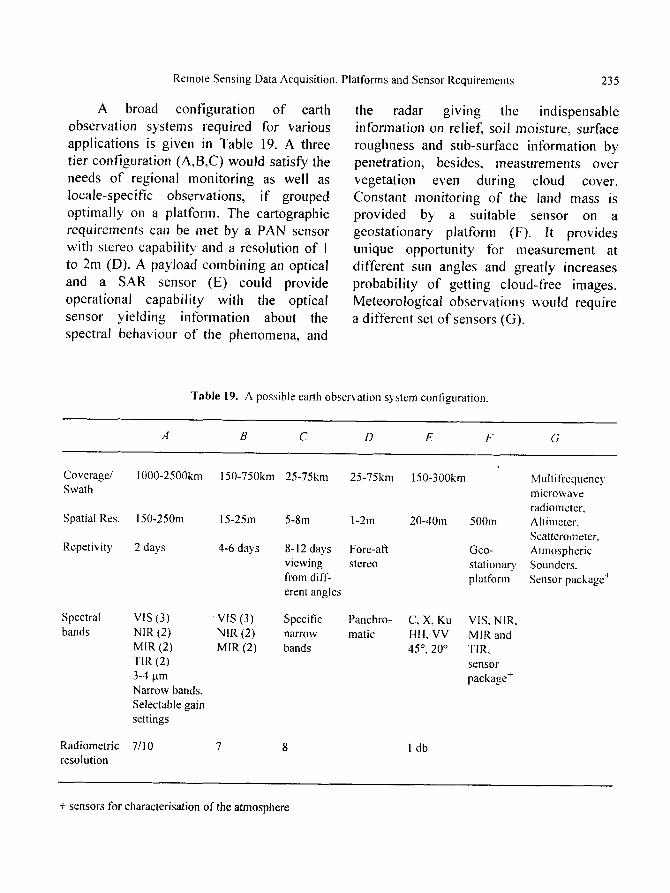
A broad configuration of earth observation systems required for various applications is given in Table 19. A three tier configuration (A,B,C) would satisfy the needs o f regional monitoring as well as locale-specific observations, if grouped optimally on a platform. The cartographic requirements can be met by a PAN sensor with stereo capability and a resolution of 1 to 2nl (D). A payload combining an optical and a SAR sensor (E) could provide operational capability with the optical sensor yielding information about the spectral behaviour o f the phenomena, and
the radar giving the indispensable information on relief, soil moisture, surface roughness and sub-surface information by penetration, besides, measurements over vegetation even during cloud cover. Constant monitoring of the land mass is provided by a suitable sensor on a geostationary platform (F). It provides tmique opportunity for measurement at different sun angles and greatly increases probability o f getting cloud-free images. Meteorological observations would require a different set of sensors (G).
Table 19. A possible earth observation system configuration.
A B C D E F G
1000-2500kin 150-750km 25-75km 25-75km 150-300kin Coverage/ Swath
Spatial Res. 150-250m 15-25m 5-8m 1-2m 20-40m
Repetivity 2 days 4-6 days 8-12 days Fore-aft viewing stereo from dill" erent angles
Spectral VIS (3) VIS (3) bands NIR (2) NIR (2)
MIR (2) MIR (2) TIR (2) 3-4 ptm Narrow bands, Selectable gain settings
Radiometric 7./10 7 resolution
Specific Panchro- C, X, Ku narrow matic HH, VV bands 45 ~ , 20 ~
8 I db
- Multiffequency lnicrowave radiometer,
500m Altimeter, Scatterometer,
G e o - Atmospheric stationau, Sounders. platform Sensor package +
VIS, NIR, MIR and TIR, s e n s o r
package +
+ sensors for charaeterisation of the atmosphere
236 R.R. Navalgund et al.
Besides the systems suggested in Table 19, there are some additional requirements. While utility of P-band SAR data is recognized there are certain stringent requirements on the kind of platform required. Synthetic aperture altimeter for elevation determination may also be examined and considered. In order to get minimum of 0.5 per cent reflectance changes seen in the images, it is necessary to have 8 bit radiometric resolution. Radiometric resolution vis-a-vis spatial resolution needs to be examined from the applications point of view both at very fine spatial resolution of a couple of metres and at moderate resolution. Simulation studies in this respect need to be taken up. Depending upon the dynamic range as seen in the scene, adaptive quantisation should be incorporated in the onboard processor. For attaining better geometric accuracies GPS receiver onboard with a network of GPS stations at precisely known ground points will be required.
Regional monitoring of crops, detection of crop stress, crop discrimination, forest mapping, detection of forest fires etc. can be operationalized with WiFS having high repetivity. However, a sensor system for mapping soils at various categoric level is a issue of concern for many application scientists. Combination of sensors and the repetivity requirements may call for using orbits other than polar. An imaging spectrometer will be required for applications which include identification of species composition and canopy structure in forests, crop species identification, crop disease and nutrient stress etc. Such sensors may use array detectors. Besides these requirements, the need for absolute
calibration of sensors and a sensor package for atmospheric correction is acutely felt. It needs to be defined in greater detail in terms of spectral channels etc. It should be integrated into the sensor system. Onboard processing should become an essential component.
Acknowledgements
The members of the study team wish to place on record their gratitude to the Executive Council of the Indian Society of Remote Sensing, Dehradun for providing an opportunity to work towards the preparation of such an approach paper. We acknowledge our indebtness to Dr. George Joseph, President, ISRS, who has been the main motivating force for this activity. Discussions held with various colleagues at SAC, in particular at the Remote Sensing Applications Group, Earth Observation Systems Office, ISRO Head Quarters, NRSA have helped in fine tuning of observational requirements and definition of the earth observation systems. We express our gratefulness to them. Cooperation of all the remote sensing professionals, academicians and the end users who participated in the survey by sending their responses is gratefully acknowledged. Unstinted support provided by Shri Mukesh Arya in drafting the report is gratefully acknowledged.
References
Navalgund R R (1991). Remote Sensing applications in Agriculture: Indian experience. In Space and Agriculture Management, Special current event section, International Astronautial Federation. 42nd IAF Congress, Montreal, Canada, pp. 31-50.
Remote Sensing Data Acquisition, Platforms and Sensor Requirements 237
ESA (1991). Report of the earth observation user consultation meeting. European Space Agency Publication, ESA-SP-1143.
Sahai B, Dadhwal V K and Chakraborty M (1988). Comparison of SPOT, TM and MSS data for agricultural landuse mapping in Gujarat (India), 39th Congress Int. Astronautical Federation, Oct. 8-15, 1988, Bangalore, India, Paper IAF-88-146.
Sahai B (1993). Applications of remote sensing for Environmental Management in India, In Space and Environment, Special Plenary session, International
Astronautical Federation, 44th IAF Congress, Gtaz. Austria, 1993, pp. 41-69.
Satellite for mapping: requirements, analysis, sensor specifications, data processing, Report of the iNCA stud)' group on 'Satellite for Mapping' submitted to the National Organising Committee, 14th Congress, Indian National Cartographic Association, November 1994.
Wakker K F, Zandbergen R C A. Van Geldorp G H M and Ambrorices B A C (1988). From satellite altimetry to ocean topography: A survey of data processing techniques, Int. J. Rein. Sens., Vol. 9, No. 10& 11, pp. 1797-1818.
A N N E X U R E - I
QUESTIONNAIRE FOR USERS' FEEDBACK TO ASSESS OPTIMUM SENSOR PARAMETER NEEDS SURVEY AND ANALYSIS
Purpose
Satellite remote sensing for resource survey initiated with the launch of LANDSAT-1 in the year 1972, has witnessed many changes, in the last two decades, in terms of availability of data of different resolutions, spectral bands, repeat cycles etc. There are many missions planned in the near filture offering data of different dimensions. Large number of users in the country have used LANDSAT, SPOT and IRS data to meet their application needs. At this juncture, it is worth-while to assess the data needs existing, gaps and operational constraints in meeting all data needs for resource exploration. One way to obtain this information was to ask the Indian remote sensing community to spell out their application needs realized/realizable vis-a- vis sensor parameter(s) in a quantitative
fashion. A survey was conducted on behalf of the Indian Society of Remote Sensing (ISRS) in September, 1994 to realize this. The broad objectives of this exercise were (a) to obtain feedback from Indian remote sensing community on effectiveness of presently available remote sensing data in meeting various application needs, (b) to assess the shortcomings in remote sensing data parameters to meet challenges, current and near future, in remote sensing applications and (c) to translate feed-back received from remote sensing data users, towards definition and design of flmlre remote sensing missions.
Structure of the questionnaire
The questionnaire was designed keeping in view that a) it should involve minimum effort on part of the respondent


![[REMOTE SENSING] 3-PM Remote Sensing](https://img.pdfslide.net/doc/110x75/61f2bbb282fa78206228d9e2/remote-sensing-3-pm-remote-sensing.jpg)


