Embed Size (px)
Citation preview
Remote SensingRemote Sensing
Meteorological Satellites Applied Meteorological Satellites Applied to Earth Surface Observationto Earth Surface Observation
Meteorological Satellites Meteorological Satellites (Metsats)(Metsats)
► Coarse spatial resolution, high temporal Coarse spatial resolution, high temporal resolutionresolution
► NOAA, GOES, and DMSP NOAA, GOES, and DMSP ► NIMBUSNIMBUS► EOS, OrbView-2, SPOT-4EOS, OrbView-2, SPOT-4

1. AVHRR1. AVHRR
► Advanced Very High Resolution Radiometer Advanced Very High Resolution Radiometer ► 1979 – 1979 – ► Designed as weather sensors on NOAA Designed as weather sensors on NOAA
satellitessatellites► Become increasingly popular for land Become increasingly popular for land
oriented applications oriented applications
http://www.crisp.nus.edu.sg/~research/tutorial/spacebrn.htm
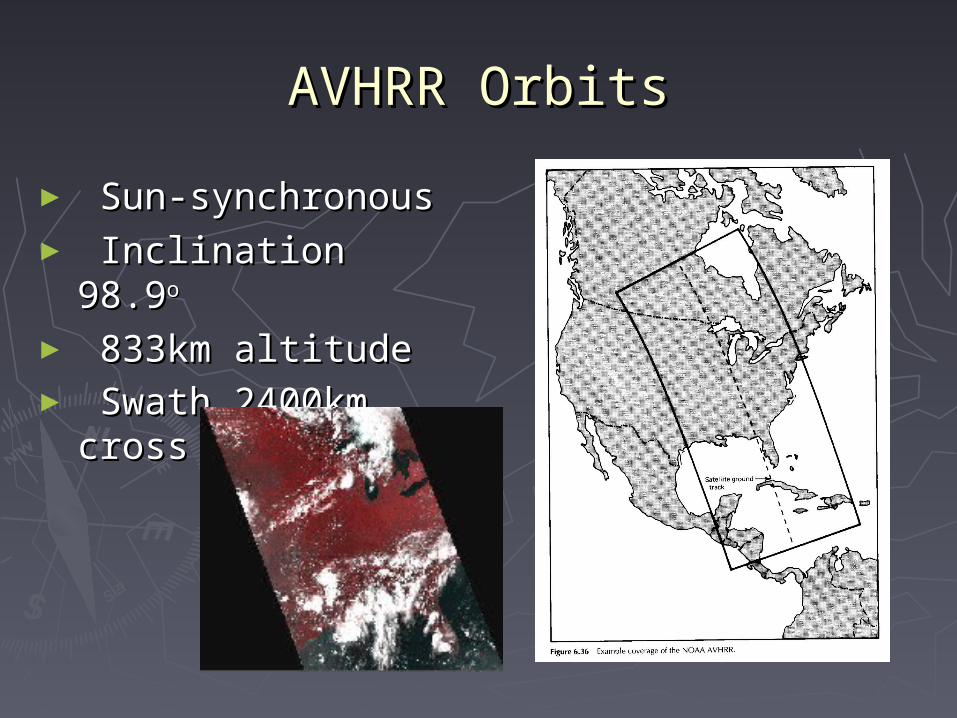
AVHRR OrbitsAVHRR Orbits
► Sun-synchronousSun-synchronous► Inclination 98.9Inclination 98.9oo
► 833km altitude833km altitude► Swath 2400km Swath 2400km
cross trackcross track

East Coast on September 27, 1997:
http://rst.gsfc.nasa.gov/Sect14/Sect14_6.html
June 26, 2000 covers European Russian eastward into Siberia.http://rst.gsfc.nasa.gov/Sect14/Sect14_6.html

Spectral ResolutionSpectral Resolution
► - band1: 0.58-0.68microm (red) - band1: 0.58-0.68microm (red) - band2: 0.72-1.10microm (near infrared) - band2: 0.72-1.10microm (near infrared) - band3: 3.55-3.93microm (mid infrared- - band3: 3.55-3.93microm (mid infrared-
thermal) thermal) - band4: 10.30-11.3microm (thermal)* - band4: 10.30-11.3microm (thermal)* - band5: 11.50-12.5microm (thermal)* - band5: 11.50-12.5microm (thermal)*
Resolutions Resolutions
► 10 bits, 1024 levels of brightness10 bits, 1024 levels of brightness► Spatial resolutionSpatial resolution
- 1.1km Local Area Coverage (LAC) - 1.1km Local Area Coverage (LAC) - 4 km global Area Coverage (GAC)- 4 km global Area Coverage (GAC)
► Temporal resolution: daily Temporal resolution: daily
DataData
► Low cost Low cost ► Public domain distributed by NOAA Public domain distributed by NOAA
Vegetation IndicesVegetation Indices
► Vegetation Index (VI): Vegetation Index (VI): NIR-Red NIR-Red
► Normalized difference vegetation index Normalized difference vegetation index (NDVI) (NDVI) NDVI = (NIR-Red)/(NIR+Red) NDVI = (NIR-Red)/(NIR+Red)

NDVI AVHRRNDVI AVHRR
http://glcf.umiacs.umd.edu/data/gimms/
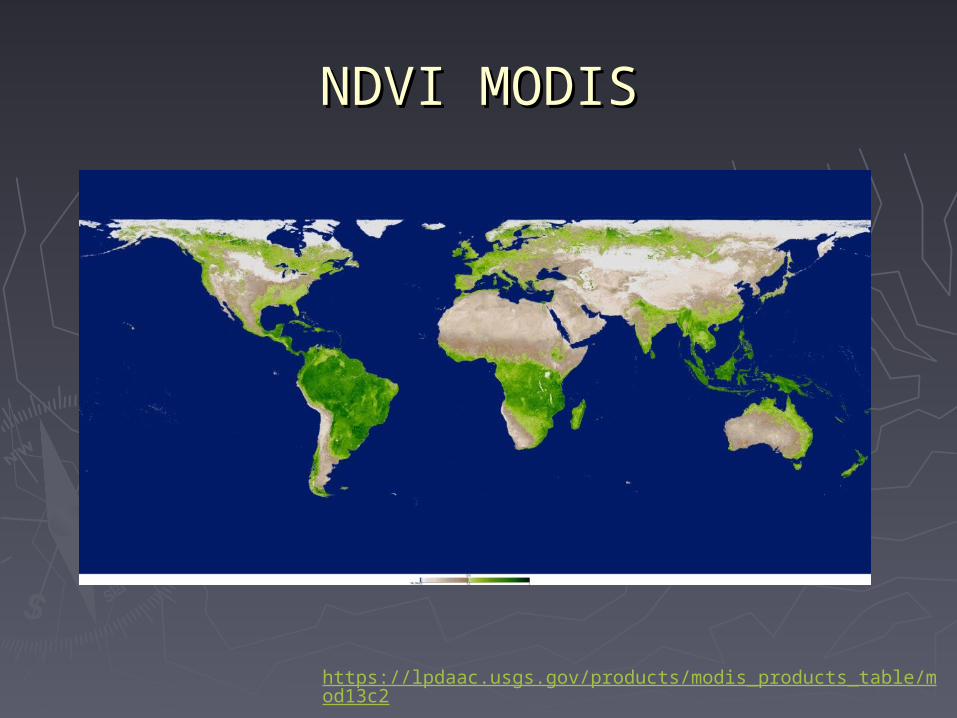
NDVI MODISNDVI MODIS
https://lpdaac.usgs.gov/products/modis_products_table/mod13c2

NDVI SPOTNDVI SPOT
http://www.spot-vegetation.com/pages/policy.html
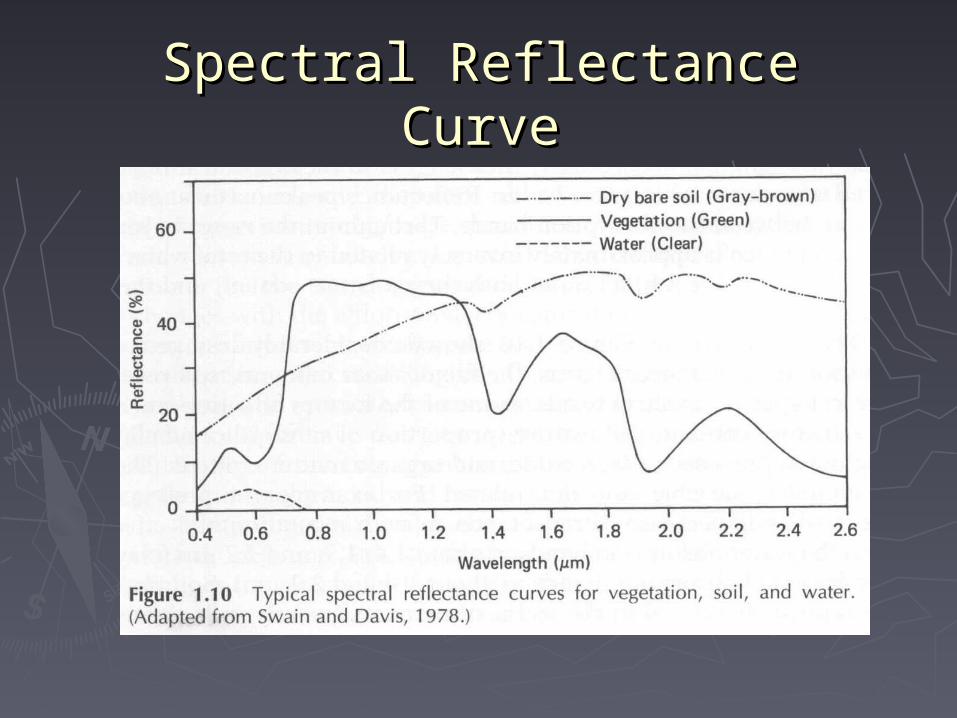
Spectral Reflectance CurveSpectral Reflectance Curve
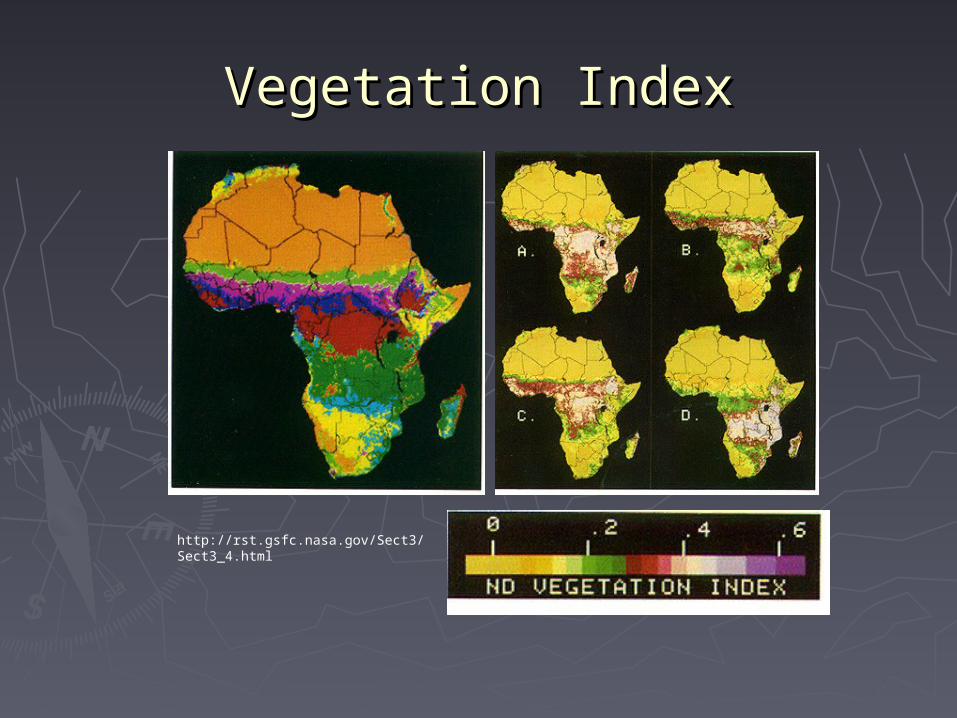
Vegetation IndexVegetation Index
http://rst.gsfc.nasa.gov/Sect3/Sect3_4.html
2. 2. GOESGOES
► Geostationary Operational Environmental Geostationary Operational Environmental Satellites Satellites
► As part of global network of metsats 70As part of global network of metsats 70oo longitude apart around the world, domestic longitude apart around the world, domestic data available since 1975 data available since 1975
► Geosynchronous, altitude 36,000km Geosynchronous, altitude 36,000km ► GOES East 75GOES East 75ooW, GOES-West 135W, GOES-West 135ooW W
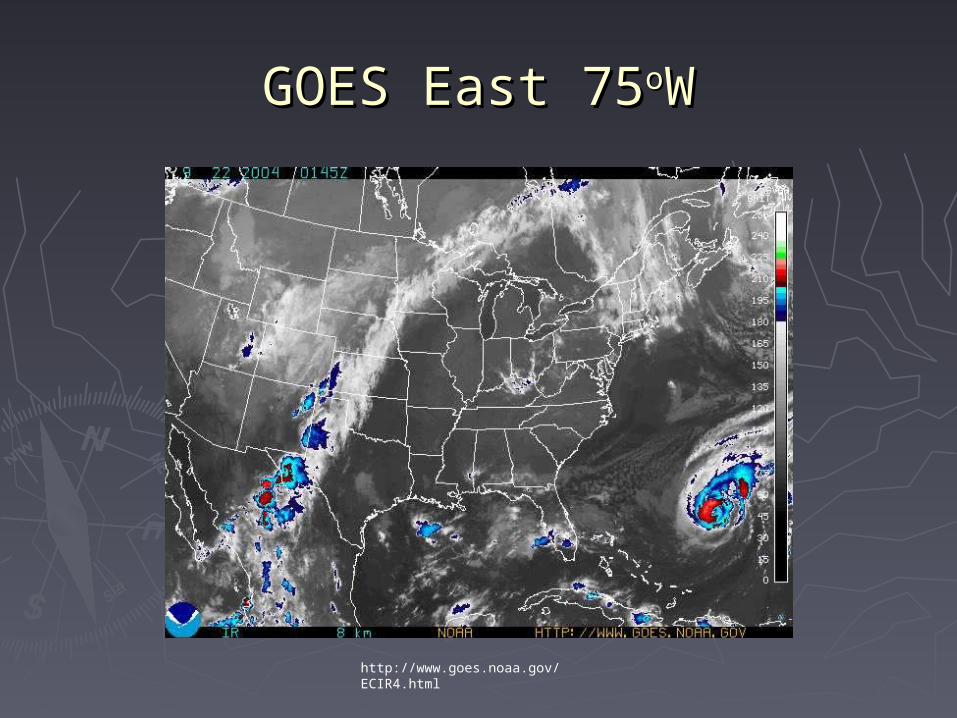
GOES East 75GOES East 75ooWW
http://www.goes.noaa.gov/ECIR4.html

GOES-West 135GOES-West 135ooWW
http://www.goes.noaa.gov/WCIR4.html
GOES ..GOES ..
► A full disk view A full disk view ► A visible (day time) 0.55-0.70microm A visible (day time) 0.55-0.70microm
4 thermal band (day and night) 3.8- 4 thermal band (day and night) 3.8-12.5microm 12.5microm
► 1km spatial resolution for the visible band, 1km spatial resolution for the visible band, and 4,8,4,4km for the four thermal bands, and 4,8,4,4km for the four thermal bands, respectivelyrespectively
► Data are distributed real time Data are distributed real time
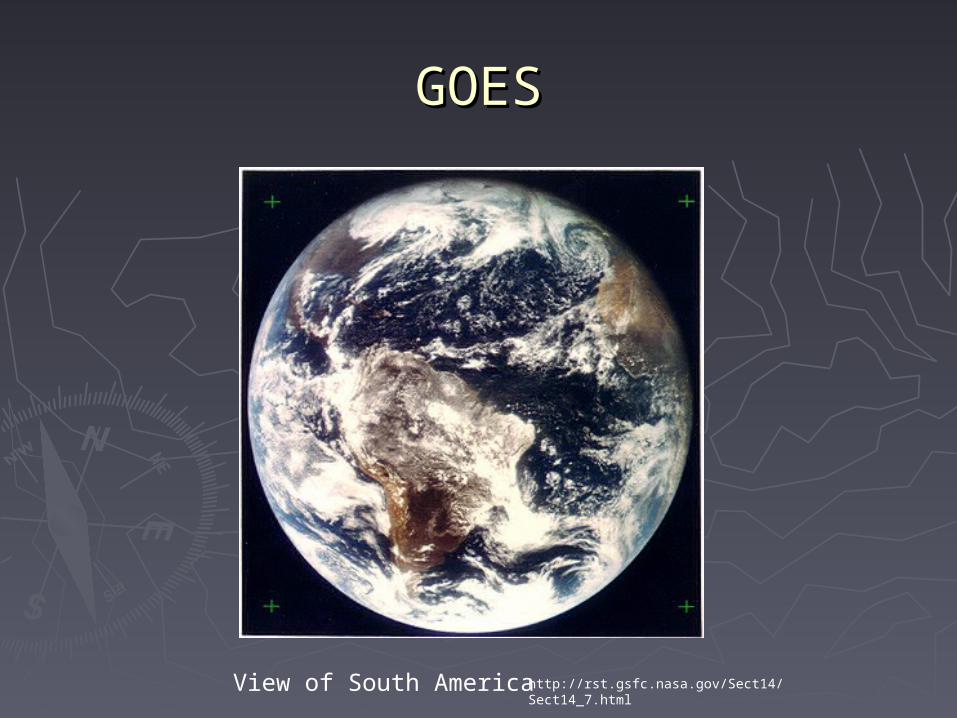
GOESGOES
View of South America http://rst.gsfc.nasa.gov/Sect14/Sect14_7.html
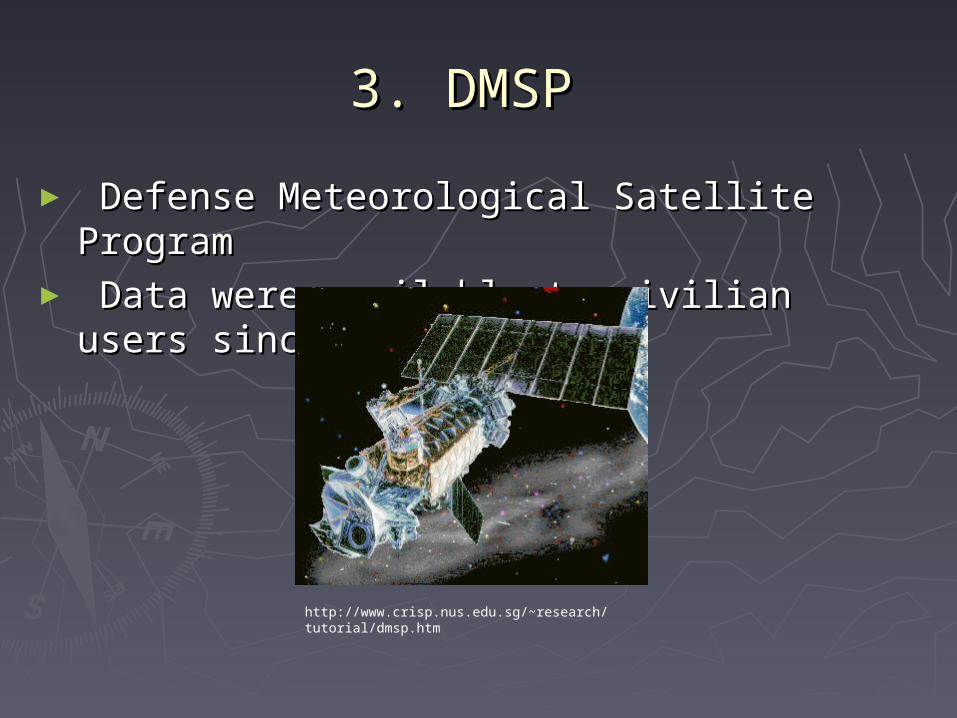
3. DMSP3. DMSP
► Defense Meteorological Satellite ProgramDefense Meteorological Satellite Program► Data were available to civilian users since Data were available to civilian users since
1973 1973
http://www.crisp.nus.edu.sg/~research/tutorial/dmsp.htm
3. DMSP3. DMSP
► Sun-synchronous Sun-synchronous ► 0.4-1.1microm (visible & NIR), 8-13microm 0.4-1.1microm (visible & NIR), 8-13microm
(thermal)(thermal)► A nighttime visible band, the population A nighttime visible band, the population
map, map, volcanoes, oil and gas fields, and forest volcanoes, oil and gas fields, and forest fires fires
► 3km spatial resolution 3km spatial resolution

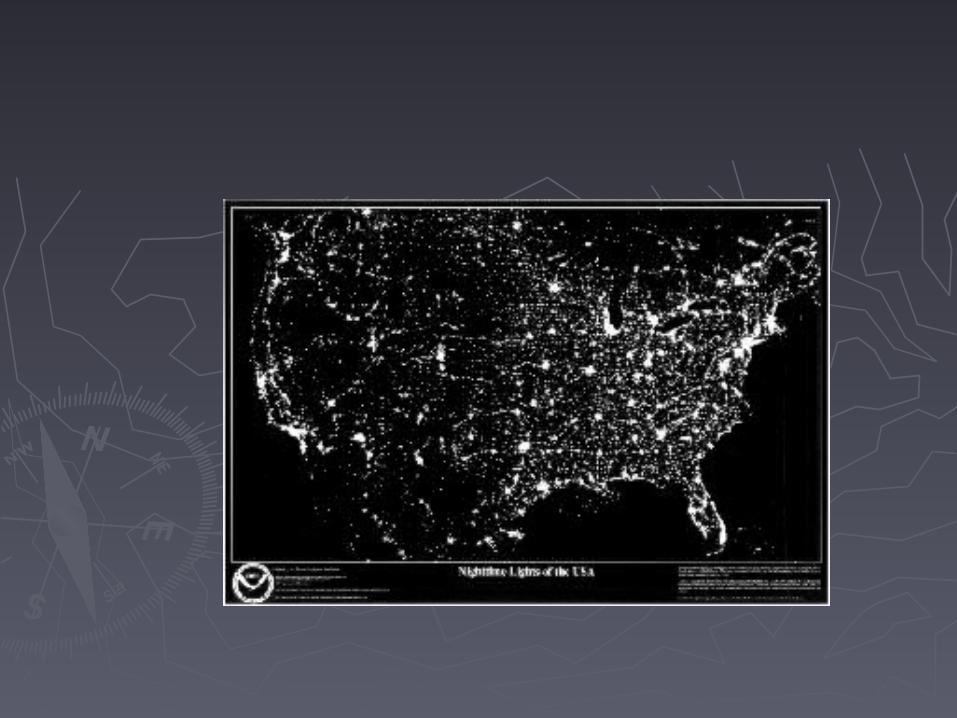

NIGHTFALL IN NIGHTFALL IN USAUSA

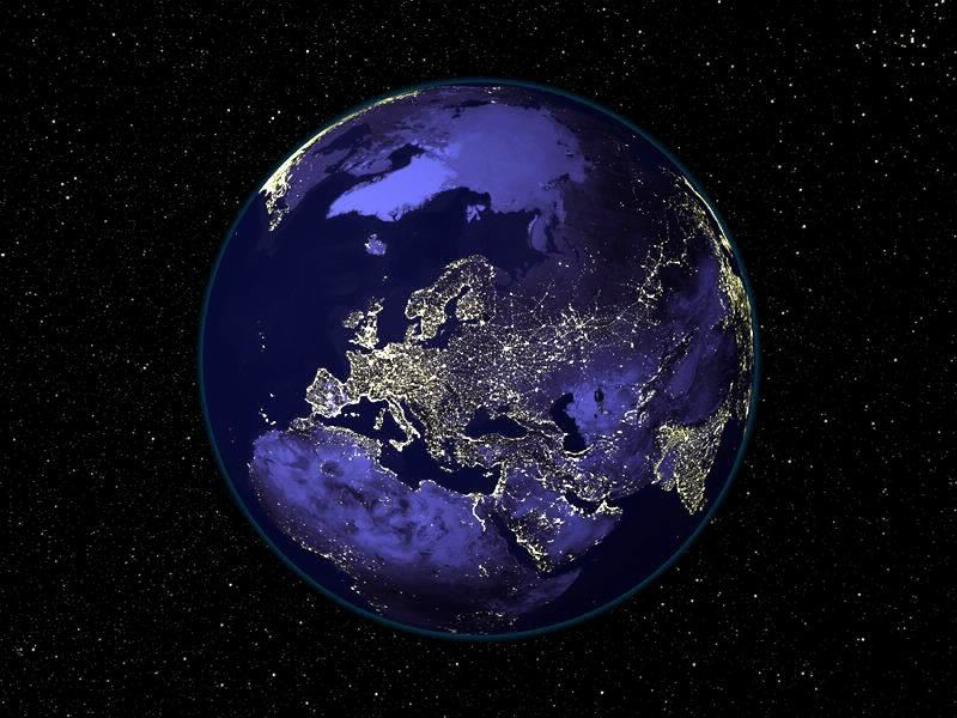
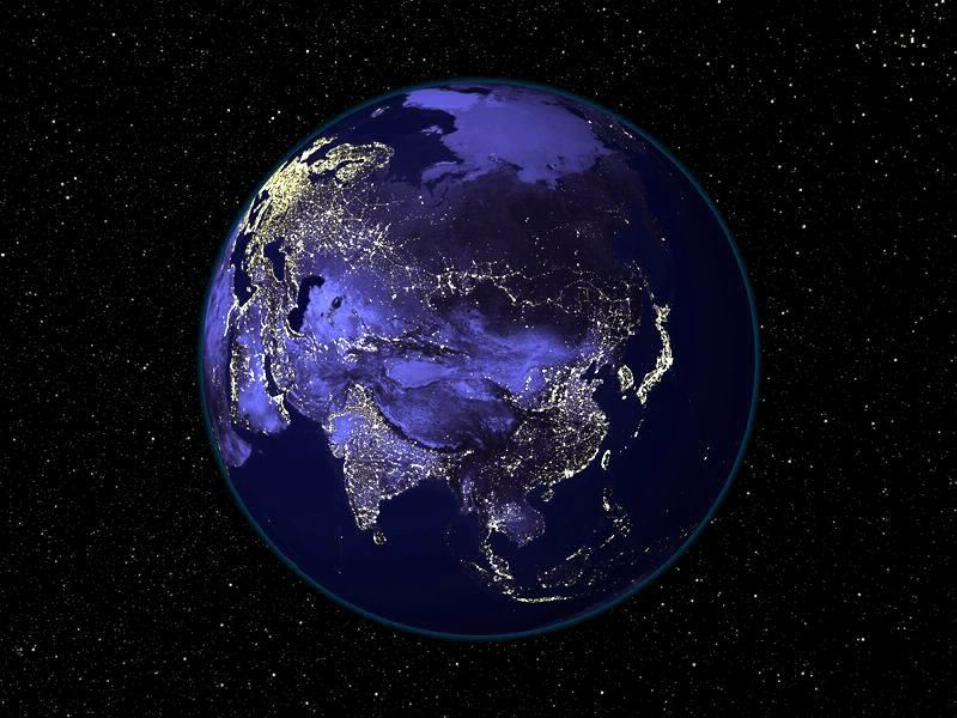
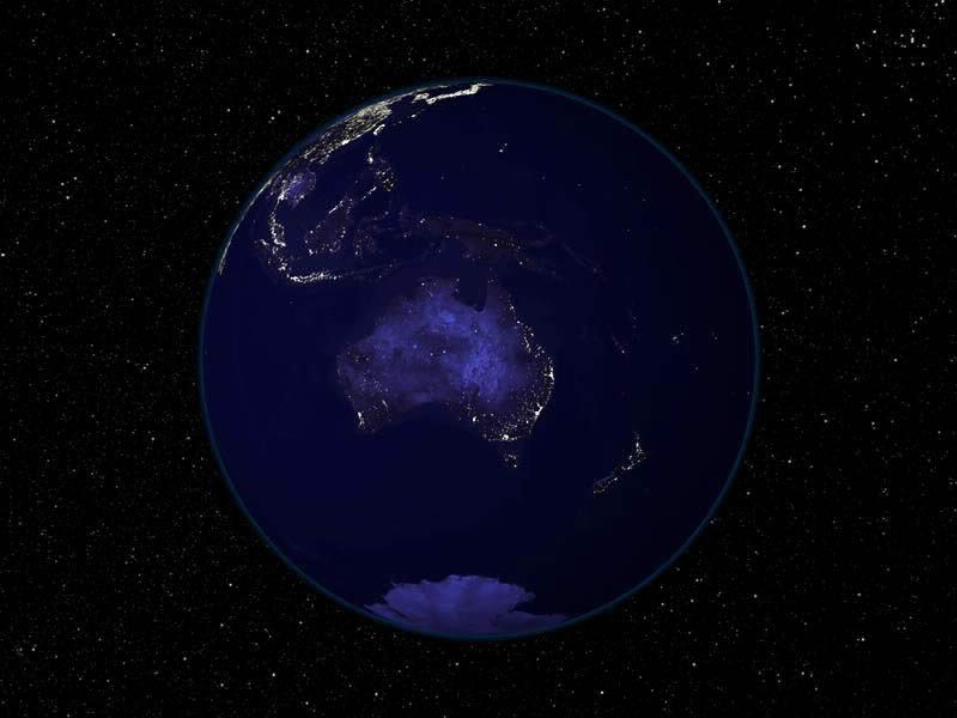
OUR PLANET IN THE MIDDLE OF THE UNIVERSE AT NIGHT


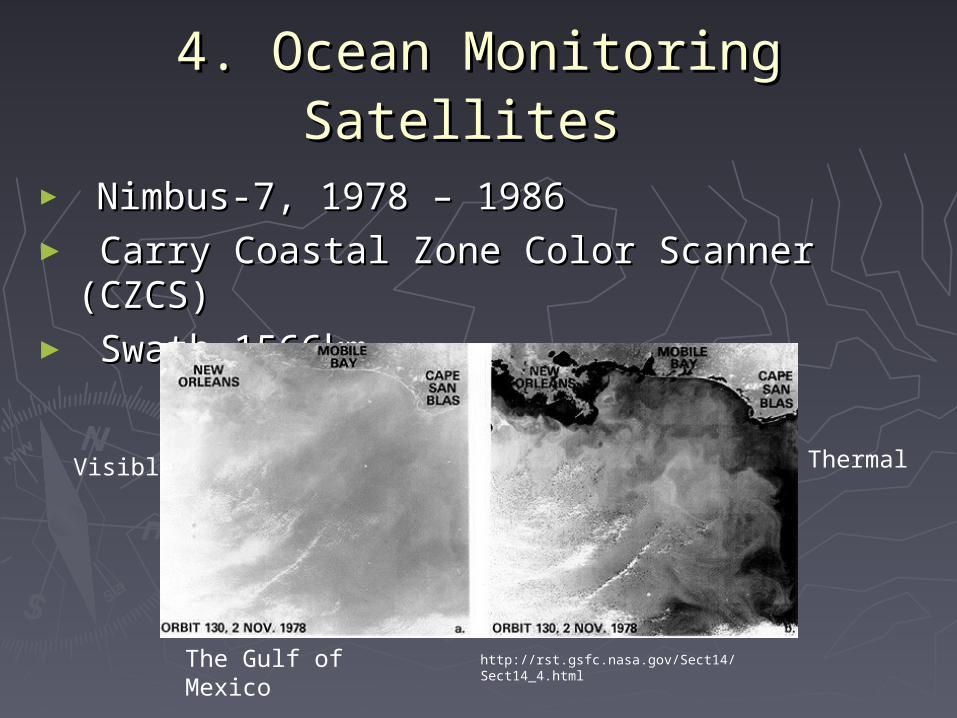
4. Ocean Monitoring Satellites4. Ocean Monitoring Satellites
► Nimbus-7, 1978 – 1986Nimbus-7, 1978 – 1986► Carry Coastal Zone Color Scanner (CZCS) Carry Coastal Zone Color Scanner (CZCS) ► Swath 1566kmSwath 1566km
The Gulf of Mexico http://rst.gsfc.nasa.gov/Sect14/Sect14_4.html
Visible Thermal
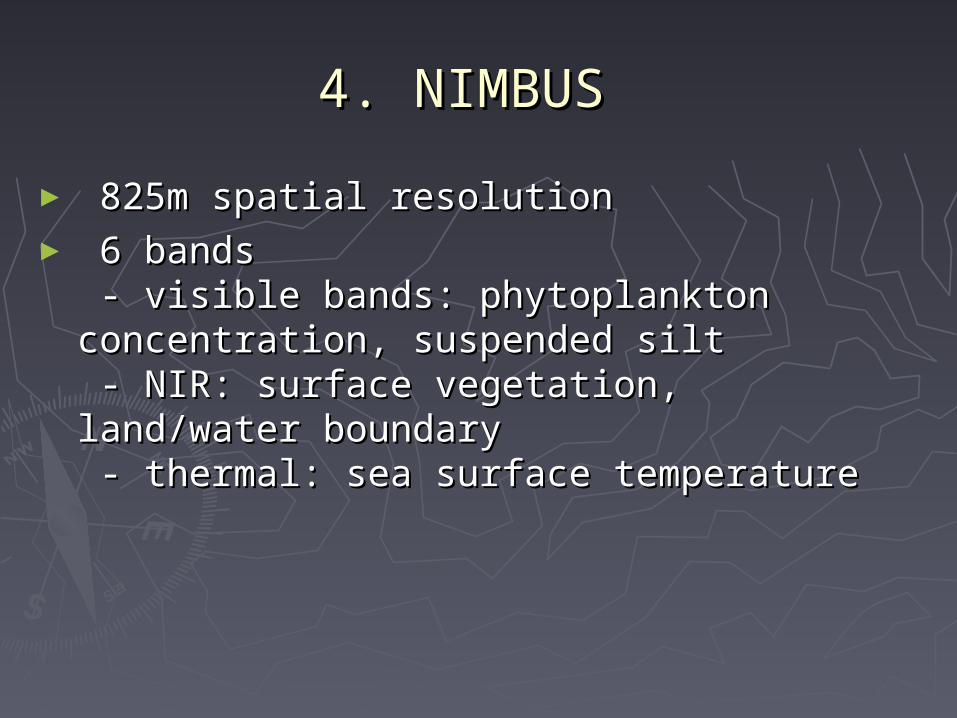
4. NIMBUS4. NIMBUS
► 825m spatial resolution 825m spatial resolution ► 6 bands 6 bands
- visible bands: phytoplankton - visible bands: phytoplankton concentration, suspended silt concentration, suspended silt - NIR: surface vegetation, land/water - NIR: surface vegetation, land/water boundary boundary - thermal: sea surface temperature - thermal: sea surface temperature

Color-coded temperature maps
http://rst.gsfc.nasa.gov/Sect14/Sect14_4.html

5. Earth Observing System 5. Earth Observing System (EOS)(EOS)
► Earth Science Enterprise (ESE) formally Earth Science Enterprise (ESE) formally called Mission to Planet Earth (MTPE) NASA called Mission to Planet Earth (MTPE) NASA program program
► Terra (EOS-AM), 1999Terra (EOS-AM), 1999 Aqua (EOS-PM), 2002 Aqua (EOS-PM), 2002

TerraTerra
http://rst.gsfc.nasa.gov/Sect16/Sect16_7.html
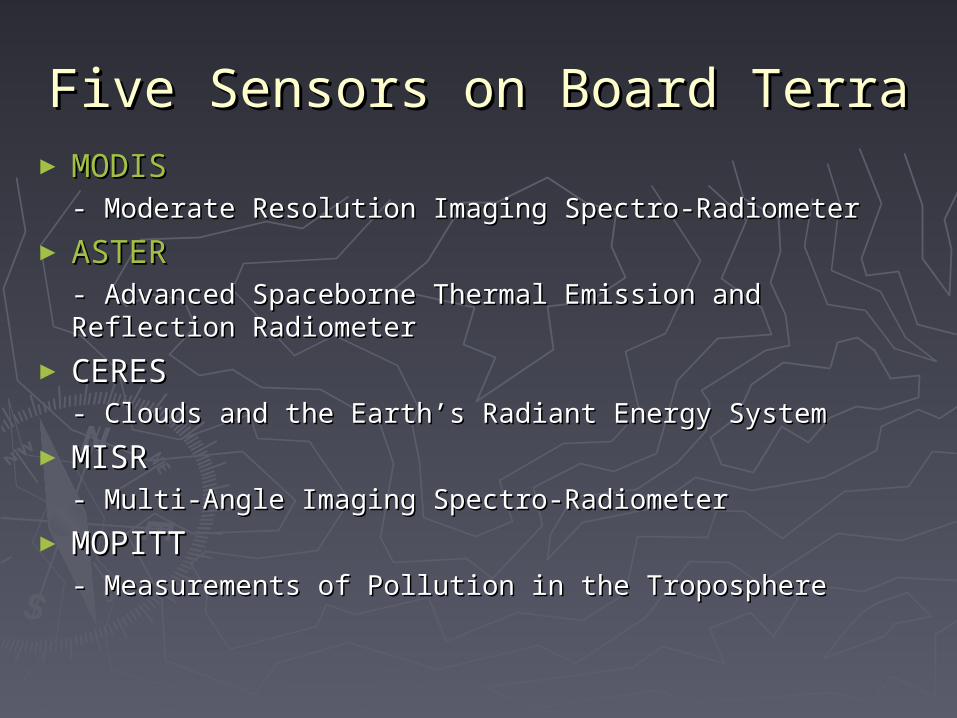
Five Sensors on Board TerraFive Sensors on Board Terra ► MODISMODIS
- Moderate Resolution Imaging Spectro-Radiometer- Moderate Resolution Imaging Spectro-Radiometer
► ASTERASTER- Advanced Spaceborne Thermal Emission and Reflection - Advanced Spaceborne Thermal Emission and Reflection RadiometerRadiometer
► CERESCERES- Clouds and the Earth’s Radiant Energy System- Clouds and the Earth’s Radiant Energy System
► MISRMISR- Multi-Angle Imaging Spectro-Radiometer- Multi-Angle Imaging Spectro-Radiometer
► MOPITTMOPITT- Measurements of Pollution in the Troposphere- Measurements of Pollution in the Troposphere
MODISMODIS
http://rst.gsfc.nasa.gov/Sect16/Sect16_7.html
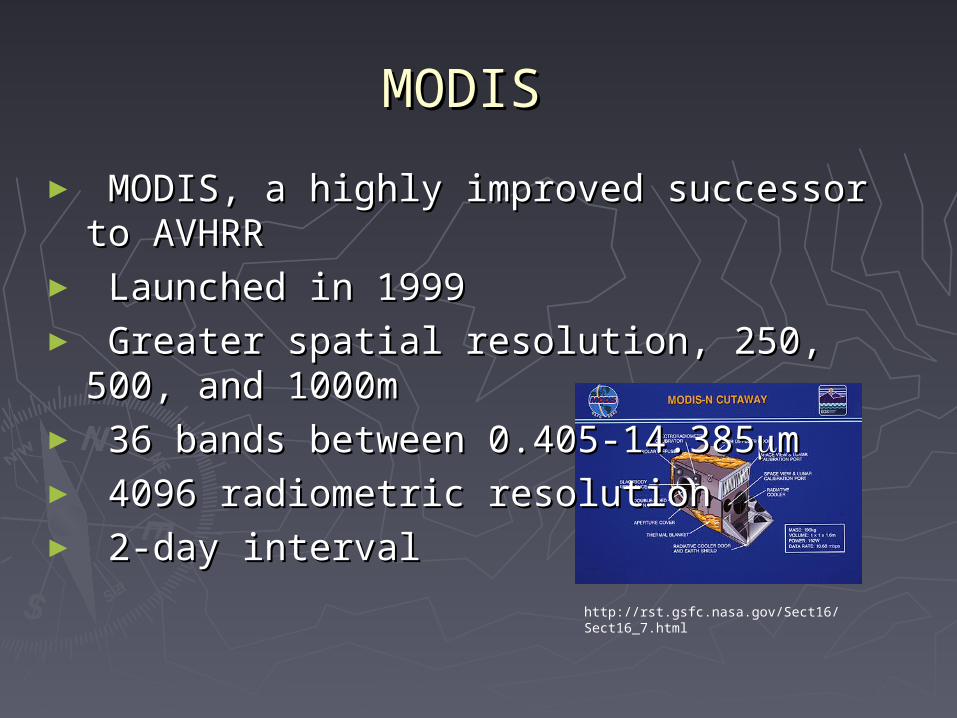
► MODIS, a highly improved successor to MODIS, a highly improved successor to AVHRRAVHRR
► Launched in 1999 Launched in 1999 ► Greater spatial resolution, 250, 500, and Greater spatial resolution, 250, 500, and
1000m1000m► 36 bands between 0.405-14.38536 bands between 0.405-14.385mm► 4096 radiometric resolution4096 radiometric resolution► 2-day interval 2-day interval

MODIS BandsMODIS Bands
► Bands 1-2Bands 1-2
0.62-0.8760.62-0.876m, 250m, Land/clouds boundariesm, 250m, Land/clouds boundaries► Bands 3-7Bands 3-7
0.459-2.1550.459-2.155m, 500m, Land/cloud propertiesm, 500m, Land/cloud properties► Bands 8-16Bands 8-16
0.405-0.8770.405-0.877m, 1000m, Ocean color m, 1000m, Ocean color /phytoplankton/biogeochemistry/phytoplankton/biogeochemistry
► Bands 17-19Bands 17-19
0.890-0.9650.890-0.965m, 1000m, Atmospheric water m, 1000m, Atmospheric water vaporvapor

MODIS Bands … MODIS Bands …
► Bands 20-23Bands 20-23
3.660-4.0803.660-4.080m, 1000m, Surface/cloud m, 1000m, Surface/cloud temperaturetemperature
► Bands 24-25Bands 24-25
4.433-4.5494.433-4.549m, 1000m, Atmospheric m, 1000m, Atmospheric temperaturetemperature
► Band 26Band 26
1.360-1.3901.360-1.390m, 1000m, Cirrus cloudsm, 1000m, Cirrus clouds► Bands 27-29Bands 27-29
6.538-8.7006.538-8.700m, 1000m, Water vaporm, 1000m, Water vapor
MODIS Bands … MODIS Bands …
► Band 30Band 30
9.580-9.8809.580-9.880m, 1000m, Ozonem, 1000m, Ozone► Bands 31-32Bands 31-32
10.780-12.27010.780-12.270m, 1000m, Surface/cloud m, 1000m, Surface/cloud temperaturetemperature
► Bands 33-36Bands 33-36
13.185-14.38513.185-14.385m, 1000m, Cloud top altitudem, 1000m, Cloud top altitude

A MODIS oblique view
One of the important EOS joint study programs is the Indian Ocean Experiment.
http://rst.gsfc.nasa.gov/Sect16/Sect16_9.html
MODISMODIS
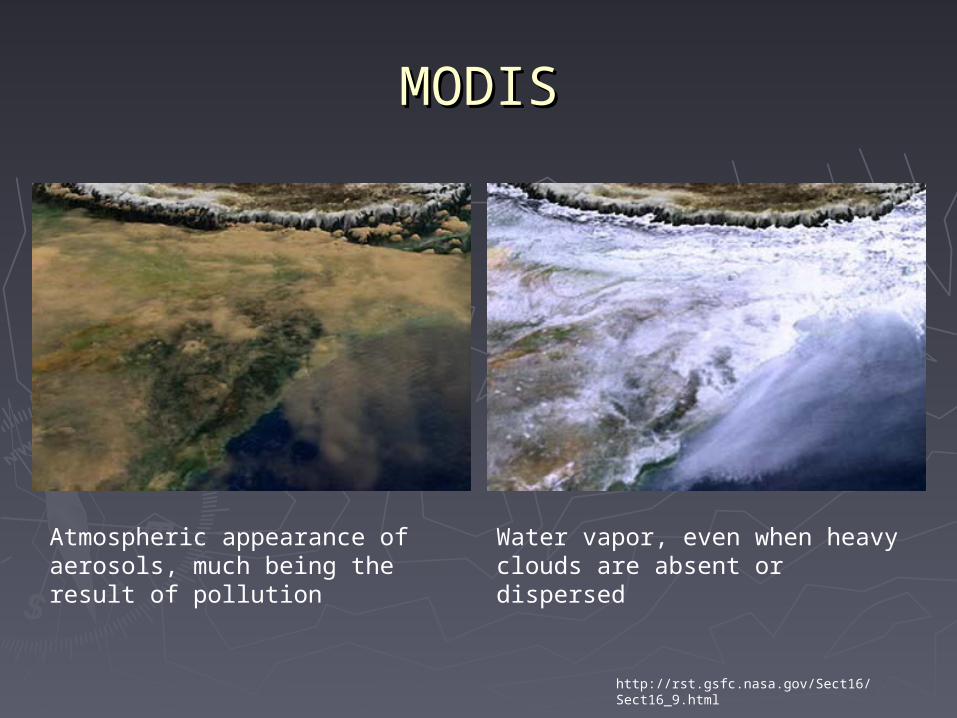
Atmospheric appearance of aerosols, much being the result of pollution
Water vapor, even when heavy clouds are absent or dispersed
http://rst.gsfc.nasa.gov/Sect16/Sect16_9.html
MODISMODIS
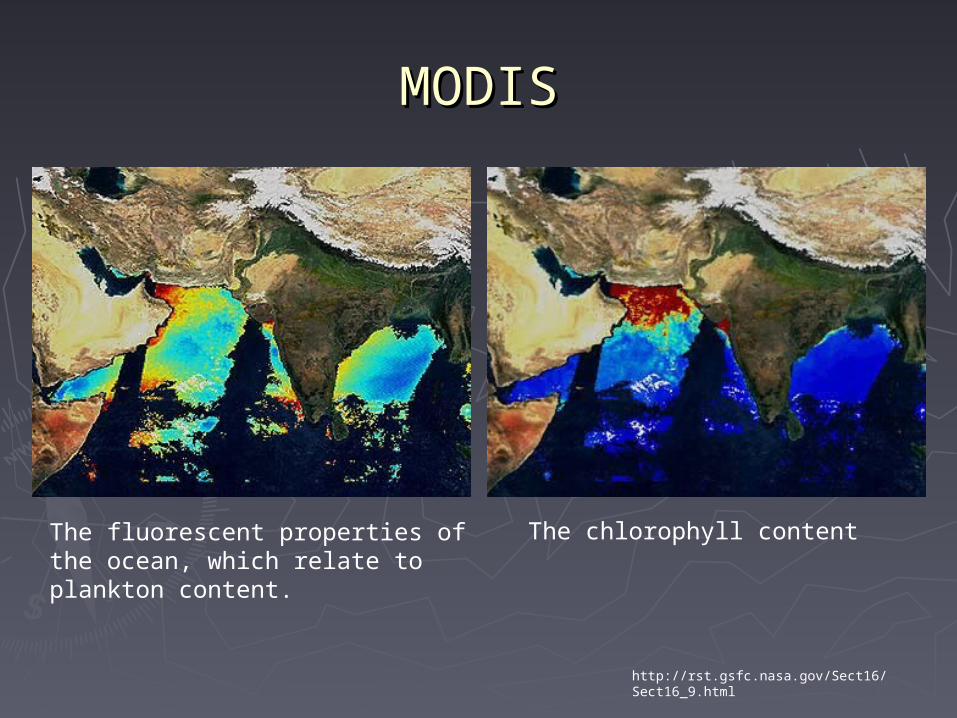
The fluorescent properties of the ocean, which relate to plankton content.
The chlorophyll content
http://rst.gsfc.nasa.gov/Sect16/Sect16_9.html
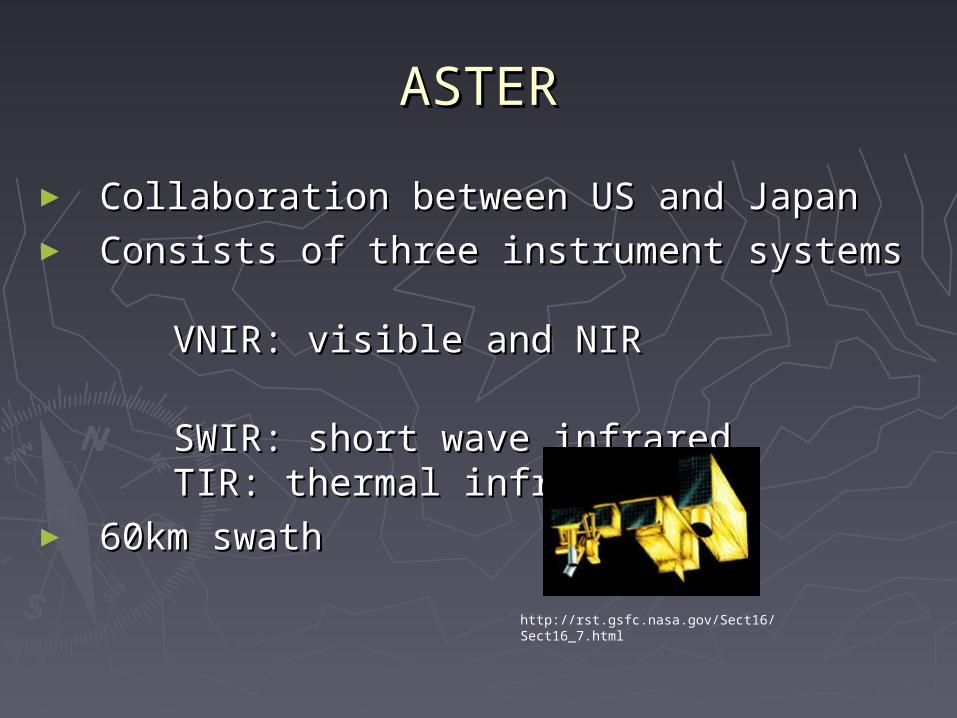
ASTERASTER
► Collaboration between US and JapanCollaboration between US and Japan► Consists of three instrument systems Consists of three instrument systems
VNIR: visible and NIR VNIR: visible and NIR
SWIR: short wave infrared SWIR: short wave infrared TIR: thermal infrared TIR: thermal infrared
► 60km swath60km swath
http://rst.gsfc.nasa.gov/Sect16/Sect16_7.html
ASTERASTER
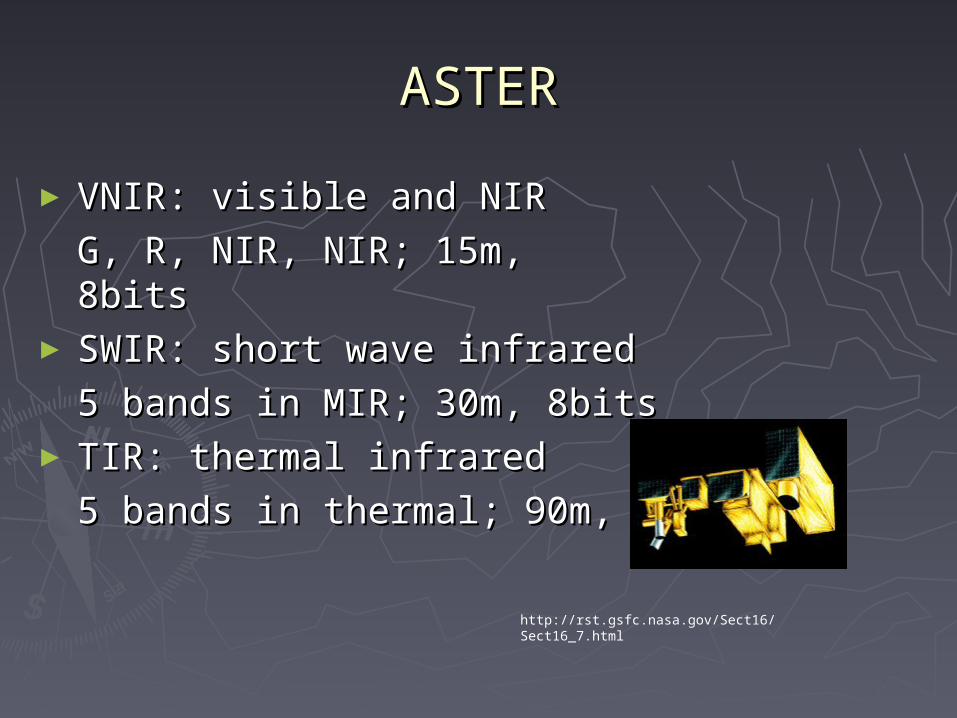
► VNIR: visible and NIR VNIR: visible and NIR
G, R, NIR, NIR; 15m, 8bits G, R, NIR, NIR; 15m, 8bits ► SWIR: short wave infrared SWIR: short wave infrared
5 bands in MIR; 30m, 8bits5 bands in MIR; 30m, 8bits► TIR: thermal infrared TIR: thermal infrared
5 bands in thermal; 90m, 12bits5 bands in thermal; 90m, 12bits
http://rst.gsfc.nasa.gov/Sect16/Sect16_7.html
ASTERASTER
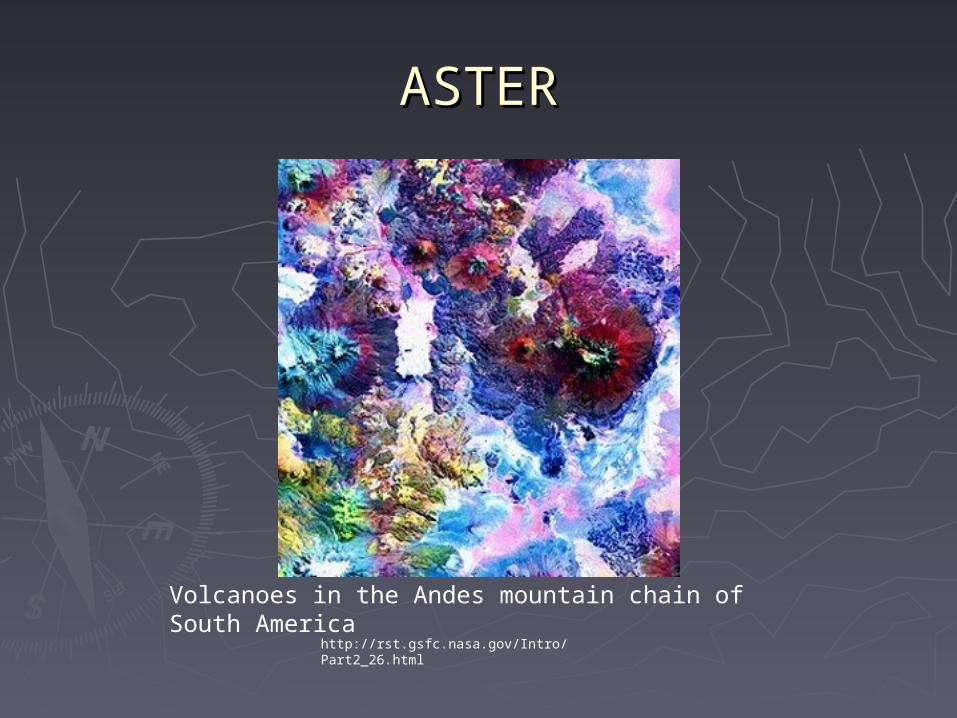
Volcanoes in the Andes mountain chain of South America
http://rst.gsfc.nasa.gov/Intro/Part2_26.html

Examples of ASTER RGB false-color composites draped over ASTER DTMs. (A) Tasman Glacier, New Zealand. The scene covers approximately 25 x 25 km (B) Llewellyn Glacier, British Columbia. Scale is 13 km across the middle of the image and 25 km from bottom ∼(foreground) to top (background). 15m resolution.
Multispectral imaging contributions to global land ice measurements from space
Kargel, J. S. and 16 others (2005) Multispectral Imaging contributions to Global Land Ice Measurements from Space, Special Issue on Terra/ ASTER Science. Remote Sensing of Environment 99, 187-219

Mapping alluvial gully erosion in Mapping alluvial gully erosion in Australia tropical riversAustralia tropical rivers
Knight, J., Spencer, J. Brooks, A. & Phinn, S. “Large-Area, High-Resolution Remote Sensing Based Mapping of Alluvial Gully Erosion in Australia’s Tropical Rivers”. Proceedings of the 5th Australian Stream Management Conference Proceedings, Albury, NSW May 2007

AquaAqua
http://aqua.nasa.gov/
AquaAqua
► Complement Terra observations by Complement Terra observations by providing data later in the dayproviding data later in the day
► Launched in 2002Launched in 2002► Designed to obtain information of weather Designed to obtain information of weather
and oceanand ocean► 6 instruments on board including MODIS6 instruments on board including MODIS
Six Sensors on Board AquaSix Sensors on Board Aqua
► MODISMODIS► CERESCERES► AMSR/EAMSR/E
- Advanced Microwave Scanning Radiometer-EOS- Advanced Microwave Scanning Radiometer-EOS
► AMSUAMSU- Advanced Microwave Sounding Unit- Advanced Microwave Sounding Unit
► AIRSAIRS- Atmospheric Infrared Sounder- Atmospheric Infrared Sounder
► HSBHSB- Humidity Sounder for Brazil- Humidity Sounder for Brazil
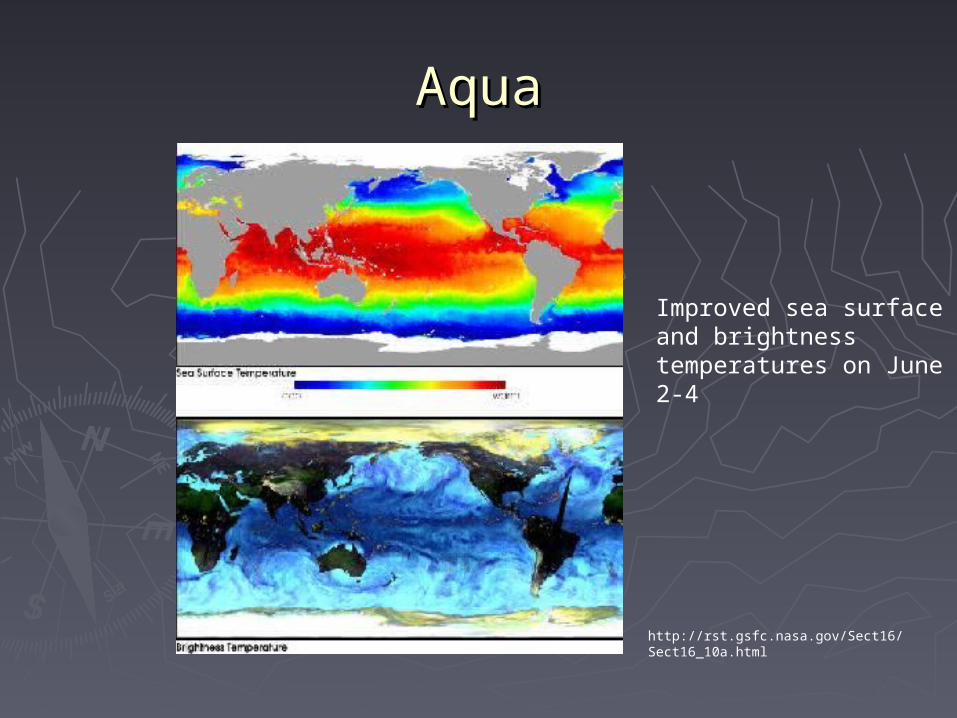
AquaAqua
Improved sea surface and brightness temperatures on June 2-4
http://rst.gsfc.nasa.gov/Sect16/Sect16_10a.html
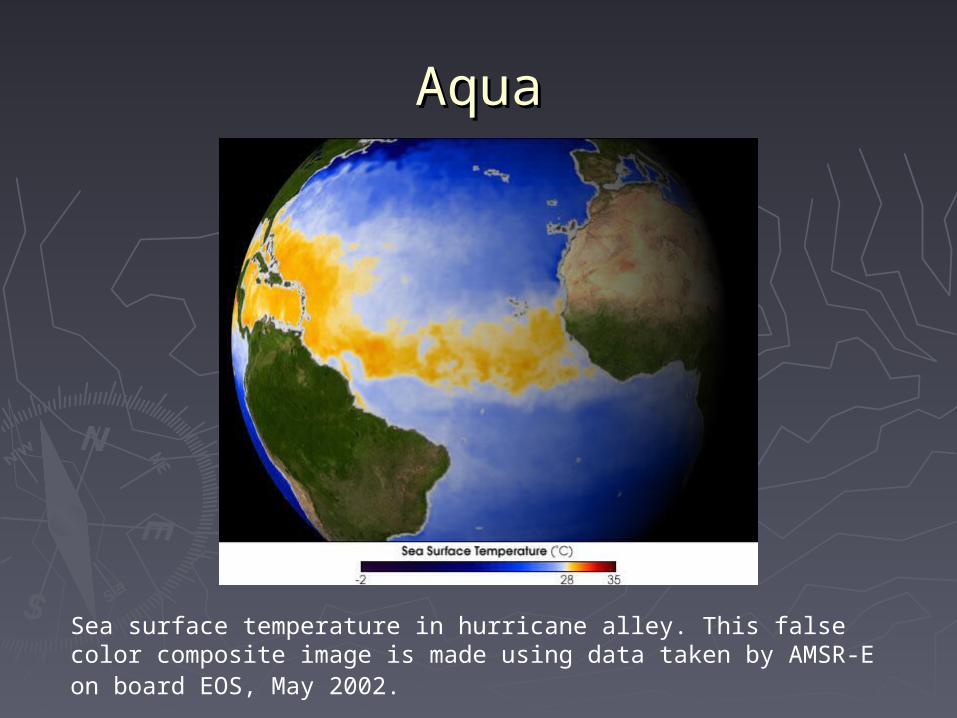
AquaAqua
Sea surface temperature in hurricane alley. This false color composite image is made using data taken by AMSR-E on board EOS, May 2002.

6. SeaWiFS6. SeaWiFS
► Sea-viewing Wide-Field-of-View SensorSea-viewing Wide-Field-of-View Sensor► NASA contracted with Orbital Science Corp. NASA contracted with Orbital Science Corp.
launched on OrbView-2launched on OrbView-2► Designed to study ocean biogeochemistry Designed to study ocean biogeochemistry
http://www.crisp.nus.edu.sg/~research/tutorial/orbview2.htm

6. SeaWiFS6. SeaWiFS
► 8 bands between 0.402-0.8858 bands between 0.402-0.885mm► 1.1km spatial resolution1.1km spatial resolution► 2800km swath2800km swath
Chlorphyll concentrations (in red, yellow, and orange colors) on a near global scale during September, 1997. http://rst.gsfc.nasa.gov/Intro/Part2_26.html
7. SPOT 47. SPOT 4
► Launched on Mar 23, 1998Launched on Mar 23, 1998► High Resolution Visible and Infrared (HRVIR)High Resolution Visible and Infrared (HRVIR)► An additional mid-infrared 1.58-1.75An additional mid-infrared 1.58-1.75m for m for
vegetation, mineral, and soil moisture vegetation, mineral, and soil moisture monitoringmonitoring
► Replace the pan band with a red band that Replace the pan band with a red band that produces both 10m black/white and 20m XS produces both 10m black/white and 20m XS datadata
► A wide IFOV Vegetation Monitoring Instrument A wide IFOV Vegetation Monitoring Instrument with 1km resolution, 2250km swath, B, R, NIR, with 1km resolution, 2250km swath, B, R, NIR, MIR bands MIR bands

ReadingsReadings
► Chapter 6Chapter 6
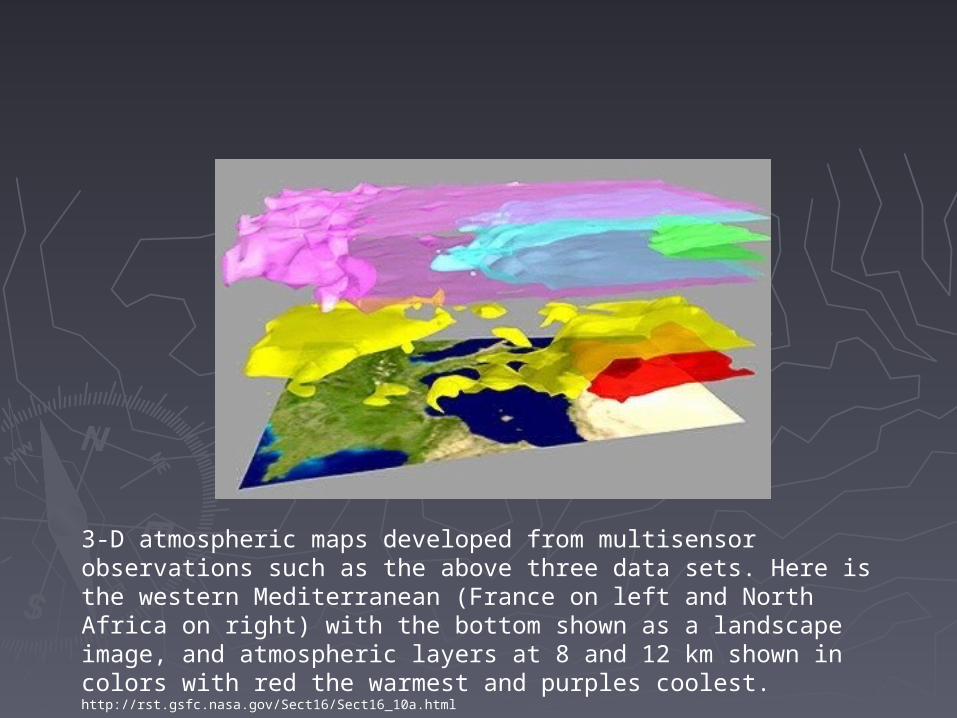
3-D atmospheric maps developed from multisensor observations such as the above three data sets. Here is the western Mediterranean (France on left and North Africa on right) with the bottom shown as a landscape image, and atmospheric layers at 8 and 12 km shown in colors with red the warmest and purples coolest. http://rst.gsfc.nasa.gov/Sect16/Sect16_10a.html