Embed Size (px)
Citation preview
Source of Acquisition NASA Goddard Space Flight Center
Remote sensing of spectral aerosol properties: A classroom experience
Robert C. Rachel T. Pinke?
Science Systems and Applications Inc., Lanham MD
Laboratory for Atmospheres, NASNGoddard Space Flight Center, Greenbelt MD
Department of Atmospheric and Oceanic Science, University of Maryland, College Park MD
2
3
Corresponding author's address: Mr. Robert Levy 301-614-6123 (voice) SSAI 30 1-6 14-6307 (fax> Code 6 13.2 NASNGoddard Space Flight Center Greenbelt MD 20771 Email: levy@climate. gsfc.nasa. gov
Revised for publication, Section "Education", BAMS
July 2006
1
https://ntrs.nasa.gov/search.jsp?R=20070014900 2018-08-08T14:10:22+00:00Z
Capsule
This paper describes a graduate level class project designed to develop understanding of aerosol
optical properties and methods for their retrieval from satellite observations.
Abstract
Bridging the gap between current research and the classroom is a major challenge to today’s
instructor, especially in the sciences where progress happens quickly. NASA Goddard Space Flight
Center and the University of Maryland teamed up in designing a graduate class project intended to
provide a hands-on introduction to the physical basis for the retrieval of aerosol properties from state-of-
the-art MODIS observations. Students learned to recognize spectral signatures of atmospheric aerosols
and to perform spectral inversions. They became acquainted with the operational MODIS aerosol
retrieval algorithm over oceans, and methods for its evaluation, including comparisons with ground-
based AERONET sun-photometer data.
2
1. Introduction
The direct and indirect radiative effects of aerosols on climate and climate change remain a
source of uncertainty in climate research (IPCC, 2001). Aerosols (also known as particulate matter
(PM)) play important roles in precipitation processes, reduced visibility, and human morbidity (Samet et
al., 2000). Before the satellite era, information on aerosols came from limited surface based
observations, which are not sufficient to describe their spatial and temporal variability of aerosols.
With their vantage high above the earth, satellite observations of reflected and emitted radiances
are increasingly being used to monitor aerosols and their interactions within the climate system (King
and Kaufman, 2000). A highly successful project is the NASA’s Moderate Imaging Spectrometer
(MODIS) (Salomonson et al., 1989), which has been observing from aboard the Terra (since 2000) and
Aqua (since 2002) satellite platforms. By observing spectral radiances in 36 channels (from 0.412 to
14.2 pm - http://modis.gsfc.nasa.gov) and at resolution ranging from 250 m to 1 lun, MODIS is highly
suitable for deriving aerosol properties over the oceans (Tant-6 et al., 1996; Tam6 et al., 1997). The
MODIS polar geo-synchronous orbit is such that most of the globe is covered each day, and completely
covered every two days, thus providing comprehensive observations. Since the MODIS data are well
characterized and easy to access, they are suitable for introducing students to the physics of remote
sensing.
As part of a graduate course in Remote Sensing, students used MODIS data and focused on the
following:
Understanding how aerosols interact with reflected solar radiation.
3
m
over oceans.
season.
Obtaining working knowledge of inversion techniques for retrieving aerosol properties
Implementing the MODIS algorithm to retrieve aerosol properties fiom observations.
Contrasting aerosol properties from different sites, and to relate them to geography and
Evaluating satellite retrievals in the context of ground based aerosol measurements.
This paper reviews the basic physics of remote sensing of aerosols and describes selected
findings and lessons learned by the students. Data, codes, and detailed instructions needed to perform
the exercises are available at:
http://www.atmos.knd.edu/-levy/MODIS-Aerosol-Project
2. Remote sensing of aerosols over the ocean from MODIS and AIZRONET
Aerosols are suspended liquids or solids in the atmosphere, ranging in size from a few molecules
to tens of micrometers. Aerosols having radii of between about 0.1 pm and 20 pm are of primary
interest, where 1.0 pm denotes separation between “fine” and “coarse” Modes. The aerosol optical
depth (AOD or z) defines the integral of the light extinction by aerosols within an atrnospheric column.
Spectral dependence of z is related to the aerosol size distribution (Eck et al, 1999), and the Fine Mode
Weighting ( F M W or q) describes the contribution of the fine aerosols to the total z at a specific
wavelength (A). By convention, z and q are reported for A=0.55 pm.
Sun photometers have been in operation for many years and when calibrated properly, provide
accurate measurements of spectral z (-€unction of A, i.e. zd. By accounting for known effects of
molecular scattering (Rayleigh scattering) and gas absorption, sun-photometer measurements of spectral
4
direct beam extinction are directly related to z,as expressed by the Be er extinction law. The
current standard for
(Holben et al., 1998), pro
wavelengths (Remer et et al., 2001; Eck et al., 2003) at over a hundr
Through measurements of spectral diffuse sky radiation, AERONET also provides estimates of aerosol
size distribution (Dubovik and King, 2000).
Whitby (1978) showed that a series of log-normal size distributions accurately describe aerosol
sizes. In most situations, aerosols that interact with solar radiation can be modeled as a weighted
combination of two log-normal modes, one for the fine and one for the coarse (Wang and Gordon, 1994)
Theoretically, using radiative transfer codes, one can pre-compute a look-up. table (LUT) of simulated
satellite-observed reflectance (normalized radiance), arising from a variety of aerosol conditions for a
subset of realistic geometries (satellite and sun angles) and total aerosol loadings z (Tanr6 et al., 1997).
For MODIS, there are four choices of fine modes and five choices of coarse modes, simulated for 2304
solarhatellite angle combinations and seven values of IC indexed by 0.55 pm (Levy et al., 2003; Remer et
al., 2005). Note that the actual spectral reflectance for each mode includes contributions from the
surface and the molecular atmosphere (Rayleigh scattering).
MODIS over-ocean aero 1 properties (known as ‘Level 2’ products) are retrieved at 10 km x 10
Ism resolution, meaning that the spectral reflectance values used for the retrieval must be representative ,
ibes how the high resolution (250 and 500 m resolution)
d sediment masking), in order to
vel 2’ spectral reflectance arises
from the radiative effects of a combination of fine and coarse modes within the atmospheric column.
5
The total z is set to fit the observed reflectance at one wavelength, and rq is calculated to match the
spectral dependence of z,. Incorrect values of q lead to larger spectral ‘fitting errors’. A separate
solution is found for each of the twenty combinations of fine and coarse modes, so that the ’best’
solution is the one combination of fine (‘f’) and coarse (‘c’) modes with the least fitting error. The
spectral AOD (2;3 and are results of the inversion.
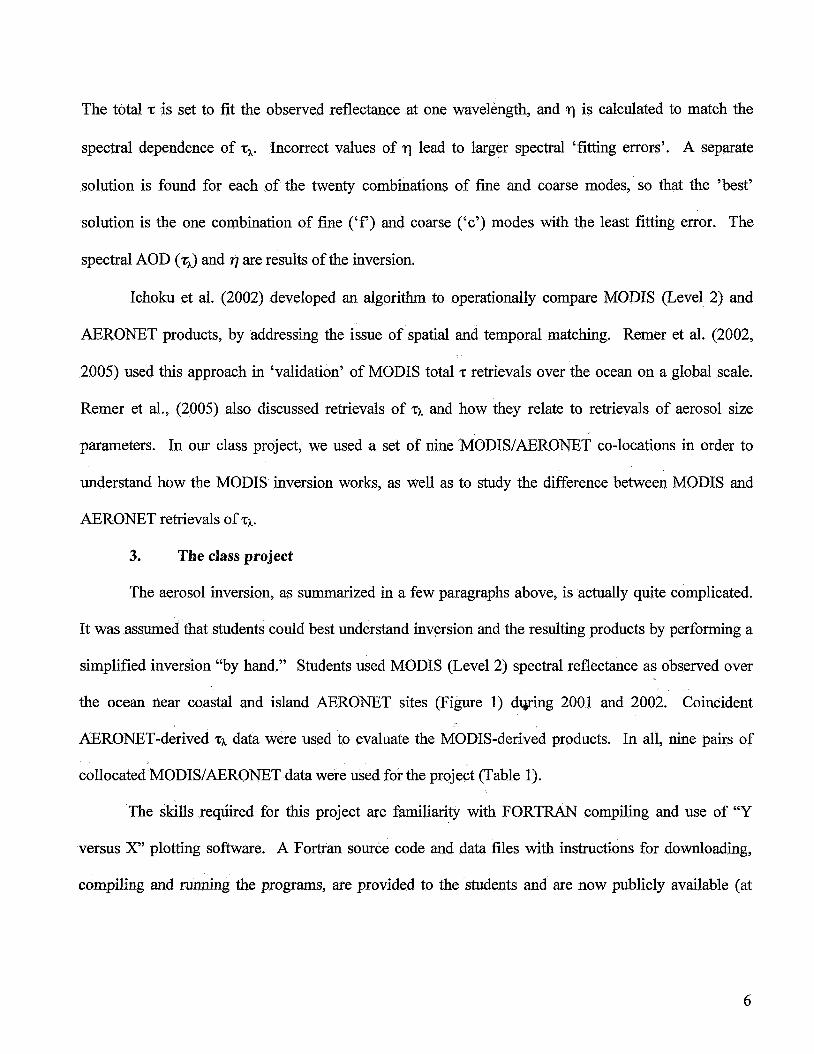
Ichoku et al. (2002) developed an algorithm to operationally compare MODIS (Level 2) and
AERONET products, by addressing the issue of spatial and temporal matching. Remer et al. (2002,
2005) used this approach in ‘validation’ of MODIS total z retrievals over the ocean on a global scale.
Remer et al., (2005) also discussed retrievals of zh and how they relate to retrievals of aerosol size
parameters. In our class project, we used a set of nine MODIWAERONET co-locations in order to
understand how the MODIS inversion works, as well as to study the difference between MODIS and
AERONET retrievals of zh.
3. The class project
The aerosol inversion, as summarized in a few paragraphs above, is actually quite complicated.
It was assumed that students could best understand inversion and the resulting products by performing a
simplified inversion “by hand.’’ Students used MODIS (Level 2) spectral reflectance as observed over
the ocean near coastal and island AERONET sites (Figure 1) dqring 2001 and 2002. Coincident
AERONET-derived q data were used to evaluate the MODIS-derived products. In all, nine pairs of
collocated MODIS/AERONET data were used for the project (Table 1).
The skills required for this project are familiarity with FORTRAN compiling and use of “Y
versus X plotting software. A Fortran source code and data files with instructions for downloading,
compiling and d n g the programs, are provided to the students and are now publicly available (at
6
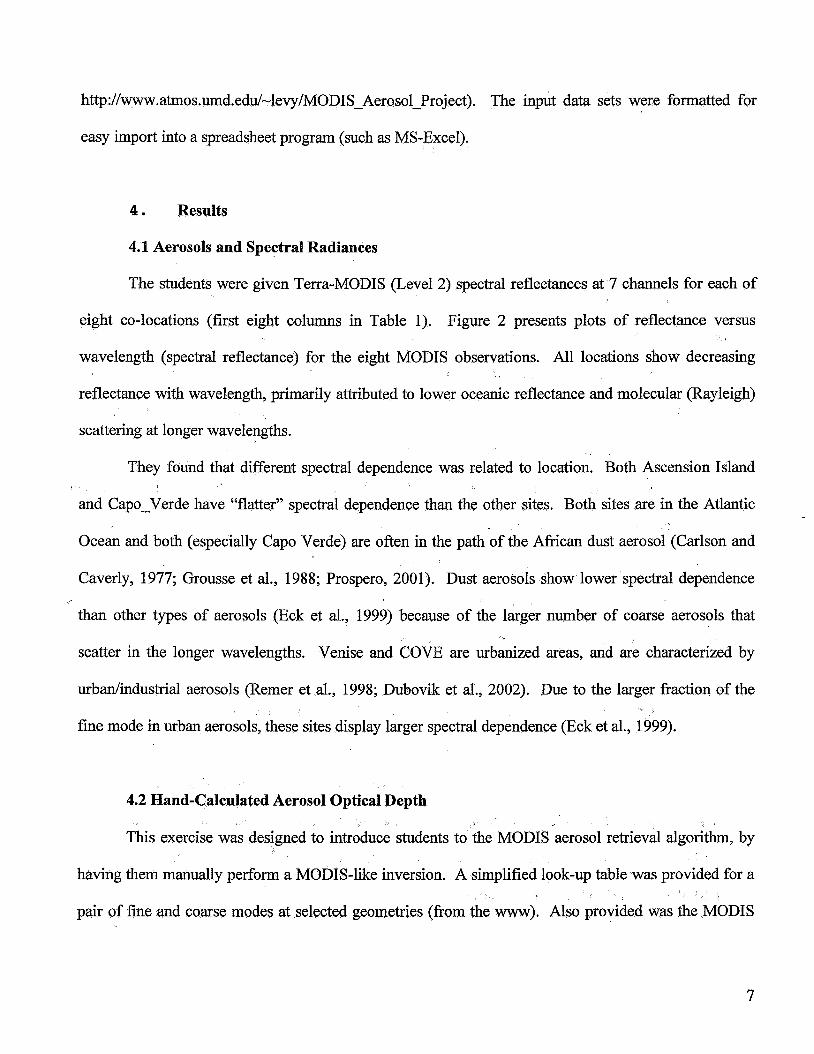
http://m.atmos.umd.edu/-levy/MODIS-Aerasol-Project). The input data sets were formatted for
easy import into a spreadsheet program (such as MS-Excel).
4 . Results
4.1 Aerosols and Spectral Radiances
The students were given Terra-MODIS (Level 2) spectral reflectances at 7 channels for each of
eight co-locations (first eight columns in Table 1). Figure 2 presents plots of reflectance versus
wavelength (spectral reflectance) for the eight MODIS observations. All locations show decreasing
reflectance with wavelength, primarily attributed to lower oceanic reflectance and molecular (Rayleigh)
scattering at longer wavelengths.
They found that different spectral dependence was related to location. Both Ascension Island
and Capo-Verde have “flatter” spectral dependence than the other sites. Both sites are in the Atlantic
Ocean and both (especially Capo Verde) are often in the path of the African dust aerosol (Carlson and
Caverly, 1977; Grousse et al., 1988; Prospero, 2001). Dust aerosols show lower spectral dependence
than other types of aerosols (Eck et al., 1999) because of the larger number of coarse aerosols that
scatter in the longer wavelengths. Venise and COVE are urbanized areas, and are characterized by
urbadindustrial aerosols (Remer et al., 1998; Dubovik et al., 2002). Due to the larger fiaction of the
fine mode in urban aerosols, these sites display larger spectral dependence (Eck et al., 1999).
4.2 Hand-Calculated Aerosol Optical Depth
This exercise was designed to introduce students to the MODIS aerosol retrieval algorithm, by
having them manually perform a MODIS-like inversion. A simplified look-up table was provided for a
pair of fine and coarse modes at selected geometries (from the www). Also provided was the MODIS
7
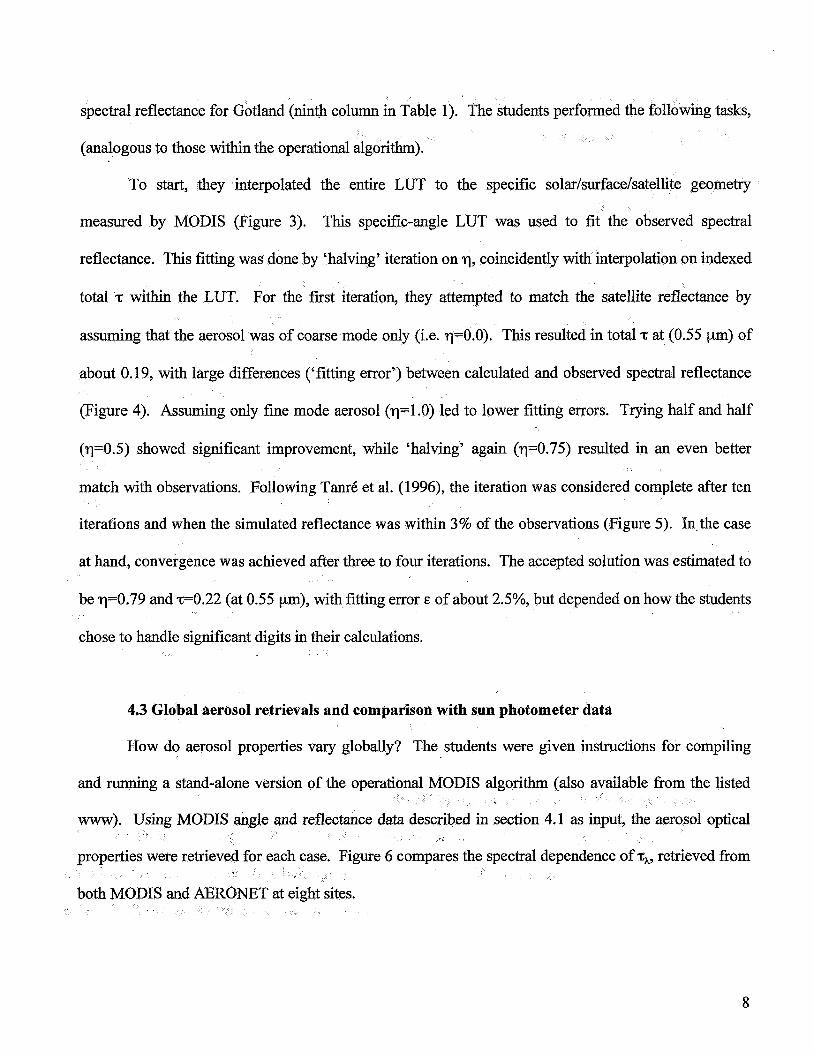
spectral reflectance for Gotland (ninth column in Table 1). The students performed the following
(analogous to those within the operational algorithm).
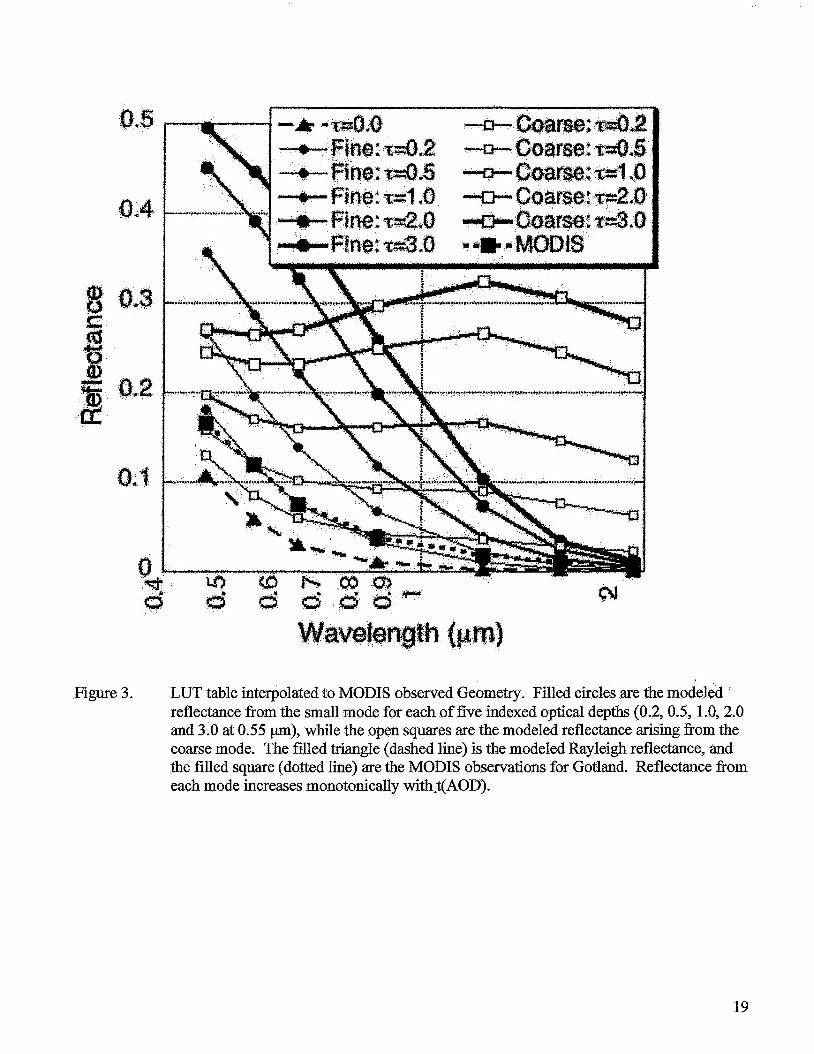
To start, they interpolated the entire LUT to the specific solar/surface/satellite geometry
measured by MODIS (Figure 3). This specific-angle LUT was used to fit the observed spectral
reflectance. This fitting was done by ‘halving’ iteration on q, coincidently with interpolation on indexed
total t within the LUT. For the first iteration, they attempted to match the satellite reflectance by
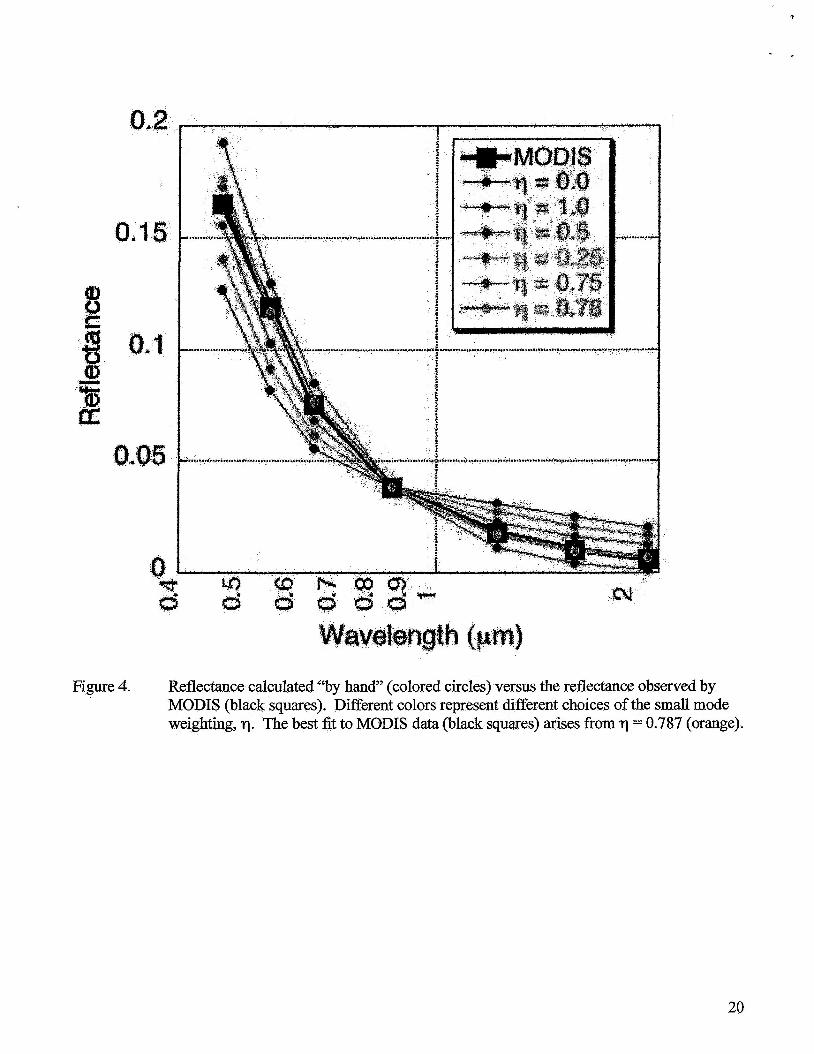
assuming that the aerosol was of coarse mode only (i.e. q=O.O). This resulted in total t at (0.55 pm) of
about 0.19, with large differences (‘fitting error’) between calculated and observed spectral reflectance
(Figure 4). Assuming only fme mode aerosol (q=l.O) led to lower fitting errors. Trying half and half
(q=0.5) showed significant improvement, while ‘halving’ again (q=0.75) resulted in an even better
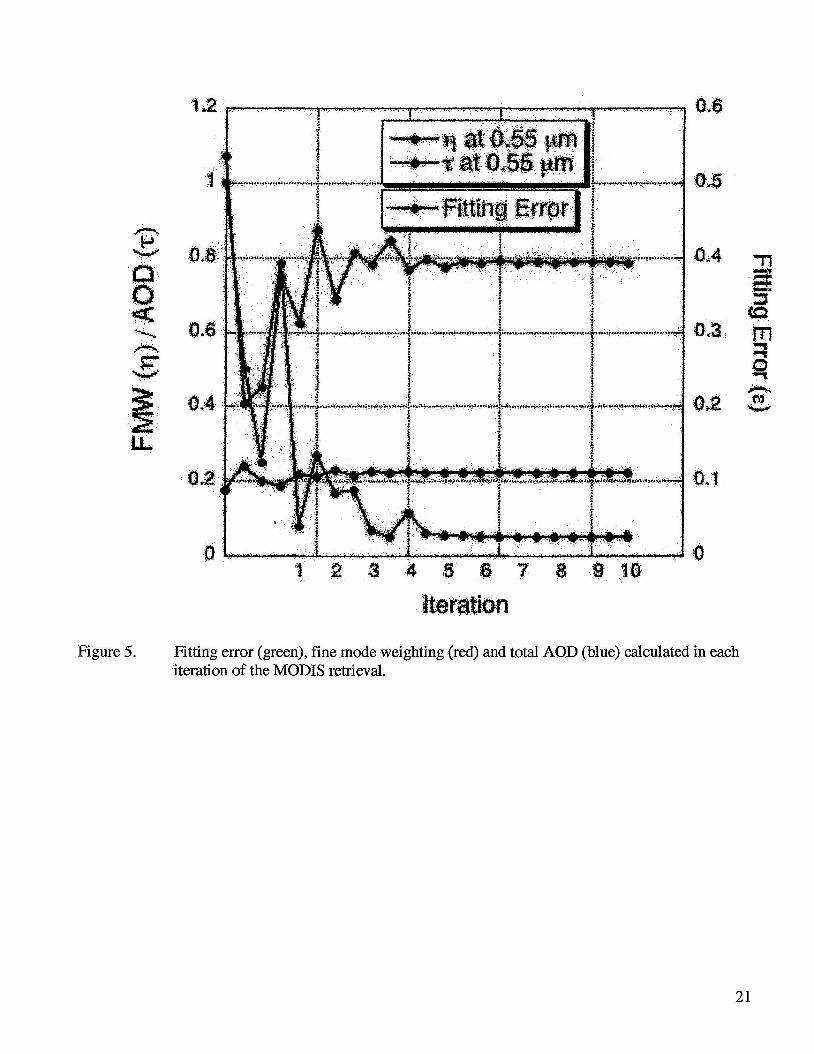
match with observations. Following Tanr6 et al. (1996), the iteration was considered complete after ten
iterations and when the simulated reflectance was within 3% of the observations (Figure 5). In,the case
at hand, convergence was achieved after three to four iterations. The accepted solution was estimated to
be q=0.79 and ~ 0 . 2 2 (at 0.55 pm), with fitting error E of about 2.5%’ but depended on how the students
chose to handle significant digits in their calculations.
4.3 Global aerosol retrievals and comparison with sun photometer data
How do aerosol properties vary globally? The students were given instructions for compiling
and running a stand-alone version of the operational MODIS algorithm (also available from the listed
www). UsingMOD e and reflectance
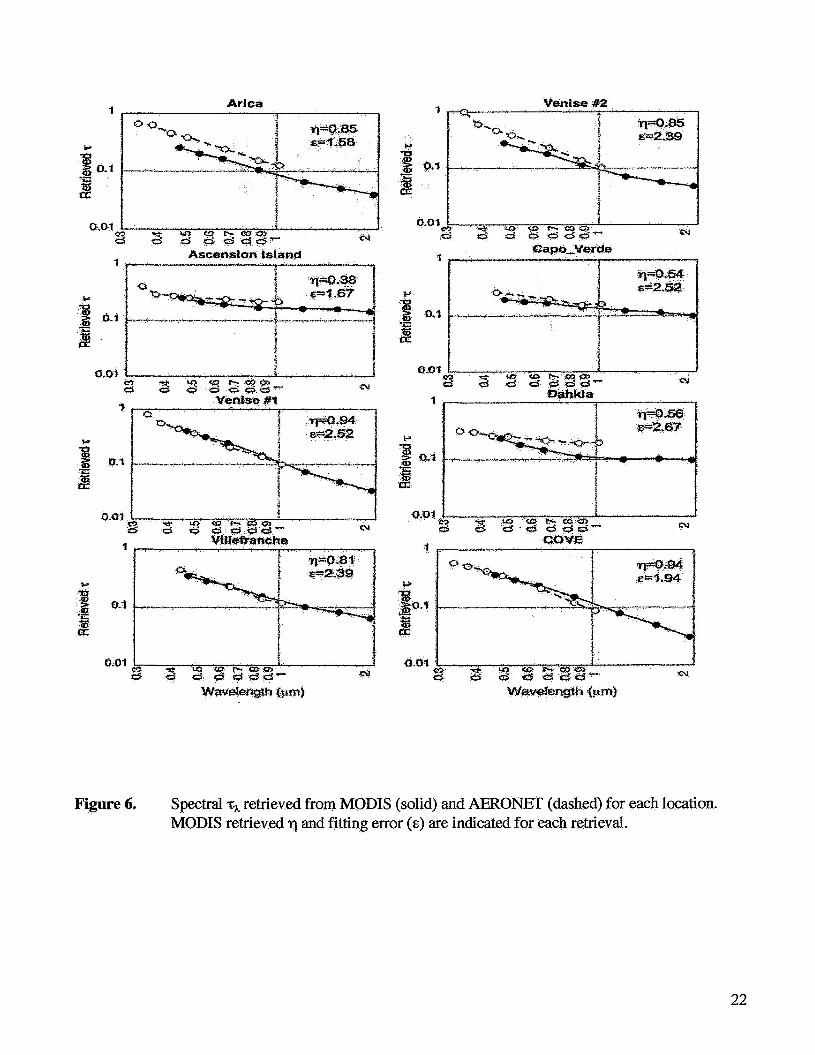
Figure 6 compares the spectral dependence of th, retrieved from
8
The spectral dependence of z was seen to resemble the o ed spectral dependence of the
reflectance for each location.
expected, the spectral dependence of z,is smaller (flatter) for
Island, Capo Verde), than for more polluted (urbdindustrial o
Venice). Mica shows a combination of small (presumably smoke) and larger sea salt aerosols. The
retrieval of q mirrors the spectral dependence of zk, with the larger particles over Ascension Island and
Capo Verde, and the smaller particles over COVE and Venise. These results are consistent with what is
known about aerosol characteristics in these regions.
Figure 6 shows good visual agreements for Venise #1, Villefranche and COVE. These three
sites are from regions known to be dominated by fme mode, aerosols and the spherical aerosol
assumption (Me theory) is appropriate. On the other hand, for regions dominated by larger non-
spherical dust particles, the differences between the two products are considerable (e.g., at Ascension
Island and Dahkla). This implies that the aerosol models employed in the MODIS algorithm are not
sufficient for describing the ambient aerosol properties at these sites (e.g. Levy et al., 2003).
Interestingly, 'the differences between the MODIS and AERONET retrievals for regions with large
aerosols tend to increase with increasing wavelength, while those for the regions with small aerosols
tend to increase with decreasing wavelength.
5. Summary and Conclusions
The objective of this project was to expose graduate students to current research in aerosol
remote sensing. The students learned about the spectral dependence of aerosol scattering and how it is
exploited in the MODIS aerosol retrieval algorithm to estimate aerosol optical properties.
9

Due to the importance of aerosols on atmospheric radiative processes and their climatic
implications, the project is relevant to interdisciplinary problems. Moreover, MODIS represents the
state of the art science and technology for remote sensing of several earth-atmosphere processes.
MODIS (as well as other satellite) data are free, easily available, and increasingly useful in many
applications, so there is a great need to learn how to process such data and interpret them in new and
exciting ways. Projects such as this one provide opportunity for students and young scientists to become
familim with (and less apprehensive of) datasets of this magnitude.
Acknowledgements: At the time of project development, Robert Levy was a student in Rachel
Pinker’s Remote Sensing class (MET0624) in the Department of Atmospheric and Oceanic Science,
University of Maryland. Five other students performed the tasks of this project (Hiroko Kato, Myeong-
Jae Jeong, Ruiming Chen, Fan Lei and Hengmao Wang). Their figures have been re-created here for
consistency. We thank Yoram Kaufinan and Lorraine Remer for the idea of creating this project.
10
References:
Carlson, T. and R Caverly, 1977: Rad S.
Transactions-American Geophysical Union, 58 (6): 555-555.
Dubovik, 0. and M. D. King, 2000: A flexible inversion algorithm
properties fiom Sun and sky radiance measurements. J. Geophys. Res.-Atmos., 105, D16,20673-20696.
Dubovik, O., B. Holben, T. F. Eck, A. Smirnov, Y. J. Kaufman, M. D. King, D. Tanre and I.
Slutsker, 2002: Variability of absorption and optical properties of key aerosol types observed in
worldwide locations. J. Atmos. Sci., 59,3, 590-608. ,
Eck, T. F., B. N Holben, J. S. Reid, 0. Dubovik, A. Smirnov, N. T. O'Neill, I. Slutsker and S.
Kinne, 1999: Wavelength dependence of the optical depth of biomass burning, urban and desert dust
aerosols, J. Geophys. Res.-Atmosy, '1 04, D8,3 1,333-3 1,349. '
Eck, T. F., and Coauthors, 2003: Variability of biomass burning aerosol optical characteristics in
southern Africa during the SAFARI 2000 dry season campaign and a comparison of single scattering
albedo estimate from radiometric measurements, J. Geophys. Res., 108(D13), 8477,
doi:lO. 1029/2002JD002321.
Intergovernmental Panel on Climate Change, 2001 : Climate Change 2001: the scientiJic basis,
Cambridge Univ. Press, New York,.
11
Grousse, F. E., B. Hamelin, P. E. Biscaye, J. Prospero, 1988: Trans-Atlantic transport of
aerosols-evidence from anthropogenic PB isotope signatures. Chemical Geology, 70 (1 -2): 196- 196.
Holben, B. N., and Coauthors, 2001: An emerging ground-based aerosol climatology: Aerosol
Optical Depth from AERONET. J. Geophys. Res., Vol. 106, No. D11, 12,067-12,097.
Ichoku, C., D. A. Chu, S. Mattoo, Y. J. Kaufman, L. A. Remer, D. Tanre, I. Slutsker, and B. N.
Holben, 2002: A spatio-temporal approach for global validation and analysis of MODIS aerosol
products. Geophys. Res. Lett., 29, doi: 10.1029/2001 GLO13206.
Kaufman, Y. J., D.
system. Nature, Vol. 419,2
I?anrk , and 0. Boucher, 2002: A sate
5-223.
ite view of aerosols in the climate
Levy, R. C., L. A. Remer, D. Tm6, Y. J. Kaufman, C. Ichoku, B. N. Holben, J. M. Livingston,
P. B. Russell and H. Maring, 2003: Evaluation of the MODIS retrievals of dust aerosol over the ocean
during PRIDE. J. Geophys. Res., 108 (D14), 10.1029/2002JD002460 ,
Pinker, R. T., G. Pandithurai, B. N. Holben, 0. Dubovik, and T. 0. Aro, 2001: A dust outbreak
episode in sub-Sahel West Africa, J. Geophys. Res., 106, D 19,22 923 - 22 930.
Prospero J. M, 200 1 : African dust in America. EOTIMES 46 (1 1): 24-27.
12
Remer, L. A., and Coauthors, 2002: Validation of MODIS aerosol retrieval over ocean. Geophys.
Res. Lett., 29, 10.1029/2001GL013204.
Remer, L.A. and Coauthors, 2005: The MODIS aerosol algorithm, products and validation. J.
Atmos. Sci., 62,947-973.
Tanre *, D., M. Herman, and Y. J. Kaufman, 1996: Information on aerosol size distribution
contained in solar reflected spectral radiances. J. Geophys. Res., 101 (D14), 19 043-19 060.
Tan& *, D., Y. J. Kaufman, M. Herman, and S . Mattoo, 1997: Remote sensing of aerosol properties
over oceans using the MODIS/EOS spectral radiances. J. Geophys. Res., 102 (D14), 16 971-16 988.
Wang M. and H. R. Gordon, 1994: Radiance reflected from the ocean-atmosphere system:
Synthesis from individual components of the aerosols size distribution, Applied Optics, 33,7088-7095.
Whitby, K. Y, 1978: The physical characteristics of sulfur aerosols, Atmos. Environ., 12, 135-
159.
13
List of Tables
Table 1. MODIWAERONET co-locations used for this project. The first eight (normal font) are
used in the MODIS/AERONET comparisons. The ninth site (in italic) was used for the
manual inversion.
14
List of Figures
Figure 1.
Figure 2.
Figure 3.
Figure 4.
Figure 5.
Figure 6.
Map of AERONET sites selected for this study.
Plot of reflectance vs. wavelength (spectral reflectance) for MODIS observations.
Data used for the later “manual” retrieval (Gotland) are plotted with squares.
LUT table interpolated to MODIS observed Geometry. Filled circles are the modeled
reflectance from the small mode for each of five indexed optical depths (0.2,0.5, 1 .O, 2.0
and 3.0 at 0.55 pm), while the open squares are the modeled reflectance arising from the
coarse mode. The fdled triangle (dashed line) is the modeled Rayleigh refl ectance, and
the filled square (dotted line) are the MODIS observations for Gotland. Reflectance from
each mode increases monotonically with ‘G (AOD).
Reflectance calculated “by hand” (colored circles) versus the reflectance observed by
MODIS (black squares). Different colors represent different choices of the small mode
weighting, q. The best fit to MODIS data (black squares) arises from q = 0.787 (orange).
Fitting error (green), fine mode weighting (red) and aerosol optical depth (blue)
calculated at each iteration of the MODIS retrieval.
Spectral 5retrieved by MODIS (solid) and AERONET (dashed) for each location.
MODIS retrieved q and fitting error are indicated on each plot.
15
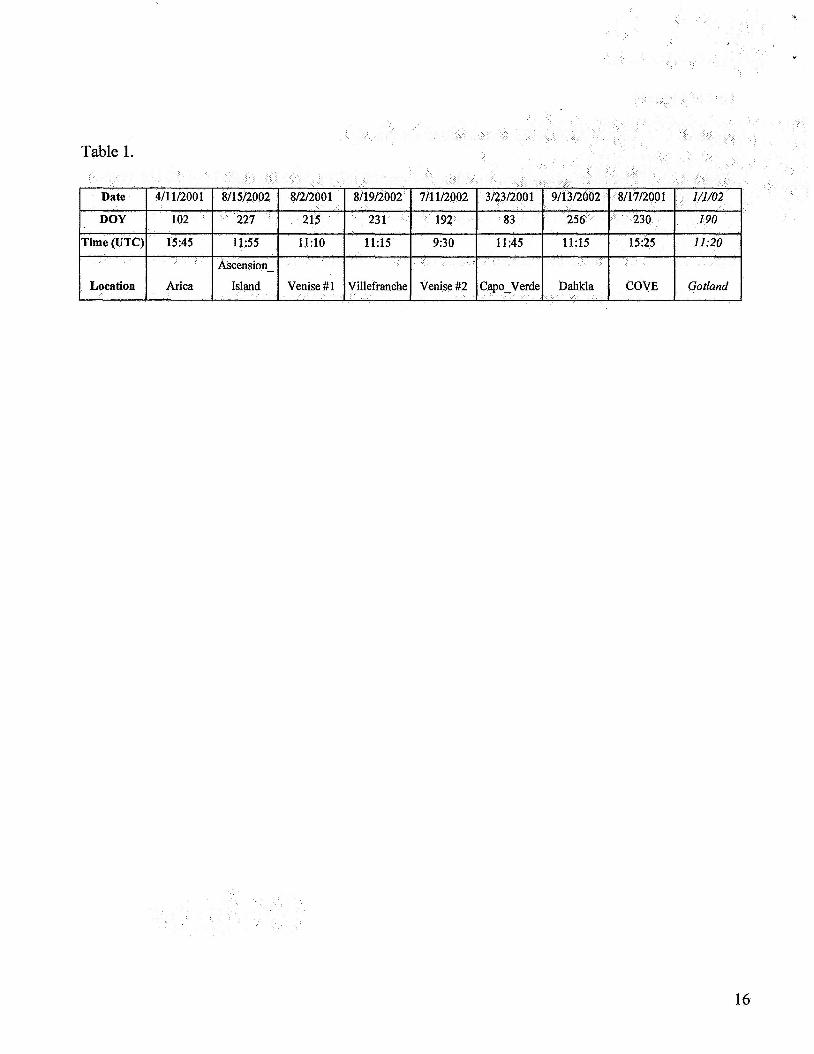
Table 1.
16

Figure 1. Map of AERONET sites selected for this study.
17
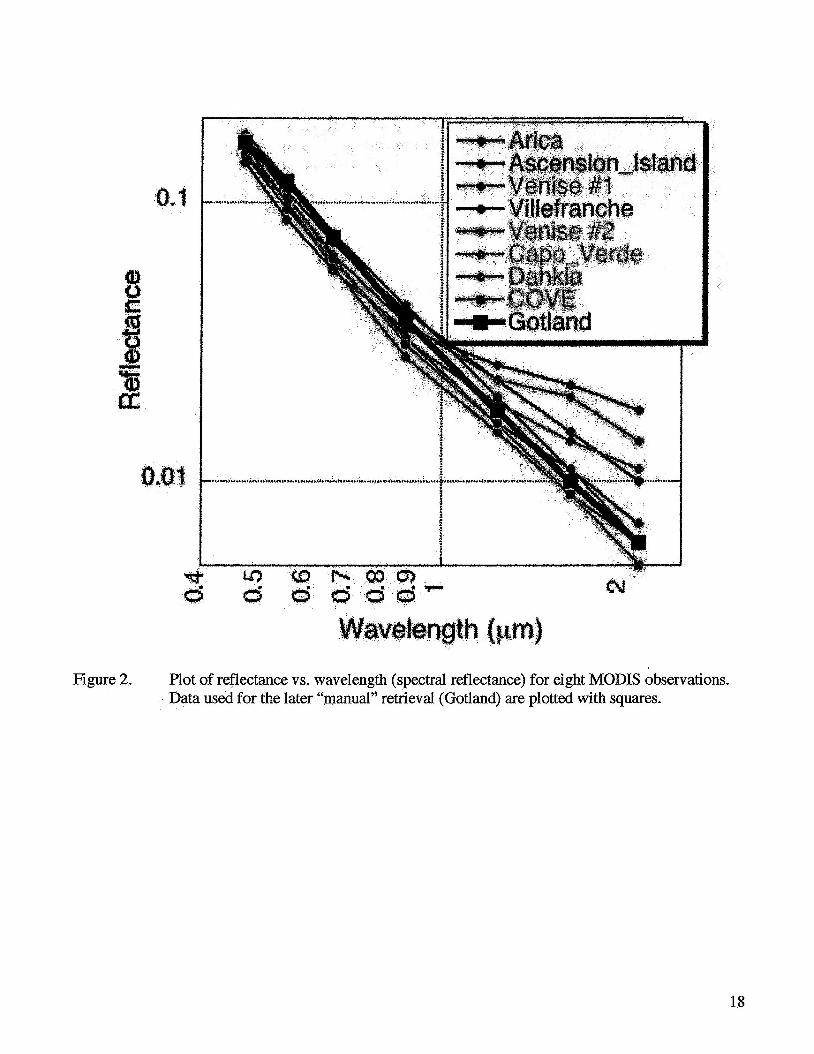
Figure 2. Plot of reflectance vs. wavelength (spectral reflectance) for eight MODIS observations. Data used for the later “manual” retrieval (Gotland) are plotted with squares.
18
f Figure 3. LUT table interpolated to MODIS observed Geometry. Filled circles are the modeled
reflectance fiom the small mode for each of five indexed optical depths (0.2,0.5, 1 .O, 2.0 and 3.0 at 0.55 pn), while the open squares are the modeled reflectance arising fiom the coarse mode. The fdled triangle (dashed line) is the modeled Rayleigh reflectance, and the filled square (dotted line) are the MODIS observations for Gotland. Reflectance fiom each mode increases monotonically with.t(AOD).
19
?
Y S l # a
t Figure 4. Reflectance calculated "by hand" (colored circles) versus the reflectance observed by
MODIS (black squares). Different colors represent different choices of the small mode weighting, q. The best fit to MODIS data (black squares) arises from q = 0.787 (orange).
20
L
Figure 5. Fitting error (green), fine mode weighting (red) and total AOD (blue) calculated in each iteration of the MODIS retrieval.
21
" 1
Y
.M f N
Figure 6. Spectral MODIS retrieved q and fitting error (E) are indicated for each retrieval.
retrieved from MODIS (solid) and AEXONET (dashed) for each location.
22