Embed Size (px)
Citation preview
www.elsevier.com/locate/rse
Remote Sensing of Environ
Remote sensing of sunlight-induced chlorophyll fluorescence and
reflectance of Scots pine in the boreal forest during spring recovery
Juliette Louisa,*, Abderrahmane Ounisa, Jean-Marc Ducrueta, Sebastien Evaina, Tuomas Laurilab,
Tea Thumb, Mika Aurelab, Gunnar Wingslec, Luis Alonsod, Roberto Pedrosd, IsmaJl Moyaa
aLaboratoire pour l’Utilisation du Rayonnement Electromagnetique (LURE) - CNRS, Univ. Paris-Sud, Bat. 203-BP34, 91898 Orsay, FrancebFinnish Meteorological Institute (FMI), Climate and Global Change Research, Sahaajankatu 20E, FIN-00880, Helsinki, Finland
cAgricultural University, Department of Forest Genetics and Plant Physiology, SLU, SE-901 83 Umea, FinlanddUniversitat de Valencia- Avda. Blasco Ibanez, 13. 46010 Valencia, Spain
Received 17 September 2004; received in revised form 26 January 2005; accepted 29 January 2005
Abstract
A measurement campaign to assess the feasibility of remote sensing of sunlight-induced chlorophyll fluorescence (ChlF) from a
coniferous canopy was conducted in a boreal forest study site (Finland). A Passive Multi-wavelength Fluorescence Detector (PMFD) sensor,
developed in the LURE laboratory, was used to obtain simultaneous measurements of ChlF in the oxygen absorption bands, at 687 and 760
nm, and a reflectance index, the PRI (Physiological Reflectance Index), for a month during spring recovery. When these data were compared
with active fluorescence measurements performed on needles they revealed the same trend. During sunny days fluorescence and reflectance
signals were found to be strongly influenced by shadows associated with the canopy structure. Moreover, chlorophyll fluorescence variations
induced by rapid light changes (due to transient cloud shadows) were found to respond more quickly and with larger amplitude under
summer conditions compared to those obtained under cold acclimation conditions. In addition, ChlF at 760 nm was observed to increase with
the chlorophyll content. During this campaign, the CO2 assimilation was measured at the forest canopy level and was found remarkably well
correlated with the PRI index.
D 2005 Elsevier Inc. All rights reserved.
Keywords: Boreal forest; Sunlight-induced chlorophyll fluorescence; CO2 flux; Diurnal cycle; Oxygen absorption band; Passive remote sensing; FLD
principle; PRI; Scots pine
0034-4257/$ - see front matter D 2005 Elsevier Inc. All rights reserved.
doi:10.1016/j.rse.2005.01.013
Abbreviations: APAR; Absorbed photosynthetically active radiation;
Chl; Chlorophyll; FIPAM; Frenquency induced pulse amplitude modula-
tion; FLD; Fraunhofer line discriminator; Fo; minimum yield of Chl a
fluorescence in dark-adapted needles; Fm; maximum yield of Chl a
fluorescence in dark adapted needles; Fm’; maximum yield of Chl a
fluorescence in the presence of PAR; Fs; stationary Chl fluorescence flux;
Fv/Fm; maximum photochemical yield of PSII; DF/Fm’; effective photo-
chemical yield; LHCII; Light harvesting antenna of photosystem II; Lidar;
Light detection and ranging; NDVI; Normalized difference vegetation
index; NPQ; Non-photochemical quenching; PAR; Photosynthetically
active radiation; PMFD; Passive multi-wavelength fluorescence detector;
PRI; Physiological reflectance index (also called Photochemical Reflec-
tance Index); PSI; Photosystem I; PSII; Photosystem II; QA; primary
quinone acceptor.
T Corresponding author. Tel.: +33 1 64 46 82 72; fax: +33 1 64 46 80 06.
E-mail address: [email protected] (J. Louis).
1. Introduction
The boreal forest, composed of evergreen (pine and fir)
and deciduous (birch and aspen) trees, contributes
significantly to carbon fluxes since it is the largest forest
of the northern hemisphere. Most conifers retain their
needles for several years. Thus cold acclimation processes
have been developed, that facilitate survival in severe
freezing periods, sometimes combined with high light
levels. Earlier studies performed at the needle level have
shown that conifers in cold climates experience large
seasonal changes in photosynthetic activity. They exhibit a
gradual decline during late summer and autumn, a strong
inhibition during winter, and a complete recovery during
spring. A study of the carotenoid composition of the
ment 96 (2005) 37–48
J. Louis et al. / Remote Sensing of Environment 96 (2005) 37–4838
needles over different seasons (Adams III & Demmig-
Adams, 1994) evidenced a higher level of lutein and
xanthophyll cycle carotenoids, and a lower level of a-
carotene, in winter compared to summer. In addition, the
extent of the de-epoxidation of violaxanthin to antherax-
anthin and zeaxanthin at midday was greater during the
winter. These results were confirmed by Ottander et al.
(1995) who also measured a decrease of the content of
D1-protein, LHCII proteins and chlorophyll, which
occurred before the increase of the xanthophyll cycle
carotenoids pool and the change of the epoxidation state.
After a substantial drop in October, the chlorophyll
content remained fairly constant at a 40% loss, on a
needle area basis. Adams III and Demmig-Adams (1994)
and Ottander et al. (1995) also evaluated the maximum
electron transfer rate of PSII using the chlorophyll
fluorescence parameters (Fv /Fm) that dropped sharply in
winter with a minimum in February. Ottander et al. (1995)
suggested that a major reorganisation of the light-harvest-
ing complexes occurs during the winter, allowing an
increase of energy dissipation as heat. PSI photochemistry
was less inhibited during winter, at variance with PSII.
Ivanov et al. (2001) showed in Scots pine that cyclic
electron transfer around the PSI was enhanced, as well as
the intersystem and stromal electron pool size, which
could play a role in spring recovery. For a general
overview on evergreen plants, see Oquist and Huner
(2003).
Other overwintering evergreen species may also exhibit
important Chl-protein changes after cold acclimation.
Gilmore and Ball (2000) evidenced a new spectral
component around 715 nm in the low temperature (77
K) Chl fluorescence emission spectrum of leaves of
winter-acclimated snow gum (Eucalyptus pauciflora Sieb.
ex Spreng.). This component seemed to be associated with
some conformational change of the PSII Chl proteins that
overrides the necessity of a pH gradient. Interestingly, a
decrease in FV /FM down to 0.2 after cold acclimation was
also observed in this species whereas a normal value of 0.8
was recovered after the end of cold acclimation.
Recently, new instruments have been developed for
passive remote sensing of sunlight-induced chlorophyll
fluorescence. These instruments allow the contribution of
chlorophyll fluorescence to the spectral radiance emerging
from the vegetation to be determined. They are based on
the Fraunhofer line principle initially proposed by Plascyk
for the Ha line (Plascyk, 1975; Plascyk & Gabriel, 1975).
The extension of this method to the atmospheric oxygen
absorption bands has been achieved by Moya et al. (1998,
2004), who described an instrument that measures sun-
light-induced chlorophyll fluorescence at 760 nm, at a
distance of several meters. Furthermore, the same instru-
ment is able to monitor the PRI index (Evain et al., 2004)
simply by changing the interference filters. This index,
defined as the relative changes of the reflectance at 531
nm relative to that at 570 nm (Gamon et al., 1990)
correlates well with changes of non-photochemical quench-
ing of chlorophyll fluorescence (Demmig-Adams &
Adams, 1992; Evain et al., 2004; Niyogi, 1999).
In order to obtain a more complete characterization of
vegetation response, a new Passive Multi-wavelength
Fluorescence Detector (PMFD) instrument, measuring
fluorescence and reflectance at 760 nm and at 687 nm,
together with the Physiological Reflectance Index (PRI),
was used for the measurement campaign described here.
The instrument is described in (Evain et al., 2001). The
campaign was conducted in the boreal forest at Sodan-
kyla (Finland) during the period corresponding to the
transition of pine trees from a winter dormant state to a
summer fully active state of photosynthesis (Oquist &
Huner, 2003). The campaign, supported by the European
Space Agency (ESA), was aimed at assessing the
feasibility of measurement of sunlight-induced chloro-
phyll fluorescence at the canopy level in the boreal
forest. Furthermore, passive fluorescence and reflectance
signatures, extracted from these data, were compared and
contrasted with the evolution of the fluorescence param-
eters at the needle level. These parameters were measured
continuously and at a distance, using a micro-lidar. The
data collected were correlated with the net CO2 uptake at
the forest level. These measurements were also compli-
mented by the determination of pigment content, once a
week.
The results obtained show a strong influence of the
canopy structure and of the shadows on the measurements
performed during the sunny days, when direct illumination
predominated. Nevertheless, the measurement of fluores-
cence at the two wavelengths proved to be feasible. Both
fluorescence quantum yields at 760 nm (AF760) and at 687
nm (AF687) were positively correlated with PAR. Under
constant illumination, an increase of AF760 was observed
which paralleled the increase of chlorophyll content, while
AF687 stayed almost constant. Furthermore, the PRI index
appeared to be well correlated to the CO2 assimilation
during spring recovery.
2. Materials and methods
2.1. Plant material and experimental site
The campaign took place at the Arctic Research Center
of the Finnish Meteorological Institute, near Sodankyla,
Finland (268 38V longitude East, 678 22V latitude North),
from 23 April 2002 to 10 June 2002. The Research Centre
is located in a Scots pine forest, naturally generated after
forest fires. The average tree age is 103 years. The height
of these trees is about 10 m, with a diameter of about 0.1
m. The tree density is 210,000 trunks per km2 and the
ground vegetation is 73% lichens, 12% mosses, and 15%
small shrubs. The soil type of the forest is fluvial sandy
podzol.

Fig. 2. Photograph of the Passive Multi-Wavelength Fluorescence Detector
(PMFD).
J. Louis et al. / Remote Sensing of Environment 96 (2005) 37–48 39
2.2. Passive fluorescence measurements
Solar-induced fluorescence was measured at the canopy
level with the Passive Multi-wavelength Fluorescence
Detector (PMFD), see Evain et al. (2001). This instrument
is based on the Fraunhofer line principle (Plascyk, 1975;
Plascyk & Gabriel, 1975), applied in the atmospheric
oxygen A and B absorption bands (760 and 687 nm,
respectively). This method compares the depth of an
absorption band in the incident solar irradiance to the
depth of this band in the radiance of the target, in order to
estimate the in-filling of the band by the chlorophyll
fluorescence emission. This requires a measurement of the
radiances reflected by the target within and out of the
band (Fig. 1). As the depth and the shape of the
atmospheric oxygen absorption bands depend on the path
length of solar radiation, it is necessary to compare these
radiances with those of a reference panel situated in the
same light regime (Moya et al., 2004). The heart of the
PMFD is a rotating filter-holder wheel, equipped with six
interference filters (Omega Optical, Brattleboro, VT,
USA), in front of a detector (Fig. 2). Two filters are
devoted to the measurement of the atmospheric oxygen
absorption band around 760 nm (A band), as described in
Moya et al. (2004). The radiant flux out of the band is
measured with an interference filter located at 758.3 nm
(FWHM=1.6 nm), whereas the flux in the band is
determined by a filter located at 760.6 nm (FWHM=1.3
nm). Two other filters are devoted to the measurement of
the atmospheric oxygen absorption band around 687 nm
(B band). The radiant flux out of the band is determined
at 686.2 nm (FWHM=0.8 nm), whereas the flux in the
band is determined at 687.3 nm (FWHM=0.7 nm). In
addition, two band-pass interference filters (FWHM=10
nm, transmission 70%) were used to measure the
reflectance signals at 531 and 570 nm, respectively. A
long-pass filter (Schott KV500) was used to cut-off the
UV radiation at the entrance of the sensor. A flip-flop
mirror, moved by a magnet, directs the field of view of
the instrument, after one revolution of the filter-wheel,
alternatively towards the vegetation target or to a
reference board, as described in Moya et al. (2004). The
repetition period of the measurement was set to 2 s. The
fluorescencefluorescence
a
λo λo
Solar irradiance(reference)
Target Radiance
b
c
d
Fig. 1. Fraunhofer Line Discriminator principle. The method is based on the pa
luminescent target. R and F are the calculated reflectance and stationary fluoresc
fluorescence fluxes are calculated according to the
following relations (Moya et al., 2004):
R ¼ a� bð Þ= c� dð Þ
F ¼ b� R d
R and F are respectively the calculated reflectance and
stationary fluorescence flux. a and b represent the detected
radiances from the reference panel in and out of the oxygen
absorption band, respectively. Similarly, c and d represent
the detected radiances from the target in and out of the band
(Fig. 1). These relationships were applied at 687 nm and at
760 nm. The parallel measurements of reflectance signals in
the red and near infrared spectral range allow the calculation
of a NDVI-like index (Tucker, 1979) using the relation:
NDVI ¼ R760 � R687ð Þ= R760 þ R687ð Þ
The PMFD sensor was installed on the top of a 20-m
height tower and maintained in the same viewing direction
during the entire campaign. The zenith angle of the viewing
direction was about 120 degrees and the instrument was
oriented south-to-north at a 50 m distance from the target.
The field of view was 70 mrad and the spot covered 9 m2,
which corresponded approximately to three trees. The
PMFD automatically and continuously acquired the radi-
R = (c-d) / (a-b)R = (c-d) / (a-b)
F = d-R b F = d-R b
Detector
Reference
rtial in-filling of the absorption band by the sun-induced emission of the
ence flux.
J. Louis et al. / Remote Sensing of Environment 96 (2005) 37–4840
ance signals from the forest canopy, with a period of 2 s. A
flip-flop mirror alternatively oriented the sensor field of
view towards the target and a small reference panel installed
horizontally near the instrument. The reference panel was a
white PVC panel, previously calibrated against a standard
white lambertian diffuser (Spectralon, Labsphere, USA).
The reflectance and fluorescence calculated in this way are
bi-directional, with a fixed detection direction and a variable
incident direction. All the curves plotted are presented
without any smoothing.
2.3. PRI measurements
According to Gamon et al. (1990), measurements of
reflectance at 531 and 570 nm enable the PRI index to be
monitored, in parallel to fluorescence, with the same field of
view and on the same target:
PRI ¼ R531 � R570
R531 þ R570
The calculation of the reflectance is simpler:
R531 ¼ t531=r531
R570 ¼ t570=r570
t531 and r531 are the radiance signals from the target and from
the reference, respectively. In this definition, the contribution
of blue-green fluorescence has been neglected. Laboratory
measurements showed indeed that this contribution is less
than 0.1% (Juliette Louis, unpublished results).
PRI was also measured in parallel with an ASD
FieldSpec Pro FR Spectroradiometer, bundled to an optical
fibre for light collection, with a field of view of 17.5 mRad.
The optical fibre was directed alternatively towards a
Spectralon panel and the same target as the PMFD. The
signal from the target was divided by the signal from the
reference panel in order to determine the bi-directional
reflectance of the tree canopy.
2.4. Atmospheric correction
As the target was 50 m distant from the instrument and
from the reference panel, the atmospheric absorption of the
radiance signals had to be taken into account. The
absorption at 760.5 nm (within the band) over 50 m of a
horizontal path was calculated with a radiative transfer code,
MODTRAN 4. It was concluded that the apparent radiance
at 760.5 nm had to be multiplied by a correction factor of
1.07, to account for the attenuation of the air mass between
the target and the instrument. The attenuation for the other
radiance signals proved to be negligible.
2.5. Active fluorescence measurements
The micro-Lidar FIPAM (Apostol et al., 2001; Flexas et
al., 2000) has been used to monitor laser-induced Chl
fluorescence. The excitation beam was produced by a
pulsed laser diode (665 nm, 4 As pulsewidth, 300 mW,
Philips, Issy-les-Moulineau, France). The frequency of
modulation can be varied from 0.5 to 100 kHz. Chlorophyll
fluorescence was detected by a PIN photodiode after it
passed through a long-pass filter (RG 9, 1 mm, Schott,
Clichy, France). The signal was processed by specially
designed electronics, which make the detector insensitive to
continuous illumination. The stationary fluorescence signal
(Fo during the night, Fs, during the day) is measured in a
non-actinic way, at a frequencyb100 Hz depending on the
ambient light. The maximum Chl fluorescence level (Fm
during the night, Fm’ during the day) is obtained by
increasing the frequency of excitation up to 100 kHz. At this
frequency, the resulting excitation intensity is about 4000
Amol photons m-2 s-1. The measurement of Fm is repeated
at a frequency, which also depends on the ambient light.
During the night, Fo is measured every 6 s and Fm every
hour. The measured fluorescence parameters allow the
maximum photochemical yield (Fv /Fm=(Fm-Fo) /Fm),
the actual photochemical yield (DF/Fm’=(Fm’ -Fs) /Fm’)
and the non-photochemical quenching (NPQ=(Fm-Fm’/
Fm’)) to be deduced. The FIPAM was fixed on a tripod
installed on the ground, oriented south-to-north at a distance
of 2.5 m from a small pine tree. The needles of a small
branch were oriented vertically, fixed by a clamp. The laser
spot, which covered a surface of 20�3 mm, illuminated
several needles. The measurements were carried out
continuously. Needle temperature was measured by a small
thermocouple in contact with the back of the same needles
used for fluorescence measurements. Air temperature was
measured by an identical thermocouple placed near the
needles but protected from direct radiation and wind. A
quantum-meter oriented perpendicularly to the plane of the
needles was used to measure the incoming PAR. All the
environmental parameters were acquired immediately after
each fluorescence measurement.
The maximum photochemical yield of Scots pine needles
was also measured on dark-adapted needles with a Plant
Efficiency Analyzer (PEA Hansatech), a portable fluorom-
eter. Saturating illumination is provided by light emitting
diodes having a peak emission at 650 nm. The fluorescence
parameter Fv/Fm is automatically calculated by the instru-
ment. Measurements with the PEA were performed daily, at
three different sites.
2.6. Pigment analysis
Needles were collected once a week from April 23 to
June 11. Ten needles were collected between 9:00 and 11:00
a.m., preserved in liquid-nitrogen while transferred to the
laboratory for pigment extraction. Fresh weight contents of
chlorophyll a and b, antheraxanthin, zeaxanthin, violaxan-
thin, lutein, neoxanthin and alfa and beta-carotenes were
obtained. Pigment analysis was conducted using HPLC at
the Swedish Agricultural University in Ume3.
J. Louis et al. / Remote Sensing of Environment 96 (2005) 37–48 41
2.7. CO2 fluxes measurements
The eddy-covariance fluxes of CO2, H2O, heat, momen-
tum and meteorological state were measured using a
LICOR-7000 analyser and a SATI-3Sx sonic anemometer
at 23 m above the ground. The eddy-covariance method-
ology has been described by Aurela et al. (2001, 2002). In
addition, heat and momentum fluxes were measured using
four Solent sonic anemometers at 47, 32, 8 and 3 m. All
these measurements were conducted by the Finnish Mete-
orological Institute.
3. Results
3.1. Daily variations: active fluorescence measurements
Continuous measurements were performed with the
FIPAM during the entire campaign, producing a time
series of the stationary fluorescence, Fv/Fm and DF/Fm’.
Although these measurements were taken from one tree, at
the needle level, they were used for comparison with the
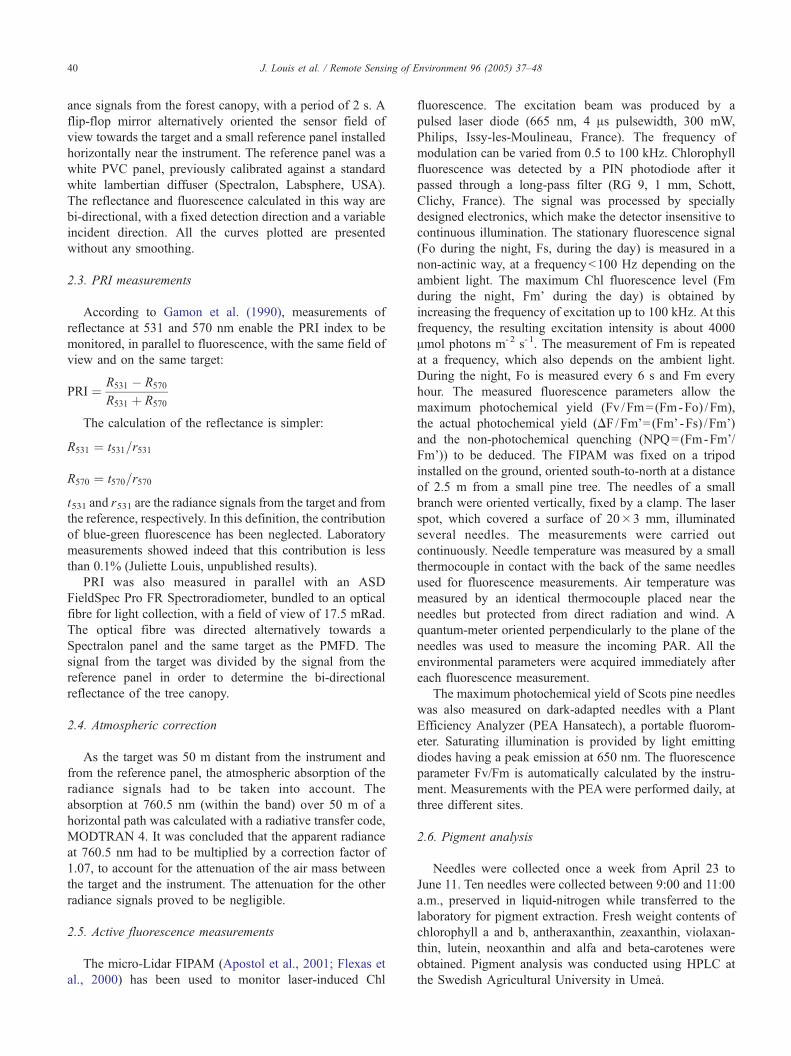
passive measurements. Fig. 3 shows diurnal cycles of
chlorophyll fluorescence under two extreme light condi-
tions. Regularly spaced spikes in the Fs signal during the
night are due to influence of some of reduced QA still
present 6 s after a saturating pulse at 100 kHz. During
sunny days, Fs experienced a 35% decrease at midday
compared to the early morning values, Fm’ a 70%
Fig. 3. Diurnal cycle variations of the PAR and of the fluorescence parameters mea
measures Fo and Fm during the night, Fs and Fm’ during the day. Fs and Fm decrea
they both increase as the PAR decreases. (B) Fv /Fm is measured during the night,
conditions (22 May 2002): (C) Fs stays constant along the day, while Fm’ decrease
PAR increases.
decrease (Fig. 3A) and DF/Fm’ a 60% decrease (Fig.
3B). Fs decreased even below the Fo level around midday.
The fall of Fs and Fm around 4:00 a.m. was not due to a
fluorescence decrease but to an optical problem, caused by
water condensation in the optics of the instrument. This
phenomenon was observed at predawn on cloudless nights.
Under low light conditions (Fig. 3C,D), Fs stayed fairly
constant along the day and the decrease of Fm’ and DF/
Fm’ was less pronounced.
3.2. Daily variations: passive measurements
Radiance signals will be described prior to fluorescence
signals since fluorescence is extracted from the comparison
of radiance signals from the target and a reference. Fig. 4
shows a diurnal cycle of radiance signals recorded when
direct illumination predominated. The intensity of the
reference signal, measured on a flat panel, depends on the
air mass and on the angle between the sun and the panel.
The panel and the quantum-meter were both horizontal. The
diurnal cycle variation of the PAR signal showed a regular
bell-shaped curve for this sunny day, with a maximum at
local midday (14:00). Whatever the wavelength considered,
the reference signals also showed a regular bell-shaped
curve as was expected, in agreement with MODTRAN
modeling (not shown), but shifted in time. This shift
between the maxima is attributed to a small difference in
the horizontal orientation settings of the quantum-meter
compared to the reference panel.
sured by the FIPAM. High light conditions (28 May 2002): (A) The FIPAM
se when the PAR increases and reaches a minimum around noon. Thereafter
DF /Fm’ during the day. DF/Fm’ decreases strongly around noon. Low light
s weakly when the PAR increases. (D) DF/Fm’ decreases weakly when the
0.02
0.01
0C
hlor
ophy
ll f
luor
esce
nce
(r.u
.)F760
F687
0.04
0.02
0
Flu
ores
cenc
e yi
eld
(r.u
.)
ΦF760
ΦF687
0.6
0.4
0.2
0
Ref
lect
ance
at 7
60 n
m
0.06
0.04
0.02
0
Reflectance at 687 nmR760
R687
A
B
C
1500
1000
500
0
PAR
(µm
ol. p
hoto
ns m
-2 s
-1 )
2018161412108
Daytime (hours)
D
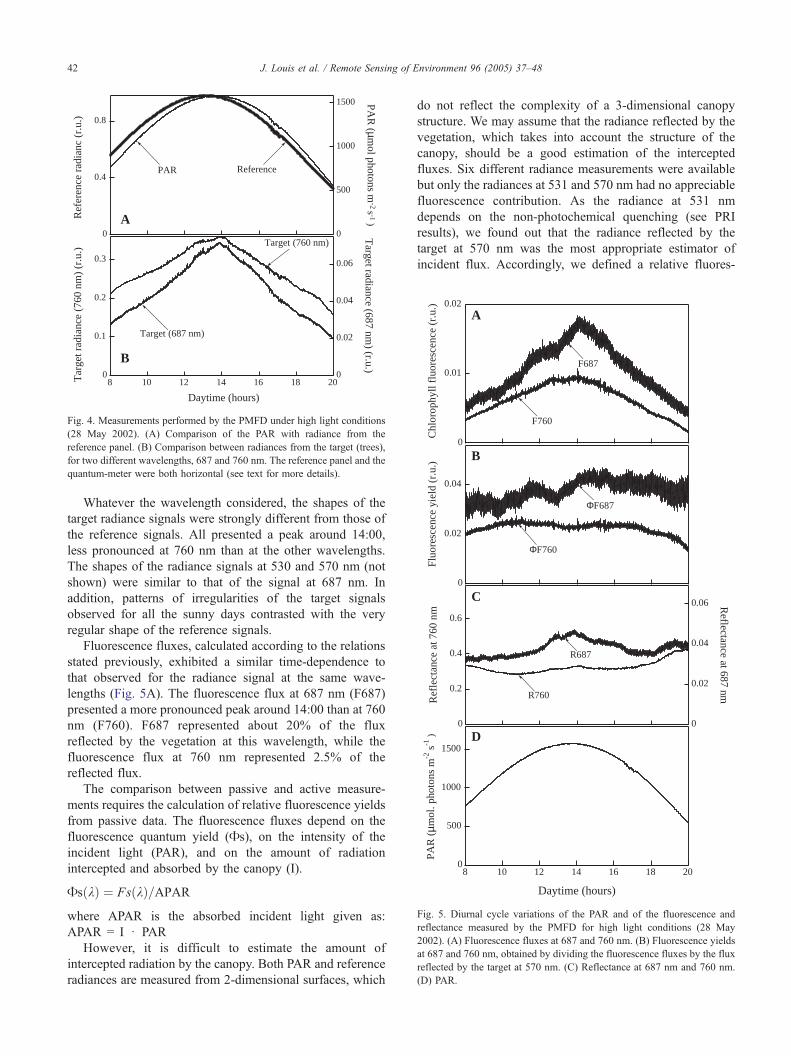
Fig. 5. Diurnal cycle variations of the PAR and of the fluorescence and
reflectance measured by the PMFD for high light conditions (28 May
2002). (A) Fluorescence fluxes at 687 and 760 nm. (B) Fluorescence yields
at 687 and 760 nm, obtained by dividing the fluorescence fluxes by the flux
reflected by the target at 570 nm. (C) Reflectance at 687 nm and 760 nm.
(D) PAR.
0.3
0.2
0.1
0Tar
get r
adia
nce
(760
nm
) (r
.u.)
2018161412108
Daytime (hours)
0.06
0.04
0.02
0
Target radiance (687 nm
) (r.u.)
Target (760 nm)
Target (687 nm)
0.8
0.4
0
Ref
eren
ce r
adia
nc (
r.u.
)
1500
1000
500
0
PAR
(µm
ol photons m-2 s -1 )
ReferencePAR
A
B
Fig. 4. Measurements performed by the PMFD under high light conditions
(28 May 2002). (A) Comparison of the PAR with radiance from the
reference panel. (B) Comparison between radiances from the target (trees),
for two different wavelengths, 687 and 760 nm. The reference panel and the
quantum-meter were both horizontal (see text for more details).
J. Louis et al. / Remote Sensing of Environment 96 (2005) 37–4842
Whatever the wavelength considered, the shapes of the
target radiance signals were strongly different from those of
the reference signals. All presented a peak around 14:00,
less pronounced at 760 nm than at the other wavelengths.
The shapes of the radiance signals at 530 and 570 nm (not
shown) were similar to that of the signal at 687 nm. In
addition, patterns of irregularities of the target signals
observed for all the sunny days contrasted with the very
regular shape of the reference signals.
Fluorescence fluxes, calculated according to the relations
stated previously, exhibited a similar time-dependence to
that observed for the radiance signal at the same wave-
lengths (Fig. 5A). The fluorescence flux at 687 nm (F687)
presented a more pronounced peak around 14:00 than at 760
nm (F760). F687 represented about 20% of the flux
reflected by the vegetation at this wavelength, while the
fluorescence flux at 760 nm represented 2.5% of the
reflected flux.
The comparison between passive and active measure-
ments requires the calculation of relative fluorescence yields
from passive data. The fluorescence fluxes depend on the
fluorescence quantum yield (As), on the intensity of the
incident light (PAR), and on the amount of radiation
intercepted and absorbed by the canopy (I).
As kð Þ ¼ Fs kð Þ=APAR
where APAR is the absorbed incident light given as:
APAR = I d PAR
However, it is difficult to estimate the amount of
intercepted radiation by the canopy. Both PAR and reference
radiances are measured from 2-dimensional surfaces, which
do not reflect the complexity of a 3-dimensional canopy
structure. We may assume that the radiance reflected by the
vegetation, which takes into account the structure of the
canopy, should be a good estimation of the intercepted
fluxes. Six different radiance measurements were available
but only the radiances at 531 and 570 nm had no appreciable
fluorescence contribution. As the radiance at 531 nm
depends on the non-photochemical quenching (see PRI
results), we found out that the radiance reflected by the
target at 570 nm was the most appropriate estimator of
incident flux. Accordingly, we defined a relative fluores-
0.004
0.002
0
Fluo
resc
ence
flu
xes
(r.u
.)
F760
F687
0.04
0.02
0
Fluo
resc
ence
yie
ld (
r.u.
)
ΦF760
ΦF687
0.4
0.2
0
Ref
lect
ance
at 7
60 n
m
0.04
0.02
0
Reflectance at 687 nmR687 R760
A
B
C
1500
1000
500
0
PAR
(µm
ol p
hoto
ns m
-2 s-1
)
2018161412108
Daytime (hours)
D
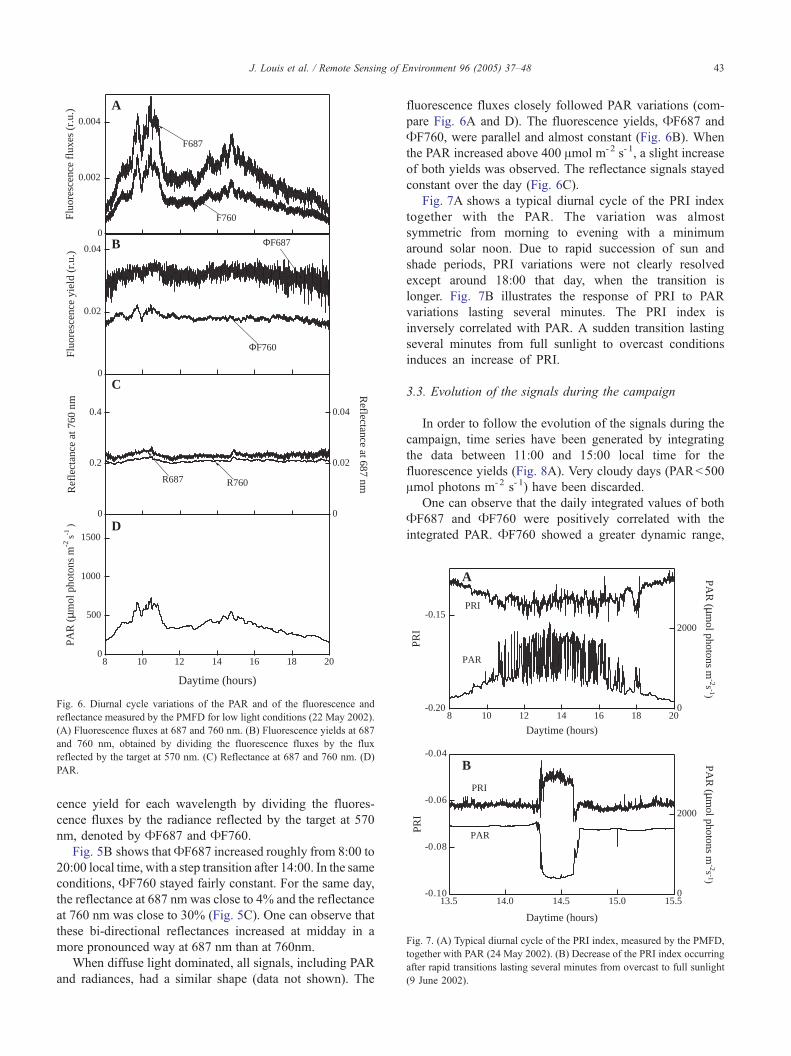
Fig. 6. Diurnal cycle variations of the PAR and of the fluorescence and
reflectance measured by the PMFD for low light conditions (22 May 2002).
(A) Fluorescence fluxes at 687 and 760 nm. (B) Fluorescence yields at 687
and 760 nm, obtained by dividing the fluorescence fluxes by the flux
reflected by the target at 570 nm. (C) Reflectance at 687 and 760 nm. (D)
PAR.
-0.20
-0.15
PRI
2018161412108
Daytime (hours)
2000
0
PAR
(µm
ol photons m-2s -1)
PRI
PAR
-0.10
-0.08
-0.06
-0.04
PRI
15.515.014.514.013.5
Daytime (hours)
2000
0
PAR
(µm
ol photons m-2s -1)
PAR
PRI
A
B
Fig. 7. (A) Typical diurnal cycle of the PRI index, measured by the PMFD,
together with PAR (24 May 2002). (B) Decrease of the PRI index occurring
after rapid transitions lasting several minutes from overcast to full sunlight
(9 June 2002).
J. Louis et al. / Remote Sensing of Environment 96 (2005) 37–48 43
cence yield for each wavelength by dividing the fluores-
cence fluxes by the radiance reflected by the target at 570
nm, denoted by AF687 and AF760.
Fig. 5B shows thatAF687 increased roughly from 8:00 to
20:00 local time, with a step transition after 14:00. In the same
conditions, AF760 stayed fairly constant. For the same day,
the reflectance at 687 nm was close to 4% and the reflectance
at 760 nm was close to 30% (Fig. 5C). One can observe that
these bi-directional reflectances increased at midday in a
more pronounced way at 687 nm than at 760nm.
When diffuse light dominated, all signals, including PAR
and radiances, had a similar shape (data not shown). The
fluorescence fluxes closely followed PAR variations (com-
pare Fig. 6A and D). The fluorescence yields, AF687 and
AF760, were parallel and almost constant (Fig. 6B). When
the PAR increased above 400 Amol m-2 s- 1, a slight increase
of both yields was observed. The reflectance signals stayed
constant over the day (Fig. 6C).
Fig. 7A shows a typical diurnal cycle of the PRI index
together with the PAR. The variation was almost
symmetric from morning to evening with a minimum
around solar noon. Due to rapid succession of sun and
shade periods, PRI variations were not clearly resolved
except around 18:00 that day, when the transition is
longer. Fig. 7B illustrates the response of PRI to PAR
variations lasting several minutes. The PRI index is
inversely correlated with PAR. A sudden transition lasting
several minutes from full sunlight to overcast conditions
induces an increase of PRI.
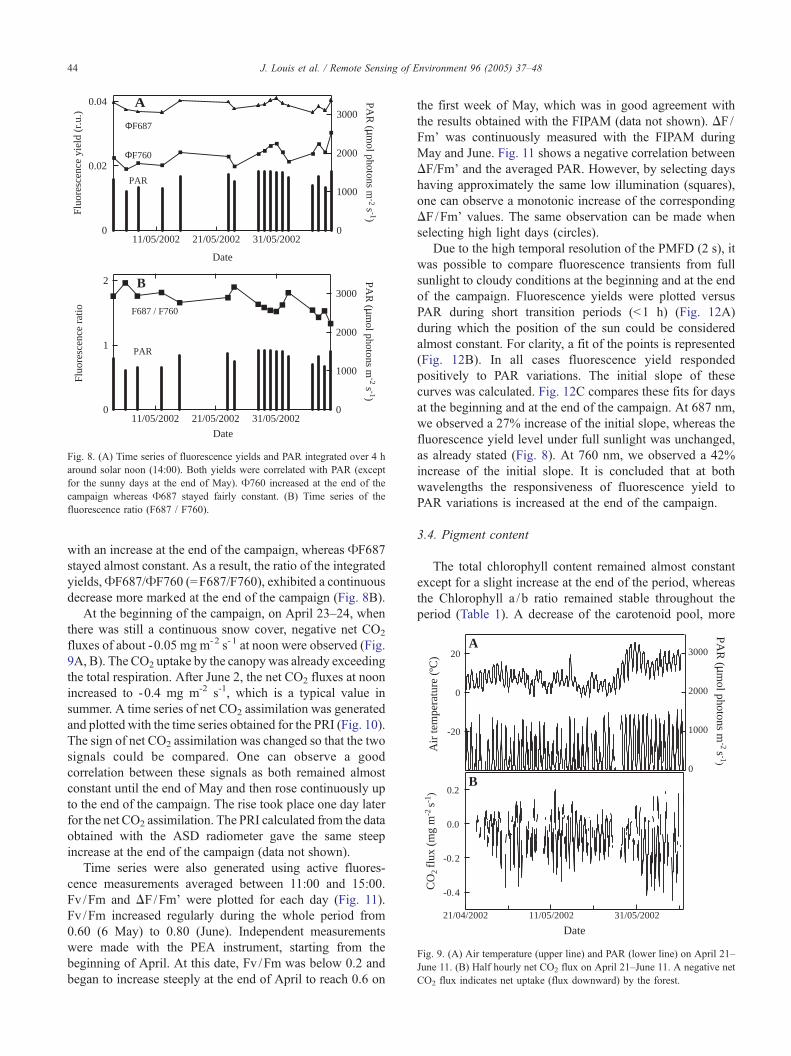
3.3. Evolution of the signals during the campaign
In order to follow the evolution of the signals during the
campaign, time series have been generated by integrating
the data between 11:00 and 15:00 local time for the
fluorescence yields (Fig. 8A). Very cloudy days (PARb500
Amol photons m-2 s- 1) have been discarded.
One can observe that the daily integrated values of both
AF687 and AF760 were positively correlated with the
integrated PAR. AF760 showed a greater dynamic range,
-20
0
20
Air
tem
pera
ture
(ºC
) 3000
2000
1000
0
PA
R (µ
mol photons m
-2 s -1)
-0.4
-0.2
0.0
0.2
CO
2 fl
ux (
mg
m-2
s-1
)
21/04/2002 11/05/2002 31/05/2002
Date
A
B
Fig. 9. (A) Air temperature (upper line) and PAR (lower line) on April 21–
June 11. (B) Half hourly net CO2 flux on April 21–June 11. A negative net
CO2 flux indicates net uptake (flux downward) by the forest.
0.04
0.02
0
Fluo
resc
ence
yie
ld (
r.u.
)
11/05/2002 21/05/2002 31/05/2002
Date
3000
2000
1000
0
PAR
(µm
ol photons m-2 s -1)
ΦF760
PAR
ΦF687
2
1
0
Fluo
resc
ence
rat
io
11/05/2002 21/05/2002 31/05/2002
Date
3000
2000
1000
0PA
R (µ
mol photons m
-2 s -1)
F687 / F760
PAR
A
B
Fig. 8. (A) Time series of fluorescence yields and PAR integrated over 4 h
around solar noon (14:00). Both yields were correlated with PAR (except
for the sunny days at the end of May). A760 increased at the end of the
campaign whereas A687 stayed fairly constant. (B) Time series of the
fluorescence ratio (F687 / F760).
J. Louis et al. / Remote Sensing of Environment 96 (2005) 37–4844
with an increase at the end of the campaign, whereas AF687
stayed almost constant. As a result, the ratio of the integrated
yields,AF687/AF760 (=F687/F760), exhibited a continuous
decrease more marked at the end of the campaign (Fig. 8B).
At the beginning of the campaign, on April 23–24, when
there was still a continuous snow cover, negative net CO2
fluxes of about -0.05 mg m-2 s-1 at noon were observed (Fig.
9A, B). The CO2 uptake by the canopywas already exceeding
the total respiration. After June 2, the net CO2 fluxes at noon
increased to -0.4 mg m-2 s-1, which is a typical value in
summer. A time series of net CO2 assimilation was generated
and plotted with the time series obtained for the PRI (Fig. 10).
The sign of net CO2 assimilation was changed so that the two
signals could be compared. One can observe a good
correlation between these signals as both remained almost
constant until the end of May and then rose continuously up
to the end of the campaign. The rise took place one day later
for the net CO2 assimilation. The PRI calculated from the data
obtained with the ASD radiometer gave the same steep
increase at the end of the campaign (data not shown).
Time series were also generated using active fluores-
cence measurements averaged between 11:00 and 15:00.
Fv /Fm and DF/Fm’ were plotted for each day (Fig. 11).
Fv /Fm increased regularly during the whole period from
0.60 (6 May) to 0.80 (June). Independent measurements
were made with the PEA instrument, starting from the
beginning of April. At this date, Fv /Fm was below 0.2 and
began to increase steeply at the end of April to reach 0.6 on
the first week of May, which was in good agreement with
the results obtained with the FIPAM (data not shown). DF/
Fm’ was continuously measured with the FIPAM during
May and June. Fig. 11 shows a negative correlation between
DF/Fm’ and the averaged PAR. However, by selecting days
having approximately the same low illumination (squares),
one can observe a monotonic increase of the corresponding
DF/Fm’ values. The same observation can be made when
selecting high light days (circles).
Due to the high temporal resolution of the PMFD (2 s), it
was possible to compare fluorescence transients from full
sunlight to cloudy conditions at the beginning and at the end
of the campaign. Fluorescence yields were plotted versus
PAR during short transition periods (b1 h) (Fig. 12A)
during which the position of the sun could be considered
almost constant. For clarity, a fit of the points is represented
(Fig. 12B). In all cases fluorescence yield responded
positively to PAR variations. The initial slope of these
curves was calculated. Fig. 12C compares these fits for days
at the beginning and at the end of the campaign. At 687 nm,
we observed a 27% increase of the initial slope, whereas the
fluorescence yield level under full sunlight was unchanged,
as already stated (Fig. 8). At 760 nm, we observed a 42%
increase of the initial slope. It is concluded that at both
wavelengths the responsiveness of fluorescence yield to
PAR variations is increased at the end of the campaign.
3.4. Pigment content
The total chlorophyll content remained almost constant
except for a slight increase at the end of the period, whereas
the Chlorophyll a /b ratio remained stable throughout the
period (Table 1). A decrease of the carotenoid pool, more

0.3
0.2
0.1
0
Net C
O2 assim
ilation (mg m
-2 s -1)
01/05/2002 11/05/2002 21/05/2002 31/05/2002
Date
-0.20
-0.15
-0.10
PRI
Net CO2 Assimilation
PRI
Fig. 10. Parallel plots of the PRI index and CO2 uptake time series during the campaign. Observe the parallel increase at the end of May.
J. Louis et al. / Remote Sensing of Environment 96 (2005) 37–48 45
pronounced for the lutein pigment, could be observed.
These findings are in good agreement with data reported in
the literature for the boreal forest (Ottander et al., 1995).
0.8
0.6
0.4
0.2
0.0
Phot
oche
mic
al y
ield
(r.
u.)
06/05/2002 11/05/2002 16/05/2002 21/05/2002 26/05/2002 31/05/2002 05/06/2002
Date
5000
4000
3000
2000
1000
0
PAR
(µm
ol photons m-2 s -1)
Fv/Fm
∆F/Fm'
PAR
Fig. 11. Evolution of the PAR and of the maximal and effective
photochemical yields during the campaign, measured by the FIPAM. The
circles and the squares highlight the increase of DF/Fm’ for the same PAR.
Squares correspond to a PAR of about 200 Amol photons m�2 s�1, circles
to a PAR of about 1000 Amol photons m�2 s�1.
4. Discussion
A prominent feature is obvious in the radiance data (Fig.
4). The shape of the radiance signals measured with the
PMFD on sunny days is very different according to whether
they originate from the reference or from the target. This
difference is attributed to a different light interception
between the 3D canopy and the 2D reference panel. The
peak around 14:00, observed for all of the sunny days, is
probably ascribable to a Hot Spot effect (Hapke et al., 1996;
Kuusk, 1985) as the inclination angles of the instrument and
the sun were respectively 308 and 428, and the azimuthal
angles were very close. The other irregularities could be due
to a changing pattern of lighted and shadowed area of the
tree canopy, when the direction of incident light changes.
The sensitivity to the Hot Spot effect depends on the canopy
reflection and transmission properties. At 687 nm, the signal
is strongly absorbed and will arise mostly from the top of
the target, and so will be more sensitive to Hot Spot effect
than the signal at 760 nm, which is weakly absorbed and
arises from scattering within the whole canopy. This may
explain the more pronounced peak at 687 nm compared to
760 nm. The structural origin of these effects is confirmed
by the data obtained under diffuse illumination conditions.
In this case, all the radiance signals, from the target and
from the reference, can almost be superimposed, and depend
only on PAR variations.
The fluorescence fluxes follow the same propagation
laws and so have the same shape as the corresponding
radiant fluxes (Fig. 5A). The calculation of fluorescence
yields was expected to minimize canopy structure effects
and to simplify the interpretation of canopy fluorescence
emission. However, the diurnal cycles acquired on sunny
days with active and passive techniques are quite different
(Figs. 3A and 5B).
4.1. Comparison of active and passive fluorescence
measurements
The diurnal cycles measured on sunny days by the
FIPAM are characterized by a pronounced decrease of Fs,
under high light conditions, to a level lower than Fo (Fig.
3A). This decrease is attributed to the increase of the non-
photochemical quenching (NPQ), calculated as stated
above, which reached 2.5 at midday (not shown). This
behaviour indicates that the plant was undergoing a strong
constraint. As the campaign took place just after the snow
melting period, a water deficit seems unlikely, so the
reversible NPQ during the daily cycle is attributed to excess
light.
At variance with Fs measured with the FIPAM, the
diurnal cycles of both AF687 and AF760 recorded by the
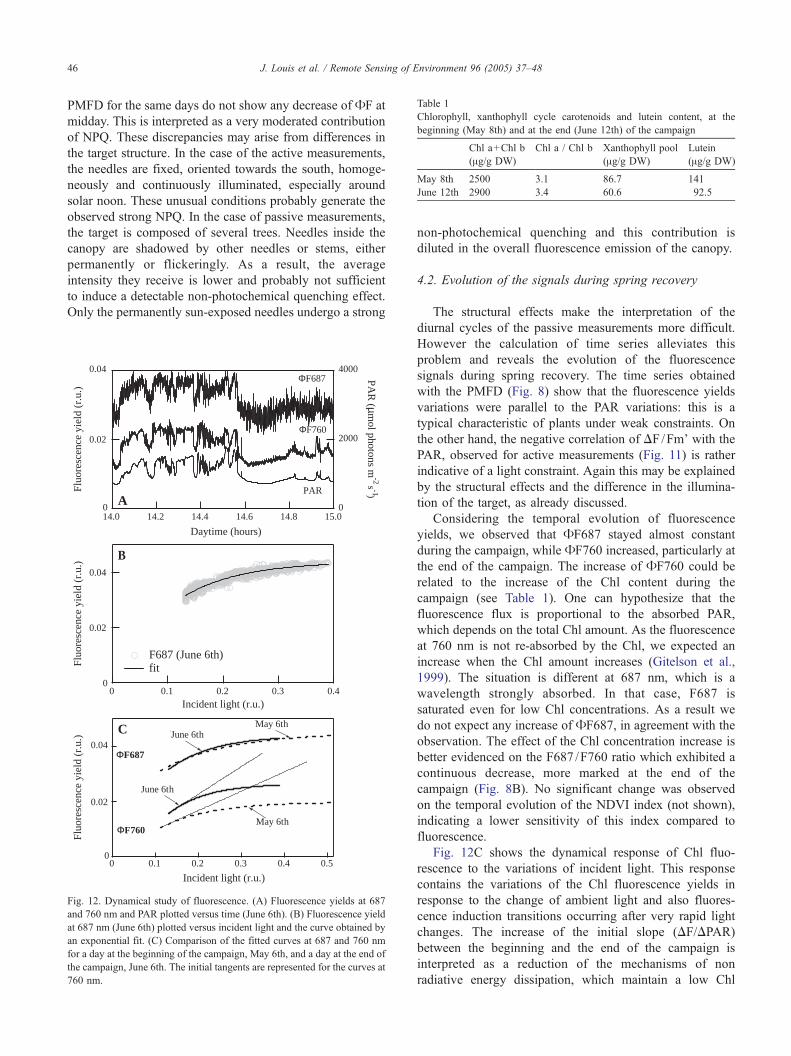
Table 1
Chlorophyll, xanthophyll cycle carotenoids and lutein content, at the
beginning (May 8th) and at the end (June 12th) of the campaign
Chl a+Chl b
(Ag/g DW)
Chl a / Chl b Xanthophyll pool
(Ag/g DW)
Lutein
(Ag/g DW)
May 8th 2500 3.1 86.7 141
June 12th 2900 3.4 60.6 92.5
J. Louis et al. / Remote Sensing of Environment 96 (2005) 37–4846
PMFD for the same days do not show any decrease of AF at
midday. This is interpreted as a very moderated contribution
of NPQ. These discrepancies may arise from differences in
the target structure. In the case of the active measurements,
the needles are fixed, oriented towards the south, homoge-
neously and continuously illuminated, especially around
solar noon. These unusual conditions probably generate the
observed strong NPQ. In the case of passive measurements,
the target is composed of several trees. Needles inside the
canopy are shadowed by other needles or stems, either
permanently or flickeringly. As a result, the average
intensity they receive is lower and probably not sufficient
to induce a detectable non-photochemical quenching effect.
Only the permanently sun-exposed needles undergo a strong
0.04
0.02
0
Fluo
resc
ence
yie
ld (
r.u.
)
0.40.30.20.10Incident light (r.u.)
F687 (June 6th) fit
0.04
0.02
0
Fluo
resc
ence
yie
ld (
r.u.
)
0.50.40.30.20.10
Incident light (r.u.)
May 6thJune 6th
ΦF687
ΦF760
June 6th
May 6th
4000
2000
0
PAR
(µm
ol photons m-2 s -1)
15.014.814.614.414.214.0
Daytime (hours)
0.04
0.02
0
Fluo
resc
ence
yie
ld (
r.u.
)
ΦF760
Φ F687
PARA
B
C
Fig. 12. Dynamical study of fluorescence. (A) Fluorescence yields at 687
and 760 nm and PAR plotted versus time (June 6th). (B) Fluorescence yield
at 687 nm (June 6th) plotted versus incident light and the curve obtained by
an exponential fit. (C) Comparison of the fitted curves at 687 and 760 nm
for a day at the beginning of the campaign, May 6th, and a day at the end of
the campaign, June 6th. The initial tangents are represented for the curves at
760 nm.
non-photochemical quenching and this contribution is
diluted in the overall fluorescence emission of the canopy.
4.2. Evolution of the signals during spring recovery
The structural effects make the interpretation of the
diurnal cycles of the passive measurements more difficult.
However the calculation of time series alleviates this
problem and reveals the evolution of the fluorescence
signals during spring recovery. The time series obtained
with the PMFD (Fig. 8) show that the fluorescence yields
variations were parallel to the PAR variations: this is a
typical characteristic of plants under weak constraints. On
the other hand, the negative correlation of DF/Fm’ with the
PAR, observed for active measurements (Fig. 11) is rather
indicative of a light constraint. Again this may be explained
by the structural effects and the difference in the illumina-
tion of the target, as already discussed.
Considering the temporal evolution of fluorescence
yields, we observed that AF687 stayed almost constant
during the campaign, while AF760 increased, particularly at
the end of the campaign. The increase of AF760 could be
related to the increase of the Chl content during the
campaign (see Table 1). One can hypothesize that the
fluorescence flux is proportional to the absorbed PAR,
which depends on the total Chl amount. As the fluorescence
at 760 nm is not re-absorbed by the Chl, we expected an
increase when the Chl amount increases (Gitelson et al.,
1999). The situation is different at 687 nm, which is a
wavelength strongly absorbed. In that case, F687 is
saturated even for low Chl concentrations. As a result we
do not expect any increase of AF687, in agreement with the
observation. The effect of the Chl concentration increase is
better evidenced on the F687 /F760 ratio which exhibited a
continuous decrease, more marked at the end of the
campaign (Fig. 8B). No significant change was observed
on the temporal evolution of the NDVI index (not shown),
indicating a lower sensitivity of this index compared to
fluorescence.
Fig. 12C shows the dynamical response of Chl fluo-
rescence to the variations of incident light. This response
contains the variations of the Chl fluorescence yields in
response to the change of ambient light and also fluores-
cence induction transitions occurring after very rapid light
changes. The increase of the initial slope (DF/DPAR)
between the beginning and the end of the campaign is
interpreted as a reduction of the mechanisms of non
radiative energy dissipation, which maintain a low Chl
J. Louis et al. / Remote Sensing of Environment 96 (2005) 37–48 47
fluorescence yield under cold acclimated conditions. In
addition to DpH associated NPQ, these mechanisms include
long-term sustained quenching for the whole winter period
(Oquist & Huner, 2003). This last quenching mechanism
affects both radiative and photochemical energy dissipation
pathways. It is well documented that a plant under constraint
is often characterized by a lower light threshold for the
apparition of the NPQ. As a result, a lower Fs is observed
for a given light level (Cerovic et al., 1996; Flexas et al.,
2000; Gunther et al., 1994). However in the present case,
the change observed during the campaign concerns mainly
the long-term quenching associated with cold acclimation.
Although active and passive measurements were per-
formed with different targets and illumination conditions,
the fluorescence parameters measured with these two
techniques reveal the same evolution during the campaign.
Indeed, the time series obtained with the FIPAM confirmed
the previous conclusion. Fig. 11 shows an increasing level
of the maximal photochemical yield (Fv/Fm) and hence an
increase of the photosynthetic activity. These findings were
corroborated by the time series of the net CO2 assimilation
(Fig. 10). The effective electron transfer rate (DF/Fm), that
was measured continuously during the campaign, also
shows the same trend. It is necessary for this to consider
separately low light and high light conditions as shown in
Fig. 11.
One can conclude that interesting information on the
photosynthetic capacity of the vegetation is contained in
naturally-induced fluorescence variations, which can be
accessed by passive fluorescence remote sensing.
Another interesting result is the good correlation
between the PRI index and the net CO2 assimilation (Fig.
10). The PRI index is associated with two identified
mechanisms, involved in excess light dissipation as heat.
The first one corresponds to rapid changes in the
aggregation state of antenna chlorophyll–protein complexes
induced by the energisation of the thylakoid membrane. It
is accompanied by absorbance changes centered near 531–
535 nm (Bilger et al., 1989; Ruban et al., 1993). The
second one corresponds to the dynamic changes in the de-
epoxidation state of the xanthophyll cycle, which are
accompanied by absorbance changes at 505–515 nm
(Bilger et al., 1989; Heber, 1969; Heber et al., 1986;
Krause, 1973; Li et al., 2000). The absorption changes
generate a broad reflectance change around 531 nm,
including both mechanisms (Gamon et al., 1990). The
robustness of this correlation was strengthened in a recent
work on grape vines (Evain et al., 2004), which demon-
strated the existence of two phases. A rapid phase lasting
less than 2 s consists in a sudden drop of PRI immediately
after a steep increase in light intensity. A slow phase of
adjustment, after the initial rapid phase, lasts several
minutes. The rapid phase is probably ascribable to
chloroplast shrinkage following an increase of DpH and
partly due to the non-photochemical quenching involving
de-epoxidated xanthophylls; the slow phase is related to the
latter phenomenon. Importantly, it has been proposed by
Oquist and Huner (2003) that cold acclimation transforms
the xanthophyll-mediated non-photochemical antenna
quenching of absorbed light from a short-term dynamic
response to a long-term sustained quenching for the whole
winter period. This was supported by Ottander et al. (1995)
who showed that the carotenoid content of Scots pine
needles is subject to important accumulation during the
cold season followed by a decrease when the full photo-
synthetic capacity is recovered in June. These changes were
associated with a major reorganisation of the light-harvest-
ing complexes. The pigment analysis conducted for this
campaign confirmed a decrease of the carotenoid pool and
especially of the lutein pigment during spring recovery. The
good correlation found between the PRI and the net CO2
assimilation would imply that PRI is also sensitive to this
long-term sustained quenching. The steep increase of PRI
in June correlates with the relaxation of that NPQ, and thus
with the increase of the Scots pine photosynthetic activity.
The instrument required for the measurement of the PRI
index is much simpler than that needed for measurement of
CO2 assimilation. PRI would then be an interesting
alternative for the monitoring of photosynthetic activity at
the tree canopy scale, over wide area.
The results presented here show that passive fluores-
cence remote sensing is now possible at the canopy level,
at large distances and over a long period, even with
cloudy weather. The 687 /760 fluorescence ratio evolved
parallel to the Chl content and a dynamical study of
fluorescence showed the increase of photochemical activ-
ity. However, as the fluorescence signals strongly depend
on structural effects, modeling will be necessary for
further interpretation.
References
Adams, W. W., III, & Demmig-Adams, B. (1994). Carotenoid composition
and down regulation of photosystem II in three conifer species during
the winter. Physiologia Plantarum, 92, 451–458.
Apostol, S., Briantais, J. -M., Moise, N., Cerovic, Z. G., & Moya, I. (2001).
Photoinactivation of the photosynthetic electron transport chain by
accumulation of over-saturating light pulses given to dark adapted pea
leaves. Photosynthesis Research, 67, 215–227.
Aurela, M., Laurila, T., & Tuovinen, J. -P. (2001). Seasonal CO2
balances of a subarctic mire. Journal of Geophysical Research,
106(D2), 1623–1638.
Aurela, M., Laurila, T., & Tuovinen, J. -P. (2002). Annual CO2 balance of a
subarctic fen in northern Europe: The importance of the wintertime
efflux. Journal of Geophysical Research, 107(D21), 1–12.
Bilger, W., Bjfrkman, O., & Thayer, S. S. (1989). Light-induced spectral
absorbance changes in relation to photosynthesis and the epoxidation
state of xanthophyll cycle components in cotton leaves. Plant
physiology, 91, 542–551.
Cerovic, Z. G., Goulas, Y., Gorbunov, M., Briantais, J. -M., Camenen, L., &
Moya, I. (1996). Fluorosensing of water stress in plants. Diurnal
changes of the mean lifetime and yield of chlorophyll fluorescence,
measured simultaneously and at distance with a t-LIDAR and a
modified PAM-fluorimeter, in maize, sugar beet and KalanchoJ. RemoteSensing of Environment, 58, 311–321.
J. Louis et al. / Remote Sensing of Environment 96 (2005) 37–4848
Demmig-Adams, B., & Adams, W. W. I. (1992). Photoprotection and other
responses of plants to high light stress. Annual Review of Plant
Physiology and Plant Molecular Biology, 43, 599–626.
Evain, S., Camenen, L., & Moya, I. (2001). Three channels detector
for remote sensing of chlorophyll fluorescence and reflectance from
vegetation, 8th international symposium: Physical measurements
and signatures in remote sensing, Aussois, France, CNES, M.
Leroy (pp. 395–400).
Evain, S., Flexas, J., & Moya, I. (2004). A new instrument for passive
remote sensing: 2. Measurement of leaf and canopy reflectance changes
at 531 nm and their relationship with photosynthesis and chlorophyll
fluorescence. Remote Sensing of Environment, 91, 175–185.
Flexas, J., Briantais, J. -M., Cerovic, Z. G., Medrano, H., & Moya, I.
(2000). Steady-state and maximum chlorophyll fluorescence responses
to water stress in grapevine leaves: A new remote sensing system.
Remote Sensing of Environnment, 73, 283–297.
Gamon, J. A., Field, C. B., Bilger, W., Bjfrkman, O., Fredeen, A. L., &
Penuelas, J. (1990). Remote sensing of xanthophyll cycle and
chlorophyll fluorescence in sunflower leaves and canopies. Oecologia,
85, 1–7.
Gilmore, A. M., & Ball, M. C. (2000). Protection and storage of chlorophyll
in overwintering evergreens. Proceedings of the National Academy of
Sciences, 97, 11098–11101.
Gitelson, A. A., Buschmann, C., & Lichtenthaler, H. K. (1999). The
chlorophyll fluorescence ratio F735/F700 as an accurate measurement
of the chlorophyll content in plants. Remote Sensing of Environment,
69, 296–302.
Gqnther, K. P., Dahn, H. -G., & Lqdeker, W. (1994). Remote sensing
vegetation status by laser-induced fluorescence. Remote Sensing of
Environment, 47, 10–17.
Hapke, B., DiMucci, D., Nelson, R., & Smythe, W. (1996). The cause of
the hot spot in vegetation canopies and soils: Shadow-hiding versus
coherent backscatter. Remote Sensing of Environment, 58, 63–68.
Heber, U. (1969). Conformational changes of chloroplasts induced by
illumination of leaves in vivo. Biochimica et Biophysica Acta, 180,
302–319.
Heber, U., Neimanis, S., & Lange, O. L. (1986). Stomatal aperture,
photosynthesis and water fluxes in mesophyll cells as affected by the
abscission of leaves. Simultaneous measurements of gas exchange, light
scattering and chlorophyll fluorescence. Planta, 167, 554–562.
Ivanov, A. G., Sane, P., Zeilanov, Y., Malmberg, G., Gardestrfm, P., Huner,
N. P. A., et al. (2001). Photosynthetic electron transport adjustments in
overwintering Scots pine (Pinus sylvestris L.). Planta, 213, 575–585.
Krause, G. H. (1973). The high-energy state of the thylakoid system as
indicated by chlorophyll fluorescence and chloroplast shrinkage.
Biochimica et Biophysica Acta, 292, 715–728.
Kuusk, A. (1985). The hot spot effect of a uniform vegetative cover. Soviet
Journal of Remote Sensing, 3, 645–658.
Li, X. -P., Bjfrkman, O., Shih, C., Grossman, A. R., Rosenquist, M.,
Jansson, S., et al. (2000). A pigment-binding protein essential for
regulation of photosynthetic light harvesting. Nature, 403, 391–395.
Moya, I., Camenen, L., Evain, S., Goulas, Y., Cerovic, Z. C., Latouche, G.,
et al. (2004). A new instrument for passive remote sensing: 1.
Measurements of sunlight induced chlorophyll fluorescence. Remote
Sensing of Environment, 91, 186–197.
Moya, I., Camenen, L., Latouche, G., Mauxion, C., Evain, S., & Cerovic, Z. G.
(1998). An instrument for the measurement of sunlight excited plant
fluorescence. Photosynthesis: Mechanisms and effects (pp. 4265–4270).
G. Garab, Dordrecht7 Kluwer Academic Pub., V.
Niyogi, K. K. (1999). Photoprotection revisited: Genetic and molecular
approaches. Annual Review of Plant Physiology and Plant Molecular
Biology, 50, 333–359.
Oquist, G., & Huner, N. P. A. (2003). Photosynthesis of overwintering
evergreen plants. Annual Review of Plant Biology, 54, 329–355.
Ottander, C., Douglas, C., & Oquist, G. (1995). Seasonal changes in
photosystem II organisation and pigment composition in Pinus
sylvestris. Planta, 197, 176–183.
Plascyk, J. A. (1975). The MK II Fraunhofer line discriminator (FLD-II) for
airborne and orbital remote sensing of solar-stimulated luminescence.
Optical Engineering, 14, 339–346.
Plascyk, J. A., & Gabriel, F. C. (1975). The Fraunhofer line discriminator
MKII-An airborne instrument for precise and standardized ecological
luminescence measurements. IEEE Transactions on Instrumentation
and Measurement, 24, 306–313.
Ruban, A. V., Horton, P., & Young, A. J. (1993). Aggregation of higher
plant xanthophylls—differences in absorption spectra and in the
dependency on solvent polarity. Journal of Photochemistry and
Photobiology, B, Biology, 21, 229–234.
Tucker, C. J. (1979). Red and photographic infrared linear combination for
monitoring vegetation. Remote Sensing of Environment, 8, 127–150.


![] U o ; . f * f # Remote Sensing, What is it ? Reflectance ... sensing. When any substance on the Earth receives electromagnetic waves such as sunlight, the substances have reflective](https://img.pdfslide.net/doc/110x75/5b2e8b9a7f8b9a91438c0278/-u-o-f-f-remote-sensing-what-is-it-reflectance-sensing-when-any.jpg)