Embed Size (px)
Citation preview
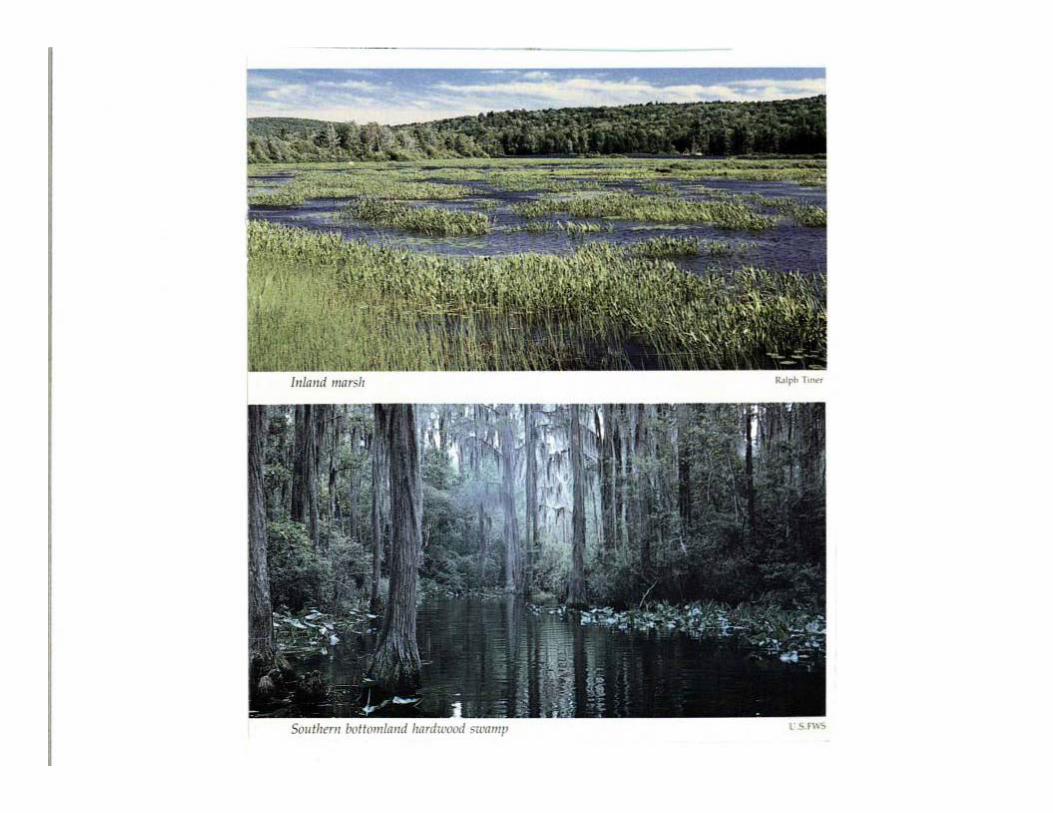
Remote Sensing of Wetland Change
Vic KlemasRichard Field
Oliver Weatherbee
Center for Remote SensingCollege of Marine and Earth Studies
University of Delaware
SYSTEM & TECHNIQUE EVALUATION
Working with NOAA/NERRS, USC, NOAA/CSC, DSU and Delaware DNREC, we have been evaluating estuarine habitat mapping and change detection techniques using imagery:
• aerial hyperspectral (AISA/CALMIT)• aerial multispectral (digital camera)• IKONOS multispectral (QuickBird)• Landsat/TM multispectral
Tests were conducted on land cover, emergent wetlands and submerged vegetation at four NERRS sites:
• St. Jones River & Blackbird Creek, Delaware• ACE Basin, South Carolina• Grand Bay, Mississippi• Padilla Bay, Washington
TYPICAL NERRS HABITAT QUESTIONSADDRESSED BY REMOTE SENSING
1. What is the extent of emergent, intertidal & submerged habitat?(Baseline mapping of habitat spatial distribution and abundance)
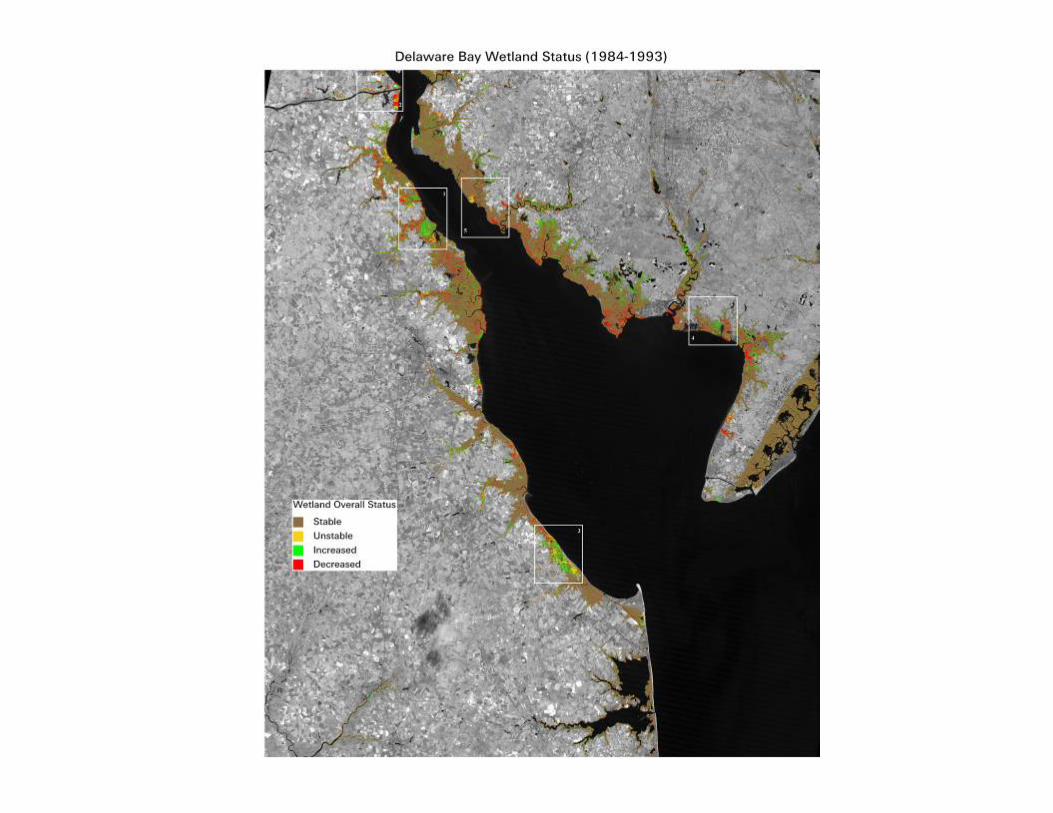
2. How is the emergent, intertidal & submerged habitat changing?(Long term change monitoring)
3. How is the suburban sprawl and coastal development impacting reserves and their watersheds?(Watershed land cover mapping)
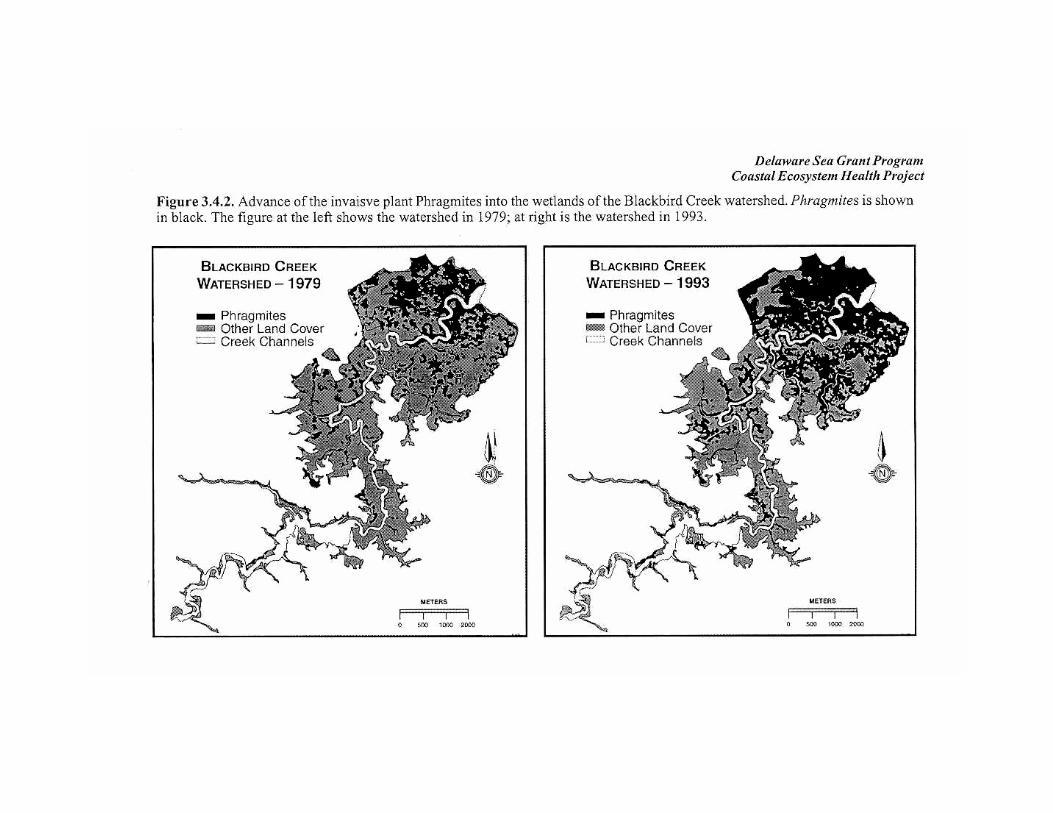
4. How have invasive plants impacted habitat? (Hyperspectral mapping of Phragmites.
5. How diverse is each NERRS site in terms of habitat types?(Hyperspectral discrimination of plant species)
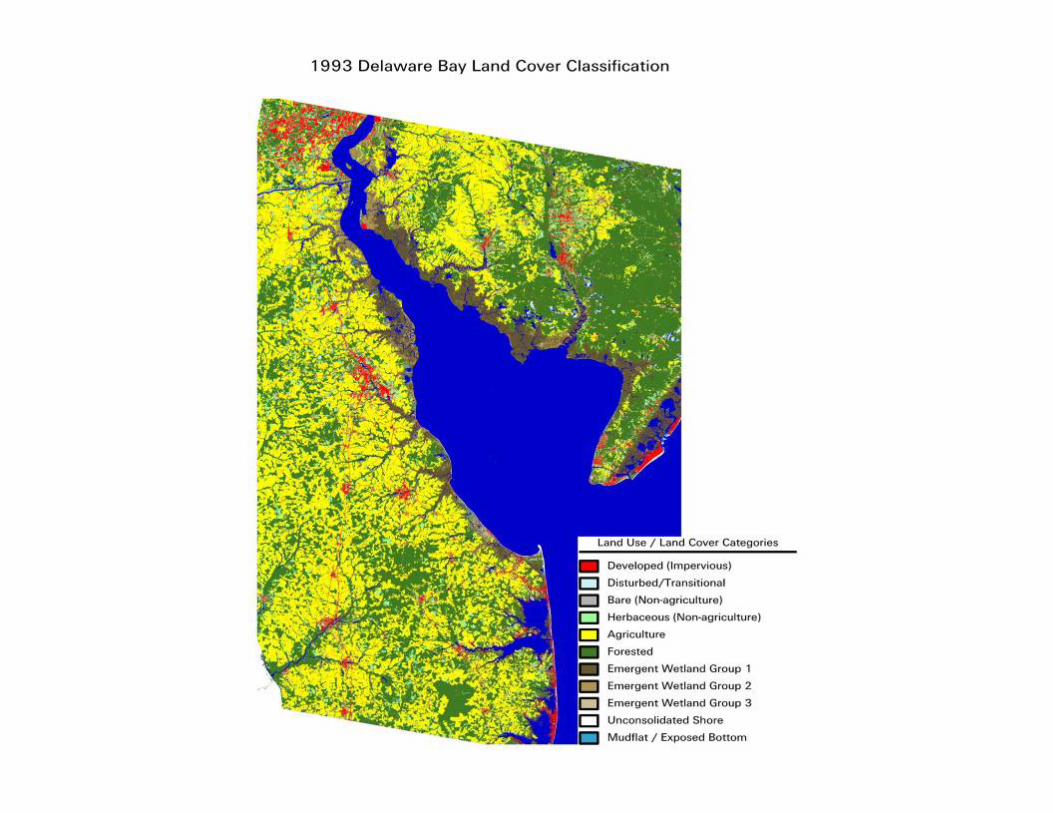
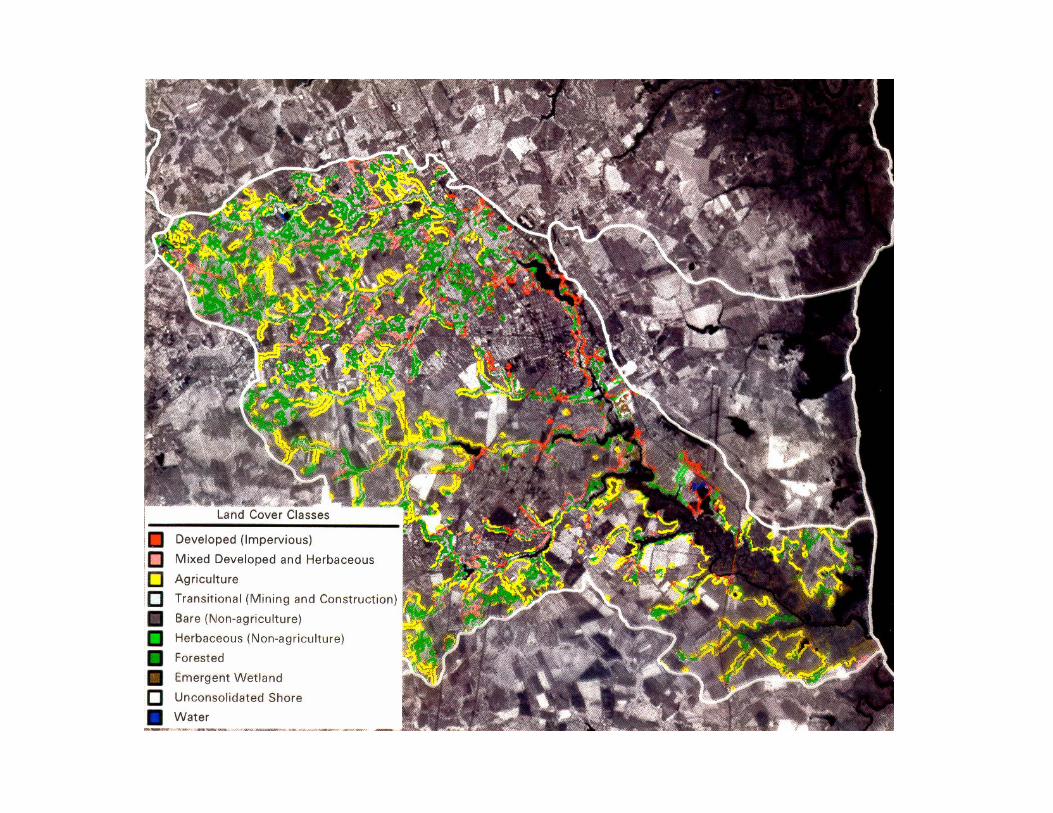
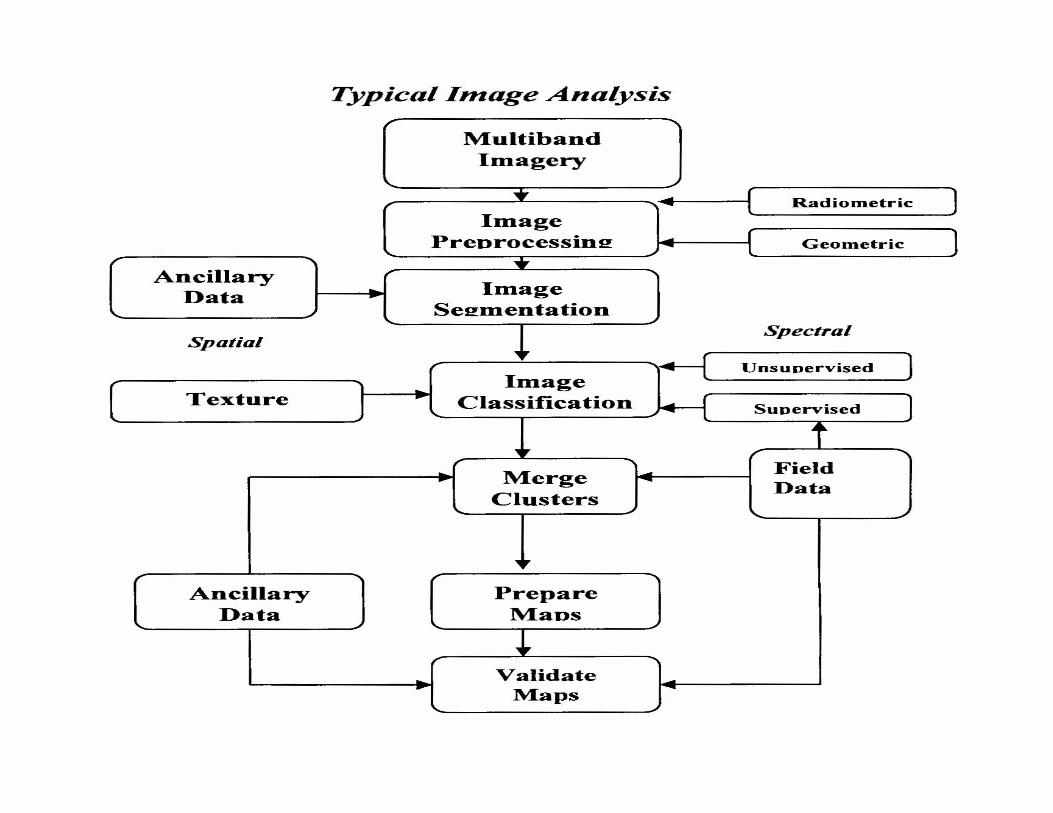
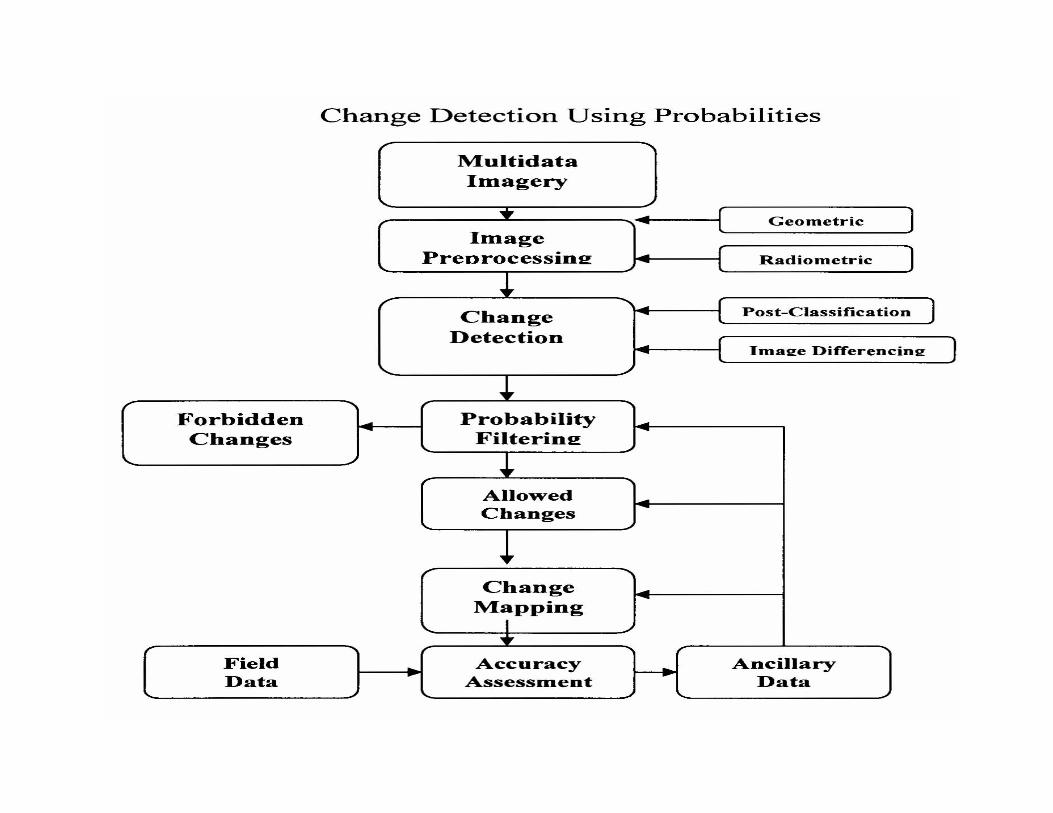
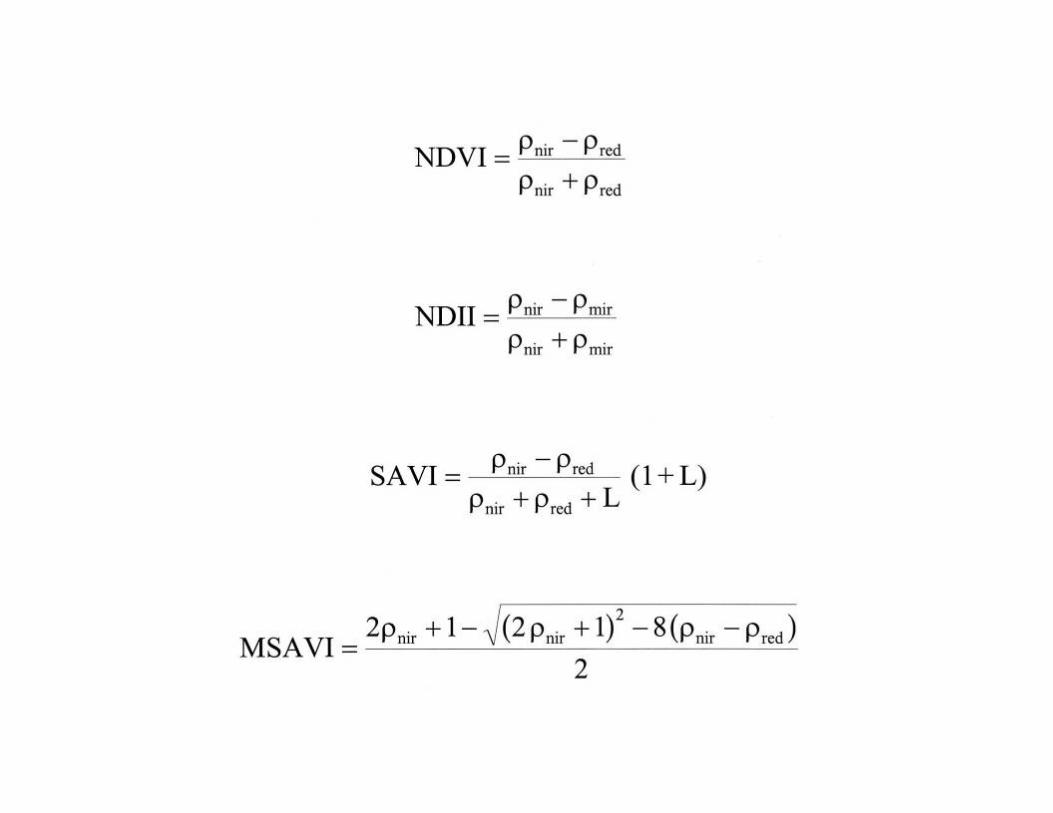
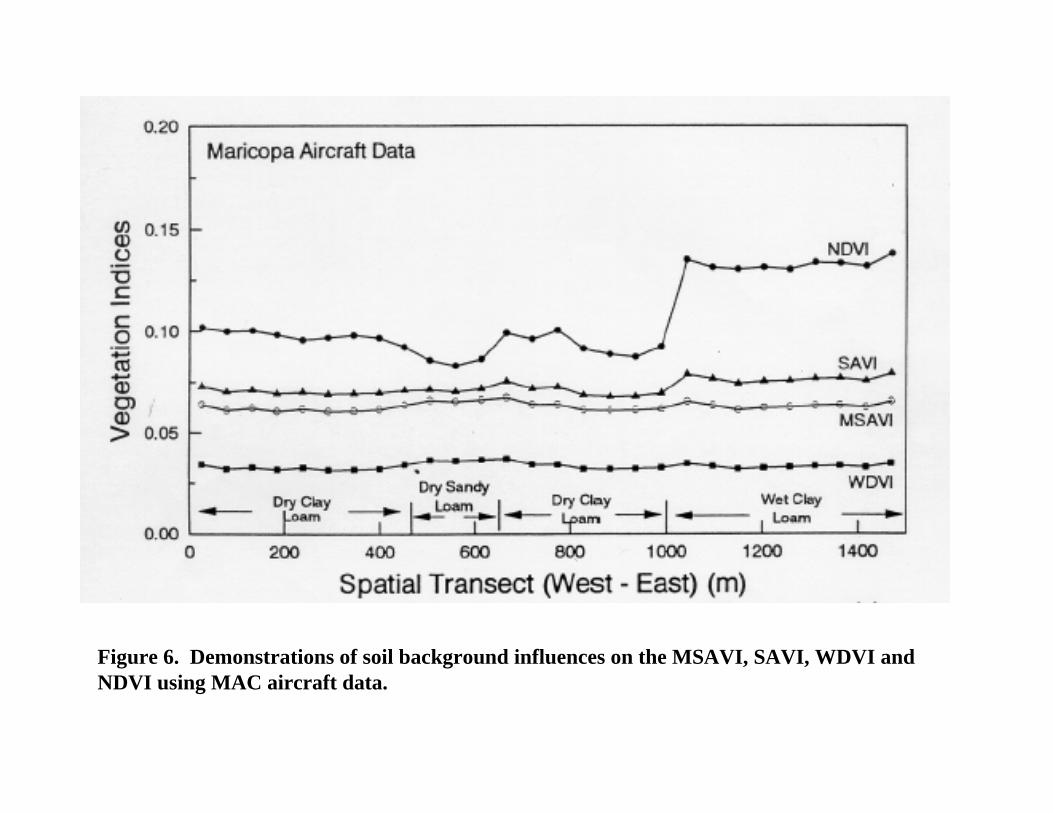
Figure 6. Demonstrations of soil background influences on the MSAVI, SAVI, WDVI and NDVI using MAC aircraft data.
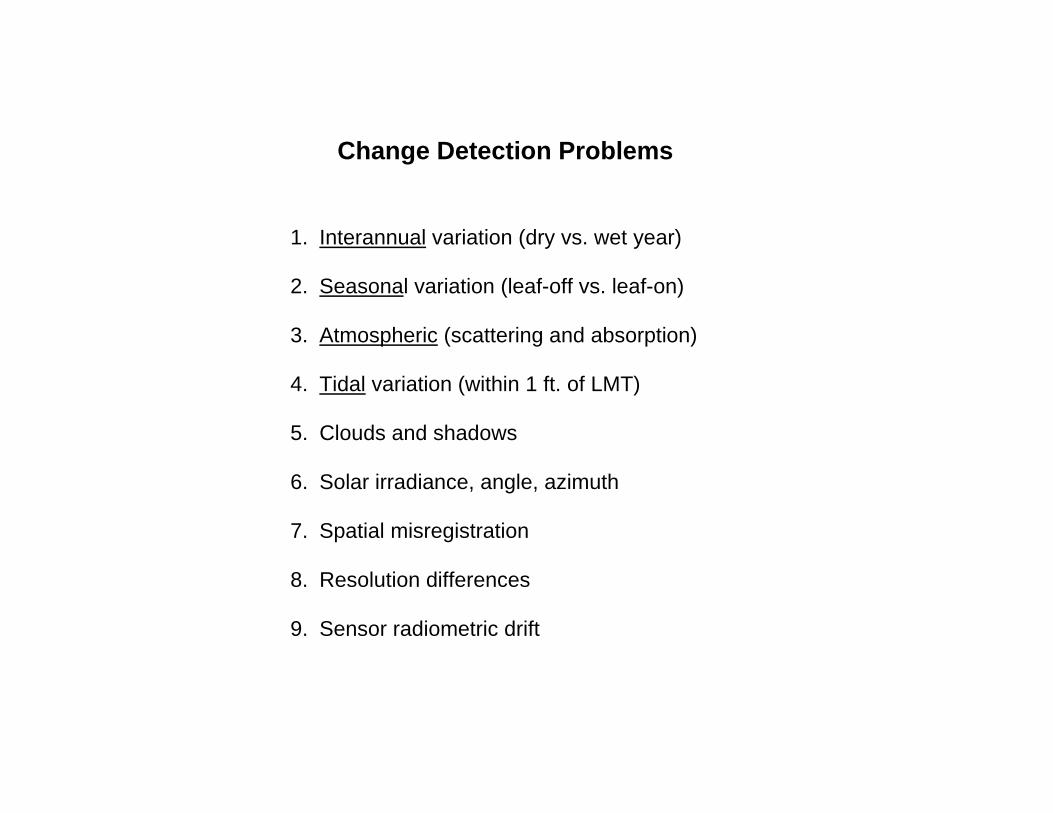
Change Detection Problems
1. Interannual variation (dry vs. wet year)
2. Seasonal variation (leaf-off vs. leaf-on) 3. Atmospheric (scattering and absorption) 4. Tidal variation (within 1 ft. of LMT)
5. Clouds and shadows
6. Solar irradiance, angle, azimuth
7. Spatial misregistration
8. Resolution differences
9. Sensor radiometric drift
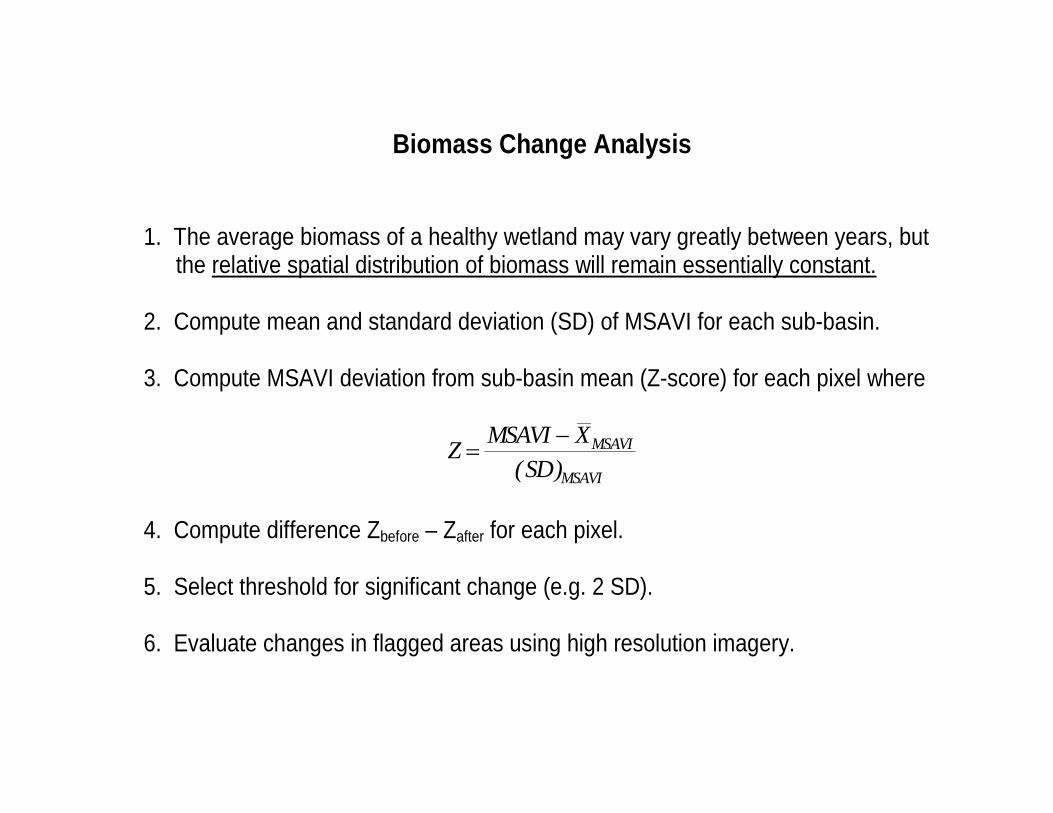
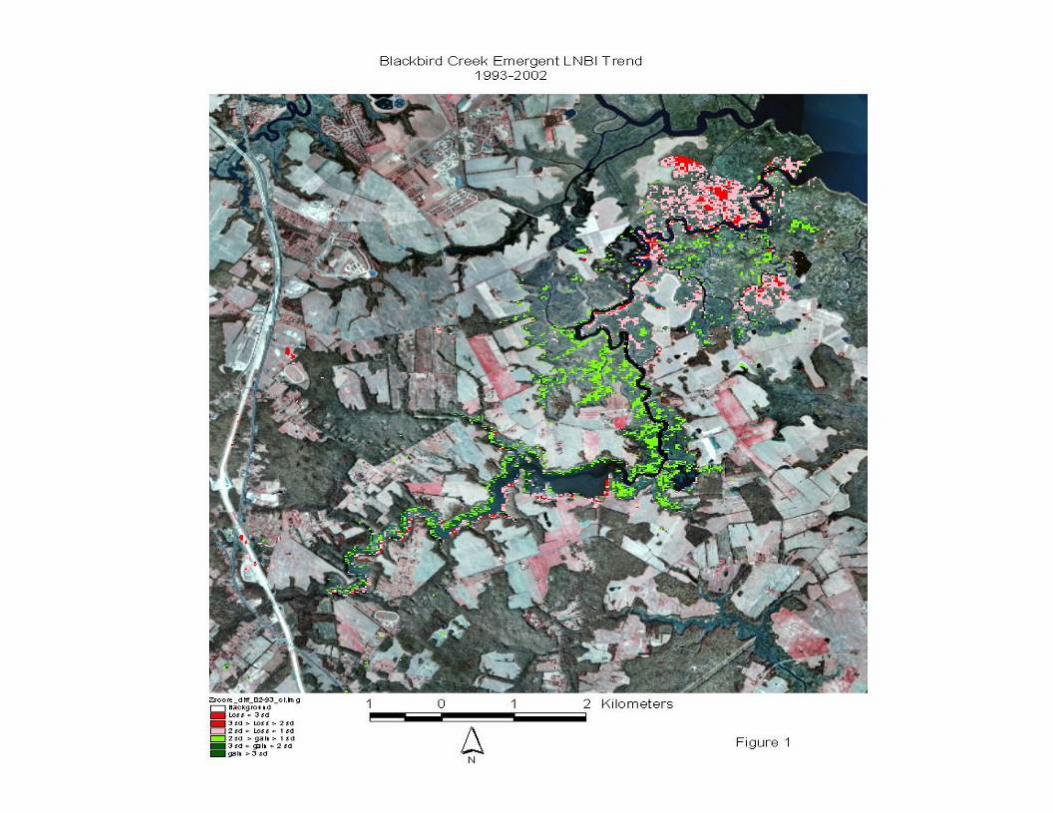
Biomass Change Analysis 1. The average biomass of a healthy wetland may vary greatly between years, but
the relative spatial distribution of biomass will remain essentially constant. 2. Compute mean and standard deviation (SD) of MSAVI for each sub-basin. 3. Compute MSAVI deviation from sub-basin mean (Z-score) for each pixel where
Z MSAVI XSD
MSAVI
MSAVI=
−( )
4. Compute difference Zbefore – Zafter for each pixel. 5. Select threshold for significant change (e.g. 2 SD). 6. Evaluate changes in flagged areas using high resolution imagery.
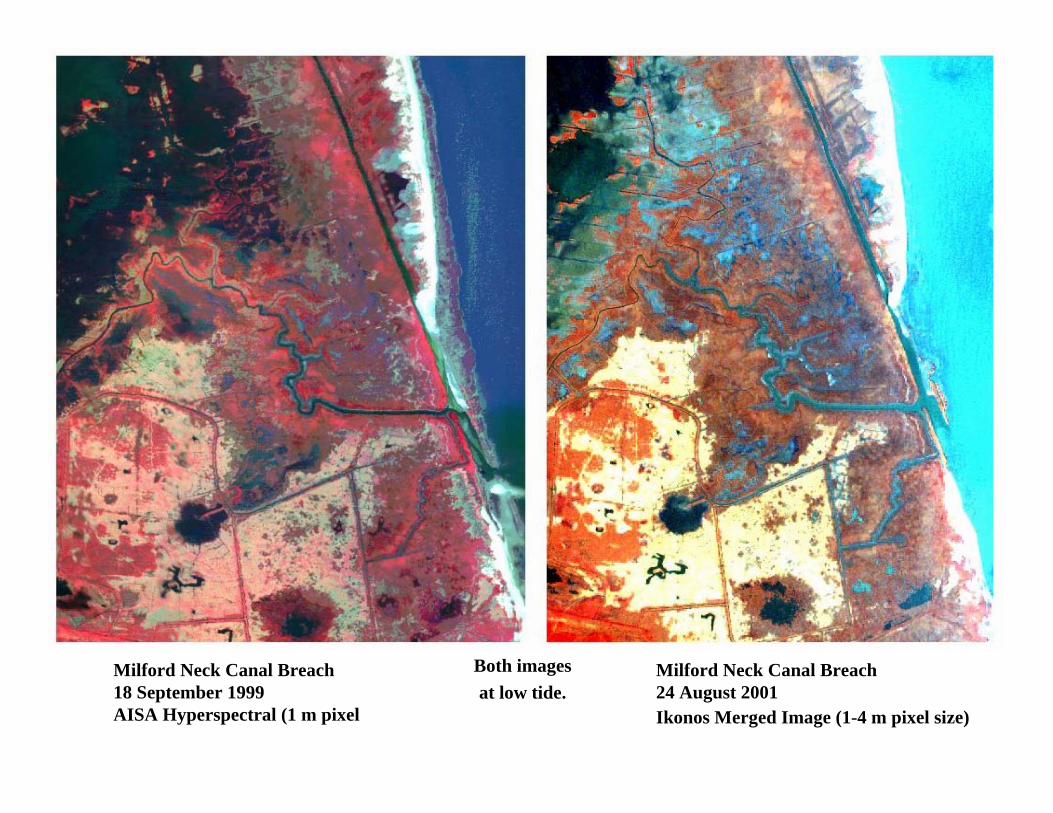
Milford Neck Canal Breach18 September 1999AISA Hyperspectral (1 m pixel size)
Milford Neck Canal Breach24 August 2001Ikonos Merged Image (1-4 m pixel size)
Both images at low tide.
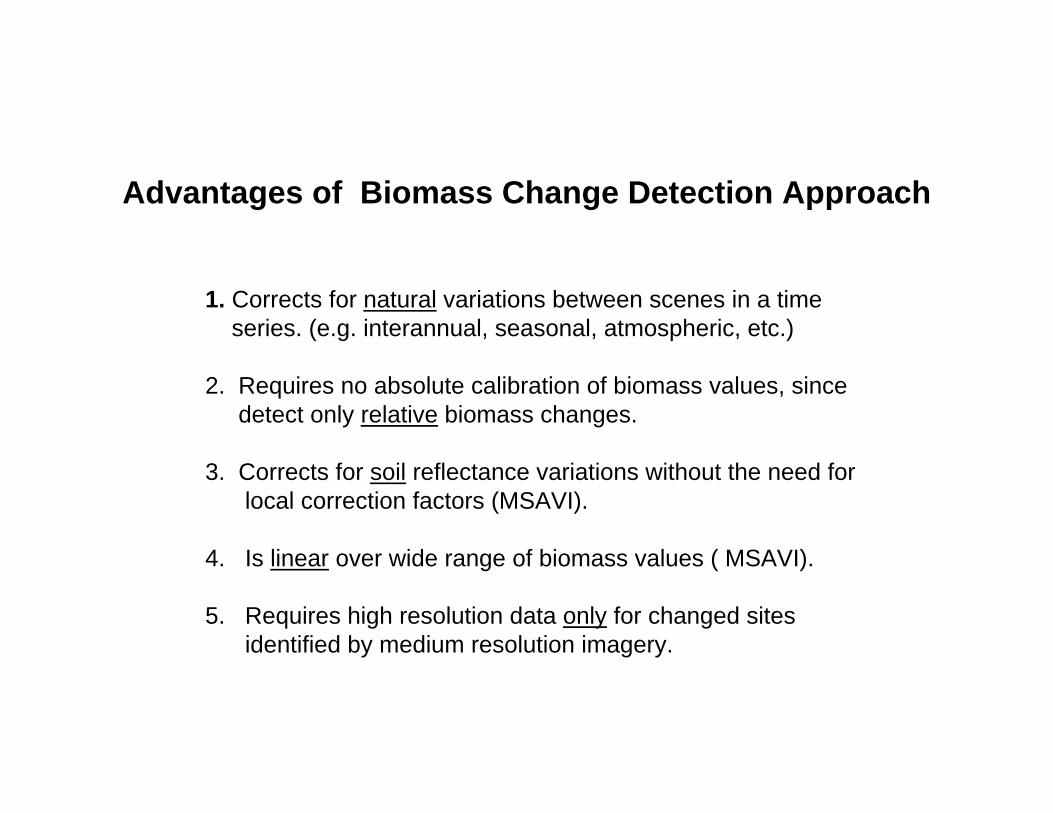
Advantages of Biomass Change Detection Approach
1. Corrects for natural variations between scenes in a time series. (e.g. interannual, seasonal, atmospheric, etc.)
2. Requires no absolute calibration of biomass values, sincedetect only relative biomass changes.
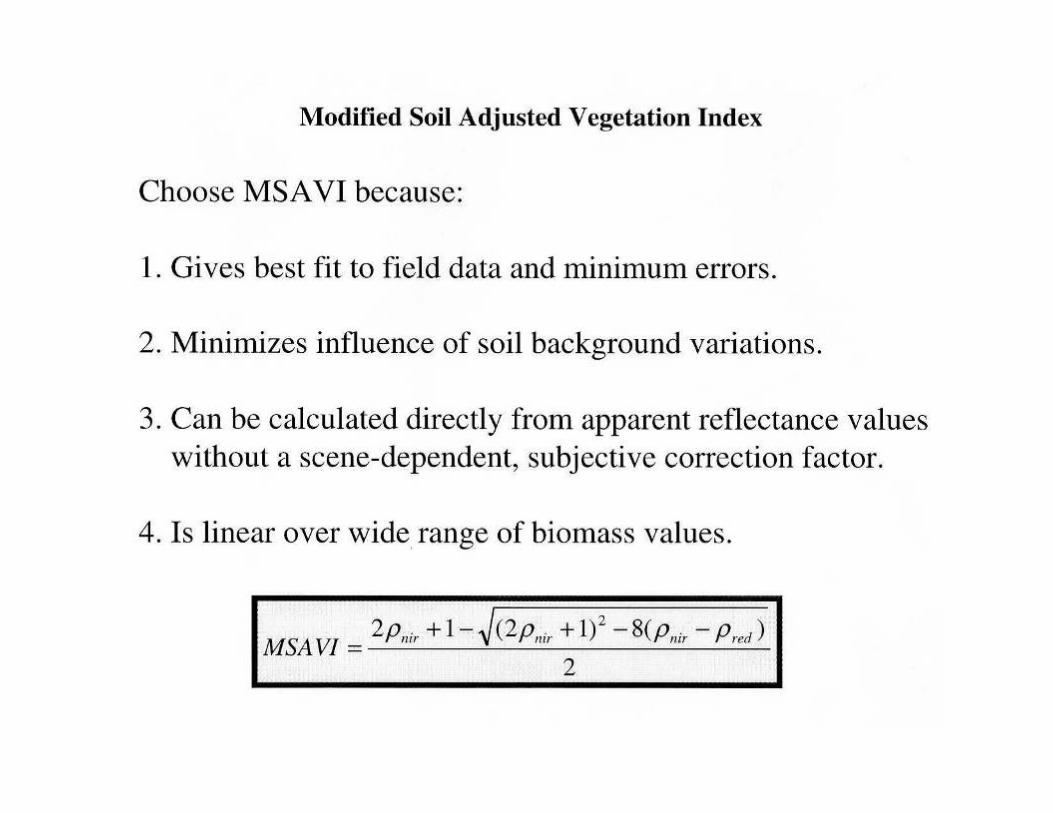
3. Corrects for soil reflectance variations without the need for local correction factors (MSAVI).
4. Is linear over wide range of biomass values ( MSAVI).
5. Requires high resolution data only for changed sitesidentified by medium resolution imagery.
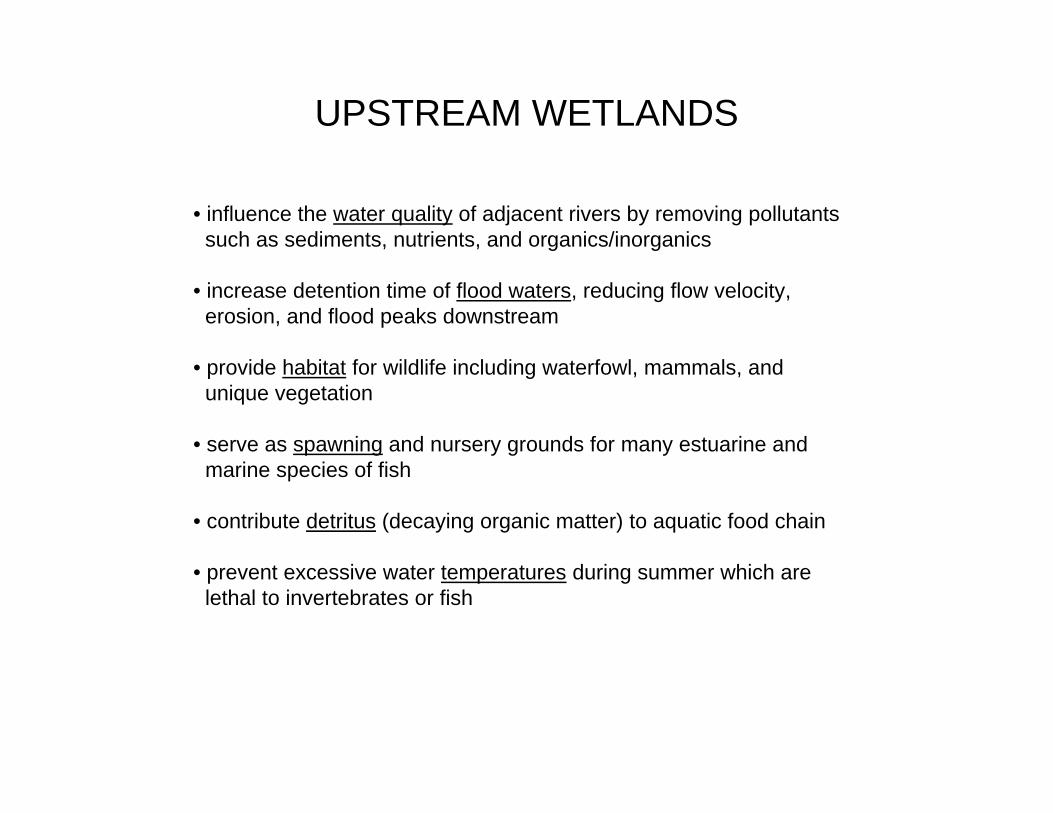
UPSTREAM WETLANDS
• influence the water quality of adjacent rivers by removing pollutants such as sediments, nutrients, and organics/inorganics
• increase detention time of flood waters, reducing flow velocity, erosion, and flood peaks downstream
• provide habitat for wildlife including waterfowl, mammals, and unique vegetation
• serve as spawning and nursery grounds for many estuarine and marine species of fish
• contribute detritus (decaying organic matter) to aquatic food chain
• prevent excessive water temperatures during summer which are lethal to invertebrates or fish
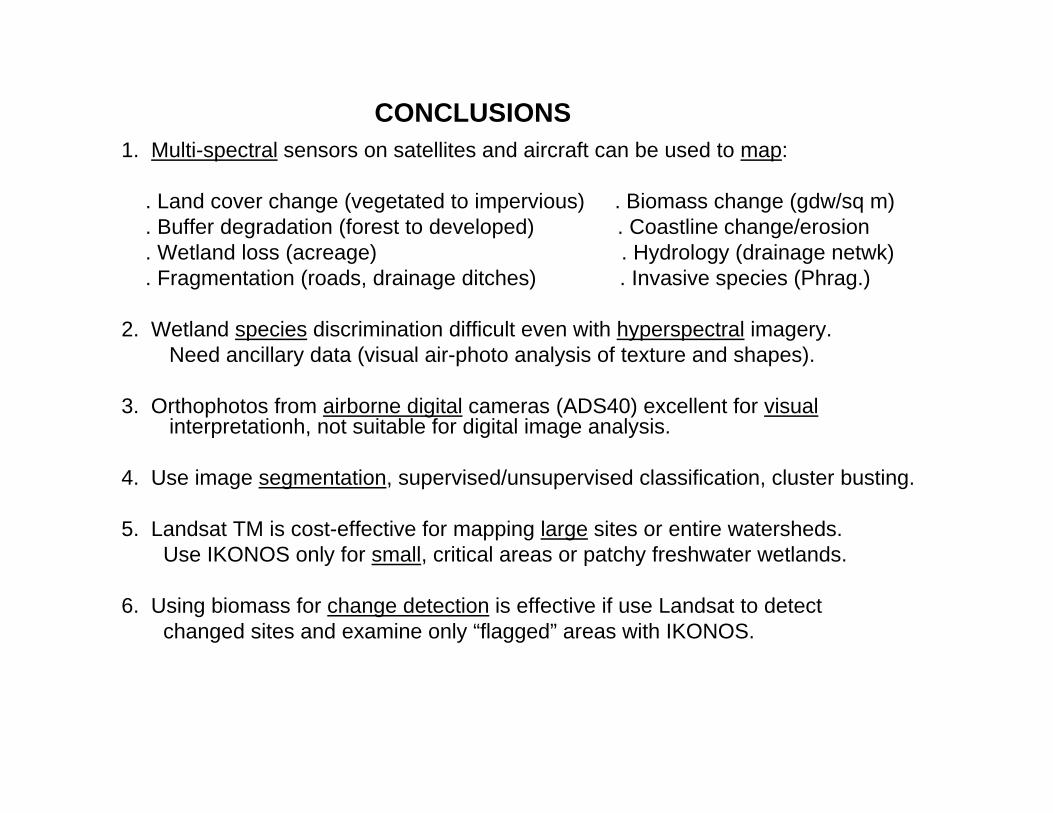
CONCLUSIONS1. Multi-spectral sensors on satellites and aircraft can be used to map:
. Land cover change (vegetated to impervious) . Biomass change (gdw/sq m)
. Buffer degradation (forest to developed) . Coastline change/erosion
. Wetland loss (acreage) . Hydrology (drainage netwk)
. Fragmentation (roads, drainage ditches) . Invasive species (Phrag.)
2. Wetland species discrimination difficult even with hyperspectral imagery.Need ancillary data (visual air-photo analysis of texture and shapes).
3. Orthophotos from airborne digital cameras (ADS40) excellent for visual interpretationh, not suitable for digital image analysis.
4. Use image segmentation, supervised/unsupervised classification, cluster busting.
5. Landsat TM is cost-effective for mapping large sites or entire watersheds. Use IKONOS only for small, critical areas or patchy freshwater wetlands.
6. Using biomass for change detection is effective if use Landsat to detect changed sites and examine only “flagged” areas with IKONOS.
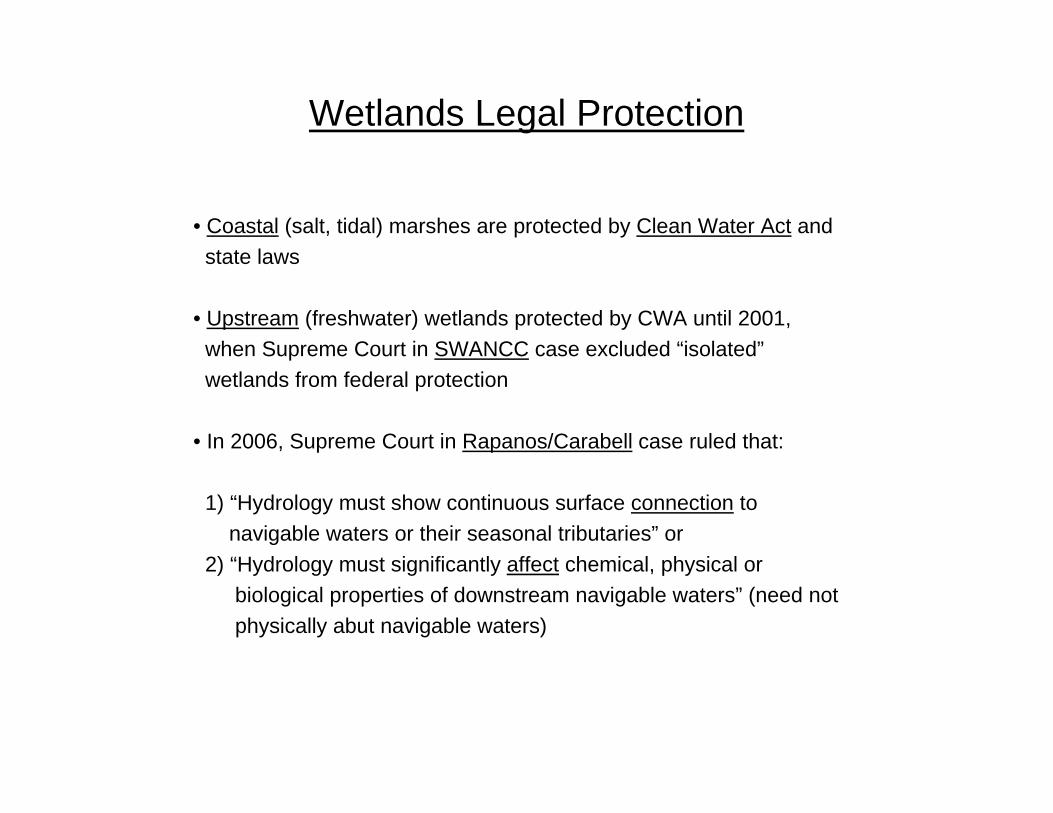
Wetlands Legal Protection
• Coastal (salt, tidal) marshes are protected by Clean Water Act and state laws
• Upstream (freshwater) wetlands protected by CWA until 2001, when Supreme Court in SWANCC case excluded “isolated”wetlands from federal protection
• In 2006, Supreme Court in Rapanos/Carabell case ruled that:
1) “Hydrology must show continuous surface connection to navigable waters or their seasonal tributaries” or
2) “Hydrology must significantly affect chemical, physical or biological properties of downstream navigable waters” (need not physically abut navigable waters)
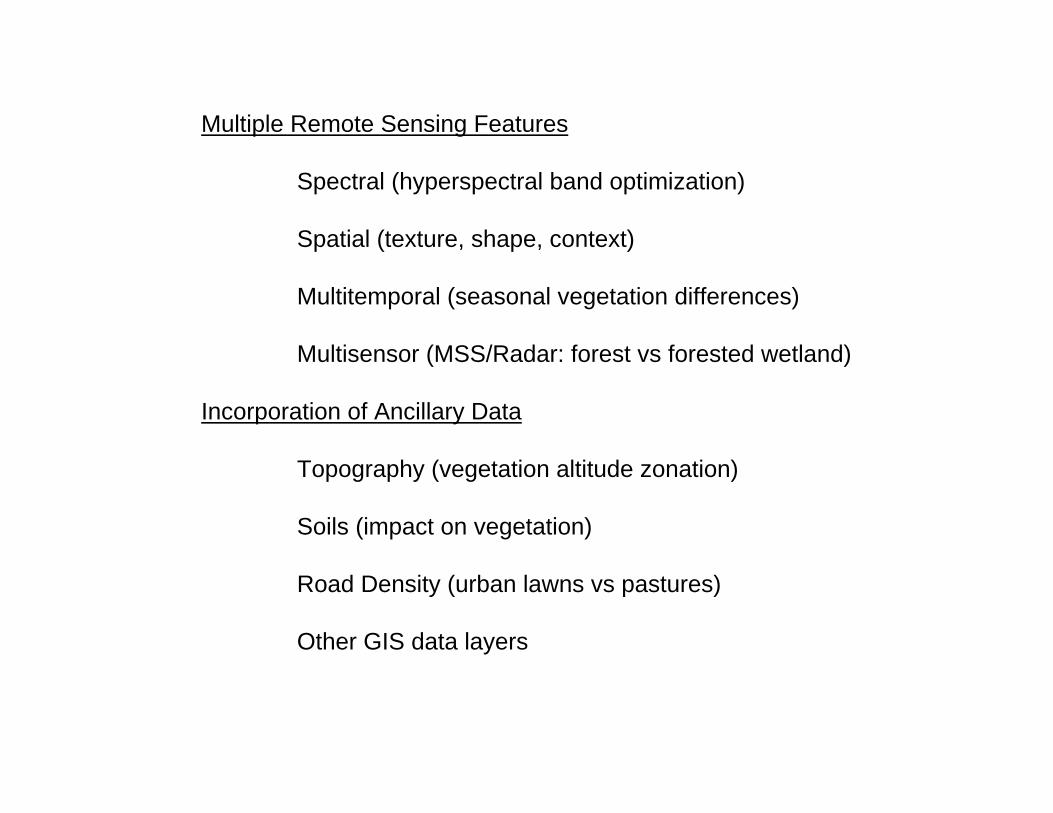
Multiple Remote Sensing Features
Spectral (hyperspectral band optimization)
Spatial (texture, shape, context)
Multitemporal (seasonal vegetation differences)
Multisensor (MSS/Radar: forest vs forested wetland)
Incorporation of Ancillary Data
Topography (vegetation altitude zonation)
Soils (impact on vegetation)
Road Density (urban lawns vs pastures)
Other GIS data layers

END
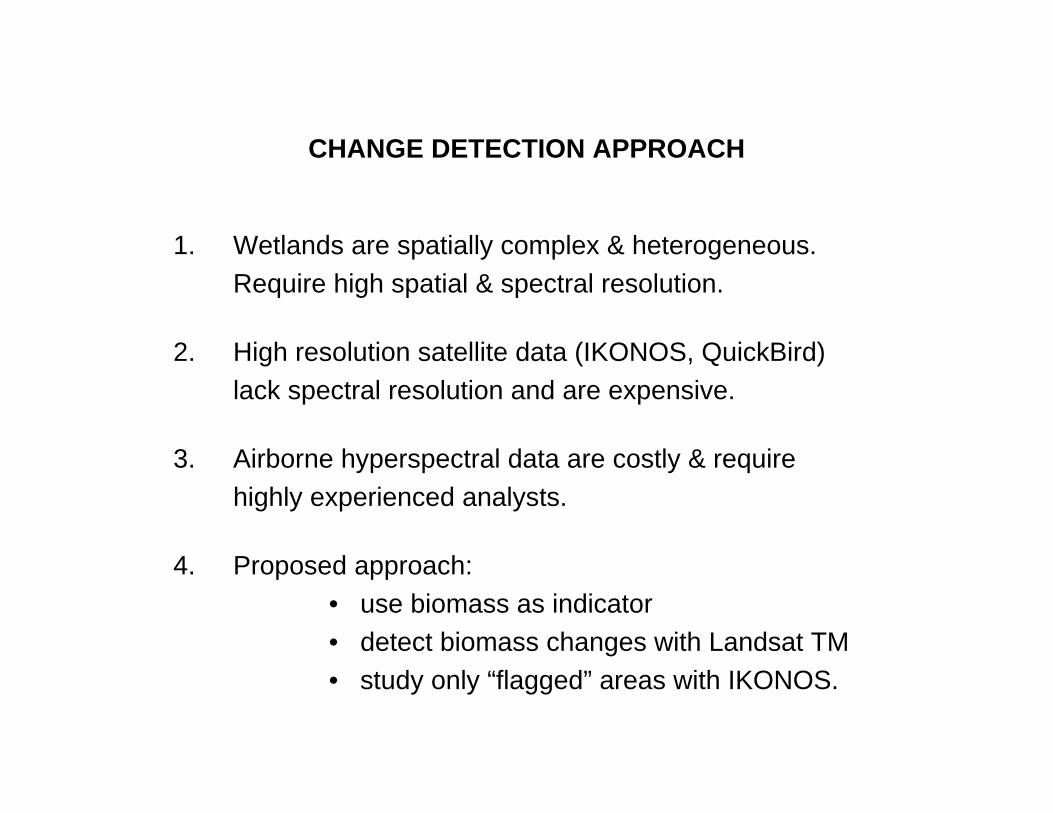
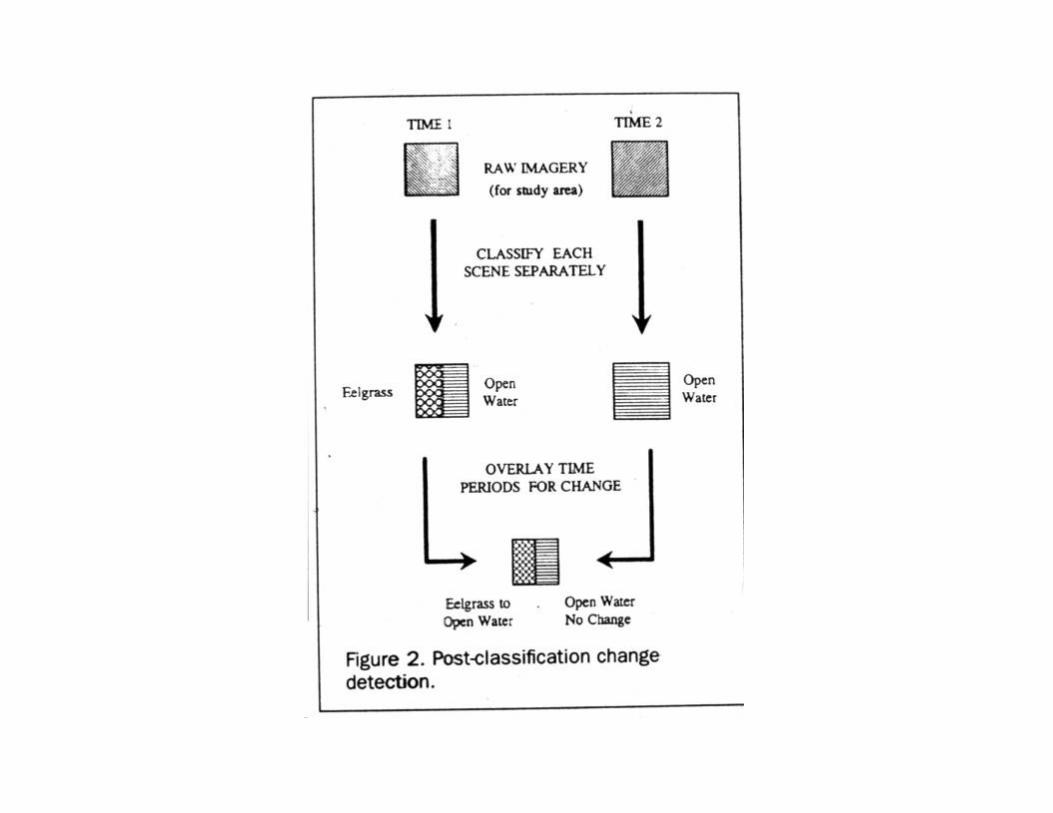
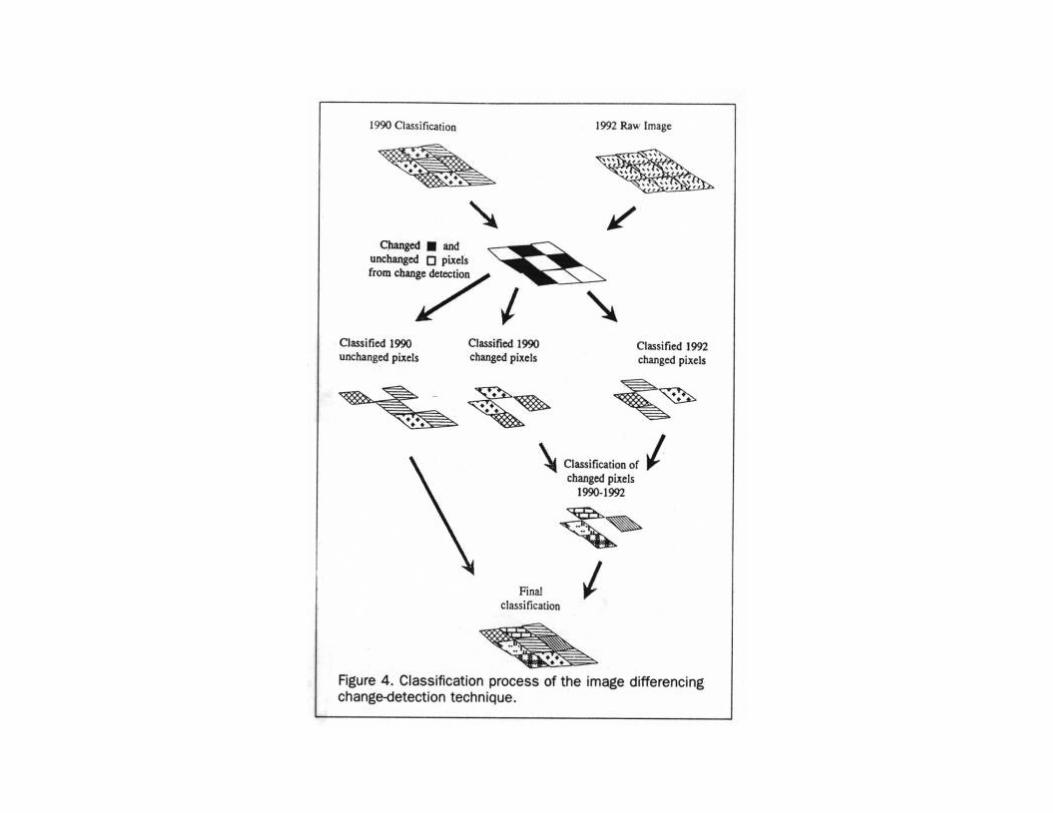
CHANGE DETECTION APPROACH
1. Wetlands are spatially complex & heterogeneous.Require high spatial & spectral resolution.
2. High resolution satellite data (IKONOS, QuickBird)lack spectral resolution and are expensive.
3. Airborne hyperspectral data are costly & require highly experienced analysts.
4. Proposed approach:• use biomass as indicator• detect biomass changes with Landsat TM• study only “flagged” areas with IKONOS.
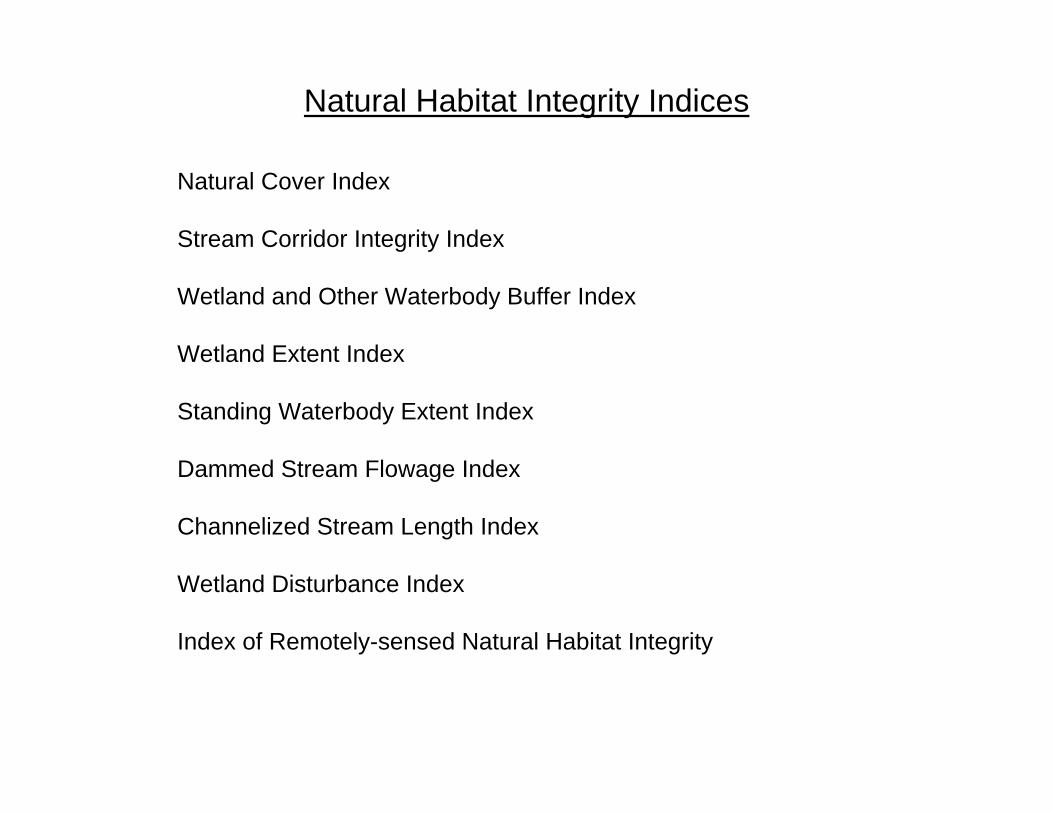
Natural Habitat Integrity Indices
Natural Cover Index
Stream Corridor Integrity Index
Wetland and Other Waterbody Buffer Index
Wetland Extent Index
Standing Waterbody Extent Index
Dammed Stream Flowage Index
Channelized Stream Length Index
Wetland Disturbance Index
Index of Remotely-sensed Natural Habitat Integrity
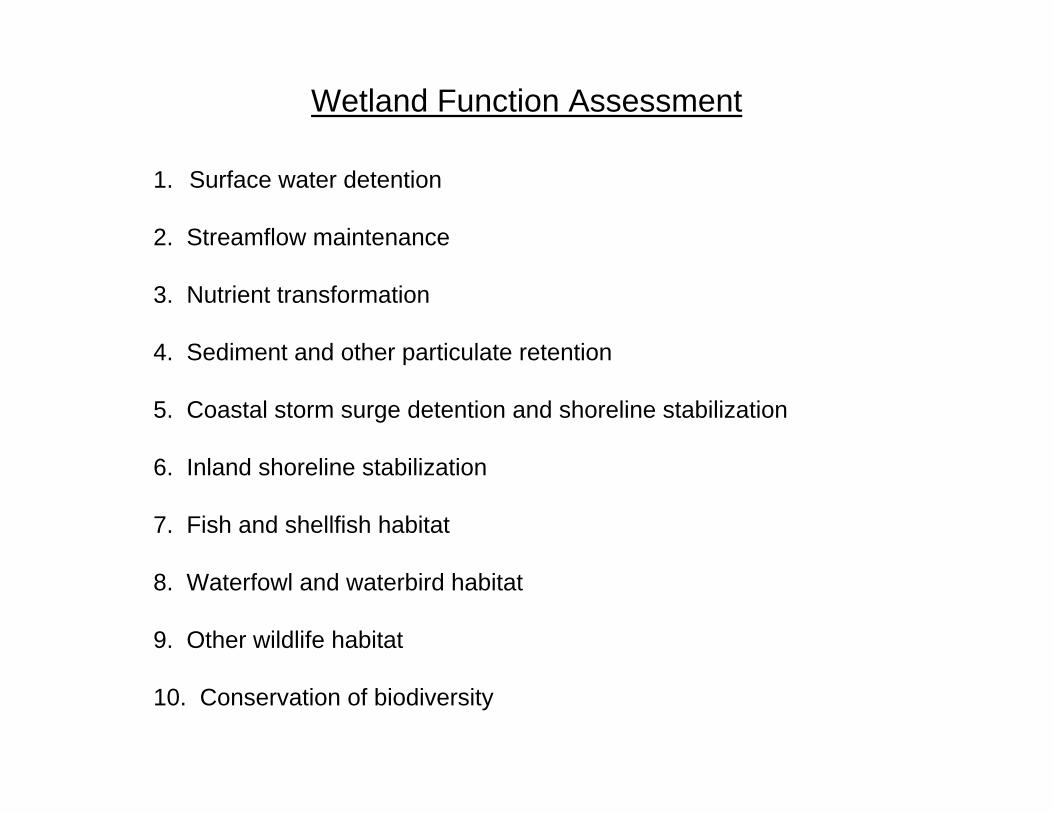
Wetland Function Assessment
1. Surface water detention
2. Streamflow maintenance
3. Nutrient transformation
4. Sediment and other particulate retention
5. Coastal storm surge detention and shoreline stabilization
6. Inland shoreline stabilization
7. Fish and shellfish habitat
8. Waterfowl and waterbird habitat
9. Other wildlife habitat
10. Conservation of biodiversity
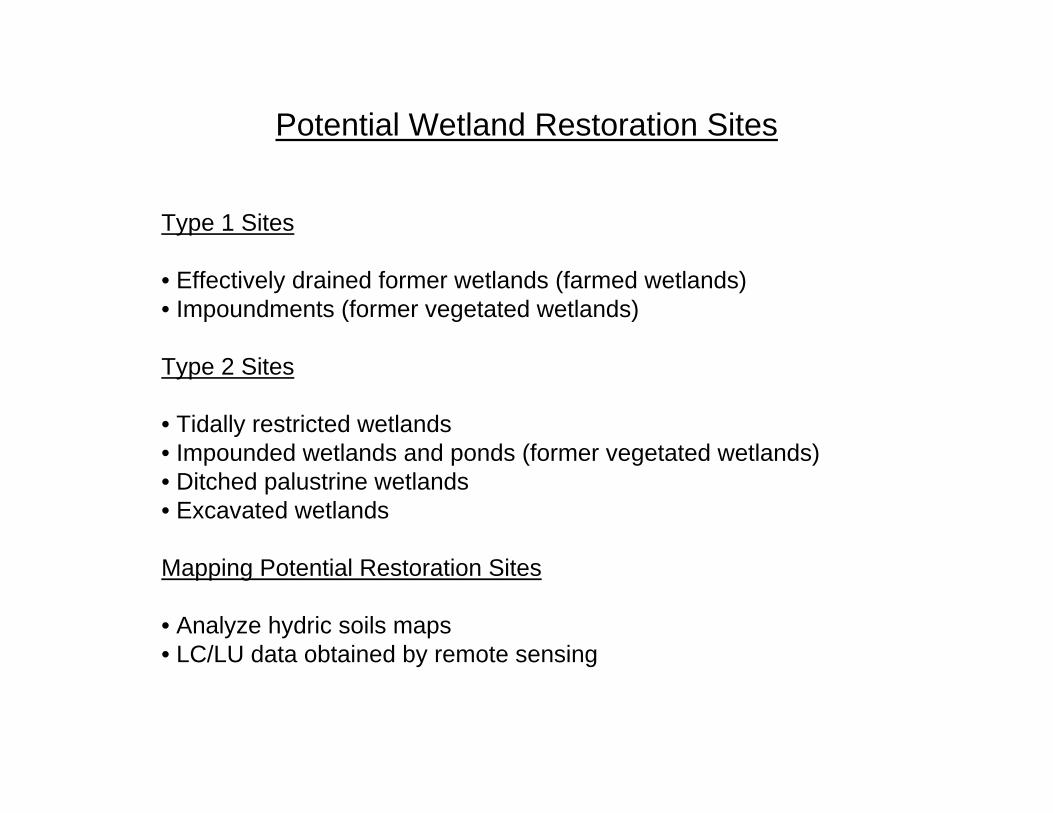
Potential Wetland Restoration Sites
Type 1 Sites
• Effectively drained former wetlands (farmed wetlands)• Impoundments (former vegetated wetlands)
Type 2 Sites
• Tidally restricted wetlands• Impounded wetlands and ponds (former vegetated wetlands)• Ditched palustrine wetlands• Excavated wetlands
Mapping Potential Restoration Sites
• Analyze hydric soils maps• LC/LU data obtained by remote sensing
Wetlands Fragmentation
Wetlands that are divided into two or more units by roads, railroads, or other structures which likely disrupt the hydrology and create increased risk for wildlife crossing
• wetlands chopped up into multiple pieces by developments and associated roadways
• large wetlands crossed by major highways
In-Stream Habitat Quality Decline
Severe degradation occurred when:
• agricultural land use in watershed exceeds 50%• urban land use in watershed exceeds 20%
* Ralph Tiner, et al. (2000)“Watershed-based Wetland Characterization for Maryland’s Coastal Bay Watersheds”.
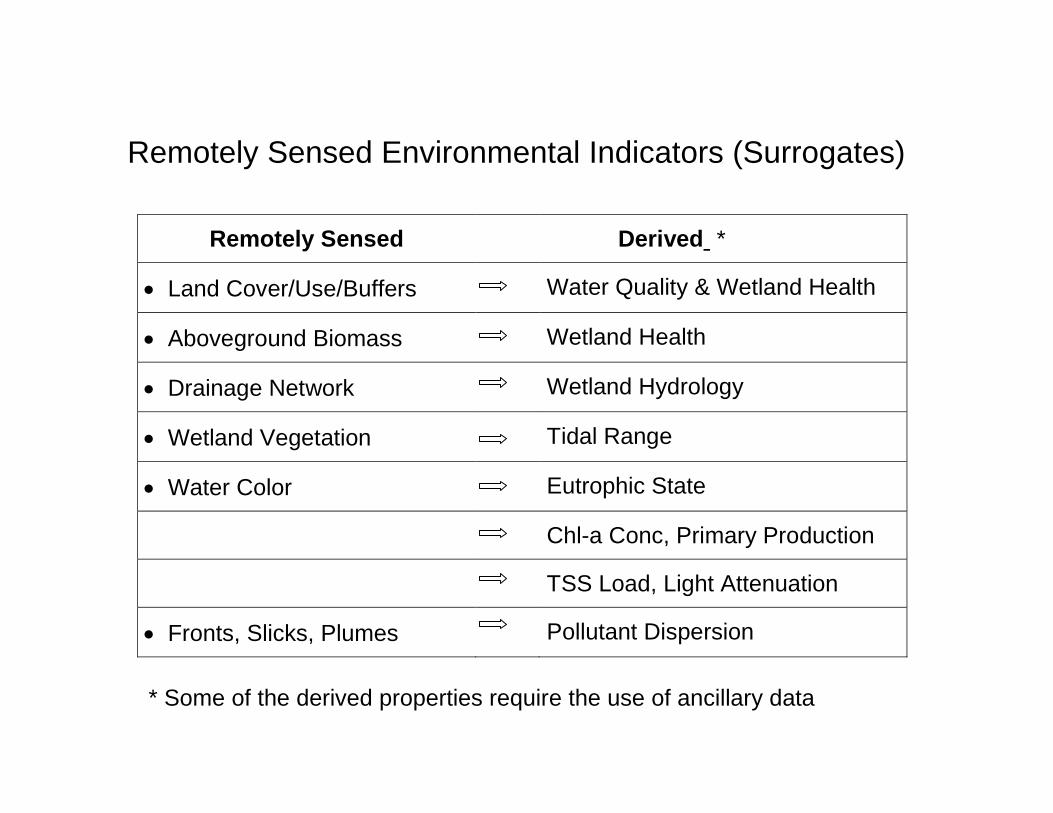
Remotely Sensed Environmental Indicators (Surrogates)
Remotely Sensed Derived *
• Land Cover/Use/Buffers Water Quality & Wetland Health
• Aboveground Biomass Wetland Health
• Drainage Network Wetland Hydrology
• Wetland Vegetation Tidal Range
• Water Color Eutrophic State
Chl-a Conc, Primary Production
TSS Load, Light Attenuation
• Fronts, Slicks, Plumes Pollutant Dispersion
* Some of the derived properties require the use of ancillary data
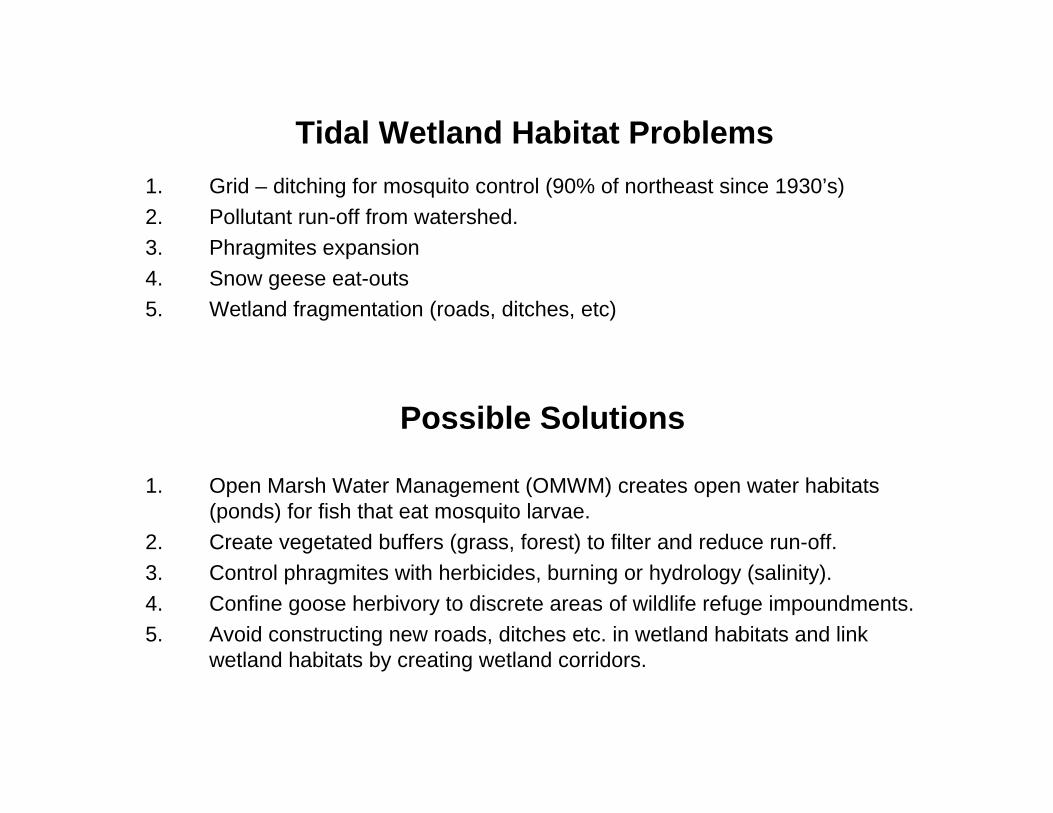
Tidal Wetland Habitat Problems1. Grid – ditching for mosquito control (90% of northeast since 1930’s)2. Pollutant run-off from watershed.3. Phragmites expansion4. Snow geese eat-outs5. Wetland fragmentation (roads, ditches, etc)
Possible Solutions
1. Open Marsh Water Management (OMWM) creates open water habitats (ponds) for fish that eat mosquito larvae.
2. Create vegetated buffers (grass, forest) to filter and reduce run-off.3. Control phragmites with herbicides, burning or hydrology (salinity).4. Confine goose herbivory to discrete areas of wildlife refuge impoundments.5. Avoid constructing new roads, ditches etc. in wetland habitats and link
wetland habitats by creating wetland corridors.
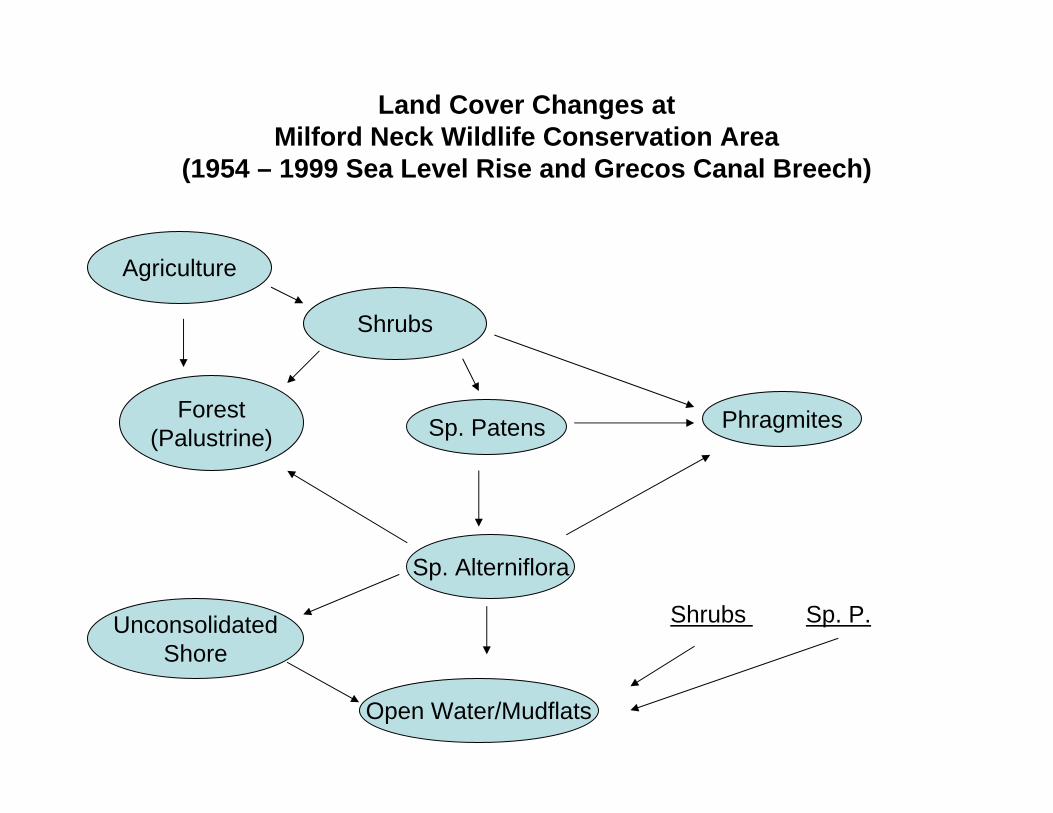
Land Cover Changes atMilford Neck Wildlife Conservation Area
(1954 – 1999 Sea Level Rise and Grecos Canal Breech)
Agriculture
Shrubs
Forest(Palustrine) Sp. Patens Phragmites
Sp. Alterniflora
UnconsolidatedShore
Open Water/Mudflats
Shrubs Sp. P.