Embed Size (px)
Citation preview

OCS Study MMS 2000-028
Remote Sensing St in the Northeastern
idy of U pwe I I i n g Gulf of Mexico and
the Effects of Hurricanes Earl and Georges
Annual Report : Year 2
U.S . Department of the Interior Minerals 1Vlanagement Service Gulf of Mexico OCS Region
OCS Study MMS 2000-028
Remote Sensing Study of U pwel I i ng in the Northeastern Gulf of Mexico and the Effects of Hurricanes Earl and Georges
Annual Report : Year 2
Authors
Frank E . Muller-Karger University of South Florida (USF) Department of Marine Science (DMS) St . Petersburg, Florida
Fred Vukovich SAIC Raleigh, North Carolina
Robert Leben University of Colorado Boulder, Colorado
Bisman Nababan USF/DMS St . Petersburg, Florida
Chuanmin Hu USF/DMS St . Petersburg, Florida
Doug Myhre USF/DMS St . Petersburg, Florida
Prepared under MMS Contract 1435-01-97-CA-30857 by University of South Florida Department of Marine Science 140 7th Avenue, South St . Petersburg, Florida 33713
Published by
U .S. Department of the Interior New Orleans Minerals management Service Gulf of Mexico OCS Region May 2000

DISCLAIMER
This report was prepared under contract between the Minerals Management Service (MMS) and the University of South Florida. This report has been technically reviewed by the MMS, and it has been approved for publication . Approval does not signify that the contents necessarily reflect the views and policies of the MMS, nor does mention of trade names or commercial products constitute endorsement or recommendation for use. It is, however, exempt from review and compliance with the MMS editorial standards .
REPORT AVAILABILITY
Extra copies of this report may be obtained from the Public Information Office (Mail Stop 5034) at the following address:
U.S . Department of the Interior Minerals Management Service Gulf of Mexico OCS Region Public Information Office (MS 5034) 1201 Elmwood Park Blvd . New Orleans, Louisiana 70123-2394
Telephone: (504) 736-2519 1-800-200-GULF
CITATION
Suggested citation :
Muller-Karger, F.E ., F. Vukovich, R. Leben, B. Nababan, C . Hu, and D. Myhre . 2000 . Remote sensing study of upwelling in the northeastern Gulf of Mexico and of the effects of Hurricanes Earl and Georges . Annual Report : Year 2. U.S . Dept . of the Interior, Minerals Management Service, Gulf of Mexico OCS Region, New Orleans, La. OCS Study MMS 2000 . 42 pp.
iii

TABLE OF CONTENTS
LIST OF TABLES . . . . . . . . . . . . . . . . . . . . . . . . . . . . . . . . . . . . . . . . . . . . . . . . . . . . . . . . . . . . . . . . . . vii
LIST OF FIGURES . . . . . . . . . . . . . . . . . . . . . . . . . . . . . . . . . . . . . . . . . . . . . . . . . . . . . . . . . . . . . . . . . . vii
ACKNOWLEDGMENTS . . . . . . . . . . . . . . . . . . . . . . . . . . . . . . . . . . . . . . . . . . . . . . . . . . . . . . . . . . xi
I . SUMMARY OF THE SECOND-YEAR RESULTS . . . . . . . . . . . . . . . . . . . . . . . 1
1 .1 . Sea Surface Temperature (SST) . . . . . . . . . . . . . . . . . . . . . . . . . . . . . . . . . . . . . . . . . . 1
1 .2 . Sea Surface Pigment Concentration . . . . . . . . . . . . . . . . . . . . . . . . . . . . . . . . . . . . . 1
1 .3 . Altimetry . . . . . . . . . . . . . . . . . . . . . . . . . . . . . . . . . . . . . . . . . . . . . . . . . . . . . . . . . . . . . . . . . . . 1
1 .4 . Field Programs . . . . . . . . . . . . . . . . . . . . . . . . . . . . . . . . . . . . . . . . . . . . . . . . . . . . . . . . . . . . 4
1 .5 . Other MMS-Related Programs . . . . . . . . . . . . . . . . . . . . . . . . . . . . . . . . . . . . . . . . . . 5
II . THE SPRING 1998 NEGOM COLD WATER EVENT : REMOTE SENSING EVIDENCE FOR UPWELLING AND FOR EASTWARD ADVECTION OF MISSISSIPPI WATER . . . . . . . . . . . . . . . . . . . . . . . . . . . . . . . . . 11
ABSTRACT . . . . . . . . . . . . . . . . . . . . . . . . . . . . . . . . . . . . . . . . . . . . . . . . . . . . . . . . . . . . . . . . . . 11
2 .1 . Introduction . . . . . . . . . . . . . . . . . . . . . . . . . . . . . . . . . . . . . . . . . . . . . . . . . . . . . . . . . . . . . . . 11
2 .2 . Methods . . . . . . . . . . . . . . . . . . . . . . . . . . . . . . . . . . . . . . . . . . . . . . . . . . . . . . . . . . . . . . . . . . 12
2 .3 . Results . . . . . . . . . . . . . . . . . . . . . . . . . . . . . . . . . . . . . . . . . . . . . . . . . . . . . . . . . . . . . . . . . . . . . 14
2 .3 .1 . AVHRR SST . . . . . . . . . . . . . . . . . . . . . . . . . . . . . . . . . . . . . . . . . . . . . . . . . . . . . . 14
2.3 .2 . Winds . . . . . . . . . . . . . . . . . . . . . . . . . . . . . . . . . . . . . . . . . . . . . . . . . . . . . . . . . . . . . . 19
2.3 .3 . SeaWiFS . . . . . . . . . . . . . . . . . . . . . . . . . . . . . . . . . . . . . . . . . . . . . . . . . . . . . . . . . . . 19
2.3 .4 . Altimetry . . . . . . . . . . . . . . . . . . . . . . . . . . . . . . . . . . . . . . . . . . . . . . . . . . . . . . . . . . 20
2.4 . Discussion . . . . . . . . . . . . . . . . . . . . . . . . . . . . . . . . . . . . . . . . . . . . . . . . . . . . . . . . . . . . . . . . . 23
2.5 . Conclusions . . . . . . . . . . . . . . . . . . . . . . . . . . . . . . . . . . . . . . . . . . . . . . . . . . . . . . . . . . . . . . . 26
v
III. HURRICANE IMPACTS ON THE NORTHEASTERN GULF OF MEXICO AS SEEN WITH THE NOAA AVHRR AND SEAWIFS . . . . . . . . . . . . . . . 27
ABSTRACT . . . . . . . . . . . . . . . . . . . . . . . . . . . . . . . . . . . . . . . . . . . . . . . . . . . . . . . . . . . . . . . . . . 27
3 .1 . Introduction . . . . . . . . . . . . . . . . . . . . . . . . . . . . . . . . . . . . . . . . . . . . . . . . . . . . . . . . . . . . . . . 27
3 .2 . Methods . . . . . . . . . . . . . . . . . . . . . . . . . . . . . . . . . . . . . . . . . . . . . . . . . . . . . . . . . . . . . . . . . . . . 28
3 .2 .1 . Sea Surface Temperature (SST) . . . . . . . . . . . . . . . . . . . . . . . . . . . . . . 28
3 .2 .2 . Sea Surface Pigment Concentration . . . . . . . . . . . . . . . . . . . . . . . . . . . 28
3 .2 .3 . Sea Surface Current . . . . . . . . . . . . . . . . . . . . . . . . . . . . . . . . . . . . . . . . . . . . . 29
3 .3 . Results . . . . . . . . . . . . . . . . . . . . . . . . . . . . . . . . . . . . . . . . . . . . . . . . . . . . . . . . . . . . . . . . . . . . . 29
3 .3 .1 . Sea Surface Temperature Changes . . . . . . . . . . . . . . . . . . . . . . . . . . . . 29
3 .3 .2 . Sea Surface Pigment Concentration . . . . . . . . . . . . . . . . . . . . . . . . . . . . 34
3 .4 . Summary and Discussion . . . . . . . . . . . . . . . . . . . . . . . . . . . . . . . . . . . . . . . . . . . . . . . . 36
IV . REFERENCES . . . . . . . . . . . . . . . . . . . . . . . . . . . . . . . . . . . . . . . . . . . . . . . . . . . . . . . . . . . . . . . . 39
LIST OF TABLES
Page
2 .1 . Center latitude and longitude for 3x3 pixel boxes (103 km2) from which SST was extracted from AVHRR images (stations shown in Figure 2.1) . . . 13
3 .1 . Sea surface temperature averages within an 8x8 pixel box centered at 28.59 °N, 89.19 °W, near the track of Hurricane Georges . . . . . . . . . . . . . . . 33
3 .2 . Mean chlorophyll-a concentration (and standard deviation) within an 8x8 pixel box centered at the location of lowest SST (28 .59 °N, 88.19 °W) . . . . . . . . . . . . . . . . . . . . . . . . . . . . . . . . . . . . . . . . . . . . . . . . . . . . . . . . . . . . . 35
LIST OF FIGURES
Page
1 .1 . Loop Current Intrusion Index - A measure of the volume of Loop Current water east of 90°W determined from satellite altimetry . . . . . . . . . . . . . . . . . . 2
1 .2 . Integral Measures of the Loop Current . . . . . . . . . . . . . . . . . . . . . . . . . . . . . . . . . . . . . . 3
1 .3 . Mean Chlorophyll-a concentration during the NEGOM III cruise from (A) SeaWiFS data and (B) Fluorometer flow-through data . . . . . . . . . . . 6
1 .4 . DOC fluorescence (A) and salinity (B) over NEGOM during NEGOM III cruise showing a strong negative correlation . . . . . . . . . . . . . . . . . . 6
1 .5 . Sea surface height dynamic over NEGOM of (A) summer 1998 and (B) winter 1998 showing different pattern and location of high and low sea surface height dynamic . . . . . . . . . . . . . . . . . . . . . . . . . . . . . . . . . . . . . . . . . . . . . . . . . . . . . . . . . 6
1 .6 . Mean chlorophyll-a concentration during the NEGOM IV cruise from (A) SeaWiFS data and (B) Fluorometer flow-through data showing a positive correlation value . . . . . . . . . . . . . . . . . . . . . . . . . . . . . . . . . . . . . . . . . . . . . . . . . . . . . . . . . 7
1 .7 . Mean chlorophyll-a concentration (A) from SeaWiFS data during summer 1999 and (B) from SeaWiFS data during the NEGOM V cruise (Spring 1999) . . . . . . . . . . . . . . . . . . . . . . . . . . . . . . . . . . . . . . . . . . . . . . . . . . . . . . . . . . . . . . . . . 7
1 .8 . Mean sea surface temperature (SST) comparison over NEGOM between in-situ (A) and NOAA AVHRR satellite (B) showing a consistent correlation . . . . . . . . . . . . . . . . . . . . . . . . . . . . . . . . . . . . . . . . . . . . . . . . . . . . . . . . . . . . . . . . . . . . . . . . . . . 7
vii
1 .9 . Salinity and DOC flow-through correlation from two different cruises showing highly negative correlation . . . . . . . . . . . . . . . . . . . . . . . . . . . . . . . . . . . . . . . . . . . 8
1 .10 .Chlorophyll-a concentration and DOC fluorescence correlation from three different cruises showing relatively highly positive correlation . . . . 9
1 .11 . Chlorophyll-a concentration from in-situ and SeaWiFS data from three different cruise showing that SeaWiFS data in general overestimate in-situ data . . . . . . . . . . . . . . . . . . . . . . . . . . . . . . . . . . . . . . . . . 10
2.1 . Coastal zone of the NEGOM, encompassing the area between 26-31 .5 °N and 82-90 °W . . . . . . . . . . . . . . . . . . . . . . . . . . . . . . . . . . . . . . . . . . . . . . . . . . . . . . . . . . . . . . . . . . . . . . . . 13
2.2 . AVHRR-derived SST on (1) 21 May 1995, (2) 17 May 1996, (3) 12 May 1988, (5) 7 June 1988, and (6) 17 July 1988 . . . . . . . . . . . . . . . . . . . . . . . . . . . . . . . . . . . . . . . 15
2.3 . SST time series at one offshore station (Station 1 in Table 2 .1 and Fig . 2 .1) and 5 coastal NEGOM stations (Station 2-6 in Table 1) . . . . . . . . . . . . . . . . . . . . . . . . 16
2.4 . SST time series at 30 .32 °N, 87 .75 °W, off Fort Walton Beach . . . . . . . . . . . . . . . . 17
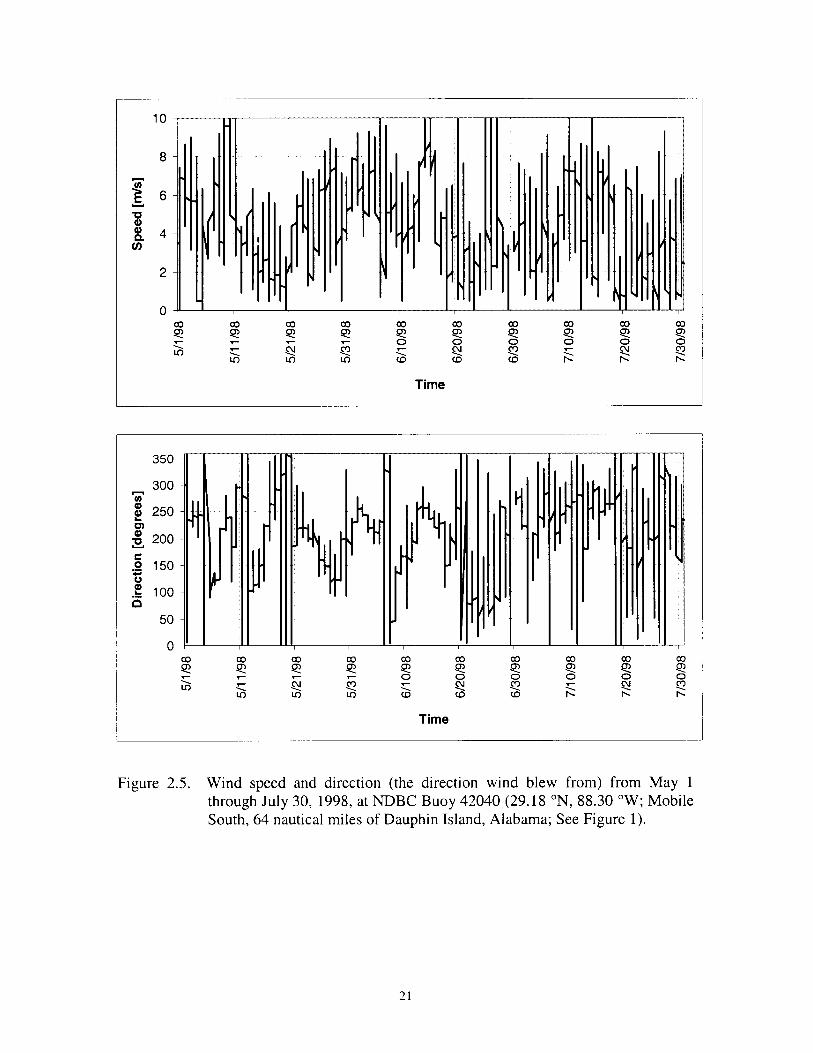
2.5 . Wind speed and direction (the direction wind blew from) from May 1 through July 30, 1998, at NDBC Buoy 42040 (29.18 N, 88 .30 W ; Mobile South, 64 nautical miles of Dauphin Island, Alabama ; See Figure 2 .1) . . . . . . . . . . . . . . . . . . . . . . . . . . . . . . . . . . . . . . . . . . . . . . . . . . . . . . . . . . . . . . . . . . . . . . . 2 1
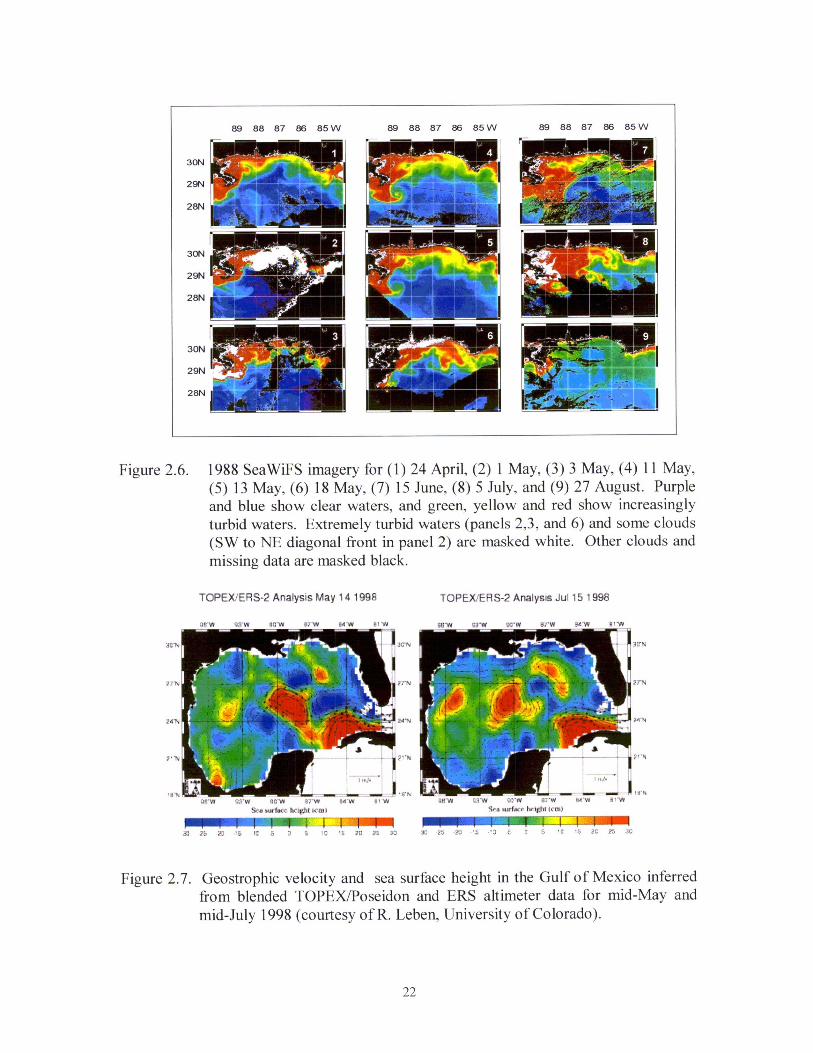
2.6 . 1998 SeaWiFS imagery for (1) 24 April, (2) 1 May, (3) 3 May, (4) 11 May, (5) 13 May, (6) 18 May, (7) 15 June, (8) 5 July, (9) 27 August . . . . . . . . . . . . . . . . 22
2.7 . Geostrophic velocity and sea surface height in the Gulf of Mexico inferred from blended TOPEX/Poseidon and ERS altimeter data for mid-May and mid-July 1998 (courtesy of R. Leben, University of Colorado) . . . . . . . . . . 22
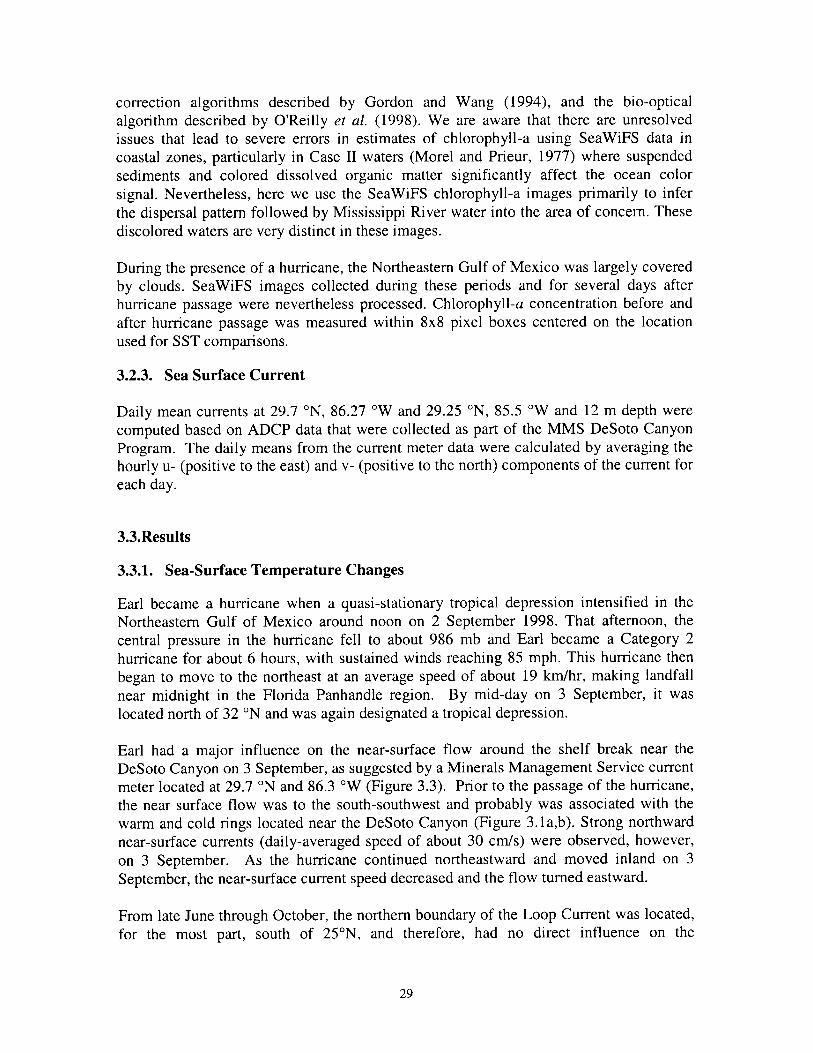
3 .1 . Sea surface height anomaly of the Gulf of Mexico based on TOPER/ ERS-2 analysis. (a) when Hurricane Earl reached the NEGOM area (September 1, 1998) and (b) after Hurricane Earl left NEGOM area (September 5, 1998) (Leben, 1998) . . . . . . . . . . . . . . . . . . . . . . . . . . . . . . . . . . . . . . . . . 31
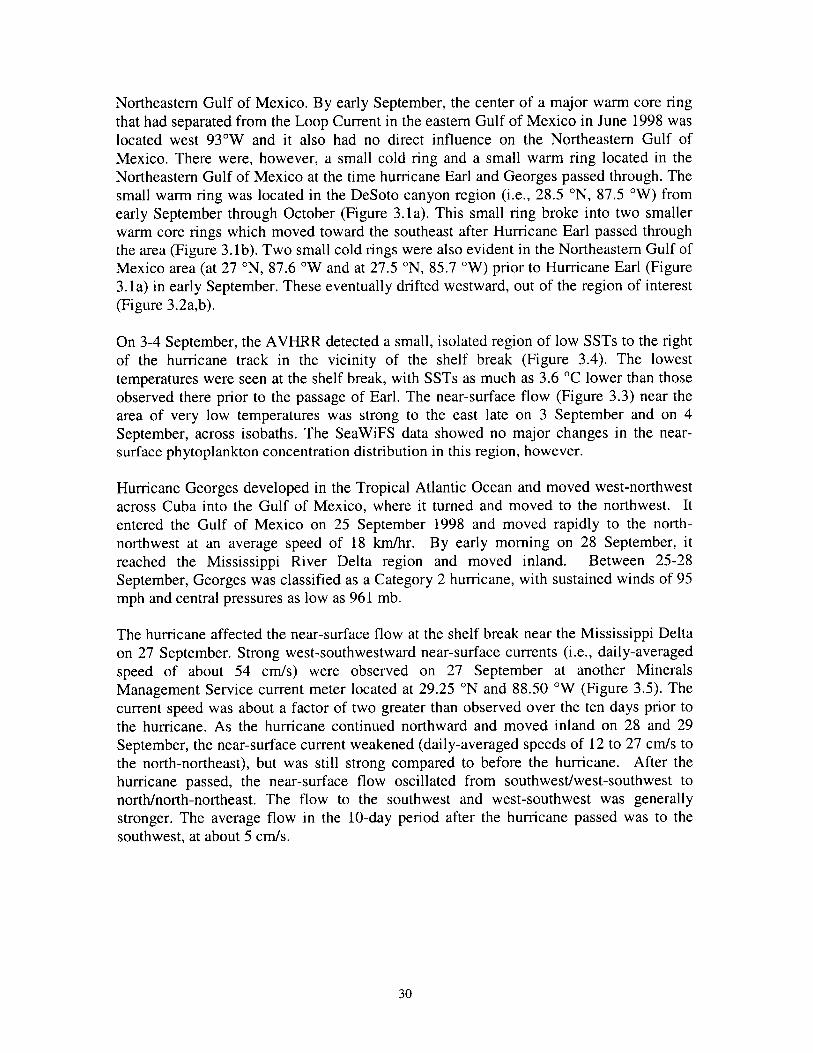
3 .2 . Sea surface height anomaly of the Gulf of Mexico based on TOPER/ ERS-2 analysis . (a) when Georges reached south of Mississippi coast (September 28, 1998) and (b) after hurricane Georges left the Mississippi coast (October 6, 1998) (Leben, 1998) . . . . . . . . . . . . . . . . . . . . . . . . . . . . . . . . . . . . . . . . . . . . . . . 31
3 .3 . Daily-averaged, near-surface currents for the period 29 August through 7 September 1998 from a mooring located at the shelf break at 29.7 °N and 86.27 °W . . . . . . . . . . . . . . . . . . . . . . . . . . . . . . . . . . . . . . . . . . . . . . . . . . . . . . . . . . . . . . . . . . . . . . . 32
Vill
3 .4 . Composite NOAA infrared AVHRR SST images of the NEGOM prior to Hurricane Earl, Aug 29-31,98 (a) and after Hurricane Earl, Sep 3-4, 98 (b) 32
3.5 . Daily-averaged, near-surface currents for the period 15 September through 15 October 1998 from a mooring located at the shelf break at 29 .25 °N and 88.50 °W . . . . . . . . . . . . . . . . . . . . . . . . . . . . . . . . . . . . . . . . . . . . . . . . . . . . . . . . . . . . . . . . . . . . . . . . . . . . . 34
3 .6 . Composite (average) NOAA AVHRR SST image of the NEGOM (a) prior to Hurricane Georges, (b) after the Hurricane on October 1, (c) Oct 5-6, (d) Oct 9-10, (e) Oct 14-15, and (f) Oct 19, respectively . . . . . . . . . . . . . . . . . . . . . 35
3 .7 . The lowest temperature in the intense cold lens developed by Hurricane Georges in the first 19 days in October 1998 . . . . . . . . . . . . . . . . . . . . . . . . . . . . . . . . . . . . . 36
3 .8 . Composite (average) SeaWiFS image of the NEGOM (a) prior to Hurricane Georges, (b) after the hurricane's passage on Sep 30-Oct 2, (c) Oct 5-6, and (d) Oct 16-19 . . . . . . . . . . . . . . . . . . . . . . . . . . . . . . . . . . . . . . . . . . . . . . . . . . . . . . . . . . . . . . . . . . . . 37

ACKNOWLEDGMENTS
This work was supported by the Minerals Management Service, Gulf of Mexico, OCS Region, under Contract Number 1335-01-97-CA-30857 . SeaWiFS data are property of Orbimage Corporation and were processed and reproduced for this report following guidelines outlined in the Dear Colleague Letter published by the National Aeronautics and Space Administration's (NASA) SeaWiFS Project at the Goddard Space Flight Center. Wind data were obtained from the NOAA National Data Buoy Center . This report benefited immensely from discussions held with Dr. William Schroeder (Dauphin Island Sea Lab, Alabama), to whom I am indebted for sharing his insight on dynamics of the circulation of shelf waters in the northeastern Gulf of Mexico area. We wish to thank Tom Berger and Peter Hamilton (SAIC) for their support in providing current meter data in the Northeastern Gulf of Mexico . We thank Dr. Doug Biggs and Dr. Norman Guinasso (TAMU) who help us coordinate field data collection using GYRE . We also thank for the GYRE crews and other participants during NEGOM cruises who provide help during field data collection.

I. SUMMARY OF THE SECOND-YEAR RESULTS
1.1 . Sea Surface Temperature (SST)
For the period covered under this study (April 1997-December 1999), we have collected approximately 5,820 Advanced Very High Resolution Radiometer (AVHRR) SST images of the Gulf of Mexico (GOM). These images are stored in high (1x1 km2 pixel) and low resolution (2.8x4.1 km z pixel) . We have also computed monthly mean SST for the Gulf of Mexico for the period of 1993-1999 . Near-real time and monthly mean SST images for the Gulf of Mexico can be accessed at : htcp ://paria .marine .usf.edu .
During the period of May-July 1998, we observed unusual upwelling along the coasts of the Florida Panhandle in the northeastern Gulf of Mexico. This led to 3-6 °C lower SST than normal . This is discussed in Chapter II of this report . We also observed strong upwelling near the shelf break in the northeastern Gulf of Mexico after hurricanes Earl (September 2-4, 1998) and Georges (September 25- October 1, 1998) . This is discussed in Chapter III of this report .
1.2 . Sea Surface Pigment Concentration
We have collected approximately 1,500 SeaWiFS images (September 1997- December 1999) over the Gulf of Mexico and computed monthly mean of chlorophyll-a concentration over the Gulf of Mexico for the period September 1997 - December 1998. Near-real time SeaWiFS data can be accessed at : hctp://paria.marine .usf.edu . In addition, the historical Coastal Zone Color Scanner (CZCS) were processed to pigment products representing the concentration of phytoplankton, and then averaged to derive a series of 92 monthly pigment concentration means.
We reprocess SeaWiFS images collected with our local antenna every time NASA introduces a new algorithm to calculate chlorophyll concentration . We also are modifying the processing algorithm for turbid waters using the NEGOM data . The NASA algorithm produces large errors in chlorophyll concentration in coastal waters .
Using SeaWiFS data, we found higher pigment concentration in upwelling areas observed during the period of May-July, 1998, and after hurricane Georges . These findings are presented in Chapters II and III of this report .
1 .3 . Altimetry
At the University of Colorado, we continue to update the Gulf of Mexico near-real time sea surface dynamic height based on blended data from TOPEX/Poseidon (TOPEX) and the Second European Remote-Sensing Satellite (ERS-2). The Gulf of Mexico altimetry data are available on-line at the following addresses:
" Near-Real-Time Altimeter Data: " Gulf of Mexico Near Real-Time Altimeter Data Homepage
(http://wwwccar.Colorado.edu/-realtime/gom/gom-nrt .html) " Gulf of Mexico Near Real-Time Data Viewer (http://www-ccar.colorado.edu/
-realtime/gom-real-time ssh) " Gulf of Mexico Near Real-Time Geostrophic Velocity Vector Viewer
(http://www-ccar.Colorado.edu/-realtime/gom-real-time vel) " Gulf of Mexico Along-Track Data Host (http://www-ccar.colorado.edu/
-realtime/gom data ssh/ssh.html) Gulf of Mexico Along-Track Visualization (One Day) (http://www-ccar.colorado.edu/-realtime/gom data ssh/sshpic.html)
" Gulf of Mexico Along-Track Visualization (Multiple Day) (http://www-ccar.colorado.edu/ -realtime/gom data ssh/sshpic2 .htm1)
" Latest Gulf of Mexico sea surface height maps (http://www-ccar.colorado.edul research/gom/html/latest nrt.html)
" Historical Gulf of Mexico Altimeter Data: Gulf of Mexico Historical Data Viewer (http ://www-ccar.colorado.edu/
gom-historical ssh) " Gulf of Mexico Historical Geostrophic Velocity Viewer (http://ccar.colorado.edu/
gom-historical vel)
A CD-ROM containing all of the historical data for the Gulf of Mexico from early 1992 through the end of 1998 is now available.
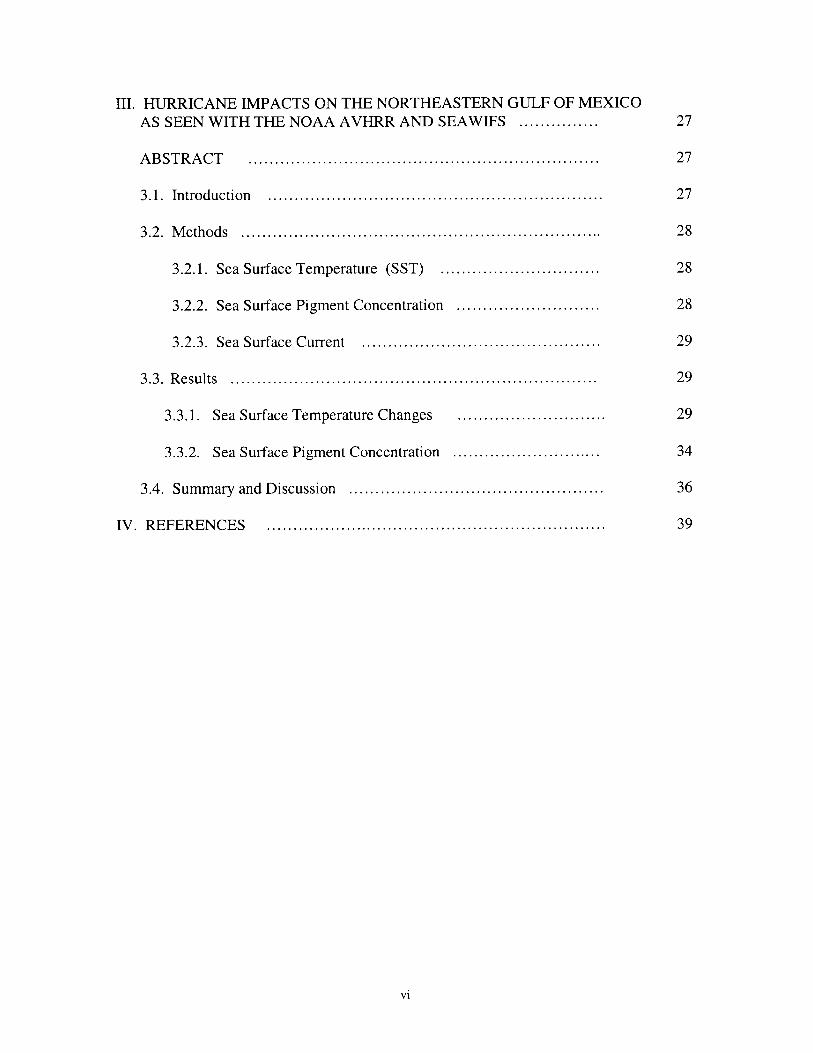
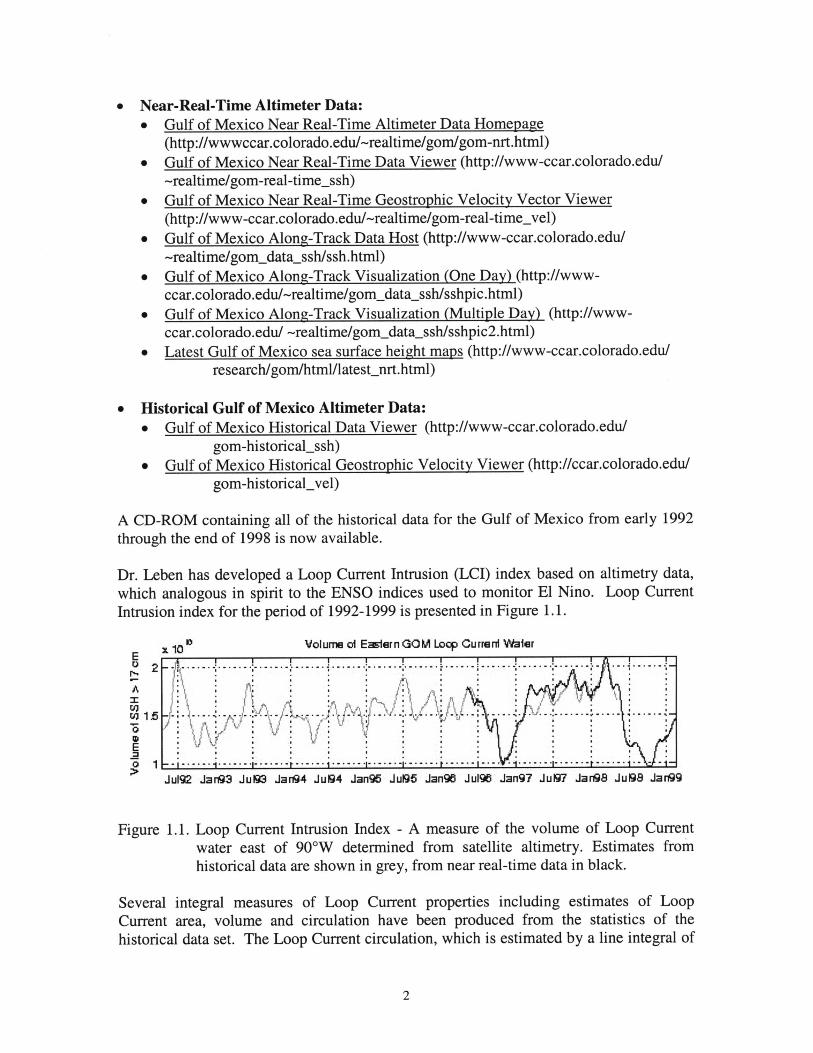
Dr . Leben has developed a Loop Current Intrusion (LCI) index based on altimetry data, which analogous in spirit to the ENSO indices used to monitor El Nino. Loop Current Intrusion index for the period of 1992-1999 is presented in Figure 1 .1 .
E U M
2
ul 1 .5 0
E > 1
x 10 ° Volume o1 EadernGOM Loop Current V'taier
c7
Ju1912 Jan43 Ju193 Jarfl4 Ju194 Jan95 Ju195 Jan96 Ju19B Jan97 JuK37 Jart98 Ju198 Jarfl9
Figure 1 .1 . Loop Current Intrusion Index - A measure of the volume of Loop Current water east of 90°W determined from satellite altimetry. Estimates from historical data are shown in grey, from near real-time data in black.
Several integral measures of Loop Current properties including estimates of Loop Current area, volume and circulation have been produced from the statistics of the historical data set. The Loop Current circulation, which is estimated by a line integral of
2
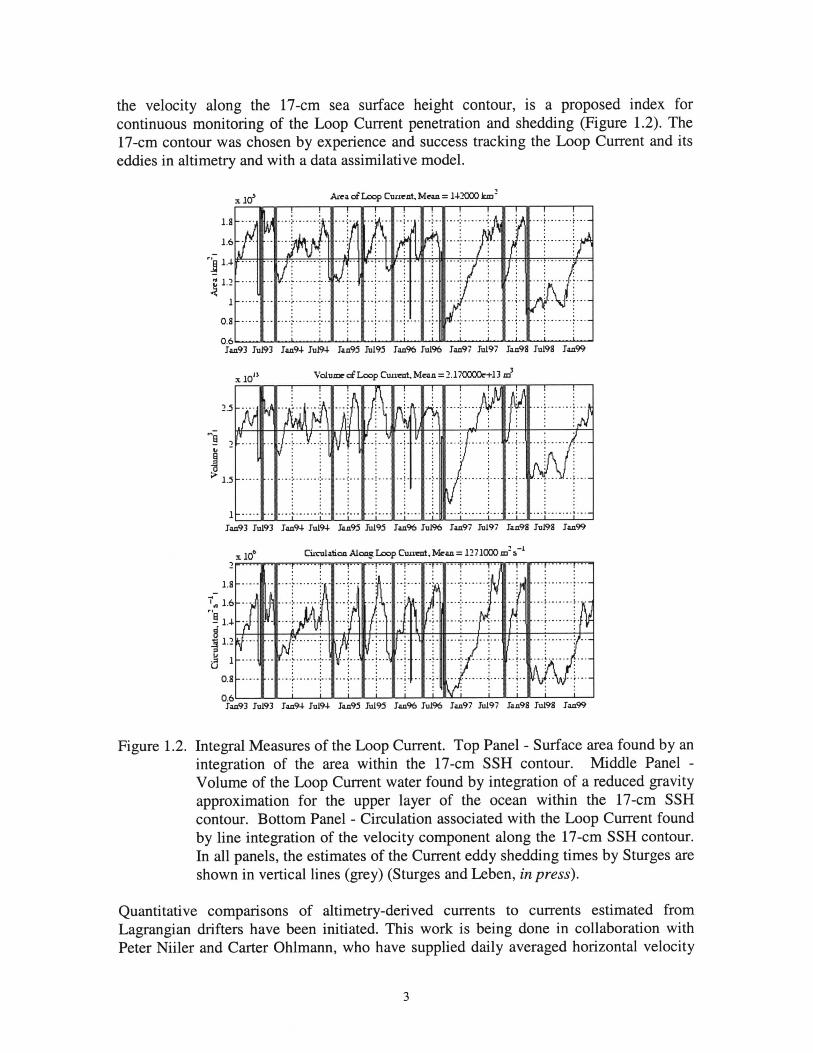
the velocity along the 17-cm sea surface height contour, is a proposed index for continuous monitoring of the Loop Current penetration and shedding (Figure 1 .2). The 17-cm contour was chosen by experience and success tracking the Loop Current and its eddies in altimetry and with a data assimilative model.
l
v
J
lOs Area of Loop Current, bleaa =14?000 km'
0.
0 .6 7an93 7u193 7aa% Ju191 7aa95 7u195 7aa96 7u196 7aa9i 7u197 7an98 7u198 7an99
V1'
. . . . . .
-, . . . .
.10" Volume apt Loop Current, Mean -?.1' 0000et13 ml
U '~l . yr. .
N U y ;y r r
- Y
RC 1 .5 - - . . . . . . . .1f . .
7aa93 7u193 Jan94 Iv194 7aa95 7u195 7aa96 7u1% 7aa9i 7u197 7aa98 7u198 7aa99
x 10' Curulatioa .V ong Lapp Curirat, Mean =1? i 1000 m' s 1 . . . . . . . . . . .
r . . . . . . .
1 .8
~� 1.6 .~
1.~
1 .3 . . . . . . . . . . . a
0.8
0.6 7aa93 7u193 7aa94 7u194 7an95 7u195 7au% 7u196 7aa9i 7u197 7aa98 7v198 7aa99
~+ q' .
. . . . . .
. . . .
.
t . . . . . ., . . . . . . , . . . . ,
r
, . . . ., . . . ., . . . . . . ., . . , .
. . . . . . : 4,
. . .
V . .
. . . . Y . . . . ~. Y
Figure 1 .2 . Integral Measures of the Loop Current. Top Panel - Surface area found by an integration of the area within the 17-cm SSH contour. Middle Panel -Volume of the Loop Current water found by integration of a reduced gravity approximation for the upper layer of the ocean within the 17-cm SSH contour. Bottom Panel - Circulation associated with the Loop Current found by line integration of the velocity component along the 17-cm SSH contour. In all panels, the estimates of the Current eddy shedding times by Sturges are shown in vertical lines (grey) (Sturges and Leben, in press) .
Quantitative comparisons of altimetry-derived currents to currents estimated from Lagrangian drifters have been initiated. This work is being done in collaboration with Peter Niiler and Carter Ohlmann, who have supplied daily averaged horizontal velocity
3

components derived from the Sculp I, II and III data sets . The data sets used for the comparison are the Sculp I daily velocity estimates co-located with descending TOPEX tracks . Co-location was determined by identifying daily Sculp I values within a 1/4° cell that also contains a TOPEX ground track point . In all, 2770 co-located positions were identified, of which 286 were in water of depth greater than 1500 meters . The horizontal velocities were used at each co-located point to determine the component perpendicular to the TOPEX tracks . Crosstrack geostrophic velocities were computed from alongtrack sea surface slopes estimated by linear regression over data point windows of 23 points (125 km) along the TOPEX tracks . This allows direct comparison of altimeter-derived currents with surface currents from drifters without interpolating the altimetry to a regular grid . First, we need to examine at the altimeter/drifter crosstrack velocity correlation over the continental shelf/slope and the deep basin to determine the utility of the altimeter over those regions of the Gulf. Second, we need to examine the correlation of the altimeter/drifter crosstrack velocities as a function of time lag between the observations . Significant correlations are found over the shelf, slope and deep basin . Decorrelation times decreased from 15 days over the continental slope and deep basin to 3-5 days over the LATEX shelf.
1 .4. Field Programs
We have joined with Texas A&M University (MMS PM Worth Nowlin) to collect bio-optical field data on oceanographic cruises to the NEGOM. For the period of 1998-1999, we participated in six cruises : NEGOM II (May4-15, 98), NEGOM III (Jul 26-Aug 8, 98), NEGOM IV (Nov 12-24, 98), NEGOM V (May 14-28, 99), NEGOM VI (Aug 15-27, 99) and NEGOM VII (Nov 12-22, 99) .
For these cruises, we collected water samples for Gelbstoff Absorbance (ag), Particle Absorbance (aP), and Dissolved Organic Carbon (DOC) concentration . We also measured remote sensing reflectance (above and under water) . In addition to the above parameters, we measured attenuation and absorption of light at nine wavelengths at the surface with a continuous-flow a/c-9 meter and DOC fluorescence with a flow-through fluorometer . For NEGOM VI and VII cruises, in addition to the above parameters, we measured optical fluorescence of surface waters continuously using a SAFIRE instrument in collaboration with Carlos del Castillo (USF) . We also participated on monthly ECOHAB cruises to the West Florida Shelf. During ECOHAB cruises, we collected similar observations . Our goals from these cruises are precise, calibrated underwater and above-water radiometric measurements to derive remote sensing reflectance, which are being compared to SeaWiFS data . We also are preparing a database of dissolved organic carbon concentrations to help interpret the ocean color signals in continental shelf waters .
The spatial and temporal variations of bio-optical properties over the Northeastern Gulf of Mexico from the two-year observations from the ship and satellite are summarized as follows : Surface chlorophyll-a concentration (CHL), colored dissolved organic matter (CDOM) fluorescence (a proxy for concentration), salinity, and temperature data were collected continuously along ship tracks with flow-through systems. Water samples and optical data were also collected at discrete stations to calibrate the flow-through data and
4

to develop an ocean-color algorithm . The flow-through data document that freshwater from the Mississippi River spread eastward in the summers of both 1998 (Figure 1 .3) and 1999 (Figure 1 .7), up to 27°N and 87°W, as indicated by low salinity (-23 psu) (Figure 1 .4), high CHL (-2 mg/m3, compared with <0.1 mg/m3 for oligotrophic ocean) (Figure 1 .3 and 1 .7), and high CDOM (absorption at 400 nm is -0.3 m 1, compared with <0.05 m-1 for oligotrophic ocean) (Figure 1 .4) . The ocean color satellite imagery (SeaWiFS, Orbview II) shows that the spatial patterns of eastward entrainment of this river plume were similar in both summers . The eastward entrainment of this river plume was facilitated by the present of an anticyclonic eddy located south of the Desoto Canyon area (Figure 1 .5) . In Spring and Winter, however, there is no significant eastward entrainment of the Mississippi River water (Figure 1 .6 and 1 .7B). Sea surface temperature (SST) from NOAA AVHRR satellite is in general consistent with SST from in-situ measurement (Figure 1 .8) . Correlation between CDOM and salinity was higher (-0.85 or higher for more than 7500 data points) (Figure 1 .9) than the correlation between CDOM and chlorophyll-a (0 .783 or less for more than 7500 data points) (Figure 1 .10), suggesting that CDOM is a better indicator than CHL of river plume waters . CDOM can be a better indicator of river plume water than chlorophyll-a since most of the CDOM enhancement in ocean water come from river water (land) whereas chlorophyll-a enhancement in ocean water could occur due to an upwelling process. Along the coast from Tampa Bay to Mobile Bay, the relationship between CDOM and salinity is robust, suggesting that a regional algorithm may be developed to estimate salinity from space . Chlorophyll-a concentration values from SeaWiFS in general overestimate in-situ measurements (Figure 1 .11) . Correlation of chlorophyll-a concentration values between in-situ and SeaWiFS data during winter (Figure 1 .11B, NEGOM4) was better compared to spring and summer (Figure 1 .10 NEGOM 3 and 5), suggesting that the presence of gelbstoff produced larger errors in the estimation of chlorophyll-a concentration from SeaWiFS .
1.5 . Other MMS-Related Programs
We completed construction of an X-band antenna to collect MODIS data from Terra, launched by NASA on December 18, 1999 . The antenna hardware was funded by NASA. Software is being developed partly using MMS support. The satellite data will support the various Gulf of Mexico MMS programs .
5
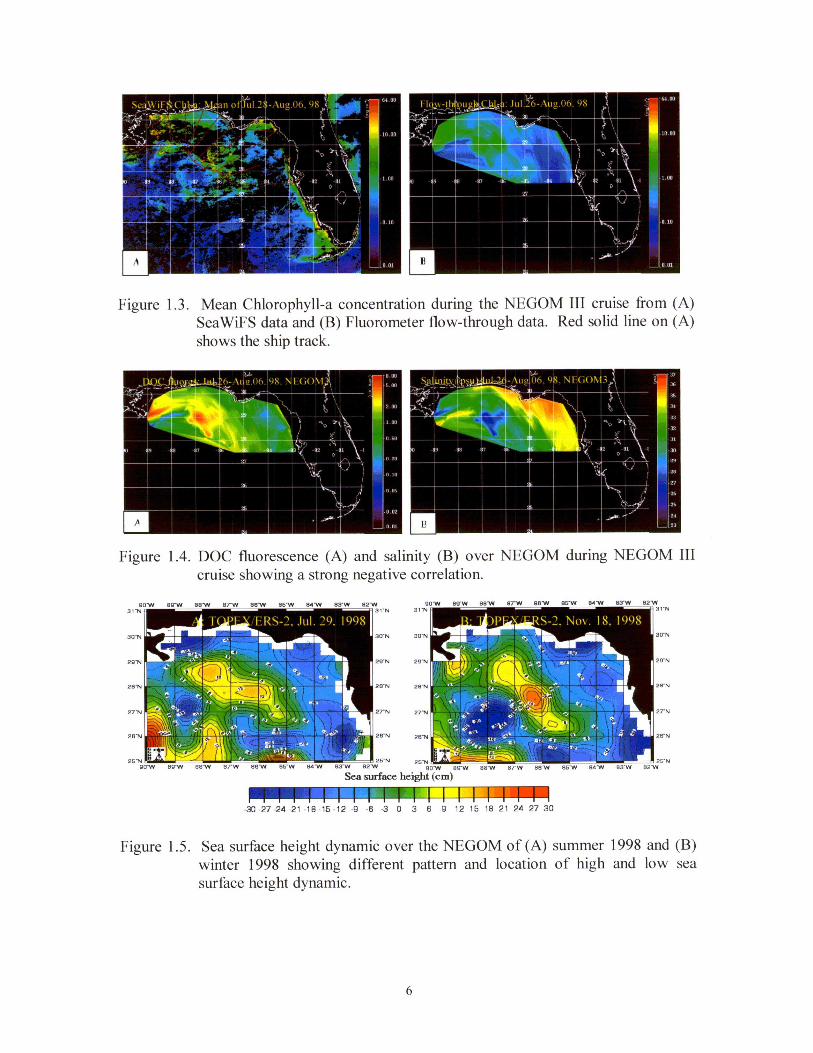
Figure 1 .3 . Mean Chlorophyll-a concentration during the NEGOM III cruise from (A) SeaWiFS data and (B) Fluorometer flow-through data . Red solid line on (A) shows the ship track.
Figure 1 .4 . DOC fluorescence (A) and salinity (B) over NEGOM during NEGOM III cruise showing a strong negative correlation.
3 1 "
P7"
26'r
-1
30 N -N 30
29-N 29'N
281
I _7 2 27'N
Ix WN -N
-N U -w
--N 2 uu~
Sea surface height (cm)
T -30 -27 -24 -21 -18 -15 -12 -9 -6 ,' 0 3 6 9 12 15 1 '8 21 24 27 30
!N rv
!B N
!7'N
!B'N
,. N
Figure 1 .5 . Sea surface height dynamic over the NEGOM of (A) summer 1998 and (B) winter 1998 showing different pattern and location of high and low sea surface height dynamic .
6

L I Figure 1 .6 . Mean chlorophyll-a concentration during the NEGOM IV cruise from (A)
SeaWiFS data and (B) Fluorometer flow-through data showing a positive correlation value. Red solid line shows ship track.
Figure 1 .7 . Mean chlorophyll-a concentration (A) from SeaWiFS data during summer 1999 and (B) from SeaWiFS data during the NEGOM V cruise (Spring 1999) . Red solid line shows the ship track.
Figure 1 .8 . Mean sea surface temperature (SST) comparison over NEGOM between in-situ (A) and NOAA AVHRR satellite (B) showing a consistent correlation .
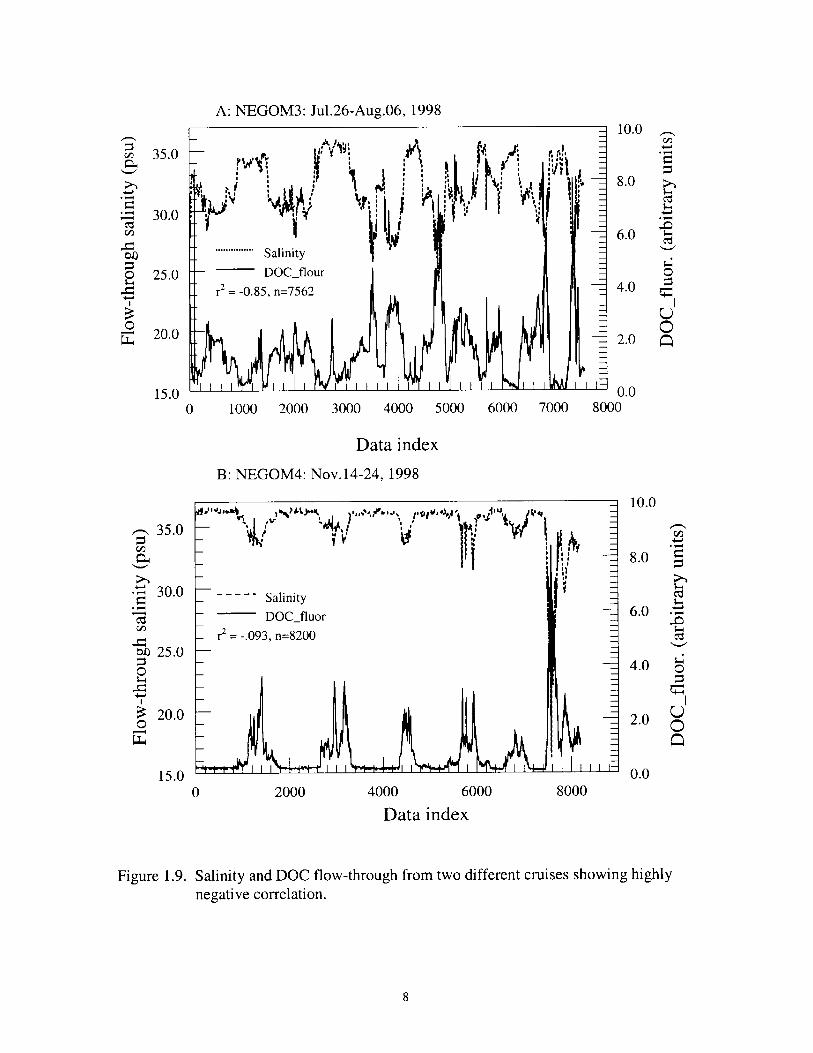
A: NEGOM3 : Ju1.26-Aug.06, 1998
35.0
30.0
bQ
0 25.0
3 ° 20.0 w
;. ., . . i I
1~ ' """"""" Salinity
DOC flour I
rZ = -0.85, n=7562 ~ ,
15 .0 0
35 .0
a
30.0
10.0
8 .0
6.0
O 4.0
U O 2.0 Q
0.0 1000 2000 3000 4000 5000 6000 7000 8000
Data index
B : NEGOM4: Nov. 14-24, 1998
!d".JJI .a+K `l*S)LL}"k .4i Y J~'V
- `~(t,~ j - ~~l S h - ~ . .
' . ; . ;
Salinity DOC fluor
- r2 = -.093,n=8200 25 .0
0 ~.
3 20.0 0 w
15.0 0 2000 4000 6000 8000
Data index
10.0 .-. .,
8 .0
6.0
4.0 p
I 2.0 U O
Q
0.0
Figure 1 .9 . Salinity and DOC flow-through from two different cruises showing highly negative correlation.
8
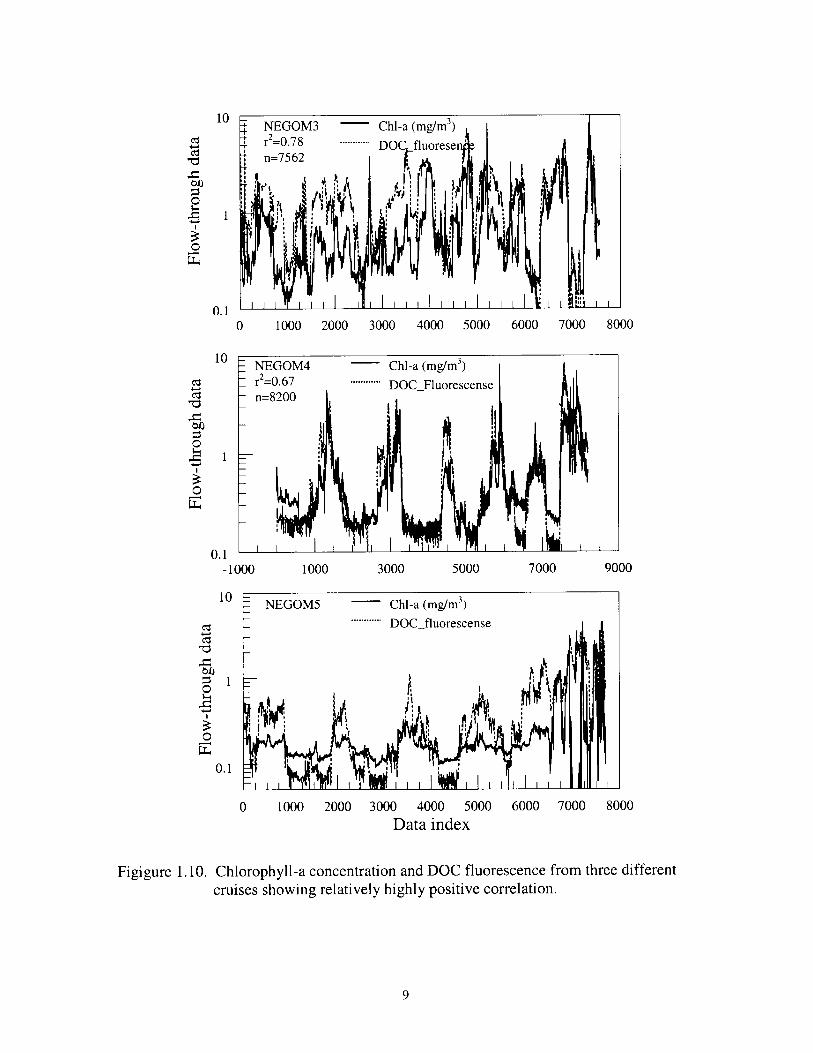
io
03
to
O 1
3 0 w
10
ct2 M b
bA 0 0 w
1000 2000 3000 4000 5000 6000 7000 8000 0.1
0
NEGOM4 Chl-a (mg/m3) r2=0.67 °°°°°° DOC Fluorescense II=g200
i o . i -1000 1000 3000 5000 7000
10
CI 03 b
of
w 0.1
7VVV
NEGOMS Chl-a (mg/m3)
"""""" DOC fluorescense
~t ~ { ;, ~I ~9 I
v~- w y~ 4!
I 11~lIILL I 0 1000 2000 3000 4000 5000 6000 7000 8000
Data index
Figigure 1 .10 . Chlorophyll-a concentration and DOC fluorescence from three different cruises showing relatively highly positive correlation .
9
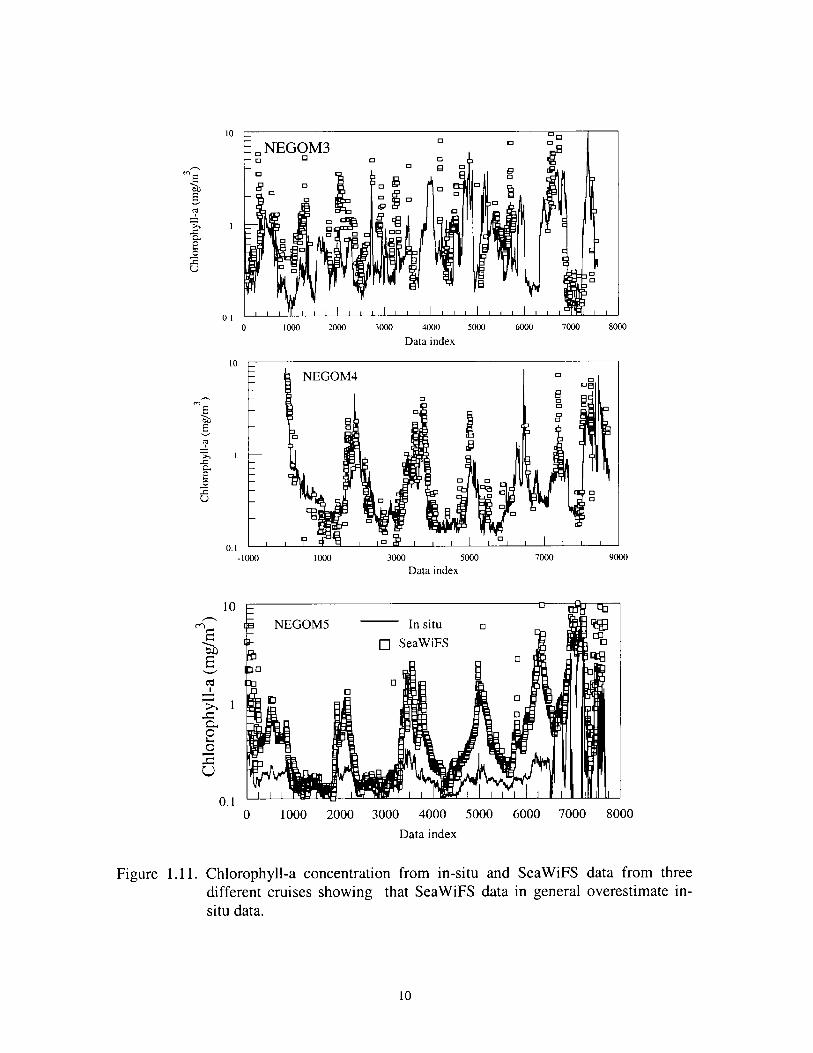
10 - o NEGOM3 -v ~ o
o g o 0
3 C3 C3
o ~ o - o 8
~bA
a 0 0 s U 0
0
8 a
B
00
0
0 .1 ` 0
Data index
E E
io
T 1 s a 0 0 s U
10 MJ
G
CL O O
U
v.i -1000 1000 3000 5000 7000 9000
Data index
0.1 0 1000 2000 3000 4000 5000 6000 7000 8000
Data index
Figure 1 .11 . Chlorophyll-a concentration from in-situ and SeaWiFS data from three different cruises showing that SeaWiFS data in general overestimate in-situ data .
10
II . THE SPRING 1998 NEGOM COLD WATER EVENT: REMOTE SENSING EVIDENCE FOR UPWELLING AND FOR EASTWARD ADVECTION OF
MISSISSIPPI WATER
ABSTRACT
Unusual upwelling in May-July 1998 along the coasts of the Florida Panhandle in the northeastern Gulf of Mexico led to 3-6 °C lower sea surface temperatures (SST) than is normal for these waters at this time of the year. Concurrently with the anomalous SST, substantial volumes of turbid Mississippi River water spread east of the Delta along the coast. The upwelling and eastward dispersal of Mississippi water were associated with both anomalous pulsating eastward winds and a large anticyclonic eddy that migrated into the northeastern Gulf of Mexico and reached the shelf break between June and August 1998 . We document the anomalous wind, upwelling, and river plume dispersal patterns using data from the Advanced Very High Resolution Radiometer (AVHRR), Sea-viewing Wide-Field-of-View Sensor (SeaWiFS), the Ocean Topography Experiment (TOPEX) and European Remote-Sensing Satellites (ERS) altimeter sensors, combined with wind data gathered at a National Data Buoy Center (NDBC) buoy (NDBC Buoy 42040) . The geostrophic current field inferred from the altimeter data suggests convergence near the Mississippi River Delta, eastward flow along the coast, and offshore flow in the vicinity of Cape San Blas. Eastward winds stronger than 3 m s-' occurred along the Alabama coast up to 32% of the time between May and August 1998, when this anticyclone was near the shelf, compared to only about 20-26% during the same months in 1996, 1997, and 1999 . These eastward anomalies in the wind may in turn be associated with the warm anticyclonic eddy. Upwelling of cold water along the coast was enhanced by the presence of baroclinic structure associated with the eddy. Eastward transport of Mississippi water was facilitated both by eastward winds and the eddy as it interacted with shelf waters . Hypoxia off northern Florida in late June and early July 1998 probably followed decay of local phytoplankton blooms after eastward winds relaxed, westward winds picked up, and the Mississippi River plume moved toward the coast, since this led to vertical stability in the water column.
2.1 . Introduction
In May 1998, the Remote Sensing Lab of the University of South Florida distributed a series of satellite images to various researchers involved in a Minerals Management Service program designed to study the Northeastern Gulf of Mexico, alerting them of a strong upwelling event along the coast of the Florida Panhandle. By June and July 1998, alarming reports appeared in the local press of "strange" water and "unusual" conditions along the northeastern shores of the Gulf of Mexico between Pensacola and Panama City, Florida (Figure 2.1) . Fishermen and the public reported massive fish kills and green or brown water filled with flocculates. News articles cited bottom-dwelling crab, shrimp, and small flounder swimming on top at the surface, and massive amounts of shellfish delivering spat . These reports also announced the sudden arrival of cold water at the shore, with one account suggesting a 9°C drop in temperature in about 24 hours. The
11
National Marine Fisheries Service (NMFS) reported low oxygen concentrations in waters at the inlet to St . Andrew Bay by Panama City (Collard et al., this issue), but the media reports led to the conclusion that hypoxia was widespread. These anecdotal accounts linked fish kills to cold, low oxygen, low salinity, and discolored water spreading along the coast . Unfortunately, it was not possible to coordinate resources fast enough to conduct detailed oceanographic ship surveys of the event . The local press from Louisiana to central Florida covered the event through the end of July 1998, and scientific and government institutions were called upon to explain the mysterious anomaly .
It is hard to decipher what really happened in the northeastern Gulf of Mexico (NEGOM) during May, June, and July 1998 using the information available from these reports . The various facts don't seem to add up. For example, how abnormal are cold temperatures along the NEGOM coastline? Why would the cold water, which is derived from upwelling, have low salinity, be discolored, or even have low dissolved oxygen? Is it possible that both river water and upwelling affected the coast at about the same time?
During the time of the event, various oceanographic satellites collected data in an operational mode over the affected area. Here we try to answer some of these questions using the remotely-sensed observations . We use these data to 1) assess the magnitude of the temperature anomaly observed along the NEGOM coast, 2) trace the source of the discolored water, and 3) evaluate the possibility of recurrence of the cold water and low oxygen phenomena .
2.2. Methods
To conduct our study, we used three primary satellite data sets . Sea Surface Temperature (SST) was derived from infrared (IR) observations collected by the Advanced Very High Resolution Radiometer (AVHRR) sensors flown on the National Oceanic and Atmospheric Administration's (NOAA) Polar Orbiting Satellite series . We used 4,077 high resolution AVHRR images collected over the NEGOM between September 1993 and July 1999 using the High Resolution Picture Transmission (HRPT) antenna located at the University of South Florida, in St . Petersburg, FL (http ://paria.marine.usf.edu) . All passes from all satellites were combined to build the time series (nightime and daytime passes from the NOAA 11 through 14 satellites) . The visible and near-infrared channels were calibrated to percent albedo, and the IR channels were calibrated to degrees Celsius . The navigation was manually corrected to compensate for errors in the satellite clock and orientation . SST was computed using the multi-channel sea-surface temperature (MCSST) algorithm developed by McClain et al. (1985) . The MCSST algorithm uses channels 4 and 5 to compute the temperature, with channels 2, 3, and 4 used to determine cloud cover . Through various comparisons (unpublished data) we have confirmed that the approximate root mean square (rms) error of the AVHRR SST retrievals are of the order of 0.5 C (see also McClain et al., 1983 ; Strong and McClain, 1984 ; Walton, 1988 ; Wick et al., 1992) . Finally, the SST fields were remapped to a Cyclindrical Equidistant projection covering the Gulf of Mexico at a spatial resolution of 2 .8x4.1 km2.
12
90W 89W 88W 87W 86W 85W 84W 83W 82W
30 N
29 N
28 N
27 N
30 N
29 N
28 N
27 N
90 W 89W 88W 87W 86W 85W 84 W 83W 82W
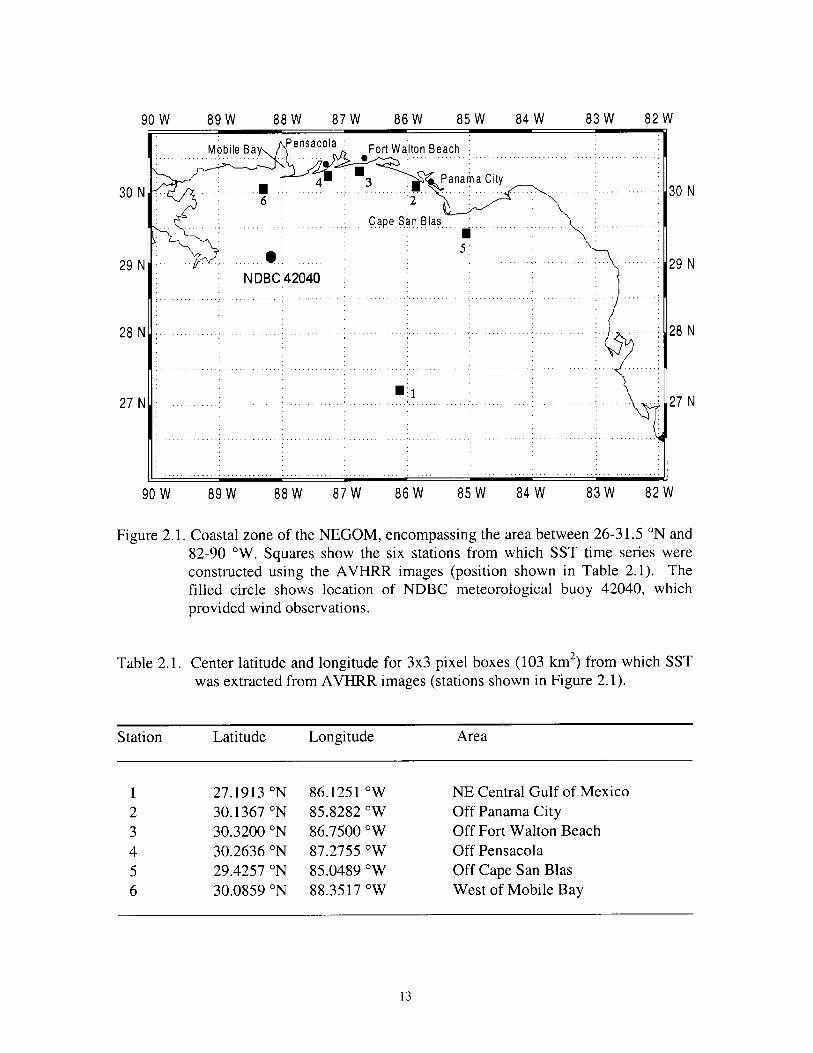
Figure 2 .1 . Coastal zone of the NEGOM, encompassing the area between 26-31 .5 °N and 82-90 °W. Squares show the six stations from which SST time series were constructed using the AVHRR images (position shown in Table 2.1) . The filled circle shows location of NDBC meteorological buoy 42040, which provided wind observations .
Table 2.1 . Center latitude and longitude for 30 pixel boxes (103 km2) from which SST was extracted from AVHRR images (stations shown in Figure 2.1) .
Station Latitude Longitude Area
1 27 .1913 °N 86.1251 °W NE Central Gulf of Mexico 2 30.1367 °N 85 .8282 °W Off Panama City 3 30.3200 °N 86.7500 °W Off Fort Walton Beach 4 30.2636 °N 87 .2755 °W Off Pensacola 5 29.4257 °N 85 .0489 °W Off Cape San Blas 6 30.0859 °N 88.3517 °W West of Mobile Bay
13
We constructed local time series of SST by averaging all observations within boxes of 30 pixels (103 km2) for each image. We extracted series for 6 boxes, 5 located near the coast in the NEGOM and one offshore (Table 2.1 ; Figure 2 .1) .
Wind speed and direction (1995-1999) were obtained from the National Data Buoy Center's (NDBC) buoy No. 42040, located at 29.18 °N, 88 .30 °W, 64 nautical miles south of Dauphin Island, Alabama (Figure 2 .1) .
Phytoplankton "chlorophyll-a concentration" fields were derived from the SeaWiFS (Sea-viewing Wide-Field-of-view Sensor ; also known as Orbview II) . SeaWiFS is flown jointly by NASA and Orbimage Corporation . The data were processed using the atmospheric correction algorithms described by Gordon and Wang (1994), and the bio-optical algorithm described by O'Reilly et al . (1998) . We are aware that there are unresolved issues that lead to severe errors in estimates of chlorophyll-a using SeaWiFS data in coastal zones, particularly in Case II waters (Morel and Prieur, 1977) where suspended sediments and colored dissolved organic matter significantly affect the ocean color signal . Nevertheless, here we use the SeaWiFS chlorophyll-a images primarily to infer the dispersal pattern followed by Mississippi River water into the area of concern . These discolored waters are very distinct in these images . We make no use of the data to determine actual phytoplankton concentrations .
Finally, we inferred circulation patterns from satellite altimetry, using the Sea Surface Height (SSH) and geostrophic current approximation products generated by Robert Leben at the Colorado Center for Astrodynamic Research (University of Colorado ; http://www-ccar.Colorado.edu/-leben/research .html) . These products incorporate data from the Ocean Topography Experiment (TOPEX) and European Remote-Sensing Satellites (ERS) satellites .
2.3 . Results
2.3.1 . AVHRR SST
We use the AVHRR imagery to examine the spatial structure of the coastal upwelling plume in May, June, and July of 1998, and to assess how it compared to conditions in other years from 1994 through 1999 . Figure 2 .2 shows examples of the imagery. Figure 2.3 presents SST extracted at one offshore location (Station 1) and at various coastal stations (Stations 2-6 in Table 2 .1 and Figure 2.1). Figure 2 .4 illustrates interannual SST variability off Fort Walton Beach, FL (Station 3), where the coldest SST off the Florida Panhandle was repeatedly detected . For display, the station data have been smoothed using a 100-point running mean filter on a series containing up to 8 observations per day.
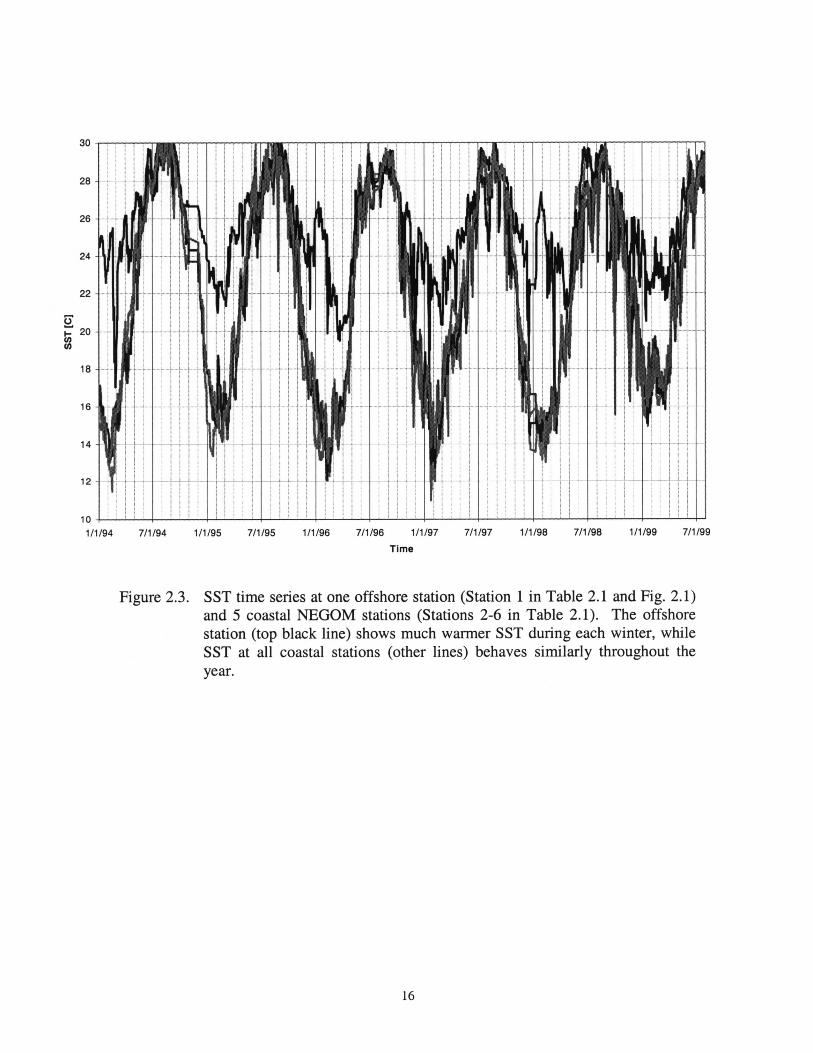
The offshore station taken in the central NEGOM (Station 1) shows an annual temperature range of about 9-11 C, from -31 C in June-August to -20-23 C in February-March (Figure 2.3). This region shows winter temperatures that are warmer than all coastal NEGOM locations . Warm winter anomalies are observed when the Loop Current or one of its warm eddies intrudes north of 27 °N, as in January and February of 1996 and
14

1998 (Figure 2.3) . In contrast, the coastal NEGOM features some of the coldest temperatures observed in the Gulf (-12 C) in January-February. After March, NEGOM waters undergo substantial warming. A cold water tongue originates in the NEGOM every winter and extends southward along the West Florida Shelf between approximately November and May. Examples of the structure of this plume are shown in Panels 2-3 of Figure 2 .2 . This structure is important for the regional ecology as it is associated with elevated phytoplankton concentrations and serves a mechanism for dispersal of river water along the West Florida Shelf break (Gilbes et al., 1996) .
Figure 2.2 . AVHRR-derived SST on (1) 21 May 1995, (2) 17 May 1996, (3) 12 May 1988, (4) 4 June 1998, (5) 7 June 1988, and (6) 17 July 1998 . SST(C) has been coded according to the color bar included . Note that extremely high SST(>30°C) are shown in blue-grey. Clouds and missing data are shown in black, and land in is shown in grey .
15
30
28
26
24
22
V F 20 N N
18
16
14
12
10
1/1/94 7/1/94 1/1/95 7/1/95 1/1/96 7/1/96 1/1/97 7/1/97 1/1/98 7/1/98 1/1/99 7/1/99
Time
Figure 2.3 . SST time series at one offshore station (Station 1 in Table 2.1 and Fig. 2.1) and 5 coastal NEGOM stations (Stations 2-6 in Table 2.1). The offshore station (top black line) shows much warmer SST during each winter, while SST at all coastal stations (other lines) behaves similarly throughout the year .
16
30 - Top
25 ~
y -
U !
20 ~ 1a '
10
J F M A M J J A S O N D
Month
-1993 -1994 1995
---- 1996 -1997 1998
-1999 100 per. Mov. Avg. (1998)
29
27
25
v 23 Arw
cn N 21-
19
17
5
M A M J J A
Month
100 per . Mov. Avg . (1998) 100 per . Mov. Avg . (1997) 100 per . Mov. Avg . (1999) 100 per . Mov. Avg . (1996)
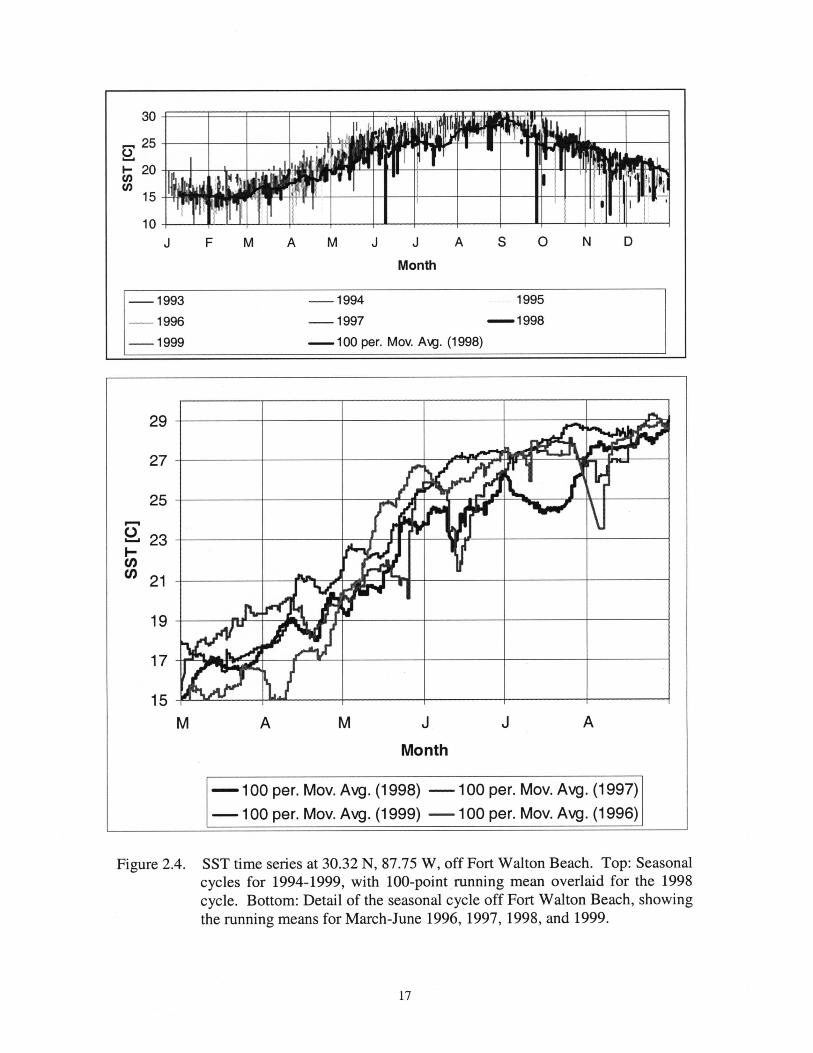
Figure 2.4 . SST time series at 30.32 N, 87.75 W, off Fort Walton Beach. Top : Seasonal cycles for 1994-1999, with 100-point running mean overlaid for the 1998 cycle . Bottom: Detail of the seasonal cycle off Fort Walton Beach, showing the running means for March-June 1996, 1997, 1998, and 1999 .
17
The AVHRR images show that in May of most years, Mississippi River water that enters the ocean is colder than surrounding waters (Panels 1 and 3 in Figure 2 .2) . However, the river plume water warms up quickly and its temperature signal becomes indistinguishable from that of oceanic waters nearby . More significant cold water patches were seen in May of several years along the coast east of Mobile Bay, even though during this period SST rises at a rate of almost 0 .25 C per day (Figure 2 .4 bottom). In May 1995, SST off Mobile Bay reached -23 C, or about 1-2 degrees below surrounding waters (Panel 1 in Figure 2.2). In May 1996 (Panel 2 in Figure 2.2), a larger plume of about 23 °C originated in the coastal zone and extended to the southeast along the shelf break of the West Florida Shelf. Figure 2.3 shows that SST in the NEGOM in May (19-25 C) is always lower relative to SST in the central Gulf of Mexico (-25-27 °C) due to the cooling effected by these coastal upwelling foci . By June, temperatures throughout the NEGOM are usually more uniform, with both offshore and coastal waters above 25-27 °C (Figure 2.3).
Of the series of images examined from 1994 through 1999, those for 1998 showed the coldest and most intense springtime upwelling (Panels 3-6 in Figure 2.2) . In May, June, and July 1998, waters along the Florida coast west of Cape San Blas were between 2 and 5 °C cooler than SST for those months in 1996 and 1999 (Figure 2.4 bottom) . Additional cooling occurred in events during the first half of June and in mid-July 1998. During each of these months, the cold coastal wedge observed along the Florida Panhandle varied in width and over several SST degrees (Figure 2 .4 bottom), probably reflecting variation in the strength of the upwelling over scales of 2-10 days.
Coastal upwelling, for example, intensified around 10 May 1998 . AVHRR imagery clearly showed a very narrow (QO km) band of cold temperatures along the coast between Cape San Blas and the entrance to Mobile Bay (Panel 3 in Figure 2 .2). SST as low as 18 °C were seen in the coldest patch, located between Pensacola and Fort Walton Beach, FL. By May 16, warm temperatures were seen along the Panhandle coast, but the cold wedge returned on May 19. From 20-24 May coastal waters warmed up again (Figure 2 .4 bottom). When present, the cold patches appeared stretched toward offshore and to the east (Panel 3 in Figure 2.2), and ultimately they appeared to disperse to the southeast along the shelf edge of the West Florida Shelf.
Temperatures along the coast of the NEGOM rose in June and July 1998 (Figure 2.4 bottom), but remained cooler than offshore waters (Panels 3-6 in Figure 2 .2, and Figure 2.3). This indicated continuation and strengthening of the upwelling process. Indeed, June 1998 showed SSTs that were 1-4 °C colder than those in June 1996 and 1999 (Figure 2 .4 bottom) . However, SST in May and June 1998 were very similar to those in 1997 . Mid-July 1998 showed much colder (-24 °C) coastal temperatures than any July between 1994 and 1999 (>27 °C; Figure 4 top) . These cold temperatures were observed in spite of offshore temperatures at their seasonal SST peak of more than 29 °C. An example of the mid-July upwelling plume is shown in Panel 6 of Figure 2.2 . Throughout this event (May-July 1998), SST along the coast remained variable over a scale of days.
18
By end of July, coastal SST in the NEGOM had risen to its seasonal mean of about 27 °C.
2.3.2 . Winds
Figure 2.5 shows variation in wind speed and direction to the east of the Mississippi Delta between May and August 1998 . We assume that the wind observations at NDBC Buoy 42040 (Figure 2 .1) are representative of conditions over the shelf off the Florida Panhandle. The wind records for 1996, 1997, 1998, and 1999 at this location show that NEGOM winds are stronger than 3 m s-1 greater than 65% of the time between 1 May and 31 August in each of these years. However, winds had an eastward component (wind direction greater than 220 degrees) 32% of the time between May and August only in 1998 . This is in contrast to 20% in 1996, 26% in 1997, and 22% in 1999 over the same time period .
The wind at the beginning of May 1998 was about 7 m s-1 from the west, but it quickly decreased and reversed to reach about 3 m s-' from the east by May 6. It then reversed again, and by 10 May had reached over 9 m s-' blowing from the west . This condition was favorable for upwelling along the Florida Panhandle coast, and resulted in the cool coastal SST pattern observed in the AVHRR image for May 11-13 (Panel 3 of Figure 2.2) . Winds decreased afterwards and reached almost 1 m s-' in mid-May . Stronger winds (> 6 m s-') were experienced during May 27-29, 1998, but blowing from the ESE, which was not favorable for upwelling . Indeed, coastal waters warmed up rapidly in late May (Figure 2.4) .
In early June 1998, winds reversed again (Figure 2 .5), increasing to nearly 8 m s~1 from the WSW. This resulted in the upwelling seen on June 4-7 (Panels 4 and 5 in Figure 2.2), and which is also shown also as a dip in SST in Figure 2 .4 . Winds then reversed and decreased in speed, and no upwelling was seen in AVHRR images for June 10. Another reversal after June 10 led to the strongest winds of the month by June 15, with winds over 8 m s-1 from the west, and AVHRR data showed a small drop in SST (Figure 2.4 bottom) . The second half of June was very cloudy, which corresponded with a period of very low winds . A thin wedge of cool waters, however, could be seen again around 29-30 June, under moderate but upwelling-favorable winds (Figure 2 .5) .
The first 10 days of July 1998 showed moderate to weak winds (1-5 m s-1) from the SSW, but during July 10-19, winds were very strong (6-8 m s-1) and upwelling favorable as they blew from the west (Figure 2.5). This led to the unusual cooling observed in July 1998, with SST nearly 3 °C below those seen during July of other years (Figure 2.4 top) . Panel 6 of Figure 2.2 shows the spatial distribution, with nearshore SST along the entire coast of Florida west of Cape San Blas 3 to 6 °C lower than water farther offshore .
2.3.3 . SeaWiFS
Figure 2.6 shows the chorophyll-a product derived from SeaWiFS ocean color imagery for selected dates between April and August 1998 . The sequence of SeaWiFS images
19

shown in Panels 2 through 6 of Figure 2.6 (1-18 May 1998) shows that a bolus of highly discolored and turbid Mississippi River plume water spread east of 88 °W over a period of about 10 days and then continued moving east along the coast. The image for May 3 (Panel 3 of Figure 2.6) shows the bolus originated in the western sector of the Mississippi Delta (Mississippi Bight, located west of 89 °W) and that it rounded the tip of the delta, entering the eastern sector (east of 89 °W) . This eastward movement was likely driven by the strong (9 m s-') wind observed blowing from the west-southwest during the first week of May (Figure 2.5) . The SeaWiFS image for 13 May (Panel 5 in Figure 2.6) also shows an area of over 100 km diameter with low pigment concentrations in the NEGOM centered around 27 .75 °N, 86 .25 °W. This is the signature of an anticyclonic feature lodged in the NEGOM.
A portion of the Mississippi water that moved east in May 1998 was entrained in a small (-50 km diameter) cyclonic eddy located off the tip of the delta near 28 .25 °N, 88 .75 °W (Panels 4 and 5 in Figure 2 .6) . However, most of this turbid water continued to flow to the north and east, past the Chandeleur Islands . Over the period May 11-18 (Panels 4-6 in Figure 2.6), this turbid water spread in a narrow plume east of Mobile Bay along the
coast (north of 30 °N and between 86-89 °W). On 18 May (Panel 6 in Figure 2.6), coastal turbidity reached very high levels along the coast west of 86 °W, and the SeaWiFS processing software masked coastal pixels as invalid (white mask). Farther to the east, prior to reaching Cape San Blas, the discolored plume turned offshore and to the southeast .
The large amount of discolored water derived from the Mississippi River delta was trapped in the NEGOM during the second half of June and the early part of July 1998 . Indeed, as winds reversed and became westward after June 10, the Mississippi water moved toward the west, was pushed against the Chandeleur Islands and the Mississippi Delta, and spread over a large area along the Alabama and Florida Panhandle coasts (Panels 7-8 in Figure 2.6). This water was dispersed (Panel 9 in Figure 2.6) after winds switched again to the east and gained in strengths in mid July (Figure 2.5).
2.3.4 . Altimetry
The large anticyclone shed by the Loop Current early in 1998 moved into the NEGOM and was detected in the AVHRR and SeaWiFS images, and was most clearly outlined in the SSH and geostrophic current fields estimated from the TOPEX/Poseidon and ERS altimeters . The sequence of AVHRR-derived SST fields and the altimeter SSH fields show that this anticyclonic eddy separated from the Loop Current in March (series not shown here). After separation, the anticyclone remained in the NEGOM for about 3-4 months, during which it dispersed warm water into the otherwise colder NEGOM (see warm peak between February and April 1998 in the offshore station SST cycle, Figure 2.3). In April-July 1998, the Loop Current remained south of 25 °N.
Figure 2.7 shows SSH fields for the Gulf of Mexico for mid May and mid July 1998 . The strong anticyclone maintained an ellipsoidal shape with its major axis oriented NW to SE throughout the June-August period . SSH values of nearly 20 cm were observed in the
20
10
8 i .--, H
G1 N ' I I I I 2
I 0 w CO CO CO CO w CO CO CO CO o~ Q? all 01, all a~ a', a', a',
N C~~ o ~
0 0 0 0 0 N c~~ ~ N Q
LO LO LO (D CO CO f~ I~ I-
Time
350
300 N
d 250 : f ~
I
l
200 ~
0 150 I v
100 O
50 - n ' 00 CO
all 01, OD 01,
C 0 01,
CO (1),
00 00 CO 00 01, all a',
r N c\ O
~ O N
O O O O 22 ~ N c~YJ
U) LO LO CO c0 cD I~ I~ f ~
Time
Figure 2.5 . Wind speed and direction (the direction wind blew from) from May 1 through July 30, 1998, at NDBC Buoy 42040 (29.18 °N, 88 .30 °W; Mobile South, 64 nautical miles of Dauphin Island, Alabama; See Figure 1) .
21
89 88 87 86 85 W
30N
29N
28N
I Imo :-~ r.~
Figure 2 .6 . 1988 SeaWiFS imagery for (1) 24 April, (2) 1 May, (3) 3 May, (4) 11 May, (5) 13 May, (6) 18 May, (7) 15 June, (8) 5 July, and (9) 27 August. Purple and blue show clear waters, and green, yellow and red show increasingly turbid waters . Extremely turbid waters (panels 2,3, and 6) and some clouds (SW to NE diagonal front in panel 2) are masked white . Other clouds and missing data are masked black .
TC?EX : EMS 2 Analysis May 14 1998
acx
771
Z4T
7' T
'8T
TOF'EX ERS-2 Analysis Jul 15 1995
iva
7TN
7n'N
2~'N
IpH
Sra wrLnx ~r~p,1d k~mi Sin zurlrr Miy~t Ic rni--~~~
Figure 2.7 . Geostrophic velocity and sea surface height in the Gulf of Mexico inferred from blended TOPEX/Poseidon and ERS altimeter data for mid-May and mid-July 1998 (courtesy of R. Leben, University of Colorado) .
22
central portion of the eddy, located farther offshore . The ellipsoidal eddy formed a SSH ridge that extended into the coastal NEGOM region between the Mississippi Delta and Cape San Blas . The SSH values here are likely to be less accurate because of problems of interpretation of altimeter data over the continental shelf, but the ridge shows lower SSH values than offshore, or values of 5-10 cm. The geostrophic current field inferred from this SSH distribution lead to convergence near the Mississippi River Delta, eastward flow along the coast, and offshore flow in the vicinity of Cape San Blas (Figure 2.7).
2.4 . Discussion
Chuang et al. (1982) and Schroeder et al . (1987) concluded that the nearshore circulation off eastern Louisiana, Mississippi, and Alabama is strongly wind-dependent, in spite of the potential for westward geostrophic flow generated by coastal fresh water input (Schroeder et al., 1987) . Chuang et al . (1982) also found that winds during summer were relatively mild, with bursts spaced about 10 days apart or longer, but that wind magnitudes rarely exceeded about 8 ms-1 . The Hellerman and Rosenstein (1983) climatological winds show that on the average, winds in the NEGOM around 29 °N, 89 °W have a westward component on a year-round basis, with a southward component between January-March and September-December, and a northward component between April and August . The zonal component of these climatological winds shows a minimum in July, and the meridional component shows its minimum in August .
However, if wind data are examined on an annual basis, each year may show a different mean orientation of the wind, as found by Chuang et al . (1982) . Indeed, as shown above, the wind records from NODC buoy No. 42040 show that winds in the NEGOM can be strong and have variable direction during summers. However, strong eastward winds are infrequent, reaching 32% of the time between May and August only in 1998 and less in 1996, 1997, and 1999 .
Clearly, inferences made based on Hellerman and Rosenstein (1983) wind climatological products are misleading because they average wind direction as well . What we may infer is that the shifting winds lead to an inconsistent summer circulation pattern on the shelf. Drifter trajectories (Muller-Karger et al ., 1998) generally have shown slow motions (order of 2-10 cm s-') within 50 km of the coast immediately to the east of Cape San Blas between March and June of 1996.
However, there are specific instances of baroclinic forcing along the shelf break (Paluszkievicz et al ., 1983) that lead to strong (>30 cm s-') currents along the shelf in the NEGOM. Chuang et al. (1982), for example, speculated that currents off Alabama in 1976 showed a stronger cross-shelf component because of a northward intrusion of the Loop Current described by Vukovich et al. (1979) . The observations of Schroeder et al. (1987) also support earlier inferences that the Loop Current plays an important role in exchange of water along the shelf break in the region . Such stronger currents, effected by interaction of large-scale circulation features such as the Loop Current and eddies with shelf waters, are also evident in the Minerals Management Service SCLTLP drifters (Muller-Karger et al., 1998).
23
The strong anticyclone shed early in 1998 from the Loop Current drifted into the NEGOM in April and interacted with shelf waters over the narrow shelf and within DeSoto Canyon off the Florida Panhandle (Nowlin et al ., 1999). Also, the winds between May and July 1998 (Figure 2.5) generated pulses of upwelling along the coast of the NEGOM between May and July 1998, as shown above. However, the outcropping of cold waters was probably facilitated by the presence of the anticyclone in the vicinity of the DeSoto Canyon (Nowlin et al ., 1999). The walls of such eddies consist of a baroclinic structure in which isotherms are raised from the interior of the eddy toward its periphery. As the eddy neared the shelf break, the upwelling-favorable wind raised isotherms further and cold waters that are normally found at depths greater than 100 m racked the surface, cropping out along the coast . While upwelling-favorable winds are observed during most years, they have been less frequent than in 1998 and they act on more stratified waters in which the thermocline lies at greater depths . Therefore, if an anticyclone is not interacting with the shelf break in the NEGOM, there is less of a surface effect even during periods of eastward wind.
The anticyclonic eddy seen in the NEGOM in 1998 led to a steep gradient in SST between the coast and offshore waters . Indeed, offshore NEGOM waters experienced significant warming in the first half of 1998 relative to other years. SSTs reached 26 °C as far north as 27 °N in February 1998, when normally minima of 20-22 °C should be observed there at that time (Figure 2 .3 ; at Station 1 in Table 2.1 ; see also Muller-Karger
et al., 1991) . In May-June 1998, waters at 27 °N were still 2-3 °C warmer than their seasonal average for that time (Figure 2.3, curve for Station 1) . This area typically would experience the effect of the cold plume that originates in the coastal zones of the NEGOM (as in Panel 2 of Figure 2.2) . However, the Loop Current anticyclone occupied this area and migrated far to the north, bringing very warm waters into the NEGOM early in the season .
This early warming of the central/eastern and northeastern Gulf of Mexico may have contributed to the anomalous winds observed during the 1998 season . It is possible that the unseasonably warm water mass represented strong meteorological forcing which stimulated the higher frequency of eastward winds seen along the shelf in the NEGOM in 1998 . Explicitly, normal meteorological conditions lead to variable winds along the coast of the Florida Panhandle at this time of the year . However, the large warm water mass associated with the eddy may have created a local atmospheric low pressure system which affected local winds. Indeed, the eastward winds observed by Chuang et al . (1982) over the shelf in 1976 may have been associated with a similar low pressure system, caused by the northward intrusion of the Loop Current identified by Vukovich et al . (1979) .
The question remains, then : What caused the anomalous fish kills and discolored water in the NEGOM during June and July 1998?
The bulk of the Mississippi water usually drifts west along the coast of Louisiana and Texas (Muller-Karger et al ., 1991 ; Muller-Karger, 1993) . However, eastward movement
24
of Mississippi water is not unusual . For example, Coastal Zone Color Scanner (CZCS) satellite images had shown that Mississippi River water can drift east and south, and reach Florida Strait during late summer every year (see Muller-Karger et al ., 1991, and references therein) . Other reports of such eastward movement abound (see, for example, Schroeder et al ., 1987) . The SeaWiFS data show that a large volume of Mississippi plume water moved from the central Louisiana coast, around the tip of the Mississippi Delta, and eastward into the NEGOM in May and June 1998 . This discolored water was trapped in the coastal NEGOM by during the second week of June and through about July 10 by weak and westward winds (Figure 2 .5) . The discolored water moved east again after July 15 and eventually cleared the area in late July, after winds became strong and eastward .
In the Mississippi Delta bight, the peak in discharge of nutrient-rich Mississippi and Atchafalaya Rivers, combined with the lack of strong winds in summer, leads to substantial phytoplankton blooms . These sink and decompose, causing seasonal hypoxia in bottom waters because vertical mixing is inhibited (Walsh, 1988 ; Turner and Allen, 1982; Turner and Rabalais, 1991 ; Justic et al., 1993 ; Atwood et al., 1994 ; Rabalais et al., 1996) . The oxygen depletion begins in late spring, reaches a maximum in mid-summer, and disappears in the fall . The area affected has grown to covers approximately 18,000 km2 every year, but has not been yet reported to extend into the eastern sector of the Mississippi Delta . A similar, but much more modest condition seems to occur within Mobile Bay . The problem occurs in the middle of an important commercial and recreational fisheries area and is considered a threat the economy of this region of the Gulf. Clearly, this phenomenon is of great concern because it leads to massive annual fish and shrimp mortality .
The documentation of the massive eastward transport of Mississippi plume water around the tip of the Delta in May and June 1998 is therefore significant. When Mississippi River bight water moved to the east and spread along the Florida Panhandle coast in May 1998, it likely had a strong stabilizing effect on the water column . The AVHRR image for 12 May 1998 (Panel 3 of Figure 2 .2) shows a newly upwelled water patch along the coast. The upwelling of deeper waters would displace any low salinity and discolored water present near the coast farther offshore . The SeaWiFS images for 18 May and 5 July (Panels 6 and 8 in Figure 2.6) confirm separation of the discolored plume from the coast in a southeastward direction, eastward of about 86.5 °W . This also followed the pattern of currents inferred from the altimeter data, and allowed for a wedge of cold water to break the surface from below along the coast.
The wind reversals then repeatedly moved the river water back toward the coast to cause the periodic masking of the upwelling in the AVHRR data . However, as the river water was advected toward the coast, local downwelling, also driven by the westward wind, caused submergence of phytoplankton blooming along the coast. These processes are accompanied by inhibition of vertical mixing and of oxygenation. This is the likely cause for depletion of dissolved oxygen in nearshore bottom waters during July 1998 off the Florida Panhandle.
25
2.5 . Conclusions
Unusual upwelling and river plume dispersal patterns observed in the NEGOM in May-July 1998 were in great measure the result of the rare northward migration of an anticyclonic eddy shed by the Loop Current . This large and warm anticyclone led to regional warming in excess of 3 °C relative to normal conditions, which in turn may have contributed to anomalous meteorological conditions over the NEGOM. The baroclinic structure of the walls of the eddy placed cold waters over the shelf, and the eastward winds that were observed repeatedly during this period facilitated outcropping of the thermocline along the coast . Through combined action of strong winds from the west and the motion of waters in the periphery of the anticyclone lodged in the NEGOM, Mississippi plume waters moved east of the delta between May and June 1998. Mississippi waters were maintained offshore during upwelling periods, but were advected toward shore as winds relaxed or became westward, and eventually became stagnant along the coast in late June and early July . This stagnation, after local downwelling of coastal, biologically productive waters, is the likely cause of the hypoxia observed during this period in coastal waters . By late August, most of the Mississippi water had been flushed out of the NEGOM, and had dispersed between the NEGOM and the Florida Keys and beyond .
It is unclear whether these phenomena were related to the strong El Nino of 1997-1998 or not . At this stage, there is no evidence for such a link . There are concerns that the 1998 cold water and hypoxic condition may occur again in the future . It is unclear that we can predict recurrence, however, but it appears that we can anticipate substantial meteorological and oceanographic impact from errant anticyclones in the Gulf of Mexico .
Clearly, routine monitoring of the entire northern Gulf of Mexico using a suite of near-real-time, complementary satellite-based sensors is viable today and helps determine whether processes are underway that can lead to anomalous situations in deep water as well as continental shelf environments of the Gulf of Mexico.
26
III. HURRICANE IMPACTS ON THE NORTHEASTERN GULF OF MEXICO AS SEEN WITH THE NOAA AVHRR AND SEAWIFS
ABSTRACT
Sea-surface effects of hurricanes Earl and Georges in the Northeastern Gulf of Mexico in 1998 were studied using the National Oceanic and Atmospheric Administration/ Advanced Very High Resolution Radiometer (NOAA/AVHRR) and the Sea-Viewing Wide Field-of-View Sensor (SeaWiFS) satellite data and in-situ current meter data. In each case, a region of low SSTs was detected to the right of the hurricane's track by the NOAA/AVHRR. For Earl, the sea surface temperature (SST) decreased by as much as 3 .6 C, and for Georges, by as much as 4.2 C relative to that prior to the passage of the hurricanes . The lowest SSTs were found near or at the shelf break in each case, suggesting that the shelf slope may have enhanced upwelling associated with hurricanes. In the case of Georges, SeaWiFS detected a doubling in pigment concentration where the lowest SST associated with the hurricane was observed . SeaWiFS also detected a region with discolored water (i .e ., large pigment concentrations) immediately south of the shelf break near the Mississippi Delta region, but it was located principally to the left of the hurricane's path . The spatial mismatch between the SST and ocean color patterns indicated that the discolored water was due to offshore advection of Mississippi River water, rather than in-situ phytoplankton growth . For Georges, both the SST and the turbid features drifted to the southwest and dissipated over a 3- to 4-day period.
3.1 . Introduction
Sea-surface temperature (SST) changes associated with the passage of hurricanes are well documented. They range from -1 .0 °C to -6.0 °C (Jordan, 1964; Leipper, 1967 ; Wright, 1969 ; Fedorov et al., 1979 ; Pudov et al., 1979; Smith, 1982; Cornillon et al., 1987 ; Nelson, 1996) . Such changes are generally centered from 20 km to 150 km to the right of the hurricane's path; that is, on the side of the hurricane where the most intense winds are found (i .e ., the right-hand quadrant) and where upwelling, induced by the hurricane, affects the first 200-300 m of the sea (Price, 1981 ; Brooks, 1983; Brink, 1989; Black et al., 1988) . The data presented by Price (1981) and Withee and Johnson (1976) have suggested that the SST changes associated with hurricanes are functions of the hurricane's translation speed and intensity, the latter being defined by the central pressure . The magnitude of the SST response increased with decreasing translation speed and decreasing central pressure . A -6.0 C SST departure was noted with hurricane Hilda when its translation speed was about 3 m/s and its central pressure was 930 mb (Leipper, 1967) . Most of the data upon which these results rely were obtained through hydographic surveys, which unfortunately are not synoptic . Furthermore, the upwelling induced by a hurricane will not only affect SST, but may bring nutrients to the surface, which should affect the surface phytoplankton distribution . However, to our knowledge, the literature on enhanced phytoplankton concentrations in oceanic waters after a hurricane is small to non-existent .
27
In this paper, we examine the influence of the passage of hurricanes Earl and Georges, which took place in the late summer and early fall of 1998, on the synoptic SST and phytoplankton biomass distribution in the Northeastern Gulf of Mexico. The SST distribution was determined from the National Oceanic and Atmospheric Administration (NOAA) 12 and NOAA 14 Advanced Very High Resolution Radiometer (AVHRR) data, and the biomass distribution from the Sea-Viewing Wide Field-of-View Sensor (SeaWiFS) data, for the period immediately following the passage of these hurricanes . Mean near-surface currents from moorings in the Northeastern Gulf of Mexico were used to examine flow characteristics in the vicinity of the cold and pigment patches detected using the satellite data and produced by the hurricanes .
3.2. Methods
3.2.1 . Sea Surface Temperature (SST)
The SST was derived from infrared (IIZ) observations collected by the AVHRR sensors placed into orbit on the NOAA Polar Orbiting Satellite series . The high-resolution AVHRR images that were used for this study were collected over the Northeastern Gulf of Mexico using the High Resolution Picture Transmission (HRPT) antenna located at the University of South Florida, in St . Petersburg, Fl . All passes (nighttime and daytime passes) from each NOAA satellite were combined to build the time series . The visible and near-infrared channels were calibrated to percent albedo, and the IR channels were calibrated to degrees Celsius . The navigation was manually corrected to compensate for errors in the satellite clock and orientation . The SST was computed using the multi-channel sea-surface temperature (MCSST) algorithm developed by McClain et al. (1985) . The MCSST algorithm uses channels 4 and 5 to compute the temperature, with channels 2, 3, and 4 used to determine cloud cover. Through various comparisons (unpublished data), we have confirmed that the approximate root mean square error of the AVHRR SST retrievals are of the order of 0.5 °C (see also McClain et al., 1983 ; Strong and McClain, 1984; Walton, 1988 ; Wick et al ., 1992) .
Because of extensive cloud cover during summer in the Gulf of Mexico, we averaged AVHRR SST images collected during both day and night time over periods of 1-2 days . Pixels with cloud cover were excluded during this binning (compositing) process. After compositing images, the SST minima were located in the vicinity of the hurricane tracks . The difference in SST values before and after a hurricane's passage was calculated for these regions of SST minima using 8x8 pixel boxes .
3.2.2 . Sea Surface Pigment Concentration
Phytoplankton "chlorophyll-a concentration" fields were derived from the SeaWiFS (Sea-viewing Wide-Field-of-view Sensor ; also known as Orbview II). SeaWiFS is flown jointly by NASA and Orbimage Corporation. SeaWiFS is a component of NASA's Earth Observing System (EOS) and builds on the legacy of the Coastal Zone Color Scanner (CZCS). SeaWiFS has been operational since September 18, 1997, and has provided global estimates of oceanic chlorophyll-a and other bio-optical quantities to the international community routinely to date (Hooker et al., 1992, McClain et al ., 1998). The data over the Northeastern Gulf of Mexico were processed using the atmospheric
28
correction algorithms described by Gordon and Wang (1994), and the bio-optical algorithm described by O'Reilly et al. (1998) . We are aware that there are unresolved issues that lead to severe errors in estimates of chlorophyll-a using SeaWiFS data in coastal zones, particularly in Case II waters (Morel and Prieur, 1977) where suspended sediments and colored dissolved organic matter significantly affect the ocean color signal . Nevertheless, here we use the SeaWiFS chlorophyll-a images primarily to infer the dispersal pattern followed by Mississippi River water into the area of concern . These discolored waters are very distinct in these images .
During the presence of a hurricane, the Northeastern Gulf of Mexico was largely covered by clouds . SeaWiFS images collected during these periods and for several days after hurricane passage were nevertheless processed. Chlorophyll-a concentration before and after hurricane passage was measured within 8x8 pixel boxes centered on the location used for SST comparisons .
3.2.3 . Sea Surface Current
Daily mean currents at 29 .7 °N, 86 .27 °W and 29 .25 °N, 85.5 °W and 12 m depth were computed based on ADCP data that were collected as part of the MMS DeSoto Canyon Program . The daily means from the current meter data were calculated by averaging the hourly u- (positive to the east) and v- (positive to the north) components of the current for each day .
3.3.Results
3.3.1 . Sea-Surface Temperature Changes
Earl became a hurricane when a quasi-stationary tropical depression intensified in the Northeastern Gulf of Mexico around noon on 2 September 1998. That afternoon, the central pressure in the hurricane fell to about 986 mb and Earl became a Category 2 hurricane for about 6 hours, with sustained winds reaching 85 mph . This hurricane then began to move to the northeast at an average speed of about 19 km/hr, making landfall near midnight in the Florida Panhandle region . By mid-day on 3 September, it was located north of 32 °N and was again designated a tropical depression .
Earl had a major influence on the near-surface flow around the shelf break near the DeSoto Canyon on 3 September, as suggested by a Minerals Management Service current meter located at 29 .7 °N and 86 .3 °W (Figure 3.3). Prior to the passage of the hurricane, the near surface flow was to the south-southwest and probably was associated with the warm and cold rings located near the DeSoto Canyon (Figure 3.la,b) . Strong northward near-surface currents (daily-averaged speed of about 30 cm/s) were observed, however, on 3 September. As the hurricane continued northeastward and moved inland on 3 September, the near-surface current speed decreased and the flow turned eastward .
From late June through October, the northern boundary of the Loop Current was located, for the most pan, south of 25°N, and therefore, had no direct influence on the
29
Northeastern Gulf of Mexico. By early September, the center of a major warm core ring that had separated from the Loop Current in the eastern Gulf of Mexico in June 1998 was located west 93°W and it also had no direct influence on the Northeastern Gulf of Mexico. There were, however, a small cold ring and a small warm ring located in the Northeastern Gulf of Mexico at the time hurricane Earl and Georges passed through . The small warm ring was located in the DeSoto canyon region (i .e ., 28.5 °N, 87.5 °W) from early September through October (Figure 3 .1a) . This small ring broke into two smaller warm core rings which moved toward the southeast after Hurricane Earl passed through the area (Figure 3 .1b) . Two small cold rings were also evident in the Northeastern Gulf of Mexico area (at 27 °N, 87.6 °W and at 27 .5 °N, 85 .7 °W) prior to Hurricane Earl (Figure 3 .1a) in early September . These eventually drifted westward, out of the region of interest (Figure 3 .2a,b) .
On 3-4 September, the AVHRR detected a small, isolated region of low SSTs to the right of the hurricane track in the vicinity of the shelf break (Figure 3.4) . The lowest temperatures were seen at the shelf break, with SSTs as much as 3 .6 °C lower than those observed there prior to the passage of Earl . The near-surface flow (Figure 3 .3) near the area of very low temperatures was strong to the east late on 3 September and on 4 September, across isobaths . The SeaWiFS data showed no major changes in the near-surface phytoplankton concentration distribution in this region, however.
Hurricane Georges developed in the Tropical Atlantic Ocean and moved west-northwest across Cuba into the Gulf of Mexico, where it turned and moved to the northwest . It entered the Gulf of Mexico on 25 September 1998 and moved rapidly to the north-northwest at an average speed of 18 km/hr . By early morning on 28 September, it reached the Mississippi River Delta region and moved inland . Between 25-28 September, Georges was classified as a Category 2 hurricane, with sustained winds of 95 mph and central pressures as low as 961 mb.
The hurricane affected the near-surface flow at the shelf break near the Mississippi Delta on 27 September. Strong west-southwestward near-surface currents (i.e ., daily-averaged speed of about 54 cm/s) were observed on 27 September at another Minerals Management Service current meter located at 29 .25 °N and 88 .50 °W (Figure 3 .5). The current speed was about a factor of two greater than observed over the ten days prior to the hurricane. As the hurricane continued northward and moved inland on 28 and 29 September, the near-surface current weakened (daily-averaged speeds of 12 to 27 cm/s to the north-northeast), but was still strong compared to before the hurricane . After the hurricane passed, the near-surface flow oscillated from southwest/west-southwest to north/north-northeast . The flow to the southwest and west-southwest was generally stronger . The average flow in the 10-day period after the hurricane passed was to the southwest, at about 5 cm/s .
30
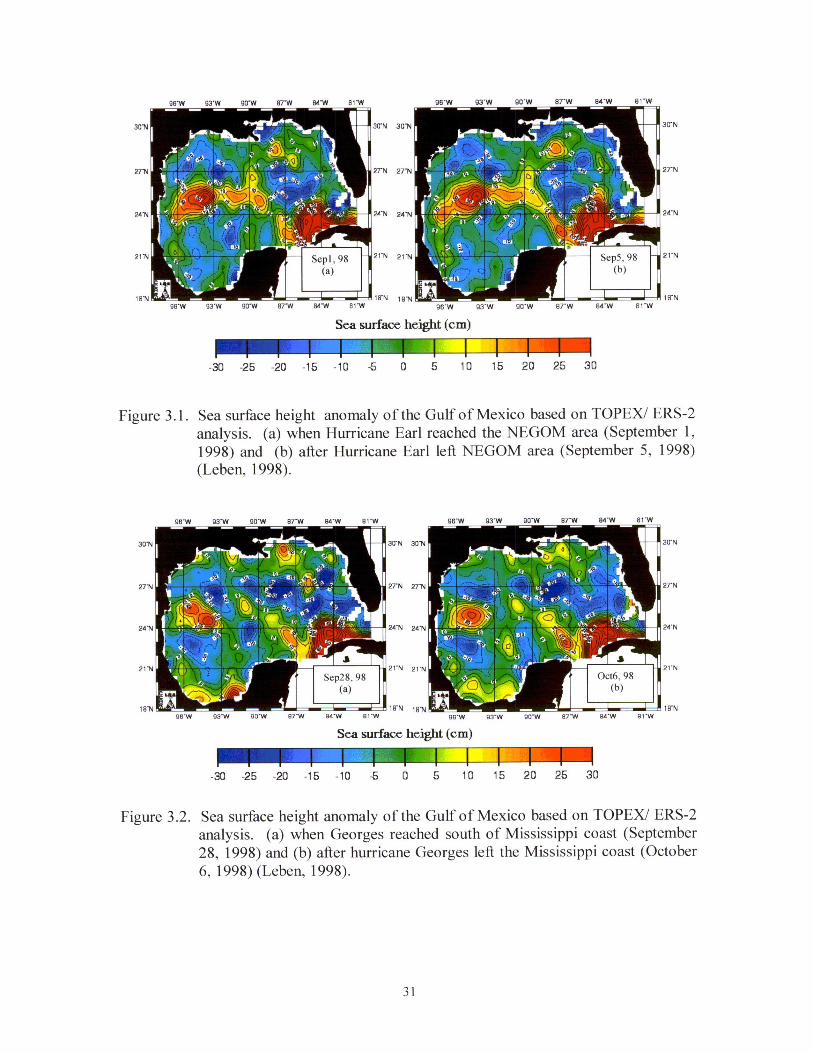
30T1
27N
2dN
21N
27"N
24'N
21"N
1 B'N 18'N 96'W 93"W 90'W 87'W 84'W 81"W 96'W 93"W 90"W 87'W 84'W 81"W
Sea surface height (cm)
-30 -25 -20 -15 -10 -5 0 5 10 15 20 25 30
Figure 3 .1 . Sea surface height anomaly of the Gulf of Mexico based on TOPER/ ERS-2 analysis . (a) when Hurricane Earl reached the NEGOM area (September 1, 1998) and (b) after Hurricane Earl left NEGOM area (September 5, 1998) (Leben, 1998).
30N
27N
24'N
21N
30'N 30N
2TN 27'N
24'N 24TI
21"N 21"N
I"N
"N
N
'N
1H'N 1 8-N 18N 9fi'W 93"W 90'W 87'W 84-W 81"W g6'W 93'W 90"W 87'W 84'W 81'W
R 18-N
Sea surface height (cm) u-
-30 -25 -20 -15 -10 5 0 5 10 15 20 25 30
Figure 3 .2 . Sea surface height anomaly of the Gulf of Mexico based on TOPER/ ERS-2 analysis . (a) when Georges reached south of Mississippi coast (September 28, 1998) and (b) after hurricane Georges left the Mississippi coast (October 6, 1998) (Leben, 1998) .
96"W 93'W 90'W 87"W 84"W 81-W
30"N
31
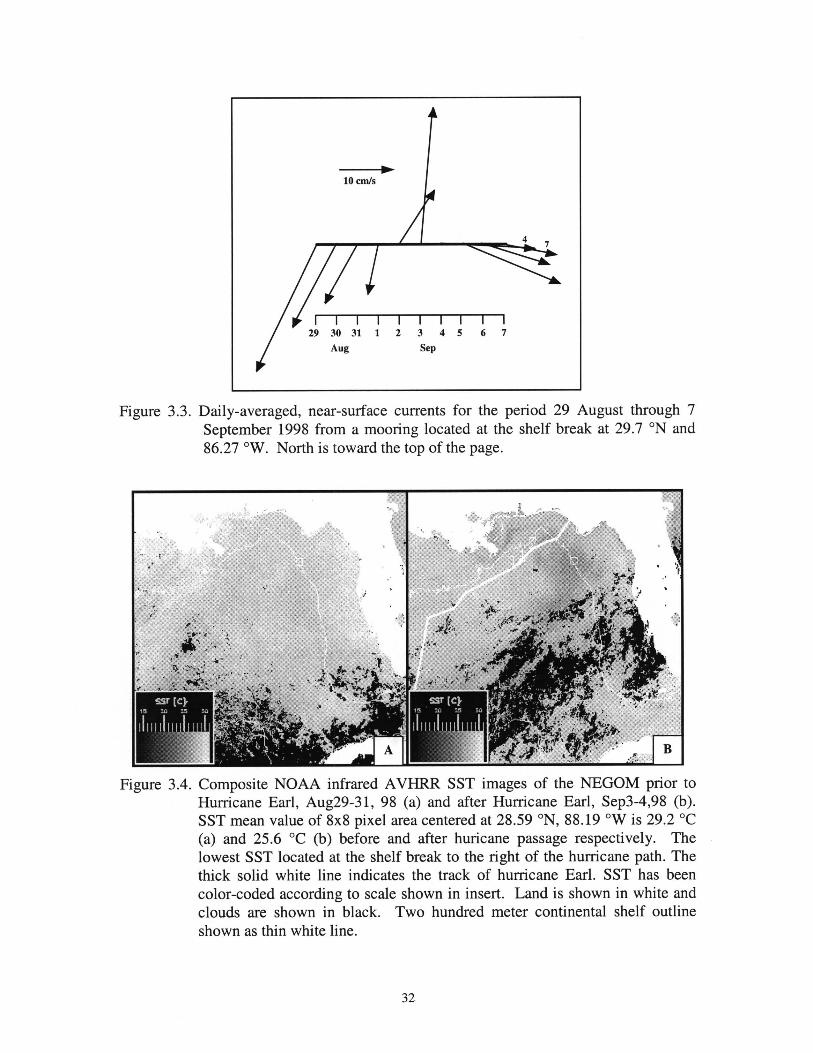
Figure 3.3 . Daily-averaged, near-surface currents for the period 29 August through 7 September 1998 from a mooring located at the shelf break at 29.7 °N and 86.27 °W . North is toward the top of the page.
1
!_1 Figure 3 .4 . Composite NOAA infrared AVHRR SST images of the NEGOM prior to
Hurricane Earl, Aug29-31, 98 (a) and after Hurricane Earl, Sep3-4,98 (b). SST mean value of 8x8 pixel area centered at 28 .59 °N, 88 .19 °W is 29.2 °C (a) and 25.6 °C (b) before and after huricane passage respectively . The lowest SST located at the shelf break to the right of the hurricane path . The thick solid white line indicates the track of hurricane Earl . SST has been color-coded according to scale shown in insert . Land is shown in white and clouds are shown in black. Two hundred meter continental shelf outline shown as thin white line .
32
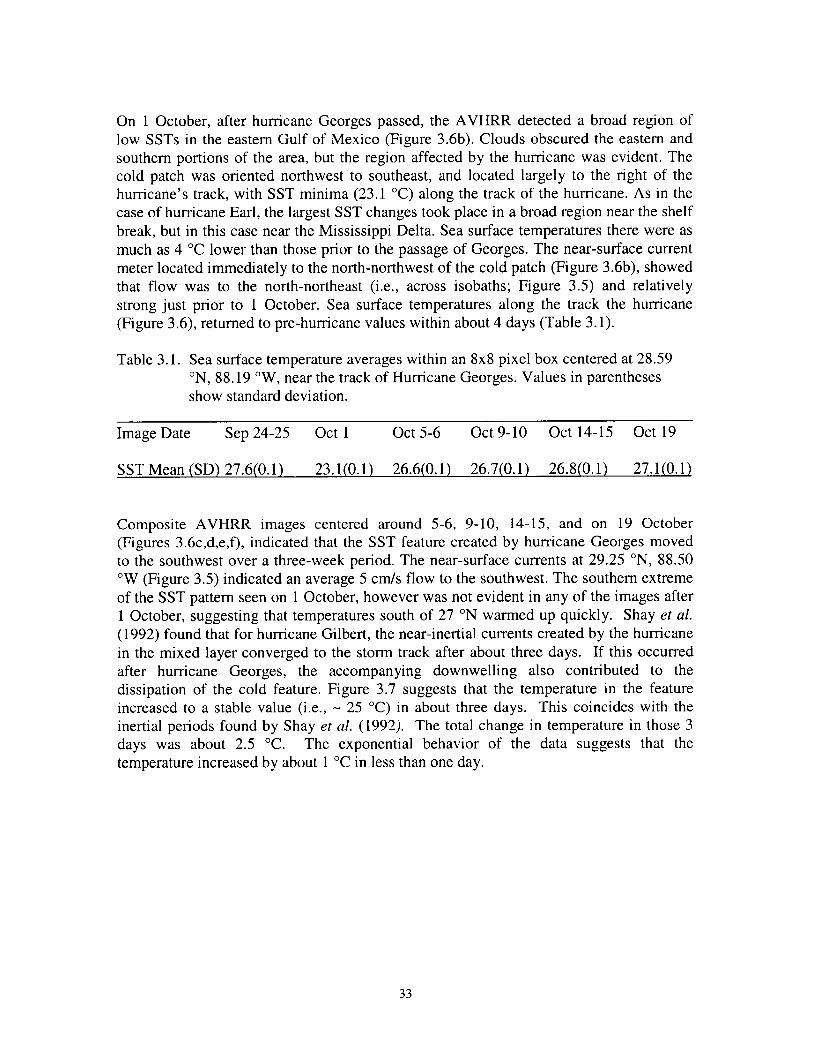
On 1 October, after hurricane Georges passed, the AVHRR detected a broad region of low SSTs in the eastern Gulf of Mexico (Figure 3.6b) . Clouds obscured the eastern and southern portions of the area, but the region affected by the hurricane was evident . The cold patch was oriented northwest to southeast, and located largely to the right of the hurricane's track, with SST minima (23.1 °C) along the track of the hurricane . As in the case of hurricane Earl, the largest SST changes took place in a broad region near the shelf break, but in this case near the Mississippi Delta . Sea surface temperatures there were as much as 4 °C lower than those prior to the passage of Georges . The near-surface current meter located immediately to the north-northwest of the cold patch (Figure 3 .6b), showed that flow was to the north-northeast (i .e ., across isobaths ; Figure 3 .5) and relatively strong just prior to 1 October . Sea surface temperatures along the track the hurricane (Figure 3.6), returned to pre-hurricane values within about 4 days (Table 3 .1) .
Table 3 .1 . Sea surface temperature averages within an 8x8 pixel box centered at 28.59 °N, 88 .19 °W, near the track of Hurricane Georges . Values in parentheses show standard deviation.
Image Date Sep 24-25 Oct 1 Oct 5-6 Oct 9-10 Oct 14-15 Oct 19
SST Mean (SD) 27 .6(0 .1) 23.1(0.1) 26 .6(0.1) 26.7(0 .1) 26.8(0.1) 27 .1(0.1)
Composite AVHRR images centered around 5-6, 9-10, 14-15, and on 19 October (Figures 3.6c,d,e,f), indicated that the SST feature created by hurricane Georges moved to the southwest over a three-week period. The near-surface currents at 29.25 °N, 88 .50 °W (Figure 3 .5) indicated an average 5 cm/s flow to the southwest . The southern extreme of the SST pattern seen on 1 October, however was not evident in any of the images after 1 October, suggesting that temperatures south of 27 °N warmed up quickly . Shay et al. (1992) found that for hurricane Gilbert, the near-inertial currents created by the hurricane in the mixed layer converged to the storm track after about three days. If this occurred after hurricane Georges, the accompanying downwelling also contributed to the dissipation of the cold feature . Figure 3.7 suggests that the temperature in the feature increased to a stable value (i .e ., - 25 °C) in about three days . This coincides with the inertial periods found by Shay et al . (1992) . The total change in temperature in those 3 days was about 2.5 °C. The exponential behavior of the data suggests that the temperature increased by about 1 °C in less than one day .
33
20 cm/s
15 20 25 30 5 10 15 Sept. Oct .
Figure 3 .5 . Daily-averaged, near-surface currents for the period 15 September through 15 October 1998 from a mooring located at the shelf break at 29.25 °N and 88 .50 °W. North is toward the top of the page.
3.3.2 . Sea-Surface Pigment Concentration
After hurricane Georges passed through the eastern Gulf of Mexico between September 26-28, 1998, SeaWiFS detected new discolored features at the sea-surface immediately south of the shelf break near the Mississippi Delta region, where none were present prior to the hurricane's passage (Figure 3 .8). However, even though a portion of this discolored feature was located near the hurricane's track, precisely where the lowest temperatures were found at that time, the bulk of the colored feature was located west of the track (Figure 3.8b) .
At the location where the lowest temperatures were found, chlorophyll-a was about 1 .25 mg/m3 on September 30-October 2, or more than twice that observed prior to the passage of Georges (0 .59 mg/m3 on September 14-24 ; Table 3 .2) . However, by October 5-6 chlorophyll-a concentrations had decreased to about half the value observed prior to the hurricane (Table 3 .2). This suggested that the hurricane enhanced surface nutrient concentrations, but that this effect was very short-lived. This effect was similar to the short-lived (2-3 days) phytoplankton bloom seen after Hurricane Bob in 1991 in Waquoit Bay, Cape Cod, Massachusetts (Valiela et al., 1998) .
34
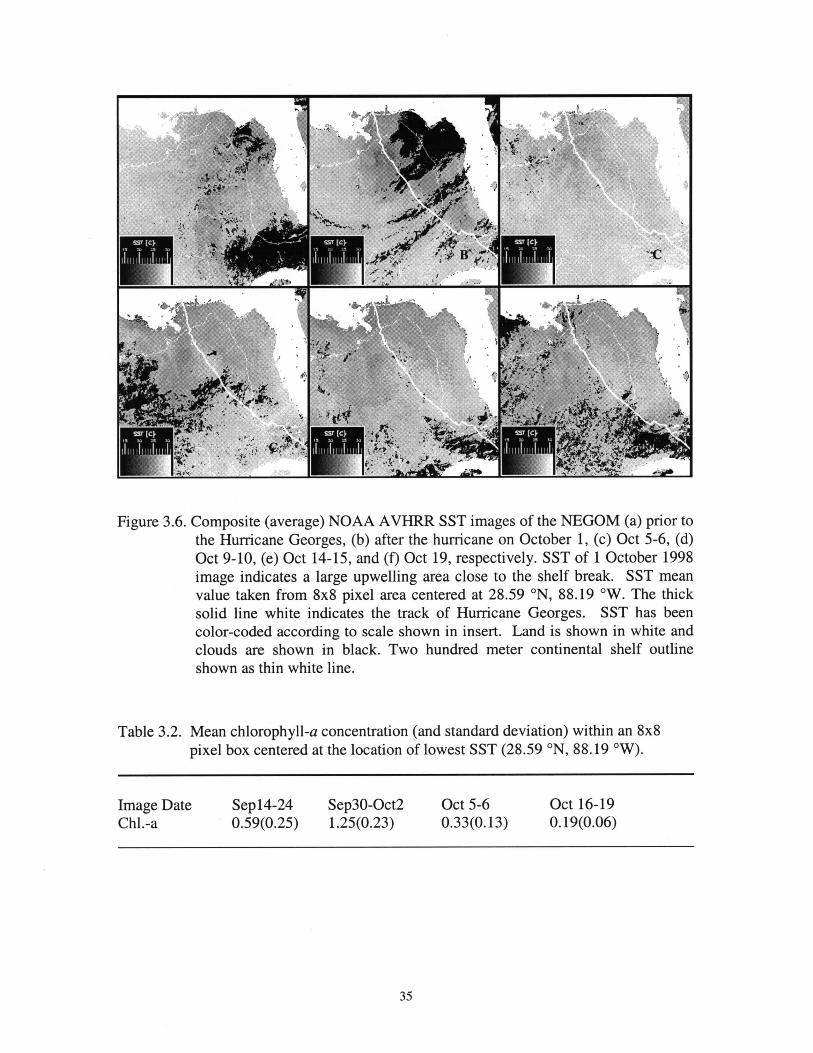
.~ ..~~
. .
\, , l
. . M~I
'~q J
'. Y
v x . ra
~'g. .
.. ~~
~~.
Figure 3 .6 . Composite (average) NOAA AVHRR SST images of the NEGOM (a) prior to the Hurricane Georges, (b) after the hurricane on October 1, (c) Oct 5-6, (d) Oct 9-10, (e) Oct 14-15, and (f) Oct 19, respectively . SST of 1 October 1998 image indicates a large upwelling area close to the shelf break. SST mean value taken from 8x8 pixel area centered at 28 .59 °N, 88.19 °W. The thick solid line white indicates the track of Hurricane Georges. SST has been color-coded according to scale shown in insert . Land is shown in white and clouds are shown in black. Two hundred meter continental shelf outline shown as thin white line.
Table 3.2 . Mean chlorophyll-a concentration (and standard deviation) within an 8x8 pixel box centered at the location of lowest SST (28.59 °N, 88 .19 °W).
Image Date Sep14-24 Sep30-Oct2 Chl .-a 0.59(0.25) 1 .25(0.23)
Oct 5-6 0.33(0 .13)
~L
Oct 16-19 0.19(0.06)
35
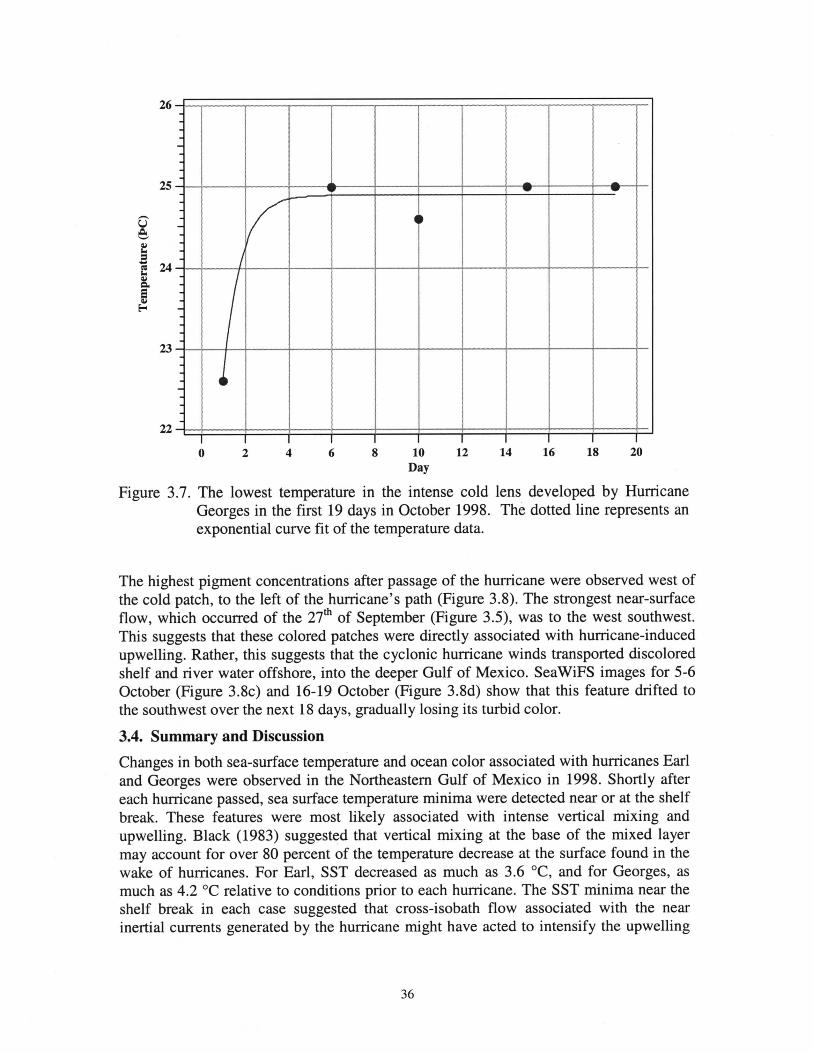
26
25
`+
N
24
F
23
22
E i --- - - ...-- --- "
+
I
f {
E
+ f
i
0 2 4 6 8 10 12 14 16 18 20 Day
Figure 3.7 . The lowest temperature in the intense cold lens developed by Hurricane Georges in the first 19 days in October 1998 . The dotted line represents an exponential curve fit of the temperature data .
The highest pigment concentrations after passage of the hurricane were observed west of the cold patch, to the left of the hurricane's path (Figure 3.8) . The strongest near-surface flow, which occurred of the 27`h of September (Figure 3 .5), was to the west southwest . This suggests that these colored patches were directly associated with hurricane-induced upwelling . Rather, this suggests that the cyclonic hurricane winds transported discolored shelf and river water offshore, into the deeper Gulf of Mexico. SeaWiFS images for 5-6 October (Figure 3.8c) and 16-19 October (Figure 3 .8d) show that this feature drifted to the southwest over the next 18 days, gradually losing its turbid color.
3.4. Summary and Discussion
Changes in both sea-surface temperature and ocean color associated with hurricanes Earl and Georges were observed in the Northeastern Gulf of Mexico in 1998. Shortly after each hurricane passed, sea surface temperature minima were detected near or at the shelf break. These features were most likely associated with intense vertical mixing and upwelling . Black (1983) suggested that vertical mixing at the base of the mixed layer may account for over 80 percent of the temperature decrease at the surface found in the wake of hurricanes . For Earl, SST decreased as much as 3 .6 °C, and for Georges, as much as 4.2 °C relative to conditions prior to each hurricane. The SST minima near the shelf break in each case suggested that cross-isobath flow associated with the near inertial currents generated by the hurricane might have acted to intensify the upwelling
36
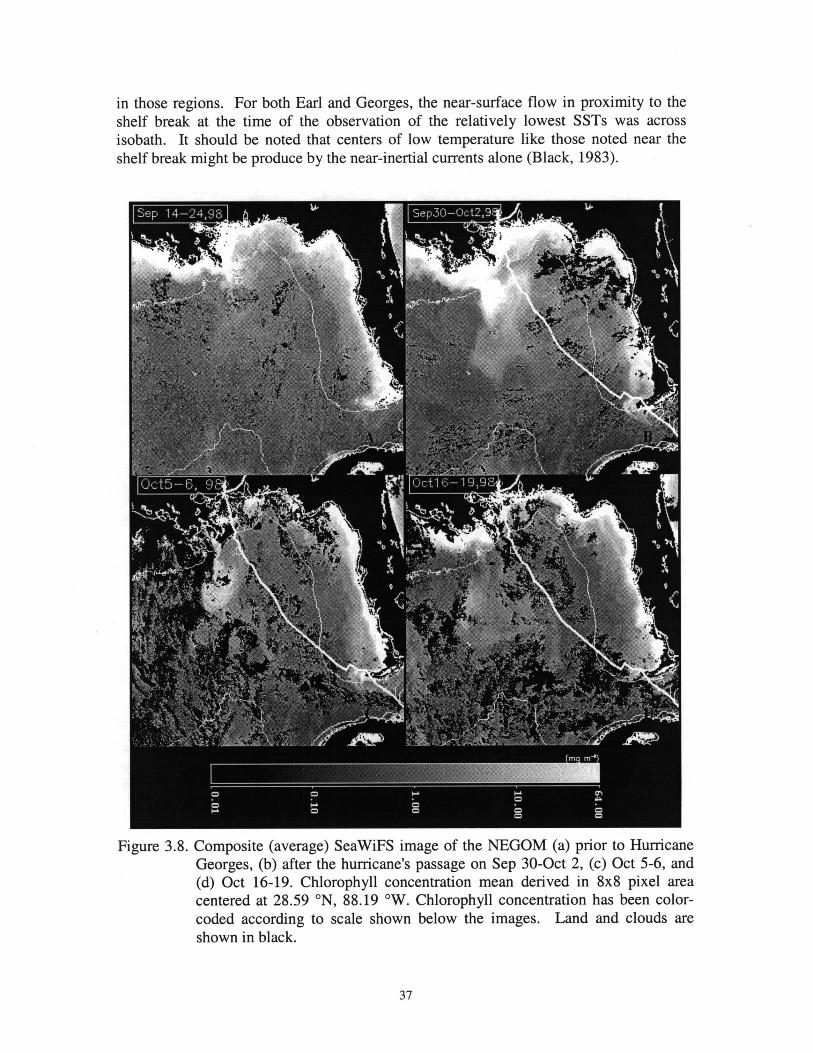
in those regions. For both Earl and Georges, the near-surface flow in proximity to the shelf break at the time of the observation of the relatively lowest SSTs was across isobath . It should be noted that centers of low temperature like those noted near the shelf break might be produce by the near-inertial currents alone (Black, 1983).
Figure 3.8 . Composite (average) SeaWiFS image of the NEGOM (a) prior to Hurricane Georges, (b) after the hurricane's passage on Sep 30-Oct 2, (c) Oct 5-6, and (d) Oct 16-19. Chlorophyll concentration mean derived in 8x8 pixel area centered at 28 .59 °N, 88.19 °W. Chlorophyll concentration has been color-coded according to scale shown below the images. Land and clouds are shown in black.
37
While pigment concentrations doubled at the location where the SST minima were seen after passage of Georges, SeaWiFS detected the largest pigment concentration increases immediately south of the shelf break near the Mississippi Delta region . Indeed, the current meter data showed strong near-surface flow from the shelf into the deep Gulf in this region on 27 September 1998, which suggests the pigment feature was advected from the shelf.
After Georges, both the SST and the pigment features drifted to the southwest and dissipated . Current meter data suggested an average southwestward drift in the region of about 5 cm/s . The temperature in the cold lens increased by 2 .5 °C in about 3 days to a relative steady value of about 25 °C. The The pigment feature was no longer visible in the SeaWiFS data after about 3-4 days . This time scale (three days) coincides with the period for inertial currents found by Shay et al . (1992) for hurricane Gilbert. Thus, it is possible that downwelling associated with these inertial currents, as well as mixing and surface warming, contribute to the dissipation of hurricane effects within 2-3 days in the water column of the Gulf of Mexico.
38
IV. REFERENCES
Atwood, D.K., A . Bratkovich, M. Gallagher, and G. Hitchcock (eds .) 1994 . Papers from NOAA's Nutrient Enhanced Coastal Ocean Productivity Study . Special Dedicated Issue . Estuaries 17(4):729-911 .
Black, P.G. 1983 . Ocean temperature changes induced by tropical cyclones . Ph.D . dissertation, Penn State College, 278 pp.
Black, P.G., R.L . Elsberry, L.K. Shay, R.P . Partridge, and J.D . Hawkins. 1988 . Atmospheric boundary layer and oceanic mixed layer observations in hurricane Josephine obtained from air-deployed drifting buoys and research aircraft . J . Atmos. Oceanic Technol . 5 :683-698 .
Brink, K.H., 1989 . Observations of the response of thermocline currents to a hurricane . J. Phys . Oceanogr . 19:1017-1022 .
Brooks, D.A., 1983 . The wake of hurricane Allen in the Western Gulf of Mexico. J . Phys. Oceanogr . 13:117-129 .
Chuang, W.S., W. Schroeder, and W. J. Wiseman, Jr . 1982 . Summer Current Observations off the Alabama Coast . Contributions in Marine Science 25 :121-131 .
Cornillon, P., L. Stramma, and J. F. Price. 1987 . Satellite Measurement of Sea Surface Cooling during Hurricane Gloria . Nature 326(611) :373-375 .
Fedorov, K.N., A.A. Varfolomeev, A.I . Ginzburg, A.G. Zatsepin, A. Yu. Krasnopevtsev, A.G. Ostrovsky, and V.E . Skylarov . 1979 . Thermal reaction of the ocean on the passage of hurricane Ella . Okeanologiya 19:992-1,001 .
Gilbes, F., C. Tomas, J . J . Walsh, and F. E . Muller-Karger . 1996. An episodic chlorophyll plume on the west Florida shelf. Continental Shelf Research 16(9) :1,201-1,224.
Gordon, H.R ., and M. Wang. 1994 . Retrieval of water-leaving radiance and aerosol optical thickness over the oceans with SeaWiFS : A preliminary algorithm . Appl . Optics . 33:443-452 .
Hellerman, S ., and M. Rosenstein . 1983. Normal monthly wind over the world ocean with error estimates . J. Physical Oceanography 13 :1,093-1,104 .
Hooker, S.B., W.E. Esaias, G.C. Feldman, W.W. Gregg, and C.R . McClain. 1992 . An overview of SeaWiFS and ocean color. NASA Technical Memo. NASA Goddard Space Flight Center 104566(1), 24 pp.
Jordan, C.L . 1964 . On the influence of tropical cyclones on the sea surface temperature. Proc . Symp . Tropical Meteoro. Wellington, New Zealand, pp. 614-622.
39
Justic, D., N.N. Rabalais, R.E . Turner and W.J . Wiseman, Jr . 1993 . Seasonal coupling between riverborne nutrients, net productivity and hypoxia. Marine Pollution Bulletin 26(4) :184-189 .
Leben, B . 1998 . Gulf of Mexico Near Real-Time Altimeter Data Viewer. http ://www-ccar.Colorado.edu/chi-realtime/gam-real-timessh/ .
Leipper, D.F . 1967. Observed ocean conditions and hurricane Hilda. J. Atmos. Sci . 24: 182-196.
McClain, E.P ., W.G. Pichel, C.C . Walton, Z. Ahmad, and J. Sutton . 1983 . Multi-channel improvements to satellite-derived global sea-surface temperatures, Adv. Space Res. 2(6):43-47 .
McClain, E.P ., W.G. Pichel, and C.C . Walton . 1985 . Comparative performance of (AVHRR) based multichannel sea surface temperatures, J. Geophys. Res . 90:11,587-11,601 .
McClain, C.R., M.L. Cleave, G.C . Feldman, W.W . Gregg, and S.B . Hooker, 1998 . Science quality SeaWiFS data for global biosphere research . Sea Technology 39 (9) :10-16 .
Morel, A., and L. Prieur . 1977 . Analysis of variations in ocean color . Limnol . Oceanogr . 22:709-722 .
Miiller-Karger, F.E ., J.J . Walsh, R.H. Evans, and M.B . Meyers. 1991 . On the Seasonal Phytoplankton Concentration and Sea Surface Temperature Cycles of the Gulf of Mexico as Determined by Satellites . Journal of Geophysical Research 96(C7): 12,645-12,665.
Muller-Karger, F.E., F . Vukovich, R. Leben, B. Nababan, and D. Myhre. 1998 . Northeastern Gulf of Mexico Physical Oceanography Program: Eddy monitoring and remote sensing . Technical Report of the U.S . Department of the Interior, Minerals Management Service, Gulf of Mexico OCS Region . OCS Study MMS 98-0051 . 41 pp.
Muller-Karger, F.E . 1993 . River discharge variability including satellite-observed plume-dispersal patterns . In : Climate Change in the Intra-Americas Sea. George Maul (editor) . United Nations Environmental Programme (Wider Caribbean Region) and Intergovernmental Oceanographic Commissions (Caribbean and Adjacent Regions) . Edward Arnold Publishers. Chapter 8. pp. 162-192 .
Nelson, N.B . 1996 . The wake of hurricane Felix . Int. J. Remote Sensing 17(15):2,893-2,895 .
40
Nowlin, W.D., A.E . Jochens, M.K. Howard, S .F . DiMarco, and W.W. Schroeder. 1999 . Hydrographic properties and inferred circulation over the northeastern shelves of the Gulf of Mexico during spring and mid-summer of 1998 .
O'Reilly, J .E ., S. Maritorena, B.G. Mithchell, D.A. Siegel, K.L . Carder, S.A. Garver, M. Kahru, and C.R . McClain, 1998. Ocean color chlorophyll algorithms for SeaWiFS. JGR 103(C11):24,937-24,953 .
Paluszkievicz, T., L. Atkinson, E.S . Parmentier, and C.R . McClain. 1983 . Observations of a Loop Current frontal eddy intrusion onto the West Florida shelf. J . Geophysical Research 88:9639-9651 .
Price, J .F . 1981 . Upper ocean response to a hurricane . J . Phys . Oceanogr . 11 :153-175 .
Pudov, V.D ., A.A . Varfolomeev, and K.N. Fedorov. 1979 . Vertical structure of the wake of a typhoon in the upper ocean. Okeanologiya 21 :142-146 .
Rabalais, N .N., R.E. Turner, D . Justic, Q. Dortch, W .J . Wiseman, Jr., and B .K. Sen Gupta. 1996 . Nutrient changes in the Mississippi River and system responses on the adjacent continental shelf . Estuaries 19:286-407.
Schroeder, W ., S .P . Dinnell, W.J . Wiseman, Jr., and W.J . Merrell . 1987. Circulation patterns inferred from the movement of detached buoys in the eastern Gulf of Mexico. Continental Shelf Research 7(8) :883-894 .
Shay, L.K., P.G . Black, A.J . Mariano, J.D . Hawkins, and R.L. Elsberry . 1992 . Upper ocean response to hurricane Gilbert . JGR 97(12) :20,227-20,248 .
Smith, N. P. 1982 . Response of Florida Atlantic Shelf Waters to hurricane David. JGR. 87(C3):2,007-2,016 .
Sturges, W. and B . Leben. (in press) . Frequency of Ring Separation of the Loop Current in the Gulf of Mexico. JPO.
Strong, A.E . and E.P . McClain. 1984 . Improved ocean surface temperatures from space, Comparisons with drifting buoys, Bull . Am . Meteor. Soc . 65(2) :138-142 .
Turner, R.E. and R.L. Allen. 1982 . Bottom water oxygen concentrations in the Mississippi River Delta Bight. Contributions in Marine Science 25 :161-172 .
Turner, R.E ., and N.N. Rabalais . 1991 . Changes in Mississippi River water quality this century: implications for coastal food webs . BioScience 41 :140-147 .
41
Valiela, I., P. Peckol, C. D'Avanco, J . Kremer, D. Hersh, K. Foreman, K. Lajtha, B . Seely, W.R . Geyer, T. Isaji, and R. Crawford . 1998. Ecological effects of major storms on coastal watersheds and coastal waters : Hurricane Bob on Cape Cod. Journal of Coastal Research 14(1):218-238 .
Vukovich, F.M., B.W. Crissman, M. Bushnell, and W.J . King . 1979 . Some aspects of the oceanography of the Gulf of Mexico via satellite and in situ data . Journal of Geophysical Research 84 :7749-7768 .
Walsh, J.J . 1988 . On the nature of continental shelves . Academic Press, San Diego. pp . 1-520.
Walton, C.C . 1988. Nonlinear multichannel algorithms for estimating sea surface temperature with AVHRR satellite data, Journal of Applied Meteorology 27 :115-127 .
Wick, G.A., W.J . Emery, and P . Schluessel. 1992 . A comprehensive comparison between satellite-measured skin and multichannel sea surface temperature . Journal of Geophysical Research 97(C4):5,569-5,595 .
Withee, G.W. and A. Johnson. 1976. Data report : buoy observations during Hurricane Eloise (September 19 to October 11, 1975). U.S . Dept . of Commerce, NOAA, NSTL Station, MS . 21 pp.
Wright, R. 1969. Temperature structure across the Kuroshio before and after typhoon Shirley. Tellus 21 :409-413 .
42

QPQ~~,ENT OpTy~' The Department of the Interior Mission
o`' 4 .i yp As the Nation's principal conservation agency, the Department of the Interior has responsibility for most of our nationally owned public lands and natural resources. This includes fostering sound use of our land and water resources; protecting our fish, wildlife, and biological diversity ; preserving the
_ p9 environmental and cultural values of our national parks and historical places ; and providing for the '9RCH 9 ~0 enjoyment of life through outdoor recreation . The Department assesses our energy and mineral
resources and works to ensure that their development is in the best interests of all our people by encouraging stewardship and citizen participation in their care . The Department also has a major responsibility for American Indian reservation communities and for people who live in island territories under U.S . administration .
o, The Minerals Management Service Mission
As a bureau of the Department of the Interior, the Minerals Management Service's (MMS) primary responsibilities are to manage the mineral resources located on the Nation's Outer Continental Shelf
~ ~ (OCS), collect revenue from the Federal OCS and onshore Federal and Indian lands, and distribute
`Aq _- ~ 7< ~gV
those revenues . ~ ~7nAGeM~t Moreover, in working to meet its responsibilities, the Offshore Minerals Management Program
administers the OCS competitive leasing program and oversees the safe and environmentally sound exploration and production of our Nation's offshore natural gas, oil and other mineral resources. The MMS Royalty Management Program meets its responsibilities by ensuring the efficient, timely and accurate collection and disbursement of revenue from mineral leasing and production due to Indian tribes and allottees, States and the U.S . Treasury .
The MMS strives to fulfill its responsibilities through the general guiding principles of : (1) being responsive to the public's concerns and interests by maintaining a dialogue with all potentially affected parties and (2) carrying out its programs with an emphasis on working to enhance the quality of life for all Americans by lending MMS assistance and expertise to economic development and environmental protection .