Embed Size (px)
Citation preview

REMOTE SENSING ON GANODERMA DISEASE
Nisfariza Mohd Noor Maris Senior Lecturer
Department of Geography, University of Malaya KUALA LUMPUR, MALAYSIA

Outline
� Introduc.on � Ganoderma BSR
• Pathological symptom • Detec.on of Ganoderma BSR
� Sensor for Disease Detec.on � Remote Sensing Proper.es of Plant � Remote Sensing Research on Ganoderma Disease in MPOB
� GER1500 Spectroradiometer • Data & Analysis
� AISA Hyperspectral � Data & Analysis
� Unmanned Aerial Vehicle Data & Analysis
� Integra.on of GIS and Remote Sensing
� Future Developments � Conclusion and Recommenda.on
2
Introduction • Oil palm (Elaeis guineensis Jacq.) the most important agriculture sector in Malaysia
• Damage and loss due to pests and diseases : serious problems and can reduce the profitability of the business; jeopardise the growth of the industry over Dme.
• Three major oil palm threats for the crop losses can be classified into insects, vertebrates and diseases.
3

… Cont
• Monitoring agricultural areas : Dme and labour consuming – dealing with large area of homogenous crop.
• Disease and pest detecDon and control are important phases in agricultural management.
• Cultural pracDces combined with biological and chemical control have been considered as the best approach for controlling diseases and pests.
• Remote sensing provides a possible soluDon to the intensive sampling required for site-‐specific pest management.
4

Ganoderma BSR
• Fatal disease – most serious disease of oil palm in Malaysia for over 80; severe economic loss in Malaysia.
• The soil-‐borne fungi aNack from the roots and progressively spread to the stem and bole system.
• Prevents water and nutrient uptake : foliar symptoms and gradually affects the growth and yield, eventually leading to the death of the palm 5

Detection of Ganoderma BSR
§ Visual interpretaDon -‐ middle or late stages of disease pathology commonly Dme-‐consuming, destrucDve and expensive.
§ Aerial detecDon – enable treatment at the early stage of the infecDon and avoid more extensive damage and losses.
§ Wet lab detecDon -‐ subclinical symptom of Ganoderma GSM test, PCR-‐DNA molecular, ELISA-‐polyclonal anDbody and GanoScan1 tomography.
6

Pathological Symptom
§ The visible symptom of is seen at later stage: infesta.on of the pathogen has damaged the stem and bole of the oil palm.
§ Four Ganoderma species to be associated with oil palm in Malaysia: G. boninense, G. zonatum, G. miniatocinctum and G. tornatum but G. boninense is the most aggressive (Idris, 1999).
7
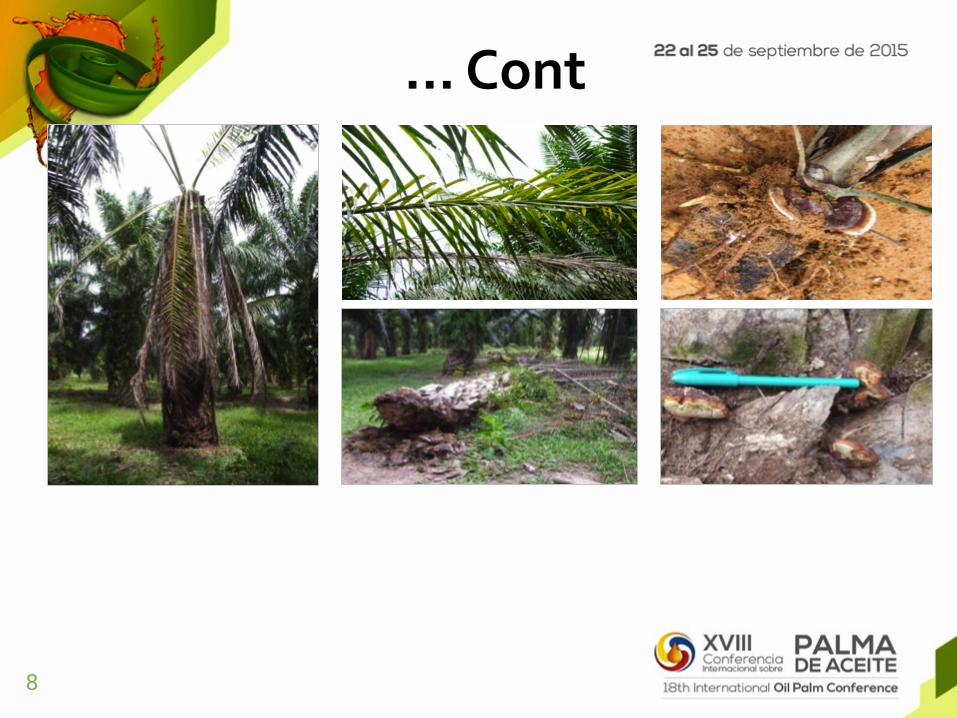
... Cont
8

Sensors for disease and stress detec.on in plants
Molecular methods
Bio-‐chemical analysis
Biomarker-‐based sensor
Remote Sensing
Remote Sensing
Visible-‐near
infrared spectrosc
opy
Fluorescence
spectroscopy
Mid infrared spectrosc
opy
Fluorescence
imaging
Hyperspectral
imaging RADAR
Mul.spectral
Imaging Others
Spectroscopic Techniques Imaging Techniques
Modified from Reza Ehsani (2010) 9
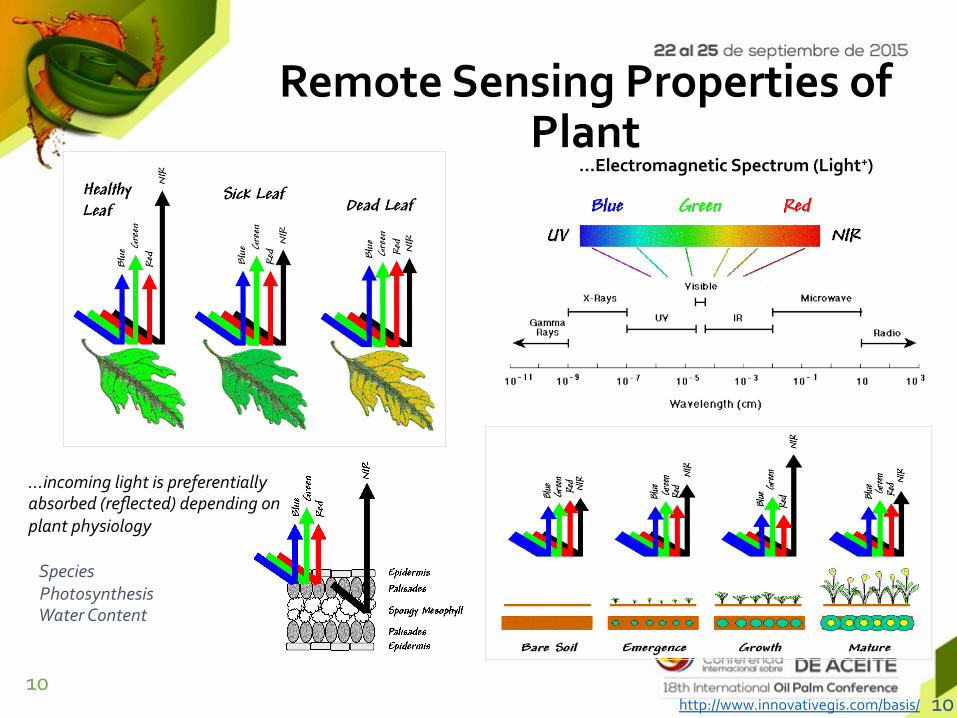
…Electromagnetic Spectrum (Light+)
…incoming light is preferentially absorbed (reflected) depending on plant physiology Species Photosynthesis Water Content
http://www.innovativegis.com/basis/
Remote Sensing Properties of Plant
10 10

• Elowitz (2013) @ h8p://www.markelowitz.com/Hyperspectral.html
11

Biochemical Response of Leaf
12
• Philpot, 2011

Remote Sensing Research on Ganoderma in MPOB
Spectroradiometer (GER1500)
Hyperspectral (AISA DUAL)
Multispectral (UAV Swinglet)
RADAR
13

Hyperspectral Approach Spectroradiometry
Nursery (seedlings)
10 months old
24 months old
Planta.on
5 years old young palm
17 years old mature palms
Hyperspectral Imaging
Planta.on
5 years old young palm
17 years old mature palms

Visual Classification @ Nursery trials
Severity Classifica.on Visual Assessments
T1 Seedlings not inoculated and not infected with Ganoderma boninense, seedling is healthy.
Leaves and tree looking healthy. Absence of white mycelium or fruiDng body (Ganoderma) at stem base.
T2
Seedlings inoculated and infected w i t h Ganode rma bon i nen se , WITHOUT foliar symptoms but with white mycelium or fruiDng body at stem base.
Leaves and tree looking healthy without any foliar symptom of BSR disease. Presence of white mycelium or fruiDng body (Ganoderma) at stem base.
T3
Seedlings inoculated and infected with Ganoderma boninense, WITH foliar symptoms and with white mycelium or fruiDng body at stem base.
Yellowing, browning or drying of some leaves due to Ganoderma infecDon. One or two new leaves remain as unopened spears. Decline of older leaves. Presence of white mycelium or fruiDng body (Ganoderma) at stem base.
15

Visual classification @ Nursery Trials
T1 T2 T3

Visual Classification @ Plantation plots
Severity Classifica.on Visual Assessments
T1 Healthy palm. Leaves and tree looking healthy. Absence of white mycelium or fruiDng body (Ganoderma) at base stem
T2
Palm infected with Ganoderma spp. w/o any foliar symptoms but w white mycelium or fruiDng body at base stem.
Leaves and tree looking healthy. Presence of white mycelium or fruiDng body (Ganoderma) at base stem
T3
Palm infected with Ganoderma spp. with foliar symptoms and white mycelium or fruiDng body at base stem.
Yellowing or drying of some leaves. One or two new leaves remain as unopened spears. DeclinaDon of older leaves. Presence of white mycelium or fruiDng body (Ganoderma) at base stem. 17

Visual Classification @ Plantation Plots
Visual appearance of severity classes in oil palm plantation for Ganoderma BSR study.
T1 T2 T3
18
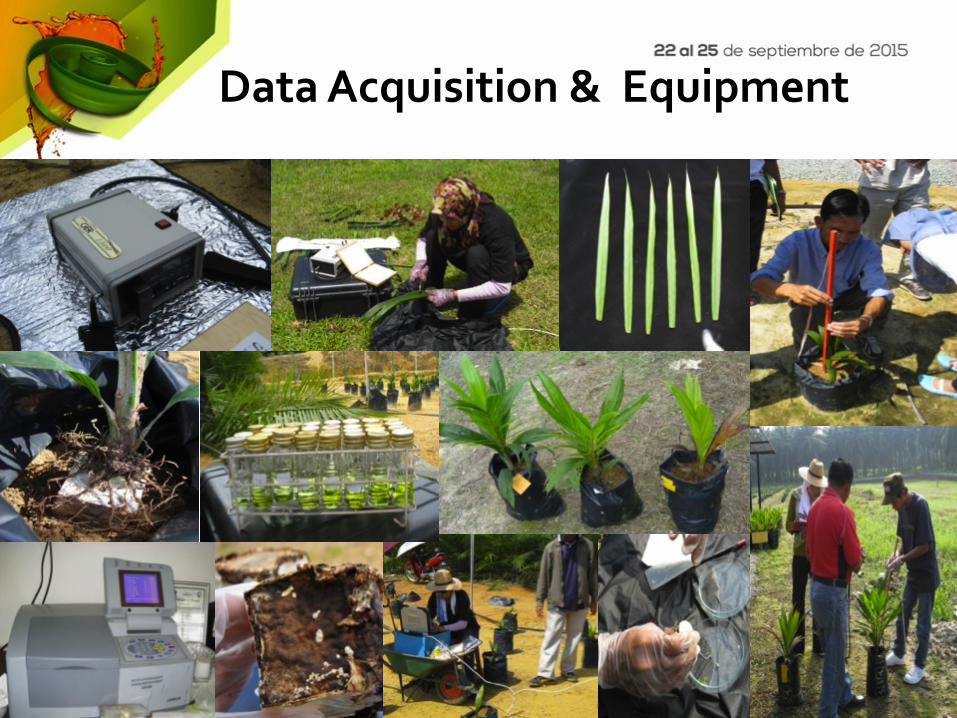
Data Acquisition & Equipment

GER1500 Handheld Spectroradiometer
§ Baseline study of possibility the use of remote sensing in detecting Ganoderma BSR.
§ Massive ground works. § Wavelength 400nm to 1050nm. § 1.5 nm intervals § 512 bands
20

Spectroradiometer Data
• Spectral data processing:
Denoising – 5pt smoothing
Original Reflectance
First Derivative
Stats – Denoise spectra
Stats – 1st Derivative
Stats -‐ Original Ref
Compare Statistically
21

Raw Reflectance Data
T1 – Inoculated looking healthy, no foliar,
mycelium or fruiting body
T2 – Inoculated no foliar symptom but with white
mycelium or fruiting body at base stem
T3 – Inoculated with foliar symptom and white
mycelium or fruiting body at base stem
22

First Derivative Analysis
T1 – Inoculated looking healthy, no foliar,
mycelium or fruiting body SFS = 9%
T2 – Inoculated no foliar symptom but with white
mycelium or fruiting body at base stem SFS = 14%
T3 – Inoculated with foliar symptom and white mycelium or fruiting body at base
stem SFS=49%
EXPERIMENT 1 23

Red Edge Position Analysis
� The inflection point on the slope between the red absorption and near infrared reflectance -‐ used to correlate chlorophyll content with reflectance. Decreasing chlorophyll causes the red edge position to shift towards shorter wavelengths.
� Shifts in the wavelength position of the red edge and the intensity of the peak slope have been related to stress factors in vegetation such as chlorophyll decline and senescence. The red edge feature is therefore an early indicator of disease symptoms in leaves.
24
24

AISA Dual Hyperspectral System
§ A scale up study from ground to aerial data. § Wavelength 400nm to 2500 nm § 5nm interval § 244 bands § 0.68m resolution § Specim, Finland.
25

Data Acquisition and Equipment
26
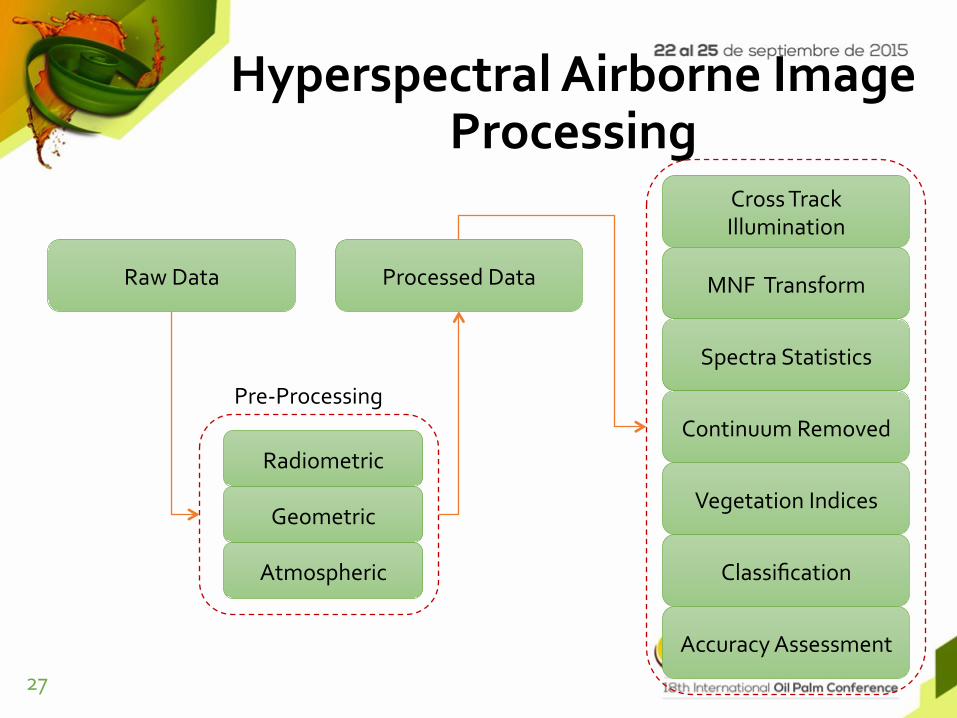
Hyperspectral Airborne Image Processing
Raw Data
Classification
Cross Track Illumination
Processed Data
Radiometric
Spectra Statistics
Continuum Removed
Atmospheric
Geometric
MNF Transform
Vegetation Indices
Accuracy Assessment
Pre-‐Processing
27

Study Area – Planted Palm / Airborne
Mature palm 17 years old
Young palm 5 years old
¡ Oil palm plantation in Seberang Perak, Perak, Malaysia (4° 6’ N 100° 53’ E).
¡ Data acquired October, 2010
28

AISA Hyperspectral Image 29
29

The hyperspectral image acquired 20 October 2008, effect of fluctuations in solar illumination during flight. [Unfavourable weather in October, the month for monsoon transition period in the country].
30

Best Band Selection • Significant bands to discriminate palms infected with Ganoderma BSR, it shows that early detection is possible using derivative spectral distinction.
• Wavelengths bands suitable for discriminating different levels of Ganoderma; the original reflectance spectra and first derivative spectra to obtain the best wavelengths in discriminating the disease.
• The results showed that for Ganoderma , the discriminating bands for mature and immature oil palms were found in ranges of 515 – 586 nm, 615 – 622 nm, 633 – 644 nm, 690 – 708 nm, 727 – 758 nm and 773 – 784 nm respectively.
31

Hyperspectral Vegetation Indices
§ Vegetation Indices – indicate the physiological and pathological parameters of vegetation – interpret the status of vigour of the plants.
§ It is not always possible to detect disease or other stresses in crops from reflectance values. A disease may be difficult to detect at an early stage, e.g. fungi that attack the roots of plants or the base of their stem, but do not at first cause any reaction in the plants itself.
§ Several indices was tested: the Normalised Difference Vegetation Index (NDVI), Modified Chlorophyll Absorption Ratio Index (MCARI), Structural Independent Pigment Index (SIPI), Optimised Soil Vegetation Index (OSAVI) and Transformed Chlorophyll Absorption in Reflectance Index (TCARI).
32

Normalised Difference Vegetation Index (NDVI)
Brighter -‐ Healthier 33

… Cont
Classified / reconciliation based on the index value of NDVI
NDVI Values Non Vege / Bare Soil : 0 – 0.7 (Red) T1 : 0.85 – 0.9 (Green) T2: 0.85 – 0.8 (Yellow) T3: 0.7 – 0.8 (Blue)
34
34
Unmanned Aerial Vehicle (UAV)
§ UAV has become commercially available nowadays – have the advantages of high spatial and temporal resolution characteristics compared to airborne and satellite platforms.
§ § The advancement of remote sensing technology in providing a synoptic view – provides possibility to monitor a large plantation state of vigorousness and stress due to disease, pest and nutrient deficiency.
§ UAV promotes the remote sensing technology in detection and monitoring of existing plot infected with Ganoderma BSR.
35

Unmanned Aerial Vehicle
§ Same visual detection concept is applied to the RGB image; since it corresponds to the optical concept of a human’s eye.
§ The use of NIR cameras in the UAV is additional whereby it implies the high reflectance of vegetation in the NIR region invisible to the human eye to demonstrate the health of the plant.
§ The RGB and NIR images are coupled with GIS analysis to achieve the aim to monitor Ganoderma BSR in oil palm plantation.
36

Data Acquisition and Equipment
37

Flight Planning
38
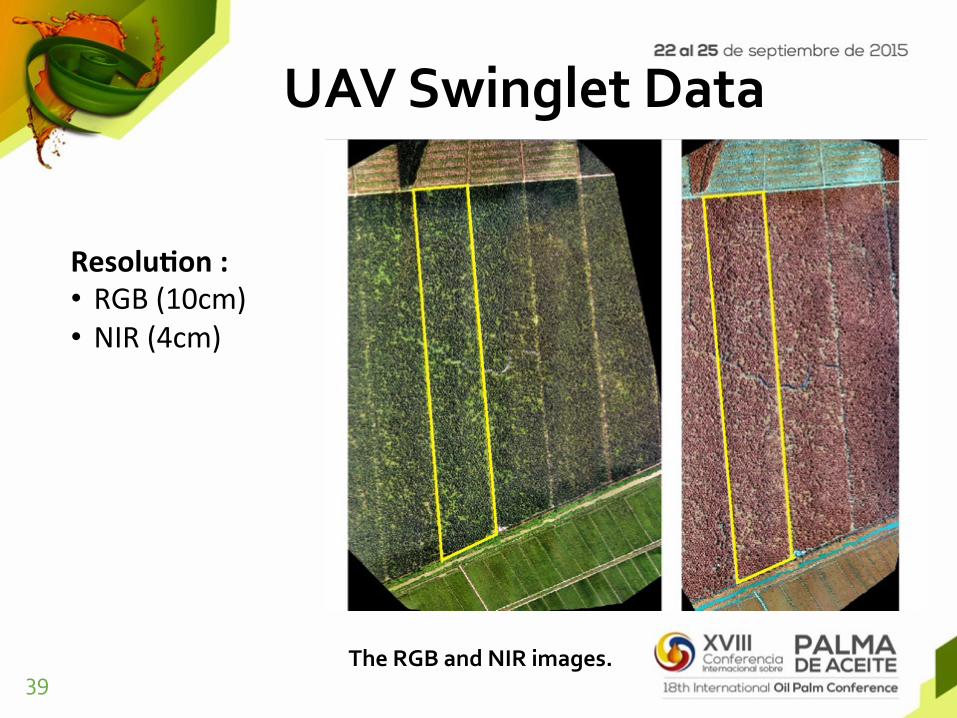
UAV Swinglet Data
The RGB and NIR images. 39
Resolu.on : • RGB (10cm) • NIR (4cm)

Integration of GIS and Remote Sensing
40

GIS Spatial -‐ Temporal Analysis
• To incorporate all data collected by remote sensing with the census to develop a time series of disease spread over time. Multi sensor and multi temporal.
41

What is next? • Ganoderma Workshop 2014 (MPOB and Malaysian Oil Palm Stakeholders) :
• Early detecDon tools – more sensiDve, precise and localize
• Standardize the methods and classificaDon – visualize • υFaster, cheaper and precise remote sensing and GIS • Aerial detecDon – need esDmaDon for the staDsDcal analysis using hyperspectral remote sensing.
• Estate experience 1 UAV for 500 ha per day, depend on certain limitaDon

Future Developments • Develop specific vegetation index for Ganoderma based on significant bands.
• Modeling on the relationship of Ganoderma disease with factors such as soil type, moisture content, nutrient.
• Index mapping of Ganoderma disease for areal based identification for management and planning purposes.
• New UAV hyperspectral system – using band selection.
• GIS mapping, hotspots and prediction of disease dispersion.
• RADAR (Radio Detection and Ranging) fusion with hyperspectral imagery.
43

Conclusion and Recommendation
§ Identification based on percentage over total area and assessment of the disease symptoms
§ Early detection of the disease is vital for profitable agriculture business.
§ Plantation management: early identification ameliorate on plan and strategy to overcome the problem in a cost effective manner.
§ Expands the Ganoderma BSR detection survey options available to plantation managers and a viable data source for detecting and monitoring damage due to pest and disease in oil palm plantation.
§ Cheaper technology for detection
44

Acknowledgement
• This research is funded by: • Innovative Technology Research Cluster (ITRC), University of Malaya http://itrc.um.edu.my
• Ganoderma and Disease Research of Oil Palm Unit (GANODROP) – Malaysian Palm Oil Board, MPOB
• Many thanks to : • Department of Geography, University of Malaya
45

Thank You
Muchas Gracias