Embed Size (px)
Citation preview

REMOVAL OF CATIONIC DYES AND HEAVY
METALS FROM WATER USING LOW COST
ADSORBENTS
Final Report of the Minor Research Project
[MRP (S)/13-14/KLMG031/UGC-SWRO dated 15-2-14]
Submitted to
UNIVERSITY GRANTS COMMISSION
South Western Regional Office
Bangalore-560 009
By
Dr. SUMA BINO THOMAS
Associate Professor
P. G. DEPARTMENT OF CHEMISTRY
BASELIUS COLLEGE, KOTTAYAM
(Affiliated to Mahatma Gandhi University, Kottayam, Kerala)
MARCH 2016

CERTIFICATE
I hereby declare that, the Minor Research Project entitled “Removal of Cationic
Dyes and Heavy metals from water using low cost adsorbents” (MRP (S)/13-
14/KLMG031/UGC-SWRO dated 15-2-14) is a bonafide work carried out by Dr. Suma
Bino Thomas, Associate professor, Department of Chemistry, Baselius College,
Kottayam. Further certify that the work presented in the report is original and carried
out according to the plan in the proposal and guidelines of the XII Plan of University
Grants Commission.
Principal
Baselius College
Kottayam Countersigned by
Director,
College Development Council,
Mahatma Gandhi University,
Kottayam, Kerala.

DECLARATION
I, Dr. Suma Bino Thomas hereby declare that the project work entitled “A study
on experiences perceptions of capital market investors on financial derivatives” has
been prepared by me and also declare that this is a bonafide record of research work
done by me during the course of minor research project allotted to me by the University
Grant Commission, New Delhi and no part of this study has been submitted earlier or
elsewhere for any similar purpose.
Kottayam
Date: 24/05/2016 Dr. Suma Bino Thomas
(Principal Investigator)

ACKNOWLEDGEMENT
I thank the Almighty, the father of all, whose blessings have enabled me to
complete my project work successfully. I take this opportunity to express my
gratitude to University Grants Commission, for providing me financial assistance,
in the form of Minor Research Project to complete the present work successfully.
I am grateful to Prof. Jacob Kurian Onattu (Former Principal) and Prof.
Alexander V George, Principal, Baselius College, Kottayam, Dr. Annie Mathews,
Former HOD, Dept. of Chemistry and my colleagues for their encouragement and
help for completing my work.
I express my heartfelt gratitude to the Management for providing the
necessary facilities to carry out this project. I am also grateful to office staff and
no-teaching staff of Chemistry department for their help and support.
I express my sincere gratitude to the staff of SCS & SPAP Mahatma Gandhi
University, STIC, CUSAT for helping me with the analytical part.
I express my sincere thanks to my M.Sc students, Sanitha Sara Kurian, Anu
Ramakrishnan, Aiswarya, Harsha, Tintu, Anu K R, Jyothish Jacob, Bijimol,
Athira and Silpamol for assisting and helping me to complete this work.
Suma Bino Thomas

CONTENTS
Page No.
Chapter 1. Introduction 1
Chapter II. Review of Literature 6
Chapter III. Experimental 32
Chapter IV. Result and Discussion
4.1. Potato peel as low cost adsorbent 34
4.2. Pomegranate Peel as Low cost adsorbent 43
4.3. Egg Shell as Low Cost Adsorbent 49
4.4. Passion Fruit Peel as Low Cost Adsorbent 54
4.5. Used Black Tea as Low Cost Adsorbent 63
4.6. Saw Dust as Low Cost Adsorbent 71
4.7. Mango Leaf as Low Cost Adsorbent 80
4.8. Rice Husk as a Low Cost Adsorbent 88
4.9. Ground Nut Shell as Low Cost Adsorbent 97
4.10. Tamarind Shell as Low Cost Adsorbent 106
Chapter V. Conclusion 115
REFERENCES

Chapter I
INTRODUCTION

1
Chapter I
INTRODUCTION
Environmental pollution due to industrial effluents is of major concern because
of their toxicity and threat for human life and the environment. The discharge
of textile effluents to the water bodies has raised much concern because of potential
health hazards associated with the entry of toxic components into the food chains of
humans and animals. Synthetic dyes are extensively used for dyeing and printing in a
variety of industries. Over 10, 000 dyes with an annual production over 7x10⁵ metric
tons worldwide are commercially available and 5-10% of the dye stuff is lost in the
industrial effluents.
Many industries, especially plating facilities and electronic manufacturing often
lead to heavy metals containing in the effluent of waste water which is a serious
environmental problems. All heavy metals are toxic and non-biodegradable and should
be separated from waste water.
Synthetic dyes usually have a complex aromatic molecular structure such as
benzene, naphthalene, anthracene, toluene, xylene, etc. The complex aromatic
molecular structures of dyes make them more stable and difficult to biodegrade. Most
of these dye wastes are toxic and may be carcinogenic. Many of these organic dyes are
hazardous and may affect the aquatic life and even the food chain. Among the chemical
classes of dyes, azo dyes are more versatile and account to more than half of the annual
dye production. And also, azo dyes are considered more carcinogenic to humans.
Heavy metal contamination exists in aqueous waste streams of many industries
such as metal purification, metal finishing, chemical manufacturing, mining operations,
smelting, battery manufacturing, and electroplating. As a result of industrial activities
and technological development, the amount of heavy metal ions discharged into streams
and rivers by industrial and municipal wastewater have been increasing incessantly.
Heavy metals are member of a loosely-defined subset of elements that exhibit metallic
properties, which mainly includes the transition metals, some metalloids, lanthanides,
and actinides.
Certain heavy metals such as iron, copper, zinc and manganese are required
by humans for normal biological functioning. However, heavy metals such as mercury,

2
lead, cadmium are toxic to organisms. Most of the health disorders are linked with
specific tendency of heavy metals to bio accumulate in living tissues and their disruptive
integration into normal biochemical processes. Increased use of metals and chemicals
in process industries has resulted in generation of large quantities of effluent that
contains high level of toxic heavy metals and their presence poses environmental-
disposal problems due to their non-degradable 2005).
Most heavy metals are cations, carrying a positive charge, such as zinc and
cadmium. Soil particles tend to have a variety of charged sites on their surfaces, some
positive while some negative. The negative charges of these soil particles tend to attract
and bind the positively charged metal cations, preventing them from becoming soluble
and dissolve in water. The soluble form of metals is more dangerous because it is easily
transported, hence more readily available to plants and animals. Metal behavior in the
aquatic environment is surprisingly similar to that outside a water body. Sediments at
the bed of streams, lakes and rivers exhibit the same binding characteristics as soil
particles mentioned earlier. Hence, many heavy metals tend to be sequestered at the
bottom of water bodies. Yet, some of these heavy metals will dissolve. The aquatic
environment is more susceptible to the harmful effects of heavy metal pollution. Metal
ions in the environment bio accumulate and are biomagnified along the food chain.
There, their toxic effect is more pronounced in animals at higher trophic levels.
Methods that are generally used such as chemical separation, filtration,
membrane separation, electrochemical treatment ion exchange and exchange and
adsorption. All these methods with the exception of adsorption are costly, have low
output and are costly, have low output and are incapable of removing trace level of
heavy metals from waste water. Adsorption has been shown to be a feasible alternative
method for removing heavy metals from waste water.
Therefore there is a need to remove dyes and heavy metals before effluent is
discharged into receiving water bodies. The most popular treatment methods for textile
wastewater are combinations of biological treatment, chemical coagulation and
activated carbon adsorption.
Cost is an important parameter for comparing the absorbent materials. Activated
carbon has been recognized as a highly effective adsorbent for the treatment of heavy metals
3
in wastewater, but is readily soluble under extreme pH conditions. Activated carbon is most
widely used adsorbent, as it has good capacity for adsorption of carcinogenic metals. However,
high cost of activated carbon and 10-15% loss during the regeneration has deterrents in the
utilization of activated carbon in the developing countries.
The cleaning of waste and waste water is one of most serious environmental
problems of the present day. Discharge of dyeing industry wastewater into natural water
bodies is not desirable as the colour prevents reoxygenation in receiving waters by
cutting off penetration of sunlight. Dyes and pigments have been used in many
industries for colouration purpose. Textile industry is one of the prominent polluters
releasing high concentrated effluent into the surrounding environment. Dyes contain
carcinogenic materials. Therefore, it is important to remove these pollutants. The
removal of coloured and colourless organic pollutants is considered as an important
application of adsorption processes.
There are a whole range of physical/chemical methods which have been
effectively employed for colour removal, namely adsorption, membrane filtration,
chemical oxidation, dissolved air floatation, coagulation/precipitation and
electrochemical methods. Adsorption is the most effective and non-destructive
technique that is widely used for the removal of dyes from aqueous solutions.
Adsorption has been found to be superior to other techniques for water re-use in terms
of initial cost, simplicity of design, use of operation and insensitivity to toxic substances.
Adsorption has been used extensively in industrial process for separation and
purification. The removal of coloured and colourless organic pollutants from industrial
wastewater is considered as an important application of adsorption processes.
At present, there is a growing interest in using low cost, commercially available
materials for the adsorption of dyes. A wide variety of materials such as potato peel,
peat, various silicas, activated clay, banana pith, natural manganese mineral, shale oil
ash, goat hair, alum sludge, natural zeolite, and mixtures of fly ash and soil have been
investigated as low-cost alternatives to activated carbon. Many studies have been
conducted to evaluate adsorption of dyes onto a wide range of natural and synthetic,
organic and inorganic sorbents.

4
Adsorption techniques in colour removal
Adsorption has evolved into one of the most effective and feasible physical
method for decolourisation of textile and dyeing wastewaters. The three different modes
of contacting the adsorbent and waste water are as follows:
1) Batch contact
2) Fixed-bed contact and
3) Fluidized bed contact
Batch contact systems are highly effective on a smaller scale of operation, while the
fixed-bed contact systems have the advantage of a constant dye concentration in contact
with the adsorbent at all times. Though the fluidised-bed systems have high rate of mass
transfer, the operating conditions are highly critical in terms of flow rates and loading
volumes and hence call for careful control.
The various factors that influence the rate of adsorption in any system are as follows:
1) Dye concentration
2) Adsorbent particle size
3) Extent of agitation
4) Temperature
5) Adsorbent/solution ratio
6) pH of the solution and
7) equilibrium capacity of the adsorbent.
The most commonly used adsorbent for colour removal is activated carbon. Since
activated carbon is relatively expensive, the emphasis has shifted towards low-cost
adsorbents that can serve as viable alternative for activated carbon. The high cost of
activated carbon, calls for regeneration for prolonged use, which again adds to the cost
of the treatment process. The advantage of using low cost adsorbent is that, they can be
used in a treatment process and then disposed off, without any associated costs of
regeneration.
Objectives of the study:
The objectives of the study were as follows:

5
1. To evaluate the feasibility of using potato peel, pomegranate peel, egg shell,
passion fruit peel, used black tea, sawdust, dried mango leaf, rice husk, ground
nut shell and tamarind shell as low cost adsorbents.
2. To compare the adsorption of different dyes, namely methylene blue, malachite
green, Eosin Yellow, Congo red and Crystal violet.
3. To compare the adsorption of different heavy metals namely Co, Cr, Ni & Cu
4. To study the effect of contact time, adsorbent dosage, temperature and
concentration
5. To examine the applicability of Freundlich and Langmuir adsorption isotherms.
6. To examine the kinetic model of adsorption.

6
Chapter II
REVIEW OF LITERATURE
Many industries, such as dyestuffs, textile, paper and plastics, use dyes in order
to colour their products and also consume substantial volumes of water. As a result, they
generate a considerable amount of coloured wastewater. It is recognized that public
perception of water quality is greatly influenced by the colour. Colour is the first
contaminant to be recognized in wastewater. The presence of very small amounts of
dyes in water (less than 1 ppm for some dyes) is highly visible and undesirable. Over
100,000 commercially available dyes exist and more than 7 · 105 tonnes per year are
produced annually. Due to their good solubility, synthetic dyes are common water
pollutants and they may frequently be found in trace quantities in industrial wastewater.
Due to increasingly stringent restrictions on the organic content of industrial
effluents, it is necessary to eliminate dyes from wastewater before it is discharged. Many
of these dyes are also toxic and even carcinogenic and this poses a serious hazard to
aquatic living organisms however, wastewater containing dyes is very difficult to treat,
since the dyes are recalcitrant organic molecules, resistant to aerobic digestion, and are
stable to light, heat and oxidizing agents.
Removal of heavy metals such as cadmium, lead, nickel, chromium and copper
from aqueous solution is necessary because of the frequent appearance of these metals
in waste streams from many industries, including electroplating, metal finishing,
metallurgical, tannery, chemical manufacturing, mining and battery manufacturing.
These problems has received considerable attention in recent years, primarily due to the
concern that those heavy metals in waste streams can be readily adsorbed by marine
animals and directly enter the human food chain, thus presenting a high health risk to
consumers. Cadmium, for example, damages the kidneys; lead adversely affects red
blood cells, the nervous system and the kidneys. Acute systemic poisoning can result
from high exposure to hexavalent chromium. For environmental protection, waste
solutions containing heavy metal elements need treatment systems that can remove
these contaminants effectively.
During the past three decades, several physical, chemical and biological
decolorization methods have been reported; few, however, have been accepted by the

7
paper and textile industries. Amongst the numerous techniques of dye removal,
adsorption is the procedure of choice and gives the best results as it can be used to
remove different types of colouring materials. Most commercial systems currently use
activated carbon as sorbent to remove dyes in wastewater because of its excellent
adsorption ability. Activated carbon adsorption has been cited by the US Environmental
Protection Agency as one of the best available control technologies. However, although
activated carbon is a preferred sorbent, its widespread use is restricted due to high cost.
In order to decrease the cost of treatment, attempts have been made to find inexpensive
alternative adsorbents.
Recently, numerous approaches have been studied for the development of
cheaper and effective adsorbents. Many non-conventional low-cost adsorbents,
including natural materials, biosorbents, and waste materials from industry and
agriculture, have been proposed by several workers. These materials could be used as
sorbents for the removal of dyes from solution. Some of the reported sorbents include
clay materials (bentonite, kaolinite), zeolites, siliceous material (silica beads, alunite,
perlite), agricultural wastes (bagasse pith, maize cob, rice husk, coconut shell),
industrial waste products (waste carbon slurries, metal hydroxide sludge), biosorbents
(chitosan, peat, biomass) and others (starch, cyclodextrin, cotton).
There are several reported methods for the removal of pollutants from effluents.
The technologies can be divided into three categories: biological, chemical and physical.
All of them have advantages and drawbacks. Because of the high cost and disposal
problems, many of these conventional methods for treating dye wastewater have not
been widely applied at large scale in the textile and paper industries.
2.1. Biological treatments
Biological treatment is often the most economical alternative when compared
with other physical and chemical processes. Biodegradation methods such as fungal
decolorization, microbial degradation, adsorption by (living or dead) microbial biomass
and bioremediation systems are commonly applied to the treatment of industrial
effluents because many microorganisms such as bacteria, yeasts, algae and fungi are
able to accumulate and degrade different pollutants. However, their application is often
restricted because of technical constraints. Biological treatment requires a large land

8
area and is constrained by sensitivity toward diurnal variation as well as toxicity of some
chemicals, and less flexibility in design and operation. Biological treatment is incapable
of obtaining satisfactory colour elimination with current conventional biodegradation
processes. Moreover, although many organic molecules are degraded, many others are
recalcitrant due to their complex chemical structure and synthetic organic origin. In
particular, due to their xenobiotic nature, azo dyes are not totally degraded.
2.2 Chemical methods
Chemical methods include coagulation or flocculation combined with flotation
and filtration, precipitation– flocculation with Fe(II)/Ca(OH)2, electroflotation,
electrokinetic coagulation, conventional oxidation methods by oxidizing agents
(ozone), irradiation or electrochemical processes. These chemical techniques are often
expensive, and although the dyes are removed, accumulation of concentrated sludge
creates a disposal problem. There is also the possibility that a secondary pollution
problem will arise because of excessive chemical use. Recently, other emerging
techniques, known as advanced oxidation processes, which are based on the generation
of very powerful oxidizing agents such as hydroxyl radicals, have been applied with
success for pollutant degradation. Although these methods are efficient for the treatment
of waters contaminated with pollutants, they are very costly and commercially
unattractive. The high electrical energy demand and the consumption of chemical
reagents are common problems.
2.3. Physical methods
Different physical methods are also widely used, such as membrane-filtration
processes (nanofiltration, reverse osmosis, electrodialysis,) and adsorption techniques.
The major disadvantage of the membrane processes is that they have a limited lifetime
before membrane fouling occurs and the cost of periodic replacement must thus be
included in any analysis of their economic viability. In accordance with the very
abundant literature data, liquid-phase adsorption is one of the most popular methods for
the removal of pollutants from wastewater since proper design of the adsorption process
will produce a high-quality treated effluent. This process provides an attractive
alternative for the treatment of contaminated waters, especially if the sorbent is
inexpensive and does not require an additional pre-treatment step before its application.

9
Adsorption is a well-known equilibrium separation process and an effective
method for water decontamination applications. Adsorption has been found to be
superior to other techniques for water re-use in terms of initial cost, flexibility and
simplicity of design, ease of operation and insensitivity to toxic pollutants. Adsorption
also does not result in the formation of harmful substances.
2.4. Adsorption using commercial activated carbons
Adsorption techniques employing solid sorbents are widely used to remove
certain classes of chemical pollutants from waters, especially those that are practically
unaffected by conventional biological wastewater treatments. However, amongst all the
sorbent materials proposed, activated carbon is the most popular for the removal of
pollutants from wastewater Because of their great capacity to adsorb dyes, CAC are the
most effective adsorbents. This capacity is mainly due to their structural characteristics
and their porous texture which gives them a large surface area, and their chemical nature
which can be easily modified by chemical treatment in order to increase their properties.
However, activated carbon presents several disadvantages. It is quite expensive, the
higher the quality, the greater the cost, non-selective and ineffective against disperse
and vat dyes. The regeneration of saturated carbon is also expensive, not
straightforward, and results in loss of the adsorbent. The use of carbons based on
relatively expensive starting materials is also unjustified for most pollution control
applications. This has led many workers to search for more economic adsorbents.
2.5. Non-conventional low-cost adsorbents
Due to the problems mentioned above, research interest into the production of
alternative sorbents to replace the costly activated carbon has intensified in recent years.
Attention has focused on various natural solid supports, which are able to remove
pollutants from contaminated water at low cost. Cost is actually an important parameter
for comparing the adsorbent materials. According to Bailey et al., a sorbent can be
considered low-cost if it requires little processing, is abundant in nature or is a by-
product or waste material from another industry. Certain waste products from industrial
and agricultural operations, natural materials and biosorbents represent potentially
economical alternative sorbents. Many of them have been tested and proposed for dye
removal.

10
The by-products from the agricultural and industrial industries could be assumed
to be low-cost adsorbents since they are abundant in nature, inexpensive, require little
processing and are effective materials. Plentiful agricultural and wood by-products may
also offer an inexpensive and renewable additional source of activated carbon. These
waste materials have little or no economic value and often present a disposal problem.
The activated carbons prepared from by-products exhibited high sorption properties.
Another waste product from the timber industry is bark, a polyphenol-rich
material. Bark is an abundant forest residue which has been found to be effective in
removing dyes from water solutions. Because of its low cost and high availability, bark
is very attractive as an adsorbent. Like sawdust, the cost of forest wastes is only
associated with the transport cost from the storage place to the site where they will be
utilized. Bark is an effective adsorbent because of its high tannin content. The
polyhydroxy polyphenol groups of tannin are thought to be the active species in the
adsorption process.
Because of their low cost and local availability, industrial solid wastes such as
metal hydroxide sludge, fly ash and red mud are classified as low-cost materials and can
be used as adsorbents for dye removal Natural clay minerals are well known and familiar
to mankind from the earliest days of civilization. Because of their low cost, abundance
in most continents of the world, high sorption properties and potential for ion exchange,
clay materials are strong candidates as adsorbents.
Clay materials possess a layered structure and are considered as host materials.
They are classified by the differences in their layered structures. There are several
classes of clays such as smectites (montmorillonite, saponite), mica (illite), kaolinite,
serpentine, pylophyllite (talc), vermiculite and sepiolite . The adsorption capabilities
result from a net negative charge on the structure of minerals. This negative charge gives
clay the capability to adsorb positively charged species. Their sorption properties also
come from their high surface area and high porosity. Montmorillonite clay has the
largest surface area and the highest cation exchange capacity. Its current market price
(about US$ 0.04–0.12/kg) is considered to be 20 times cheaper than that of activated
carbon.

11
Generally, a suitable non-conventional low-cost adsorbent for dye adsorption
should meet several requirements: (i) efficient for removal of a wide variety of dyes;
(ii) high capacity and rate of adsorption; (iii) high selectivity for different
concentrations; and (iv) non-conventional adsorbents may have potential as readily
available, inexpensive and effective sorbents. They also possess several other
advantages that make them excellent materials for environmental purposes, such as high
capacity and rate of adsorption, high selectivity for different concentrations, and also
rapid kinetics (of dye from aqueous solutions. Chitosan has received considerable
interest for dye removal due, to its excellent dye-binding capacities.
OTHER ADSORBENTS
1. FLY ASH
Gangoli et al. examined the suitability of fly ash as an adsorbent for the removal
of heavy metal ions from the aqueous solutions. They concluded that metal ions might
adsorb on fly ash because of its high content of silica and alumina. Two different fly
ashes (Afsin-Elbistan and Seyitomer) are generally used the studies. Adsorption data
were correlated using the linear forms of the Langmuir and Freundlich equations. The
adsorption data fitted the Langmuir isotherm better since the correlation coefficients for
the Langmuir isotherm were higher than those for the Freundlich equation. The Afsin-
Elbistan fly ash with a high calcium content was found to be metal adsorbent as effective
as activated carbon. Therefore there are good prospects for the adsorption of these
metals on fly ash with high calcium content in practical applications in Turkey.
2. PEAT
Peat is a low grade carbonaceous fuel containing lignin, cellulose and humic
acids as its major constituents, these bear polar functional groups such as alcohols,
aldehydes, carboxylic acids, ketones and phenolic hydroxides which can all be involved
in chemical bonding with the adsorbed pollutants. Peat has a polar character which tends
itself to the adsorption of specific materials such as metals and polar organic molecules.
3. ZEOLITE
Zeolites are highly porous aluminosilicates with different cavity structures. Their
structures consists of a three dimensional framework, having a negatively charged
12
lattice. The negative charge is balanced by cations which are exchangeable with certain
cation in solutions. It is recognized that, like clay, their adsorption properties of zeolites
result mainly from ion exchange capabilities.
4. EGG SHELL
Egg shell membrane is located on the inner surface of an egg shell. It is a dual
membrane composed of fibers of polysaccharides collagen like proteins. The membrane
demonstrates good adsorption characteristics due to the availability of sites containing
substituting groups such as hydroxyl, amine and sulphonic groups with which reactive
metals or dyes can react.
A comparison between the adsorption by activated carbon and egg shell
membrane towards reactive levafix brilliant red E-4BA suggests that egg shell
membrane has a higher capacity (80 mg g-1) than the carbon (60 mg g-1).
Generally, a suitable non-conventional low-cost adsorbent for dye adsorption
should meet several requirements:
(1) Efficient for removal of a wide variety of dyes.
(2) High capacity and rate of adsorption.
(3) High selectivity for different concentrations.
Non-conventional adsorbents may have potential as readily available, inexpensive and
effective sorbents. They also possess several other advantages that make them excellent
materials for environmental purposes, such as high capacity and rate of adsorption, high
selectivity for different concentrations, and also rapid kinetics. Such a newly mined,
low-cost material, egg shell, was used in this investigation as adsorbent for various
heavy metals.
2.6. Adsorption Isotherms
Adsorption is usually described through isotherms, that is, the amount of
adsorbate on the adsorbent as a function of its pressure (if gas) or concentration (if
liquid) at constant temperature. The quantity adsorbed is nearly always normalized by
the mass of the adsorbent to allow comparison of different materials.
Many studies have been conducted to evaluate adsorption of dyes onto a wide
range of natural and synthetic, organic and inorganic sorbents. Highest adsorption
capacities have been reported for: 940 mg Reactive Black 5, 1190 mg Reactive Orange

13
96 and 1750 mg Reactive Red 120/g cucurbituril; 104.2 mg Acid Green 27, 53,5 mg
Acid Violet 27 and 51.0 mg Indigo Carmin/g living mycelium of Trametes versicolor ;
242 mg Basic Red 18/g palm-fruit; 13.95 and 15.17 mg Acid Blue 29/g peat and fly ash,
respectively ; and 1119, 873, 875, 190 914, 312, 277, 158 and 250 mg Methylene Blue/g
adsorbent for bark, rice hisk, cotton waste, hair and coal, respectively ; 5.92 mg direct
red and 4.42 mg acid brilliant blue/ g banana pith, respectively ; 159.0mg Maxilon
Goldgelb GL EC 400 and 309.0 mg Maxilon Schwarz FBL-01 300/g granular activated
carbon, and 14.9 mg Maxilon Goldgelb GL EC 400 and 55.86 mg Maxilon Schwarz
FBL-01 300/g natural zeolite, respectively. 160 mg Drim yellow-K4G, 140 mg Drim
blue-KBL and 100 mg Drim red K4BL/ g shale oil ash. Approximately 88% of Dianix
Blue [125 mg/dm3] could be removed from wastewater with 75 mg/dm3 recycled alum
sludge at pH 9.13; 97.9% of Levafix Brill Blue EBRA[1. g/dm3] could be removed with
a solution containing minimum 3 g/dm3 by chemical precipitation at pH 10.5-11.0.
a) Freundlich Isotherm
The first mathematical fit to an isotherm was published by Freundlich and Küster
(1894) and is a purely empirical formula for gaseous adsorbates,
x/m = kP1/n
where x is the quantity adsorbed, m is the mass of the adsorbent, P is the pressure of
adsorbate and k and n are empirical constants for each adsorbent-adsorbate pair at a
given temperature. The function has an asymptotic maximum as pressure increases
without bound. As the temperature increases, the constants k and n change to reflect the
empirical observation that the quantity adsorbed rises more slowly and higher pressures
are required to saturate the surface. Taking log both sides of equation, we get,
The equation above equation is comparable with equation of straight line, y = mx +c
where, m represents slope of the line and c represents intercept on y axis.
Plotting a graph between log(x/m) and log p, we will get a straight line with value
of slope equal to 1/n and log k as y-axis intercept.

14
Fig.2.1. log(x/m) vs. log p graph
Limitation of Freundlich Adsorption Isotherm
Experimentally it was determined that extent of adsorption varies directly with
pressure till saturation pressure Ps is reached. Beyond that point rate of adsorption
saturates even after applying higher pressure. Thus Freundlich Adsorption Isotherm
failed at higher pressure.
b) Langmuir Isotherm
In 1916, Irving Langmuir published a new model isotherm for gases adsorbed to
solids, which retained his name. It is a semi-empirical isotherm derived from a proposed
kinetic mechanism. It is based on four assumptions:
1. The surface of the adsorbent is uniform, that is, all the adsorption sites are
equivalent.
2. Adsorbed molecules do not interact.
3. All adsorption occurs through the same mechanism.
4. At the maximum adsorption, only a monolayer is formed: molecules of
adsorbate do not deposit on other, already adsorbed, molecules of adsorbate,
only on the free surface of the adsorbent.
These four assumptions are seldom all true: there are always imperfections on
the surface, adsorbed molecules are not necessarily inert, and the mechanism is clearly
not the same for the very first molecules to adsorb to a surface as for the last. The fourth
condition is the most troublesome, as frequently more molecules will adsorb to the
monolayer; this problem is addressed by the BET isotherm for relatively flat

15
(nonmicroporous) surfaces. The Langmuir isotherm is nonetheless the first choice for
most models of adsorption, and has many applications in surface kinetics (usually called
Langmuir-Hinshelwood kinetics) and thermodynamics. Langmuir suggested that
adsorption takes place through this mechanism:
,
where A is a gas molecule and S is an adsorption site. The direct and inverse rate
constants are k and k-1. If we define surface coverage, θ, as the fraction of the adsorption
sites occupied, in the equilibrium we have
or
where P is the partial pressure of the gas or the molar concentration of the solution. For
very low pressures and for high pressures .
2.7. ADSORPTION REACTION MODELS
The study of sorption kinetics describes the adsorbate uptake rate and evidently
this rate controls the residence time of adsorbate at the solid liquid interface. The
different kinetic models, include the pseudo-first order, pseudo-second order, Elovich
mass transfer, intraparticle diffusion, intraparticle diffusivity etc.
2.7.1. The Pseudo-First Order Equation
Lagergren (1898) presented a first-order rate equation to describe the kinetic
process of liquid-solid phase adsorption of oxalic acid and malonic acid onto charcoal,
which is believed to be the earliest model pertaining to the adsorption rate based on the
adsorption capacity. The pseudo-first order equation is generally expressed as:
dqt/dt = k1(qe-qt)
Where qe and qt are the sorption capacities at equilibrium and at time t, respectively
(mgg-1) and K1 is the rate constant of pseudo-first order sorption (Lmin-1). After
integration and applying boundary conditions t = 0 to t = t and qt = 0 to qt = qt, the
integrated form of equation becomes:
Log (qe-qt) = log qe - k1t
When the values of log (qe – qt) were linearly correlated with t, the plot of log (qe – qt)
versus t will give a linear relationship from which k1 and qe can be determined from the
slope and intercept of the graph respectively.

16
2.7.2. The Pseudo- Second Order Equation
In 1995, Ho described a kinetic process of the adsorption of divalent metal ions
onto peat in which the chemical bonding among divalent metal ions and polar functional
groups on peat, such as aldehydes, ketones, acids, and phenolics are responsible for the
cation-exchange capacity of the peat. The pseudo-second order chemisorption kinetic
equation is expressed as eqn:
dqt/dt = k2 (qe-qt)2
Where qe and qt are the sorption capacity at equilibrium and at time t,(mgg-1)
respectively and K2 is the rate constant of the pseudo-second order sorption (g.mg-1.
min-1). For the boundary conditions t = 0 to t = t and qt = 0 to qt = qt, the integrated form
of eqn becomes:
Furthermore above eqn can be written as:
If the pseudo-second order kinetics is applicable to the experimental data, the plot of t/qt
versus t of eqn (II) should give a linear relationship from which qe, k and h can be
determined from the slope and intercept of the plot respectively.
2.8. TYPES OF ADSORPTION
Adsorption can be classified into two categories as described below,
(1) Depending upon the concentration: In adsorption the concentration of one
substance is different at the surface of the other substance as compared to adjoining bulk
or interior phase.
(i) Positive adsorption : If the concentration of adsorbate is more on the surface as
compared to its concentration in the bulk phase then it is called positive adsorption.
(ii) Negative adsorption : If the concentration of the adsorbate is less than its
concentration in the bulk then it is called negative adsorption.
17
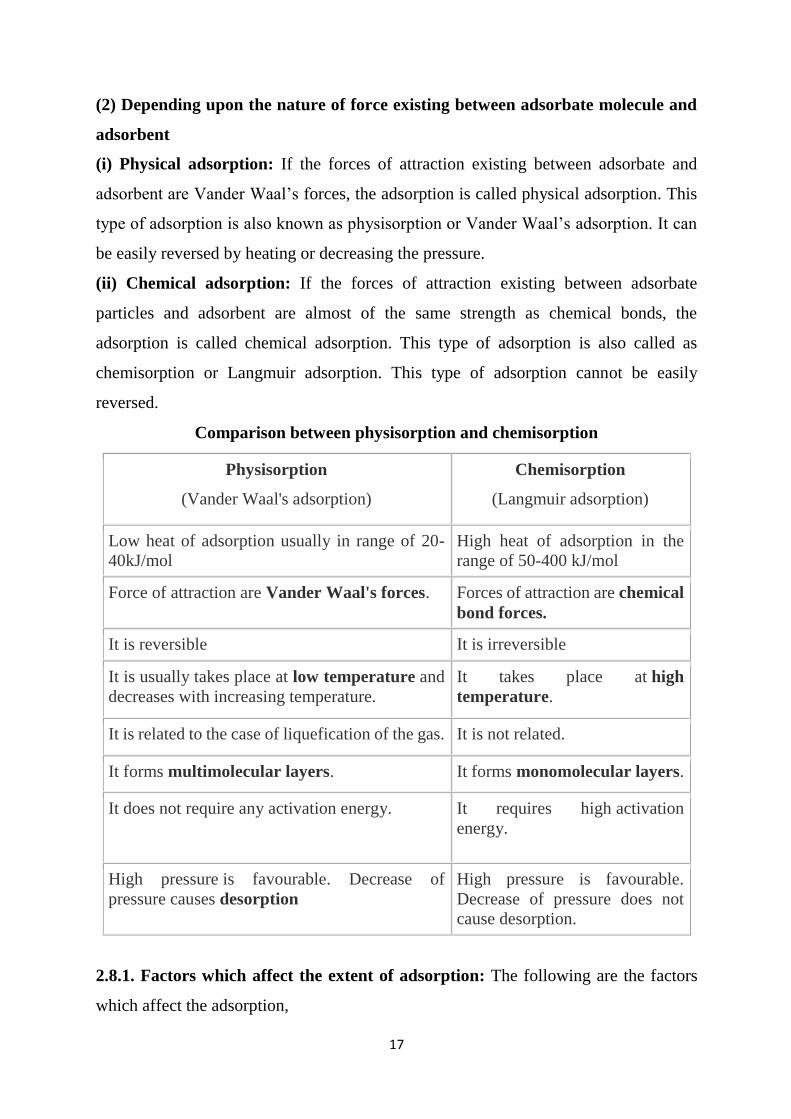
(2) Depending upon the nature of force existing between adsorbate molecule and
adsorbent
(i) Physical adsorption: If the forces of attraction existing between adsorbate and
adsorbent are Vander Waal’s forces, the adsorption is called physical adsorption. This
type of adsorption is also known as physisorption or Vander Waal’s adsorption. It can
be easily reversed by heating or decreasing the pressure.
(ii) Chemical adsorption: If the forces of attraction existing between adsorbate
particles and adsorbent are almost of the same strength as chemical bonds, the
adsorption is called chemical adsorption. This type of adsorption is also called as
chemisorption or Langmuir adsorption. This type of adsorption cannot be easily
reversed.
Comparison between physisorption and chemisorption
Physisorption
(Vander Waal's adsorption)
Chemisorption
(Langmuir adsorption)
Low heat of adsorption usually in range of 20-
40kJ/mol
High heat of adsorption in the
range of 50-400 kJ/mol
Force of attraction are Vander Waal's forces. Forces of attraction are chemical
bond forces.
It is reversible It is irreversible
It is usually takes place at low temperature and
decreases with increasing temperature.
It takes place at high
temperature.
It is related to the case of liquefication of the gas. It is not related.
It forms multimolecular layers. It forms monomolecular layers.
It does not require any activation energy. It requires high activation
energy.
High pressure is favourable. Decrease of
pressure causes desorption
High pressure is favourable.
Decrease of pressure does not
cause desorption.
2.8.1. Factors which affect the extent of adsorption: The following are the factors
which affect the adsorption,

18
(1) Nature of the adsorbate (gas) and adsorbent (solid)
(i) In general, easily liquefiable gases e.g., CO2, NH3, Cl2 and SO2 etc. are adsorbed to
a greater extent than the elemental gases e.g. H2, O2, N2, He etc. (while chemisorption
is specific in nature.)
(ii) Porous and finely powdered solid e.g. charcoal, fullers earth, adsorb more as
compared to the hard non-porous materials. Due to this property powdered charcoal is
used in gas masks.
(2) Surface area of the solid adsorbent
(i) The extent of adsorption depends directly upon the surface area of the adsorbent, i.e.
larger the surface area of the adsorbent, greater is the extent of adsorption.
(ii) Surface area of a powdered solid adsorbent depends upon its particle size. Smaller
the particle size, greater is its surface area.
(3) Effect of pressure on the adsorbate gas
(i) An increase in the pressure of the adsorbate gas increases the extent of adsorption.
(ii) At low temperature, the extent of adsorption increases rapidly with pressure.
(iii) Small range of pressure, the extent of adsorption is found to be directly proportional
to the pressure.
(iv) At high pressure (closer to the saturation vapour pressure of the gas), the adsorption
tends to achieve a limiting value.

19
(4) Effect of temperature
(i) As adsorption is accompanied by evolution of heat, so according to the Le-Chatelier’s
principle, the magnitude of adsorption should decrease with rise in temperature.
(ii)The relationship between the extent of adsorption and temperature at any constant
pressure is called adsorption isobar.
(iii) A physical adsorption isobar shows a decrease in x/m (where ‘m’ is the mass of the
adsorbent and ‘x’ that of adsorbate) as the temperature rises.
(iv)The isobar of chemisorption show an increase in the beginning and then decrease as
the temperature rises.
2.9. Dyes
The total dye consumption of the textile industry worldwide is more than 107 kg
year-1. There are more than 10,000 commercially available dyes with over 7x10⁵ tones
of dyestuff produced annually across the world. It is estimated that 2 % of dyes produced
annually are discharged in effluent from manufacturing operations. While in the textile
industry, it is estimated that 10–15% of the dye is lost during the dyeing process and
released with the effluent. Effluents discharged from washing and dyeing processes
represent 95% of the total amount of consumed water, namely 200 L per kg fabric.
Synthetic dyes usually have a complex aromatic molecular structure such as benzene,
naphthalene, anthracene, toluene, xylene, etc. The complex aromatic molecular
structures of dyes make them more stable and difficult to biodegrade. Most of these dye
wastes are toxic and may be carcinogenic. Many of these organic dyes are hazardous
and may affect the aquatic life and even the food chain. Among the chemical classes of

20
dyes, azo dyes are more versatile and account to more than half of the annual dye
production. And also, azo dyes are considered more carcinogenic to humans.
1. Methylene blue (MB)
Methylene blue is a heterocyclic aromatic chemical compound with the
molecular formula C16H18N3SCl. It has many uses in a range of different fields, such as
biology and chemistry. At room temperature it appears as a solid, odorless, dark green
powder that yields a blue solution when dissolved in water. The hydrated form has 3
molecules of water per molecule of methylene blue. Methylene blue should not be
confused with methyl blue, another histology stain, new methylene blue, nor with the
methyl violets often used as pH indicators.MB is the most commonly used material for
dying cotton, wood, and silk with molecular weight 373.9 corresponds to methylene
blue hydrochlorine with three groups of water. The structure of the methylene blue is
given as below.
Recent research suggests that methylene blue, toluidine blue, and other 3,7-
diaminophenothiazinium-based redox cyclers induce selective cancer cell apoptosis by
NAD(P)H:quinone oxidoreductase (NQO1)-dependent bioreductive generation of
cellular oxidative stress. Combined with plant auxin (indole-3-acetic acid), methylene
blue is being investigated for the photodynamic treatment of cancer.
2. Crystal Violet
Crystal violet is also known under the name of gentian violet. It is a protein dye
which stains the fatty portions of sebaceous sweat a deep purple color. Being a protein
dye, crystal violet dye can also be used asan enhancer for bloody fingerprints. However,
if this dye solution is going to be used on bloody prints, the first method shown here is
recommended. Crystal violet dye is also used on most types of adhesive tapes, because
conventional powders adhere to the entire sticky side of the tape and are not selective
to the latent prints. It is a triarylmethane dye. The dye is used as a histological stain and
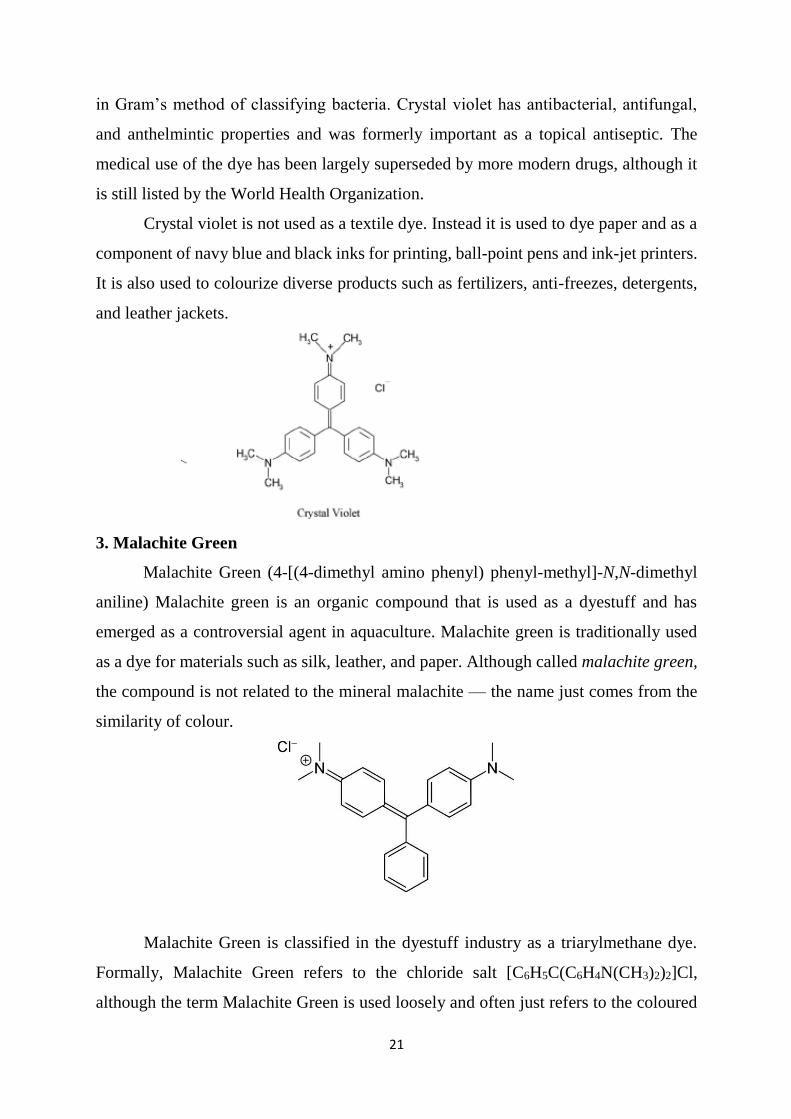
21
in Gram’s method of classifying bacteria. Crystal violet has antibacterial, antifungal,
and anthelmintic properties and was formerly important as a topical antiseptic. The
medical use of the dye has been largely superseded by more modern drugs, although it
is still listed by the World Health Organization.
Crystal violet is not used as a textile dye. Instead it is used to dye paper and as a
component of navy blue and black inks for printing, ball-point pens and ink-jet printers.
It is also used to colourize diverse products such as fertilizers, anti-freezes, detergents,
and leather jackets.
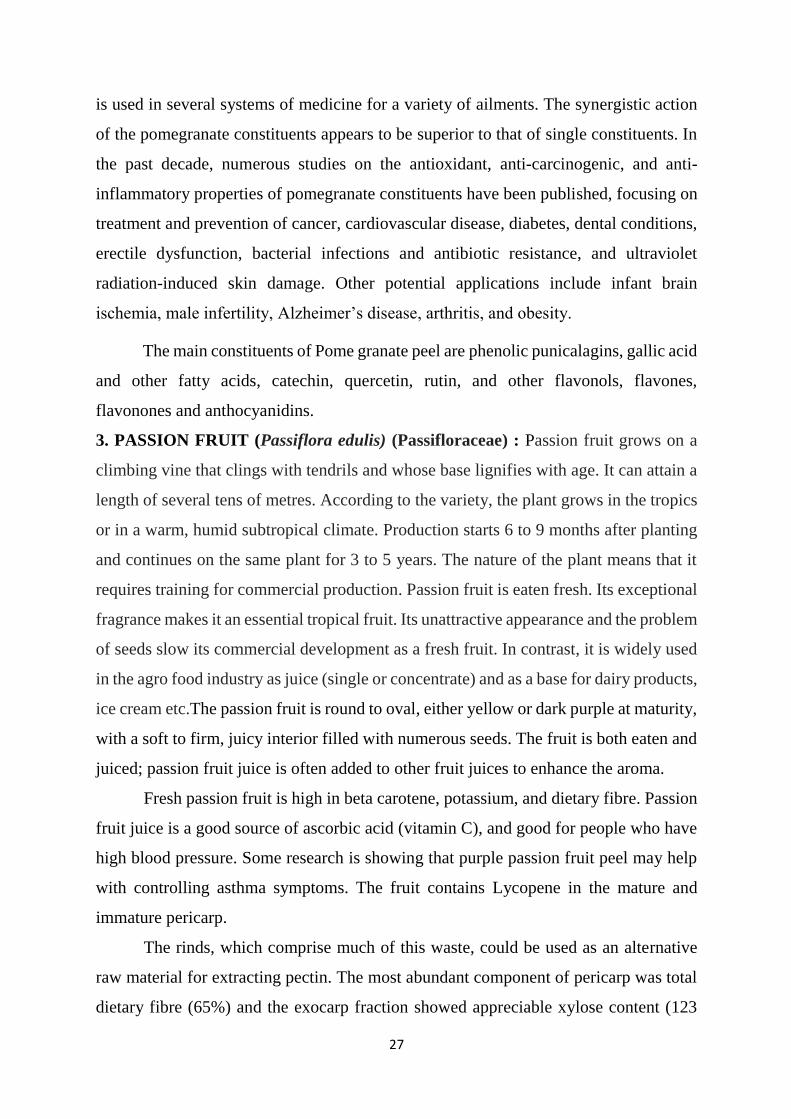
3. Malachite Green
Malachite Green (4-[(4-dimethyl amino phenyl) phenyl-methyl]-N,N-dimethyl
aniline) Malachite green is an organic compound that is used as a dyestuff and has
emerged as a controversial agent in aquaculture. Malachite green is traditionally used
as a dye for materials such as silk, leather, and paper. Although called malachite green,
the compound is not related to the mineral malachite — the name just comes from the
similarity of colour.
Malachite Green is classified in the dyestuff industry as a triarylmethane dye.
Formally, Malachite Green refers to the chloride salt [C6H5C(C6H4N(CH3)2)2]Cl,
although the term Malachite Green is used loosely and often just refers to the coloured

22
cation. The oxalate salt is also marketed. The chloride and oxalate anions have no effect
on the color. The intense green color of the cation results from a strong absorption band
at 621 nm (extinction coefficient of 105 M−1cm−1). Malachite green is traditionally used
as a dye. Millions of kilograms of MG and related triarylmethane dyes are produced
annually for this purpose. Malachite green can also be used as a saturable absorber in
dye lasers, or as a pH indicator between pH 0.2 - 1.8.
The LD50 (oral, mouse) is 80 mg/kg. Rats fed malachite green experience “a
dose-related increase in liver DNA adducts” along with lung adenomas. Leuco-
malachite green causes an “increase in the number and severity of changes”. As leuco-
malachite green is the primary metabolite of malachite green and is retained in fish
muscle much longer, most intake of malachite green would be in the leuco form. During
the experiment, rats were fed up to 543 ppm of leuco-malachite green, an extreme
amount compared to the average 5 ppb discovered in fish. After a period of two years,
an increase in lung adenomas in male rats was discovered but no incidences of liver
tumors. Therefore it could be concluded that malachite green caused carcinogenic
symptoms, but a direct link between malachite green and liver tumor was not
established.
4. Eosin Yellow
Eosin is a water soluble dye, a red crystalline powder, designated by the formula
C20H8O5Br4, used in textile dyeing and ink manufacturing or the red sodium salt of this
powder, used in biology to stain cells, or any of a class of red acid dyes of the xanthene
group used as cytoplasmic stains and as counter-stains.
Eosin yellowish is a versatile red dye used in cosmetics, pharmaceuticals,
textiles, etc., and as tissue stain, vital stain, and counterstain with hematoxylin. It is also
used in special culture media.

23
The textile industry uses eosin for strong staining properties to efficiently dye
nylon, silk, and wool. Additionally, the paper industry makes use of eosin as a ruling
ink.
5. Congo red
Congo red is the sodium salt of 3,3'-([1,1'-biphenyl]-4,4'-diyl)bis(4-aminonaphthalene-
1-sulfonic acid) (formula: C32H22N6Na2O6S2; molecular weight: 696.66 g/mol). It is a
secondary diazo dye. Congo red is water-soluble, yielding a red colloidal solution; its
solubility is better in organic solvents such as ethanol. It has a strong, though apparently
noncovalent, affinity to cellulose fibers. However, the use of Congo red in the cellulose
industries (cotton textile, wood pulp, and paper) has long been abandoned, primarily
because of its toxicity and tendency to run and change color when touched by sweaty
fingers. The Congo red dye was first synthesized in 1883 by Paul Bottiger who was
working then for the Friedrich Bayer Company in Elberfeld, Germany. Due to a color
change from blue to red atpH 3.0-5.2, congo red can be used as a pH indicator.
Due to a color change from blue to red at pH 3.0–5.2, Congo red can be used as a
pH indicator. Since this color change is an approximate inverse of that of litmus, it can
be used with litmus paper in a simple parlor trick: add a drop or two of Congo red to
both an acid solution and a base solution. Dipping red litmus paper in the red solution
will turn it blue, while dipping blue litmus paper in the blue solution will turn it red.
This property gives Congo red a metachromatic property as a dye, both in strongly
acidic solutions and with strongly acidophilic tissue.
Congo red has a propensity to aggregate in aqueous and organic solutions. The
proposed mechanisms suggest hydrophobic interactions between the aromatic rings of
the dye molecules, leading to a pi–pi stacking phenomenon. Although these aggregates

24
are present under various sizes and shapes, the "ribbon-like micelles" of a few molecules
seem to be the predominant form (even if the "micelle" term is not totally appropriate
here). This aggregation phenomenon is more prevalent in high Congo red
concentrations, at high salinity and/or low pH.
In biochemistry and histology, Congo red is used to stain microscopic preparates,
especially as a cytoplasm and erythrocyte stain. Apple-green birefringence of Congo
red stained preparates under polarized light is indicative for the presence of amyloid
fibrils. Additionally, Congo red is used in microbiological epidemiology to rapidly
identify the presence of virulent serotype 2a Shigella flexneri, where the dye binds the
bacterium's unique lipopolysaccharide structure.
2.10. Effects of heavy metals on human health
The heavy metals hazardous to humans include lead, mercury, cadmium,
arsenic, copper, zinc, and chromium. Such metals are found naturally in the soil in trace
amounts, which pose few problems. When concentrated in particular areas, however,
they present a serious danger. Arsenic and cadmium, for instance, can cause cancer.
Mercury can cause mutations and genetic damage, while copper, lead, and mercury can
cause brain and bone damage. Next section presents the harmful effects to the three
heavy metals that are prevalent in the environment.
1. Copper: Cu is heavily used in metal industries such as plating, mining and smelting,
brass manufacture, electroplating industries, petroleum refining, and excessive use of
Cu-based agrichemical mining (Demirbas et al., 2008). About 98% of all Cu is used as
metal, taking advantage of its distinctive physical properties by being malleable and
ductile, a good conductor of both heat and electricity, and being resistant to corrosion.
Cu is one of the relatively small groups of metallic elements which are essential to
human health. Short periods of exposure can cause gastrointestinal disturbance,
including nausea and vomiting. Long-term exposure to Cu can cause irritation of the
nose, mouth and eyes and it causes headaches, stomachaches, dizziness, vomiting and
diarrhea. Use of water that exceeds the Action Level over many years could cause liver
or kidney damage.

25
2. Nickel: Electroplating is one important process involved in surface finishing and
metal deposition for better life of articles and for decoration. Although several metals
can be used for electroplating, nickel, copper, zinc and chromium are the most
commonly used metals, the choice depending upon the specific requirement of the
articles. During washing of the electroplating tanks, considerable amounts of the metal
ions find their way into the effluent. Ni (II) is present in the effluents of silver refineries,
electroplating, zinc base casting and storage battery industries (Sitting, 1976). Higher
concentrations of nickel cause cancer of lungs, nose and bone. Dermatitis (Ni itch) is
the most frequent effect of exposure to Ni, such as coins and jewelry. Acute poisoning
of Ni (II) causes headache, dizziness, nausea and vomiting, chest pain, tightness of the
chest, dry cough and shortness of breath, rapid respiration, cyanosis and extreme
weakness.
3. Cobalt: As cobalt is widely dispersed in the environment humans may be exposed to
it by breathing air, drinking water and eating food that contains cobalt. Skin contact with
soil or water that contains cobalt may also enhance exposure. Cobalt is beneficial for
humans because it is a part of vitamin B12, which is essential for human health. Cobalt
is used to treat anaemia with pregnant women, because it stimulates the production of
red blood cells. The total daily intake of cobalt is variable and may be as much as 1 mg,
but almost all will pass through the body unadsorbed, except that in vitamine B12.
However, too high concentrations of cobalt may damage human health.
4. Chromium: Chromium is used mainly in metal alloys such as metal-ceramics,
stainless steel, and is used as chrome plating. It has high value in the industrial world
because it can be polished to a mirror-like finish, and provides a durable, highly rust
resistant coating, for heavy applications. On the flip side, chromium can also provide
health benefits to humans.
Chromium is unstable in an oxygenated environment and, when exposed to air,
immediately produces an oxide layer which is impermeable to further oxygen
contamination. Chromium enters the environment through both natural processes and
human activities. Increases in Chromium III are due to leather, textile, and steel

26
manufacturing; Chromium VI enters the environment through leather and textile
manufacturing, but also due to industrial applications such as electro painting and
chemical manufacturing. Groundwater contamination may occur due to seepage from
chromate mines or improper disposal of mining tools and supplies, and improper
disposal of industrial manufacturing equipment.
Chromium VI (hexavalent chromium) is considered carcinogenic only to animals
in certain circumstances at this point; chromium in general is currently not classified as
a carcinogen as the OSHA and is fairly unregulated, but is considered toxic, level 3.
While chromium III is essential for regular operation of human vascular and metabolic
systems as well as combating diabetes, too much chromium III may result in severe skin
rash, or other more serious symptoms. Chromium VI is the most dangerous form of
chromium and may cause health problems including: allergic reactions, skin rash, nose
irritations and nosebleed, ulcers, weakened immune system, genetic material alteration,
kidney and liver damage, and may even go as far as death of the individual.
2.11. Constituents of low cost adsorbents
1. POTATO PEEL: Potato peels are a potential source of dietary fiber. Potato peel
is a nutrient rich waste and it contains adequate amount of nutrients such as carbohydrate
and proteins. It also contains alcohol-insoluble solids (pectin, cellulose, starch), soluble
sugars and minerals (mainly Ca, K, P, and Si). Potato peels are renewable, cheap and
widely available waste. Utilization of waste potato peels to produce biomass appears to
be economic. The biosorption ability of potato peels (as a new waste material obtained
from commercial processing of potato chips factories) was investigated for removal of
Pb(II), Cd(II) and Zn (II) from aqueous solutions. The percentage removals are 92, 75
and 42 % for Pb(II), Cd(II) and Zn(II), respectively at initial metal ion concentration of
100 mg/L and at room temperature.
2. POME GRANATE PEEL: The pomegranate, Punica granatum L., is an ancient,
mystical, unique fruit borne on a small, long-living tree cultivated throughout the
Mediterranean region, as far north as the Himalayas, in Southeast Asia, and in California
and Arizona in the United States. In addition to its ancient historical uses, pomegranate
27
is used in several systems of medicine for a variety of ailments. The synergistic action
of the pomegranate constituents appears to be superior to that of single constituents. In
the past decade, numerous studies on the antioxidant, anti-carcinogenic, and anti-
inflammatory properties of pomegranate constituents have been published, focusing on
treatment and prevention of cancer, cardiovascular disease, diabetes, dental conditions,
erectile dysfunction, bacterial infections and antibiotic resistance, and ultraviolet
radiation-induced skin damage. Other potential applications include infant brain
ischemia, male infertility, Alzheimer’s disease, arthritis, and obesity.
The main constituents of Pome granate peel are phenolic punicalagins, gallic acid
and other fatty acids, catechin, quercetin, rutin, and other flavonols, flavones,
flavonones and anthocyanidins.
3. PASSION FRUIT (Passiflora edulis) (Passifloraceae) : Passion fruit grows on a
climbing vine that clings with tendrils and whose base lignifies with age. It can attain a
length of several tens of metres. According to the variety, the plant grows in the tropics
or in a warm, humid subtropical climate. Production starts 6 to 9 months after planting
and continues on the same plant for 3 to 5 years. The nature of the plant means that it
requires training for commercial production. Passion fruit is eaten fresh. Its exceptional
fragrance makes it an essential tropical fruit. Its unattractive appearance and the problem
of seeds slow its commercial development as a fresh fruit. In contrast, it is widely used
in the agro food industry as juice (single or concentrate) and as a base for dairy products,
ice cream etc.The passion fruit is round to oval, either yellow or dark purple at maturity,
with a soft to firm, juicy interior filled with numerous seeds. The fruit is both eaten and
juiced; passion fruit juice is often added to other fruit juices to enhance the aroma.
Fresh passion fruit is high in beta carotene, potassium, and dietary fibre. Passion
fruit juice is a good source of ascorbic acid (vitamin C), and good for people who have
high blood pressure. Some research is showing that purple passion fruit peel may help
with controlling asthma symptoms. The fruit contains Lycopene in the mature and
immature pericarp.
The rinds, which comprise much of this waste, could be used as an alternative
raw material for extracting pectin. The most abundant component of pericarp was total
dietary fibre (65%) and the exocarp fraction showed appreciable xylose content (123

28
mg per g). The highest content of pectin isolates (13.6%) of high esterification (79%)
with highest viscosity (3.41 dl per g) was found in the mesocarp fraction, the lowest
retention to the phenolic content of isolated pectin (15%) compared to the prepared flour
prior to pectin extraction, and the HPSEC profile suggests the presence of a single
population of polymers with high molar mass.
Chemical composition of passion fruit peel flour (g/100 g dry sample,except for
moisture)
Moisture 9.93 ± 0.12
Ash 7.52 ± 0.02
Protein 4.05 ± 0.61
Lipid Less than 0.10
Soluble fiber 19.20 ± 0.02
Insoluble fiber 38.05 ± 0.02
Carbohydrate 21.28 ± 0.44
4. USED BLACK TEA : In the present study a waste-material, used black tea (UBT),
was apply as an adsorbent. Used black tea is an abundant and low cost natural
adsorbent. The basic constituents which have a considerable influence on taste and color
characteristics of tea include polyphenolic bodies, caffeine, non-caffeine nitrogenous
compounds, pectic substances and minerals. Used black tea is renewable, cheap and
widely available waste.
5. MANGO LEAVES : Mango is a fruit which is indigenous to the Indian subcontinent,
belonging to the genus Mangiferaand family Anacardiaceae. It is native to southern
Asia, especially Burma and eastern India. Mango exists in two races, one from India
and another from the Philippines and Southeast Asia. The Indian race is intolerant of
excess moisture, has flushes of bright red new growth that are subject to mildew, bearing
monoembryonic fruit of high color and regular form. The Philippine race, on the other
hand, is able to tolerate humidity, has pale green or red new growth and resists mildew.
Although there are various Magnifera species being grown many countries, the spesies
Magniferaindica, also known as the Indian Mango or Common Mango, is the only
mango tree commonly cultivated in many tropical and subtropical regions.

29
Mango trees are long-lived evergreen trees that grow 35–40 m tall, with a crown
radius of 10 m. Mango fruits are popular with people around the world due to their sweet
pleasant flavor and essential vitamins and dietary minerals provided such as vitamins
A, B, B6, C, E and K. Mature mango leaves are dark green above and pale below; the
leaves are orange-pink when they are young, rapidly changing to a dark gloss red. The
midrib is pale and conspicuous and the many horizontal veins distinct.
Leaves of different trees are very versatile natured chemical species as these
contain a variety of organic and inorganic compounds. Cellulose, 17 hemicellulose,
pectins and lignin present in the cell wall are the most important sorption sites. The
important feature of these compounds is that they contain hydroxyl, carboxylic,
carbonyl, amino and nitro groups which are important sites for metal sorption .
Pineapple leaves, for instance, which are used in the study of Wenget al. for removal of
methylene blue.
6. TAMARIND FRUIT SHELL: Tamarindus indica fruit shells (TIFSs) are naturally
calcium rich compounds. The fluoride scavenging ability of TIFS carbons was due to
naturally dispersed calcium compounds. Tamarind fruit shells have high ash content and
fixed carbon and very less calorific value and volatile matter but it has long uniform
fibrous lignocellulosic structure i.e they give good mechanical property but fails in
combustion properties.
7. RICE HUSK: The total percentage composition of iron oxide (Fe2O3= 0.95%),
Silicon dioxide (SiO2= 67.30%) and Aluminum Oxide (Al2O3= 4.90%)was found to be
73.15%. Ye et al, reported physical properties of rice husk such as surface area of
438.05m2/g, bulk density of 0.3086 g/cm3 and porosity of 0.38 by fraction. The
chemical composition of rice husk by component analysis has been reported as
34.4%cellulose by weight, 29.3% hemicellulose by weight, 19.2% lignin by weight,
17.1%ash by weight, elemental analysis shows 49.3 % oxygen by weight , 44.6 %
carbon by weight, and 5.6 % hydrogen by weight and by proximate analysis 59.5%
volatiles by weight, 17.1 % ash by weight (composition of mineral ash
SiO2,K2O,MgO,Fe2O3, Al2O3,CaO) and 7.9 % moisture by weight was found. As rice
husk is insoluble in water, having good chemical stability, structural strength due to

30
high silica content so researchers are using it for treating heavy metal from ground water
and surface water.
8. GROUND NUT SHELL: Groundnut botanically known as Arachis hypogeae
belongs to Leguminosae family. Lignocellulosic fibers are constituted by three main
components: hemicellulose, cellulose and lignin, which are known to present very
complex structure. Cellulose, which is the main fraction of the fibers, is a
semicrystalline polysaccharide made up of D-glucosidic bonds. A large amount of
hydroxyl groups in cellulose gives hydrophilic properties to the natural fibers.
Hemicellulose is strongly bound to the cellulose fibrils, presumably by hydrogen bonds.
It consists of polysaccharides of comparatively low molecular weight built up from
hexoses, pentoses and uronic acid residues. Lignin acts as the cementing agent in fiber,
binding the cellulose fibers together. Chemical composition of groundnut shell is
compared with the composition of selected species. The hemi cellulose content of the
fiber was found to be 18.7%, cellulose 35.7%, lignin 30.2% and Ash content 5.9%.
9. EGG SHELL: The chicken egg shell comprises calcified shell and shell membranes
including inner and outer membranes. These membranes retain albumen and prevent
penetration of bacteria. Shell membranes are also essential for the formation of eggshell.
The organic matter of eggshell and shell membranes contain proteins as major
constituents with small amounts of carbohydrates and lipids. Bronsch and Diamantstein
(1965) analyzed uronic acid in eggshells and reported a significant correlation between
the uronic acid content and the breaking strength of the shell. Uronic acid is a constituent
sugar of glycosaminoglycan. We have shown that the organic matter of eggshell
contains two glycosaminoglycans including hyaluronic acid and chondroitin sulfate-
dermatansulfate copolymer. Sialic acid is another carbohydrate found in eggshell
membranes. .However, little is known about the difference in concentrations of sialic
acid between the inner and outer eggshell membranes. There is also limited information
available concerning variations in nitrogen concentrations and amino acid composition
among the organic matter of eggshell and shell membranes. Eggshell and shell
membranes are non-edible by-products with little saleable value. However, they may
contain biologically active compounds.

31
10. USED BLACK TEA POWDER: The main constituents of tea leaves belong to the
polyphenol group accounting for 25 to 35% on a dry weight basis. The polyphenols in
tea mainly include the following six groups of compounds: flavanols, hydroxyl-4-
flavanols, anthocyanins, flavones, flavonols and phenolic acids. Important and
characteristic tea polyphenols are the flavanols of which catechins (flavan-3-ols) are
pre- dominant and the major ones are: (-)-epicatechin (EC), (-)-epicatechin gallate
(ECG), (-)epigallocatechin (EGC), (-)-epigallocatechin gallate (EGCG), (+)-catechin
(C), and (+)-gallocatechin (GC). These compounds contribute to the bitterness,
astringency and sweet aftertaste of tea beverages. Tea contains also favonols, mainly
quercetin, kaempferol, myrecetin, and their glycosides. In black tea, the oxidation of
polyphenols during processing leads to the formation of catechins and gallic acid
complexes such as theaflavins, theaflavinic acids, thearubigins or theasinensis, and of
proanthocyanidin polymers theobromine.
Tea contains many amino acids, but theanine, specific to the tea plant, is the most
abundant, accounting for 50% of the total amino acids. Amino acid degradation is
involved in the biogenesis of the tea aroma. Chlorophyll, carotenoids, lipids and volatile
compounds are not major constituents in a tea brew but they also play an important role
in the development of the aroma Volatile fractions of tea leaves have been studied in
detail and more than 600 different molecules have been isolated. These include
terpenoids and degradation products of amino acids, carotenoids and linoleic acid. Tea
also contains carbohydrates, vitamins E, K, A, low levels of B vitamins and vitamin C
(in green tea only). Tea also provides useful amounts of potassium, manganese and
fluoride ions to the diet.

32
Chapter III
EXPERIMENTAL
3.1. MATERIALS AND METHODS
Five different dyes namely Crystal violet, Methylene blue, Malachite green,
Congo red and Eosin Yellow were obtained from Nice Chemicals, Kerala and Qualigen
Fine Chemicals, Mumbai. The stock solution of these dyes was prepared in distilled
water.
Four chemicals namely potassium dichromate, copper sulphate, cobalt nitrate
and nickel sulphate were used in order to analyze the adsorption of Cr, Cu, Co and Ni
respectively. The stock solutions of these metals were prepared in distilled water.
The adsorbents, Potato peel, Pome granate peel, Egg shell, Passion fruit peel,
Saw dust, Mango leaves, Ground nut shell, Used black tea, Rice husk and Tamarind
shell were collected and washed with distilled water. They were dried in sunlight,
powdered and sieved. The adsorbents were characterized by IR spectroscopy and
Scanning Electron Microscopy.
3.2. Batch experiments (Dye adsorption)
Dye adsorption experiments were performed by taking 50 ml stock solution of
dye (500 mg /l). The variables studied were agitation time, adsorbent dose and
concentration. After desired time of treatment samples were filtered to remove the
adsorbent and progress of adsorption was determined spectrophotometrically using
Photocolorimeter (Systronic) at the wavelength for maximum absorbance (λmax) which
are 595nm, 661nm, 621 nm, 515-518nm and 497nm for crystal violet, methylene blue,
malachite green, eosin yellow and congo red respectively. A blank was also carried out.
3.2. Batch experiments (Heavy Metal adsorption)
Adsorption experiments were conducted in which aliquots of dye solution with
known concentrations were introduced into iodine flasks (250 cm3) containing
accurately weighed amounts of the absorbent. The bottles were shaken at room
temperature using a shaker for a prescribed length of time to obtain equilibrium. The
adsorbent was then removed by filtration. The equilibrium concentrations of metals
33
were determined by a Photocolorimeter (Systronic) at the wavelength for maximum
absorbance (λmax) which are 590, 445,500 and 540nm for Cu, Ni, Co and Cr
respectively. A blank was also carried out.
3.2.1. Effect of adsorbent dose
The study was carried out with different dose of adsorbent of 400 µm average particle
size ie; 0.5, 1.0, 1.5, 2.0 and 2.5 g. The concentrations of samples were 100mg/L and
treated at room temperature for one hour.
3.2.2. Effect of agitation time
The experiments were carried out by taking 50 ml samples of dyes (concentration
100 mg/L) in separate flasks and treated with 0.05g of adsorbent dose at room
temperature and was shaken well in an automatic shaker. The time period was varied
from 10 min to 60minutes and after each 10min, adsorbent was removed by filtration
and absorbance of the filtrate was measured.
3.2.3. Effect of concentration:
The samples were treated with constant dose of adsorbent (50mg) for one hour
at room temperature. The concentrations of the adsorbate were 25, 50, 75, 100,125 and
150 mg/L.
3.2.4. Adsorption Isotherm
Batch adsorption experiments were carried out in a shaker using 250ml-shaking
flasks at room temperature for 60 min. The adsorbent (0.5 g) was thoroughly mixed with
50 mL of dyes solutions. The isotherm studies were performed by varying the initial
dyes concentrations from 25 to 150 mg/L. After shaking the flasks for 60 min, the
reaction mixture was analyzed for the residual dyes concentration.
3.2.5. Kinetics studies
Adsorption studies were conducted in 250-mL Iodine flasks and was thoroughly
mixed individually with 50mL of dyes solution (100 and 125 mg/L) and the suspensions
were shaken at room temperature. Samples were collected from the flasks at required
time intervals viz.10, 20,30,40,50, and 60 min by filtration. The clear solutions were
analyzed for residual dyes concentration in the solutions photometrically.

34
Chapter IV
RESULTS AND DISCUSSION
4.1. Potato peel as low cost adsorbent
Adsorption of dye, methylene blue (MB), malachite green (MG) and crystal
violet (CV) which are cationic in nature, were studied on poato peel as a functional of
amount of adsorbent, agitation time and concentration of adsorbate.
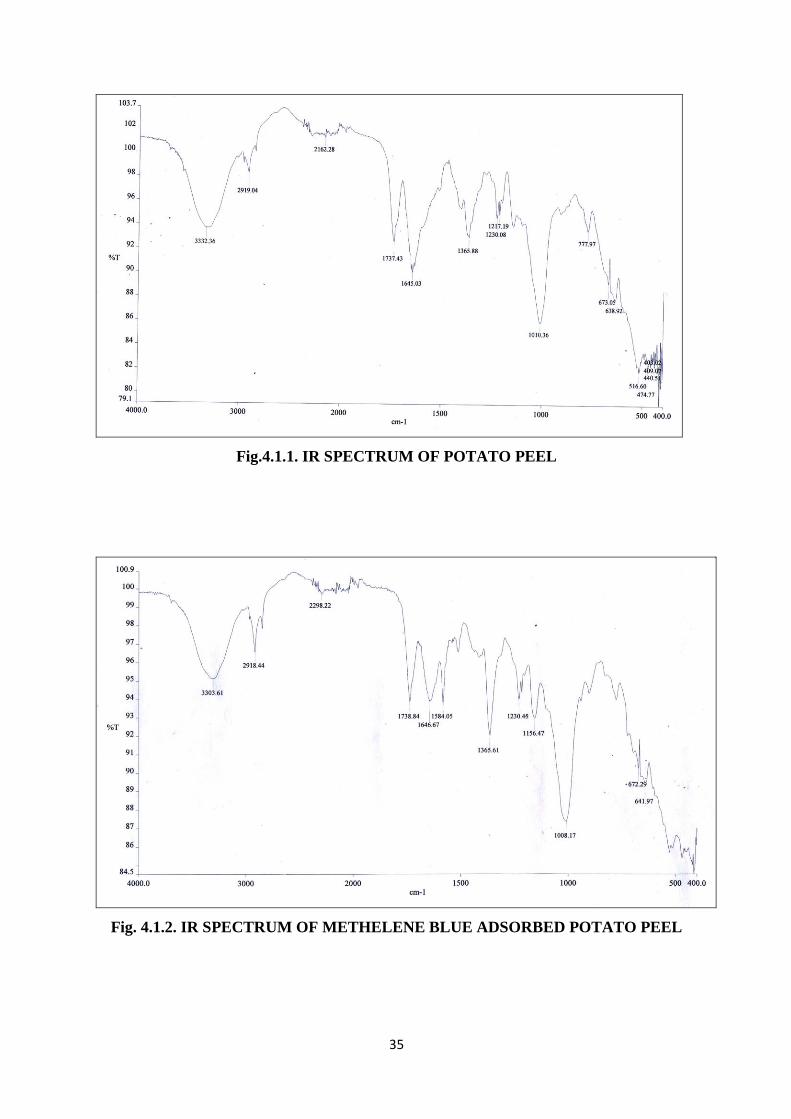
4.1.1. IR-characterization of the adsorbent
In order to gain better insight into the surface functional groups available on the
surface of the different investigated adsorbents, the IR spectra of adsorbent before and
after adsorption of dye were recorded as shown in Figs. 4.1.1-4.1.4. Potato peel IR
spectrum showed four intense bands, at 3332.1, 1737, 1645 and 1010.2 cm-1. The band
at 3332.1 cm-1 was attributed to the surface hydroxyl groups and chemisorbed water.
An examination of the adsorbent before and after sorption reaction possibly
provides information regarding the surface a group that might have participated in the
adsorption reaction and also indicates the surface sites on which adsorption has taken
place.
Both spectra show the O-H stretching region at around 3300cm-1. However, a
new band at 1584cm-1, which corresponds to the MG and MB and one at 1738 for CV
confirms dye adsorption onto the potato peel. The maximum wavelengths (λmax) and
extinction coefficients (ε) of prepared dye solutions are given in Table 4.1. 1.
Table.4.1.1. Characterization of dyes
Dye CAS
No
Colour
index
No.
F.W.
(gmol-1)
λmax
(nm)
ε
(dm3/mol.
cm)
Methylene
Blue
61-73-4 52015 319.85 661 73044
Malachite
Green
569-64-2 42000
364.92 620 145603
Crystal Violet 548-62-9 42555 407.911 590 87000
35
Fig.4.1.1. IR SPECTRUM OF POTATO PEEL
Fig. 4.1.2. IR SPECTRUM OF METHELENE BLUE ADSORBED POTATO PEEL

36
Fig. 4.1.3. IR SPECTRUM OF MALACHITE GREEN ADSORBED POTATO PEEL
Fig 4.1.4. IR SPECTRUM OF CRYSTAL VIOLET ADSORBED POTATO PEEL
37
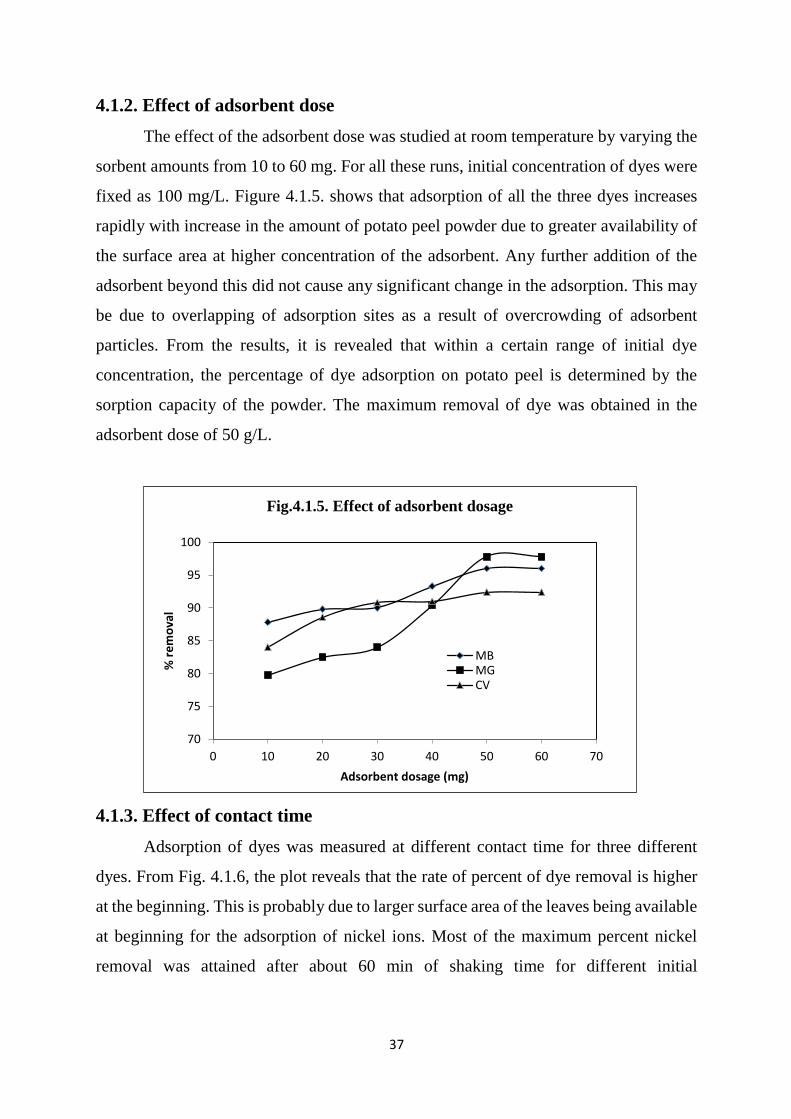
4.1.2. Effect of adsorbent dose
The effect of the adsorbent dose was studied at room temperature by varying the
sorbent amounts from 10 to 60 mg. For all these runs, initial concentration of dyes were
fixed as 100 mg/L. Figure 4.1.5. shows that adsorption of all the three dyes increases
rapidly with increase in the amount of potato peel powder due to greater availability of
the surface area at higher concentration of the adsorbent. Any further addition of the
adsorbent beyond this did not cause any significant change in the adsorption. This may
be due to overlapping of adsorption sites as a result of overcrowding of adsorbent
particles. From the results, it is revealed that within a certain range of initial dye
concentration, the percentage of dye adsorption on potato peel is determined by the
sorption capacity of the powder. The maximum removal of dye was obtained in the
adsorbent dose of 50 g/L.
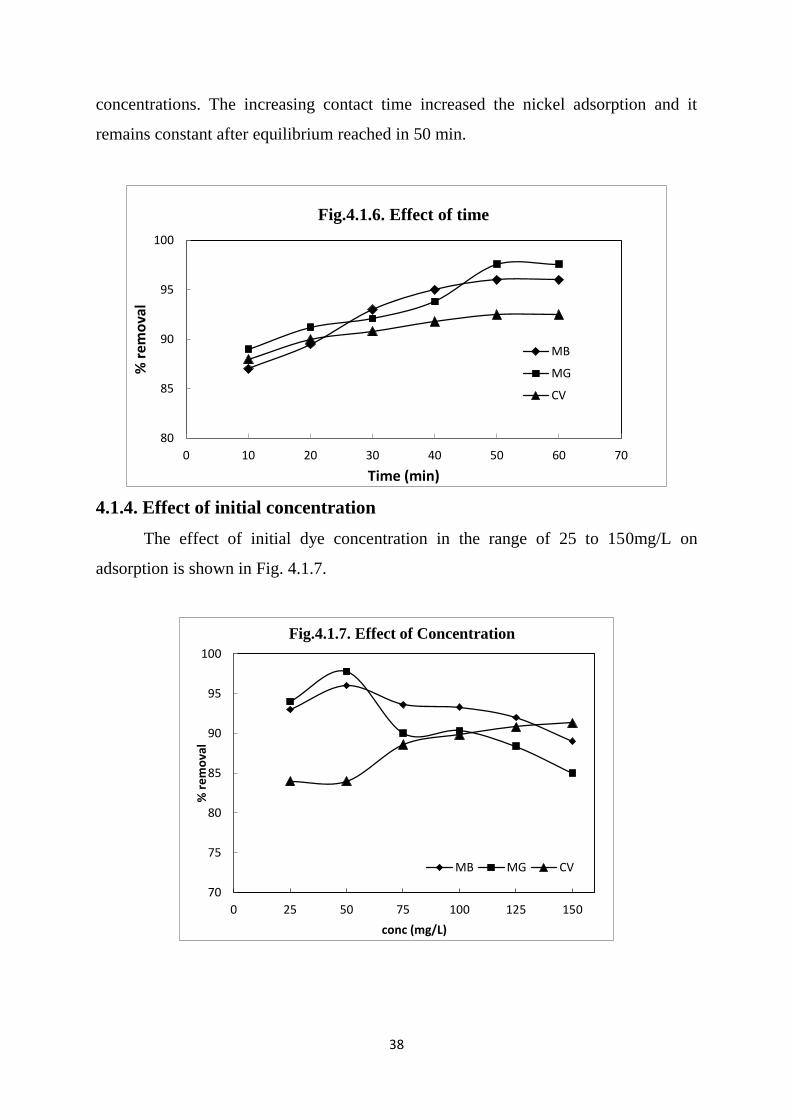
4.1.3. Effect of contact time
Adsorption of dyes was measured at different contact time for three different
dyes. From Fig. 4.1.6, the plot reveals that the rate of percent of dye removal is higher
at the beginning. This is probably due to larger surface area of the leaves being available
at beginning for the adsorption of nickel ions. Most of the maximum percent nickel
removal was attained after about 60 min of shaking time for different initial
70
75
80
85
90
95
100
0 10 20 30 40 50 60 70
% r
em
ova
l
Adsorbent dosage (mg)
Fig.4.1.5. Effect of adsorbent dosage
MBMGCV
38
concentrations. The increasing contact time increased the nickel adsorption and it
remains constant after equilibrium reached in 50 min.
4.1.4. Effect of initial concentration
The effect of initial dye concentration in the range of 25 to 150mg/L on
adsorption is shown in Fig. 4.1.7.
80
85
90
95
100
0 10 20 30 40 50 60 70
% r
emo
val
Time (min)
Fig.4.1.6. Effect of time
MB
MG
CV
70
75
80
85
90
95
100
0 25 50 75 100 125 150
% r
em
ova
l
conc (mg/L)
Fig.4.1.7. Effect of Concentration
MB MG CV

39
It is seen that the removal of dye was dependent on the concentration of dye as
the increase in the initial concentration increased the amount of dye removed
upto50mg/L for methylene blue and malachite green and then the % removal decreased.
In the case of crystal violet it goes on increasing with the increase in initial
concentration. The results indicate that potato peel adsorbs the largest quantity of
malachite green followed by methylene blue and crystal violet respectively.
4.1.5. Isotherm data analysis
The parameters obtained from the different models provide important
information on the adsorption mechanisms and the surface properties and affinities of
the adsorbent. The most widely accepted surface adsorption models for single-solute
systems are the Langmuir and Freundlich models. The correlation with the amount of
adsorption and the liquid-phase concentration was tested with the Langmuir and
Freundlich isotherm equations.
2.8
2.9
3
3.1
3.2
3.3
3.4
3.5
3.6
0.1761 0.204 1 1.161 1.161
log
qe
logCe
Fig. 4.1.8. Freundlisch Adsorption Isotherm of MG

40
1.5
2
2.5
3
3.5
4
4.5
0.5 0.6 0.7 0.8 0.9 1 1.1 1.2 1.3
log
qe
logCe
Fig. 4.1.9. Freundilich adsorption isotherm for crystal violet
0
0.1
0.2
0.3
0.4
0.5
0.6
0.7
0.8
0.9
1
0 0.1 0.2 0.3 0.4 0.5 0.6 0.7 0.8 0.9 1
log
qe
logCe
Fig.4.1.10.Freundlisch Adsorption Isotherm of MB
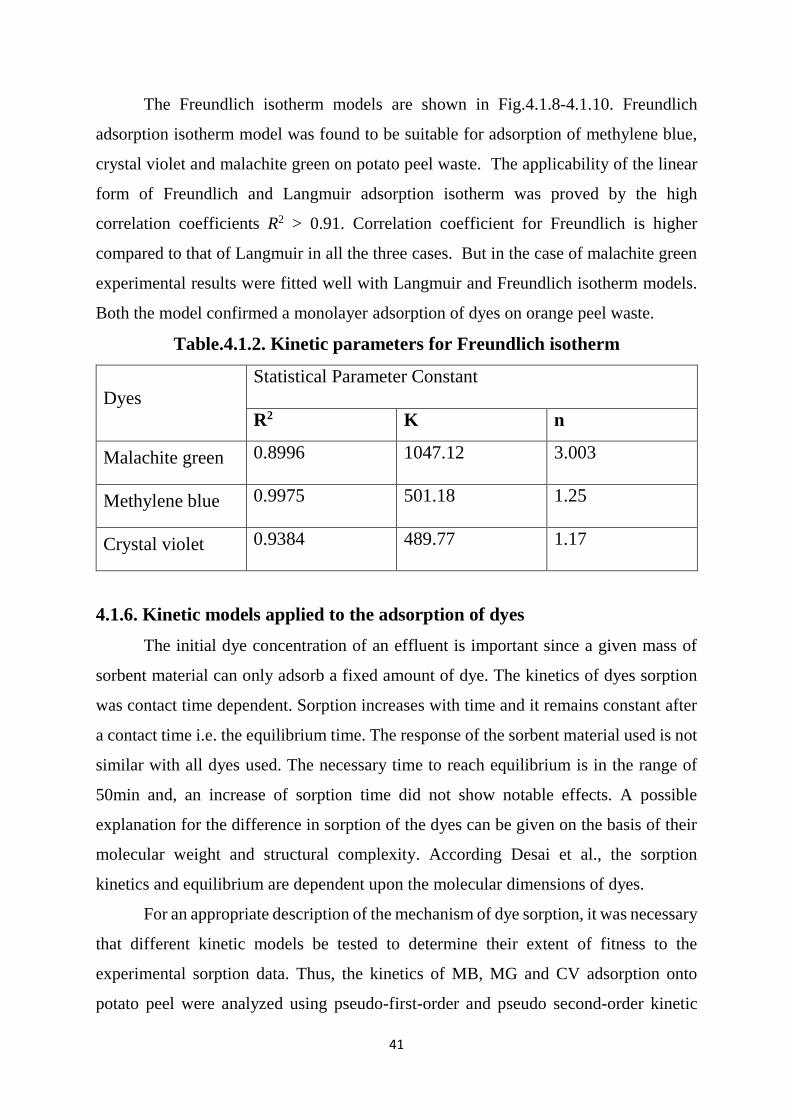
41
The Freundlich isotherm models are shown in Fig.4.1.8-4.1.10. Freundlich
adsorption isotherm model was found to be suitable for adsorption of methylene blue,
crystal violet and malachite green on potato peel waste. The applicability of the linear
form of Freundlich and Langmuir adsorption isotherm was proved by the high
correlation coefficients R2 > 0.91. Correlation coefficient for Freundlich is higher
compared to that of Langmuir in all the three cases. But in the case of malachite green
experimental results were fitted well with Langmuir and Freundlich isotherm models.
Both the model confirmed a monolayer adsorption of dyes on orange peel waste.
Table.4.1.2. Kinetic parameters for Freundlich isotherm
Dyes
Statistical Parameter Constant
R2 K n
Malachite green 0.8996 1047.12 3.003
Methylene blue 0.9975 501.18 1.25
Crystal violet 0.9384 489.77 1.17
4.1.6. Kinetic models applied to the adsorption of dyes
The initial dye concentration of an effluent is important since a given mass of
sorbent material can only adsorb a fixed amount of dye. The kinetics of dyes sorption
was contact time dependent. Sorption increases with time and it remains constant after
a contact time i.e. the equilibrium time. The response of the sorbent material used is not
similar with all dyes used. The necessary time to reach equilibrium is in the range of
50min and, an increase of sorption time did not show notable effects. A possible
explanation for the difference in sorption of the dyes can be given on the basis of their
molecular weight and structural complexity. According Desai et al., the sorption
kinetics and equilibrium are dependent upon the molecular dimensions of dyes.
For an appropriate description of the mechanism of dye sorption, it was necessary
that different kinetic models be tested to determine their extent of fitness to the
experimental sorption data. Thus, the kinetics of MB, MG and CV adsorption onto
potato peel were analyzed using pseudo-first-order and pseudo second-order kinetic

42
models. The conformity between experimental data and the model-predicted values was
expressed by the correlation coefficients (R2, values close or equal to 1). The relatively
higher value is the more applicable model to the kinetics of dye adsorption onto potato
peel.
Table.3. presents the values of the linear coefficient of determination (R2) values of the
different kinetic models used to evaluate the sorption of dyes onto the potato peel.
Examination of Table.4.1.3. shows that the pseudo-second order kinetic equation had
the highest R2 values. Thus this kinetic model was taken as the best fit equation for the
description of the mechanism of sorption of dyes.
Table.4.1.3. The rate constant for Pseudo-second order adsorption
Dyes K qe R2
Malachite green 2.90 4358.9 0.9991
Methylene Blue 3.479 1916 0.9963
Crystal violet 2.77 3333 0.9943
0
0.01
0.02
0.03
0.04
0.05
0.06
0.07
0.08
10 20 30 40 50 60
t/q
t
Time (min)
Fig.4.1.11. Pseudo-second order kinetics
CV
MG
MB

43
In addition, examination of the sorption capacity values (qe) of the pseudo second
order model shows that the values were in the same range as the experimental sorption
capacity values. Therefore, the sorption of dyes from aqueous solution onto the potato
peel waste adsorbents was found to follow the pseudo-second order kinetic equation.
Furthermore, the pseudo-second order is based on the assumption that sorption follows
a second order mechanism, with chemisorption as the rate limiting step. So the rate of
occupation of adsorption sites is proportional to the square of number of unoccupied
sites.
4.2. Pomegranate Peel as Low cost adsorbent
4.2.1. IR-characterisation of the adsorbent
In order to gain better insight into the surface functional groups available on the surface
of the different investigated adsorbents, the IR spectra of adsorbent before and after
adsorption of dye were recorded. The IR spectrum of pomegranate peel shows peaks at
3288.01, 2918.11 and 2849.67 cm-1 which refers to group (-OH), identical alkyl group(-
CH2-) and aldehyde group (-CHO), respectively. Also, the spectrum shows bands at
1717.77 and 1016.60 cm-1 were to be the presence of (C=C) and (C-O), respectively.
The surface IR-characterization of pome granate peel indicated the presence of many
functional groups which were able to bind with the cationic dyes. The band at
3288.01cm-1 was attributed to the surface hydroxyl groups and chemisorbed water.
An examination of the adsorbent before and after sorption reaction possibly
provides information regarding the surface a group that might have participated in the
adsorption reaction and also indicates the surface sites on which adsorption has takes
place. It was found that the spectra of treated sorbents did not differ significantly from
the spectrum of the ‘‘parent” (untreated) material, suggesting that the treatment
procedures did not change substantially the peel structure.
4.2.2. Effect of adsorbent dose
The effect of adsorbent dose was also investigated for the removal of dyes from
aqueous solution. The experiments were carried out with adsorbent dose varied from 10
to 60 mg with keeping other parameters are constant. The removal of dyes was found to

44
be 82-89%, 84-88.2% and 89-92.8% in case of malachite green, methylene blue and
crystal violet respectively (Figure.4.2.1.). The increase in removal of dyes with
adsorbent dose is due to the introduction of more binding sites for adsorption.
The peel consists mainly of cellulose and lignin. Numerous hydroxyl groups in
the molecules of these compounds represent main active sites for binding of ionic
compounds, usually by an ion-exchange mechanism. However, some other binding
mechanisms may occur on the peel sorbents, such as hydrogen bonding or hydrophobic
interactions on the non-polar moieties of the peel matrix.
Peel is effective for removal of dye ions from water because of its high content
of polyhydroxy polyphenolic groups that are capable of chelating dye ions. In addition,
peel contains carboxylic groups, which can bind dye ions by ion- exchange mechanisms.
4.2.3. Effect of Shaking Time
The time-dependent behaviour of dye adsorption was examined by varying the
contact time between adsorbate and adsorbent in the range of 10-60 min. The
concentrations of dyes were kept as 200mg/L while the amount of adsorbents added was
0.06 g. The dyes remaining plotted at a function of contact time (Figure. 4.2.2.) showed
that the equilibrium between dyes and the adsorbents was attained within 40 min.
Therefore, a 40 min shaking time was found to be appropriate for maximum adsorption
and was used in all subsequent experiments. The removal of direct dyes by adsorption
80
82
84
86
88
90
92
94
0 20 40 60 80
% r
em
oval
Adsorbent dosage (mg)
Fig. 4.2.1. Effect of adsorbent dosage
methylene blue
malachite green
crystal violet

45
increased with time and attained a maximum value in 40 min and thereafter it remained
constant for all the concentrations studied.
4.2.4. Effect of initial concentration
The effect of concentration of dyes (50 to 300 mg/L) has been also tested with
constant dose of adsorbent. The removal of dyes increased first from 83.5 to 87.5% in
case of MB, 78.5 to 82.5 in case of CV and 85.75 to 92.8% in case of MG, reached a
maximum value and remains constant(Fig.4.2.3). The results indicated that the
adsorption of dyes is much dependent on concentration of solution.
78
80
82
84
86
88
90
92
94
0 20 40 60 80
% r
em
oval
Time (min)
Fig.4.2.2. Effect of Time
methylene blue
malachite green
crystal violet
40
50
60
70
80
90
100
0 50 100 150 200 250 300 350
% r
em
oval
Conc (mg/L)
Fig. 4.2.3. Effect of concentration
methylene blue
malachite green
crystal violet

46
4.2.5. Isotherm data analysis
The parameters obtained from the different isotherm models provide important
information on the adsorption mechanisms and the surface properties and affinities of
the adsorbent. The most widely accepted surface adsorption models for single-solute
systems are the Langmuir and Freundlich models. Langmuir and Freundlich isotherms
are used for fitting the experimental data in adsorption studies to understand the extent
and degree of favorability of adsorption. According to the obtained data for the model
parameters it is obvious that Freundlich equilibrium model is favourable. Taking into
consideration the values of the coefficient of correlation as criteria for goodness of fit,
for most investigated Systems the Freundlich equation gives a better correlation
between the theoretical and experimental data for the whole concentration range when
compared with Langmuir equations.
The Freundlich constant, n also indicates the degree of favorability of adsorption.
The Freundlich constant, n have values lying in the range of 1 to 10 for classification as
favorable adsorption A smaller value of (1/n) indicates a stronger bond between
adsorbate and adsorbent while a higher value for k indicates rate of adsorbate removal
is high. Hence it should be noted that the Isotherm constants are important in
understanding the adsorption mechanism and their subsequent application for prediction
of some important design paramaters.
Table.4.2.1. Kinetic parameters for Freundlich isotherm
Dyes Statistical Parameter Constant
R2 K n
Malachite green 0.8839 158.48 1.5
Methylene blue 0.9851 177.82 1.8
Crystal violet 0.9544 178.27 1.9
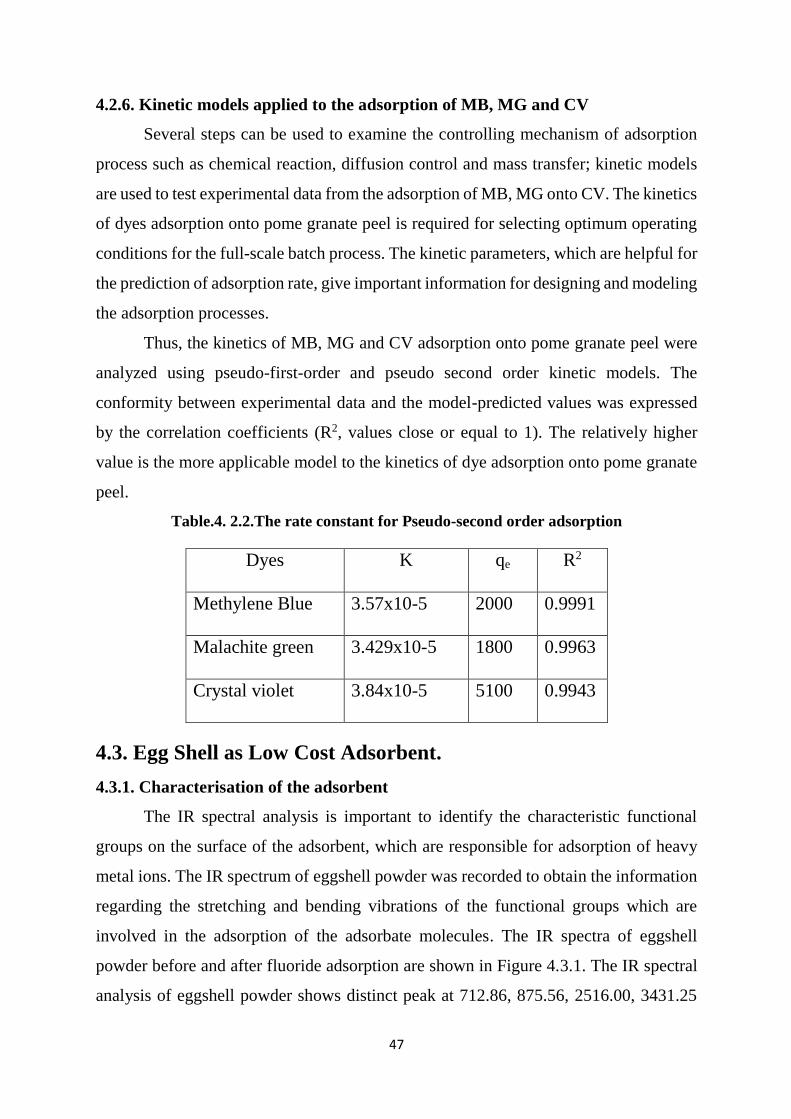
47
4.2.6. Kinetic models applied to the adsorption of MB, MG and CV
Several steps can be used to examine the controlling mechanism of adsorption
process such as chemical reaction, diffusion control and mass transfer; kinetic models
are used to test experimental data from the adsorption of MB, MG onto CV. The kinetics
of dyes adsorption onto pome granate peel is required for selecting optimum operating
conditions for the full-scale batch process. The kinetic parameters, which are helpful for
the prediction of adsorption rate, give important information for designing and modeling
the adsorption processes.
Thus, the kinetics of MB, MG and CV adsorption onto pome granate peel were
analyzed using pseudo-first-order and pseudo second order kinetic models. The
conformity between experimental data and the model-predicted values was expressed
by the correlation coefficients (R2, values close or equal to 1). The relatively higher
value is the more applicable model to the kinetics of dye adsorption onto pome granate
peel.
Table.4. 2.2.The rate constant for Pseudo-second order adsorption
Dyes K qe R2
Methylene Blue 3.57x10⁻⁵ 2000 0.9991
Malachite green 3.429x10⁻⁵ 1800 0.9963
Crystal violet 3.84x10⁻⁵ 5100 0.9943
4.3. Egg Shell as Low Cost Adsorbent.
4.3.1. Characterisation of the adsorbent
The IR spectral analysis is important to identify the characteristic functional
groups on the surface of the adsorbent, which are responsible for adsorption of heavy
metal ions. The IR spectrum of eggshell powder was recorded to obtain the information
regarding the stretching and bending vibrations of the functional groups which are
involved in the adsorption of the adsorbate molecules. The IR spectra of eggshell
powder before and after fluoride adsorption are shown in Figure 4.3.1. The IR spectral
analysis of eggshell powder shows distinct peak at 712.86, 875.56, 2516.00, 3431.25

48
cm.-1The peak observed at 3431.25 and 2516.00 cm-1 may be assigned to the presence
of alcohol hydroxyl group (-OH) and acidic hydrogen group (-OH) stretching
respectively. This result suggests that fluoride interacts with metal oxides and -OH
functional group present in eggshell powder. The spectrum also shows some peaks
positioned at 1648, 1528, 1308 and 1168 cm-1. The bands at 1648 and 1528 cm-1 reflect
the carbonyl group stretching (amide) and N–H bending respectively. Bands at 1308.03
and 1168.70 cm-1correspond to C–H bending and C–O stretching respectively.
Wave number (cm-1)
Fig.4.3.1. IR Spectrum of egg shell powder
SEM analysis is another useful tool for the analysis of the surface morphology
of an adsorbent. The porous and irregular surface structure of the adsorbent can be
clearly observed in SEM images shown in Figure 4.3.2.
Fig.4.3.2. SEM of Egg shell powder
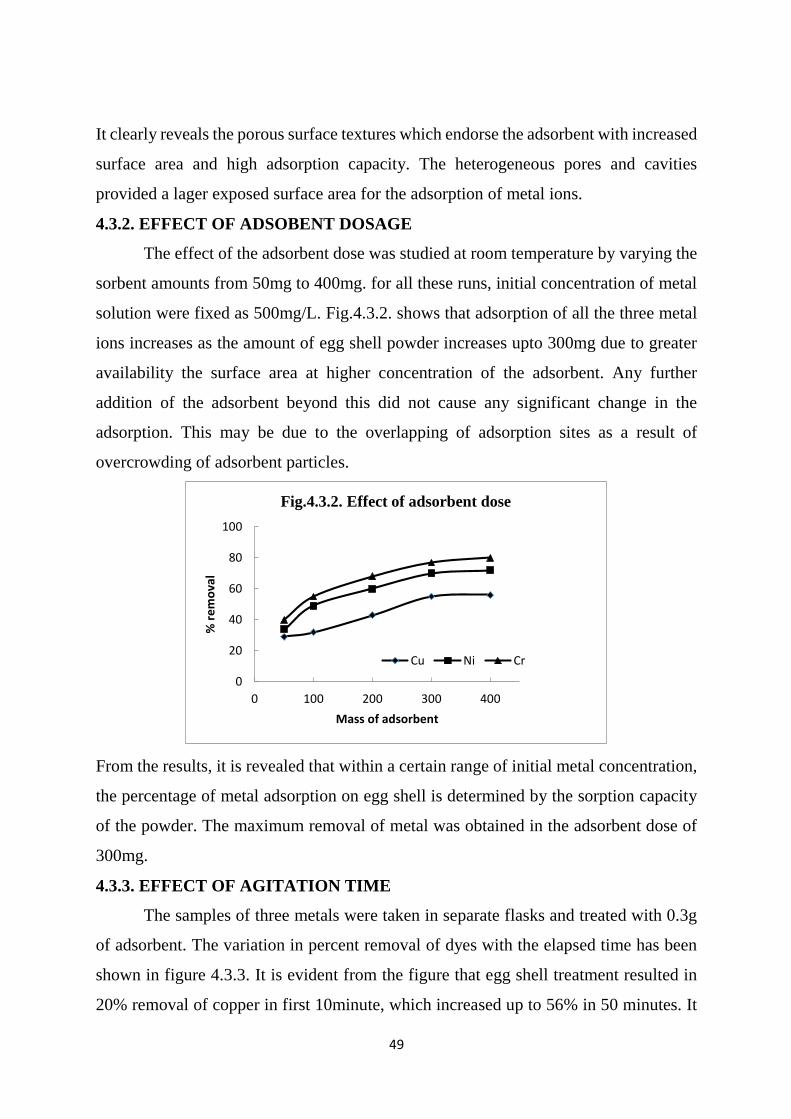
49
It clearly reveals the porous surface textures which endorse the adsorbent with increased
surface area and high adsorption capacity. The heterogeneous pores and cavities
provided a lager exposed surface area for the adsorption of metal ions.
4.3.2. EFFECT OF ADSOBENT DOSAGE
The effect of the adsorbent dose was studied at room temperature by varying the
sorbent amounts from 50mg to 400mg. for all these runs, initial concentration of metal
solution were fixed as 500mg/L. Fig.4.3.2. shows that adsorption of all the three metal
ions increases as the amount of egg shell powder increases upto 300mg due to greater
availability the surface area at higher concentration of the adsorbent. Any further
addition of the adsorbent beyond this did not cause any significant change in the
adsorption. This may be due to the overlapping of adsorption sites as a result of
overcrowding of adsorbent particles.
From the results, it is revealed that within a certain range of initial metal concentration,
the percentage of metal adsorption on egg shell is determined by the sorption capacity
of the powder. The maximum removal of metal was obtained in the adsorbent dose of
300mg.
4.3.3. EFFECT OF AGITATION TIME
The samples of three metals were taken in separate flasks and treated with 0.3g
of adsorbent. The variation in percent removal of dyes with the elapsed time has been
shown in figure 4.3.3. It is evident from the figure that egg shell treatment resulted in
20% removal of copper in first 10minute, which increased up to 56% in 50 minutes. It
0
20
40
60
80
100
0 100 200 300 400
% r
em
ova
l
Mass of adsorbent
Fig.4.3.2. Effect of adsorbent dose
Cu Ni Cr

50
also shows that the percent removal of nickel and chromium are45% and 38% in 10
minutes, which increased up to 72% and 80% in 40 minutes respectively for both the
metals. The optimum time is 40 minutes for both the metals at which equilibrium is
obtained. The increase in the extend of removal of metals with increasing time because
adsorbate generally formed monolayer on the surface of adsorbent. Thus the removal of
metals from aqueous solution is controlled by the rate of transport of the adsorbate
species from the outer sites to the interior sites of adsorbent.
4.3.4. EFFECT OF INITIAL CONCENTRATION
The effects of concentration of metals100 to 500ppm have been also tested with
constant dose of adsorbent.
0
20
40
60
80
100
0 10 20 30 40 50 60 70
% r
em
ova
l
Time (min)
Fig.4.3.3. Effect of contact time
Cu Ni Cr
0
10
20
30
40
50
60
70
80
90
0 100 200 300 400 500 600
% r
em
val
Conc
Fig.4.3.4. Effect of initial concentration
Cu Ni Cr

51
The removal of metals increased from 15 to 43% in case copper. 22 to 48% in
case of nickel and 35 to 61% in case of chromium. The results indicated that the
adsorptions of metals are much dependent on concentration of solution.
4.3.5. Isotherm data analysis
2
2.2
2.4
2.6
2.8
3
3.2
3.4
1.7 1.8 1.9 2 2.1 2.2 2.3 2.4
log
x/m
log Ce
Fig.4.3.5. Freundlich Isotherm of Copper
2
2.2
2.4
2.6
2.8
3
3.2
3.4
1.8 1.85 1.9 1.95 2 2.05 2.1 2.15 2.2
logx
/m
log Ce
Fig.4.3.6. Freundlich Isotherm of Nickel
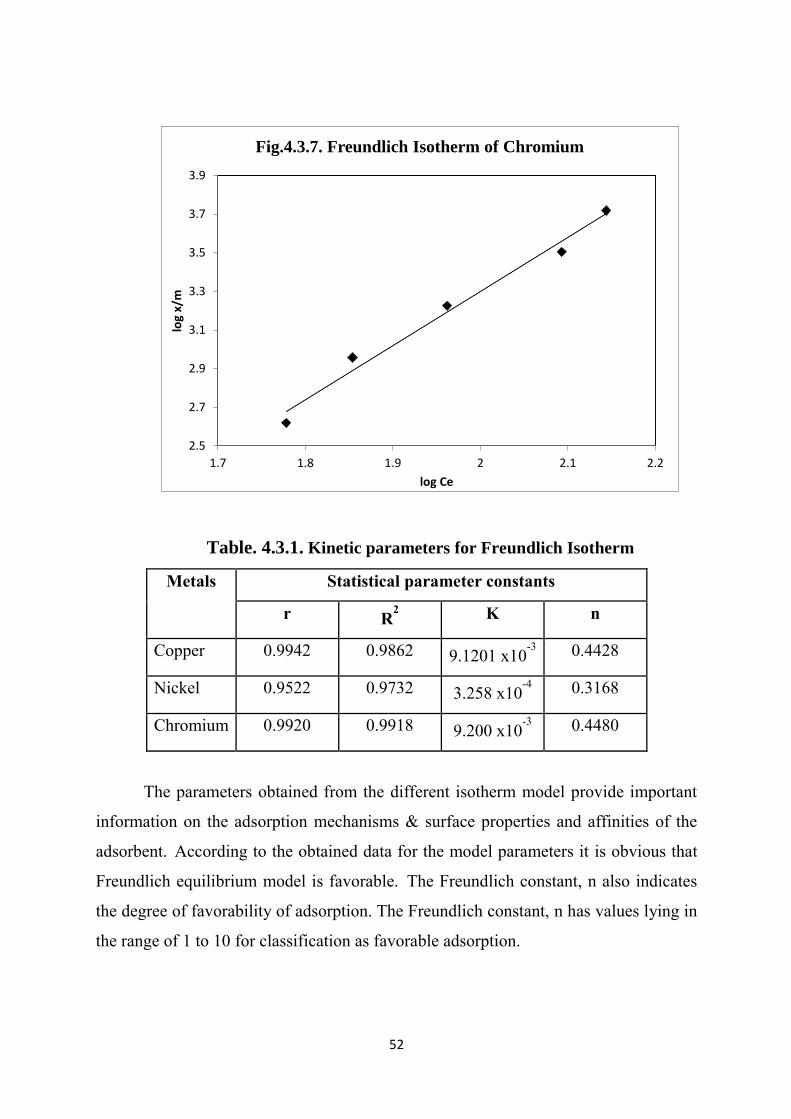
52
Table. 4.3.1. Kinetic parameters for Freundlich Isotherm
Metals Statistical parameter constants
r R2 K n
Copper 0.9942 0.9862 9.1201 x10⁻³ 0.4428
Nickel 0.9522 0.9732 3.258 x10⁻⁴ 0.3168
Chromium 0.9920 0.9918 9.200 x10⁻³ 0.4480
The parameters obtained from the different isotherm model provide important
information on the adsorption mechanisms & surface properties and affinities of the
adsorbent. According to the obtained data for the model parameters it is obvious that
Freundlich equilibrium model is favorable. The Freundlich constant, n also indicates
the degree of favorability of adsorption. The Freundlich constant, n has values lying in
the range of 1 to 10 for classification as favorable adsorption.
2.5
2.7
2.9
3.1
3.3
3.5
3.7
3.9
1.7 1.8 1.9 2 2.1 2.2
log
x/m
log Ce
Fig.4.3.7. Freundlich Isotherm of Chromium

53
4.3.6. Kinetic models applied to the adsorption of metals
0.04
0.06
0.08
0.1
0.12
0 10 20 30 40 50 60 70
t/q
t
Time (min)
Fig.4.3.8.Pseudo-second order kinetics of Cu
0.03
0.04
0.05
0.06
0.07
0.08
0.09
0.1
0 10 20 30 40 50 60 70
t/q
t
Time (min)
Fig.4.3.9.Pseudo-second order kinetics of Ni

54
Table.4.3.2. Pseudo-second order parameters
Metals
Statistical parameter constants
r R2 qe kad (x10-5)
Copper 0.9752 0.9510 900.00 2.77
Nickel 0.9883 0.9760 970.87 3.325
Chromium 0.9928 0.9850 1143.17 9.588
The kinetics of Cu, Ni and Cr adsorption onto egg shell powder were analyzed
using pseudo-first-order and pseudo second order kinetic models. The conformity
between experimental data and the model-predicted values was expressed by the
correlation coefficients (R2, values close or equal to 1). The relatively higher value is
the more applicable model to the kinetics of dye adsorption onto egg shell powder.
4.4. Passion Fruit Peel as Low Cost Adsorbent
4.4.1. Characterisation of the adsorbent
In order to gain better insight into the surface functional groups available on the
surface of the different investigated adsorbents, the IR spectra of adsorbent before and
after adsorption of dye were recorded as shown in Figs.4. 1-4. The IR spectrum of
0.02
0.04
0.06
0.08
0.1
0 10 20 30 40 50 60 70
t/q
t
Time (min)
Fig.4.3.10. Pseudo-second order kinetics of Cr

55
passion fruit peel shows peaks at 3319.21 and 2918.09 cm-1 which refers to (-OH) and
identical alkyl group(-CH2-) respectively.
Fig.4.4.1. IR Spectrum of passion fruit peel
Also, the spectrum shows bands at 1736.71 and 1013.07 cm-1 were to be the
presence of (C-O) and (-OH), respectively. The band at 3319.21cm-1 was attributed to
the surface hydroxyl groups and chemisorbed water. An examination of the adsorbent
before and after sorption reaction possibly provides information regarding the surface.
We can find a group that might have participated in the adsorption reaction and also
indicates the surface sites on which adsorption has takes place. After the adsorption of
dyes, there is a shift in the peak at 3319.21cm-1 and the band at 1736.71cm-1 disappears.
Fig.4.4.2. IR Spectrum of EY adsorbed passion fruit peel
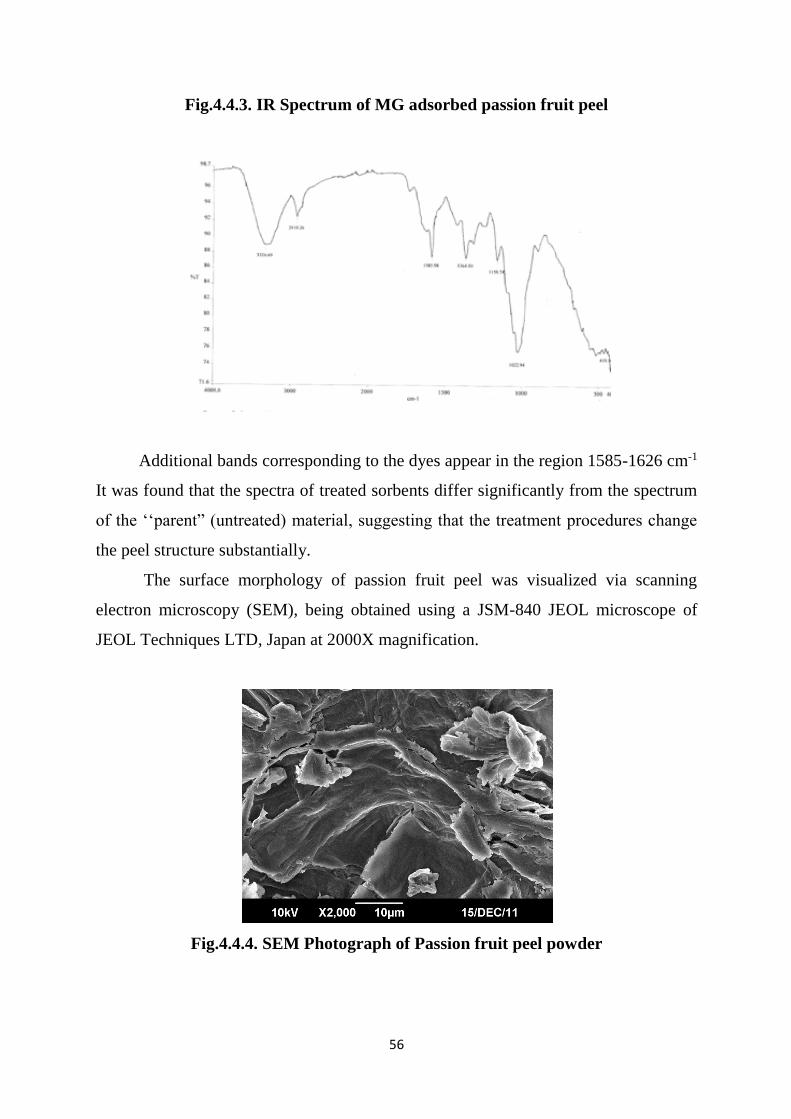
56
Fig.4.4.3. IR Spectrum of MG adsorbed passion fruit peel
Additional bands corresponding to the dyes appear in the region 1585-1626 cm-1
It was found that the spectra of treated sorbents differ significantly from the spectrum
of the ‘‘parent” (untreated) material, suggesting that the treatment procedures change
the peel structure substantially.
The surface morphology of passion fruit peel was visualized via scanning
electron microscopy (SEM), being obtained using a JSM-840 JEOL microscope of
JEOL Techniques LTD, Japan at 2000X magnification.
Fig.4.4.4. SEM Photograph of Passion fruit peel powder
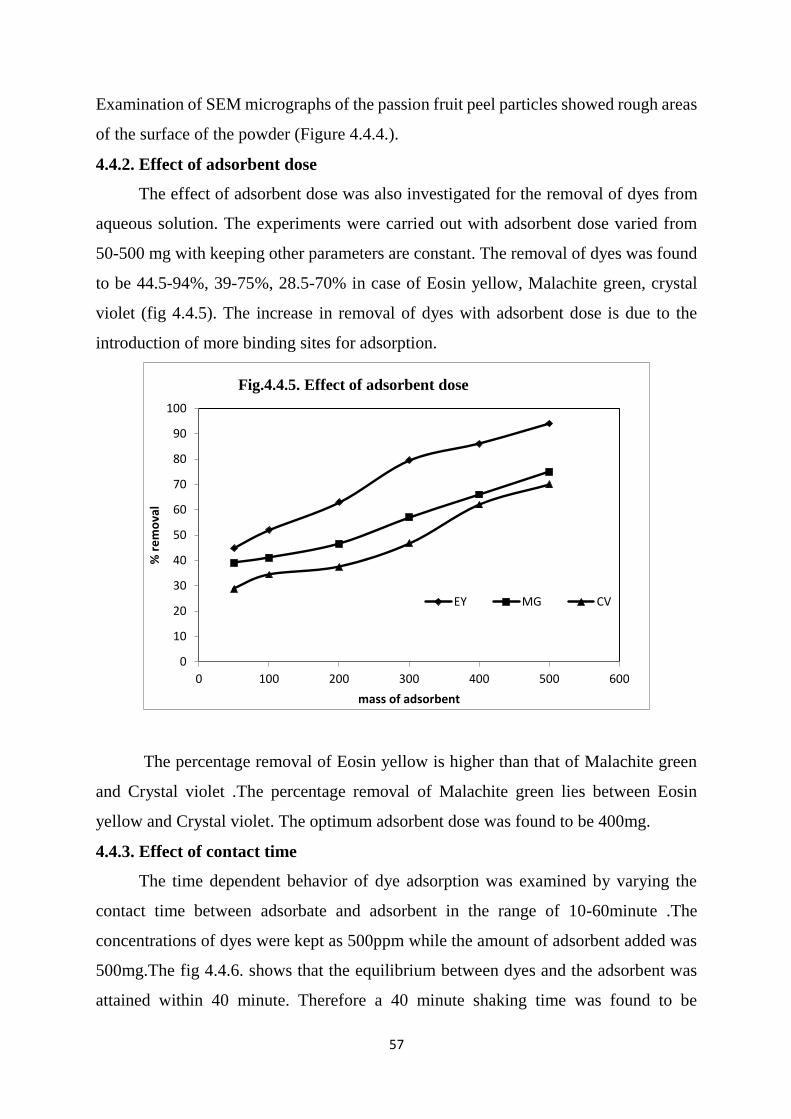
57
Examination of SEM micrographs of the passion fruit peel particles showed rough areas
of the surface of the powder (Figure 4.4.4.).
4.4.2. Effect of adsorbent dose
The effect of adsorbent dose was also investigated for the removal of dyes from
aqueous solution. The experiments were carried out with adsorbent dose varied from
50-500 mg with keeping other parameters are constant. The removal of dyes was found
to be 44.5-94%, 39-75%, 28.5-70% in case of Eosin yellow, Malachite green, crystal
violet (fig 4.4.5). The increase in removal of dyes with adsorbent dose is due to the
introduction of more binding sites for adsorption.
The percentage removal of Eosin yellow is higher than that of Malachite green
and Crystal violet .The percentage removal of Malachite green lies between Eosin
yellow and Crystal violet. The optimum adsorbent dose was found to be 400mg.
4.4.3. Effect of contact time
The time dependent behavior of dye adsorption was examined by varying the
contact time between adsorbate and adsorbent in the range of 10-60minute .The
concentrations of dyes were kept as 500ppm while the amount of adsorbent added was
500mg.The fig 4.4.6. shows that the equilibrium between dyes and the adsorbent was
attained within 40 minute. Therefore a 40 minute shaking time was found to be
0
10
20
30
40
50
60
70
80
90
100
0 100 200 300 400 500 600
% r
em
ova
l
mass of adsorbent
Fig.4.4.5. Effect of adsorbent dose
EY MG CV
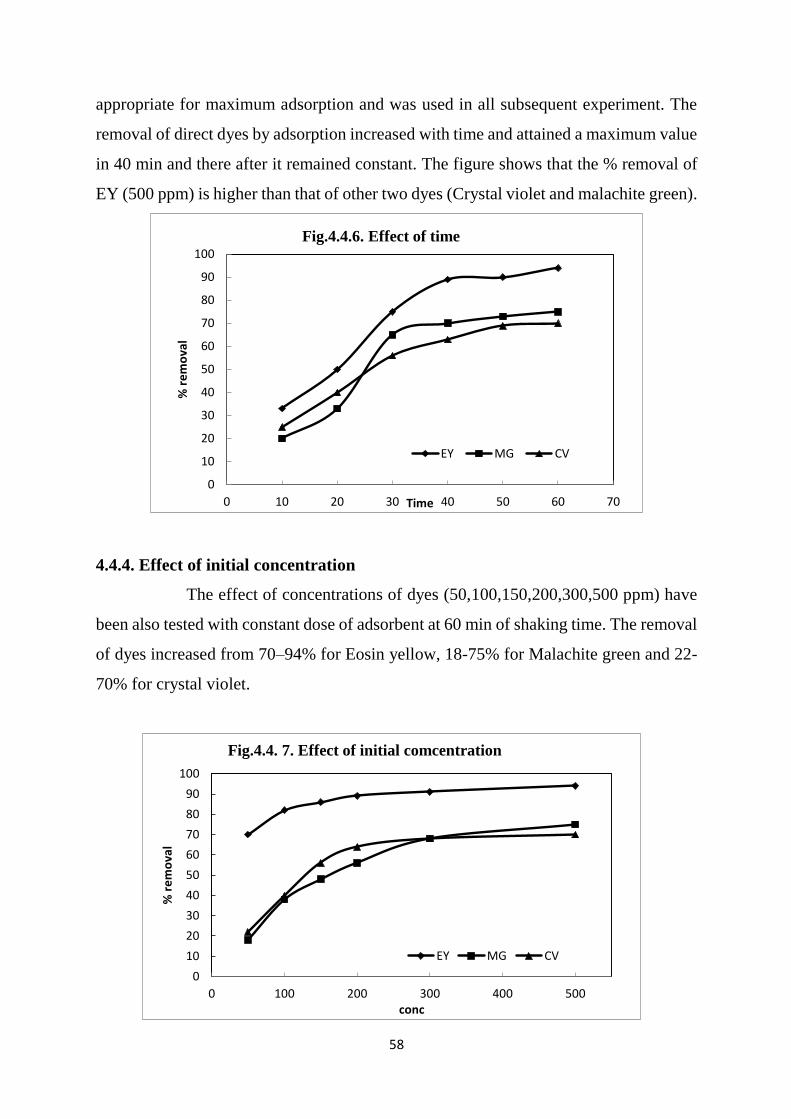
58
appropriate for maximum adsorption and was used in all subsequent experiment. The
removal of direct dyes by adsorption increased with time and attained a maximum value
in 40 min and there after it remained constant. The figure shows that the % removal of
EY (500 ppm) is higher than that of other two dyes (Crystal violet and malachite green).
4.4.4. Effect of initial concentration
The effect of concentrations of dyes (50,100,150,200,300,500 ppm) have
been also tested with constant dose of adsorbent at 60 min of shaking time. The removal
of dyes increased from 70–94% for Eosin yellow, 18-75% for Malachite green and 22-
70% for crystal violet.
0
10
20
30
40
50
60
70
80
90
100
0 10 20 30 40 50 60 70
% r
em
ova
l
Time
Fig.4.4.6. Effect of time
EY MG CV
0
10
20
30
40
50
60
70
80
90
100
0 100 200 300 400 500
% r
em
ova
l
conc
Fig.4.4. 7. Effect of initial comcentration
EY MG CV

59
The plot reached a maximum value and remains constant. The adsorption attains
equilibrium within 300 ppm. The results indicated that the adsorption of dyes is much
dependent on concentration of solution.
4.4.5. Equilibrium study
Adsorption isotherms are mathematical models that describe the distribution of
the adsorbate species among liquid and adsorbent, based on a set of assumptions that
are mainly related to the heterogeneity/homogeneity of adsorbents, the type of coverage
and possibility of interaction between the adsorbate species. Adsorption data are usually
described by adsorption isotherms, such as Langmuir and Freundlich isotherms. These
isotherms relate dye uptake per unit mass of adsorbent, qe, to the equilibrium adsorbate
concentration in the bulk fluid phase Ce.
The parameters obtained from the different isotherm models provide important
information on the adsorption mechanisms and the surface properties and affinities of
the adsorbent. According to the obtained data for the model parameters it is seen that
Freundlich equilibrium model is favourable. Taking into consideration the values of the
coefficient of correlation as criteria for goodness of fit, for most investigated systems
the Freundlich equation gives a better correlation between the theoretical and
experimental data for the whole concentration range when compared with Langmuir
equations.
Table 4.4.1. Kinetic parameters for Freundlich Isotherm
Dyes
Statistical parameter constants
r R2 K n
Malachite green 0.9942 0.9734 0.00335 0.3152
Crystal Violet 0.9522 0.9702 0.00152 0.2901
Eosin Yellow 0.9920 0.9763 0.6246 0.3175
The Freundlich constant, n also indicates the degree of favorability of adsorption. The
values of K and n are obtained from the intercept and slope of the graph plotted between
log qe versus log Ce (Fig.4.4.8-4.4.10). The values of n lie between 0 and 1 (Table 4.4.1),
indicated that the adsorption is favourable with the Freundlich isotherm model. The
similar results were earlier reported by the other investigators. Hence it should be noted
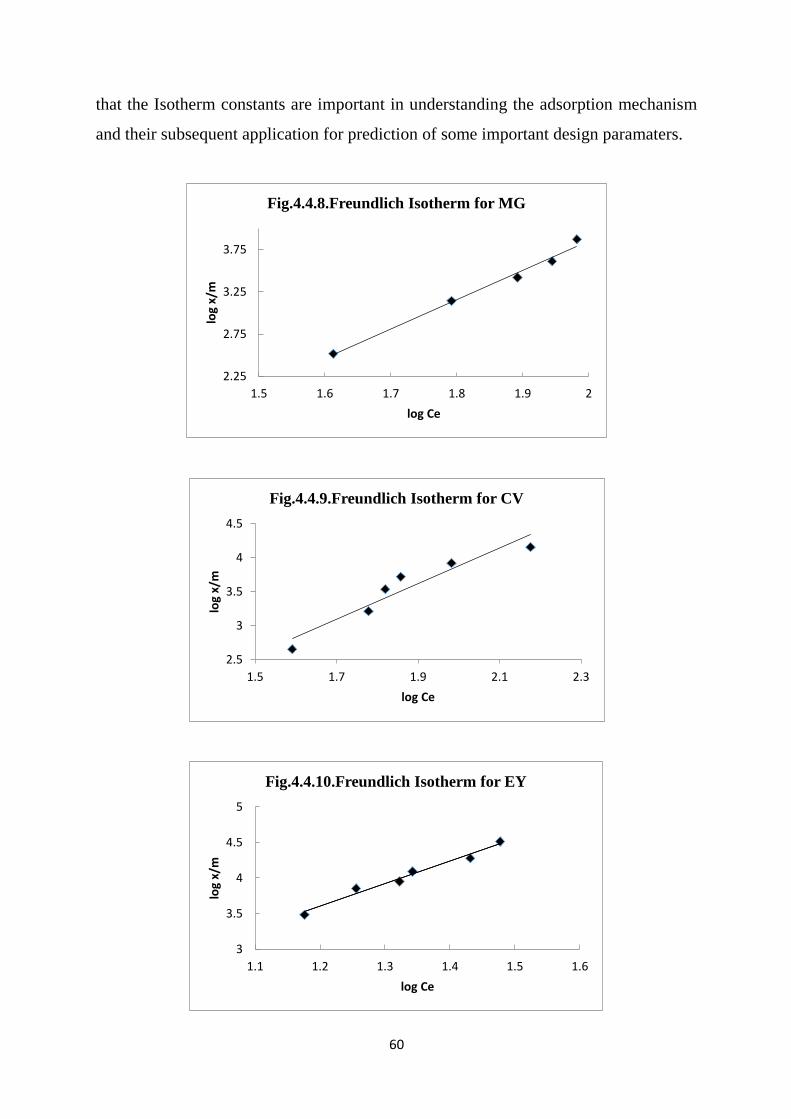
60
that the Isotherm constants are important in understanding the adsorption mechanism
and their subsequent application for prediction of some important design paramaters.
2.25
2.75
3.25
3.75
1.5 1.6 1.7 1.8 1.9 2
log
x/m
log Ce
Fig.4.4.8.Freundlich Isotherm for MG
2.5
3
3.5
4
4.5
1.5 1.7 1.9 2.1 2.3
log
x/m
log Ce
Fig.4.4.9.Freundlich Isotherm for CV
3
3.5
4
4.5
5
1.1 1.2 1.3 1.4 1.5 1.6
log
x/m
log Ce
Fig.4.4.10.Freundlich Isotherm for EY

61
4.4.6. Kinetic Study
In order to investigate the controlling mechanism of adsorption processes such
as mass transfer and chemical reaction, the pseudo-first-order and pseudo-second order
equations are applied to model the kinetics of dye adsorption onto passion fruit peel
powder. The pseudo-first-order rate equation is given as
where qt and qe are the amount adsorbed (mg/g) at time t, and at equilibrium respectively
and kad is the rate constant of the pseudo-first-order adsorption process (min-1). Straight
line plots of log (qe - qt) against t were used to determine the rate constant, kad, and
correlation coefficients, R2, for different dye concentration. But it was seen that
adsorption of dyes on passion fruit peel powder did not follow pseudo first-order
kinetics compare with the correlation coefficient of pseudo second-order kinetics.
The pseudo-second-order equation is expressed as:
0
0.01
0.02
0.03
0.04
0.05
0.06
0.07
0.08
0.09
0 10 20 30 40 50 60 70
t/q
t
time
Fig.4.4.11.Pseudo-second order kinetics of MG

62
where h = kqe2 (mg g-1min-1) can be regarded as the initial adsorption rate as t→0 and k
is the rate constant of pseudo-second-order adsorption (g mg-1min-1).The plot t/qt versus
t should give a straight line if pseudo-second-order kinetics is applicable and qe, k and
h can be determined from the slope and intercept of the plot, respectively. The plots of
the linearized form of the pseudo second-order by passion fruit peel powder are shown
in Fig. 4.4.11-13.
0
0.01
0.02
0.03
0.04
0.05
0.06
0.07
0.08
0.09
0 10 20 30 40 50 60 70
t/q
t
time
Fig.4.4.12.Pseudo-second order kinetics of CV
0
0.01
0.02
0.03
0.04
0.05
0.06
0.07
0 10 20 30 40 50 60 70
t/q
t
time
Fig.4.4.13.Pseudo-second order kinetics of EY

63
Table.4.4.2. Pseudo-second order parameters for adsorption of dyes
Dyes
Statistical parameter constants
r R2 qe Kad
Malachite green 0.9884 0.9770 1428.57 28.82
Crystal Violet 0.9892 0.9784 1111.11 33.00
Eosin Yellow 0.9907 0.9823 1666.67 41.84
The plot of t/qt versus t for pseudo-second-order model yields very good straight lines
(correlation coefficient, R2 > 0.97) as compared to the plot of pseudo-first order.
4.5. Used Black Tea as Low Cost Adsorbent
4.5.1. Characterisation of the adsorbent
FTIR spectra (Fig.4.1.a-d) were carried out and a broad absorption peak at
3285.32 cm-1 is indicative of bonded hydroxyl group. A peak observed at 1626.36cm-1
can be assigned to >C=O group. A peak at 1516.12cm-1 indicates secondary amino
group. The peak at 1447.4 cm-1 may be due to symmetric C-H stretching and C-O
stretching of ether group is observed due to peak at 1032.56 cm-1.
Fig. 4.5.1. IR spectrum of used black tea powder
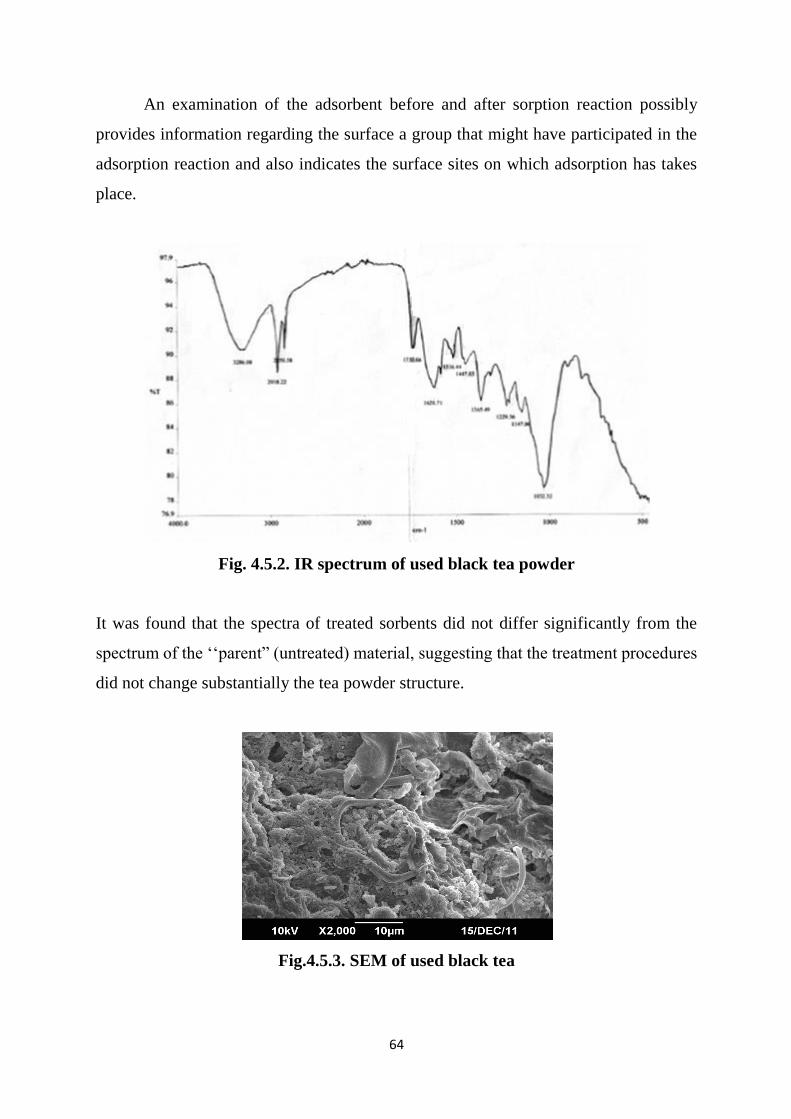
64
An examination of the adsorbent before and after sorption reaction possibly
provides information regarding the surface a group that might have participated in the
adsorption reaction and also indicates the surface sites on which adsorption has takes
place.
Fig. 4.5.2. IR spectrum of used black tea powder
It was found that the spectra of treated sorbents did not differ significantly from the
spectrum of the ‘‘parent” (untreated) material, suggesting that the treatment procedures
did not change substantially the tea powder structure.
Fig.4.5.3. SEM of used black tea

65
SEM (Figure 4.5.3.) revealed that the surface of adsorbent is rough and almost
non compact in nature. Used black tea waste has considerable number of pores suitable
for physisorption.
4.5.2. EFFECT OF ADSORBENT DOSAGE
The effect of the adsorbent dose was studied at room temperature by varying the
sorbent amounts from 50 to 400 mg. For all these runs, initial concentration of dyes was
fixed as 500 ppm.
Figure.4.5.4. shows that adsorption of all these dyes increases rapidly with increase in
amount of used black tea due to greater availability of the adsorption sites at higher
concentration of the adsorbent. Any further addition of the adsorbent beyond 300mg did
not cause any significant change in the adsorption. This may be due to overlapping of
adsorption sites as a result of overcrowding of adsorbent particles. From the results, it
is revealed that within a certain range of initial dye concentration, the percentage of dye
adsorption on used black tea is determined by the sorption capacity of the powder.
4.5.3. EFFECT OF TIME
Adsorption of dyes was measured at different contact time for three different
dyes. The plot (Fig.4.5.5.) reveals that the rate of percentage of dye removal is higher
at the beginning. This is probably due to large surface area being available at beginning
for the adsorption. The increasing contact time increased the dye adsorption and it
remains constant after 60 min.
0
20
40
60
80
100
0 100 200 300 400 500
% r
em
ova
l
Weight (mg)
Fig.4.5.4. Effect of adsorbent dose
MG CV EY
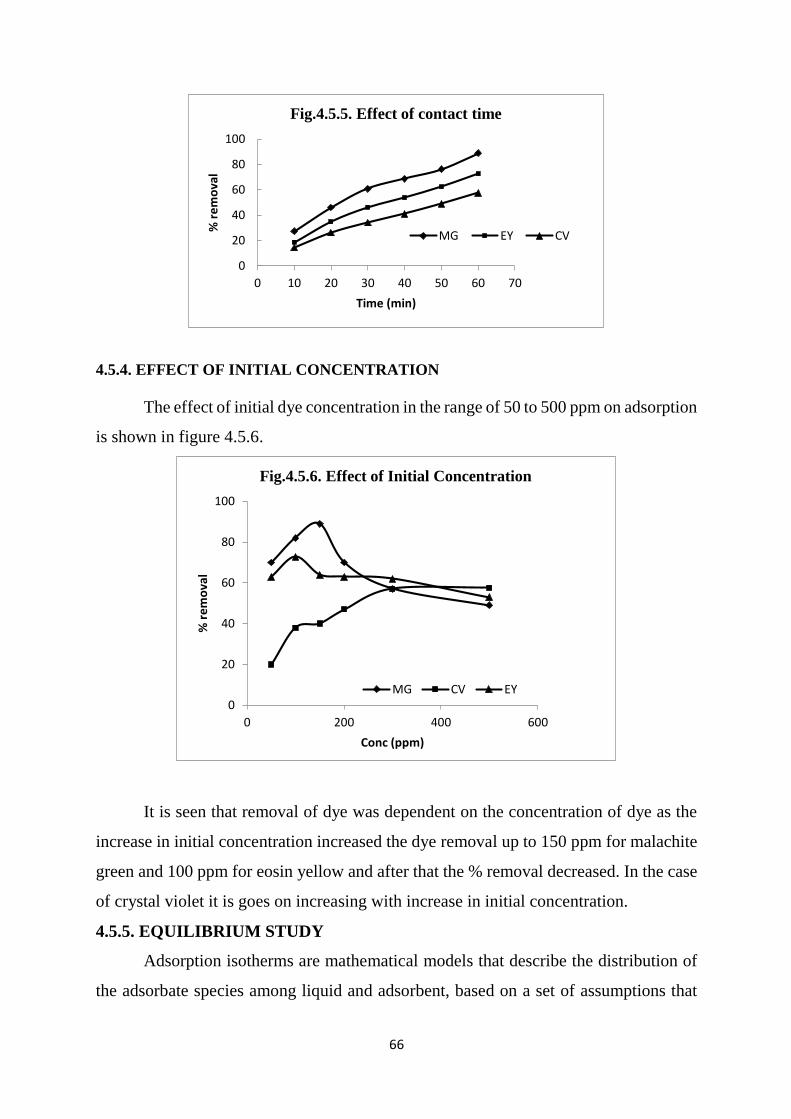
66
4.5.4. EFFECT OF INITIAL CONCENTRATION
The effect of initial dye concentration in the range of 50 to 500 ppm on adsorption
is shown in figure 4.5.6.
It is seen that removal of dye was dependent on the concentration of dye as the
increase in initial concentration increased the dye removal up to 150 ppm for malachite
green and 100 ppm for eosin yellow and after that the % removal decreased. In the case
of crystal violet it is goes on increasing with increase in initial concentration.
4.5.5. EQUILIBRIUM STUDY
Adsorption isotherms are mathematical models that describe the distribution of
the adsorbate species among liquid and adsorbent, based on a set of assumptions that
0
20
40
60
80
100
0 10 20 30 40 50 60 70
% r
em
ova
l
Time (min)
Fig.4.5.5. Effect of contact time
MG EY CV
0
20
40
60
80
100
0 200 400 600
% r
em
ova
l
Conc (ppm)
Fig.4.5.6. Effect of Initial Concentration
MG CV EY

67
are mainly related to the heterogeneity/homogeneity of adsorbents, the type of coverage
and possibility of interaction between the adsorbate species. Adsorption data are usually
described by adsorption isotherms, such as Langmuir, Freundlich and Temkin
isotherms. These isotherms relate dye uptake per unit mass of adsorbent, qe, to the
equilibrium adsorbate concentration in the bulk fluid phase Ce.
4.5.5. a. The Langmuir isotherm
The Langmuir model is based on the assumption that the maximum adsorption occurs
when a saturated monolayer of solute molecules is present on the adsorbent surface, the
energy of adsorption is constant and there is no migration of adsorbate molecules in the
surface plane.
The constants in the Langmuir isotherm can be determined by plotting (Ce/qe)
versus (Ce) and making use of equation
Ce/qe =Ce/qm +1/qmKL
where qm and KL are the Langmuir constants, representing the maximum adsorption
capacity for the solid phase loading and the energy constant related to the heat of
adsorption respectively.
4.5.5. b. The Freundlich isotherm
The Freundlich isotherm model is an empirical relationship describing the
adsorption of solutes from a liquid to a solid surface and assumes that different sites
with several adsorption energies are involved. Freundlich adsorption isotherm is the
relationship between the amounts of dye adsorbed per unit mass of adsorbent, qe, and
the concentration of the dye at equilibrium, Ce. The logarithmic form of the equation is:
log (x/m) = log Kf + 1/n log Ce
where Kf and n are the Freundlich constants, the characteristics of the system. Kf and n
are the indicators of the adsorption capacity and adsorption intensity, respectively. The
ability of Freundlich model to fit the experimental data was examined. For this case, the
plot of log Ce vs. log (x/m) was employed to generate the intercept value of Kf and the
slope of n. The magnitudes of Kf and n show easy separation of MG and EY dyes from
the aqueous solution and indicate favourable adsorption whereas the values of Kf and n
are very low for CV indicting an unfavorable adsorption.. The intercept Kf value is an

68
indication of the adsorption capacity of the adsorbent; the slope 1/n indicates the effect
of concentration on the adsorption capacity and represents adsorption intensity.
Table 4.5.1. Kinetic parameters for Freundlich Isotherm
Dyes
Statistical parameter constants
r R2 K n
Malachite green 0.9885 0.9772 4.901x10² 1.9368
Crystal Violet 0.9695 0.9400 0.4988 0.4957
Eosin Yellow 0.9839 0.9680 4.885 x10² 1.2820
3.2
3.4
3.6
3.8
4
4.2
4.4
1 1.5 2 2.5
log
x/m
log Ce
Fig.4.5.7. Freundlich Isotherm for MG
2.5
2.9
3.3
3.7
4.1
4.5
1.5 1.7 1.9 2.1 2.3 2.5
log
x/m
log Ce
Fig.4.5.8. Freundlich Isotherm for CV
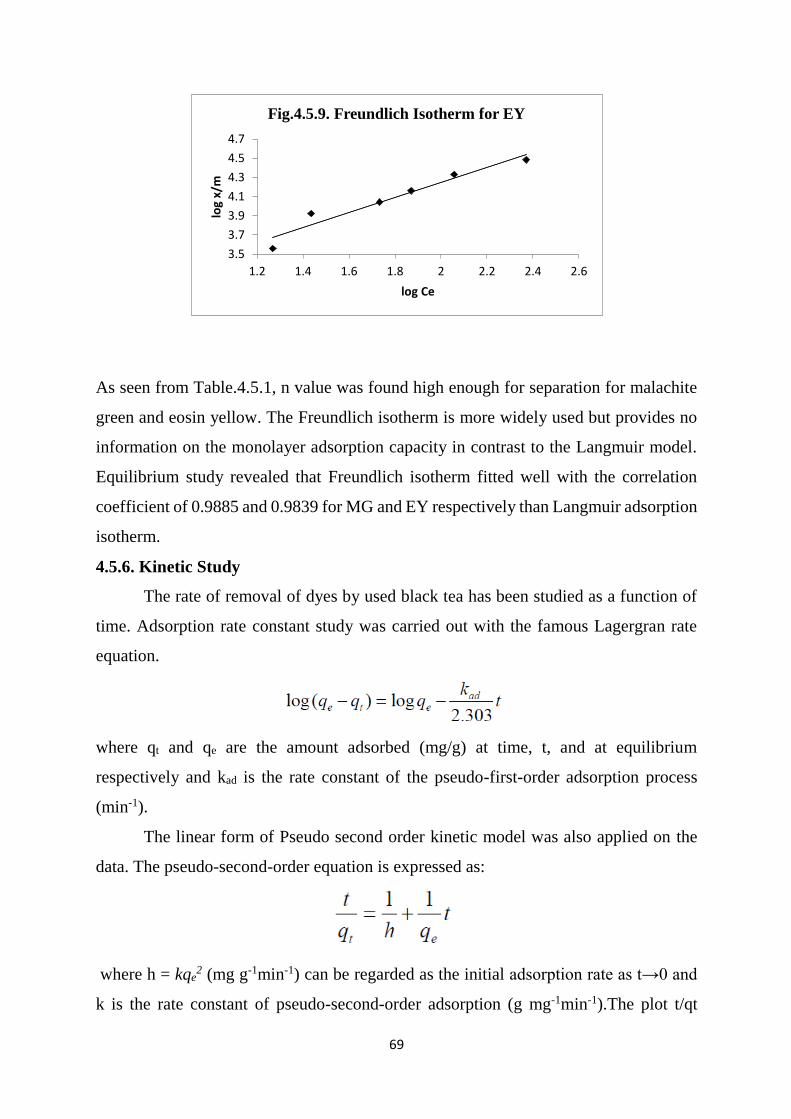
69
As seen from Table.4.5.1, n value was found high enough for separation for malachite
green and eosin yellow. The Freundlich isotherm is more widely used but provides no
information on the monolayer adsorption capacity in contrast to the Langmuir model.
Equilibrium study revealed that Freundlich isotherm fitted well with the correlation
coefficient of 0.9885 and 0.9839 for MG and EY respectively than Langmuir adsorption
isotherm.
4.5.6. Kinetic Study
The rate of removal of dyes by used black tea has been studied as a function of
time. Adsorption rate constant study was carried out with the famous Lagergran rate
equation.
where qt and qe are the amount adsorbed (mg/g) at time, t, and at equilibrium
respectively and kad is the rate constant of the pseudo-first-order adsorption process
(min-1).
The linear form of Pseudo second order kinetic model was also applied on the
data. The pseudo-second-order equation is expressed as:
where h = kqe2 (mg g-1min-1) can be regarded as the initial adsorption rate as t→0 and
k is the rate constant of pseudo-second-order adsorption (g mg-1min-1).The plot t/qt
3.5
3.7
3.9
4.1
4.3
4.5
4.7
1.2 1.4 1.6 1.8 2 2.2 2.4 2.6
log
x/m
log Ce
Fig.4.5.9. Freundlich Isotherm for EY

70
versus t should give a straight line if pseudo-second-order kinetics is applicable and qe,
k and h can be determined from the slope and intercept of the plot, respectively. The
plots of the linearized form of the pseudo second-order by used black tea powder are
shown in Fig. 4.5.10-12.
A linear plot is obtained for all the dyes suggesting the applicability of pseudo
second order model on the data well. The values of Rate constant and qe was calculated
and has been given in table 4.5.2.
Table.4.5.2. Pseudo-second order parameters for adsorption of dyes
Dyes
Statistical parameter constants
r R2 qe Kad(x10-5)
Malachite green 0.9905 0.9812 1666.66 1.1842
Crystal Violet 0.9873 0.9742 1250.00 1.0220
Eosin Yellow 0.9756 0.9519 1428.57 1.0606
0.03
0.04
0.05
0.06
0.07
0.08
0 20 40 60 80
t/q
t
Time
Fig.4.5.10. Pseudo-second-order kinetics for MG

71
The determinant coefficient (square of correlation coefficient) for the pseudo-
second-order model was 0.9812, 0.9742 and 0.9512 for MG, EY and CV respectively
being significantly higher than that for the pseudo first-order model. It suggests that the
dye adsorption process of the spent tea leaf adsorbent was more fitted to the pseudo-
second-order model than the pseudo-first-order model.
4.6. Saw Dust as Low Cost Adsorbent
4.6.1. Characterisation of the adsorbent
The IR spectral analysis is important to identify the characteristic functional
groups on the surface of the adsorbent, which are responsible for adsorption of heavy
metal ions. The IR spectrum of sawdust was recorded to obtain the information
0.045
0.055
0.065
0.075
0.085
0.095
0 20 40 60 80
t/q
t
Time
Fig.4.5.11. Pseudo-second-order kinetics for EY
0.06
0.07
0.08
0.09
0.1
0.11
0.12
0 10 20 30 40 50 60 70
t/q
t
Time
Fig.4.5.12. Pseudo-second-order kinetics for CV

72
regarding the stretching vibrations of the functional groups which are involved in the
adsorption of the adsorbate molecules. The IR spectrum of sawdust before and after
metal ion adsorption are shown in the figure 4.6.1-3. The IR spectral analysis of sawdust
shows distinct peak at 558.27, 1047.54, 1729.3 and 3332.65cm-1. The peak observed at
558.2 and 1047.54 may be assigned to the presence of vinyl compound ester group
respectively. The peak observed at 1729cm-1 confirm the presence of carbonyl group.
the peak at 3332.65cm-1 reveals alkyne stretching vibration.
Fig 4.6.1. IR spectrum of saw dust
Fig 4.6.2. IR Spectrum of sawdust loaded with Cu
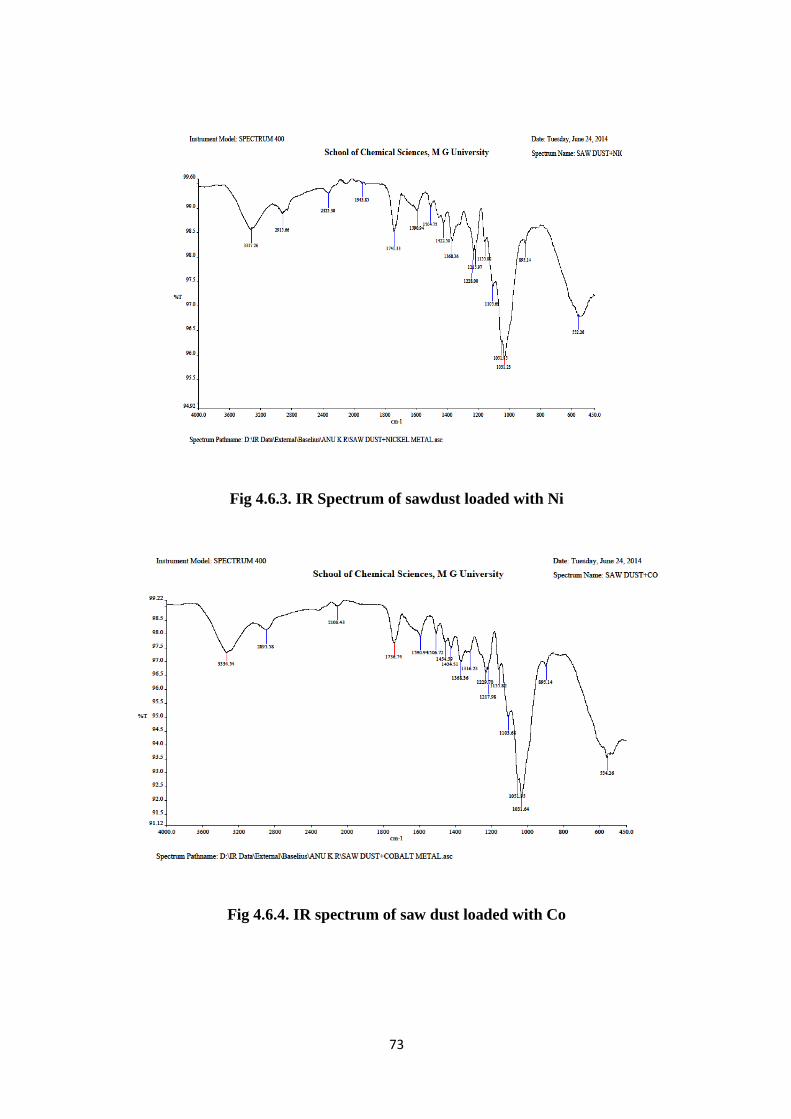
73
Fig 4.6.3. IR Spectrum of sawdust loaded with Ni
Fig 4.6.4. IR spectrum of saw dust loaded with Co

74
SEM analysis is another useful tool for the analysis of the surface
morphology of an adsorbent. The porous and irregular surface structure of the adsorbent
can be clearly observed in SEM images shown in figure 4.6.5.
Fig 4.6.5. SEM of saw dust and Cu loaded saw dust
4.6.2. Effect of initial concentration
Initial metal ion concentration is one of the effective factors in removal
efficiency. Fig.4.6.6 depicts the effect of increase in initial metal ion concentration on
the adsorption of the various metal ions onto saw dust adsorbent. The strong affinities
of Cu, Ni & Co the saw dust give concentration to a marginal variation in % adsorption
with increase in initial metal ion.
0
20
40
60
80
100
0 200 400 600 800 1000 1200
% r
emo
val
Initial metal ion conc(ppm)
Ni Cu
Fig 4.6.6. Effect of initial concentration

75
4.6.3. Effect of adsorbent dosage
From fig.4.6.7, it is apparent that by increasing the adsorbent dose the removal
efficiency of each ion increases. This is readily understood from the fact that the number
of available adsorption site increases by increasing the adsorbent dose and therefore,
result in the increase in the removal efficiency or the % adsorption of the respective ion.
Also, at a low adsorbent dose, e.g. 2g, the available sorption site were quite insufficient
compare with the large amount of adsorbate ions in the solution, resulting in low
removal efficiency. However, at a higher adsorbent dose, e.g. 8g, the sorption sites were
sufficient thereby resulting in a rapid removal of the different adsorbates. The
adsorption order of the adsorbate on the saw dust was observed to follow the pattern
Cu> Co> Ni.
4.6.4. Effect of agitation time
To establish an appropriate contact time between the sawdust and metallic ion
solution, adsorption capacities of metal ion were measured as a function of time
(Fig.4.6.8). The plot reveals that the rate of the percentage of HMI removal is higher at
the beginning. That is probably due to the larger surface area of the sawdust being
available at beginning for the adsorption of metals. As the surface adsorption sites
50
60
70
80
90
100
0 0.02 0.04 0.06 0.08 0.1 0.12
% R
emo
val
Wt. of Adsorbent (g)
Ni
Cu
Co
Fig.4.6.7. Effect of adsorbent dosage

76
become exhausted, the uptake rate is controlled by the rate at which the adsorbate is
transported from the exterior to the interior sites of the adsorbent particles. The rate of
heavy metal ion removal was attained after approximately 50 min stirring.
4.6.5. Isotherm data analysis
The parameters obtained from the different isotherm models provide important
information on the adsorption mechanisms and the surface properties and affinities of
the adsorbent. The most widely accepted surface adsorption models for single-solute
systems are the Langmuir and Freundlich models. Langmuir and Freundlich isotherms
are used for fitting the experimental data in adsorption studies to understand the extent
and degree of favorability of adsorption. According to the obtained data for the model
parameters it is obvious that Freundlich equilibrium model is favourable. Taking into
consideration the values of the coefficient of correlation as criteria for goodness of fit,
for most investigated Systems the Freundlich equation gives a better correlation
between the theoretical and experimental data for the whole concentration range when
compared with Langmuir equations.
0
10
20
30
40
50
60
70
80
90
100
0 10 20 30 40 50 60 70
% r
em
ova
l
Time (min)
Ni
Cu
Co
Fig.4.6.8. Effect of time
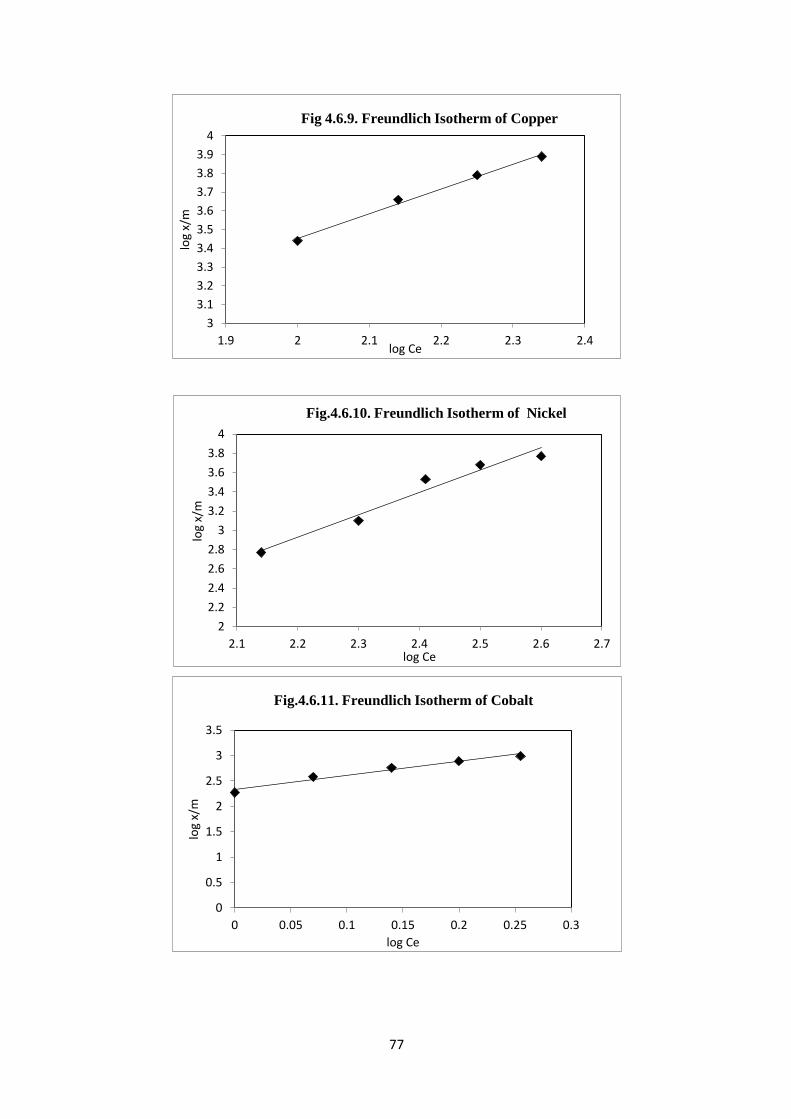
77
3
3.1
3.2
3.3
3.4
3.5
3.6
3.7
3.8
3.9
4
1.9 2 2.1 2.2 2.3 2.4
log
x/m
log Ce
Fig 4.6.9. Freundlich Isotherm of Copper
2
2.2
2.4
2.6
2.8
3
3.2
3.4
3.6
3.8
4
2.1 2.2 2.3 2.4 2.5 2.6 2.7
log
x/m
log Ce
Fig.4.6.10. Freundlich Isotherm of Nickel
0
0.5
1
1.5
2
2.5
3
3.5
0 0.05 0.1 0.15 0.2 0.25 0.3
log
x/m
log Ce
Fig.4.6.11. Freundlich Isotherm of Cobalt
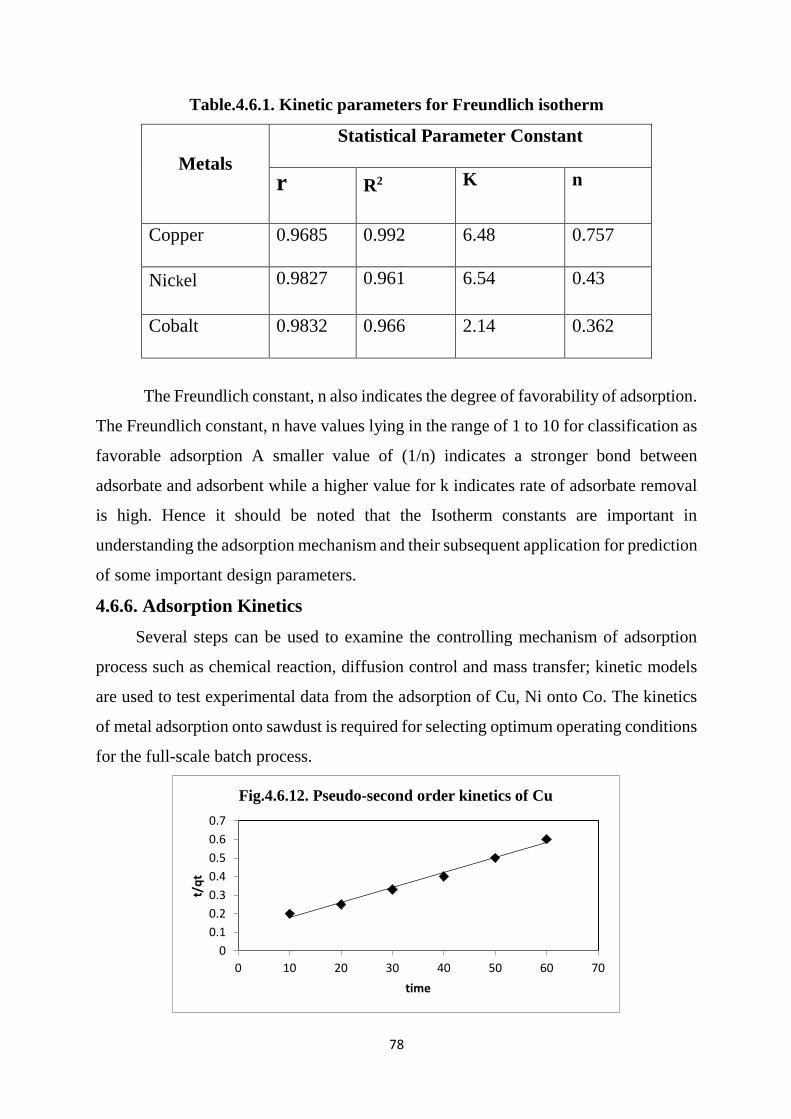
78
Table.4.6.1. Kinetic parameters for Freundlich isotherm
Metals
Statistical Parameter Constant
r R2 K n
Copper 0.9685 0.992 6.48 0.757
Nickel 0.9827 0.961 6.54 0.43
Cobalt 0.9832 0.966 2.14 0.362
The Freundlich constant, n also indicates the degree of favorability of adsorption.
The Freundlich constant, n have values lying in the range of 1 to 10 for classification as
favorable adsorption A smaller value of (1/n) indicates a stronger bond between
adsorbate and adsorbent while a higher value for k indicates rate of adsorbate removal
is high. Hence it should be noted that the Isotherm constants are important in
understanding the adsorption mechanism and their subsequent application for prediction
of some important design parameters.
4.6.6. Adsorption Kinetics
Several steps can be used to examine the controlling mechanism of adsorption
process such as chemical reaction, diffusion control and mass transfer; kinetic models
are used to test experimental data from the adsorption of Cu, Ni onto Co. The kinetics
of metal adsorption onto sawdust is required for selecting optimum operating conditions
for the full-scale batch process.
0
0.1
0.2
0.3
0.4
0.5
0.6
0.7
0 10 20 30 40 50 60 70
t/q
t
time
Fig.4.6.12. Pseudo-second order kinetics of Cu

79
The kinetic parameters, which are helpful for the prediction of adsorption rate, give
important information for designing and modeling the adsorption processes.
Table.4.6.2.The rate constant for Pseudo-second order adsorption
Metals
Statistical Parameter Constant
r R2 qe Kad
Copper 0.9928 0.993 125 6.52x10⁻⁴
Nickel 0.976 0.971 125 2.44x10⁻⁴
Cobalt 0.982 0.985 100 1.96x10⁻³
0
0.1
0.2
0.3
0.4
0.5
0.6
0.7
0.8
0.9
0 10 20 30 40 50 60 70
t/q
t
time
Fig.4.6.13. Pseudo-second order kinetics of Ni
0
0.1
0.2
0.3
0.4
0.5
0.6
0.7
0.8
0 10 20 30 40 50 60 70
t/q
t
time
Fig.4.6.14. Pseudo-second order kinetics of Co

80
4.7. Mango Leaf as Low Cost Adsorbent
4.7.1. Characterization of the adsorbents
a) FT-IR spectroscopy
In order to gain better insight into the surface functional groups available on the
surface of the different investigated adsorbents, the IR spectra of adsorbent before and
after adsorption of dye were recorded as shown in Figs.4.7. 1-3. Mango leaf powder. IR
spectrum (Fig.4.1) showed five intense bands, at 3321.28, 2919.05,1739, 1614.7 and
1032.38 cm-1.The band at 3321.28 and 2919.05cm-1 which refers to (-OH) and identical
alkyl group (-CH2-) respectively. Also the spectrum shows bands at 1739 and 1032.38
cm-1 were to be the presence of (C-O) and (-OH), respectively.
An examination of the adsorbent before and after sorption reaction possibly
provides information regarding the surface a group that might have participated in the
adsorption reaction and also indicates the surface sites on which adsorption has taken
place.
Fig.4.7.1. IR Spectrum of Mango leaf powder

81
Fig.4.7.2. IR Spectrum of Congo Red adsorbed Mango leaf powder
Fig.4.7.3. IR Spectrum of Methylene Blue adsorbed Mango leaf powder
Both spectra show the O-H stretching region at around 3300cm-1. However, a
new band at 1733.31cm-1, which corresponds to the MB and CR and one at 1600and
1607.37cm-1 for MB and CR confirms dye adsorption onto the mango leaf powder.

82
b) SEM analysis
A better understanding of the surface morphology is provided by the Scanning
Electron microscopy (SEM). The porous structure of the adsorbent is visible in the
micrograph (Fig 4.7.4.). After adsorption, the surface of the adsorbent becomes rough
and rigid and the voids are absent.
Fig.4.7.4. SEM of mango leaf powder before and after adsorption
The maximum wavelengths (λmax) and extinction coefficients(ε) of prepared
dye solutions are given in Table 4.7.1.
Table.4.7.1. Characterization of dyes
Dye CAS
No
Colour
index
No.
F.W.
(gmol-
1)
λmax
(nm)
ε
(dm3/mol.
cm)
Methylene Blue 61-73-4 52015 319.85 661 73044
Congo Red 573-58-0 22120
696.67 497 89500
4.7.2. ADSORPTION STUDIES
4.7.2. 1. Effect of adsorbent dose
The effect of the adsorbent dose was studied at room temperature by varying the
sorbent amounts from 20 to 100mg. For all these runs, initial concentration of dyes was
fixed as 100 mg/L. Figure 4.7.5. shows that adsorption of all the two dyes increases
rapidly with increase in the amount of mango leaf powder due to greater availability of

83
the surface area at higher concentration of the adsorbent. Any further addition of the
adsorbent beyond this did not cause any significant change in the adsorption.
This may be due to overlapping of adsorption sites as a result of overcrowding
of adsorbent particles. From the results, it is revealed that within a certain range of initial
dye concentration, the percentage of dye adsorption on mango leaf powder is
determined by the sorption capacity of the powder. The maximum removal of dye was
obtained in the adsorbent dose of 80mg.
4.7.3. Effect of contact time
Adsorption of dyes was measured at different contact time for two different dyes.
F ig.4.7.6, reveals that the rate of percent of dye removal is higher at the beginning. This
is probably due to larger surface area of the leaves being available at beginning for the
adsorption of dyes ions. Most of the maximum percent dye removal was attained after
about 60 min of shaking time for different initial concentrations. The increasing contact
time increased the dye adsorption and it remains constant after equilibrium reached in
50 min.
94
94.5
95
95.5
96
96.5
97
97.5
98
98.5
99
0 0.02 0.04 0.06 0.08 0.1 0.12
% r
em
ova
l
mass of adsorbent (g)
Figure 4.7.5. Effect of adsorbent dose
CR
MB
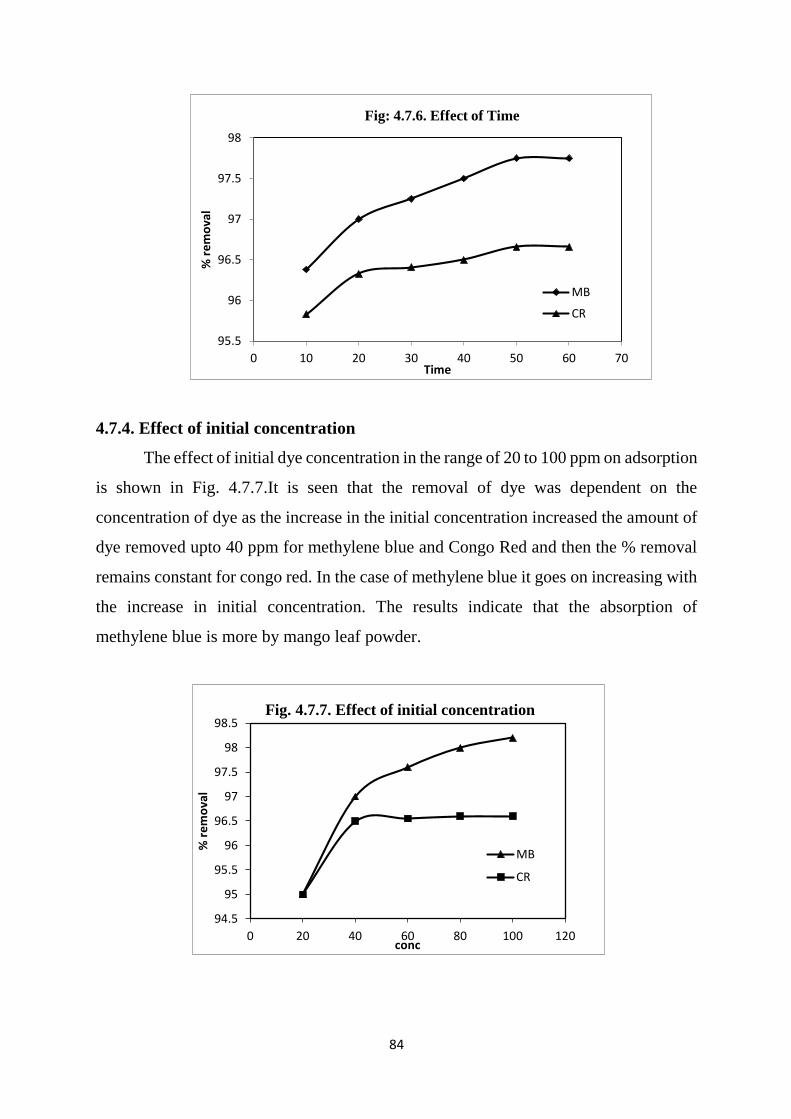
84
4.7.4. Effect of initial concentration
The effect of initial dye concentration in the range of 20 to 100 ppm on adsorption
is shown in Fig. 4.7.7.It is seen that the removal of dye was dependent on the
concentration of dye as the increase in the initial concentration increased the amount of
dye removed upto 40 ppm for methylene blue and Congo Red and then the % removal
remains constant for congo red. In the case of methylene blue it goes on increasing with
the increase in initial concentration. The results indicate that the absorption of
methylene blue is more by mango leaf powder.
95.5
96
96.5
97
97.5
98
0 10 20 30 40 50 60 70
% r
em
ova
l
Time
Fig: 4.7.6. Effect of Time
MB
CR
94.5
95
95.5
96
96.5
97
97.5
98
98.5
0 20 40 60 80 100 120
% r
em
ova
l
conc
Fig. 4.7.7. Effect of initial concentration
MB
CR

85
4.7.5. Isotherm data analysis
The parameters obtained from the different isotherm models provide important
information on the adsorption mechanisms and the surface properties and affinities of
the adsorbent. The most widely accepted surface adsorption models for single-solute
systems are the Langmuir and Freundlich models. The correlation with the amount of
adsorption and the liquid-phase concentration was tested with the Langmuir and
Freundlich isotherm equations.
The Freundlich isotherm models are shown in Fig.4.7.7 and 4.7.8. Freundlich
adsorption isotherm model was found to be suitable for adsorption of methylene blue
and congo red on mango leaf powder. The applicability of the linear form of Freundlich
adsorption isotherm was proved by the high correlation coefficients R2> 0.91.
Correlation coefficient for Freundlich is higher compared to that of Langmuir in all the
two cases.
The Freundlich constant, n also indicates the degree of favorability of
adsorption. The value of K and n are obtained from the intercept and slope of the graph
plotted between logx/m versus log Ce. The values of n lies between 1 and 2
(Table.4.7.2), indicated that the adsorption is favourable with the Freundlich isotherm
model. The similar results were earlier reported by the other investigators. Hence it
should be noted that the Isotherm constants are important in understanding adsorption
mechanism and their subsequent application for prediction of some important design
parameters.
0
0.5
1
1.5
2
2.5
3
3.5
0 0.05 0.1 0.15 0.2 0.25 0.3
log
x/m
log Ce
Fig.4.7.8. Freundlich Adsorption Isotherm for
Methylene Blue
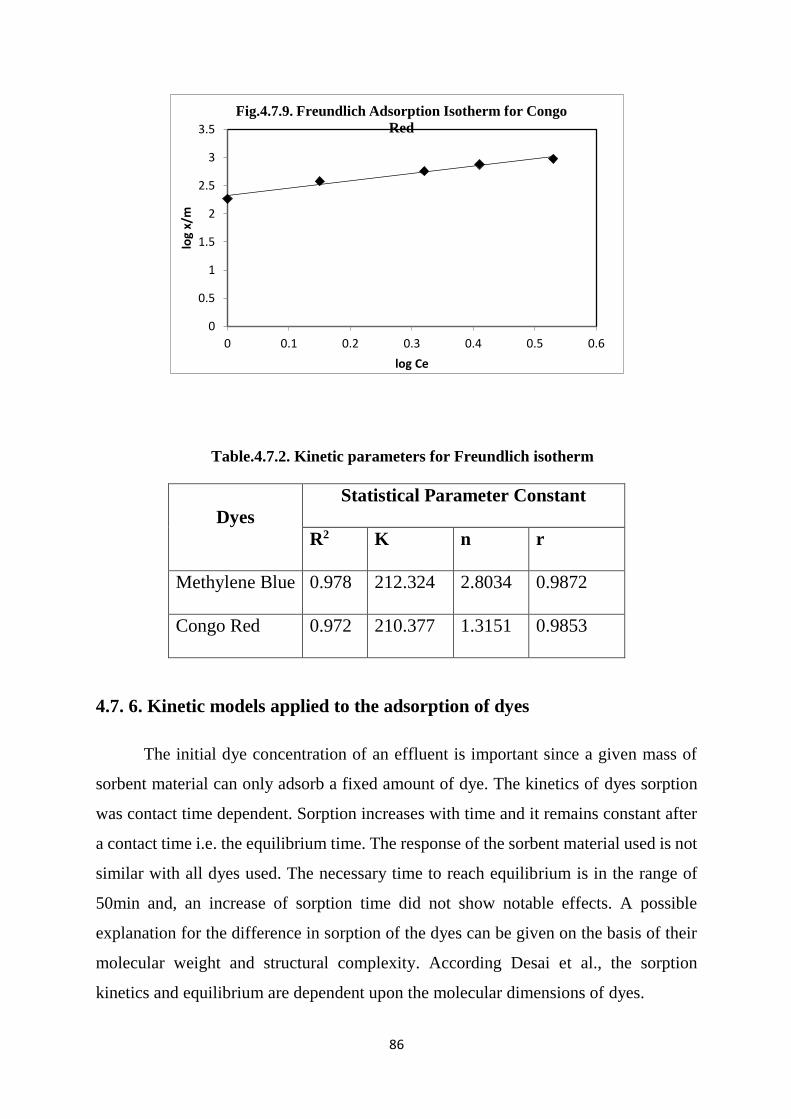
86
Table.4.7.2. Kinetic parameters for Freundlich isotherm
Dyes
Statistical Parameter Constant
R2 K n r
Methylene Blue 0.978 212.324 2.8034 0.9872
Congo Red 0.972 210.377 1.3151 0.9853
4.7. 6. Kinetic models applied to the adsorption of dyes
The initial dye concentration of an effluent is important since a given mass of
sorbent material can only adsorb a fixed amount of dye. The kinetics of dyes sorption
was contact time dependent. Sorption increases with time and it remains constant after
a contact time i.e. the equilibrium time. The response of the sorbent material used is not
similar with all dyes used. The necessary time to reach equilibrium is in the range of
50min and, an increase of sorption time did not show notable effects. A possible
explanation for the difference in sorption of the dyes can be given on the basis of their
molecular weight and structural complexity. According Desai et al., the sorption
kinetics and equilibrium are dependent upon the molecular dimensions of dyes.
0
0.5
1
1.5
2
2.5
3
3.5
0 0.1 0.2 0.3 0.4 0.5 0.6
log
x/m
log Ce
Fig.4.7.9. Freundlich Adsorption Isotherm for Congo
Red
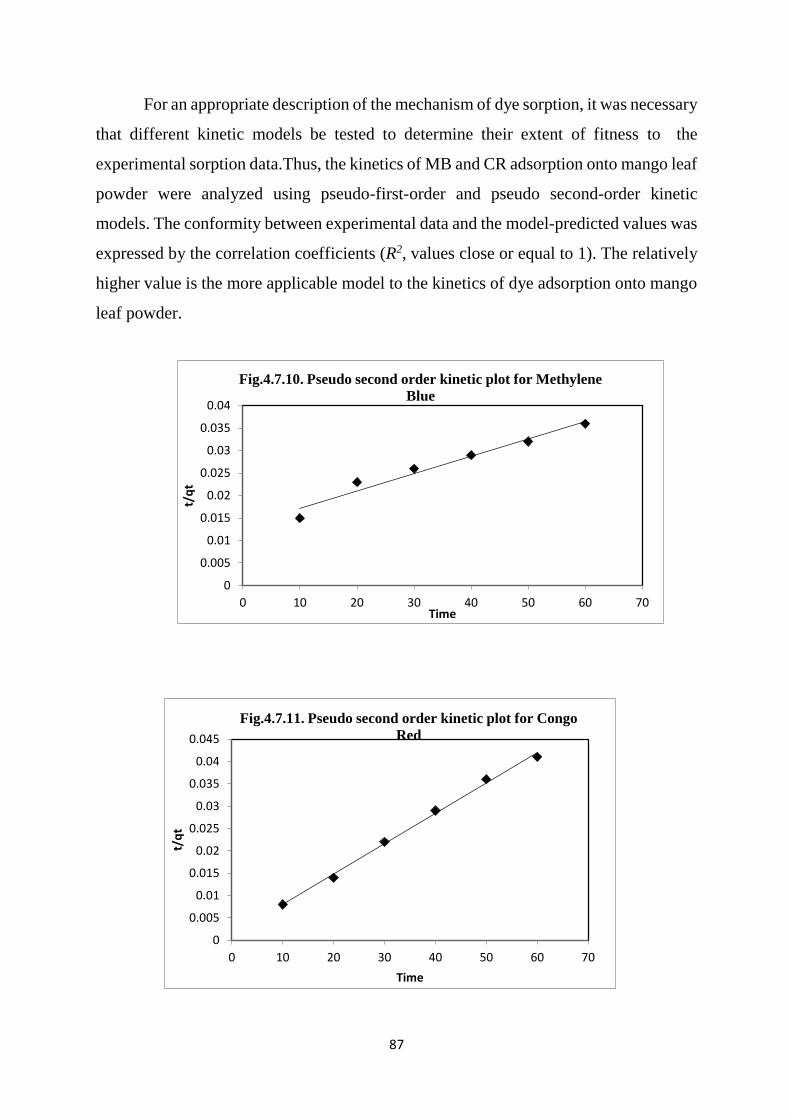
87
For an appropriate description of the mechanism of dye sorption, it was necessary
that different kinetic models be tested to determine their extent of fitness to the
experimental sorption data.Thus, the kinetics of MB and CR adsorption onto mango leaf
powder were analyzed using pseudo-first-order and pseudo second-order kinetic
models. The conformity between experimental data and the model-predicted values was
expressed by the correlation coefficients (R2, values close or equal to 1). The relatively
higher value is the more applicable model to the kinetics of dye adsorption onto mango
leaf powder.
0
0.005
0.01
0.015
0.02
0.025
0.03
0.035
0.04
0 10 20 30 40 50 60 70
t/q
t
Time
Fig.4.7.10. Pseudo second order kinetic plot for Methylene
Blue
0
0.005
0.01
0.015
0.02
0.025
0.03
0.035
0.04
0.045
0 10 20 30 40 50 60 70
t/q
t
Time
Fig.4.7.11. Pseudo second order kinetic plot for Congo
Red
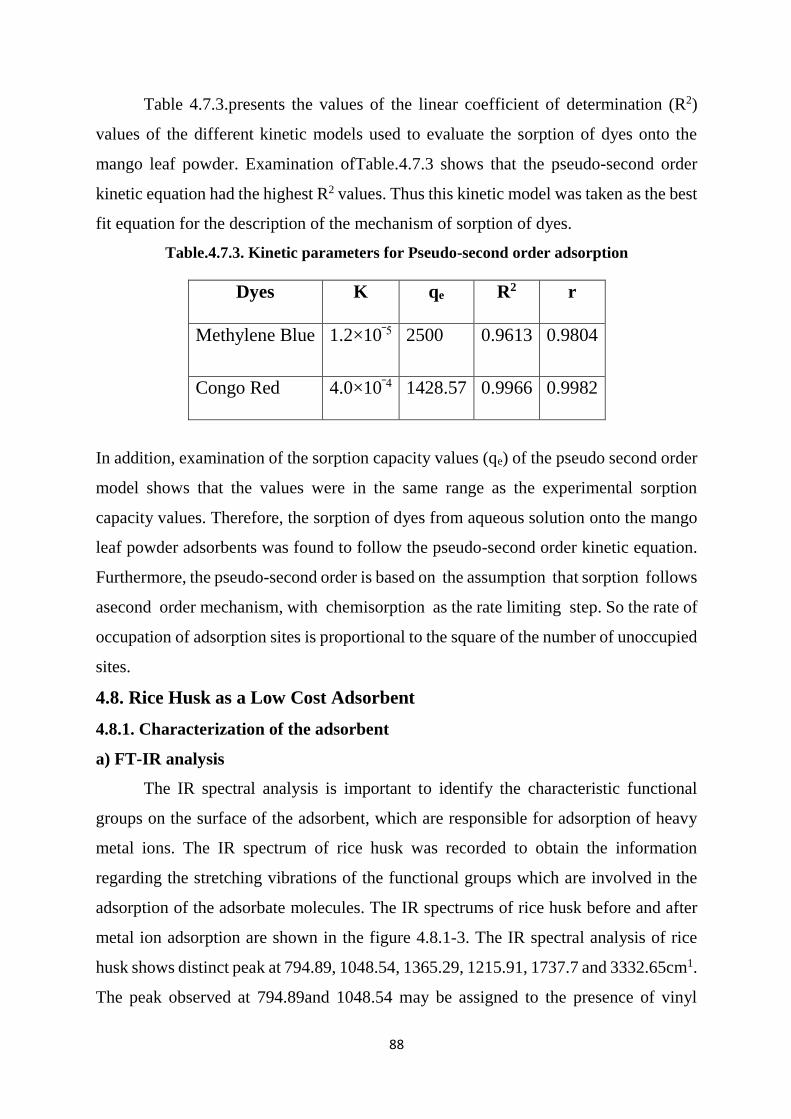
88
Table 4.7.3.presents the values of the linear coefficient of determination (R2)
values of the different kinetic models used to evaluate the sorption of dyes onto the
mango leaf powder. Examination ofTable.4.7.3 shows that the pseudo-second order
kinetic equation had the highest R2 values. Thus this kinetic model was taken as the best
fit equation for the description of the mechanism of sorption of dyes.
Table.4.7.3. Kinetic parameters for Pseudo-second order adsorption
Dyes K qe R2 r
Methylene Blue 1.2×10‾5 2500 0.9613 0.9804
Congo Red 4.0×10‾4 1428.57 0.9966 0.9982
In addition, examination of the sorption capacity values (qe) of the pseudo second order
model shows that the values were in the same range as the experimental sorption
capacity values. Therefore, the sorption of dyes from aqueous solution onto the mango
leaf powder adsorbents was found to follow the pseudo-second order kinetic equation.
Furthermore, the pseudo-second order is based on the assumption that sorption follows
asecond order mechanism, with chemisorption as the rate limiting step. So the rate of
occupation of adsorption sites is proportional to the square of the number of unoccupied
sites.
4.8. Rice Husk as a Low Cost Adsorbent
4.8.1. Characterization of the adsorbent
a) FT-IR analysis
The IR spectral analysis is important to identify the characteristic functional
groups on the surface of the adsorbent, which are responsible for adsorption of heavy
metal ions. The IR spectrum of rice husk was recorded to obtain the information
regarding the stretching vibrations of the functional groups which are involved in the
adsorption of the adsorbate molecules. The IR spectrums of rice husk before and after
metal ion adsorption are shown in the figure 4.8.1-3. The IR spectral analysis of rice
husk shows distinct peak at 794.89, 1048.54, 1365.29, 1215.91, 1737.7 and 3332.65cm1.
The peak observed at 794.89and 1048.54 may be assigned to the presence of vinyl

89
compound ester group respectively. The peak observed at 1737.7cm-1 confirm the
presence of carbonyl group. The peak at3332.65cm-1reveals –OH group stretching. Also
the band which can be seen at 1376.5 and is related to COO– group.
Fig 4.8.1.IR spectrum of rice husk
Fig.4.8.2. IR spectrum of rice husk loaded with Cr
Fig.4.8.3. IR spectrum of rice husk loaded with Co
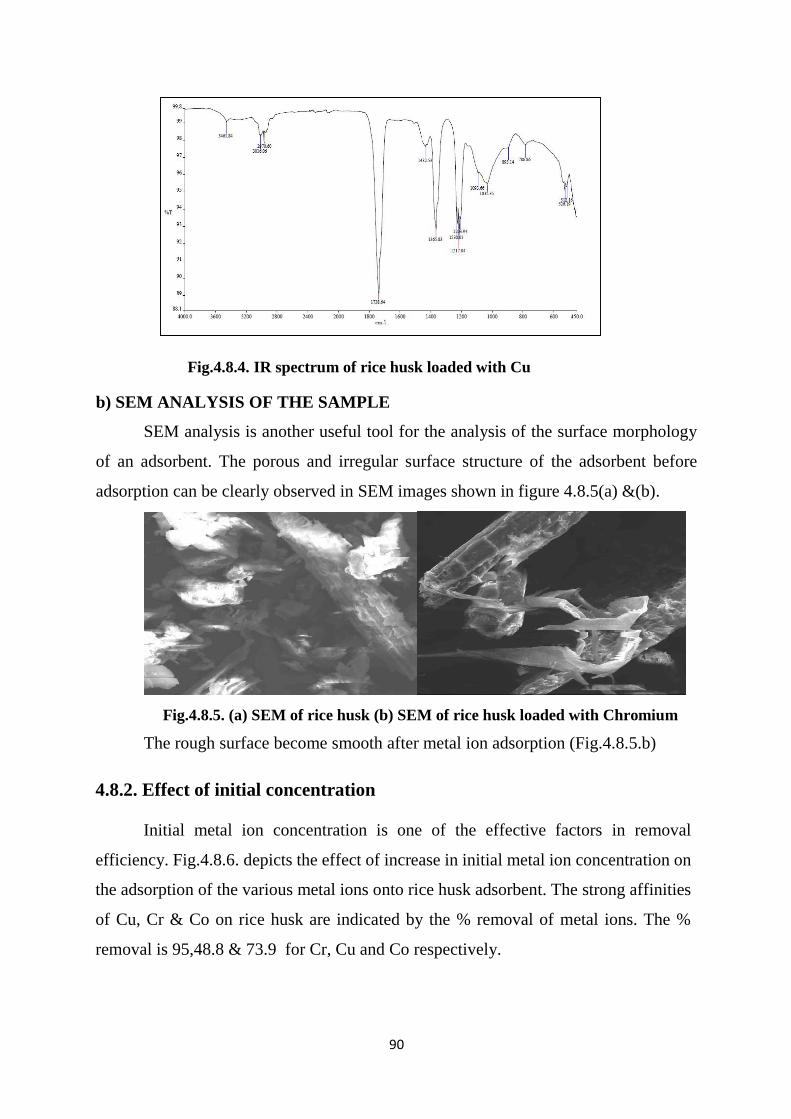
90
Fig.4.8.4. IR spectrum of rice husk loaded with Cu
b) SEM ANALYSIS OF THE SAMPLE
SEM analysis is another useful tool for the analysis of the surface morphology
of an adsorbent. The porous and irregular surface structure of the adsorbent before
adsorption can be clearly observed in SEM images shown in figure 4.8.5(a) &(b).
Fig.4.8.5. (a) SEM of rice husk (b) SEM of rice husk loaded with Chromium
The rough surface become smooth after metal ion adsorption (Fig.4.8.5.b)
4.8.2. Effect of initial concentration
Initial metal ion concentration is one of the effective factors in removal
efficiency. Fig.4.8.6. depicts the effect of increase in initial metal ion concentration on
the adsorption of the various metal ions onto rice husk adsorbent. The strong affinities
of Cu, Cr & Co on rice husk are indicated by the % removal of metal ions. The %
removal is 95,48.8 & 73.9 for Cr, Cu and Co respectively.

91
4.8.3. Effect of adsorbent dosage
The effect of adsorbent dosage is illustrated in figure 4.8.7.It was found that the
percentage of metal ion removal was increased as the adsorbent dosage increased from
50mg to 300mg.This is because increase in adsorbent dosage attributed to increase in
surface area and availability of more adsorption sites.
4.8.4. Effect of agitation time
To establish an appropriate contact time between the rice husk and metallic ion
solution, adsorption capacities of metal ion were measured as a function of time
(Fig.4.8.8). The maximum adsorption percentage was 95.7%. This phenomenon may be
related to the vacant adsorption sites on the adsorbent surface. During the initial stage
0
10
20
30
40
50
60
70
80
90
100
0 100 200 300 400 500
%
R
E
M
O
V
A
L
INITIAL CONCENTRATION (ppm)
Fig.4.8.6. Effect of initial concentration on adsorption
Co Cr Cu
0
20
40
60
80
100
120
0 0.05 0.1 0.15 0.2 0.25 0.3
%
R
E
M
O
V
A
L
AMOUNT OF ADSORBENT
Fig.4.8.7. Effect of adsorbent dosage on adsorption
% removal of Cu % removal of Cr % removal of Co

92
of sorption, a large number of vacant surface sites are available for adsorption. After
lapse of time, the remaining vacant surface sites can be occupied difficultly due to
repulsive forces between the solute molecules on the adsorbent surface and the bulk
phase.
4.8.5. Effect of temperature
The results regarding the effect of temperature on the biosorption of metal ions
by rice husk is shown in Fig.(4.8.9). The results indicated that, biosorption of metal
ions increase with increase in temperature from 303-323K keeping other parameters
constant.
0
20
40
60
80
100
120
0 10 20 30 40 50 60 70
%
R
E
M
O
V
A
L
TIME
Fig.4.8.8. Effect of agitation time on adsorption
%REMOVAL OF Cu %remov al of Cr % removal of Co
41
71
89
48
75
92
49
79
94
Cu Co Cr
Fig.4.8.9. Effect of Temperature
30 40 50

93
The biosorption which is favorable at high temperature indicates the endothermic
nature of the process. This might be due to the increase in the number of pores
on the biomass surface at high temperature. The high temperature reduce the
thickness of outer surface of rice husk and increase the kinetic energy of metal
ions, as a result, the adsorption of the metal ions increases with temperature
increases with temperature.
4.8.6. Isotherm data analysis
Adsorption isotherms described the adsorption process and the interaction
between adsorbates and adsorbents. It is important to establish the most
acceptable correlations for the batch equilibrium data for analysis and design of
adsorption systems. The Langmuir and Freundlich models are the most
frequently used to describe the equilibrium data of adsorption. In the present
work, these two models were applied on the study of adsorption isotherms of
metal ions.
Taking into consideration the values of the coefficient of correlation as
criteria for goodness of fit, for most investigated systems the Freundlich equation
gives a better correlation between the theoretical and experimental data for the
whole concentration range when compared with Langmuir equations.
The Freundlich model assumes a heterogeneous surface with a
nonuniform distribution of heat of adsorption over the surface, and the adsorption
sites are distributed exponentially with respect to the heat of adsorption. Smaller
value of implies stronger interaction between the adsorbent and heavy metal
while equal to 1 indicates linear adsorption leading to identical adsorption
energies for all sites. The parameters of Freundlich isotherm are shown in Table
4.8.1. Among the limited concentrations, the fact that the experimental data fitted
well with the Freundlich isotherm model indicates that the surface of the
adsorbent was nonuniform.
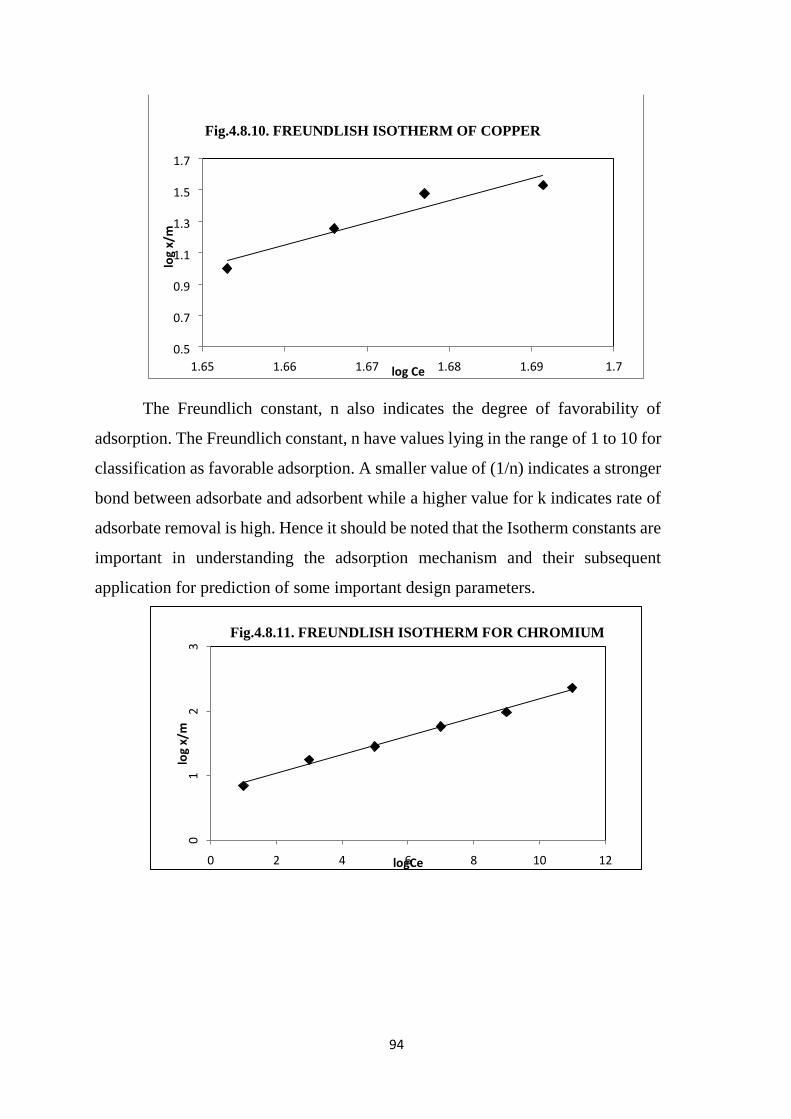
94
The Freundlich constant, n also indicates the degree of favorability of
adsorption. The Freundlich constant, n have values lying in the range of 1 to 10 for
classification as favorable adsorption. A smaller value of (1/n) indicates a stronger
bond between adsorbate and adsorbent while a higher value for k indicates rate of
adsorbate removal is high. Hence it should be noted that the Isotherm constants are
important in understanding the adsorption mechanism and their subsequent
application for prediction of some important design parameters.
0.5
0.7
0.9
1.1
1.3
1.5
1.7
1.65 1.66 1.67 1.68 1.69 1.7 log Ce
Fig.4.8.10. FREUNDLISH ISOTHERM OF COPPER
0 2 4 6 8 10 12 logCe
Fig.4.8.11. FREUNDLISH ISOTHERM FOR CHROMIUM

95
Table.4.8.1. Kinetic parameters for Freundlich isotherm
Metals
Statistical Parameter Constant
r R2 K n
Chromium 0.9893 0.9787 7.1187 2.8216
Cobalt 0.977 0.9545 4.8521 2.3821
Copper 0.9492 0.901 0.4267 1.5486
4.8.7. Adsorption kinetics
The kinetics of metal ion adsorption was evaluated by applying two common
models: the pseudo-first-order kinetic model and the pseudo-second-order kinetic
model. Several steps can be used to examine the controlling mechanism of
adsorption process such as chemical reaction, diffusion control and mass transfer;
kinetic models are used to test experimental data from the adsorption of Cu, Cr and
Co. The kinetics of metal adsorption onto rice husk is required for selecting
optimum operating conditions for the full-scale batch process. The kinetic
parameters, which are helpful for the prediction of adsorption rate, give important
information for designing and modeling the adsorption processes.
0
0.4
0.8
1.2
1.6
2
0 0.5 1 1.5 2 2.5 log Ce
Fig.4.8.12. FREUNDLISH ISOTHERM FOR COBALT

96
The pseudo-second-order model plots of Co, Cu and Cr adsorbed on rice
husk were shown in figure 4.8.13-15 respectively. Comparing the correlation
coefficient it could be detected that the kinetics of Cu, Cr and Co adsorbed on rice
husk conformed to the Ho’s pseudo-second order rate equation better than the
Lagergren’s pseudo-second order rate equation.
The pseudo-second-order kinetic model assumes that chemical adsorption
can be the rate limiting stage involving valence forces through sharing or exchange
of electrons between adsorbent and adsorbate. The rate constant and correlation
0
0.05
0.1
0.15
0.2
0.25
0.3
0.35
0 20 40 60 80
t/qt
TIME
Fig.4.8.13. Pseudo second order kinetics of Co
0
0.5
1
1.5
2
2.5
0 10 20 30 40 50 60 70
t/qt
TIME
Fig.4.8.14.Pseudo Second order kinetics of Cu
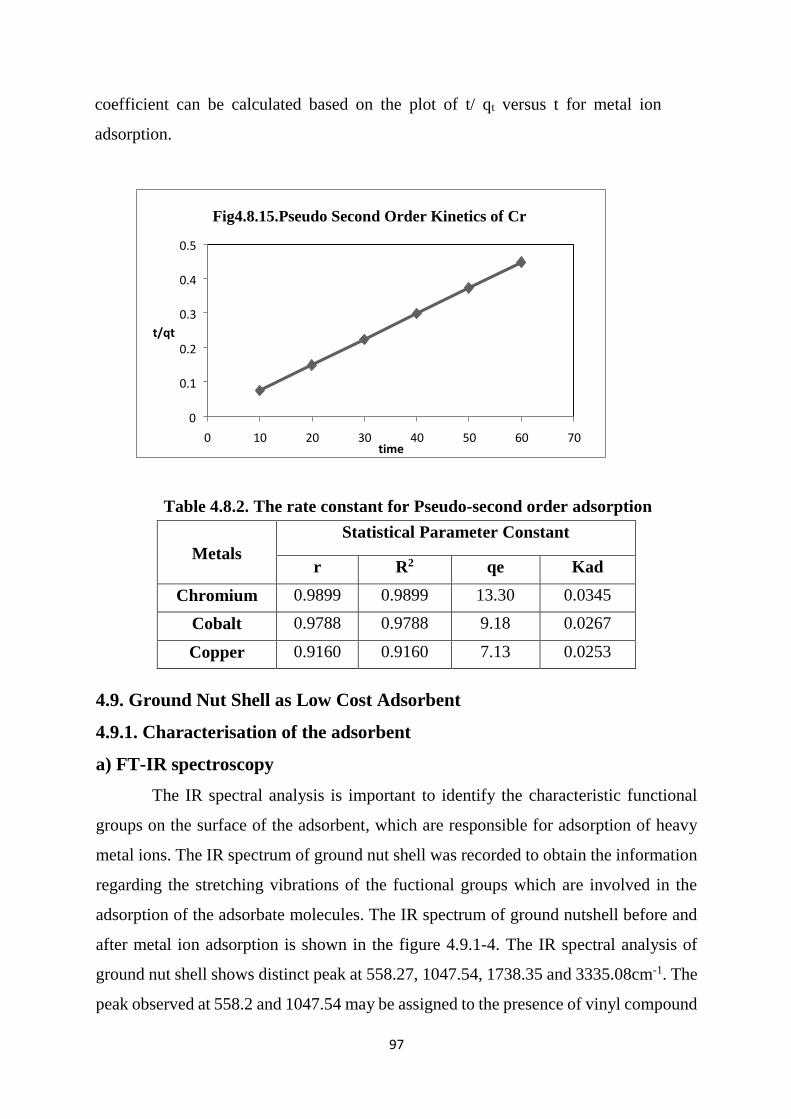
97
coefficient can be calculated based on the plot of t/ qt versus t for metal ion
adsorption.
Table 4.8.2. The rate constant for Pseudo-second order adsorption
Metals
Statistical Parameter Constant
r R2 qe Kad
Chromium 0.9899 0.9899 13.30 0.0345
Cobalt 0.9788 0.9788 9.18 0.0267
Copper 0.9160 0.9160 7.13 0.0253
4.9. Ground Nut Shell as Low Cost Adsorbent
4.9.1. Characterisation of the adsorbent
a) FT-IR spectroscopy
The IR spectral analysis is important to identify the characteristic functional
groups on the surface of the adsorbent, which are responsible for adsorption of heavy
metal ions. The IR spectrum of ground nut shell was recorded to obtain the information
regarding the stretching vibrations of the fuctional groups which are involved in the
adsorption of the adsorbate molecules. The IR spectrum of ground nutshell before and
after metal ion adsorption is shown in the figure 4.9.1-4. The IR spectral analysis of
ground nut shell shows distinct peak at 558.27, 1047.54, 1738.35 and 3335.08cm-1. The
peak observed at 558.2 and 1047.54 may be assigned to the presence of vinyl compound
0
0.1
0.2
0.3
0.4
0.5
0 10 20 30 40 50 60 70
t/qt
time
Fig4.8.15.Pseudo Second Order Kinetics of Cr

98
ester group respectively. The peak observed at 1738.35cm-1 confirm the presence of
carbonyl group. The peak at 3335.08cm-1 reveals OH stretching vibration. It can be
seen from the spectra that upon adsorption of metal ions by ground nut shell, the broad
OH and NH bands at 3395 cm−1 was shifted to 3285 cm−1. This is indicative of the
binding of metals with hydroxyl and amino groups. There is a shift in the C=O of ester
from 1035 to 1031 cm−1. This indicates that carboxyl groups are likely to be the main
group to be involved in binding with metals. Since the biosorption was carried out at
ambient pH which was higher than pHpzc, the COOH groups will be deprotonated to
form carboxylate ions which would attract the metal ions.
Fig 4.9.1. IR spectrum of ground nut shell
Fig.4.9.2. IR spectrum of ground nut shell loaded with Cr

99
Fig.4.9.3. IR spectrum of ground nut shell loaded with Co
Fig.4.9.4. IR spectrum of ground nut shell loaded with Cu
b)SEM (Scanning Electron Microscope)
SEM studies stands for scanning electron microscopy, which is used for studying
the surface morphology of substances due to its high magnification imaging capability.
Fig. 4.9.5. SEM images of ground nut shell (a) before and (b) after adsorption
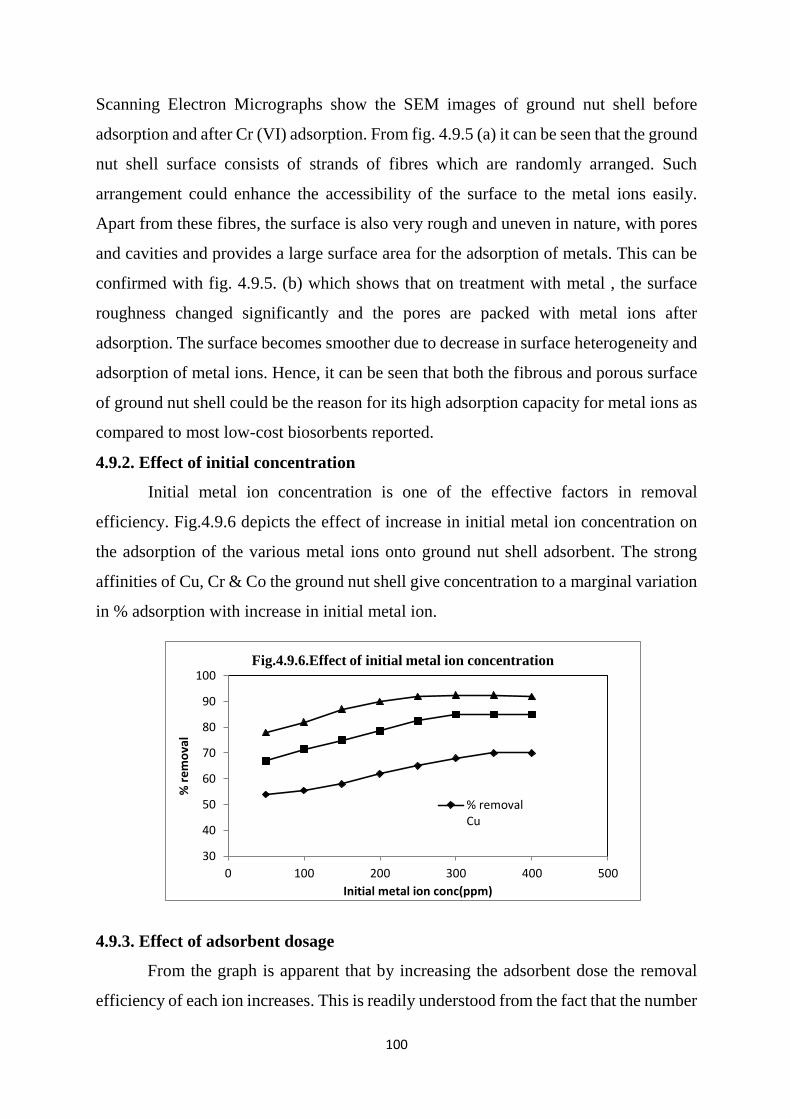
100
Scanning Electron Micrographs show the SEM images of ground nut shell before
adsorption and after Cr (VI) adsorption. From fig. 4.9.5 (a) it can be seen that the ground
nut shell surface consists of strands of fibres which are randomly arranged. Such
arrangement could enhance the accessibility of the surface to the metal ions easily.
Apart from these fibres, the surface is also very rough and uneven in nature, with pores
and cavities and provides a large surface area for the adsorption of metals. This can be
confirmed with fig. 4.9.5. (b) which shows that on treatment with metal , the surface
roughness changed significantly and the pores are packed with metal ions after
adsorption. The surface becomes smoother due to decrease in surface heterogeneity and
adsorption of metal ions. Hence, it can be seen that both the fibrous and porous surface
of ground nut shell could be the reason for its high adsorption capacity for metal ions as
compared to most low-cost biosorbents reported.
4.9.2. Effect of initial concentration
Initial metal ion concentration is one of the effective factors in removal
efficiency. Fig.4.9.6 depicts the effect of increase in initial metal ion concentration on
the adsorption of the various metal ions onto ground nut shell adsorbent. The strong
affinities of Cu, Cr & Co the ground nut shell give concentration to a marginal variation
in % adsorption with increase in initial metal ion.
4.9.3. Effect of adsorbent dosage
From the graph is apparent that by increasing the adsorbent dose the removal
efficiency of each ion increases. This is readily understood from the fact that the number
30
40
50
60
70
80
90
100
0 100 200 300 400 500
% r
em
ova
l
Initial metal ion conc(ppm)
Fig.4.9.6.Effect of initial metal ion concentration
% removalCu

101
of available adsorption site increases by increasing the adsorbent dose and therefore,
result in the increase in the removal efficiency or the % adsorption of the respective ion
Also, at a low adsorbent dose, e.g. 0.025g, the available sorption sites were quite
insufficient compare with the large amount of adsorbate ions in the solution, resulting
in low removal efficiency. However, at a higher adsorbent dose, e.g. 0.20g, the sorption
sites were sufficient thereby resulting in a rapid removal of the different adsorbates. The
adsorption order of the adsorbate on the ground nutshell was observed to follow the
pattern Cr> Co> Cu.
4.9.4. Effect of agitation time
To establish an appropriate contact time between the ground nutshell and
metallic ion solution, adsorption capacities of metal ion were measured as a function of
time (Fig.4.9.8).
20
30
40
50
60
70
80
90
100
0 0.05 0.1 0.15 0.2 0.25 0.3
% r
em
ova
l
Wt. of Adsorbent(g)
Fig.4.9.7.Effect of adsorbent dosage on adsorption
% removalCu
0
20
40
60
80
100
0 10 20 30 40 50 60 70
% r
em
ova
l
Time(min)
Fig.4.9.8. Effect of contact time on adsorption
% removalCu

102
The plot reveals that the rate of the percentage of removal is higher at the beginning.
That is probably due to the larger surface area of the ground nut shell being available at
beginning for the adsorption of metals. As the surface adsorption sites become
exhausted, the uptake rate is controlled by the rate at which the adsorbate is transported
from the exterior to the interior sites of the adsorbent particles. The rate of metal ion
removal was attained after approximately 40 min stirring.
4.9.5. Effect of Temperature
Temperature dependence of the adsorption process is associated with several
thermodynamic parameters. Fig.4.9.10 shows an decreasing trend of Cr (VI), Cu(II) and
Co(II) removal with the rise in temperature from 30oC to 50oC. The decrease in metal
ion uptake may be due to the exothermic nature of adsorption. As temperature increases
adsorption decreases.
4.9.6. Isotherm data analysis
The parameters obtained from the different isotherm models provide important
information on the adsorption mechanisms and the surface properties and affinities of
the adsorbent. The most widely accepted surface adsorption models for single-solute
systems are the Langmuir and Freundlich models. Langmuir and Freundlich isotherms
are used for fitting the experimental data in adsorption studies to understand the extent
and degree of favorability of adsorption.
0
10
20
30
40
50
60
70
80
90
100
Cu Co Cr
Fig.4.9.10. Effect of temperature on adsorption
30
40
50

103

104
According to the obtained data for the model parameters it is obvious that
Freundlich equilibrium model is favourable. Taking into consideration the values of the
coefficient of correlation as criteria for goodness of fit, for most investigated systems
the Freundlich equation gives a better correlation between the theoretical and
experimental data for the whole concentration range when compared with Langmuir
equations.
The Freundlich constant, n also indicates the degree of favorability of adsorption.
The Freundlich constant, n have values lying in the range of 1 to 10 for classification as
favorable adsorption. A smaller value of (1/n) indicates a stronger bond between
adsorbate and adsorbent while a higher value for k indicates rate of adsorbate removal
is high. Hence it should be noted that the Isotherm constants are important in
understanding the adsorption mechanism and their subsequent application for prediction
of some important design parameters.
Table.4.9.1. Kinetic parameters for Freundlich isotherm
Metals
Statistical Parameter Constant
r R2 K n
Chromium 0.9913 0.9827 6.309 2.270
Cobalt 0.9802 0.9608 5.754 1.916
Copper 0.9079 0.8243 2.880 1.250
4.9.7. Adsorption Kinetics
Several steps can be used to examine the controlling mechanism of adsorption
process such as chemical reaction, diffusion control and mass transfer; kinetic models
are used to test experimental data from the adsorption of Cr, Cu onto Co. The kinetics
of metal adsorption onto ground nut shell is required for selecting optimum operating
conditions for the full-scale batch process. The kinetic parameters, which are helpful for
the prediction of adsorption rate, give important information for designing and modeling
the adsorption processes.
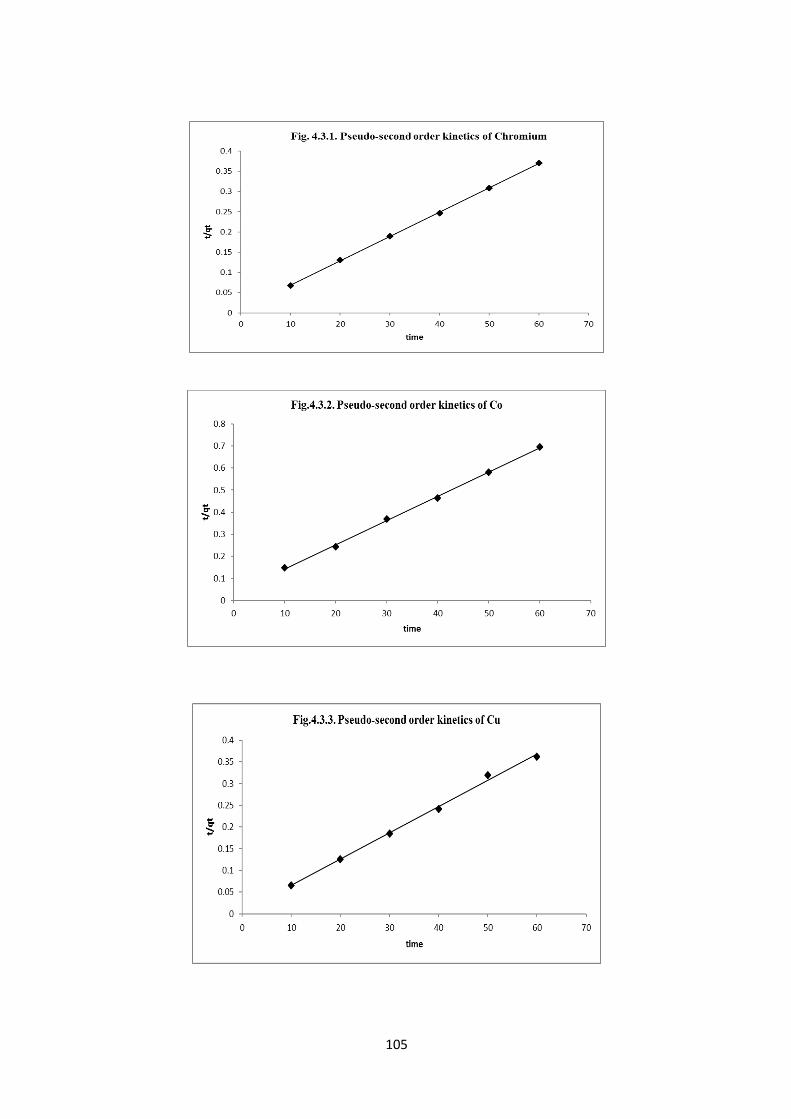
105

106
Table.4.9.2. Kinetic parameters for Pseudo-second order kinetics
Metals
Statistical Parameter Constant
R R2 Kad qe
Chromium 0.9999 0.9998 0.1003 12.20
Cobalt 0.9996 0.9992 0.0139 8.22
Copper 0.9945 0.9890 0.0076 4.10
Table 4.9.2 presents the kinetic parameters resulted by fitting the pseudo-second
order equation to the experimental data. The pseudo-second order model has been
successfully used to fit the kinetic data. When the linearities of the plots of the two
kinetic models were compared, the linearities of the chemisorptions pseudo-second
order kinetic model were higher for each concentration than when the Lagrenge pseudo-
first order kinetic model was applied. This shows that the mechanism of the adsorption
of metal ions by ground nut shell can be described by the pseudo-second order kinetic
model, based on the assumption that the rate- limiting step may be chemisorptions
involving valency forces through sharing or exchange of electrons between the
hydrophilic edge sites of shell powder and metal ions. The correlation coefficient
indicates that the kinetics of Cr, Co and Cu adsorbed on ground nut shell obey Ho’s
pseudo-second order rate equation.
4.10. Tamarind Shell as Low Cost Adsorbent
4.10.1. Characterisation of the adsorbent
a. FT-IR Spectroscopy
Infrared (IR) is the name given to the range in the electromagnetic spectrum between
visible light and microwave radiation, conventionally from 0.8 µm to 1 mm wavelength
(12,500–10 cm–1). The far (1 mm–25 µm; 10–400 cm–1) to mid-IR (25 µm–2.5 µm;
400–4000 cm–1) range coincides with the energies needed to excite fundamental modes
of rotation and vibration in gases, liquids or solids. The IR spectral analysis is important
to identify the characteristic functional groups on the surface of the adsorbent, which
are responsible for adsorption of heavy metal ions. The IR spectrum of tamarind shell
was recorded to obtain the information regarding the stretching vibrations of the

107
functional groups which are involved in the adsorption of the adsorbate molecules. The
IR spectrum of tamarind shell before and after metal ion adsorption are shown in the
figure. The IR spectral analysis of tamarind shell shows distinct peak at 542.27, 1033.81,
1217.06, 1365.88, 1738.12, 2975.90, 3036.14, and 3449.79cm-1. The peak observed at
1033.81, 1217.06, 1365.88cm-1 may be assigned to the presence of sulfoxide, aliphatic
C-N vibrations, azides, aromatic nitro compounds respectively. The peak observed at
1738.12cm-1 confirms the presence of carbonyl aldehyde group. The peak at 2975.90
reveals alkane stretching vibration, 3036.14cm-1 for alkene and 3449.79cm-1 for amine
group respectively.
Fig.4.10.1. IR Spectrum of Tamarind Shell
Fig.4.10.2. IR Spectrum of Tamarind Shell loaded with Cr

108
Fig.4.10.3. IR Spectrum of Tamarind Shell loaded with Co
Fig.4.10.4. IR Spectrum of Tamarind Shell loaded with Cu
b) SEM Analysis
SEM analysis is another useful tool for the analysis of the surface morphology
of an adsorbent.
Fig. 4.10.5. SEM images of tamarind shell (a) before and (b) after adsorption
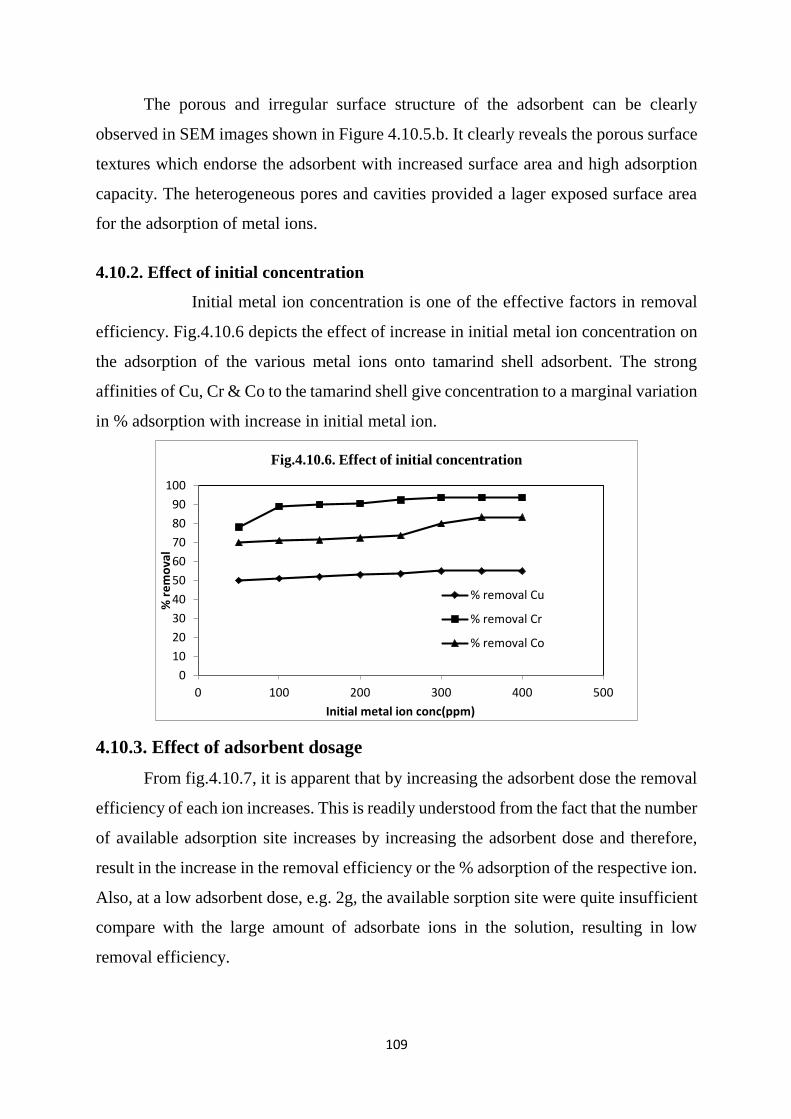
109
The porous and irregular surface structure of the adsorbent can be clearly
observed in SEM images shown in Figure 4.10.5.b. It clearly reveals the porous surface
textures which endorse the adsorbent with increased surface area and high adsorption
capacity. The heterogeneous pores and cavities provided a lager exposed surface area
for the adsorption of metal ions.
4.10.2. Effect of initial concentration
Initial metal ion concentration is one of the effective factors in removal
efficiency. Fig.4.10.6 depicts the effect of increase in initial metal ion concentration on
the adsorption of the various metal ions onto tamarind shell adsorbent. The strong
affinities of Cu, Cr & Co to the tamarind shell give concentration to a marginal variation
in % adsorption with increase in initial metal ion.
4.10.3. Effect of adsorbent dosage
From fig.4.10.7, it is apparent that by increasing the adsorbent dose the removal
efficiency of each ion increases. This is readily understood from the fact that the number
of available adsorption site increases by increasing the adsorbent dose and therefore,
result in the increase in the removal efficiency or the % adsorption of the respective ion.
Also, at a low adsorbent dose, e.g. 2g, the available sorption site were quite insufficient
compare with the large amount of adsorbate ions in the solution, resulting in low
removal efficiency.
0
10
20
30
40
50
60
70
80
90
100
0 100 200 300 400 500
% r
em
ova
l
Initial metal ion conc(ppm)
Fig.4.10.6. Effect of initial concentration
% removal Cu
% removal Cr
% removal Co

110
However, at a higher adsorbent dose, e.g. 0.25g, the sorption sites were sufficient
thereby resulting in a rapid removal of the different adsorbates. The adsorption order of
the adsorbate on the tamarind shell was observed to follow the pattern Cr> Co> Cu.
4.10.4 Effect of agitation time
To establish an appropriate contact time between the tamarind shell and metallic
ion solution, adsorption capacities of metal ion were measured as a function of time
(Fig.4.10.8).
The plot reveals that the rate of the percentage of heavy metal ion removal is higher at
the beginning. That is probably due to the larger surface area of the tamarind shell being
available at beginning for the adsorption of metals. As the surface adsorption sites
become exhausted, the uptake rate is controlled by the rate at which the adsorbate is
0
10
20
30
40
50
60
70
80
90
100
0 0.05 0.1 0.15 0.2 0.25 0.3
% r
em
ova
l
Wt.of Adsorbent(g)
Fig.4.10.7. Effect of Adsorbent dosage
%removal Cu
%removal Co
%removal Cr
0
10
20
30
40
50
60
70
80
90
100
0 20 40 60 80
% r
em
ova
l
Time(min)
Fig.4.10.8. Effect of time
%removal Cu
%removal Cr
%removal Co
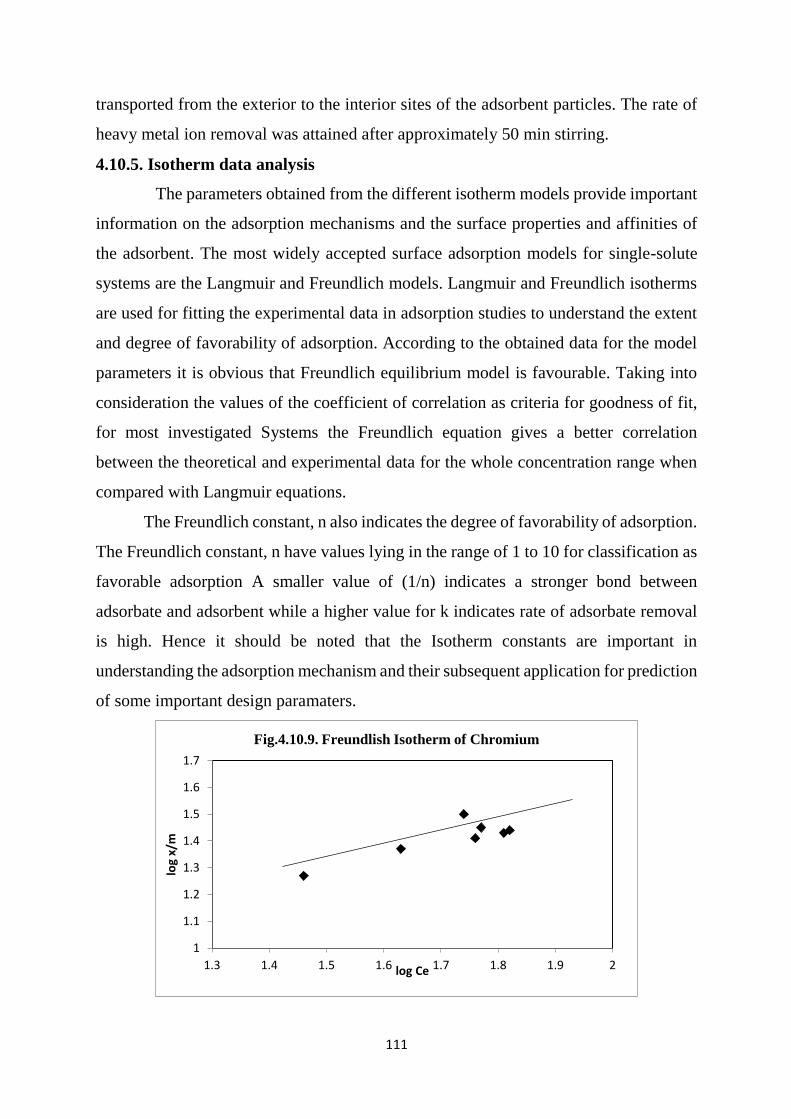
111
transported from the exterior to the interior sites of the adsorbent particles. The rate of
heavy metal ion removal was attained after approximately 50 min stirring.
4.10.5. Isotherm data analysis
The parameters obtained from the different isotherm models provide important
information on the adsorption mechanisms and the surface properties and affinities of
the adsorbent. The most widely accepted surface adsorption models for single-solute
systems are the Langmuir and Freundlich models. Langmuir and Freundlich isotherms
are used for fitting the experimental data in adsorption studies to understand the extent
and degree of favorability of adsorption. According to the obtained data for the model
parameters it is obvious that Freundlich equilibrium model is favourable. Taking into
consideration the values of the coefficient of correlation as criteria for goodness of fit,
for most investigated Systems the Freundlich equation gives a better correlation
between the theoretical and experimental data for the whole concentration range when
compared with Langmuir equations.
The Freundlich constant, n also indicates the degree of favorability of adsorption.
The Freundlich constant, n have values lying in the range of 1 to 10 for classification as
favorable adsorption A smaller value of (1/n) indicates a stronger bond between
adsorbate and adsorbent while a higher value for k indicates rate of adsorbate removal
is high. Hence it should be noted that the Isotherm constants are important in
understanding the adsorption mechanism and their subsequent application for prediction
of some important design paramaters.
1
1.1
1.2
1.3
1.4
1.5
1.6
1.7
1.3 1.4 1.5 1.6 1.7 1.8 1.9 2
log
x/m
log Ce
Fig.4.10.9. Freundlish Isotherm of Chromium
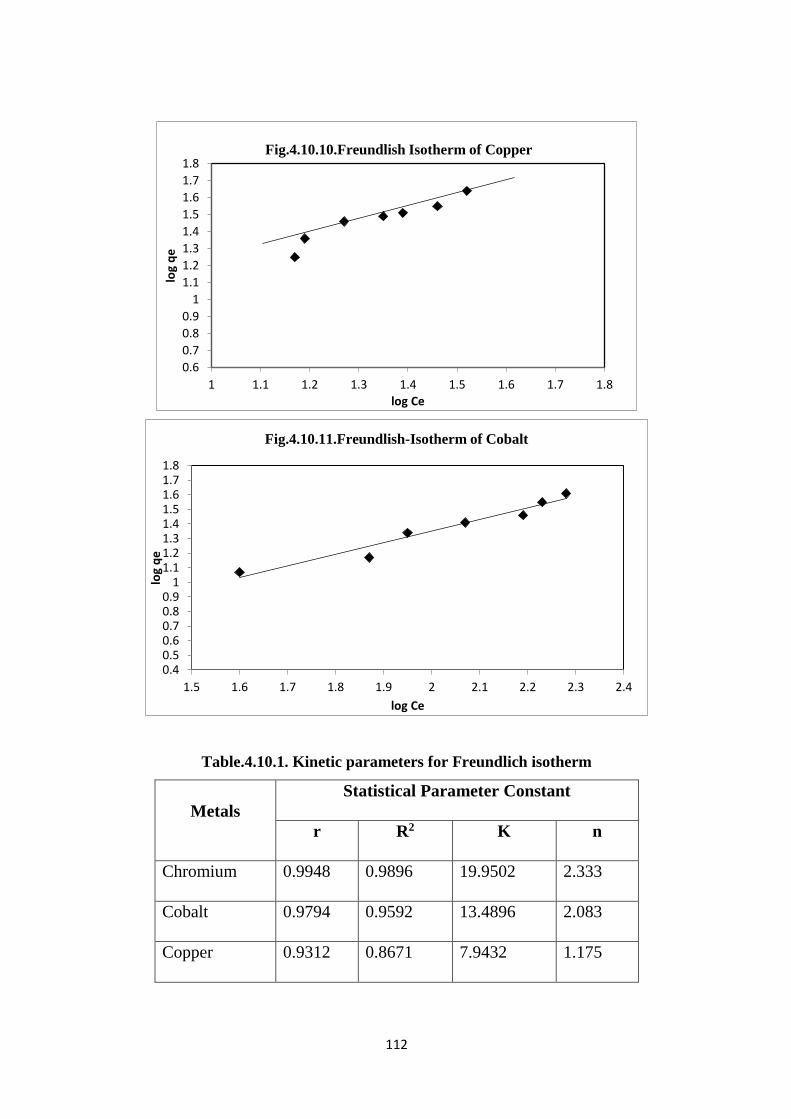
112
Table.4.10.1. Kinetic parameters for Freundlich isotherm
Metals
Statistical Parameter Constant
r R2 K n
Chromium 0.9948 0.9896 19.9502 2.333
Cobalt 0.9794 0.9592 13.4896 2.083
Copper 0.9312 0.8671 7.9432 1.175
0.6
0.7
0.8
0.9
1
1.1
1.2
1.3
1.4
1.5
1.6
1.7
1.8
1 1.1 1.2 1.3 1.4 1.5 1.6 1.7 1.8
log
qe
log Ce
Fig.4.10.10.Freundlish Isotherm of Copper
0.40.50.60.70.80.9
11.11.21.31.41.51.61.71.8
1.5 1.6 1.7 1.8 1.9 2 2.1 2.2 2.3 2.4
log
qe
log Ce
Fig.4.10.11.Freundlish-Isotherm of Cobalt

113
4.10.6. Adsorption kinetics
Several steps can be used to examine the controlling mechanism of
adsorption process such as chemical reaction, diffusion control and mass transfer;
kinetic models are used to test experimental data from the adsorption of Cr, Co onto Cu.
The kinetics of metal adsorption onto tamarind shell is required for selecting optimum
operating conditions for the full-scale batch process. The kinetic parameters, which are
helpful for the prediction of adsorption rate, give important information for designing
and modeling the adsorption processes.
0
0.1
0.2
0.3
0.4
0.5
0.6
0.7
0.8
0 10 20 30 40 50 60 70
t/q
t
Time
Fig.4.10.12. Pseudo-second Order Kinetics of Cr
0
0.2
0.4
0.6
0.8
0 10 20 30 40 50 60 70
t/q
t
Time
Fig.4.10.13. Pseudo-second Order Kinetics of Co
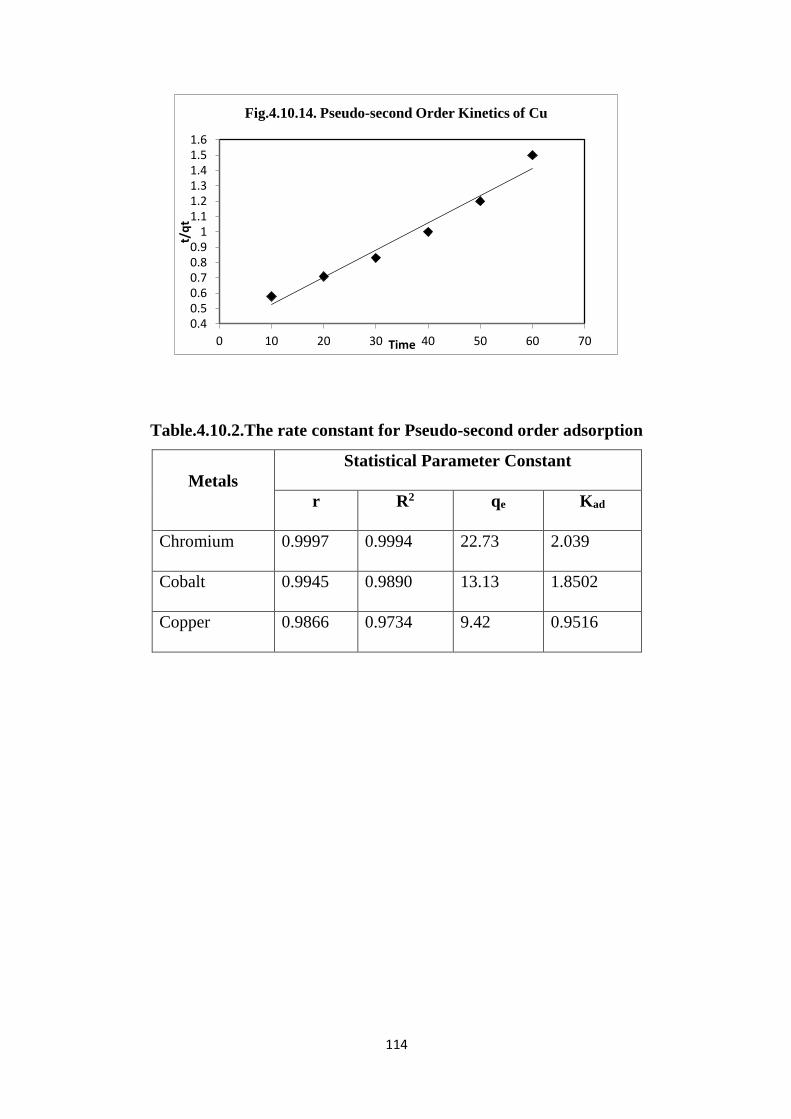
114
Table.4.10.2.The rate constant for Pseudo-second order adsorption
Metals
Statistical Parameter Constant
r R2 qe Kad
Chromium 0.9997 0.9994 22.73 2.039
Cobalt 0.9945 0.9890 13.13 1.8502
Copper 0.9866 0.9734 9.42 0.9516
0.40.50.60.70.80.9
11.11.21.31.41.51.6
0 10 20 30 40 50 60 70
t/q
t
Time
Fig.4.10.14. Pseudo-second Order Kinetics of Cu

115
Chapter V
CONCLUSION
Adsorption was an effective process for decolorisation of textile waste waters.
Although activated carbon was the most effective sorbent, other low cost sorbents could
be used for color removal. The final choice of the sorbent is a matter of economics.
Batch studies confirm that all the ten waste materials used as low cost adsorbent can be
used as a substitute for high cost adsorbents.
Agricultural by-product waste pomegranate peel, potato peel, rice husk, saw
dust, tamarind shell powder, ground nut shell, mango leaves, egg shell, used black tea
and passionfruit peel were tested for the removal of cationic dyes, namely methylene
blue, malachite green, eosin yellow, congo red and crystal violet and also for the
removal of heavy metal ions. All the adsorbents were collected, washed with distilled
water, dried, powdered and sieved. They were characterised by FT-IR spectroscopy and
SEM.
Adsorption of dyes were studied on pome granate peel, potato peel, mango
leaves, passion fruit peel, and used black tea as a function of amount of adsorbent, initial
concentration of the adsorbate and agitation time. The adsorption capacity of pome
granate peel decreased in the order crystal violet (CV) > malachite green (MG) >
methylene blue (MB), the % adsorption is almost having the same range. i.e. 89-92.8%.
The dyes sorption performances of potato peel are strongly affected by parameters such
as contact time, adsorbant dosage and dyes type. About 97.8% removal was obtained
for malachite green whereas the % removal was 96 and 92.4 for MB and CV
respectively. The amount of dye sorbed by this material increased with the increase of
these parameters at a specific time. The rate of adsorption increase with increase in
initial dye concentration and decreased for MG and MV whereas it increased for CV.
The adsorption of dyes on passion fruit increased with the increase of initial
concentration of dye, contact time and adsorbent dosage. The results of the investigation
show that passion fruit peel has a suitable adsorption capacity for the removal of
malachite green, crystal violet and eosin yellow from aqueous solution. The adsorption
capacity of passion fruit peel decreased in the order Eosin yellow > Malachite green >

116
Crystal violet. About 94% removal was obtained for Eosin yellow whereas the percent
removal was 75% and 70% for Malachite green and crystal violet respectively. With
used black tea about 89% removal was obtained for malachite green, 73% for eosin
yellow and crystal violet had a poor adsorption of 57.6%. The percentage removal of
MG and EY increases with initial adsorbate concentration reaches a maximum and then
decreases, whereas for CV, adsorption increases with dye concentration. Adsorption of
all three dyes increases with the increase in adsorbent dosage and contact time. The
possibility of adsorptive removal of dyes like methylene blue and Congo red from waste
water by mango leaf powder has been examined. About 98% removal was obtained for
methylene blue whereas the % removal was 96.5 for Congo red.
The egg shell could be employed as low cost adsorbents as alternatives to
commercial activated carbon and othe costly adsorbents for the removal of heavy metals
from waste water over a wide range of concentrations. About 94.5% removal was
obtained for chromium whereas the % removal was 85.1% and 73.5% for nickel and
copper respectively. The rice husk has high potential for removal of heavy metals like
Cu, Zn, Pb, Cd, Cr, Ni, Mn, Co, Fe, Hg and many more in terms of experimental
conditions, high adsorption capacity, binding mechanisms and pre-treatment methods.
The maximum sorption percentage was 95.8% for Cr(VI), 74.3% for Co( III) and
48.2% for Cu. The SEM image of rice husk showed that the rough structure of the
sorbent surface could improve the adsorption capacity. The results of this study
indicated that the uptake of Cu, Cr & Co ions by rice husk was affected by contact time,
initial heavy metal ion concentration and agitation rate. The uptake of Cu Cr& Co ions
increased with increasing contact time and decreasing ions concentration and
equilibrium was attained in 60 minutes of contact.
The study on ground nut shell as adsorbent has been successfully approved it to
act as a potential low cost adsorbent for removal of heavy metals from aqueous solution
as wastewater. About 94.8% removal was obtained for chromium whereas the %
removal was 85 and 72% for Cobalt and Copper respectively. Tamarind shell act as a
good adsorbent for heavy metal removal and the adsorption order of the adsorbate on
the tamarind shell was observed to follow the pattern Cr> Co> Cu. The maximum
sorption percentage was 93.66% for Cr(VI) , 83.3% for Co( III) and 55% for Cu.

117
The results of the study on saw dust indicated that the uptake of Cu Ni & Co ions
was affected by contact time, initial heavy metal ion concentration and agitation rate.
The uptake of Cu Ni & Co ions increased with increasing contact time and decreasing
ions concentration and equilibrium was attained in 60 minutes of contact. About 94.8%
removal was obtained for chromium whereas the % removal was 85 and 72% for Cobalt
and Copper respectively using Ground nut shell as the adsorbent.
From the kinetic model analysis using coefficient of determination, the pseudo-
second order model was the most fitting for the description of dye transport from the
bulk solution onto the surface of the mango leaf powder, pome granate peel, potato peel,
used black tea powder and passion fruit peel.
The kinetic data obtained from the study using saw dust, ground nut shell, egg
shell, rice husk and tamarind shell for the removal of heavy metal ions fitted well with
the pseudo-second order model and the sorption profiles derived based on the pseudo-
second order kinetic model showed good agreement with the experimental curves.
A good fitting of dyes sorption equilibrium data is obtained with Freundlich
model in all the range of dyes concentrations studied for all the adsorbents, namely,
mango leaf powder, pome granate peel, potato peel, used black tea powder and passion
fruit peel. The equilibrium data conformed well to the Freundlich with a high correlation
coefficient indicating that the adsorption of metal ions onto surface of the adsorbents
followed a multilayer pattern.
The presents work is the study of employing ten different waste materials as low
cost adsorbent for removal of cationic dyes like MB, MG, EY, CR and CV and heavy
metals like Cr, Co Cu and Ni from water and waste water. Adsorbents prepared from
domestic and agricultural waste, can successfully be used to remove the cationic dyes
and heavy metals from an aqueous solution. The present study concludes that they could
be employed as low-cost adsorbents as alternatives to commercial activated carbon and
other costly adsorbents for the removal of dyes and heavy metals from wastewater over
a wide range of concentrations. The adsorbents are inexpensive and readily available,
thus this study provide a cost effective means for removing dyes and metal ions from
contaminated water or effluents. The use of low cost adsorbents as potential
bioadsorbent for metal remediation and dye removal and environment management

118
technologies has increased in recent past due to its easy availability, low cost,
reusability, high efficiency, easy processing, application and recovery without any
adverse impact on the environment.

119
REFERENCES
1. Zollinger H., Color chemistry: synthesis, properties and applications of organic dyes and
pigments, 2nd Ed. VCH Publisher, New York, 1991.
2. Selvam, K., Swaminathan, K., Chae, K-S., Bioresource Technology., Vol. 88, 115- 119,
2003.
3. O’Mahony, T., Guibal, E., Tobin, J.M., Enzyme and Microbiology Technology, Vol. 31,
456, 2002.
4. Garg, V.K., Gupta, R., Yadav, A. B., Kumar R., Dye removal from aqueous solution by
adsorption on treated qawdust, Bioresource Technology, Vol. 89, 121-124, 2003.
5. Kapdan, I. K., Kargi, F., Mcmullan, G., Marchant, R., Environmental Technology,Vol. 21,
231-236, 2000.
6. Denizli, A., Cihangir, N., Rad., A.Y., Taner, M., Alsancak, G., Removal of Chlorophenols
from synthetic solutions using Phanerochaete chrysosporiup, Process Biochemistry, Vol.
39, 2025-2030, 2004.
7. C. I. J. R. Lloyd and J. T Guthrie, The removal of colour from textile wastewater using
whole bacterial cells: a review, Dyes Pigments 58:179-196(2003).
8. M. S. Otterburn, and D. A. Aga, Fullers earth and fired clay as adsorbent for dye stuffs,
equilibrium and rate constants, Water Air Soil Pollut 24 : 307-322(1985).
9. C. Namasivayam and K. Kadirvelu, Coirpith, an agricultural waste by-product for the
treatment of dyeing wastewater, Bioresour.Technol 48 :79-81(1994).
10. G.Sun and X. Xu, Sunflower stalks as adsorbents for color removal from textile wastewater,
Ind. Eng. Chem. Res 36:808-812(1997).
11. B. Chandran and P. Nigam, Removal of dyes from an artificial textile dye effluent by two
agricultural waste residues, corncob and barley husk, Environ. Int 28: 29-33(2002).
12. V. Vadivelan and K.V. Kumar, Equilibrium, kinetics, mechanism, and process design for
the sorption of methylene blue onto rice husk, J.Colloid Interf. Sci 286:90-100(2005).
13.R. X. Zhang, H. Liu, Y. Sun and B. Liu, Uptake of cationic dyes from aqueous solution by
biosorption onto granular kohlrabi peel, Bioresour. Technol 98:1319-1323(2007).
14.T.Santhi and S. Manonmani ,Uptake of cationic dyes from aqueous solution by
bioadsorption using granulized Annona squmosa seed,E-J. Chemistry 6 (4): 1260–1266
(2009).

120
15. T.Santhi and S. Manonmani, Removal of methylene blue from aqueous solution by
bioadsorption onto Recinus communis epicarp activated carbon, Chemical Engineering
research bulletion 13 :1–5 (2009).
16. T.Santhi . S. Manonmani, T. Smitha, D. Sugirtha and K. Mahalakshmi, Uptake of cationic
dyes from aqueous solution by bioadsorption onto granular cucumis sativa, J. Applied.Sci.in
Environ. Sanit 4:29–35(2009).
17. T.Santhi , S. Manonmani and T.Smitha , Removal of malachite green from aqueous solution
by activated carbon prepared from the epicarp of Ricinus communis , J. Hazard. Mater
article in press 2010.
18. EI Nem. Ola Abdelwahab, Amany EI-Sikaily and Azza Khaled, Removal of direct blue-86
from from aqueous solution by new activated carbon developed from orange peel, J. Hazard.
Mater 161(1) :102–110(2009).
19. M. M. Alkan and Y. Onganer, Adsorption of methylene blue from aqueous solution onto
perlite, Water Air Soil Pollut 120: 229–249(2000).
20. G .Akkaya and A. Ozer, Adsorption of acid red 274 (AR 274) on Dicranella varia:
determination of equilibrium and kinetic model parameters, Process Biochem 40 (11)
:3559–3568(2005).
21. S. Kundu and A.K. Gupta, Investigation on the adsorption efficiency of iron oxide coated
cement (IOCC) towards As(V)—kinetics,equilibrium and thermodynamic studies, Colloid
Surf. A: Physicochem. Eng. Aspects 273 : 121–128(2006).
22. W. Jern, Industrial Wastewater Treatment, London, 2006.
23. S.J.Allen, B. Koumanova, Decolourisation of Water/Waterwaste using Adsorption, J
Chem. Tech. Metall. 40 (2005) 145 - 192.
24. S. Meski, S. Ziani, H. Khireddine, Removal of lead Ions by hydroxyapatite prepared from
the egg shell. J Chem. Eng. 55 (2010) 3923-3928.
25. J. Schwarz, C.I. Contescu, Surfaces of nanoparticles and porous materials, United States of
America, 1999.
26. G.D. Stevenson, Water Treatment Unit Processes, London, 1998.
27. Md. Ahmaruzzaman, Adsorption of phenolic compounds on low-cost adsorbents: A review,
Ad. Coll. Inter. Sci. 143 (2008) 48–67.
28. V.K. Gupta, Suhas, Application of low-cost adsorbents for dye removal – a review. J. Envir.
Man. 90 (2009) 2313–2342.
29. V.K Gupta, P.J. Carrott, M.M. Carrott, Suhas, Low-Cost Adsorbents: Growing Approach
to Wastewater Treatment—a review. Envir. Sc. Tech. 39 (2009) 783–842.

121
30. J. Carvalho, J. Araújo, F.P. Castro, Alternative low-cost adsorbent for water and wastewater
decontamination derived from eggshell waste - an overview, W. Bio. Val. 2 (2011) 157-163.
31. H.J. Park, S.W. Jeong, J.K Yang, B.G. Kim, S.M. Lee, Removal of heavy metals using
waste eggshell, J. Envir. Sci. 19 (2007) 1436–1441.
32. L. Clescer, A. Greenberg, A. Eaton, Standard methods for the examination of water and
wastewater, 20th ed, American Public Health Association, Washington, 1998.
33. R.A. Yokel, P.J. McNamara, Intestinal Aluminum Absorption and Bioavailability from
Representative Aluminum Species, Annual Report, 2006.
34. Ajmal M, Khan A H, Ahmad S, 1998. Role of sawdust in the removal of copper(II) from
industrial wastes[J]. Water Research, 32(10): 3085–3091.
35. Anirudhan T S, Raji C, 1997. Choromium(VI) adsorption by sawdust carbon: Kinetics and
equilibrium[J]. Indian Journal of Chemical Technology, 4: 228–236.
36. Bailey S E, Olin T J, Bricka R M et al., 1999. A review of potentially low-cost sorbents for
heavy metals, J. Water Research, 33: 2469–2479.
37. Bulut Y, Tez Z, 2003. Removal of heavy metal ions by modified sawdust of walnut[J].
Fresenius Environmental Bulletin, 12(12): 1499–1504.
38. Dorris K L, Zhang Y, Shukla A et al., 2000. The removal of heavy metal from aqueous
solutions by sawdust adsorption removal of copper[J]. Hazard Mater, B80: 33–42.
39. Gaikwad, R.W., (2004). Removal of Cd(II) from aqueous solution by activated charcoal
derived from coconut shell. Electronic Journal of Environmental, Agriculture and Food
Chemistry, 3(4), 702-709.
40. Gueu,S., Yao, B., Adouby, K., and Ado, G., (2006). Heavy metals removal in aqueous
solution by activated carbons prepared from coconut shell and seed shell of the palm tree.
Journal of Applied Sciences, 6(13), 2789-2793.
41. Gupta, S., Kumar, D., and Gaur, J.P., (2008). Kinetic and isotherm modeling of lead(II)
sorption onto some waste plant materials. Chemical Engineering Journal, 148, 226-233.
42. Hanafiah, M.A.K.M., Ngah, W.S.W., Ibrahim, S.C., Zakaria, H., and Ilias, W.A.H.W.,
(2006). Kinetics and thermodynamic study of lead adsorption from aqueous solution onto
rubber (Hevea brasiliensis) leaf powder. Journal of Applied Sciences, 6(13), 2762-2767.
43. Ho, Y. and Ofomaja, A.E., (2006). Kinetic studies of copper ion adsorption on palm kernel
fibre. Journal of Hazardous Materials, B137, 1796-1902.
44. Denizli, A., Cihangir, N., Rad., A.Y., Taner, M., Alsancak, G., Removal ofChlorophenols
from synthetic solutions using Phanerochaetechrysosporiup,Process Biochemistry, Vol. 39,
2025-2030, 2004.

122
45. C. I. J. R. Lloyd and J. T Guthrie, The removal of colour from textile wastewater using
whole bacterial cells: a review, DyesPigments 58:179-196(2003).
46. B. Chandran and P. Nigam, Removal of dyes from an artificial textile dye effluent by two
agricultural waste residues, corncob andbarley husk, Environ. Int 28: 29-33(2002).
47. V. Vadivelan and K.V. Kumar, Equilibrium, kinetics, mechanism, and process design for
the sorption of methylene blueonto rice husk, J.ColloidInterf. Sci 286:90-100(2005).
48. R. X. Zhang, H. Liu, Y. Sun and B. Liu, Uptake of cationic dyes from aqueous solution by
biosorption onto granular kohlrabipeel, Bioresour. Technol 98:1319-1323(2007).
49. T.Santhi and S. Manonmani ,Uptake of cationic dyes from aqueous solution by
bioadsorption using granulized Annona squmosaseed,E-J. Chemistry 6 (4): 1260–1266
(2009).
50. T.Santhi and S. Manonmani, Removal of methylene blue from aqueous solution by
bioadsorption onto Recinuscommunisepicarpactivated carbon, Chemical Engineering
research bulletion 13 :1–5 (2009).
51. Suleman Qaiser, Anwar R. Saleemi and Muhammad Umar , “Biosorption of Pb (II) and Cr
(VI) on groundnut hull: Equilibrium, kinetics and thermodynamics study”, Electronic
Journal of Biotechnology, 2009,.12 4.
52. Nasim Ahmad Khan, Shaliza Ibrahim and Piarapakaran Subramaniam 2004, “Elimination
of Heavy Metals from Wastewater Using Agricultural Wastes as Adsorbents”, Malaysian
Journal of Science,2004, 23, 43 – 51.
53. O. E. A. Salam , N. A. Reiad , M. M. ElShafei , A study of the removal characteristics of
heavy metals from wastewater by low-cost adsorbents, Journal of Advanced Research, 2,
2011, 297-303.
54. Suleman Qaiser, Anwar R. Saleemi, Muhammad Umar, Biosorption of lead (II) and
chromium(VI) on groundnut hull: Equilibrium, kinetics and thermodynamics study,
Electronic Journal of Biotechnology, 12(4), 2009, 1-17.
55. B.M. Kiran, S.Srikantaswamy, H.V. Pallavi, V. Manoj, T. Tasneem, A Study on Utilization
of Groundnut Shell as Biosorbant for Heavymetals Removal, Journal of Environmental
Science, Computer Science and Engineering & Technology, 2, 2012,173-186.
56. Wofwoyo, W, Chung, W.S., and Marshall, W.E., (1999). Utilization of Ground nut shells as
Adsorbents for Selected Metals. Journal of Chemical Technology and Biotechnology 74:
1117-1121.

123
57. Kadirvelu, K.,Senthilkumar, P.,Thamaraiselvi, V., and Subburam, V., (2002). Activated
Carbon Prepared from Biomass as Adsorbent: Elimination of Ni (II) from Aqueous Solution.
BioresourceTechnology 81: 87-90.
58. Subramaniam, P., Khan, N.A., and Ibrahim, S., (2004). Rice Husk as an Adsorbent for
Heavy Metal. Proceedings of International Conference on Water and Wastewater 2004
(Asiawater 2004), Kuala Lumpur, Malaysia.
59. Amarasinghe, and Williams, R.A. Tea waste as a low cost adsorbent for the removal of Cu
and Pb from wastewater. Chemical Engineering Journal, January 2007, vol.132, no. 1-3, p.
299-309.
60. Amuda, O.S.; Giwa, A.A. And Bello, I.A. Removal of heavy metal from industrial
wastewater using modified activated coconut shell carbon. Biochemical Engineering
Journal, September 2007, vol. 36, no. 2, p. 174-181.
61. Tan, W.T.; Ool, S.T. And Lee, C.K. Removal of Cr(VI) from solution by coconut husk and
palm pressed fibres. Environmental Technology, March 1993, vol. 14, no. 3, p. 277-282.
62. Nilanjana Das, R.Vimala and P.Karthika 2008, “Biosorption of heavy metals-An overview”,
Indian Journal of Biotechnology, 2008, 1, 159-169.
63. Amit Bhatnagar and A K Minocha 2006, “Conventional and non-conventional adsorbents
for removal of pollutants from water”, Indian Journal of chemical techonology,2006, 13,
203-217.
64. Namasivayam, C., Muniasamy, N., Gayatri, K., Rani, M., Ranganathan K., Removal of dyes
from aqueous solutions by cellulosic waste orange peel, Bioresource Technology, Vol. 57,
37-43, 1996.
65. Özacar, M., Sengil, I.A., Adsorption of acid dyes from aqueous solutions by calcined alunite
and granular activated carbon, Adsorption, Vol. 8, 301-308, 2002.
66. Desai, M., Dogra, A., Vora, S., Bahadur, P., Ram, R.N., Adsorption of some Acid dyes
from aqueous solutions onto neutral alumina, Indian Journal of Chemistry, Vol. 36A, 938-
944, 1997.
67. Denizli, A., Cihangir, N., Rad., A.Y., Taner, M., Alsancak, G., Removal of Chlorophenols
from synthetic solutions using Phanerochaete chrysosporiup, Process Biochemistry, Vol. 39,
2025-2030, 2004.