Embed Size (px)
Citation preview
THE JOURNAL OF I%IOLOQICAL CHEMSTRY Vol. 242, No. 2, Issue of January 25, PP. 173-181, 1967
Printed in U.S.A.
Removal of Fatty Acids from Serum Albumin
by Charcoal Treatment
RAYhfoND F. CHEN
(Received for publication, July 25, 1966)
From the Laboratory of Technical Development, National Heart Institute, Bethesda, Maryland 20014
SUMMARY
The fatty acid contents of 26 different serum albumin prep- arations representing different species and obtained from various commercial sources have been determined. Some samples had surprisingly little fatty acid contamination, but it was found that other samples contained between 2 and 3 moles of acid per mole of protein, in confirmation of earlier reports. Treatment of these samples with charcoal at low pH resulted in the virtually complete removal of fatty acids. The conditions for such treatment were investigated as a function of the type of fatty acid, pH, and the amount of charcoal re- quired. Charcoal treatment removed at least 99% of albumin- bound radioactive fatty acids under optimal conditions, whereas the amount of protein adsorbed onto charcoal was 4.9 %. The protein that remained in solution following sepa- ration of the charcoal appeared to be native, as judged by a number of criteria, including analytical ultracentrifugation, optical rotatory dispersion, the ability to bind fatty acids, and the ability to bind the fluorescent dye, g-anilinonaphthalene- 1-sulfonic acid, as well as several other fluorescence param- eters. Fluorescence spectra of human serum albumin sam- ples indicated that impurities are sometimes present which can be removed by charcoal at neutral pH. A possible expla- nation for the gentleness of charcoal treatment is offered. Acid-charcoal treatment is a much more rapid method of removing lipid impurities than other methods previously described.
It has been known for many years that serum albumin prepara- tions contain variable amounts of lipid impurity (1, 2); this appears to be t,rue not only of samples prepared by fractionation but also of crystalline human serum albumin and bovine serum albumin. The bulk of the impurity appears to consist of free (i.e. unesterified) fatty acids, and infrared spectroscopy of the material isolated from BSAI has indicated that stearate is present ($4). Williams and Foster (4) suggested that other homologous saturated fatty acids are probably present, and Bro and Sturt- evant (8) postulated that dinonyl ketone was present as well.
1 The abbreviations used are: BSA, bovine serum albumin; HSA human serum albumin; FFA, free fatty acid or acids; ANS, 8-aniiinonaphthalene-l-sulfonic acid.
Analysis of a sample of HSA by Saifer and Goldman (5), who used gas-liquid chromatography, showed that a variety of fatty acids was present, the most prominent being oleic, palmitic, and linoleic acids. The exact composition of the lipid impurity in albumin probably varies from sample to sample, but it is gen- erally agreed that current methods of preparing this protein result in the presence of some such impurity. Foster (6) pointed out that not enough attention has been paid to such contamina- tion, and that it is not clear whether the fatty acids in BSA and HSA have influenced the results of published studies on the physical properties of these proteins. For instance, the presence of FFA would tend to influence the electrophoretic mobility of albumin, and could also affect its conformation. Binding studies involving albumin could be drastically altered depending on whether the ligand of interest were to compete for a site occupied by fatty acid contaminants; examples of such a situation are the binding of tryptophan by HSA (7), and, of course, the binding of other fatty acid anions (8). Certain metabolic studies with the use of complexes of albumin with radioactive fatty acids (e.g. Reference 9) require defatted albumin as starting material, since the presence of contaminating (“endogenous”) acids would lower to an uncertain degree the specific radioactivity. For these and other reasons, it is desirable to have a convenient method of removing fatty acid impurities.
Two procedures described for this purpose are those of Good- man (10) and Williams and Foster (11). In Goodman’s method, dry albumin is extracted with a mixture of isooctane and glacial acetic acid for at least 6 hours, washed with isooctane, extracted again with isooctane-acetic acid, washed repeatedly with iso- octane, dried in a vacuum, and, finally, dialyzed exhaustively against buffer. In the method of Williams and Foster, the concentrated albumin solutions are kept at pH 2.9 for 2 to 3 days, during which time lipids form a separate phase and can be re- moved by centrifugation. However, these authors subsequently stated, “It is noteworthy that this procedure for removal of the lipid material is not always 100% efficient” (4). Since both methods are time-consuming and documentation of their effec- tiveness is incomplete, it was decided to investigate the effect of activated charcoal on the FFA content of albumins. The present communication reports that charcoal treatment at low pH is a rapid and effective method of defatting albumins from a variety of sources. The method seems to be effective for dif- ferent fatty acids, and does not result in any gross structural changes in the protein which are detectable at neutral pH by
173
by guest on January 4, 2020http://w
ww
.jbc.org/D
ownloaded from
174 Chaxoal Treatment of Serum Albumin Vol. 242, So. 2
analytical ultracentrifugation, optical rotatory dispersion in the far ultraviolet, or fluorescence techniques.
EXPERIMENTAL PROCEDURE
Materials-The commercial sources and lot numbers of the albumin samples are generally indicated as they occur in the text, figures, and tables. Otherwise, Armour BSA, Fraction V, Lots Ml2005 or B23809, was used. Fatty acids were obtained from the following sources: Eastman, octanoic acid; Hormel Institute, crystalline l&uric, myristic, palmitic, oleic, and stearic acids; Nuclear-Chicago, oleic acid-l-r%; New England Nuclear, palmitic acid-1-i4C and stearic acid-l-14C. The radioactive fatty acids, which had been purified by extraction into alkaline ethanol followed by acidification and re-extraction into isooctane (9) were found by gas-liquid chromatography to be at least 96.5 ‘% pure.2 The activated charcoals used were Darco M, Lot DXL- O-2881, obtained from Atlas Chemical Industries, and Norit A and Nuchar-ClSO-N, obtained from Fisher Chemical Company. The charcoals were washed with distilled water, filtered with a Buchner funnel, and allowed to dry at room temperature. 8 ,4nilinonaphthalene-I-sulfonic acid was obtained as the sodium salt from the J. T. Baker Chemical Company, Phillipsburg, New Jersey, and was crystallized twice as the magnesium salt
02). Complexes of BSA with fatty acids were made simply by
adding FFA in a slight excess of aqueous KOH to solutions of BSA which had previously been treated with charcoal.
Protein concentration was measured by the method of Lowry et al. (13) or from the A279 as determined with a Beckman DU spectrophotometer. The assumed extinctions at 279 rnp for 1 o/0 solutions of BSA and HSA were 6.67 and 5.30, respectively (14, 15).
General Procedure for Removal of Fatty Acids from Serum Al- bumin-Albumin (7.0 g) was dissolved in 70 ml of distilled water at 23”. Darco (3.5 g) was mixed into the solution, and the pH was lowered to 3.0 by the addition of 0.2 N HCl. The solution was then placed in an ice bath and mixed magnetically for 1 hour. Charcoal was then removed by centrifugation at 20,200 x g for 20 min in a Sorvall RCl centrifuge with an SS 34 rotor at 2”. The clarified solution was then brought to pH 7.0 by the addition of 0.2 N NaOH.
Assay of FFA-.4 modification of the procedures of Dole (16) and Trout, Estes, and Friedberg (17) was briefly described by Spector, Steinberg, and Tanaka (9). As used in this study, the method is as follows. Sample (1 .O ml) containing 30 to 70 mg of albumin and 0 to 3 peq of FFA was shaken with 5.0 ml of ex- traction mixture in a glass-stoppered test tube and allowed to stand for 15 min. The extraction mixture contained isopropyl alcohol-isooctane-1 N HzS04 (40 : 10 : 1). Isooctane (3.0 ml) and 2.0 ml of 0.1 N HzS04 were then added to the test tube, and the contents were again shaken. The upper phase was transferred to another glass-stoppered test tube containing 5.0 ml of 0.01 N
HzS04 and the contents were shaken. The isooctane phase (3.0 ml) was transferred to a conical centrifuge tube containing 1 ml of a titration mixture, consisting of 0.002% Nile blue A in 90% (v/v) ethanol. The FFA was then titrated with 0.02 N
NaOH to a light pink end point, with mixing being effected by a stream of COS-free nitrogen. The titrations permitted the
* Dr. A. A. Spector provided these samples and performed the chromatographic analysis.
determination of the FFA content of samples with a precision of ho.03 mole of FFA per mole of albumin. However, from ex- periments with radioactive fatty acids (see below), it appears that the titrimetric assay occasionally gave slightly high values, since albumin samples containing negligible radioactivity seemed to have 0.02 to 0.06 peq of titratable acid per mole of albumin. It is presumed that this slight artifact may be due to a degrada- tion product from protein formed during the vigorous shaking of the acid-isooctane extraction, especially since the protein con- centration was high.
Radioactivity was measured with a Packard Tri-Carb scintil- lation counter. To determine FFA content of albumin samples, the extraction procedure was carried out as above and 3.0 ml of the final isooctane phase were taken to dryness under a stream of Nz in a counting vial. The radioactivity of the residue was determined after the addition of 10 ml of toluene containing phosphor (9).
Optical rotatory dispersion was determined with a Cary model 60 spectropolarimeter with the cell compartment maintained at 27”. A cylindrical cell with a O.lOO-cm path length was used for all measurements.
Fluorescence was measured with an Aminco-Bowman spectro- photofluorometer fitted with an emission monochromator grating blazed for maximum transmission in the first order at 300 nm. Excitation energy was passed through a horizontally oriented polarizing filter in order to reduce scattered light signal (18), as well as to attenuate the light so as to avoid photodecomposition of sample. Calibration of the detector system, which utilized an RCA lP28 photomultiplier tube, was carried out as previously described (19), and showed that the detector response, expressed in terms of relative quanta, was essentially flat from 280 to 400 mp. The spectra of Fig. 10 can therefore be taken as “true” emission curves without correction. The other emission spectra (Fig. 9) are corrected for detector response with the use of the calibration data.
RESULTS
FFA Content of Albumin Preparations-Albumin samples derived from different species were obtained and their FF.4 contents measured. The results, shown in Table I, indicate great variation in FFA content, ranging from less than 0.1 to more than 2 eq per mole of albumin. Samples of HSA which were examined were particularly high in FFA content, and three of the four crystalline BSA samples contained close to 1 eq of FFA. The wide variation in FFA content shows that no assumption can be made concerning the lipid content of any given sample. When each sample was treated with charcoal (Darco M) at pH 3.0 under the conditions described under “Experimental Procedure,” the FFA content was reduced to below 0.1 eq per mole of protein, as also shown in Table I. In a sense, the results of this table anticipate the data of the follow- ing sections, since the conditions used for charcoal treatment were arrived at by systematically studying the effects of pH, amount of charcoal required, and the amount of contact time needed. These results are shown below.
E$ect of pH-Initial attempts to remove FFA from albumin by charcoal treatment in solutions of pH 5 to 8 were only par- tially successful. This is not surprising, in view of the extreme tightness with which these acids are bound; Goodman (8) found the first two association constants for binding of stearic, palmitic, and oleic acids were of the order of lo8 liters per mole. The
by guest on January 4, 2020http://w
ww
.jbc.org/D
ownloaded from
Issue of January 25, 1967 R. F. Chen 175
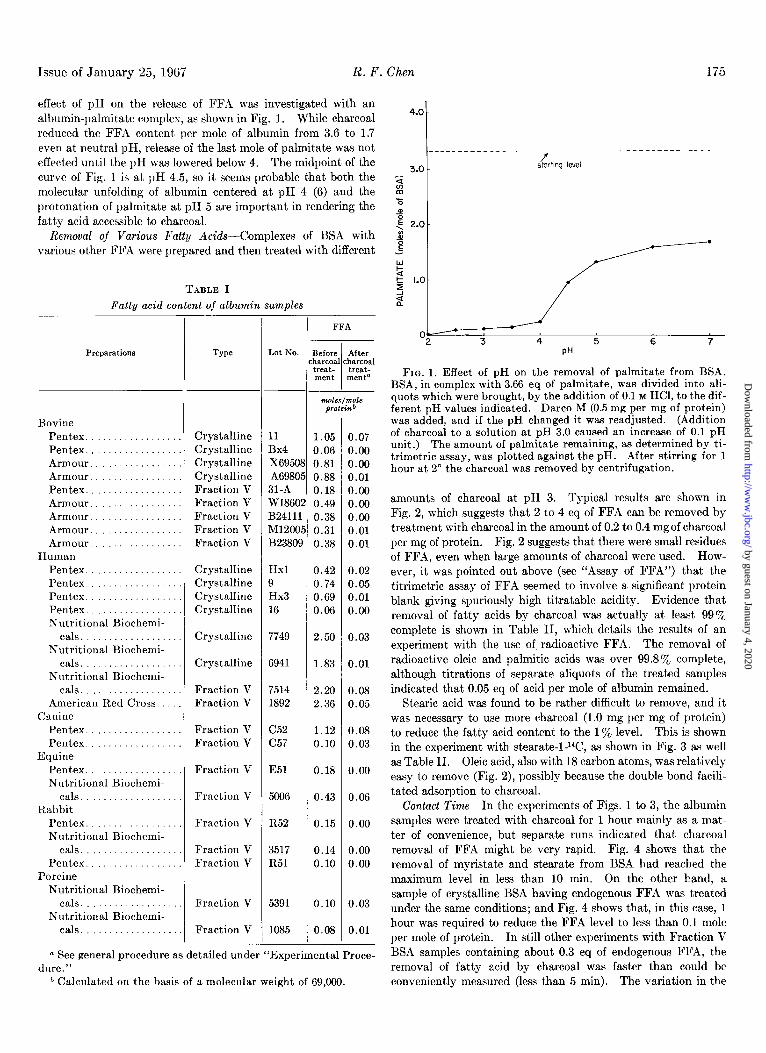
effect of pH on the release of FFA was investigated with an albumin-palmitate complex, as shown in Fig. 1. While charcoal reduced the FFA content per mole of albumin from 3.6 to 1.7 even at neutral pH, release of the last mole of palmitate was not effected until the pH was lowered below 4. The midpoint of the curve of Fig. 1 is at pH 4.5, so it seems probable that both the molecular unfolding of albumin centered at pH 4 (6) and the protonation of palmitate at pH 5 are important in rendering the fatty acid accessible to charcoal.
Removal of Various Fatty ilcids-Complexes of BSA with various other FFA were prepared and then treated with different
TABLE I Fatty acid content of albumin samples
Preparations TYPO Lot x0. Before After harcoal charcoal treat- treat- ment mentn
Bovine Pentex ................. Pentex. ................ Armour. ............... Armour. ............... Pentex. ................ Armour. ............... Armour. ............... Armour. ............... Armour. ...............
Human Pentex. ................ Pentex. ................ Pentex. ................ Pentex. ................ Nutritional Biochemi-
cals .................. Nutritional Biochemi-
cals .................. Nutritional Biochemi-
cals. ................. American Red Cross. ...
Canine Pentex ................. Pentex. ................
Equine Pentex. ............... Nutritional Biochemi-
cals .................. Rabbit
Pentex. ................ Nutritional Biochemi-
cals. ................. Pent.ex. ................
Porcine Nutritional Biochemi-
cals. ................. Nutritional Biochemi-
cals. .................
Crystalline 11 Crystalline Bx4 Crystalline X69501 Crystalline A6980i Fraction V 31-A Fraction V WI860: Fraction V B24111 Fraction V M1200! Fraction V B23809
Crystalline Crystalline Crystalline Crystalline
Crystalline
Crystalline
Fraction V Fraction V
Hxl 9 Hx3 16
Fraction V Fraction V
Fraction V
Fraction V
Fraction 17
Fraction V Fraction V
7749
6941
7514 1892
C52 c57
E51
5006
R52
3517 R51
1.05 0.07 0.06 0.00 0.81 0.00 0.88 0.01 0.18 0.00 0.49 0.00 0.38 0.00 0.31 0.01 0.38 0.01
0.42 0.02 0.74 0.05 0.69 0.01 0.06 0.00
2.50 0.03
1.83 0.01
2.20 0.08 2.36 0.05
1.12 0.08 0.10 0.03
0.18 0.00
0.43 0.06
0.15 0.00
0.14 0.00 0.10 0.00
Fraction V 5391 0.10 0.03
i Fraction V 1085 0.08 0.01
a See general procedure as detailed under “Experimental Proce- diire.”
FFA
r, Calculated on the basis of a molecular weight of 69,000.
4.0
I
7 3.0
starting level T 8 z
. -0
5 6 7 PH
FIG. 1. Effect of pH on the removal of palmitate from BSA. BSA, in complex with 3.66 eq of palmitate, was divided into ali- quots which were brought, by the addition of 0.1 M HCl, to the dif- ferent pH values indicated. Darco M (0.5 mg per mg of protein) was added, and if the pH changed it was readjusted. (Addition of charcoal to a solution at pH 3.0 caused an increase of 0.1 pH unit.) The amount of palmitate remaining, as determined by ti- trimetric assay, was plotted against the pH. After stirring for 1 hour at 2” the charcoal was removed by centrifugation.
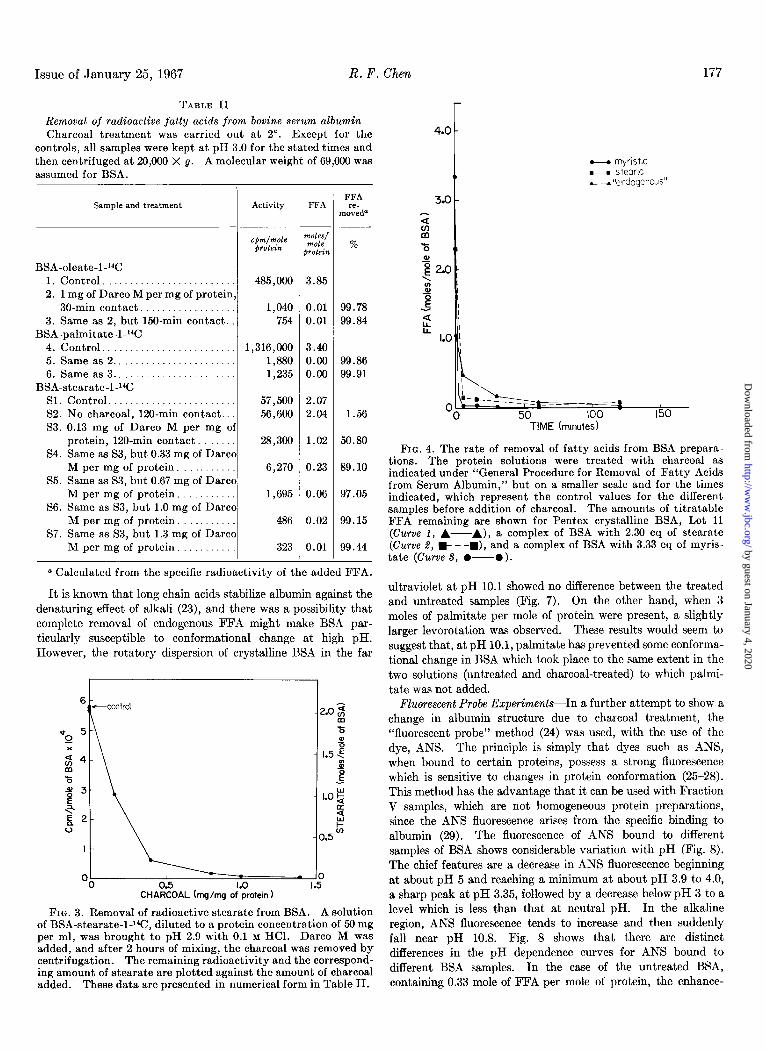
amounts of charcoal at pH 3. Typical results are shown in Fig. 2, which suggests that 2 to 4 eq of FFA can be removed by treatment with charcoal in the amount of 0.2 to 0.4 mgof charcoal per mg of protein. Fig. 2 suggests that there were small residues of FFA, even when large amounts of charcoal were used. How- ever, it was pointed out above (see “Assay of FFA”) that the titrimetric assay of FFA seemed to involve a significant protein blank giving spuriously high titratable acidity. Evidence that removal of fatty acids by charcoal was actually at least 99% complete is shown in Table II, which details the results of an experiment with the use of radioactive FFA. The removal of radioactive oleic and palmitic acids was over 99.8% complete, although titrations of separate aliquots of the treated samples indicated that 0.05 eq of acid per mole of albumin remained.
Stearic acid was found to be rather difficult to remove, and it was necessary to use more charcoal (1.0 mg per mg of protein) to reduce the fatty acid content to the 1 y0 level. This is shown in the experiment with stearate-lJ4C, as shown in Fig. 3 as well as Table II. Oleic acid, also with 18 carbon atoms, was relatively easy to remove (Fig. 2), possibly because the double bond facili- tated adsorption to charcoal.
Contact Time--In the experiments of Figs. 1 to 3, the albumin samples were treated with charcoal for 1 hour mainly as a mat- ter of convenience, but separate runs indicated that charcoal removal of FFA might be very rapid. Fig. 4 shows that the removal of myristate and stearate from BSA had reached the maximum level in less than 10 min. On the other hand, a sample of crystalline BSA having endogenous FFA was treated under the same conditions; and Fig. 4 shows that, in this case, 1 hour was required to reduce the FFA level to less than 0.1 mole per mole of protein. In still other experiments with Fraction V BSA samples containing about 0.3 eq of endogenous FFA, the removal of fatty acid by charcoal was faster than could be conveniently measured (less than 5 min). The variation in the
by guest on January 4, 2020http://w
ww
.jbc.org/D
ownloaded from

176 Charcoal Treatment of Serum Albumin Vol. 242, No. 2
4.0 -
3.0 - ,control
OCTANOATE
3.0
t
MYRISTATE
FIG. 2. Removal by charcoal of fatty acids bound to BSA. The amount of fatty acid remaining after treatment with charcoal at pH 3.0 and 2” is plotted against the amount of charcoal added. In each case, a BSA preparation was used which was previously treated with charcoal to remove endogenous FFA (see “General Procedure for Removal of Fatty Acids from Serum Albumin”) and then charged with the indicated fatty acid anion in the form
amount of contact time required for different samples might reflect differences in the types of fatty acids bound; however, this is not clearly established. At any rate, a contact time of 1 hour appears to suffice for all commercial preparations tested (Table I), and was adopted for the general procedure described under “Experimental Procedure.”
Other Vatiables-Experiments similar to those of Fig. 2 were carried out in the presence of 0.5 M NaCl with no detectable difference in results, thus suggesting that the ionic strength of the solutions is not a particularly important factor under these conditions. Usually, charcoal was applied to 4 to 6% albumin solutions, but other experiments with more dilute solutions (down to 1%) showed no significant decrease in the effectiveness of charcoal treatment.
Although the experiments reported here were done with Darco M, a limited number of studies such as those of Fig. 1 were done with Norit A and Nuchar-ClSO-N charcoals. No significant difference was noted among the three charcoals in their capacity to remove FFA from BSA. All three types of charcoal are derived from wood or pulp (20), but they are activated by different processes.
It was noted that the centrifuged charcoal particles, in the presence of serum albumin, tended to become resuspended with time, probably because of charge repulsion, since it is likely that the particles are coated with albumin which has a net positive charge at pH 3. For this reason, the protein supernatants were always decanted immediately after centrifugation.
Protein Recovery-The optical density at 280 rnp of BSA solution treated with a weight of charcoal equal to that of the
4.0 1
/co”trol
2.0 c LAURATE
0.2 0.4 0.6 0.B 1.0 1.2 1.4
z ‘;;
f ‘;; 5.0 Control
3.0 OLEATE
2.0 -
1.0 -
0 . 0 0.2 0.4 Cli~~COAL?ig/mg%SA~ 1.2 I.4
of its potassium salt. The charcoal was removed by centrifuga- tion after 1 hour of mixing time. The points labeled control repre- sent the amount of FFA present before charcoal treatment, and are distinguished from the other points at charcoal = 0, which are samples which have lost some FFA solely as a result of standing for 1 hour at pH 3.0 and centrifugation.
protein showed a 4.9% decrease, suggesting that no more than this amount of protein was actually adsorbed by the carbon. In the general procedure given above, however, the protein re- covery is usually only 80% because of occlusion of protein solution in the charcoal pellet.
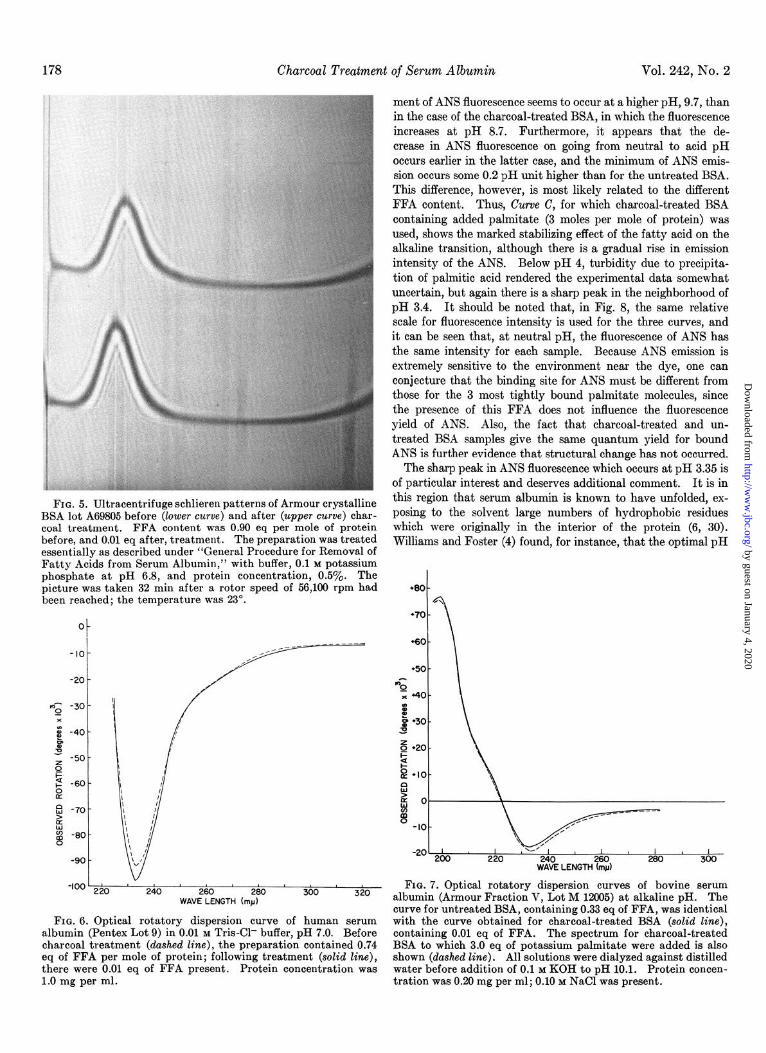
Ultracenttifugation of Charcoal-treated Albumin-Work of Williams and Foster (4) and Hartley, Peterson, and Sober (21) showed that dimerization of albumin occurred at low pH. Since charcoal treatment was performed at pH 3.0 to remove fatty acids in this study, it seemed possible that some degree of ag- gregation could have been induced. For this reason, samples of treated and untreated BSA (from the same crystalline prepara- tion) were examined in the analytical ultracentrifuge with the two solutions in separate parts of a double-sector cell. The results (Fig. 5) showed no evidence of aggregation, and the original homogeneity of the preparation was undisturbed.
Optical Rotatory Dispersion-The cotton effects of proteins in the far ultraviolet region, 190 to 240 rnp, have been found to be sensitive indicators of protein conformation (22). The specific rotation of albumin in the negative trough at 233 rnp has been used to show that when albumin is oxidized it loses much of its helical structure (22). The rotatory dispersion of HSA was examined before and after charcoal treatment (Fig. 6). No decrease in the magnitude of the 233 rnF trough can be seen, and one can reasonably conclude that there was no gross disruption of helicity during the acid-charcoal procedure. The observed rotation actually seems slightly greater with the treated protein at neutral pH, although the magnitude of the difference is probably within the limits of experimental error.
by guest on January 4, 2020http://w
ww
.jbc.org/D
ownloaded from
Issue of January 25, 1967 R. F. Chen 177
TABLE 11
Removal of radioactive fatty acids from bovine serum albumin Charcoal treatment was carried out at 2”. Except for the
controls, all samples were kept at pH 3.0 for the stated times and then centrifuged at 20,000 X 8. A molecular weight of 69,000 was assumed for BSA.
Sample and treatment Activity FFA
BSA-oleate-1-W 1. Control. 2. 1 mg of Darco M per mg of proteir
30.min contact. 3. Same as 2, but 150-min contact.
BSA-palmitate-1-W 4. Control........................ 5. Same as 2...................... 6. Same as 3..
BSA-stearate-l-l% Sl. Control....................... S2. No charcoal, 120-min contact.. S3. 0.13 mg of Darco M per mg c
protein, 120-min contact S4. Same as S3, but 0.33 mg of Dart
M per mg of protein S5. Same as S3, but 0.67 mg of Dart
M per mg of protein, S6. Same as 53, but 1.0 mg of Dart
M per mg of protein. 57. Same as S3, but 1.3 mg of Dart
M per mg of protein.
FFA re-
moved= 1
cpm/no1c protein %
485,000 3.85
1,040 0.01 99.78 754 0.01 99.84
1,316,OOO 3.40 1,880 0.00 1,235 0.00
99.86 99.91
57,500 2.07 56,600 2.04
28,300 1.02
6,270 0.23
1,695 0.06
486 0.02
323 0.01
1.56
50.80
89.10
97.05
99.15
99.44
(i Calculated from the specific radioactivity of the added FFA.
It is known that long chain acids stabilize albumin against the denaturing effect of alkali (23), and there was a possibility that complete removal of endogenous FFA might make BSA par- ticularly susceptible to conformational change at high pH. However, the rotatory dispersion of crystalline BSA in the far
1.0 CHARCOAL (mg/mg of protein 1
I.50
FIG. 3. Removal of radioactive stearate from BSA. A solution of BSA-stearate-l-l%, diluted to a protein concentration of 50 mg per ml, was brought to pH 2.9 with 0.1 M HCl. Darco M was added, and after 2 hours of mixing, the charcoal was removed by centrifugation. The remaining radioactivity and the correspond- ing amount of stearate are plotted against the amount of charcoal added. These data are presented in numerical form in Table II.
r
- myistlc e--m steaw _ “endogenous”
I 100 150
TIME (minutes)
FIG. 4. The rate of removal of fatty acids from BSA prepara- tions. The protein solutions were treated with charcoal as indicated under “General Procedure for Removal of Fatty Acids from Serum Albumin,” but on a smaller scale and for the times indicated, which represent the control values for the different samples before addition of charcoal. The amounts of titratable FFA remaining are shown for Pentex crystalline BSA, Lot 11 (Curve 1, A---A), a complex of BSA with 2.30 eq of stearate (Curve .%‘, e - -m), and a complex of BSA with 3.33 eq of myris- tate (Curve 3, 0-O).
ultraviolet at pH 10.1 showed no difference between the treated and untreated samples (Fig. 7). On the other hand, when 3 moles of palmitate per mole of protein were present, a slightly larger levorotation was observed. These results would seem to suggest that, at pH 10.1, palmitate has prevented some conforma- tional change in BSA which took place to the same extent in the two solutions (untreated and charcoal-treated) to which palmi- tate was not added.
Fluorescent Probe Experiments-In a further attempt to show a change in albumin structure due to charcoal treatment, the “fluorescent probe” method (24) was used, with the use of the dye, ANS. The principle is simply that dyes such as ANS, when bound to certain proteins, possess a strong fluorescence which is sensitive to changes in protein conformation (25-28). This method has the advantage that it can be used with Fraction V samples, which are not homogeneous protein preparations, since the ANS fluorescence arises from the specific binding to albumin (29). The fluorescence of ANS bound to different samples of BSA shows considerable variation with pH (Fig. 8). The chief features are a decrease in ANS fluorescence beginning at about pH 5 and reaching a minimum at about pH 3.9 to 4.0, a sharp peak at pH 3.35, followed by a decrease below pH 3 to a level which is less than that at neutral pH. In the alkaline region, ANS fluorescence tends to increase and then suddenly fall near pH 10.8. Fig. 8 shows that there are distinct differences in the pH dependence curves for ANS bound to different BSA samples. In the case of the untreated BSA, containing 0.33 mole of FFA per mole of protein, the enhance-
by guest on January 4, 2020http://w
ww
.jbc.org/D
ownloaded from
ment of ANS fluorescence seems to occur at a higher pH, 9.7, than in the case of the charcoal-treated BSA, in which the fluorescence increases at pH 8.7. Furthermore, it appears that the de- crease in ANS fluorescence on going from neutral to acid pH occurs earlier in the latter case, and the minimum of ANS emis- sion occurs some 0.2 pH unit higher than for the untreated BSA. This difference, however, is most likely related to the different FFA content. Thus, Curve C, for which charcoal-treated BSA containing added palmitate (3 moles per mole of protein) was used, shows the marked stabilizing effect of the fatty acid on the alkaline transition, although there is a gradual rise in emission intensity of the ANS. Below pH 4, turbidity due to precipita- tion of palmitic acid rendered the experimental data somewhat uncertain, but again there is a sharp peak in the neighborhood of pH 3.4. It should be noted that, in Fig. 8, the same relative scale for fluorescence intensity is used for the three curves, and it can be seen that, at neutral pH, the fluorescence of ANS has the same intensity for each sample. Because ANS emission is extremely sensitive to the environment near the dye, one can conjecture that the binding site for ANS must be different from those for the 3 most tightly bound pahnitate molecules, since the presence of this FFA does not influence the fluorescence yield of ANS. Also, the fact that charcoal-treated and un- treated BSA samples give the same quantum yield for bound ANS is further evidence that structural change has not occurred.
The sharp peak in ANS fluorescence which occurs at pH 3.35 is of particular interest and deserves additional comment. It is in
FIG. 5. Ultracentrifuge schlieren patterns of Armour crystalline this region that serum albumin is known to have unfolded, ex- BSA lot A69805 before (lower curve) and after (upper curve) char- posing to the solvent large numbers of hydrophobic residues coal treatment. FFA content was 0.90 eq per mole of protein which were originally in the interior of the protein (6, 30). before, and 0.01 eq after, treatment. The preparation was treated essentially as described under “General Procedure for Removal of
Williams and Foster (4) found, for instance, that the optimal pH
Fattv Acids from Serum Albumin.” with buffer, 0.1 M uotassium phosphate at pH 6.8, and protein concentration, 0.5yo. The picture was taken 32 min after a rotor speed of 56,109 rpm had 40 1. been reached; the temperature was 23’.
x
F$ -4o-
B 3
-50 - g
2 -6O-
8
8 -7o- & w g -0o- 0
178 Charcoal Treatment of Serum Albumin Vol. 242, No. 2
-loo I I
220 240 260 260 300 320 Fro. 7. Optical rotatory dispersion curves of bovine serum
WAVE LENGTH (mp) albumin (Armour Fraction V, Lot M 1‘2005) at alkaline pH. The curve for untreated BSA, containing 0.33 eq of FFA, was identical
FIG. 6. Optical rotatory dispersion curve of human serum with the curve obtained for charcoal-treated BSA (solid line), albumin (Pentex Lot 9) in 0.01 M Tris-Cl- buffer. nH 7.0. Before charcoal treatment (dashed line), the preparatidn contained 0.74
containing 0.01 eq of FFA. The spectrum for charcoal-treated BSA to which 3.0 eq of potassium palmitate were added is also
eq of FFA per mole of protein; following treatment (solid line), shown (dashed line). All solutions were dialyzed against distilled there were 0.01 eq of FFA present. Protein concentration was water before addition of 0.1 M KOH to pH 10.1. Protein concen- 1.0 mg per ml. tration was 0.26 mg per ml; 0.10 M NaCl was present.
by guest on January 4, 2020http://w
ww
.jbc.org/D
ownloaded from
Issue of January 25, 1967 R. F. Chen 179
60 A
30 -cr/ t
60
t C 50 .
lb- :-+-----
. *
40 .
30 l . IA
00 6 7 6 9 IO II 12 PH
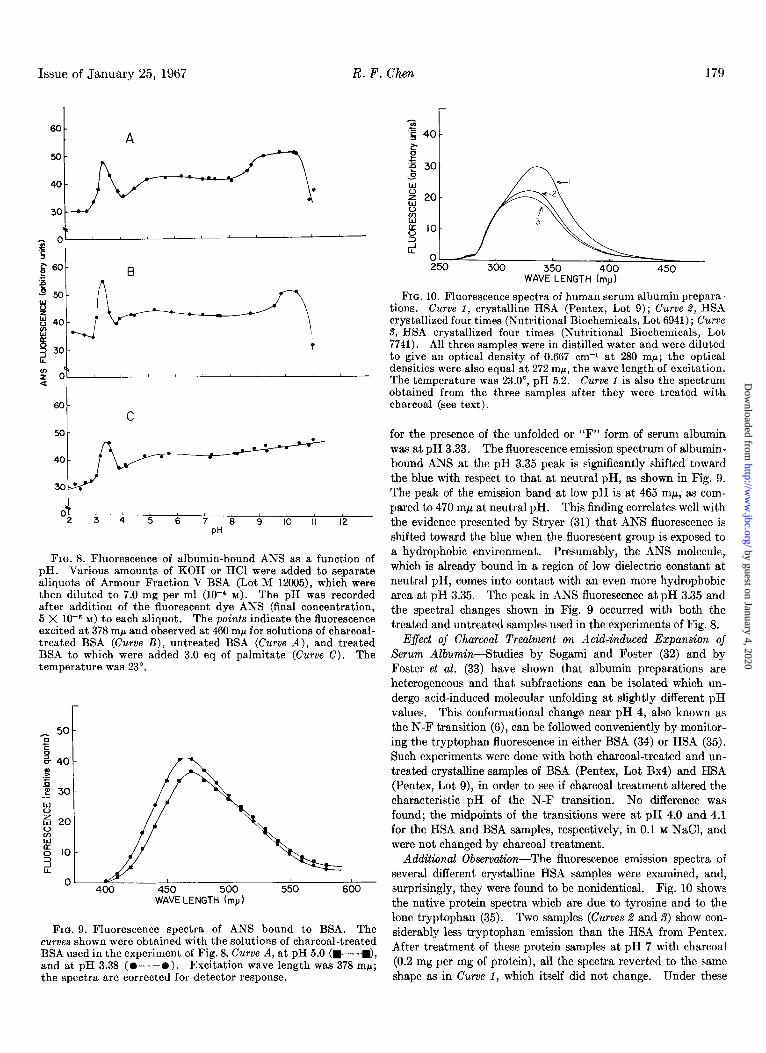
FIG. 8. Fluorescence of albumin-bound ANS as a function of pH. Various amounts of KOH or HCl were added to separate aliquots of Armour Fraction V BSA (Lot M 12005), which were then diluted to 7.0 mg per ml (10-l M). The pH was recorded after addition of the fluorescent dye ANS (final concentration, 5 X 1Om6 M) to each aliquot. The points indicate the fluorescence excited at 378 rnp and observed at 460 mp for solutions of charcoal- treated BSA (Curve B), untreated BSA (Curve A), and treated BSA to which were added 3.0 eq of palmitate (Curve C). The temperature was 23”.
WAVE LENGTH (my)
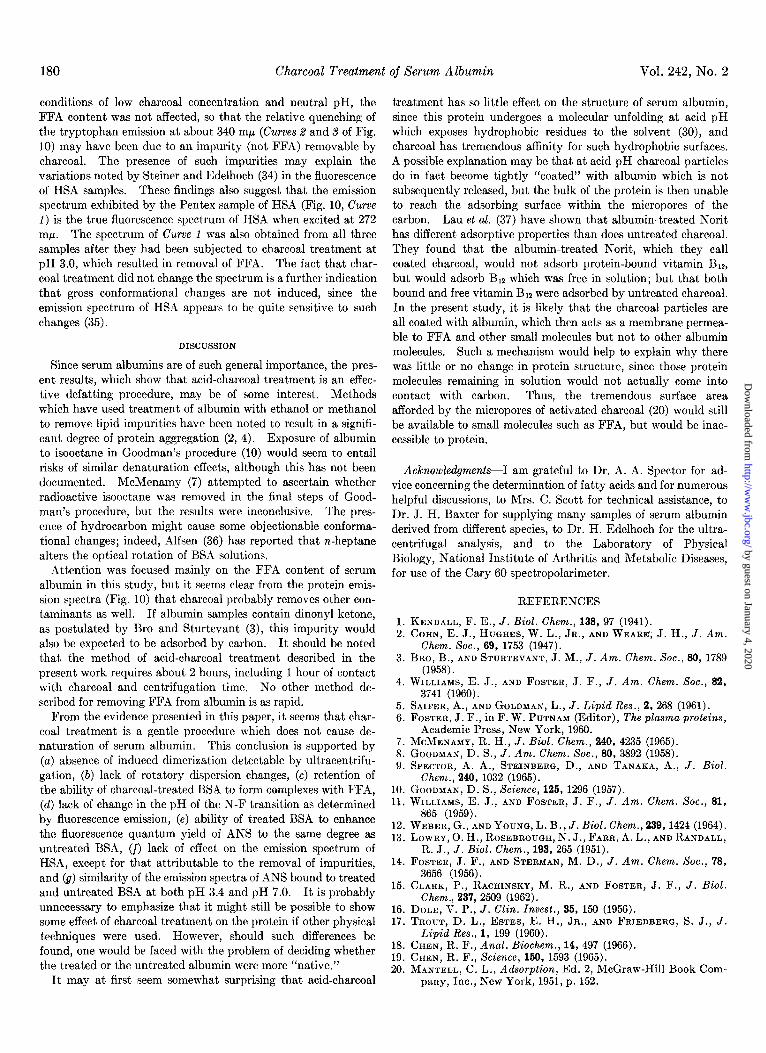
FIG. 9. Fluorescence spectra of ANS bound to BSA. The curves shown were obtained with the solutions of charcoal-treated BSA used in the experiment of Fig. 8, Curve A, at pH 5.0 (W-I), and at pH 3.38 (O--O). Excitation wave length was 378 mr; the spectra are corrected for detector response.
I+ 0: 250 300 350 400 450
WAVE LENGTH (my)
FIG. 10. Fluorescence spectra of human serum albumin prepara- tions. Curve 1, crystalline HSA (Pentex, Lot 9); Curve 2, HSA crystallized four times (Nutritional Biochemicals, Lot 6941); Curve 9, HSA crystallized four times (Nutritional Biochemicals, Lot 7741). All three samples were in distilled water and were diluted to give an optical density of 0.667 cm-1 at 280 mr; the optical densities were also equal at 272 mp, the wave length of excitation. The temperature was 23.0”, pH 5.2. Curve 1 is also the spectrum obtained from the three samples after they were treated with charcoal (see text).
for the presence of the unfolded or “F” form of serum albumin was at pH 3.33. The fluorescence emission spectrum of albumin- bound ANS at the pH 3.35 peak is significantly shifted toward the blue with respect to that at neutral pH, as shown in Fig. 9. The peak of the emission band at low pH is at 465 rnp, as com- pared to 470 rnp at neutral pH. This finding correlates well with the evidence presented by Stryer (31) that ANS fluorescence is shifted toward the blue when the fluorescent group is exposed to a hydrophobic environment. Presumably, the ANS molecule, which is already bound in a region of low dielectric constant at neutral pH, comes into contact with an even more hydrophobic area at pH 3.35. The peak in ANS fluorescence at pH 3.35 and the spectral changes shown in Fig. 9 occurred with both the treated and untreated samples used in the experiments of Fig. 8.
Effect of Charcoal Treatment on Acid-induced Expansion of Serum Albumin-Studies by Sogami and Foster (32) and by Foster et al. (33) have shown that albumin preparations are heterogeneous and that subfractions can be isolated which un- dergo acid-induced molecular unfolding at slightly different pH values. This conformational change near pH 4, also known as the N-F transition (6), can be followed conveniently by monitor- ing the tryptophan fluorescence in either BSA (34) or HSA (35). Such experiments were done with both charcoal-treated and un- treated crystalline samples of BSA (Pentex, Lot Bx4) and HSA (Pentex, Lot 9), in order to see if charcoal treatment altered the characteristic pH of the N-F transition. No difference was found; the midpoints of the transitions were at pH 4.0 and 4.1 for the HSA and BSA samples, respectively, in 0.1 M NaCl, and were not changed by charcoal treatment.
Additional Observation-The fluorescence emission spectra of several different crystalline HSA samples were examined, and, surprisingly, they were found to be nonidentical. Fig. 10 shows the native protein spectra which are due to tyrosine and to the lone tryptophan (35). Two samples (Curves %’ and S) show con- siderably less tryptophan emission than the HSA from Pentex. After treatment of these protein samples at pH 7 with charcoal (0.2 mg per mg of protein), all the spectra reverted to the same shape as in Curve 1, which itself did not change. Under these
by guest on January 4, 2020http://w
ww
.jbc.org/D
ownloaded from
180 Charcoal Treatment of Serum Albumin Vol. 242, No. 2
conditions of low charcoal concentration and neutral pH, the FFA content was not affected, so that the relative quenching of the tryptophan emission at about 340 rnl.c (Curves d and S of Fig. 10) may have been due to an impurity (not FFA) removable by charcoal. The presence of such impurities may explain the variations noted by Steiner and Edelhoch (34) in the fluorescence of HSA samples. These findings also suggest that the emission spectrum exhibited by the Pentex sample of HSA (Fig. 10, Curve 1) is the true fluorescence spectrum of HSA when excited at 272 rnp. The spectrum of Curve 1 was also obtained from all three samples after they had been subjected to charcoal treatment at pH 3.0, which resulted in removal of FFA. The fact that char- coal treatment did not change the spectrum is a further indication that gross conformational changes are not induced, since the emission spectrum of HSA appears to be quite sensitive to such changes (35).
DISCUSSION
Since serum albumins are of such general importance, the pres- ent results, which show that acid-charcoal treatment is an effec- tive defatting procedure, may be of some interest. Methods which have used treatment of albumin with ethanol or methanol to remove lipid impurities have been noted to result in a signifi- cant degree of protein aggregation (2, 4). Exposure of albumin to isooctane in Goodman’s procedure (10) would seem to entail risks of similar denaturation effects, although this has not been documented. McMenamy (7) attempted to ascertain whether radioactive isooctane was removed in the final steps of Good- man’s procedure, but the results were inconclusive. The pres- ence of hydrocarbon might cause some objectionable conforma- tional changes; indeed, Alfsen (36) has reported that n-heptane alters the optical rotation of BSA solutions.
Attention was focused mainly on the FFA content of serum albumin in this study, but it seems clear from the protein emis- sion spectra (Fig. 10) that charcoal probably removes other con- taminants as well. I f albumin samples contain dinonyl ketone, as postulated by Bro and Sturtevant (3), this impurity would also be expected to be adsorbed by carbon. It should be noted that the method of acid-charcoal treatment described in the present work requires about 2 hours, including 1 hour of contact with charcoal and centrifugation time. No other method de- scribed for removing FFA from albumin is as rapid.
From the evidence presented in this paper, it seems that char- coal treatment is a gentle procedure which does not cause de- naturation of serum albumin. This conclusion is supported by (a) absence of induced dimerization detectable by ultracentrifu- gation, (b) lack of rotatory dispersion changes, (c) retention of t,he ability of charcoal-treated BSA to form complexes with FFA, (d) lack of change in the pH of the N-F transition as determined by fluorescence emission, (e) abilit,y of treated BSA to enhance the fluorescence quantum yield of ANS to the same degree as untreated BSA, (f) lack of effect on the emission spectrum of HSA, except for that attributable to the removal of impurities, and (9) similarity of the emission spectra of ANS bound to treated and untreated BSA at both pH 3.4 and pH 7.0. It is probably unnecessary to emphasize that it might still be possible to show some effect of charcoal treatment on the protein if other physical techniques were used. However, should such differences be found, one would be faced with the problem of deciding whether the treated or the untreated albumin were more “native.”
It may at first seem somewhat surprising that acid-charcoal
treatment has so little effect on the structure of serum albumin, since this protein undergoes a molecular unfolding at acid pH which exposes hydrophobic residues to the solvent (30), and charcoal has tremendous affinity for such hydrophobic surfaces. A possible explanation may be that at acid pH charcoal particles do in fact become tightly “coated” with albumin which is not subsequently released, but the bulk of the protein is then unable to reach the adsorbing surface within the micropores of the carbon. Lau et al. (37) have shown that albumin-treated Norit has different adsorptive properties than does untreated charcoal. They found that the albumin-treated Norit, which they call coated charcoal, would not adsorb protein-bound vitamin B12, but would adsorb B,z which was free in solution; but that both bound and free vitamin Blz were adsorbed by untreated charcoal. In the present study, it is likely that the charcoal particles are all coated with albumin, which then acts as a membrane permea- ble to FFA and other small molecules but not to other albumin molecules. Such a mechanism would help to explain why there was little or no change in protein structure, since those protein molecules remaining in solution would not actually come into contact with carbon. Thus, the tremendous surface area afforded by the micropores of activated charcoal (20) would still be available to small molecules such as FFA, but would be inac- cessible to protein.
Acknowledgments-1 am grateful to Dr. A. A. Spector for ad- vice concerning the determination of fatty acids and for numerous helpful discussions, to Mrs. C. Scott for technical assistance, to Dr. J. H. Baxter for supplying many samples of serum albumin derived from different species, to Dr. H. Edelhoch for the ultra- centrifugal analysis, and to the Laboratory of Physical Biology, National Institute of Arthritis and Metabolic Diseases, for use of the Cary 60 spectropolarimeter.
REFERENCES
1. KENDALL, F. E., J. Biol. Chem., 138, 97 (1941). 2. COHN. E. J.. HUGHES. W. L.. JR.. AND WEARE. J. H.. J. Am.
Chekz. See:, 69, 1753 (1947): 3. BRO, B., AND STURTEVANT, J. M., J. Am. Chem. Sot., 80, 1789
(1958). 4. WILLIAMS, E. J., AND FOSTER, J. F., J. Am. Chem. Sot., 82,
3741 (1960). 5. SAIFER, A., AND GOLDMAN, L., J. Lipid Res., 2, 268 (1961). 6. FOSTER, J. F., in F. W. PUTNAM (Editor), The plasma proteins,
Academic Press, New York, l&O. - 7. MCMENAMY. R. H.. J. Biol. Chem.. 240. 4235 (1965). 8. GOODMAN, c. S., J: Am. Chem. So;., 80; 3892 i1958j. 9. SPECTOR, A. A., STEINBERG, D., AND TANAKA, A., J. Biol.
Chem., 240, 1032 (1965). 10. GOODMAN, D. S., Science, 126, 1296 (1957). 11. WILLIAMS, E. J., AND FOSTER, J. F., J. Am. Chem. Sot., 81,
865 (1959). 12. WEBER, G., AND YOUNG, L. B., J. Biol. Chem., 239,1424 (1964). 13. LOWRY, 0. H., ROSEBROUGH, N. J., FARR, A. L., AND RANDALL,
R. J., J. Biol. Chem., 193, 265 (1951). 14. FOSTER. J. F., AND STERMAN, M. D., J. Am. Chem. Sot.. ‘78.
3656 i1956): 15. CLARK, P., RACHINSKY, M. R., AND FOSTER, J. F., J. Biol.
Chem.. 237. 2509 (1962). 16. DOLE, v. P.; J. Clin. Invest., 36, 150 (1956). 17. TROUT, D. L., ESTES, E. H., JR., AND FRIEDBERG, S. J., J.
Lipid Res., 1, 199 (1960). 18. CHEN, R. F., Anal. Biochem., 14, 497 (1966). 19. CHEN, R. F., Science, 160, 1593 (1965). 20. MANTELL, C. L., Adsorption, Ed. 2, McGraw-Hill Book Com-
pany, Inc., New Yol,k, 1951, p. 152.
by guest on January 4, 2020http://w
ww
.jbc.org/D
ownloaded from
Issue of January 25, 1967 R. F. Chen 181
21. HARTLEY, R. W., JR., PETERSON, E. A., AND SOBER, H. A., Biochemistry, 1,60 (1962).
22. JIRGENSONS, B., J. Biol. Chem., 240, 1064 (1965). 23. OTT, H., in H. PEETERS (Editor), Protides of the biological
JEuids, American Elsevier Publishing Company, Inc., New York, 1962.
24. GALLY, J. A., AND EDELMAN, G. M., Biochim. Biophys. Acta, 94, 175 (1965).
25. WEBER, G., AND LAURENCE, D. J. R., Biochem. J., 61, xxxi (1954).
26. CALLAGHAN, P., AND MARTIN, N. H., Biochem. J., 83, 144 (1962).
27. ALEXANDER, B., AND EDELMAN, G. M., Federation Proc., 24, 413 (1965).
‘23. MCCLURE, W. O., AND EDELMAN, G. M., Biochemistry, 6, 1908 (1966).
29.
30.
31. 32.
33.
34.
35. 36. 37.
FILDES, J. E., LAURENCE, D. J. R., AND REES, V. H., Biochem. J., 66. xxxi (1954).
HERSKOVITS, T. T., AND LASKOWSKI, M., JR., J. Biol. Chem., 237, 2481 (1962).
STRYER, L., J. Mol. Biol., 13, 482 (1965). SOGAMI, M., AND FOSTER, J. F., J. BioZ. Chem., 238, PC2245
(1963). FOSTER, J. F., SOGAMI, M., PETERSEN, H. A., AND LEONARD,
W. J., JR., J. BioZ. Chem., 240, 2495 (1965). STEINER, R. F., AND EDELHOCH, H., Biochim. Biophys. Acta,
66, 341 (1963). CHEN, R. F., Biochim. Biophys. Acta, 120, 169 (1966). ALFSEN, A., Compt. Rend. Trav. Lab. Carlsberg, 38, 415 (1963). LAU, K.-S., GOTTLIEB, C., WASSERMAN, L. R., AND HERBERT,
V., Blood 26, 202 (1965).
by guest on January 4, 2020http://w
ww
.jbc.org/D
ownloaded from
Raymond F. ChenRemoval of Fatty Acids from Serum Albumin by Charcoal Treatment
1967, 242:173-181.J. Biol. Chem.
http://www.jbc.org/content/242/2/173Access the most updated version of this article at
Alerts:
When a correction for this article is posted•
When this article is cited•
to choose from all of JBC's e-mail alertsClick here
http://www.jbc.org/content/242/2/173.full.html#ref-list-1
This article cites 0 references, 0 of which can be accessed free at
by guest on January 4, 2020http://w
ww
.jbc.org/D
ownloaded from