Embed Size (px)
Citation preview

Removal of Safranin Dye from Aqueous Solution
using Surfactant-Modified Carbonized Olive Stones
Mausul Umar
Submitted to the
Institute of Graduate studies and Research
in partial fulfillment of the requirements for the degree of
Master of Science
in
Chemistry
Eastern Mediterranean University
July 2017
Gazimağusa, North Cyprus

Approval of the Institute of Graduate Studies and Research
___________________________ Prof. Dr. Mustafa Tümer
Director
I certify that this thesis satisfies the requirements as a thesis for the degree of Master
of Science in Chemistry
___________________________ Prof. Dr. İzzet Sakalli
Chair, Department of Chemistry
We certify that we have read this thesis and that in our opinion it is fully adequate in
scope and quality as a thesis for the degree of Master of Science in Chemistry
____________________________ Assoc. Prof. Dr. Mustafa Gazi
Supervisor
Examining Committee
1. Assoc. Prof. Dr. Mustafa Gazi
2. Asst. Prof. Dr. Akeem Oladipo
3. Dr. Kivanc Yuney
iii
ABSTRACT
The adsorption study of safranin dye by surfactant modified carbon MCOS produced
from olive stone under batch adsorption process was undertaken to check the
influence of varying different experimental conditions; initial safranin concentration,
pH, adsorbent dosage, temperature, counter ions and time on safranin removal by our
adsorbent. Physiochemical characterizations including moisture content, ash content,
bulk density etc. was also undertaken. Two well known adsorption isotherms
(Langmuir and Freundlich) and three kinetic models (pseudo first and second order,
intra particle diffusion) were used to better understand the mechanism involved in
the adsorption process.
Our collected results showed that there was an increase in adsorption capacity of
MCOS as initial dye concentration, dose and number of counter ions in solution
increased; pHpzc was at pH 6.6 while maximum adsorption capacity was 7.30mg/g
obtained at pH 7. Langmuir isotherm which implies monolayer coverage by MCOS
well represented our equilibrium data with a higher correlation coefficient value of
while kinetic study showed that adsorption process followed pseudo second order
kinetic model. RL and n values obtained from both adsorption isotherms used
indicates a favorable adsorption process. The spontaneity and exothermic nature was
confirmed by negative ΔG° and ΔH° values, though spontaneity reduced as
temperature increased. Hence, MCOS can serve as an ecofriendly and cheap
alternative for removing safranin from industrial waste effluents.
Keywords: Safranin, activated carbon, adsorption, olive stones
iv
ÖZ
Safran boyasının yüzey aktif madde modifiye edilmiş karbonize zeytin çekirdeği
MCOS tarafından emilimi üzerine yapılan çalışmada, başlangıçtaki safran
konsantrasyonu, pH değeri, emici dozajı, sıcaklık, karşı iyonlar ve safranın
kullandığımız emici tarafından adsorbe edilmesi için gereken süre gibi deneysel
koşulların adsorpsiyon üzerindeki etkisi kontrol edilmiştir. Nem içeriği, kül içeriği,
yığın yoğunluğu gibi fizyokimyasal nitelemeler de üstlenmiştir. Adsorpsiyon
işleminin mekanizmasını daha iyi anlayabilmek içi, iki iyi bilinen adsorpsiyon
izotermi (Langmuir ve Freundlich) ve üç kinetik modeli (yalancı birinci ve ikinci
dereceden, partikül içi difüzyonu) kullanılmıştır.
Elde edilen sonuçlar; başlangıçtaki boya konsantrasyonu, çözeltideki doz ve karşıt
iyon sayısı arttıkça, MCOS'un adsorpsiyon kapasitesinde bir artış olduğunu
göstermiştir; pH değeri 7 iken, maksimum adsorpsiyon kapasitesi 7.30mg / g olarak
elde edilmiş, ve pHpzc değerinin pH 6.6 olduğu gözlemlenmiştir.
Bu çalışmada, adsorpsiyon prosesinin yalancı ikinci dereceden kinetik modeli
izlediğini göstermekle birlikte, MCOS tarafından tek katmanlı kapsama alanını ifade
eden Langmuir izotermi, denge verilerimizin daha yüksek bir korelasyon katsayısı
değeri ile temsil edildimiştir. Kullanılan her iki adsorpsiyon izoterminden elde edilen
RL ve n değerleri, elverişli bir adsorpsiyon olayını gösterir. Sıcaklık arttıkça
spontaneliğin azalmasına rağmen, spontanelik ve ekzotermiklik, negatif ΔG ° ve ΔH°
değerleri ile teyit edilmiştir. Bu nedenle, MCOS, endüstriyel atık çıkışlarından safran
giderimi için çevre dostu ve ucuz bir alternatif olarak hizmet verebilir.
Anahtar Kelimeler: Safran, aktif karbon, adsorpsiyon, zeytin çekirdeği

v
DEDICATION
This thesis is dedicated to my parents; Justice Umar Muhammad Dutse and Hajiya
Khadija Umar for their spiritual, moral and financial support towards my entire
educational career. May Almighty sustain them from all evil, increase their health,
bless their life and grant them with paradise Ameen.
vi
ACKNOWLEDGMENT
Praise and ultimate thanks be to Allah who gave me the ability and sparing my time
for the completion of this thesis.
I am very grateful to my supervisor, Assoc. Prof. Dr. Mustafa Gazi for choosing this
new and important topic in the field of environmental chemistry and also for his
simplicity, in terms of our interaction as teacher and student. He provided me with
the academic guidance and necessary facilities needed to excel in this thesis work. I
wish him success in his entire life and hereafter.
My special thanks to Ayodeji Ifebajo for his contribution in the experimental part of
this thesis. I enthusiastically appreciate his effort and I wish him success.
Finally, i am also grateful to all my instructors in the Chemistry department of
Eastern Mediterranean University, most especially Prof. Dr. Elvan Yilmaz and Dr
Kıvanc Yüney.

vii
TABLE OF CONTENT
ABSTRACT ................................................................................................................ iii
ÖZ ............................................................................................................................... iv
DEDICATION ............................................................................................................. v
ACKNOWLEDGMENT ............................................................................................. vi
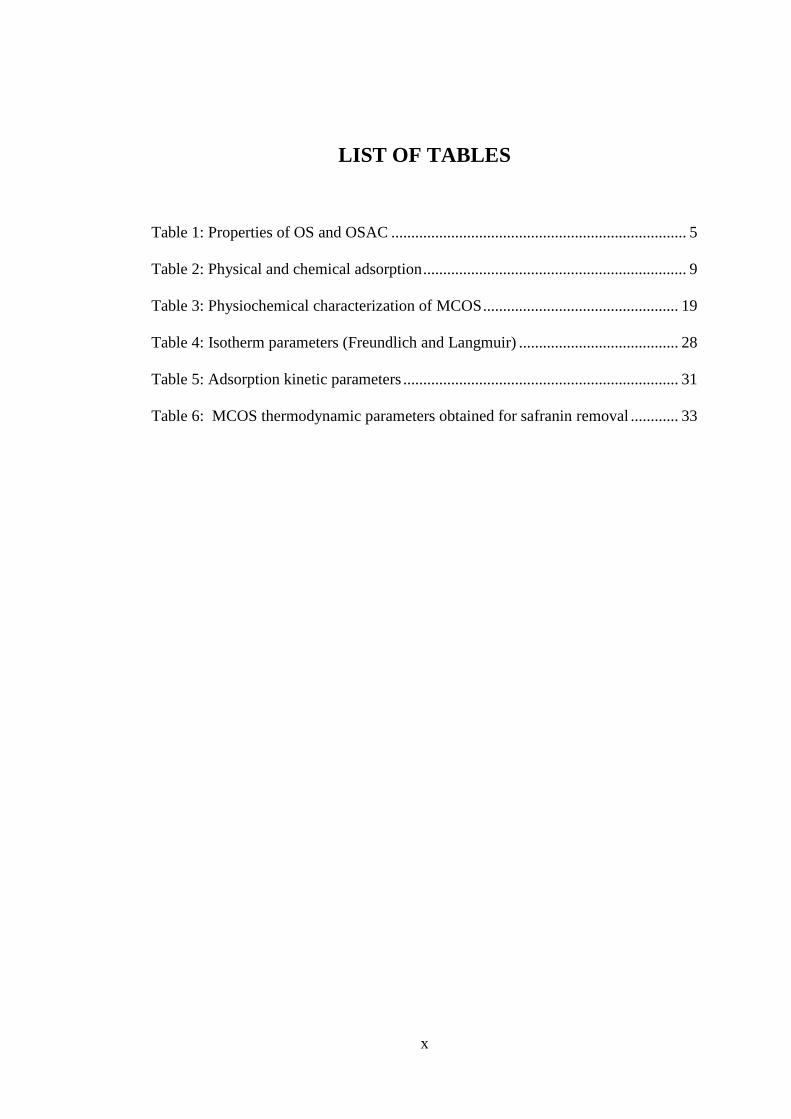
LIST OF TABLES ....................................................................................................... x
LIST OF FIGURES .................................................................................................... xi
1 INTRODUCTION .................................................................................................... 1
1.1 Environmental issues .......................................................................................... 1
1.2 Aim and objectives of research .......................................................................... 3
1.2.1 Research aim ................................................................................................ 3
1.2.2 Objectives of this study are; ........................................................................ 3
2 LITERATURE REVIEW ......................................................................................... 4
2.1 Olive tree ............................................................................................................ 4
2.2 Composition of olive stone ................................................................................ 4
2.3 Application of olive stone .................................................................................. 5
2.4 Activated carbon ................................................................................................ 6
2.5 Safranin dye ........................................................................................................ 7
2.5.1 Application of safranin dye ......................................................................... 8
2.5.2 Effects of safranin dye ................................................................................. 8
viii
2.6 Treatment technique: adsorption ........................................................................ 8
2.6.1 Classes of adsorption ................................................................................... 9
2.6.2 Factors affecting adsorption ........................................................................ 9
2.7 Adsorption isotherms ....................................................................................... 10
2.7.1. Langmuir isotherm.................................................................................... 11
2.7.2 Freundlich isotherm ................................................................................... 12
2.8 Adsorption kinetics .......................................................................................... 12
2.8.1 Pseudo first and second order kinetic models............................................ 13
2.8.2 Intraparticle diffusion model ................................................................... 13
3 EXPERIMENTAL .................................................................................................. 15
3.1 Materials and equipment .................................................................................. 15
3.2. Preparation of carbonized olive stones using olive stones (COS)................... 15
3.3 Modification of COS using SLS ...................................................................... 16
3.4 Batch adsorption studies ................................................................................... 16
3.5 Adsorbate preparation ...................................................................................... 17
3.6 Physiochemical characterization of MCOS ..................................................... 18
4 RESULT AND DISCUSSION ............................................................................... 19
4.1 Characterization ............................................................................................... 19
4.2 Effects of different experimental conditions on safranin removal ................... 20
4.2.1 Dye solution pH ......................................................................................... 20
4.2.2 MCOS dosage ............................................................................................ 21
4.2.3 Contact time ............................................................................................... 22

ix
4.2.4 Dye initial concentration............................................................................ 23
4.2.5 Counter ions ............................................................................................... 24
4.2.6 Temperature ............................................................................................... 25
4.3 Adsorption isotherm models ............................................................................ 26
4.4 Adsorption kinetics models .............................................................................. 28
4.5 Thermodynamics analysis ................................................................................ 31
5 CONCLUSION ....................................................................................................... 34
REFERENCES .......................................................................................................... 36
x
LIST OF TABLES
Table 1: Properties of OS and OSAC .......................................................................... 5
Table 2: Physical and chemical adsorption .................................................................. 9
Table 3: Physiochemical characterization of MCOS ................................................. 19
Table 4: Isotherm parameters (Freundlich and Langmuir) ........................................ 28
Table 5: Adsorption kinetic parameters ..................................................................... 31
Table 6: MCOS thermodynamic parameters obtained for safranin removal ............ 33

xi
LIST OF FIGURES
Figure 1: olive stones and activated carbon (COS) at different temperatures such as
200, 300, 400, 700 and 900oC ...................................................................................... 6
Figure 2: Chemical structure of safranin dye ............................................................... 7
Figure 3: Calibration curve of safranin ...................................................................... 18
Figure 4꞉ pHpzc of MCOS .......................................................................................... 20
Figure 5꞉ Effect of pH on removal efficiency of MCOS ........................................... 21
Figure 6: Effect of dosage on adsorption capacity of MCOS .................................... 22
Figure 7: Effect of dosage on the removal efficiency of MCOS ............................... 22
Figure 8꞉ Effect of contact time on adsorption capacity of MCOS ........................... 23
Figure 9꞉ Effect of concentration on adsorption capacity of MCOS ......................... 24
Figure 10꞉ Effect of salinity on removal efficiency of MCOS .................................. 25
Figure 11꞉ Effect of temperature on adsorption of safranin by MCOS ..................... 26
Figure 12: Langmuir plot of safranin on MCOS ....................................................... 27
Figure 13: Freundlich plot of safranin on MCOS ...................................................... 27
Figure 14: Pseudo first order kinetic plot of MCOS .................................................. 28
Figure 15: Pseudo second order kinetic plot of MCOS ............................................. 29
Figure 16: Intra-particle plot of MCOS ..................................................................... 29
Figure 17: Van’t Hoff Plot for safranin adsorption by MCOS .................................. 32

1
Chapter 1
1 INTRODUCTION
1.1 Environmental issues
Numerous industries make use of dyes for their industrial processes thereby
producing high quantities of colored waste water which is sometimes released into
the environment untreated and becomes a major source of environmental pollution
(Pereira et. al., 2006; Huo et al., 2013). Even at very low concentrations, the
presence of these dyes in water is very displeasing because of their color which is
visible to humans (Al-Degs et al., 2000). Many of these dyes also contain
recalcitrant organic molecules that are toxic, stable to light, carcinogenic and
inhibit light penetration into water which may have adverse effects on biological
processes occurring in water (Mohammadi et al., 2011).
Safranin also known as Basic Red 2 (C20H19N4Cl) belongs to the quinone-imine
group and is one of the oldest known synthetic cationic dyes. It is used as a food
additive; to flavor and color candies and cookies. It also finds a wide range of
applications in the textile industries to dye various materials like wool, tannin,
blast fibers etc. (Shah, 1998). Several health defects have been associated with
safranin (Rejniak and Piotrowska, 1966; Gupta et al., 2006). As clean water is
important to our existence, it is imperative to eradicate safranin from industrial
wastewater bodies before release into the environment.
2
In recent times, numerous techniques have been proposed for waste water
treatment and recycling. These methods; adsorption (Coro and Laha, 2001),
electrocoagulation and electrocoagulation/flotation (Emamjomeh and Sivakumar,
2009), oxidation (Perez et al., 2002), advanced oxidation process (Sanchez et al.,
1998), ion exchange (Dabrwoski et al., 2004) etc. are available to treat industrial
wastewater. Adsorption exhibits several advantages when compared to all other
methods because it has been found to be a reasonably cheap and energy
conserving process, effective for the removal of a wide range of pollutants, easy to
operate and recover etc. (Mahvi et al., 2009; Iram et al., 2010; Ali and Gupta,
2007; Amin, 2009).
One of the most widely used adsorbent in waste water remediation due to its
ability to remove various pollutants is activated carbon (AC). AC has a large
surface area and pore volume with a broad pore size distribution that makes it
efficient and effective in the adsorption process (Gupta et al., 2011). However,
there are some shortcomings encountered in the use of these commercially
produced activated carbons. These include; difficulty to regenerate and reuse the
AC, high cost of producing conventional ACs and the management of exhausted
adsorbent after use (Gupta et al., 2012). Researchers are now investigating the
adsorptive potential of applying low cost, ecofriendly, renewable and cheap
materials to serve as precursors for production of commercial ACs (Baccar et al.,
2010).
In line with this trend, our work focuses on the use of olive stone which is an
agricultural waste in olive oil processing as a cheaper and renewable precursor to
producing commercial AC.
3
1.2 Aim and objectives of research
1.2.1 Research aim
The main aim of carrying out this study is to prepare carbonized olive stone using
a cheap and renewable waste (olive stone), modify it with an anionic surfactant
sodium lauryl sulfate (SLS) and use it under laboratory simulated conditions to
adsorb safranin from aqueous solution.
1.2.2 Objectives of this study are;
i. To optimize performance of carbonized Olive Stones by modifying it with SLS.
ii. To access the adsorptive potential of the as-prepared adsorbent.
iii. To determine the effect of different experimental parameters like solution pH,
counter ions, dosage, time etc. on adsorption efficiency of the prepared adsorbent.
iv. Finally, to investigate and use the most appropriate isotherm(s) and kinetic
model(s) to explain the adsorption mechanism.

4
Chapter 2
2 LITERATURE REVIEW
2.1 Olive tree
The olive tree is one the oldest known cultivated tree in the world and according to
reports; about 97% of current olive oil cultivation in the world is done in the
Mediterranean countries with 90% of olives harvested used mainly to produce oil
(Uylaser and Yildiz, 2014). The origin of the tree itself is not known and has been
subject to a lot of debate with some believing it was discovered in Africa while
others say the origin can be traced back to 5,000 years ago in ancient Persia and
Mesopotamia (kapellakis et al., 2008). Different industrial methods depending on
the region are used to process olives. Both the fruit and oil contain several
phenolic compounds that give them antioxidant properties which make it
nutritional and medicinal when consumed (Uylaser and Yildiz, 2014). Olive stone
is a by-product obtained in large amounts from olive oil production and has no real
economic value; hence there is ongoing research to find other uses for this by-
product (Calero et al., 2016).
2.2 Composition of olive stone
Olive stone OS is a lignocellulosic material. Chemical composition of OS and its
husk show that cellulose (31.9% and 36.4%), Hemicellulose (21.9% and 26.8%)
and lignin (26.5% and 26.0%) are the main components though there are small
amounts of fats (5.53% and 1.01%) and protein (3.20% and 1.29%) also (Heredia
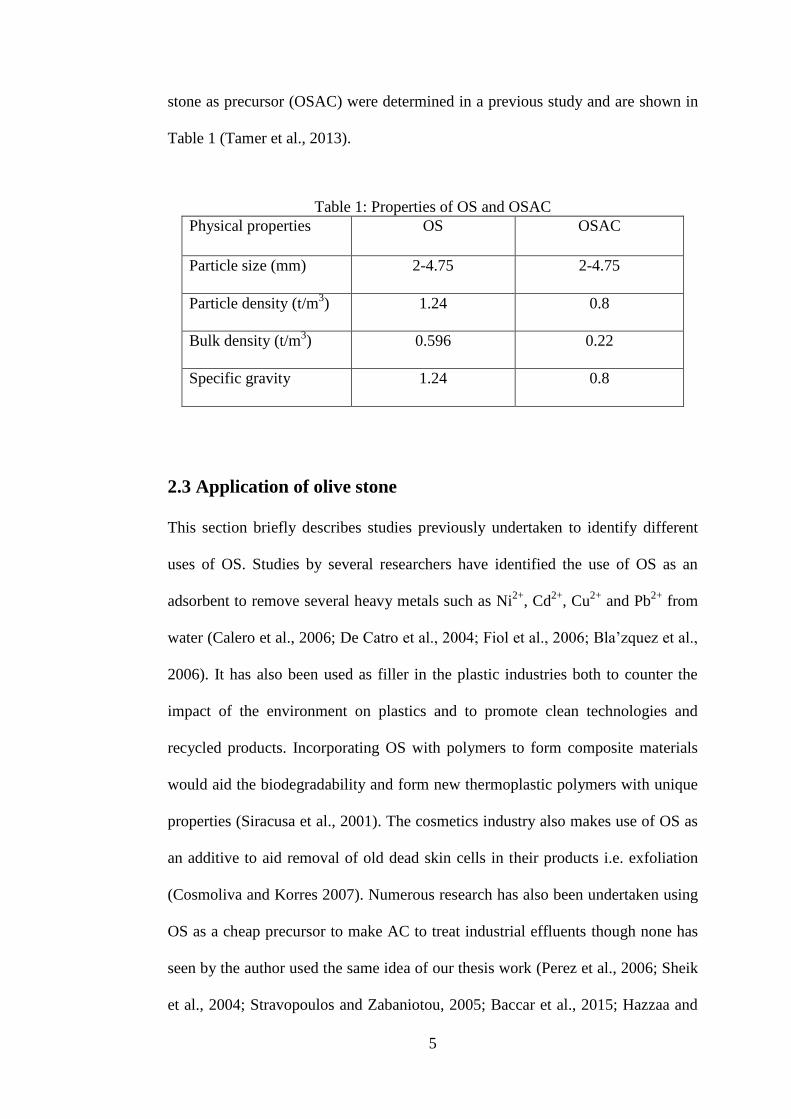
et. al., 1987). Characteristics of OS and activated carbon produced using olive
5
stone as precursor (OSAC) were determined in a previous study and are shown in
Table 1 (Tamer et al., 2013).
Table 1: Properties of OS and OSAC
Physical properties OS OSAC
Particle size (mm) 2-4.75 2-4.75
Particle density (t/m3) 1.24 0.8
Bulk density (t/m3) 0.596 0.22
Specific gravity 1.24 0.8
2.3 Application of olive stone
This section briefly describes studies previously undertaken to identify different
uses of OS. Studies by several researchers have identified the use of OS as an
adsorbent to remove several heavy metals such as Ni2+
, Cd2+
, Cu2+
and Pb2+
from
water (Calero et al., 2006; De Catro et al., 2004; Fiol et al., 2006; Bla’zquez et al.,
2006). It has also been used as filler in the plastic industries both to counter the
impact of the environment on plastics and to promote clean technologies and
recycled products. Incorporating OS with polymers to form composite materials
would aid the biodegradability and form new thermoplastic polymers with unique
properties (Siracusa et al., 2001). The cosmetics industry also makes use of OS as
an additive to aid removal of old dead skin cells in their products i.e. exfoliation
(Cosmoliva and Korres 2007). Numerous research has also been undertaken using
OS as a cheap precursor to make AC to treat industrial effluents though none has
seen by the author used the same idea of our thesis work (Perez et al., 2006; Sheik
et al., 2004; Stravopoulos and Zabaniotou, 2005; Baccar et al., 2015; Hazzaa and
6
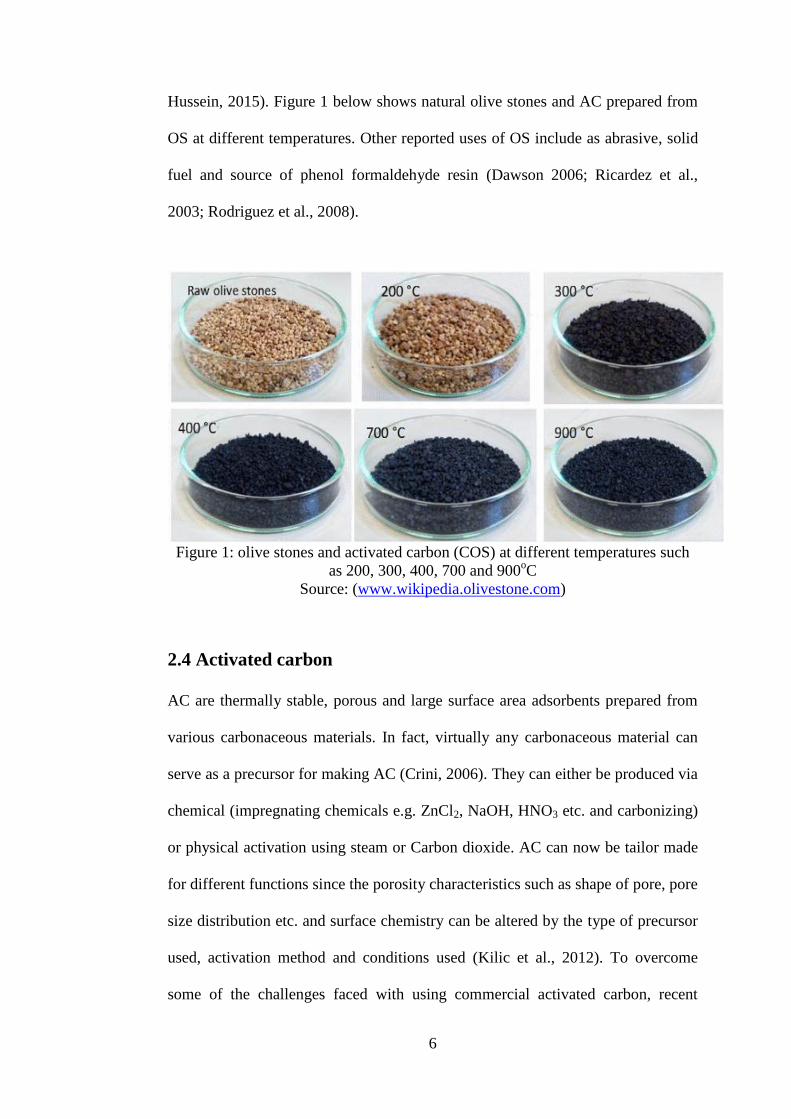
Hussein, 2015). Figure 1 below shows natural olive stones and AC prepared from
OS at different temperatures. Other reported uses of OS include as abrasive, solid
fuel and source of phenol formaldehyde resin (Dawson 2006; Ricardez et al.,
2003; Rodriguez et al., 2008).
Figure 1: olive stones and activated carbon (COS) at different temperatures such
as 200, 300, 400, 700 and 900oC
Source: (www.wikipedia.olivestone.com)
2.4 Activated carbon
AC are thermally stable, porous and large surface area adsorbents prepared from
various carbonaceous materials. In fact, virtually any carbonaceous material can
serve as a precursor for making AC (Crini, 2006). They can either be produced via
chemical (impregnating chemicals e.g. ZnCl2, NaOH, HNO3 etc. and carbonizing)
or physical activation using steam or Carbon dioxide. AC can now be tailor made
for different functions since the porosity characteristics such as shape of pore, pore
size distribution etc. and surface chemistry can be altered by the type of precursor
used, activation method and conditions used (Kilic et al., 2012). To overcome
some of the challenges faced with using commercial activated carbon, recent

7
research is now geared towards finding cheaper materials to serve as source of
carbon to make AC. Also, surface modification using surfactants can significantly
enhance the adsorption capacities of AC (Hou et. al., 2013). AC is now used in
many industries; food, chemical, water treatment, pharmaceutical industries, in
recovering metals, catalysis etc.
Numerous precursors: rice husk, coconut shells and wood (Polido-Novicio et al.,
2001), peach stones (Galiatsatou, et al., 2016), almond shells (Iniesta et al., 2001),
plum stones (Gierak, 1996), palm oil shells (Hashim, 1994), viscose fibre based
materials (Rodriguez Reinoso et al., 1994), coal (Li and lin 1999), cane bagasse
(Bernardo et al., 1997), aromatic polyimide films (Doyama et al., 2001), esparto
grass (Doyama et al., 2001) used tires (Helleur et al., 2001) and olive stones
(Overend and Chornet, 1999) etc. have been used to prepare AC.
2.5 Safranin dye
Safranin is a water-soluble dye that finds a wide range of applications in many
industries today. In fact, it falls into the category of the frequently used cationic
dyes in several industries (Rani et al., 2015). Figure 2 depicts the structural
formula of safranin:
Figure 2: chemical structure of safranin dye
• Molecular weight: 350.84g/mol
8
2.5.1 Application of safranin dye
Safranin can be used as a biological stain in histology and cytology researches
(Moawed and Abulkibash, 2012). It also finds a wide range of applications in the
food, paper and textile industries.
2.5.2 Effects of safranin dye
Long term human exposure to this dye usually causes respiratory tract and skin
irritation (Gupta et al., 2006). Other adverse effects of safranin to humans include
causing diarrhea, vomiting and nausea (Rejniak and Piotrowska, 1996). As earlier
said, the dye when present in water leads to pollution and makes water habitat
unfit for aquatic life (Preethi et al., 2006). In worse case scenarios, the harmful
impacts of this dye can be felt by future generations since it could result in gene
mutation and birth defects (Mahmoud et al., 2016).
2.6 Treatment technique: adsorption
Adsorption is the increase in the amount/concentration of one component known
as adsorbate on the surface (of adsorbent) or the interface between two phases
(Gupta et al., 2012). It occurs at the interphase between the solid and liquid
thereby reducing the concentration of the pollutant (adsorbate) in solution.
Four-stage adsorption mechanism proposed to explain dye adsorption is shown
below (Sivakumar and Palanisamy, 2010);
Stage I: Bulk Diffusion i.e. dye molecules diffuses from the solution towards the
adsorbent.
Stage II: Pore diffusion involving the adsorbate movement through adsorbent
boundary layer at the adsorption interface.
9
Stage III: Monolayer sorption of dye molecules involving adsorption on single
layer of adsorbent.
Stage IV: Multilayer adsorption of dye molecules involving adsorption in more
than single layer of adsorbent.
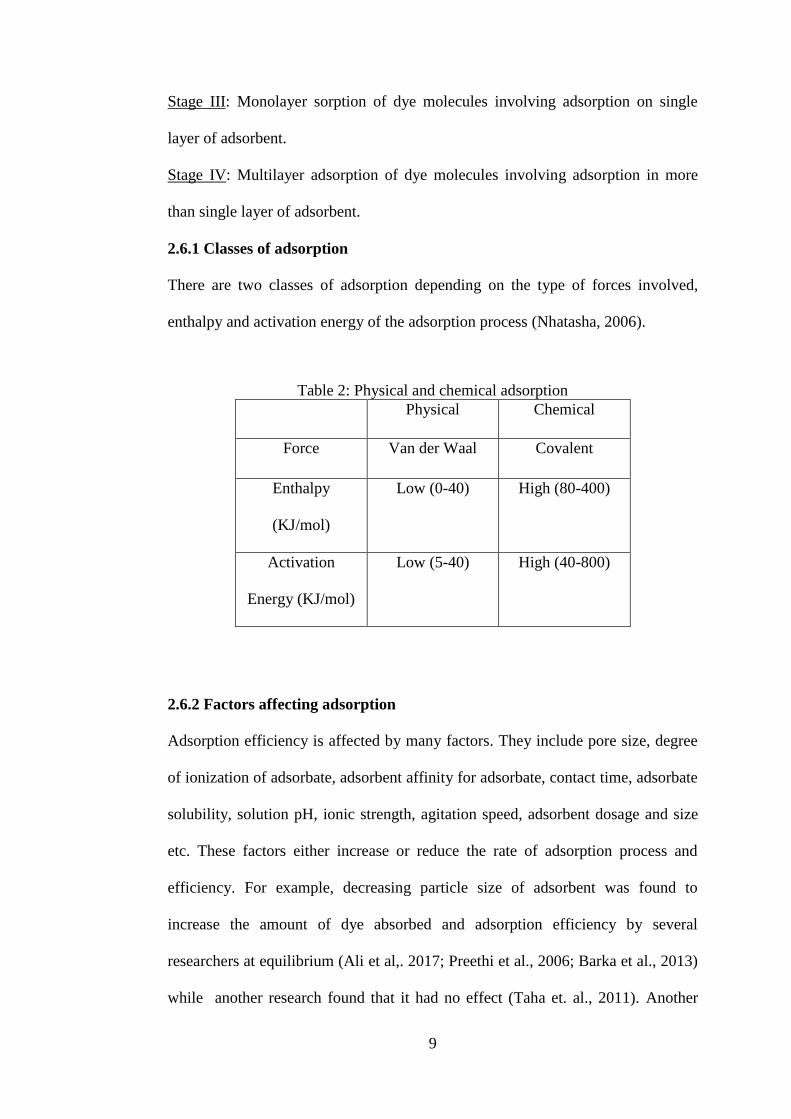
2.6.1 Classes of adsorption
There are two classes of adsorption depending on the type of forces involved,
enthalpy and activation energy of the adsorption process (Nhatasha, 2006).
Table 2: Physical and chemical adsorption
Physical Chemical
Force Van der Waal Covalent
Enthalpy
(KJ/mol)
Low (0-40) High (80-400)
Activation
Energy (KJ/mol)
Low (5-40) High (40-800)
2.6.2 Factors affecting adsorption
Adsorption efficiency is affected by many factors. They include pore size, degree
of ionization of adsorbate, adsorbent affinity for adsorbate, contact time, adsorbate
solubility, solution pH, ionic strength, agitation speed, adsorbent dosage and size
etc. These factors either increase or reduce the rate of adsorption process and
efficiency. For example, decreasing particle size of adsorbent was found to
increase the amount of dye absorbed and adsorption efficiency by several
researchers at equilibrium (Ali et al,. 2017; Preethi et al., 2006; Barka et al., 2013)
while another research found that it had no effect (Taha et. al., 2011). Another

10
good example is the impact of increasing ionic strength of dye solution by adding
salts. Chieng and colleagues found that on adding KNO3 to Rhodamine solution,
the % removal increased while Lim in their own studies found the exact opposite
(Lim et al., 2014).
2.7 Adsorption isotherms
Adsorption isotherms are applied by measuring the amount (at a fixed
temperature) of adsorbate present in the solution before and after adsorption is
carried out (Crini and Badot, 2008). It is very essential for design purposes, to
determine a suitable model from different isotherm models by analyzing the
equilibrium sorption data (Bharathi and Ramesh, 2013). These isotherms are
divided into monolayer and multilayer isotherms before further subdivisions into
2, 3, 4 and 5 parameter equilibrium isotherm models (Saadi et al., 2015).
(1)
Where:
f is the function of Ce
Ce is equilibrium dye concentration in solution (mg/L)
qe is equilibrium sorption uptake rate of adsorbent (mg/g).
Various mathematical isotherms have been formulated based on 3 fundamental
approaches; kinetics, thermodynamics and potential theory (Foo and Hameed,
2010). Examples include: Langmuir, Freundlich, Sips, Toth, Flory-Huggins,
Redlich-Peterson etc. These mathematical models are important because they help
to identify interactions between adsorbate and surface of adsorbent e.g. adsorbent
affinity, surface properties, adsorbent capacity etc. The commonly used isotherms
(Langmuir and Freundlich) were applied in our study.
11
2.7.1. Langmuir isotherm
Langmuir isotherm is a 2-parameter isotherm model that is one of the most useful
and simplest isotherms for both types of adsorption process (Saadi et al., 2015).
Assumptions based on this model are shown below.
Characteristics of this model are;
1. Monolayer and homogeneous type of adsorption
2. Adsorption is at specific sites i.e. localized surface adsorption.
3. Finite capacity of adsorbent for adsorbate
4. Identical sites of adsorbent surface having same energy and affinity for
adsorbent.
5. No interaction between adsorbents occupied on neighboring sites.
Mathematical expression and linearized form of this model is shown below
(equations 2 and 3);
(2)
(3)
Langmuir plot of / versus Ce is used to determine the values of qm (monolayer
adsorption capacity) and (Langmuir constant). Important information obtained
from this isotherm is the separation factor (RL).
(4)
is initial concentration (mgL-1)
Several probabilities obtained from RL values are;
RL greater than1: unfavorable
12
RL =1: linear
0< RL<1: favorable
RL equal 0: irreversible
2.7.2 Freundlich isotherm
This isotherm is applicable to identify multilayer adsorption.
1. Multilayer adsorption.
2. Adsorption occurs on heterogeneous surfaces.
3. Stronger binding sites based on their energy are first occupied by adsorbate.
4. Exponential decrease in adsorption energy on completion of the adsorption
process.
Equation 5 and 6 shows the Freundlich equation and its linearized form;
= KFCe1/n
(5)
log = log + (1/n) log
(6)
and Ce used in the equation are same as that of Langmuir above, n is the
adsorption intensity and KF is the Freundlich constant known as adsorption
coefficient. Both values are determined by plotting log qe against log Ce. Value of
n greater than unity indicates favorable adsorption process while 1/n greater than
unity shows cooperative adsorption (Fytianos et al., 2000).
2.8 Adsorption kinetics
Kinetic models are very useful in examining the mechanism (such as chemical
reaction, diffusion mechanism and adsorption surface) controlling the adsorption
process. Three kinetic models were applied to determine the rate and mechanism
of adsorption.

13
2.8.1 Pseudo first and second order kinetic models
The first order model proposed by Lagergren in 1898 assumes that difference in
adsorbent concentration at equilibrium or saturation is directly proportional to
uptake of adsorbate while second order kinetic proposed by Ho and McKay says
the rate limiting step in adsorption is chemisorption (Ali et al., 2017). The
equations for both models are depicted below.
(7)
(8)
Where;
= amount of dye adsorbed at equilibrium
= amount of dye absorbed at specific time intervals
k1 and k2 = pseudo first and second order rate constant
Graph of log (qe-qt) and t/qe versus t is used to determine the calculated values of
qe and rate constants k1 and k2.
2.8.2 Intraparticle diffusion model
This model is represented by equation 9 below and is used to describe the nature
of rate limiting steps in batch system to determine the properties of the solute and
adsorbent (Weber and Morris, 1962).
(9)
Where;
Kp = constant related to intra particle diffusion model (mgg-1
min-1/2
)
t1/2
= diffusion time (1/min1/2
)
= adsorption capacity of adsorbent at pre-determined time (mgg-1
)

14
Plotting against t1/2
will give values of Kp and constant, C. This plot can be used
to determine multi-linearity i.e. if two or more stages occurred during adsorption
process and whether intraparticle is the rate determining step (Feng et al., 2001).

15
Chapter 3
3 EXPERIMENTAL
3.1 Materials and equipment
Olive Stones used as precursor for carbonized olive stones (COS) was collected
from an olive oil producing industry. Safranin dye was purchased from Fluka
while anionic surfactant used to modify AC sodium lauryl sulphate; SLS and
hydrochloric acid were both purchased from BDH, England. Absolute ethanol,
sodium hydroxide, sodium chloride and potassium nitrate was obtained from
Aldrich.
Equipments used in this study include; Water proof pH meter (HANNA HI
98127), electronic balance, mechanical stirrer (Heidoph MR Hei standard),
mechanical agitator (SL350), centrifuge (NF 815), UV-spectrophotometer (T80+
Version 5.0), muffle furnace (Nabertherm GmbH model) and drying oven (Binder
GMPH).
3.2 Preparation of carbonized olive stones using olive stones (COS)
Olive stones OS previously collected from the olive oil producing industry was
cleaned several times with ordinary tap water and then distilled water to remove
all traces of dirt and unwanted particles before drying it at 70°C for 48 hours using
a conventional oven. Carbonization of OS was achieved by putting 100g of OS
into a muffle furnace and heating it at a heating rate of 5°C per minute till we
attained required carbonization temperature (500°C). On attaining this required

16
temperature, the sample COS was left for another 30 minutes for complete
carbonization. Afterwards, the product obtained COS was crushed using a
mechanical blender and sieved with the aid of a 500µm sieve to get uniform sizes.
COS was then washed several times using ethanol and hot distilled water. Finally,
mass of COS was measured to determine our yield.
3.3 Modification of COS using SLS
Carbonized olive stones obtained from olive stones COS was modified using
sodium lauryl sulfate by a similar method found in literature (Hou et. al., 2013).
20g of OSAC was added to 100mL of 0.05M SLS (2g of OSAC per 10mL SLS
solution) and stirred at 250 rpm overnight at ambient temperature. Product
obtained MCOS was filtered, washed several times using hot distilled water till the
pH of our filtrate became neutral. The product was then transferred into the oven
and dried at 70°C until a constant weight was obtained. MCOS was kept in a petri
dish until further use.
3.4 Batch adsorption studies
The adsorption studies were performed using the batch system to better understand
the effect of varying some experimental conditions such as; initial safranin
concentration (20 - 100mg/L), adsorbent dosage (0.1g, 0.25g, and 0.5g), pH (2-
10), temperature (25, 35 and 50⁰ C) and time. Dye solutions of known
concentrations containing a known amount of adsorbent were put in 250mL
Erlenmeyer flasks under constant agitation speed of 150rpm. The flasks were
agitated to allow for adequate contact between the MCOS and the safranin
solution. Solution pH was fixed to the desired pH value by adding either one of
HCL or NaOH (0.1M). Concentration of safranin remaining at pre-determined
time intervals was analyzed by taking the absorbance of the samples after

17
centrifugation at 2000rpm for 10 minutes using a UV-visible spectrophotometer
(517nm). Finally, amount of safranin dye absorbed at equilibrium and removal
efficiency MCOS was calculated from Equations 10 and 11.
(10)
% Removal = (
) (11)
Ci: initial safranin concentration (mgL-1
)
Cf: final safranin concentration (mgL-1
)
V: volume safranin dye (L)
w: mass of MCOS (g)
3.5 Adsorbate preparation
Safranin stock solution (500mg/L) was prepared by dissolving 500mg of safranin
in 1L deionized water. Serial dilutions of our stock solution was used to prepare
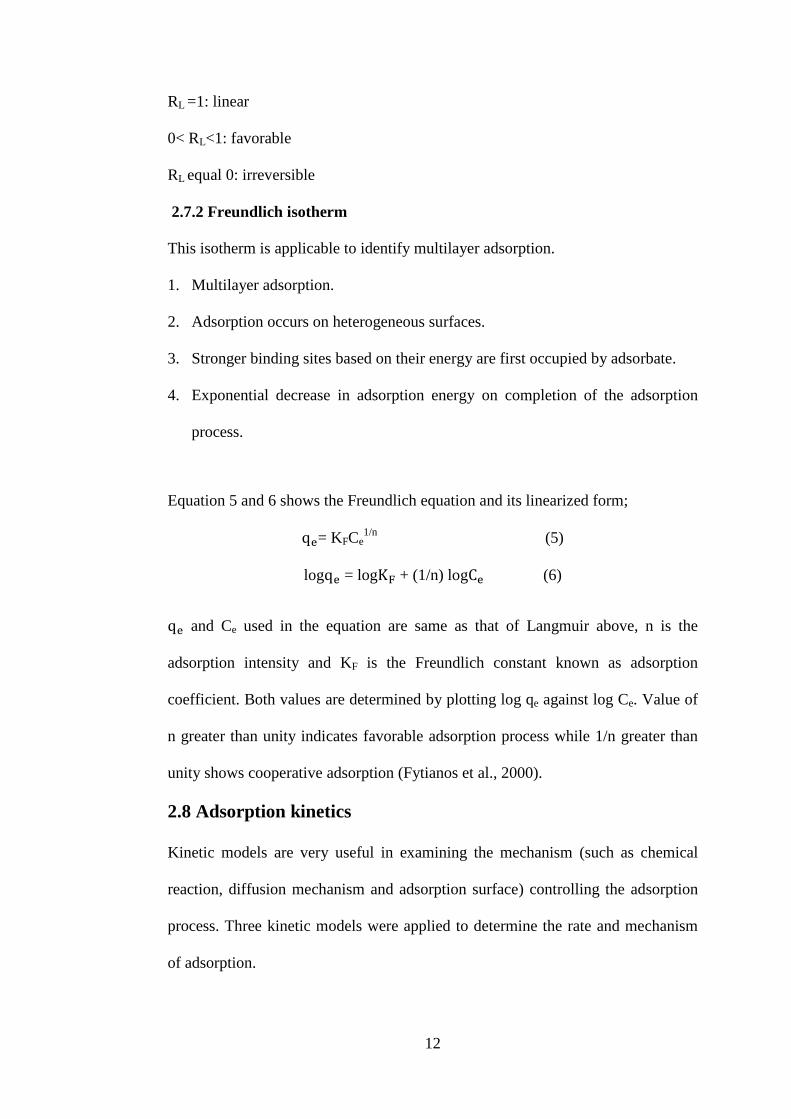
working solutions of different concentrations. The Calibration curve of safranin
dye was done by preparing six different dye concentrations (2, 4, 6, 8, 10 and
30mg/L) and the absorbance of each solution was measured. Calibration curve
shown in Figure 3 was plotted to obtain the absorbance-concentration profile and
used to determine unknown dye concentration.
18
Figure 3: Calibration curve of safranin
3.6 Physiochemical characterization of MCOS
The zero point charge (pHpzc) of OSAC was investigated using pH adjustment.
Briefly, 50mL of 0.1M NaCl solutions was put in several conical flasks. The pH of
each solution in the conical flasks was adjusted from 2-10 by adding either a 0.1M
solution of HCl or NaOH. To each separate flask, 100mg of MCOS was added and
agitated for 24hrs before final solution pH was taken. A plot of initial versus final
pH was used to determine the pHpzc (where pH initial is equal to pH final) of
MCOS. Physiochemical characterizations such as yield percentage, weight loss,
moisture and ash content, bulk density etc. was also undertaken.

19
Chapter 4
4 RESULT AND DISCUSSION
4.1 Characterization
Physiochemical characteristics of the adsorbent was studied and parameters such
as bulk density, yield%, weight loss%, moisture and content%, pHpzc and pH
values are given in Table 4 below.
Table 3: Physiochemical characterization of MOSAC
Adsorbent Parameters Values
MCOS
Yield (%)
Weight loss (%)
Bulk density(g/cm3)
Moisture content (%)
Ash content (%)
pHpzc
pH
29.90
70.10
0.494
1.00
2.00
6.60
7.00
The plot of initial and final solution pH of MCOS is shown in Figure 4. The pHpzc
of MCOS was found to be 6.6. When the pH is greater than 6.6, the surface of
MCOS will be negatively charged which is expected to enhance the adsorption of
positively charged dye ions via electrostatic force of attraction (Asabuwa, 2014).

20
Figure 4꞉ pHpzc of MCOS
4.2 Effects of different experimental conditions on safranin
removal
4.2.1 Dye solution pH
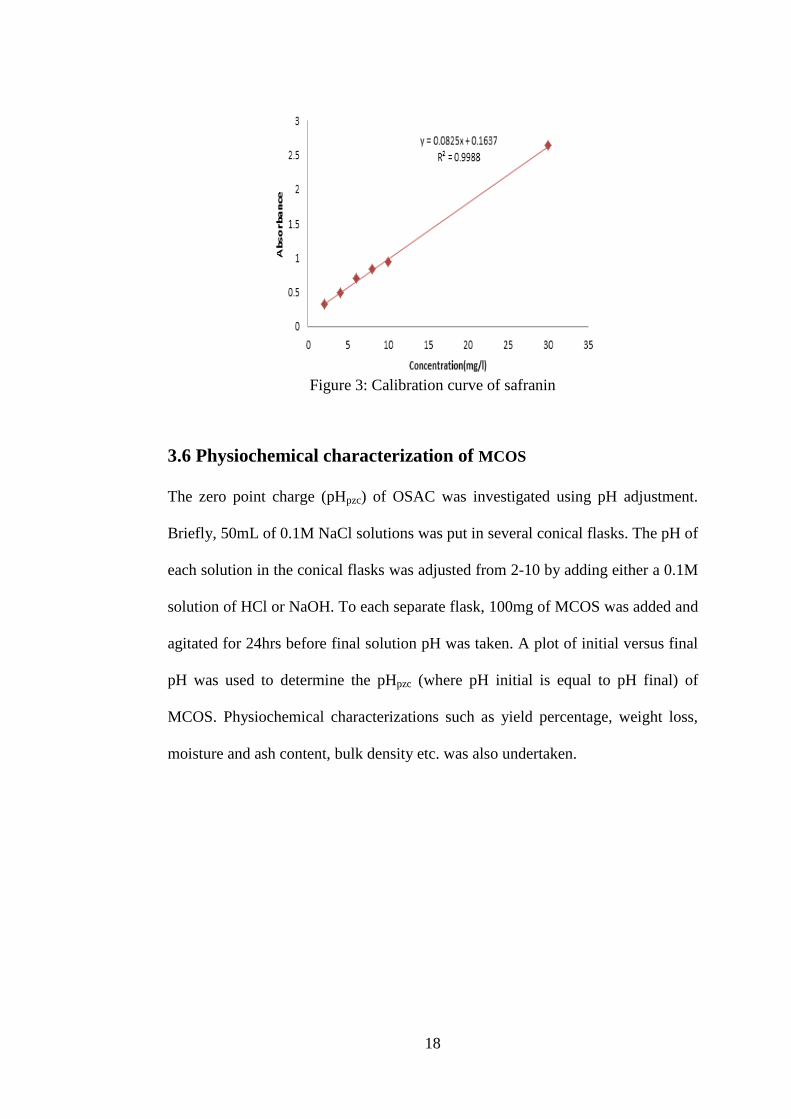
Figure 5 shows the relationship between the removal efficiency of safranin dye
using MCOS and changes in solution pH. The result shows that adsorption of
safranin dye on MCOS is pH dependent. Removal efficiency of safranin by
MCOS increases (28.9% to 42.6%) from pH 2–6 and attains maximum removal
(66.2%) at pH 7. Further increase in pH value reduced the removal efficiency of
MCOS hence; pH 7 was taken as the optimum pH for adsorption. This can be
explained based on the surface chemistry of MCOS. At pH lower than our pHpzc,
MCOS is positively charged due to presence of H+ ions on its surface. There is an
observed electrostatic repulsion between MCOS and safranin molecules which
causes a decrease in removal of the dye as seen in the graph (Garg et al., 2004).
When the pH˃ pHpzc, the surface of MCOS carries a negative charge and can
21
easily adsorb/attract the basic safranin dye molecules via electrostatic forces of
attraction (Auta and Hameed, 2011). This is similar to what has been reported in a
previous study (Amin, 2009).
Figure 5꞉ Effect of pH on removal efficiency of MCOS
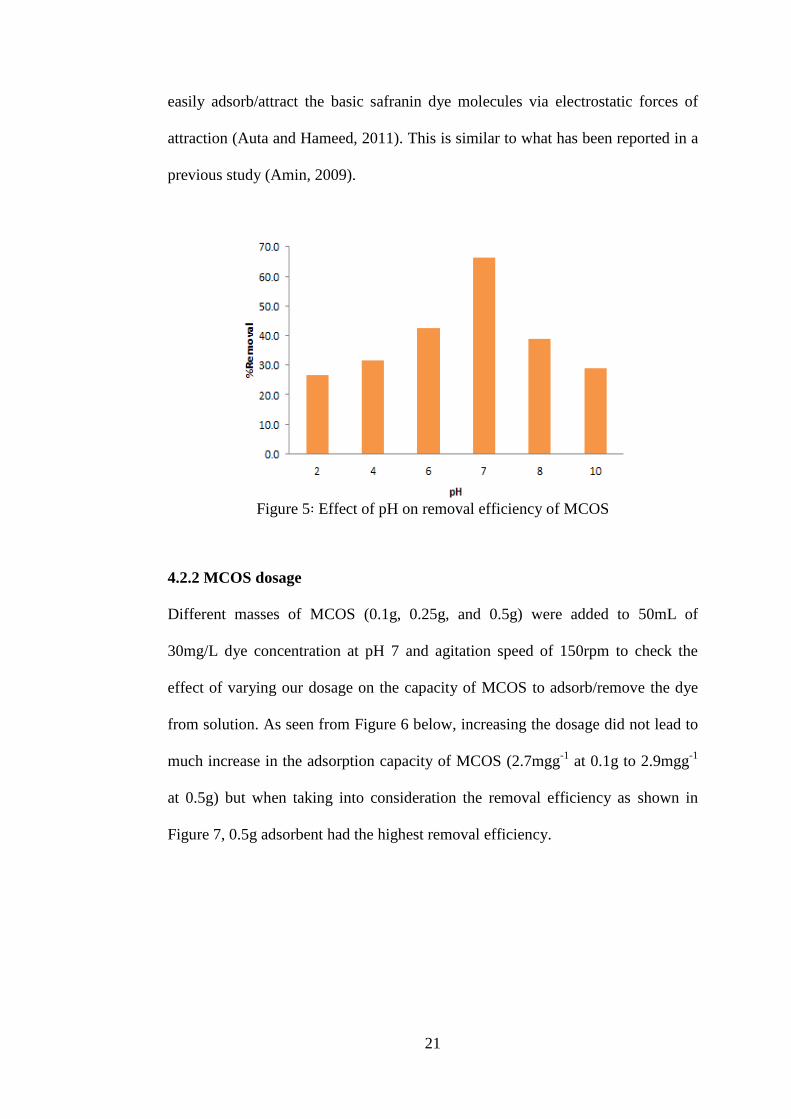
4.2.2 MCOS dosage
Different masses of MCOS (0.1g, 0.25g, and 0.5g) were added to 50mL of
30mg/L dye concentration at pH 7 and agitation speed of 150rpm to check the
effect of varying our dosage on the capacity of MCOS to adsorb/remove the dye
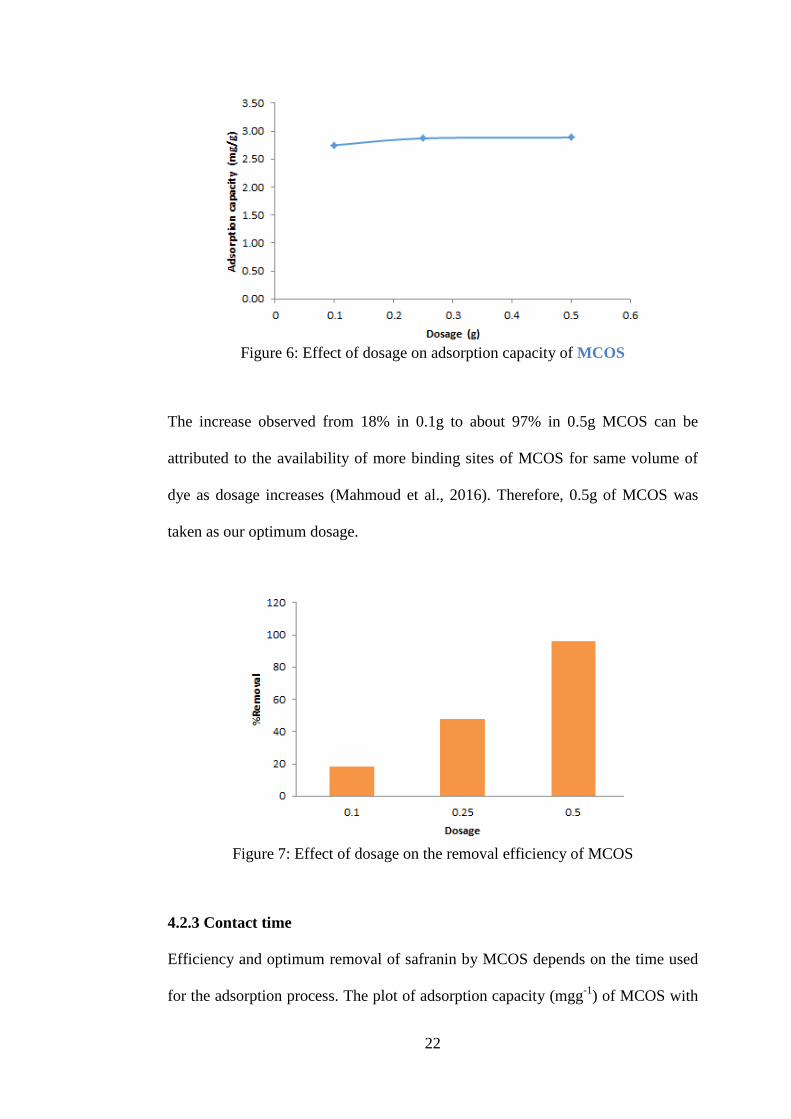
from solution. As seen from Figure 6 below, increasing the dosage did not lead to
much increase in the adsorption capacity of MCOS (2.7mgg-1
at 0.1g to 2.9mgg-1
at 0.5g) but when taking into consideration the removal efficiency as shown in
Figure 7, 0.5g adsorbent had the highest removal efficiency.
22
Figure 6: Effect of dosage on adsorption capacity of MCOS
The increase observed from 18% in 0.1g to about 97% in 0.5g MCOS can be
attributed to the availability of more binding sites of MCOS for same volume of
dye as dosage increases (Mahmoud et al., 2016). Therefore, 0.5g of MCOS was
taken as our optimum dosage.
Figure 7: Effect of dosage on the removal efficiency of MCOS
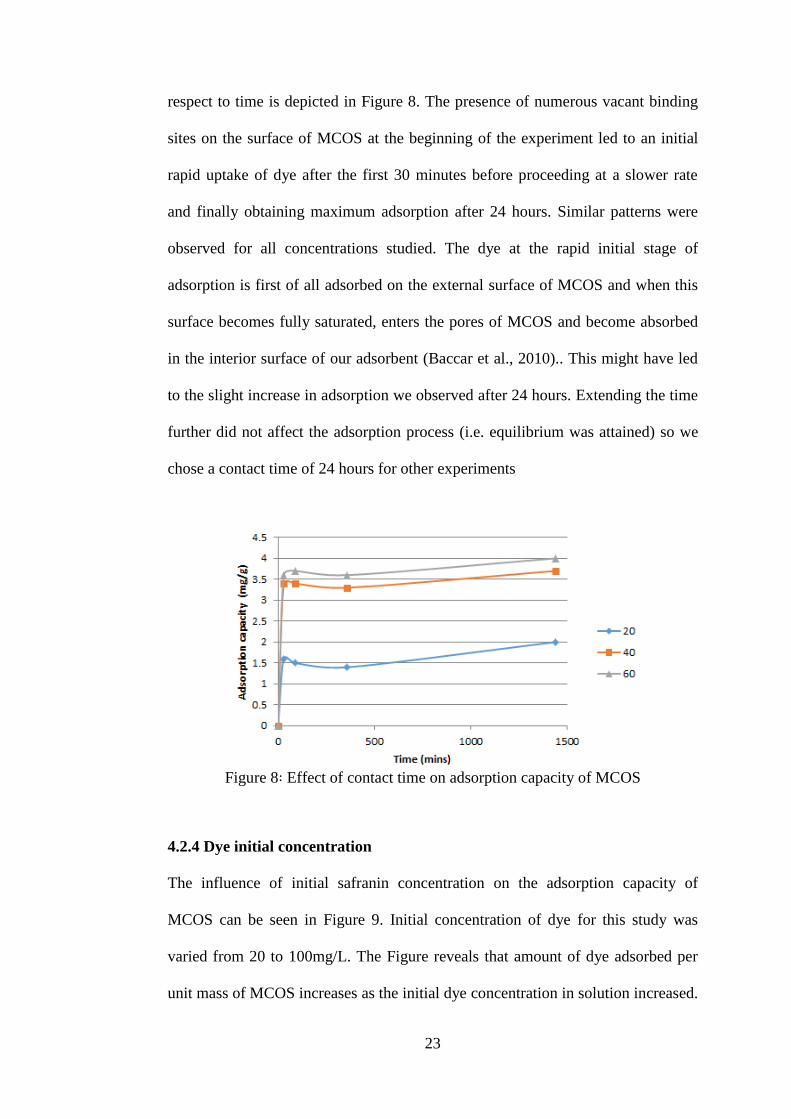
4.2.3 Contact time
Efficiency and optimum removal of safranin by MCOS depends on the time used
for the adsorption process. The plot of adsorption capacity (mgg-1
) of MCOS with
23
respect to time is depicted in Figure 8. The presence of numerous vacant binding
sites on the surface of MCOS at the beginning of the experiment led to an initial
rapid uptake of dye after the first 30 minutes before proceeding at a slower rate
and finally obtaining maximum adsorption after 24 hours. Similar patterns were
observed for all concentrations studied. The dye at the rapid initial stage of
adsorption is first of all adsorbed on the external surface of MCOS and when this
surface becomes fully saturated, enters the pores of MCOS and become absorbed
in the interior surface of our adsorbent (Baccar et al., 2010).. This might have led
to the slight increase in adsorption we observed after 24 hours. Extending the time
further did not affect the adsorption process (i.e. equilibrium was attained) so we
chose a contact time of 24 hours for other experiments
Figure 8꞉ Effect of contact time on adsorption capacity of MCOS
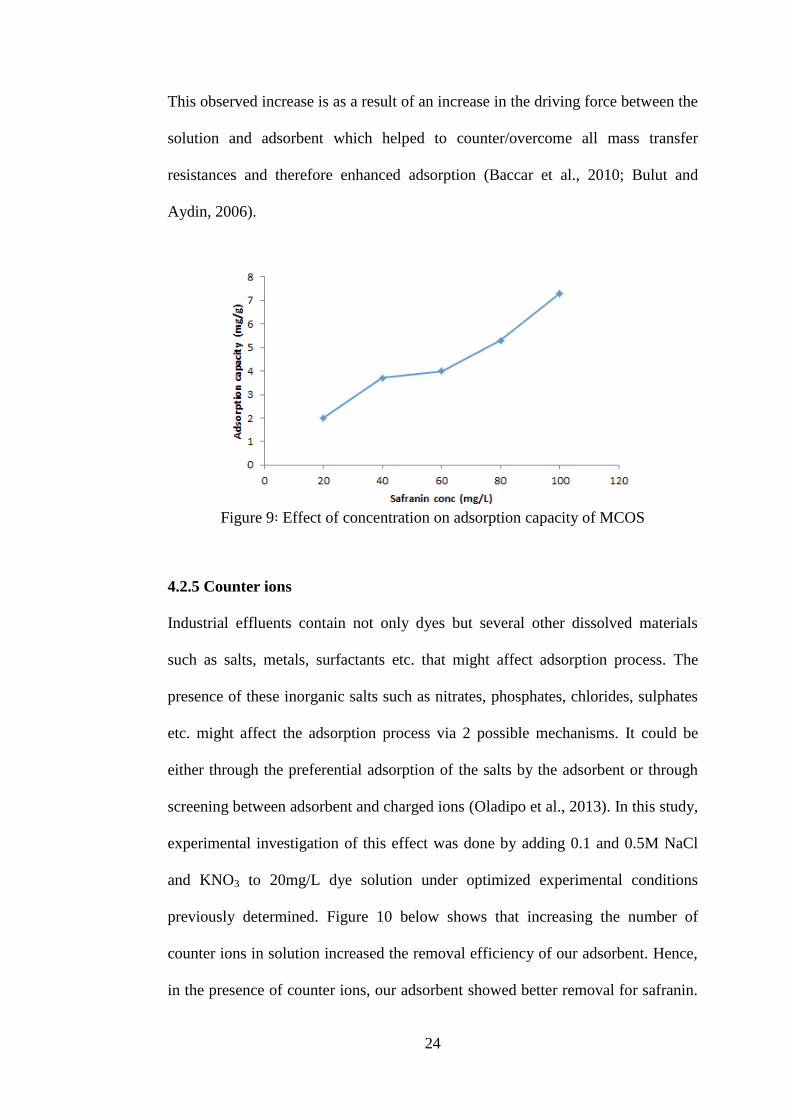
4.2.4 Dye initial concentration
The influence of initial safranin concentration on the adsorption capacity of
MCOS can be seen in Figure 9. Initial concentration of dye for this study was
varied from 20 to 100mg/L. The Figure reveals that amount of dye adsorbed per
unit mass of MCOS increases as the initial dye concentration in solution increased.
24
This observed increase is as a result of an increase in the driving force between the
solution and adsorbent which helped to counter/overcome all mass transfer
resistances and therefore enhanced adsorption (Baccar et al., 2010; Bulut and
Aydin, 2006).
Figure 9꞉ Effect of concentration on adsorption capacity of MCOS
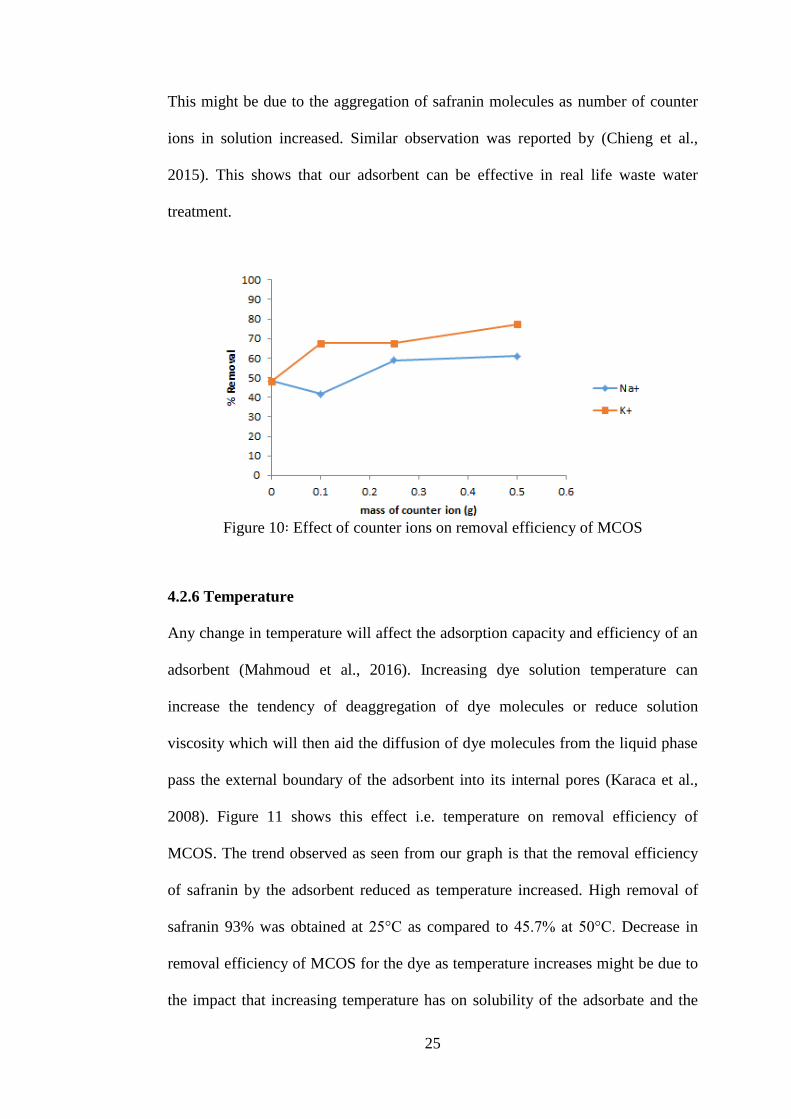
4.2.5 Counter ions
Industrial effluents contain not only dyes but several other dissolved materials
such as salts, metals, surfactants etc. that might affect adsorption process. The
presence of these inorganic salts such as nitrates, phosphates, chlorides, sulphates
etc. might affect the adsorption process via 2 possible mechanisms. It could be
either through the preferential adsorption of the salts by the adsorbent or through
screening between adsorbent and charged ions (Oladipo et al., 2013). In this study,
experimental investigation of this effect was done by adding 0.1 and 0.5M NaCl
and KNO3 to 20mg/L dye solution under optimized experimental conditions
previously determined. Figure 10 below shows that increasing the number of
counter ions in solution increased the removal efficiency of our adsorbent. Hence,
in the presence of counter ions, our adsorbent showed better removal for safranin.
25
This might be due to the aggregation of safranin molecules as number of counter
ions in solution increased. Similar observation was reported by (Chieng et al.,
2015). This shows that our adsorbent can be effective in real life waste water
treatment.
Figure 10꞉ Effect of counter ions on removal efficiency of MCOS
4.2.6 Temperature
Any change in temperature will affect the adsorption capacity and efficiency of an
adsorbent (Mahmoud et al., 2016). Increasing dye solution temperature can
increase the tendency of deaggregation of dye molecules or reduce solution
viscosity which will then aid the diffusion of dye molecules from the liquid phase
pass the external boundary of the adsorbent into its internal pores (Karaca et al.,
2008). Figure 11 shows this effect i.e. temperature on removal efficiency of
MCOS. The trend observed as seen from our graph is that the removal efficiency
of safranin by the adsorbent reduced as temperature increased. High removal of
safranin 93% was obtained at 25°C as compared to 45.7% at 50°C. Decrease in
removal efficiency of MCOS for the dye as temperature increases might be due to
the impact that increasing temperature has on solubility of the adsorbate and the

26
chemical properties of adsorbate-adsorbent (Mahmoud et al., 2016). It could also
be because the dye molecules escape from the surface of MCOS as temperature
increases (Sen et al., 2011). It is evident from this result that the adsorption
process is exothermic.
Figure 11꞉ Effect of temperature on adsorption of safranin by MCOS
4.3 Adsorption isotherm models
The adsorption isotherm of safranin on MCOS was studied. Two commonly used
adsorption isotherms were used in this study to find the adsorption capacity of
safranin dye on MCOS. Applicability of the isotherm equation to adsorption data
was based on comparing the R2 values of the two models used. Both Langmuir
and Freundlich plots are shown in Figures 12 and 13 while the adsorption isotherm
parameters are tabulated in Table 5.

27
Figure 12: Langmuir plot of safranin on MCOS
Figure 13: Freundlich plot of safranin on MCOS
As seen from the table, the R2 value obtained from the Langmuir was higher when
compared to that of the Freundlich model hence, our adsorption process obeys
Langmuir isotherm model which shows monolayer adsorption. In addition, the
values of RL ranging from 0.017-0.079 and 1/n of 0.202 obtained from both
isotherms indicate a favorable adsorption of safranin on MCOS.
28
Table 4: Isotherm parameters (Freundlich and Langmuir)
Isotherm parameter
Langmuir T(K) qm (mgg-1
) KL (Lmg-1
) RL R2
298 7.46 0.583 0.017-
0.079
0.9968
Freundlich T(K) Kf(mg/l)(L/mg1/n
) 1/n R2
298 2.9 0.202 0.9361
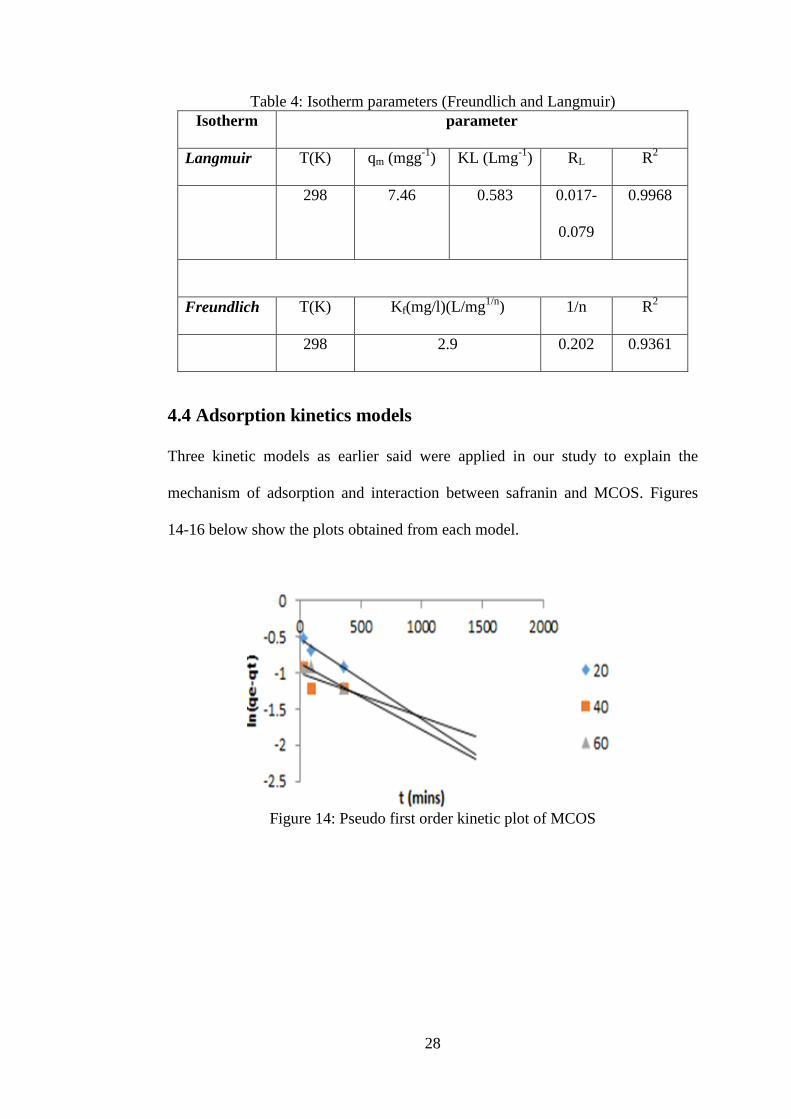
4.4 Adsorption kinetics models
Three kinetic models as earlier said were applied in our study to explain the
mechanism of adsorption and interaction between safranin and MCOS. Figures
14-16 below show the plots obtained from each model.
Figure 14: Pseudo first order kinetic plot of MCOS

29
Figure 15: Pseudo second order kinetic plot of MCOS
Figure 16: Intra-particle plot of MCOS
Kinetic parameters determined from the kinetic plots above were calculated and
the results are tabulated in the Table below. As shown in the table, pseudo second
order model has highest correlative coefficient R2
with values ranging from
0.9967-1.000 when compared to the other two models. Also, the experimental
adsorption capacities, qeexp (2.00-7.30mg/g) are very close to the calculated
adsorption capacities qecal (2.05-7.03mg/g). Hence, adsorption system obeys the
pseudo second order model.
30
According to Weber and Morris, for intra particle diffusion to be our rate limiting
step, our plot of qt versus t1/2
in Figure 16 should be a linear one that passes
through the origin (Weber and Morris, 1963). As seen from the Figure, the plot
does not start from the origin which is indicative that the process is possibly
controlled by other mechanisms. The magnitude of C (where C represents
intercept of our plot) tells us how thick the boundary layer between adsorbent and
adsorbate is. Large intercept values imply that the boundary layer is high. If
intercept C is higher than 0, the adsorption process is said to be complex and
comprise of more than one stage but when C is 0, intra-particle diffusion is the rate
controlling step (Iriarte-Velasco et al., 2011). The C values increases as initial
safranin concentration increases and C≠ 0 as shown in the table. This also
confirms our earlier assumption that intra-particle diffusion is not the only rate
determining step.

31
Table 5: Adsorption kinetic parameters
Safranin concentration
0.02g/L 0.04g/L 0.06g/L 0.08g/L 0.1g/L
Pseudo First Order
qe,exp(mg/g) 2.00 3.70 4.00 5.30 7.30
qe,cal (mg/g) 0.59 0.36 0.42 0.45 0.39
K1 (min-1
) 0.0011 0.0006 0.0009 0.004 0.0019
R2 0.916 0.4102 0.9709 0.9993 0.9367
Pseudo second order
qe,cal (mg/g) 2.05 3.67 3.98 5.02 7.03
K2 (1/min) 0.022 0.073 0.072 0.925 0.945
R2 0.9967 0.9995 0.9994 0.9999 1.0000
Intraparticle diffusion
Kp (mgg-1
min-1/2
) 0.018 0.0105 0.0113 0.0117 0.0102
C 1.3006 3.2408 3.5137 4.8649 6.8921
R2 0.9862 0.9672 0.9679 0.9809 0.7438
4.5 Thermodynamics analysis
The impact of temperature on the removal of safranin by MCOS was investigated
by conducting the experiments at three varying temperatures 25, 35 and 50°C at
constant safranin concentration and used to carry out a thermodynamic analysis.
Thermodynamic parameters (change in entropy and enthalpy) were determined
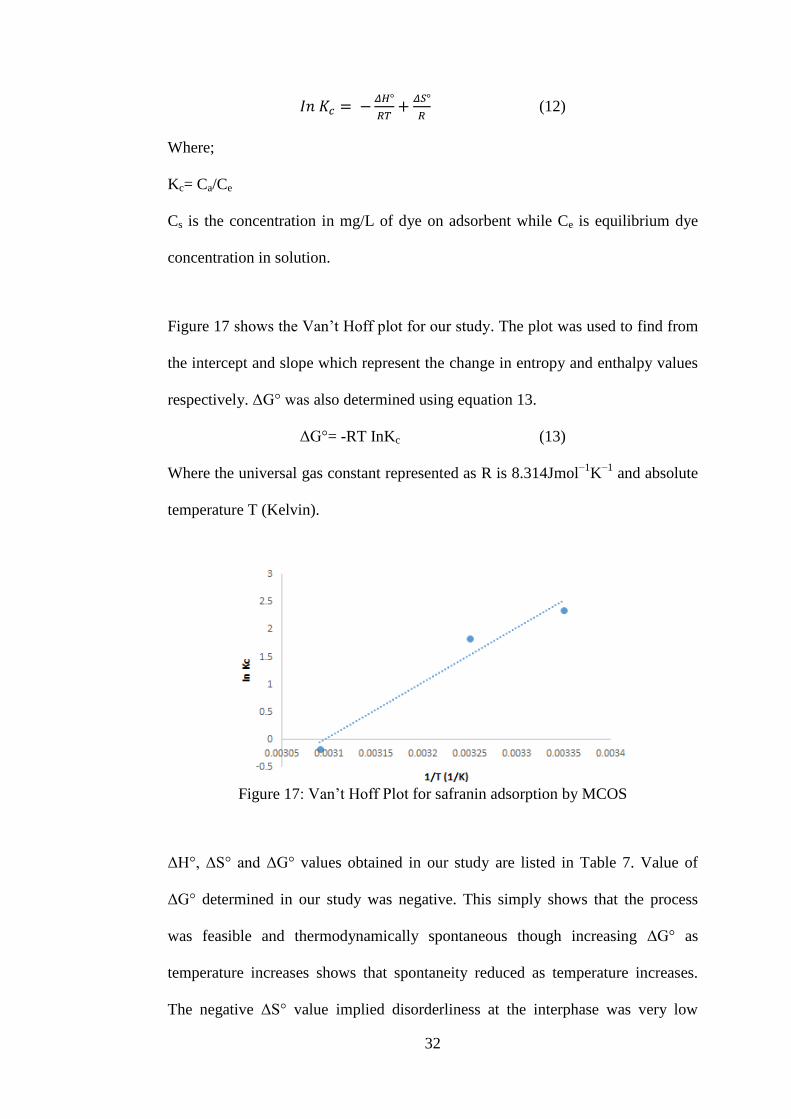
from the plot using equation 12 known as the Van’t Hoff equation.
32
(12)
Where;
Kc= Ca/Ce
Cs is the concentration in mg/L of dye on adsorbent while Ce is equilibrium dye
concentration in solution.
Figure 17 shows the Van’t Hoff plot for our study. The plot was used to find from
the intercept and slope which represent the change in entropy and enthalpy values
respectively. ΔG° was also determined using equation 13.
ΔG°= -RT InKc (13)
Where the universal gas constant represented as R is 8.314Jmol−1
K−1
and absolute
temperature T (Kelvin).
Figure 17: Van’t Hoff Plot for safranin adsorption by MCOS
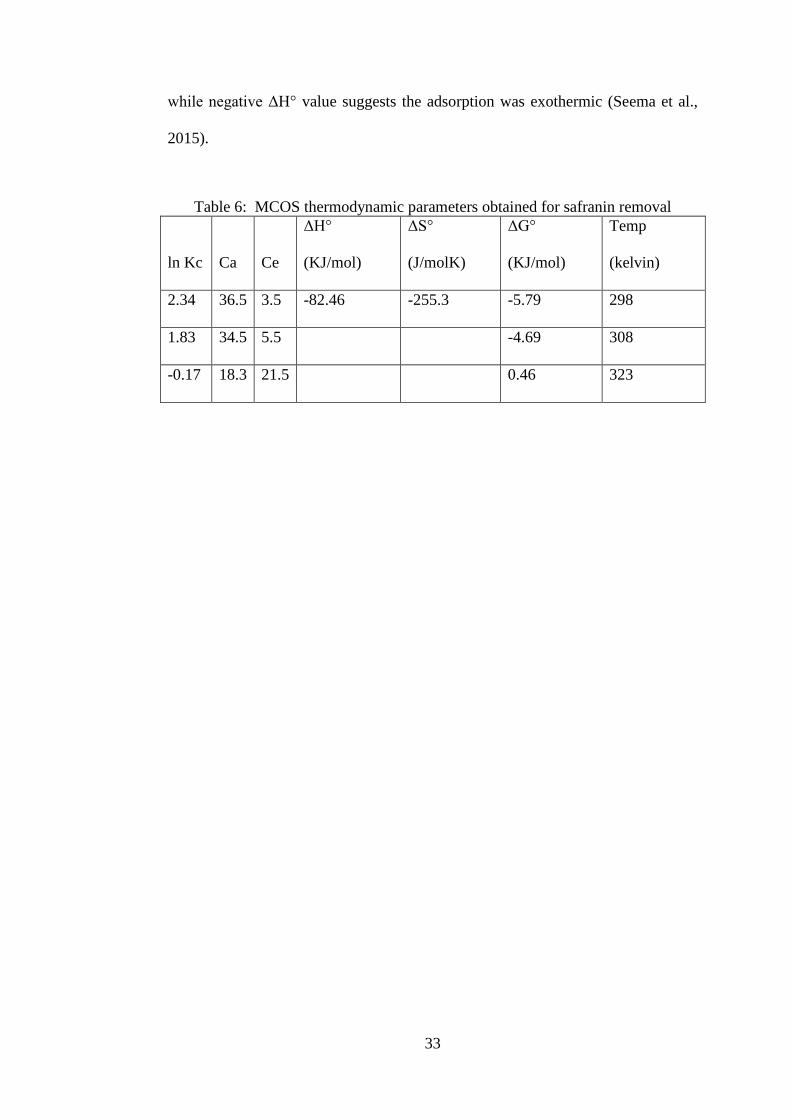
ΔH°, ΔS° and ΔG° values obtained in our study are listed in Table 7. Value of
ΔG° determined in our study was negative. This simply shows that the process
was feasible and thermodynamically spontaneous though increasing ΔG° as
temperature increases shows that spontaneity reduced as temperature increases.
The negative ΔS° value implied disorderliness at the interphase was very low
33
while negative ΔH° value suggests the adsorption was exothermic (Seema et al.,
2015).
Table 6: MCOS thermodynamic parameters obtained for safranin removal
ln Kc
Ca
Ce
ΔH°
(KJ/mol)
ΔS°
(J/molK)
ΔG°
(KJ/mol)
Temp
(kelvin)
2.34 36.5 3.5 -82.46 -255.3 -5.79 298
1.83 34.5 5.5 -4.69 308
-0.17 18.3 21.5 0.46 323
34
Chapter 5
5 CONCLUSION
The adsorptive potential of anionic surfactant modified activated carbon using
olive stone as precursor (MCOS) for adsorption of safranin dye in aqueous media
was evaluated in our research work. The effect of varying several experimental
conditions of the adsorption process and adsorbent physiochemical characteristics
was also studied. The following results were determined after completion of this
research work;
i. Maximum adsorption occurred at pH 7.
ii. The ability of MCOS to remove the dye from solution increased as initial
dye concentration and counter ions in solution increased but reduces as
temperature increased.
iii. Removal efficiency of MCOS increases as dosage increased. Optimum
dosage used for this study was 0.5g.
iv. Adsorption equilibrium was well fitted to experimental data using the
Langmuir isotherm due to high value of correlative coefficient R2 (0.9968)
which shows monolayer adsorption on the sorption sites of MCOS.
v. RL and 1/n values supported favorable adsorption of safranin by MCOS.
vi. Thermodynamic study shows that adsorption of safranin by our MCOS is a
spontaneous and exothermic process.

35
vii. MCOS, as discovered in our study displayed good adsorptive properties for
safranin dye and can be a suitable alternative adsorbent to treat waste water
rich in safranin.

36
REFERENCES
Al-Degs, Y.; Khraisheh, A. M.; Allen, S. J.; Ahmad, M. N. (2000). Effect of
carbon surface chemistry on the removal of reactive dyes from textile effluent.
Water Res., 34 (3): 927–935.
Ali, I.; Gupta, V. K. (2007). Advances in water treatment by adsorption
technology. Nat. Protoc., 1: 2661–2667.
Amin NK (2009). Removal of direct blue-106 dye from aqueous solution using
new activated carbons developed from pomegranate peel: Adsorption
equilibrium and kinetics. J.Hazard Mater;165:52–62.
Amin, N. K (2009). Removal of direct blue-106 dye from aqueous solution using
new activated carbons developed from pomegranate peel: Adsorption
equilibrium and kinetics. J. Hazard. Mater., 165: 52–62.
Auta M, Hameed BH. Optimized waste tea activated carbon for adsorption of
methylene blue and acid blue 29 dyes using response surface methodology.
Chem.Eng J. 2011; 175:233–43.
Baccar R, Blanquez P ,Bouzid J, Feki M, Sarra M (2010). Equilibrium,
thermodynamic and kinetic studies on adsorption of commercial dye by
activated carbon derived from olive waste cakes. Chem Eng J 165:457–
464.
37
Barka H, Guiyin W, Shirong Z. (2013). Removal of Pb(II) from aqueous solutions
by Phytolacca americana L. biomass as a low cost biosorbent.
Bulut Y, Aydin H. A kinetics and thermodynamics study of methylene blue
adsorption on wheat shells. Desalination 2006;194: 259–267.
Calero M., Hermainz F., Blazquez G., Tenorio G., (2006). Equilibrium modelling
of removal of cadmium ions by olive stones. Environ. Process 25, 261-
266.
Coro, E.; Laha, S. (2001). Color removal from textile effluents using hardwood as
an adsorbent. Water Res., 35 (7):1851–1854.
Cosmoliva, (2007). Available from http//www.cosmoliva.co.uk/htm/liquid.html.
Crini, G. (2006) Non-conventional low-cost adsorbents for dye removal: A review.
Bioresour. Technol., 97:1061–1085.
Dabrowski A., Hubicki Z., Podkoscielny P., Robens E. (2004). Selective removal
of the heavy metal ions from waters and industrial wastewaters by
ion.exchange method. Review. Chemosphere 56: 91-106.
Dawson, D., 2006. Available from http://www.dennisdawson.com/ industry.htm.
De Castro F.H.B., De Hoces, M.C., Garcia G.B., (2004). Kinetics aspects in the
cadmium removal by biosorption. Afinidad 61, 454-459.

38
E. Bernardo, R. Egashira, J. Kawasaki. Carbon 35 (1997). 1217–1221.
E. Iniesta, F. Sanchez, A. Garcia, A. Marcilla, Journal of Analytical and Applied
Pyrolysis 58(2001) 983–994.
Emamjomeh, M. M.; Sivakumar, M. (2009). Review of pollutants removed by
electro coagulation and electrocoagulation/flotation processes. J. Environ.
Manag., 90:1663–1679.
Feng-Chin W., Ru-Ling T ., Ruey-Shin J. (2001). Kinetic modeling of liquid-
phase adsorption of reactive dyes and metal ions on chitosan, Wat.
Res.35(3),613–618.
Fiol N.,villaescusa I., Martinez M., Miralles N., Poch J., Serarols J., (2006).
Sorption of Pb(II), Ni(II), Cd(II) and Cu(II) from aqueous solution by
olive stones waste. Sep. purif. Technol. 50, 132-140.
Foo K. Y., Hameed B.H. (2010). Insights into the modeling of adsorption
isotherm systems, Chem. Eng. J. 156, 2–10.
Garg VK, Moirantthem A, Rakesh K, Renuka G. Basic dye (methylene blue)
removal from simulated wastewater by adsorption using Indian rose wood
sawdust: a timber industrywaste. Dye, Pigment 2004;63:243–50.
Gierak, Science and Technology 14 (1996) 47–57.
39
Gupta, V. K.; Agarwal, S.; Saleh, T.A. (2011). Chromium removal by combining
the magnetic properties of iron oxide with adsorption properties of carbon
nanotubes. Water Res., 45: 2207–2212.
Gupta, V. K.; Ali, I.; Saleh, T. A.; Nayak, A.; Agarwal, S. (2012). Chemical
treatment technologies for waste-water recycling: An overview. RSC
Advances, 2: 6380–6388.
Gupta, V. K.; Jain, R.; Mittal, A.; Mathur, M.; Sikarwar, S. (2006) Adsorption of
Safranin-T from wastewater using waste materialsactivated carbon and
activated rice husks. J. Colloid Interface Sci, 303: 80–86.
Hazzaa R., Hussein M. (2015). Adsorption of cationic dye from aqueous solution
onto activated carbon prepared from olive stones.
Heredia, A., Guille ´n, R., Ferna ´ndez-Bolan ˜os, J., Rivas, M.,1987. Olives
stone as a source of fermentable sugars. Biomass 14, 143–148.
Hou G., Li y. & Cheng y. (2013). Activated carbon modified with sodium dodecyl
sulfonate as a solid phase sorbent for the separation and preconcentration
of trace cadmium in water samples with detection by electrochemical
atomic adsorption spectrometry. Analytical Letter 46: 1978-1990.
Huo, Y.; Xie, Z.; Wang, X.; Li, H.; Hoang, M.; Caruso, R. A. (2013). Methyl
orange removal by combined visible-light photo-catalysis and membrane
distillation. Dyes Pigments 98: 106–112.
40
Iram, M.; Guo, C.; Guan, Y.; Ishfaq, A.; Liu, H. (2010). Adsorption and magnetic
removal of neutral red dye from aqueous solution using Fe3O4 hollow
nanospheres. J. Hazard. Mater., 181: 1039–1050.
Kapellakis H, Giorgos M, Dimitris G, Katerina P, Geogia S. (2008). Adsorption
of cationic dye from aqueous solution onto activated carbon prepared from
olive stones.
Karaca S, Gürses A, Acıkyıldız M, EjderKorucu M. Adsorption of cationic dye
from aqueous solutions by activated carbon. Microporous Mesoporous
Mater 2008;115: 376–82.
Kilic M, Apaydin-Varol E, Pütün AE (2012) Adsorptive removal of phenol from
aqueous solutions on activated carbon prepared from tobacco residues:
Equilibrium, kinetics and thermodynamics. Journal of Hazardous
Materials 189: 397-403.
Korres, 2007. Available from http://www.amazon.com/Korres-OliveStone-
Scrub/Combination/dp/B0002VXTTQ. Kourtzis, M., 1999. Olive crop
processing method. Patent, International Publication Number: WO
99/16322.
L. Polido-Novicio, T. Hata, Y. Kurimoto, S. Doi, S. Ishihara, Y. Imamura, Journal
of Wood Science 47 (2001) 48–57.
Lim L.B., Priyantha N., Tennakoon D.T.B, Chieng H.I., Dabri M.K., Suklueng M.
2014. Breadnut peel as a highly effective low cost biosorbent for

41
methylene blue: Equilibrum, thermodynamics and kinetic studies. Arabian
Journal of Chemistry 10(2): 3216-3228.
M. Doyama, A. Ichida, Y. Inoue, Y. Kogure, T. Nozaki, S. Yamada, International
Journal of Inorganic Materials 3 (2001) 1105–1107.
M.A. Hashim (Ed.), Preparation and characterization of activated carbon derived
from palm oil shells using a fixed bed pyrolyser. Symposium on
Bioproducts Processing—Technologies for the Tropics, Kualalampur,
Malaysia, Jan 4–7, 1994, INST Chemical Engineers, UK, 1994.
M.A. Hashim (Ed.), Preparation and characterization of activated carbon derived
from palm oil shells using a fixed bed pyrolyser. Symposium on
Bioproducts Processing—Technologies for the Tropics, Kualalampur,
Malaysia, Jan 4–7, 1994, INST Chemical Engineers, UK, 1994.
Mahmoud, M., Kim, H.R., Xing, R., Hsiao, S., (2016). TWIST1 Integrates Endothelial
Responses to Flow in Vascular Dysfunction and Atherosclerosis. J.Circulation
research 119(3): 450-62.
Mahvi, A. H.; Ghanbarian, M.; Nasseri, S.; Khairi, A. (2009). Mineralization and
dis coloration of textile wastewater by TiO2 nanoparticles. Desalination,
239: 309–316.
Moawed E.A. and Alulkibash A.B. (2016). Selective separation of light green and
safranin O from aqueous solution using Salvadora persica (Miswak)

42
powder as a new biosorbent. Journal of Saudi Chemical Society 20: 178-
185.
Moawed E.A. and Alulkibash A.B. (2016). Selective separation of light green and
safranin O from aqueous solution using Salvadora persica (Miswak)
powder as a new biosorbent. Journal of Saudi Chemical Society 20: 178-
185.
Mohammadi, N.; Khani, H.; Gupta, V. K.; Amereh, E.; Agarwal, S. (2011).
Adsorption process of methyl orange dye onto mesoporous carbon
material–kinetic and thermodynamic studies. J. Colloid Interface Sci., 362:
457–462.
Nhatasha binti S. S. J. (2006). Adsorption study – dye removal using clay,
University College of Engineering and Technology Malaysia.
Oladipo A. A., Gazi M., Saber-Samandari S. (2013). Adsorption of anthraquinone
dye onto eco-friendly semi-IPN biocomposite hydrogel: Equilibrium
isotherms, kinetics studies and optimization, Journal of the Taiwan
Institute of Chemical Engineers.
P. Galiatsatou, M. Metaxas, V. Kasseloui-Rigopoulou, Mikrochimica Acta 136
(2001). 147–152.

43
Pereira M. R., Arroyo P.A., Barros M.A., Sanches V.M., Silva E.A., Fonseca I.S.
& Lovera R.G. (2006). Chromium adsorption in olive stone activated
carbon. Adsorption 12: 155-162.
Perez M., Torrades F., Domenech X., Peral J. (2002). Fenton and Photo-Fenton
oxidation of textile effluents. Water Research 36: 2703-2710.
Polido N., Toshimitsu H, Yasuji K, Shuichi D., Shigehisa I, Yuji I, (2001).
Adsorption capacities and related characteristics of wood charcoals
carbonized using a one-step or two-step process. J Wood Sci (2001)
47:48-57.
Preethi H., Tünay L., Doğruel D. (2006). Chemical Oxidation Applications for
Industrial Wastewaters.
R. Helleur, N. Popovic, M. Ikura, M. Stanciulescu, D. Liu, Journal of Analytical
and Applied Pyrolysis 58 (2001) 813–824
R. Helleur, N. Popovic, M. Ikura, M. Stanciulescu, D. Liu, Journal of Analytical
and Applied Pyrolysis 58 (2001) 813–824.
R.P. Overend, E. Chornet (Eds.), Pyrolysis of olive stones in different reactions,
Fourth Conference on Biomass: A Growth Opportunity in Green Energy
and Value-Added Products, Oakland, CA, August 29–September 2, 1999,
Pergamon/Elsevier, UK, 1999.

44
Rejniak, L.; Piotrowska, H. (1966) Effect of Malachite Green, Congo red and
Safranin on Cell Division in Gemmae of Allium cepa. Nature, 209: 517–
518.
Rejniak, L.; Piotrowska, H. (1966). Effect of Malachite Green, Congo red and
Safranin on Cell Division in Gemmae of Allium cepa. Nature, 209: 517–
518.
Sanchez L., Peral J., Domenech X. (1998). Aniline degradation by combined
photocatalysis and ozonation. Applied Catalysis B: Environmental 19: 59-
65.
Shah, K. M. (1998). Handbook of Synthetic Dyes and Pigments, 2nd ed.;
Multitech Publishing Co.: India.
Sheikh, A., Newman, A.P., Al-Daff aee, H.K., Phull, S., Cresswell, N., 2004.
Characterization of activated carbon prepared from a single cultivar of
Jordanian olive stone by chemical and physicochemical techniques. J.
Anal. Appl. Pyrol. 71, 151–164.
Siracusa, G., La Rosa, A.D., Siracusa, V., Trovato, M., 2001. EcoCompatible use
of olive huso as filler in thermoplastic composites. J. Polym. Environ. 9,
157–161.
Sivakumar P, Palanisamy N (2010) Mechanistic study of dye adsorption on to a
novel non-conventional low-cost adsorbent. Adv Appl Sci Res 1(1):58–65.
45
Stavropoulos, G.G., Zabaniotou, A.A., 2005. Production and characterization of
activated carbons from olive-seed waste residue. Micropor. Mesopor.
Mater. 82, 79–85.
Taha G., Arifien A.,El-Nahas S, (2011). Removal efficiency of potato peels as a
new biosorbent material for uptake of Pb(II), Cd(II) and Zn(II) from
aqueous solutions. Journal of Solid Waste Technology and Management
37: 128-140.
Taha S., Sophie R., Ibrahim C. (2011). Kinetic study and modeling of heavy metals
removal by adsorption onto peanut husks incinerated residues. Energy Procedia
6 (2011) 143–152.
Tamer M. A., Ismail A., mohd A., Ahmad A. F., (2013). Effect of different olive
stone particle size on the yield and surface area of activated carbon
production, Advanced Materials Research 626: 126-130.
Tejeda-Ricardez J., Vaca-Garcia C., Borredon M.E. (2003). Design of a batch
solvolytic liquefaction reactor for vaporazation of residues from the
agricultural foodstuff. Chem. Eng. Res. 81, 1066-1070.
Uylaşer V, Yildiz G, (2014).The Historical Development and Nutritional Importance of
Olive and Olive Oil Constituted an Important Part of the Mediterranean Diet.
Weber, W.J., Morris, J.C., 1963. Kinetics of adsorption on carbon from solution.
J. Sanit. Eng. Div. Am. Soc. Civ. Eng. 89, 31–60.