Embed Size (px)
Citation preview
1
FACT SHEET
OVERVIEW
Modern applications are more complex than ever as mobile and web applications drive increasing transaction volumes. At the same time, a transitioning workforce is resulting in experienced people leaving IT organizations and inexperienced staff taking over application performance responsibilities. As a result, when problems occur, much time is wasted and productivity is lost in war room discussions. What businesses need is a solution that addresses all of these issues.
Strobe®, a suite of performance analysis tools including iStrobe and AutoStrobe, is the industry-leading application performance and analysis solution for z/OS-based applications. With Strobe, IT departments can pinpoint application inefficiencies that cause excessive CPU consumption, while reducing hardware and software costs and increasing customer satisfaction.
ENABLE THE TRANSITIONING WORKFORCE
Strobe has been modernized to make it easy for users, even those new to the mainframe, to analyze and tune application performance. For example, Strobe’s web-based graphical interface enables users to easily initiate measurements and leverage intuitive graphs and charts to accurately diagnose application performance issues.
In addition, users can rely on Strobe’s built-in intelligence including detailed recommendations for performance improvement opportunities and precise, in-depth application performance data necessary for locating and eliminating sources of excessive resource demand.
Together, these capabilities reduce reliance on application expertise, lessening the impact of a transitioning workforce, while empowering developers to focus on application performance earlier in the lifecycle.
PROACTIVELY DETERMINE WHAT AND WHEN TO MEASURE
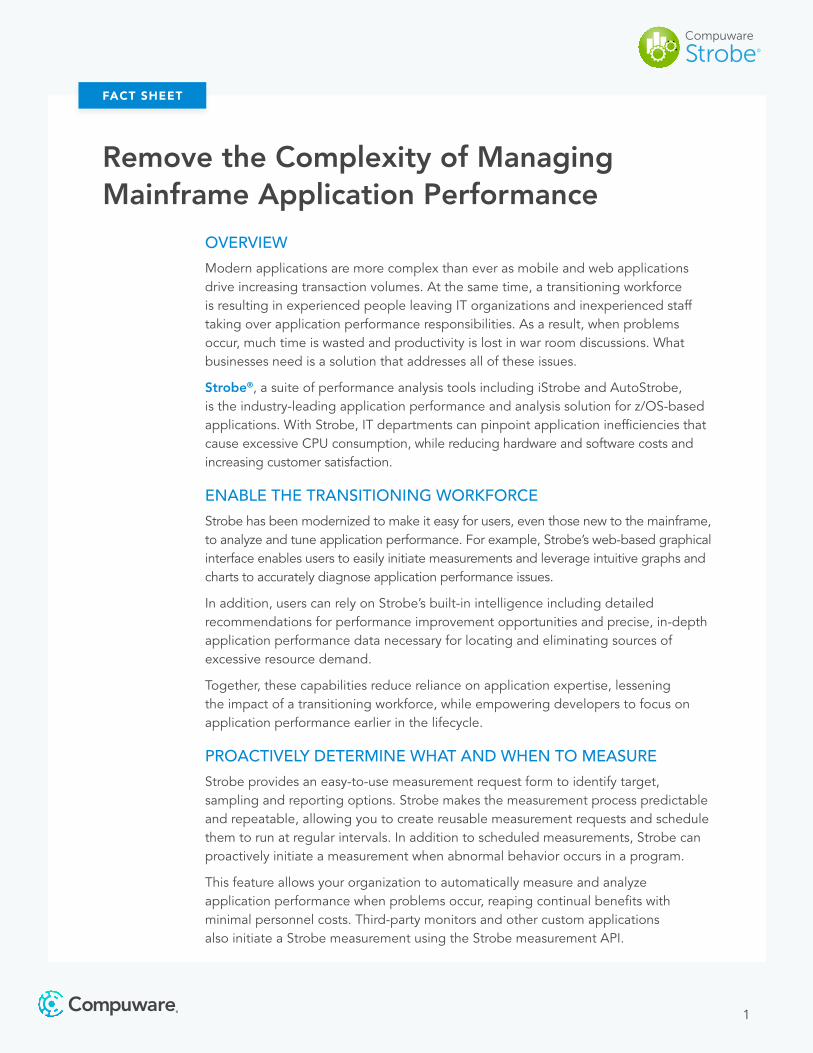
Strobe provides an easy-to-use measurement request form to identify target, sampling and reporting options. Strobe makes the measurement process predictable and repeatable, allowing you to create reusable measurement requests and schedule them to run at regular intervals. In addition to scheduled measurements, Strobe can proactively initiate a measurement when abnormal behavior occurs in a program.
This feature allows your organization to automatically measure and analyze application performance when problems occur, reaping continual benefits with minimal personnel costs. Third-party monitors and other custom applications also initiate a Strobe measurement using the Strobe measurement API.
Remove the Complexity of Managing Mainframe Application Performance
Compuware
Strobe®
2
FACT SHEET
REDUCE TIME AND RESOURCES WASTED IN WAR ROOMS
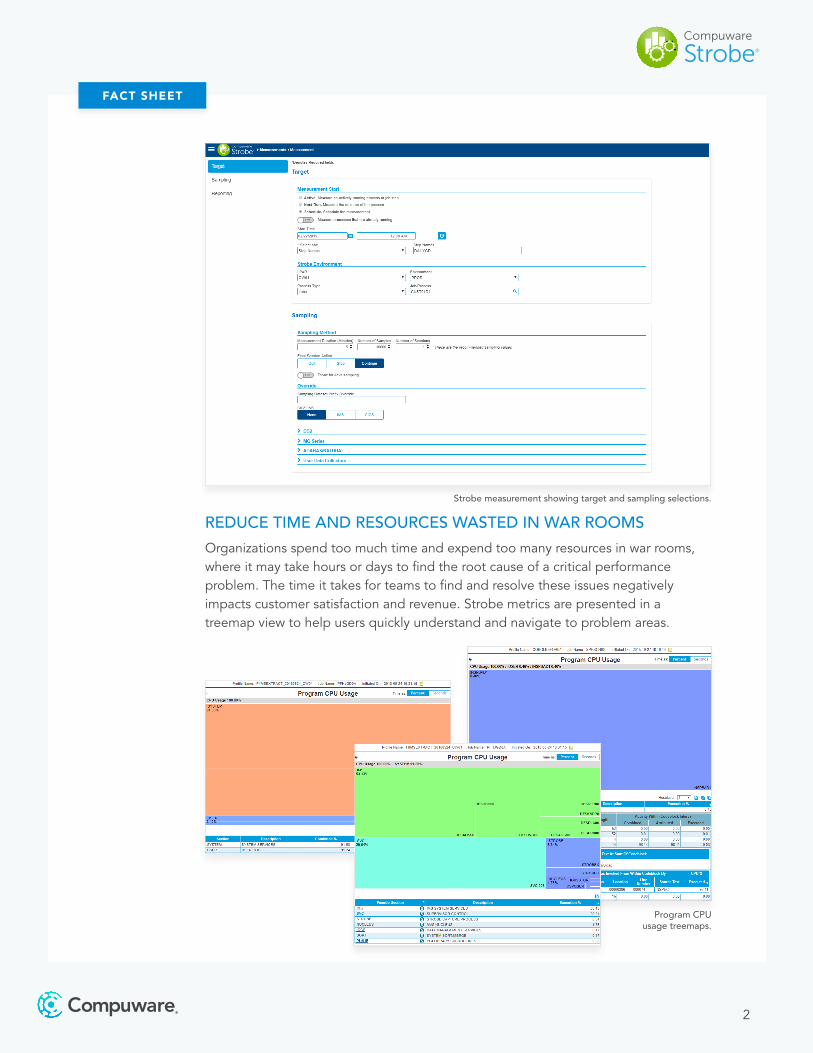
Organizations spend too much time and expend too many resources in war rooms, where it may take hours or days to find the root cause of a critical performance problem. The time it takes for teams to find and resolve these issues negatively impacts customer satisfaction and revenue. Strobe metrics are presented in a treemap view to help users quickly understand and navigate to problem areas.
Program CPU usage treemaps.
Strobe measurement showing target and sampling selections.
Compuware
Strobe®
Program CPU usage treemaps.
3
FACT SHEET
Strobe quickly and easily pinpoints the root cause of performance problems, even in complex environments with multiple languages, databases or teleprocessing subsystems. A single Strobe performance profile supplies a comprehensive view of mainframe application performance to quickly and accurately put an end to finger pointing and guesswork.
BREAK DOWN I.T. BARRIERS AND SOLVE PROBLEMS FASTER
A lack of collaboration and manually sharing information can prolong resolution times and increase application backlogs. Compuware helps solve this age-old issue by uniting tools used to find problems with those used to fix them. When Strobe detects a performance problem or exception, an issue is generated within Atlassian Jira Software. Any developer tasked with that Jira issue can initiate a Topaz Workbench debugging session pre-configured to address the precise point in the application where the problem occurs.
MEASURE AND REPORT APM SUCCESS
What cannot be measured cannot be improved. Organizations require objective performance data to track and report successful performance tuning. Strobe Insight provides analysis for all major subsystem components, including batch, CICS, Db2 and IMS. Performance data is stored in a Microsoft SQL Server, Oracle or Db2 database. Using the Business Intelligence Reporting Tool (BIRT), you can either view the supplied reports or easily craft custom reports to view data from a variety of perspectives. This lets you follow trends, identify the best areas for tuning efforts, and isolate response time and CPU consumption problems.
REDUCE YOUR MONTHLY SOFT CAPACITY CHARGES
IT shops that experience peak usage overruns may pay a large penalty for excess CPU consumption. Strobe Insight includes a Rolling 4-hour Average (R4HA) soft capacity peak time report that customers can use to reduce CPU charges. Users can see all jobs that are consuming the most CPU during peak times, regardless of LPAR and according to Coordinated Universal Time (UTC) instead of current local time, resulting in more accurate usage measurements. Using SMF data collected throughout the month, Insight identifies the peak period and exactly what was executed during that time. Customers can then determine what workload to migrate to other times and which application components to tune using Strobe, resulting in lower licensing charges. Reports can also be generated to reduce CPU time regardless of when peaks occur.
Compuware
Strobe®
4
FACT SHEET
INTEGRATIONS WITH INDUSTRY-LEADING TOOLS
Mainframe workloads are growing significantly as mobile apps, Big Data analytics, IoT and other technologies place greater demands on mainframe-resident applications, data and transaction/compute processing power. Capabilities offered on the IBM z15—including Java-enabled specialty processors—are also likely to attract new workloads. This workload growth drives up Monthly License Charges (MLC) for IBM mainframe software.
A Jenkins plugin makes it easy for developers to take Strobe performance measurements automatically as part of a Jenkins CI/CD pipeline, as code is promoted towards production, ensuring accurate and repeatable performance testing. If a Jenkins plugin is not available, developers can leverage a Strobe REST API, which can be integrated into other DevOps CI/CD tools.
Strobe integrates with Compuware ThruPut Manager, which automates batch processing and helps reduce R4HA MLC. Developers can use a ThruPut Manager JCL card to quickly start a measurement on a batch jobstep. ThruPut Manager makes use of a Strobe API to easily add the request on behalf of the user.
To help customers further minimize MLC, Strobe is also tightly integrated with BMC Cost Analyzer for zEnterprise and BMC MainView. The integration between these solutions enables customers to quickly and easily identify tuning opportunities that will have the greatest impact on their monthly software licensing costs by applying BMC Cost Analyzer’s visual mapping to the detailed batch and transaction information provided by
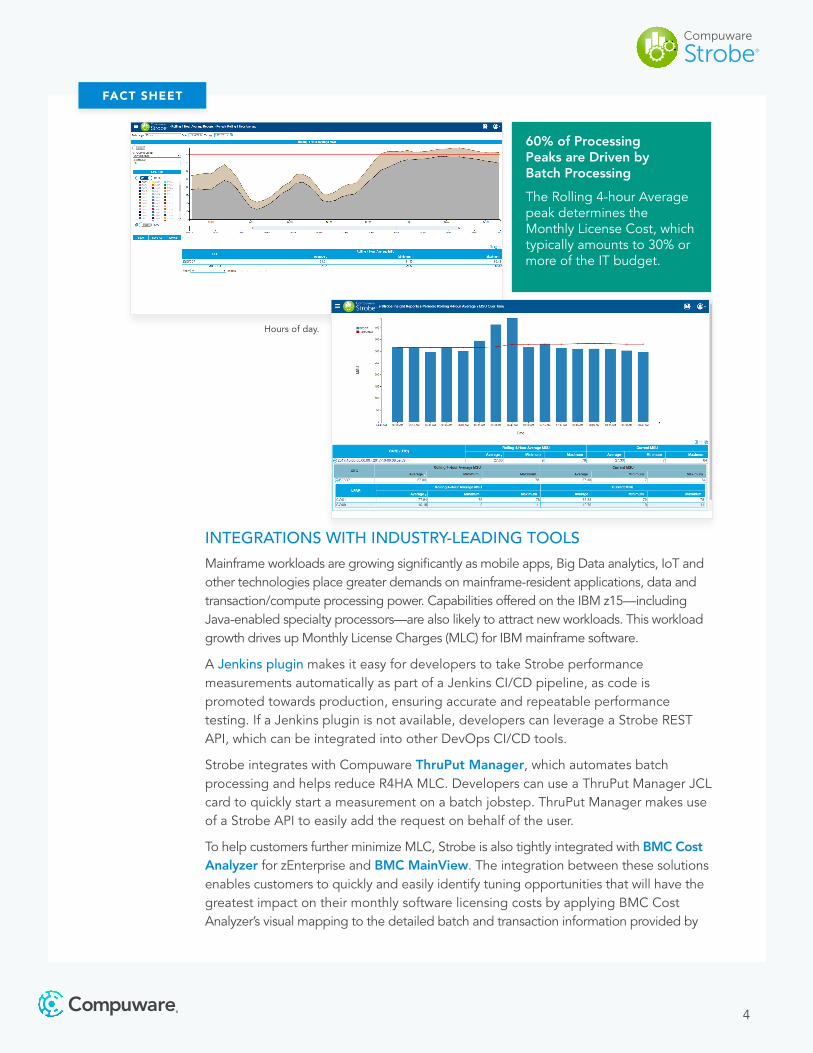
Peak R4HA period.
Hours of day.
60% of Processing Peaks are Driven by Batch Processing
The Rolling 4-hour Average peak determines the Monthly License Cost, which typically amounts to 30% or more of the IT budget.
Compuware
Strobe®
5
FACT SHEET
Strobe. The integration also makes cost management easier for mainframe operations staff by allowing them to invoke Strobe data collection directly from BMC MainView.
Strobe also integrates with ConicIT to help ops staff proactively resolve emerging mainframe issues before they impact application service levels. ConicIT baselines normal mainframe behavior across thousands of metrics and then applies advanced algorithms to recognize in real time when those metrics deviate from the baseline. Predictive alerts from ConicIT automatically launch a Strobe measurement to provide root-cause analysis to address the appropriate corresponding mainframe conditions.
Additionally, Strobe integrates with industry leading end-to-end APM tools AppDynamics and Dynatrace, both of which provide views of individual transactions as they flow from the end user’s device through the different layers of servers and back.
The AppDynamics integration enables users to capture SQL Analysis data for Db2 for z/OS SQL that was initiated off platform to resolve issues with applications that use Db2 for z/OS. AppDynamics captures the JDBC call to Db2 but does not see what happens in Db2. Strobe for Db2 allows the user to analyze data with iStrobe’s SQL Analysis feature and perform “what-if” analysis for improving it.
The Dynatrace integration provides the ability to capture high-level data on a business transaction as it flows from one CICS region to another in z/OS. Analysts who see a problem can request a Strobe measurement from the Dynatrace UI to provide root-cause analysis of why a CICS transaction may be using more CPU.
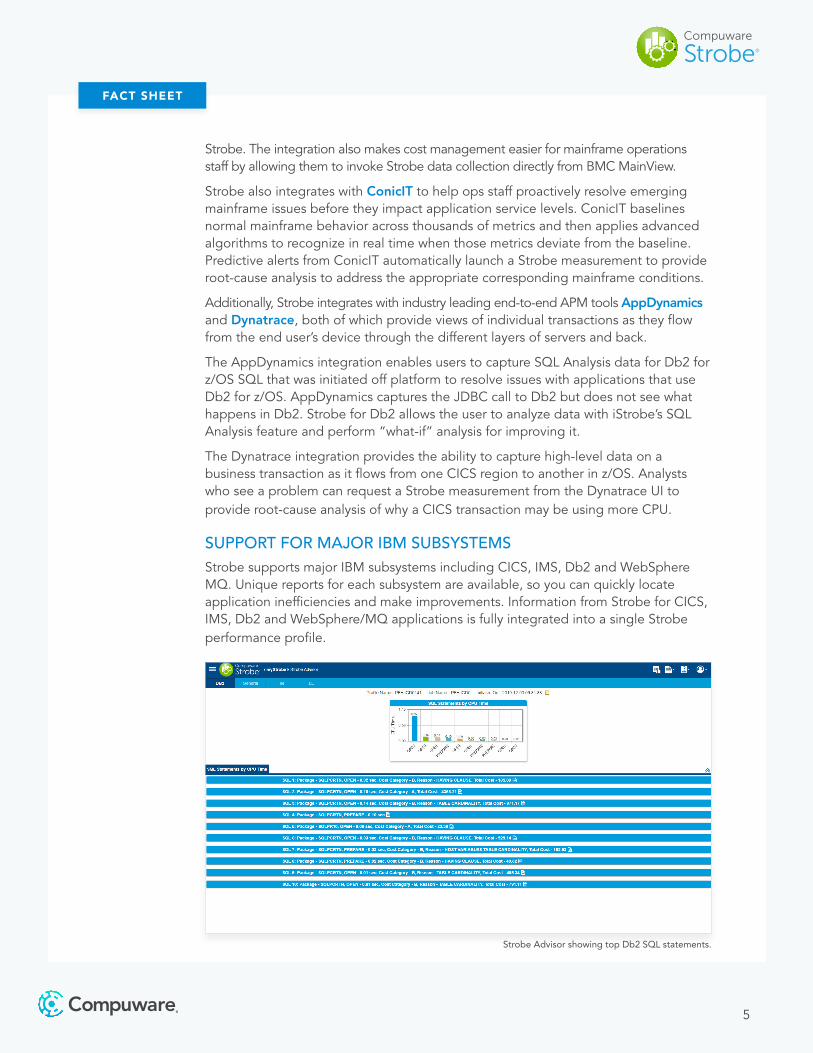
SUPPORT FOR MAJOR IBM SUBSYSTEMSStrobe supports major IBM subsystems including CICS, IMS, Db2 and WebSphere MQ. Unique reports for each subsystem are available, so you can quickly locate application inefficiencies and make improvements. Information from Strobe for CICS, IMS, Db2 and WebSphere/MQ applications is fully integrated into a single Strobe performance profile.
Strobe Advisor showing top Db2 SQL statements.
Compuware
Strobe®
6
FACT SHEET
DB2 SQL ANALYSIS FEATURE
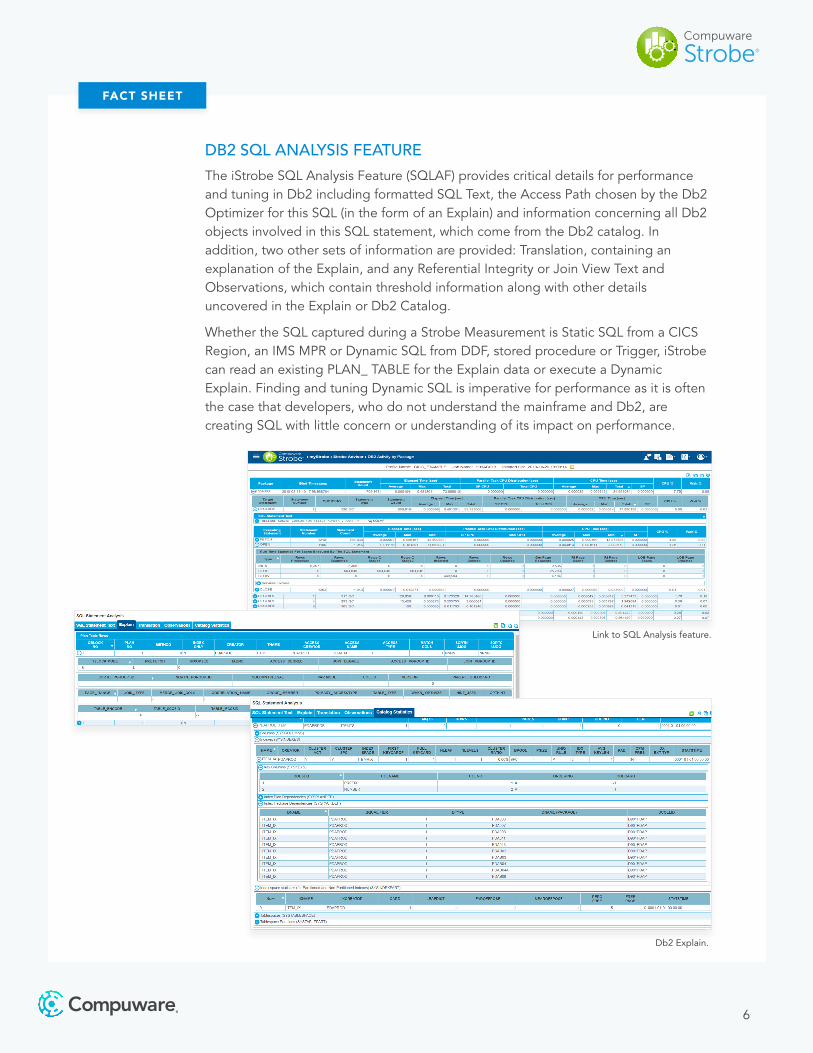
The iStrobe SQL Analysis Feature (SQLAF) provides critical details for performance and tuning in Db2 including formatted SQL Text, the Access Path chosen by the Db2 Optimizer for this SQL (in the form of an Explain) and information concerning all Db2 objects involved in this SQL statement, which come from the Db2 catalog. In addition, two other sets of information are provided: Translation, containing an explanation of the Explain, and any Referential Integrity or Join View Text and Observations, which contain threshold information along with other details uncovered in the Explain or Db2 Catalog.
Whether the SQL captured during a Strobe Measurement is Static SQL from a CICS Region, an IMS MPR or Dynamic SQL from DDF, stored procedure or Trigger, iStrobe can read an existing PLAN_ TABLE for the Explain data or execute a Dynamic Explain. Finding and tuning Dynamic SQL is imperative for performance as it is often the case that developers, who do not understand the mainframe and Db2, are creating SQL with little concern or understanding of its impact on performance.
Db2 Explain.
Link to SQL Analysis feature.
Compuware
Strobe®
The Mainframe Software Partner for the Next 50 Years
Compuware empowers the world’s largest companies to excel in the digital economy by taking full advantage of their mainframe investments. We do this by delivering innovative software that enables IT professionals with mainstream skills to develop, deliver and support mainframe applications with ease and agility. Our modernized solutions uniquely automate mainframe work, integrate into a cross-platform DevOps toolchain and measure software delivery quality, velocity and efficiency.
Learn more at compuware.com.
© 2020 Compuware Corporation. Compuware products and services listed within are trademarks or registered trademarks of Compuware Corporation. 7
FACT SHEET
IBM TAILORED FIT PRICING
If considering adopting IBM Tailored Fit Pricing, customers should optimize 12 months of history using Strobe to tune high-cost applications. Reducing MSU overhead will provide a better cost basis for Tailored Fit Pricing. Strobe should still be used to optimize high-cost applications, which could incur additional costs.
IMPLEMENT BEST PRACTICES
Learn how you can reduce MLC costs with an active performance management program that gives you more results for your efforts. Read The Grand Proposition: Mainframe MLC Savings Are All Around You white paper to learn how you can find more MLC savings, how to cut costs with the right tools and processes, and how your ops team and business will benefit.
• Improves user code efficiency, transaction response time and throughput.
• Enables new users to be more productive using a graphical interface.
• Focuses on performance earlier in the application development lifecycle.
• Minimizes MIPS/MSU growth as new mobile workloads and applications use more mainframe resources.
• Reduces complexity of mainframe applica-tion performance management.
• Defers CPU upgrades by reducing execu-
tion time and resource consumption.
• Integrates with industry-leading tools from BMC, ConicIT, AppDynamics, Dynatrace and Jenkins.
THE VALUE OF STROBE
Learn more at compuware.com/strobe.
03.20_31812_Strobe_fs
Compuware
Strobe®