Embed Size (px)
Citation preview

Review of dynamic pricing programs in the U.S. and Europe: Status quoand policy recommendations
Zheng Hu a, Jin-ho Kim b, Jianhui Wang c,n, John Byrne d
a School of Engineering and Applied Science, Harvard University, MA, USAb Department of Energy and Information Technology, Gachon University, South Koreac Decision and Information Sciences Division, Argonne National Laboratory, USAd Center for Energy and Environmental Policy, University of Delaware, DE, USA
a r t i c l e i n f o
Article history:Received 13 September 2013Received in revised form28 April 2014Accepted 21 October 2014Available online 10 November 2014
Keywords:Dynamic pricingDemand responseElectricity tariffs
a b s t r a c t
With the development of demand response (DR) technologies and increasing electricity demand,dynamic pricing has been a popular topic in many countries. This paper evaluates various dynamicpricing programs in the U.S. and Europe, and provides insights into various aspects including risks andrewards, enabling technologies, lower-income groups and customer types surrounding programs such asTime-of-Use (TOU), Critical Peak Pricing (CPP), Peak Time Rebates (PTR) and Real Time Pricing (RTP). Weconclude this paper with three main findings: (1) policy coordination in promoting dynamic pricingprograms between federal and state regulatory agencies is very critical; (2) customer engagement is veryimportant and can be enhanced via more accessible educational programs and policy adjustments; and(3) more investment in related R&D is required to construct a commonly accepted methodology formeasuring the effectiveness of dynamic pricing programs.
& 2014 Elsevier Ltd. All rights reserved.
Contents
1. Introduction . . . . . . . . . . . . . . . . . . . . . . . . . . . . . . . . . . . . . . . . . . . . . . . . . . . . . . . . . . . . . . . . . . . . . . . . . . . . . . . . . . . . . . . . . . . . . . . . . . . . . . . . 7432. Review of dynamic pricing programs in the U.S. and some European Countries . . . . . . . . . . . . . . . . . . . . . . . . . . . . . . . . . . . . . . . . . . . . . . . . . . 744
2.1. Status quo in the U.S. . . . . . . . . . . . . . . . . . . . . . . . . . . . . . . . . . . . . . . . . . . . . . . . . . . . . . . . . . . . . . . . . . . . . . . . . . . . . . . . . . . . . . . . . . . 7442.1.1. Statistical methods and focuses . . . . . . . . . . . . . . . . . . . . . . . . . . . . . . . . . . . . . . . . . . . . . . . . . . . . . . . . . . . . . . . . . . . . . . . . . . . 7452.1.2. Risks and rewards of various programs . . . . . . . . . . . . . . . . . . . . . . . . . . . . . . . . . . . . . . . . . . . . . . . . . . . . . . . . . . . . . . . . . . . . . 7452.1.3. Enabling technologies . . . . . . . . . . . . . . . . . . . . . . . . . . . . . . . . . . . . . . . . . . . . . . . . . . . . . . . . . . . . . . . . . . . . . . . . . . . . . . . . . . . 7452.1.4. Influence on low-income groups . . . . . . . . . . . . . . . . . . . . . . . . . . . . . . . . . . . . . . . . . . . . . . . . . . . . . . . . . . . . . . . . . . . . . . . . . . 7462.1.5. Temperature effects . . . . . . . . . . . . . . . . . . . . . . . . . . . . . . . . . . . . . . . . . . . . . . . . . . . . . . . . . . . . . . . . . . . . . . . . . . . . . . . . . . . . . 746
2.2. Status quo in Europe . . . . . . . . . . . . . . . . . . . . . . . . . . . . . . . . . . . . . . . . . . . . . . . . . . . . . . . . . . . . . . . . . . . . . . . . . . . . . . . . . . . . . . . . . . . 7462.3. Summary of findings . . . . . . . . . . . . . . . . . . . . . . . . . . . . . . . . . . . . . . . . . . . . . . . . . . . . . . . . . . . . . . . . . . . . . . . . . . . . . . . . . . . . . . . . . . . 747
2.3.1. Focuses of the U.S. and Europe . . . . . . . . . . . . . . . . . . . . . . . . . . . . . . . . . . . . . . . . . . . . . . . . . . . . . . . . . . . . . . . . . . . . . . . . . . . . 7472.3.2. Tariff mechanisms . . . . . . . . . . . . . . . . . . . . . . . . . . . . . . . . . . . . . . . . . . . . . . . . . . . . . . . . . . . . . . . . . . . . . . . . . . . . . . . . . . . . . . 7492.3.3. Enabling technologies and income groups . . . . . . . . . . . . . . . . . . . . . . . . . . . . . . . . . . . . . . . . . . . . . . . . . . . . . . . . . . . . . . . . . . . 749
3. Policy implications and conclusions . . . . . . . . . . . . . . . . . . . . . . . . . . . . . . . . . . . . . . . . . . . . . . . . . . . . . . . . . . . . . . . . . . . . . . . . . . . . . . . . . . . . . 750Acknowledgment . . . . . . . . . . . . . . . . . . . . . . . . . . . . . . . . . . . . . . . . . . . . . . . . . . . . . . . . . . . . . . . . . . . . . . . . . . . . . . . . . . . . . . . . . . . . . . . . . . . . . . . 751References . . . . . . . . . . . . . . . . . . . . . . . . . . . . . . . . . . . . . . . . . . . . . . . . . . . . . . . . . . . . . . . . . . . . . . . . . . . . . . . . . . . . . . . . . . . . . . . . . . . . . . . . . . . . . 751
1. Introduction
Increasing electrification in the modern society boosts thedemand of electricity, especially during peak hours [1]. Peakdemand that targeted by most of dynamic pricing programs
Contents lists available at ScienceDirect
journal homepage: www.elsevier.com/locate/rser
Renewable and Sustainable Energy Reviews
http://dx.doi.org/10.1016/j.rser.2014.10.0781364-0321/& 2014 Elsevier Ltd. All rights reserved.
n Corresponding author. Tel.: þ1 6302521474; fax: þ1 6302526073.E-mail address: [email protected] (J. Wang).
Renewable and Sustainable Energy Reviews 42 (2015) 743–751

usually refers to the top 100–200 h/year, which are approximately8–18% of annual peak loads, whereas the top 1% accounts for thegreatest portion [2], for instance, top 1% peak load can determine5–8% of the total installed capacity [3]. Based on this principle,dynamic pricing strategies are designed to reduce the peak load orshift part of the peak load to some other off-peak periods byproviding price signals to electricity customers. From the perspec-tive of system control, dynamic pricing can also link wholesale andretail electricity markets in the U.S. [4]. Reducing peak demand canbring down wholesale market prices in the near term while in thelong run, it can defer or replace new generation capacity [5].
Effective pricing is a powerful tool to economically adjustthe load curve [6–8]. Characteristics of dynamic pricing vary inthe U.S., Europe and Asian countries. In many parts of the U.S., thederegulation of the electric industry has enabled a market-drivendevelopment. Responses to dynamic pricing incentives in the U.S.have tended to be conservative with less than 23% customersenrolled, and most of them are commercial and industrial (C&I)customers [1,8–10]. In comparison, EU countries are generallyfocusing on massive installations of hardware devices. Somecountries (e.g. Italy) have experienced a progress from zero toalmost 100% roll-outs of smart meters in 5–8 years since 2003 [11].On the other hand, dynamic pricing in Europe is mainly focused onTOU tariffs.
Although dynamic pricing has also shown great potential inAsia, this paper only focuses on the U.S. and Europe because mostAsian countries just started their pilot smart metering research inrecent years with incomplete results available. As shown in Fig. 1,the top three Asian countries in terms of per million dollars GDPinvestments are China, Japan and Korea [12]. China initiatedresearch in smart meter pilots in 2009 while Korea started fromthe end of 2010 and Japan started in 2012. All these countries haveless than 3% smart meter penetration [13], except that the smartmeter penetration across the residential customers would bearound 10% by the end of 2013 in Korea. Related studies in Asia,especially in China, are currently concentrated on their industrialsectors, residential sectors are seldom attended to. Further evalua-tions of dynamic pricing programs in Asian countries can befollowed after the completion of their pilot programs.
It can be seen that most of the work done on dynamic pricingin many developed and developing countries have been focusedon pilot projects. The majority of the conducted studies wascompleted based on the various policy structures of their ownutility system characteristics where resources, focuses and resultsof each pilot study are technically related yet structurally differentfrom one region to another. The lack of a comprehensive review ofdynamic pricing programs across countries was recognized in anumber of academic papers [4,10,19], which created difficulties for
readers from other nations and states to study the experience andpotential of implementing dynamic pricing in a global context.
As a result, this paper evaluates various dynamic pricingprograms in the U.S. and Europe where such programs have alonger history and are more mature compared with the othercountries. We try to provide insights into various aspects ofdynamic pricing including risks and rewards, enabling technolo-gies, lower-income groups and customer types surrounding pro-grams such as TOU, CPP, PTR and RTP. This paper provides avaluable comparative analysis of dynamic pricing programs interms of their differences and similarities horizontally betweenthe U.S. and Europe. Such a paper can shed light on future dynamicpricing project implementation and offer instructions for improv-ing the existing programs.
The remainder of this paper is organized as follows. In Section 2,we conduct a detail literature survey and analyze selected programsin the U.S. and Europe individually. We conclude the discussion inSection 3 with the major findings and policy suggestions.
2. Review of dynamic pricing programs in the U.S. and someEuropean Countries
2.1. Status quo in the U.S.
In the U.S., the most popular forms of dynamic pricing are TOU,CPP, PTR, and RTP. We here follow the definition of the three majortariff mechanisms by [9] at the beginning of Section 2 and below:
� TOU: These daily energy or energy and demand rates aredifferentiated by peak and off-peak (and possibly shoulder)periods.
� CPP: CPP is an overlay on either TOU or flat pricing. CPP usesreal-time prices at times of extreme system peak. CPP isrestricted to a small number of hours per year, is much higherthan a normal peak price, and its timing is unknown ahead ofbeing called.
� RTP: RTP links hourly prices to hourly changes in the day-of(real-time) or day-ahead cost of power.
In comparison with the above three, PTR is less common andrefers to the payment that consumers can receive for reducingdemand during peak periods on event days. According to [14], TOUis the most effective tariff for customers to reduce power usagewhen the total consumption is low. Prices are usually set higherwhen power usage is high, and lower prices are applied for therest of the period. Seasonal prices are also applicable for TOUtariffs. CPP, on the other hand, is called upon by significantlyincreasing tariffs when the reliability of the power system isthreatened (e.g., during a very hot day). In order to reduce risks,utility companies are usually allowed to adjust CPP tariffs andnotify customers one day ahead of time. PTR tariffs are inversefrom CPP, where customers will be reimbursed for the amount ofreduced power consumption during the critical peak period(compared with the predicted amount) [14]. For RTP, enablingtechnologies (e.g., smart meters) are usually involved to supportthe accuracy of measurements. The reason RTP highly relies onenabling technologies is that it has to be closely connected withwholesale market prices, as well as with consumer feedbacks(two-way communication required).
Among the different forms of demand response, it has beengenerally agreed upon that the most sophisticated form is RTP, andthe simplest design is TOU since time periods and prices areusually fixed at least one year in advance [15]. Meanwhile, there isan increasing volume of research studying CPP, in which prices fortop 60 to 100 h are known ahead of time [2]. As RTP is not widelyFig. 1. Leading countries' focuses for investment in smart grid [12].
Z. Hu et al. / Renewable and Sustainable Energy Reviews 42 (2015) 743–751744

deployed, this paper will primarily concentrate on TOU, CPPand PTR.
In this following section, we will review case studies in severalstates, including California, Connecticut, Michigan, and Washing-ton D.C. The earliest pilot study in California was from 2003 to2005. The longest test by far was done by Baltimore Gas andElectric (BGE) from 2006 to 2008. Most of the case studies containmultiple research objectives and focuses including:
� Risks and rewards: risks and returns of different dynamicpricing programs
� Enabling technologies: effectiveness of using smart meters� Types of dynamic pricing programs: discussion of TOU, CPP
and PTR� Lower-income groups: response of lower-income groups� Customer types: C&I and residential customers� Temperature: influence of cold, mild and warm weather
conditions on price responsiveness
2.1.1. Statistical methods and focusesThe commonly used variables for statistical analysis with
dynamic pricing programs include temperature, levels of priceelasticity, consumer types, consumer income, and effectiveness ofdevices. Panel data analysis is often used to understand theeffectiveness of each indicator under different price mechanisms[16,19]. More specifically, constant elasticity of substitution isrecognized to be the most appropriate analytical method [16,19].The constant elasticity of substitution refers to two substitutablejoint equations of: (1) the model of peak to off-peak ratio (otherfactors can also be considered) and (2) the function of dailyelectricity consumption (expressed in logs) for constructing asystematic yet reliable prediction of electricity consumption underthe changing conditions and time periods [16]. Given the nature ofpanel data, researchers can label binary representatives to thecharacteristics of participating groups such as high/low incomegroup, hot/cold temperature, etc. Responsiveness of each pricemechanism is therefore reflected from each parameter. The con-venience of using constant elasticity of substitution is that theelectricity consumption can be modeled given various consumerbehavior changes. Furthermore, equations can be tested by usingthe ordinary least square (OLS) linear regression method whichaims to provide unbiased analytical results [16].
In [16], major factors including the impacts from cold, averageand hot weather, and electricity prices are tested for residents andC&I customers respectively. The study focusing on Connecticutinvestigates TOU, CPP and RTP prices for both residential and C&Icustomers based on low and mild temperatures [17]. According to[7], tests in Michigan contain variables of standard rates, CPP rates,peak-time rates, and price-information only rates (using thetraditional rate but providing customers the information of alter-native prices). In comparison, the research on Washington D.C.engaged regular (non-electric heat) and all-electric (electric heat)customers at the residential level, considering three types ofpricing strategies, i.e., hourly pricing (real-time pricing), criticalpricing and critical pricing with rebates, during summer andwinter periods [18].
2.1.2. Risks and rewards of various programsMany researchers argue for the existence of both risks and
rewards of dynamic pricing options. Although RTP contains thehighest rewards for participating customers, its embedded risksare also high due to the associated highest price uncertainty incomparison with traditional pricing tools. TOU, on the other hand,has the lowest risks as it is conceptually simplistic with low
rewards. CPP is an option with moderate risks as well as moderaterewards. Fig. 2 illustrates the curve of risks and rewards for threeincentives. According to [2], consumer preferences, represented bythe indifferences, would be maximized at the points of tangencyshown in the figure.
Furthermore, [18] compared the impact of CPP with and with-out rebates with hourly prices in Washington D.C., and summar-ized that all three types of incentives are stable and providesizable demand reductions. As to this point, the descending orderof load reduction from high to low is CPP, PTR, and the hourlyprices. The reason of the lowest response for hourly pricing,according to [18], is because day-ahead hourly wholesale pricesin the U.S. markets are mathematically correlated, which meanshourly prices in a certain time period are similar so that the users'incentives to shift demand are reduced.
2.1.3. Enabling technologiesThe official definition of smart meters in the U.S. is [9]:“Meters that measure and record usage data at hourly intervals
or more frequently, and provide usage data to both consumers andenergy companies at least once daily. Data are used for billing andother purposes. Advanced meters include basic hourly intervalmeters, meters with one-way communication, and real timemeters with built-in two-way communication capable of recordingand transmitting instantaneous data.”
There are a lot of discussions on the effectiveness of smartmeters and other types of enabling technologies. The principle of asmart meter is to provide an advanced measurement of powerusage when different rates are applied to various time periods.Some research proposes that lack of smart meters for residentialcustomers creates a technical barrier to the deployment ofdynamic pricing programs.
The study on California tested CPP and TOU, found thatcustomers are price-responsive and prices are positively correlatedwith enabling technologies [16]. The study in [19] made up themissing tests for RTP in California. Findings are similar butsupplementary to [16] including: (1) customers are price-respon-sive; (2) CPP and PTR rates have similar responses, and (3) enablingtechnologies can improve consumer responses. The ConnecticutLight and Power (CLP) experiment had similar findings that priceresponsiveness is positive and enabling technologies can improveresponses, whereas CPP customers without rebates are moreprice-responsive than PTR (peak time rebate) customers, andTOU customers have the least price responsiveness [19]. Theirstudy shows that CPP rates are of substantially higher price-responsiveness than PTR rates, which is supported by a later testdone by Pepco Holdings in Washington D.C. [18].
However, field studies in [19] as well as [16] point out thecomparison of with and without smart meters does not show
Fig. 2. Pricing choice frontier represented as indifference curves [9].
Z. Hu et al. / Renewable and Sustainable Energy Reviews 42 (2015) 743–751 745

significant differences as to customer choices. Also regarding priceresponsiveness, customers in Michigan showed the same respon-siveness to the equivalent designed PTR and CPP without rebatesduring the testing period. For a given elasticity of substitution,1 theconsumers' response tends to increase with a higher peak to off-peak ratio, but at a decreasing rate. The peak to off-peak price ratioexplains a large portion of the variations in demand response,whilst the remaining can be explained by other factors likeweather, consumer attitudes, etc. Meanwhile, it is illustrated themagnitude of customer response varies with the price incentive,with and without enabling technologies [19]. Their study shows apositive correlation between incentives and responses whenenabling technologies are not applied.
Furthermore, it should be of note that a study [16] points outthat manual responses and automatic adjustments are not directlycomparable because each sample may consist of different custo-mer types according to the nature of their consumption. It isreasonable that higher income groups and higher power con-sumption groups are more likely to rely on technology to managetheir energy consumptions, whereas low-income and low-consumption groups may find it unnecessary to install additionaldevices for such purposes. According to the study, the manualresponse group is representative of the overall statewide popula-tion in California, but the automatic adjustment group onlyconsists of high-consumption residential homes with central air-conditioning in some particular climate zones in San Diego.
2.1.4. Influence on low-income groupsAnother topic that receives great public attention is the
influence of dynamic pricing on low-income groups. Accordingto the study on Michigan [19], substitution elasticities for low-income groups are not significantly different from other targetgroups. Impacts from other factors, such as enabling technologies,as well as CPP or PTR treatments are also not distinguishableamong all income groups. Study of Connecticut [19] shows thatalthough there is no available data about income diversity, it isconfident to state that elasticities of substitution for low-incomecustomers are actually the same as those for the average custo-mers with known income data if we ignore the fact that only 552out of 1251 customers responded to the survey.
It is believed that there is a minimum influence of dynamicpricing programs on lower-income population [2]. They referred toa broader application of price responsiveness in other fields suchas sports game ticket sales and showed consumers can savemoney through altering their behavior between higher-pricepeak-demand periods and other times. It is argued that mostcustomers prefer this way of pricing, which can actually benefitlower-income population. They further pointed out that HydroOneTOU survey shows 72% of customers wanted to remain on dynamicpricing rates while only 4% found the changes in their dailyactivities to be inconvenient.
2.1.5. Temperature effectsThe relationship between temperature changes and price
responsiveness based on manual responses and automatic adjust-ments is investigated in [2]. A 15-month experimental tariffbetween 2003 and 2004 gave participants in California a dis-counted two-level TOU rate, which increases the peak-periodprices (2 p.m. to 7 p.m.) by about three times. Their findings showthat the average demand reduction in critical periods in the
manual response group is �0.23 kW per home (�13%) in hotweather (95–104.9 1F), �0.03 kW per home (�4%) in mildweather (60–94.9 1F), and -0.07 kW per home (�9%) during coldweather (50–59.9 1F). For utility-controlled customer groups, hotweather performance is also stronger than that of cold weather.Between 90 1F and 94.9 1F, the response approached �0.56 kWper home (�25%) for hot weather.
The survey in [4] also concentrates on price responsiveness totemperatures. It is argued that the influence of seasons wouldcause a great impact to the shape of load curves [11]. Power loadcurves in winters are less significant than those in summers; morethan one peak load could be seen in experimental periods withlower temperatures. Statistical evidence shows that mild weatherprovides slightly lower price responsiveness compared with thatof warmer climate. It partly matches the results from [4]. However,as shown in Fig. 3 below, a more detailed description drawn from[4] shows that mild and cold temperatures have less influence onprice responsiveness, whereas hot weather can significantlychange the consumer behaviors.
In another test, [4] also separately analyzed summer and winterimpacts on different price mechanisms. For both regular customers(non-electric heat) and all electric heat customers, load reductionfor summer periods is significant, while winter periods have lessprecise estimation. Research also suggested that all electric heatusers have greater potential of load reduction (maximum 12.6%),compared with regular users' 8.9%. CPP in both summer and wintershows larger reduction than hourly prices [19].
2.2. Status quo in Europe
In comparison with the in-depth analyses of dynamic pricingmechanisms in the U.S., Europe has a strong focus on large-scaleroll-outs of smart meter devices. The definition of smart meters inEurope seems to be broader than that in the U.S. In some Europeancountries, the key purpose of installing smart meters is to replacemanual meter reading in order to reduce costs [7]. The function ofproviding real-time data has been minimal in most Europeancountries. As stated by [8] and also illustrated by [9], the EUstandard defines the term ‘smart meter’ by two components: it hasto be more advanced than a conventional meter (mandatory) andto communicate billing information between utility companiesand end users (optional). The European definition of smart griddetermines the function and availability of smart meters. There-fore, smart meter technologies in Europe are expected to be lessexpensive and easier to be massively applied in comparison withthe case in the U.S.
Studies clarified that most of the EU countries are using smartmeters as substitutions of manual meter reading, not commonly
Fig. 3. Average customer response as a function of temperature (in kWh/hour; [4]).
1 The elasticity of substitution was defined as “a measure of the ease withwhich the varying factor can be substituted for others”[20]. The elasticity ofsubstitution in the context of demand response refers to the relative changes inelectricity consumption between peak and off-peak periods caused by a relativeprice change.
Z. Hu et al. / Renewable and Sustainable Energy Reviews 42 (2015) 743–751746
for sending price signals [18,21]. Distribution System Operators(DSOs) in most European countries did not show much enthu-siasm to shorten data reading periods by using advanced meteringinfrastructure (AMI). At the moment, electricity consumption dataare still collected on a monthly basis in most countries, and evenwith AMI technologies in place dynamic pricing mechanisms arestill limited to end customers. Accordingly, [18] argued that policy-makers in Europe have long been focusing on massive applicationsand engaging utility suppliers and end customers in tariff alter-natives is often ignored.
As a typical case in Europe, smart meters in Sweden are simplyseen as a replacement of labor, with current electric data still beingrecorded on a monthly basis. From the perspective of SwedishCoordination Council for Smart Grid, [24] stated an importantreason for replacing traditional meters with smart meters was dueto the high labor cost. He also pointed out that 99% of thetraditional meters in Sweden were replaced by smart meters in2009 and the next step is to enable hourly data delivering withlimited focus on dynamic pricing.
The largest and most statistically robust trial conducted inEurope was by the Ireland Commission for Energy Regulation from2008 to 2011 [25]. In order to test TOU mechanisms, customerswere divided into four major groups: residents, small and mediumenterprises (SMEs), prepayment customers, and multi-site custo-mers.2 Responses are separately analyzed for each group ofcustomers. For residential customers, average response rate was30%. Tariff rates were divided into four weekday rates and oneweekend rate. Accordingly, a significant finding is that the overallelectricity usage was reduced by 2.5% and the peak usage wasreduced by 8.8%. Customers with higher education achievedhigher reductions, and low-income groups also received benefitsfrom TOU. For SME customers, rates were designed in threecategories: day time, night time and peak time. Results for SMEsshowed that reduction of overall electricity usage was 0.3% andreduction for peak usage was 2.2%. In their test, 72% of the SMEcustomers did not reduce peak loads and 61% did not reduce theiroverall load at all. A major reason of this insignificance is thatbusiness operations cannot find an alternative time slot to shiftthe loads.
Another case study is Netherlands, which focuses on impacts ofresidential TOU rates with specific emphasis on time durations.A 15-month study on domestic energy monitors, referred to asHome Energy Management Systems is conducted [23]. Theirresults find that customer behaviors can be influenced for a shortperiod. However, significance of longer-term utilization dependson customer groups. It is shown that with the installation of HomeEnergy Management Systems, there was an initial saving of 7.8% inelectricity consumption for the participants in the first fourmonths. However, with an increasing testing period, savings onelectricity consumption cannot be sustained since a significantnumber of participants tend to revert to the traditional patterns ofelectricity consumption. On the other hand, a certain group ofpeople (characteristics unidentified in the article) can keep goodpractice of energy conservation after understanding the data fromenergy monitors. Therefore, [26] suggested energy monitoringsystems should not be massively applied to the public at thisstage and further designs should consider the fact that users'responses to a certain type of intervention could be different.Furthermore, they argued that a lot of participants added newelectric devices such as air conditioners and dish washers intotheir houses during the 15-month period, which could be a factor
that significantly influenced their total electricity consumptions.They pointed out that once new energy-efficient devices replaceold devices, participants tend to use these new devices more oftenand the overall power consumption shows a ‘rebound effect’,which means the shifted demand peaks in another period.
The potential and limitations of global residential dynamicpricing programs is also explored [14]. 100 pilot studies (450,000families were involved in total) were used to examine the use ofmainly TOU and CPP (with and without rebates). The results onRTP were not summarized in their report due to lack of sufficientdata. From the global perspective, it is evident that TOU tariffsindeed have the lowest response in comparison with CPP. How-ever, TOU is a daily response while CPP only shows its significanceduring peak loads. On the other hand, consumers positively reactto dynamic pricing mechanisms in the long run (e.g., over 2–3years) and they can also be effective for consumer groups of over1000 households. During these pilot studies, enabling technologieshave been confirmed for having positive influence on energyefficiency. Regarding the debates that challenge the contributionof smart meters, they argued that the key difference they foundbetween the success and failure of a pilot project is whether theprogram designers are able to meet consumer needs throughenergy efficiency programs. Technology should be seen as anenabler of the value chain of meeting customers' needs. It istherefore important to design a suitable pricing strategy instead ofutilizing templates on a foreign case.
2.3. Summary of findings
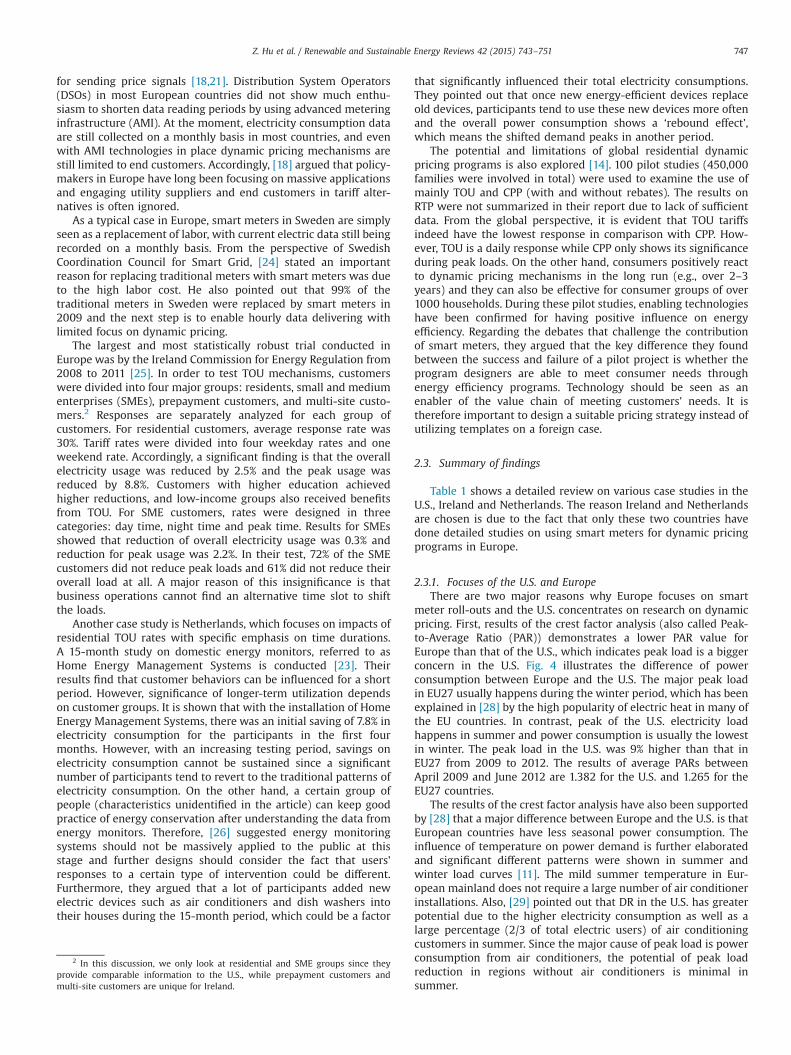
Table 1 shows a detailed review on various case studies in theU.S., Ireland and Netherlands. The reason Ireland and Netherlandsare chosen is due to the fact that only these two countries havedone detailed studies on using smart meters for dynamic pricingprograms in Europe.
2.3.1. Focuses of the U.S. and EuropeThere are two major reasons why Europe focuses on smart
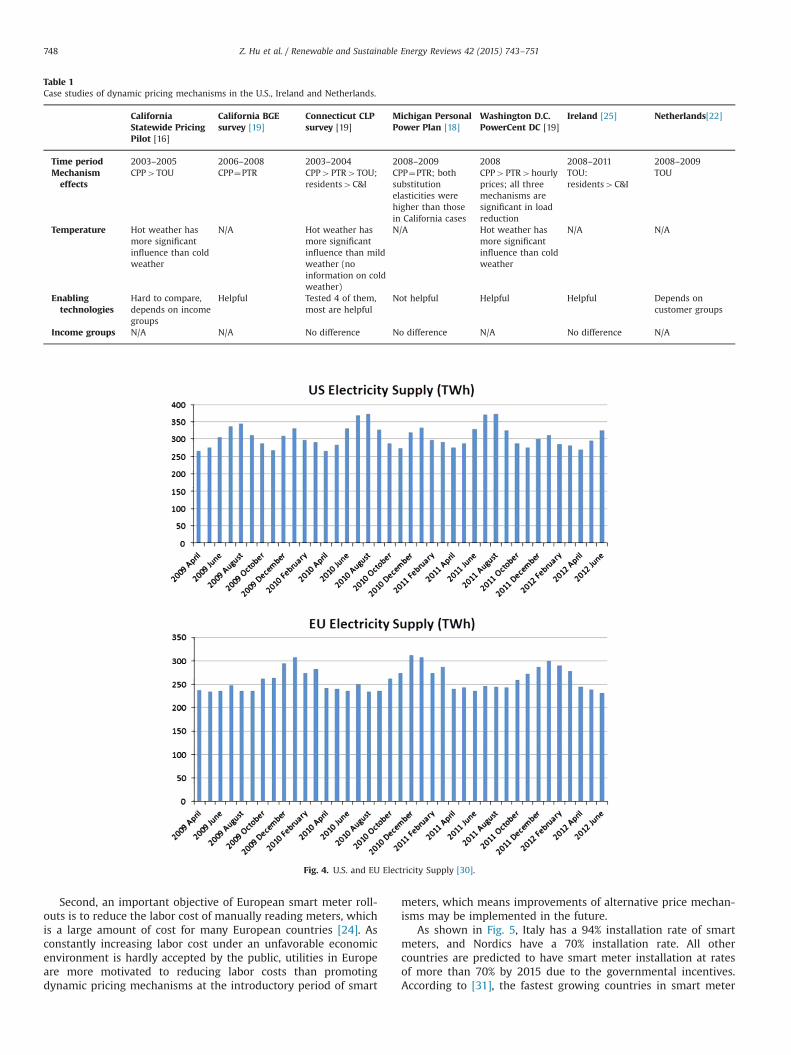
meter roll-outs and the U.S. concentrates on research on dynamicpricing. First, results of the crest factor analysis (also called Peak-to-Average Ratio (PAR)) demonstrates a lower PAR value forEurope than that of the U.S., which indicates peak load is a biggerconcern in the U.S. Fig. 4 illustrates the difference of powerconsumption between Europe and the U.S. The major peak loadin EU27 usually happens during the winter period, which has beenexplained in [28] by the high popularity of electric heat in many ofthe EU countries. In contrast, peak of the U.S. electricity loadhappens in summer and power consumption is usually the lowestin winter. The peak load in the U.S. was 9% higher than that inEU27 from 2009 to 2012. The results of average PARs betweenApril 2009 and June 2012 are 1.382 for the U.S. and 1.265 for theEU27 countries.
The results of the crest factor analysis have also been supportedby [28] that a major difference between Europe and the U.S. is thatEuropean countries have less seasonal power consumption. Theinfluence of temperature on power demand is further elaboratedand significant different patterns were shown in summer andwinter load curves [11]. The mild summer temperature in Eur-opean mainland does not require a large number of air conditionerinstallations. Also, [29] pointed out that DR in the U.S. has greaterpotential due to the higher electricity consumption as well as alarge percentage (2/3 of total electric users) of air conditioningcustomers in summer. Since the major cause of peak load is powerconsumption from air conditioners, the potential of peak loadreduction in regions without air conditioners is minimal insummer.
2 In this discussion, we only look at residential and SME groups since theyprovide comparable information to the U.S., while prepayment customers andmulti-site customers are unique for Ireland.
Z. Hu et al. / Renewable and Sustainable Energy Reviews 42 (2015) 743–751 747
Second, an important objective of European smart meter roll-outs is to reduce the labor cost of manually reading meters, whichis a large amount of cost for many European countries [24]. Asconstantly increasing labor cost under an unfavorable economicenvironment is hardly accepted by the public, utilities in Europeare more motivated to reducing labor costs than promotingdynamic pricing mechanisms at the introductory period of smart
meters, which means improvements of alternative price mechan-isms may be implemented in the future.
As shown in Fig. 5, Italy has a 94% installation rate of smartmeters, and Nordics have a 70% installation rate. All othercountries are predicted to have smart meter installation at ratesof more than 70% by 2015 due to the governmental incentives.According to [31], the fastest growing countries in smart meter
Table 1Case studies of dynamic pricing mechanisms in the U.S., Ireland and Netherlands.
CaliforniaStatewide PricingPilot [16]
California BGEsurvey [19]
Connecticut CLPsurvey [19]
Michigan PersonalPower Plan [18]
Washington D.C.PowerCent DC [19]
Ireland [25] Netherlands[22]
Time period 2003–2005 2006–2008 2003–2004 2008–2009 2008 2008–2011 2008–2009Mechanismeffects
CPP4TOU CPP¼PTR CPP4PTR4TOU;residents4C&I
CPP¼PTR; bothsubstitutionelasticities werehigher than thosein California cases
CPP4PTR4hourlyprices; all threemechanisms aresignificant in loadreduction
TOU:residents4C&I
TOU
Temperature Hot weather hasmore significantinfluence than coldweather
N/A Hot weather hasmore significantinfluence than mildweather (noinformation on coldweather)
N/A Hot weather hasmore significantinfluence than coldweather
N/A N/A
Enablingtechnologies
Hard to compare,depends on incomegroups
Helpful Tested 4 of them,most are helpful
Not helpful Helpful Helpful Depends oncustomer groups
Income groups N/A N/A No difference No difference N/A No difference N/A
Fig. 4. U.S. and EU Electricity Supply [30].
Z. Hu et al. / Renewable and Sustainable Energy Reviews 42 (2015) 743–751748

installations are expected to be U.K. and France, increasing fromaround 4% in 2011 to 50–60% in 2015.
2.3.2. Tariff mechanismsThe overall focus of tariff mechanisms discussed is on the three
price mechanisms: TOU, CPP and RTP. It is clear that TOU and CPPhave received greater attention than that of RTP. Lack of researchin RTP reveals RTP is still at the conceptual design stage withoutbroad customer acceptance (especially among industrial custo-mers); it also shows a global trend that TOU and CPP are morepopular than RTP to customers. Another reason for limited RTPprograms may be that, as pointed by [2], RTP has the highestrewards and the highest risks. Although dynamic pricing has beenlaunched for 10 years, it is reasonable that consumers respondconservatively during the introductory period. From the globalperspective, most of the European countries are still relying onTOU as the only program of smart meter roll-outs. In the U.S.,despite of a low smart meter penetration rate of 23%, in-depthstudies on TOU, CPP and PTR have been done.
Pilot studies in the U.S. have illustrated that TOU receivesminimal interest from C&I costumers. Several surveys show thatpower consumption does not change at all after implementation ofTOU prices [15]. However, [14] argued that TOU is the mosteffective tariff for customers whose overall consumption is low.Because the power consumption of the European countries issubstantially lower than that in the U.S., Europe is currentlymainly utilizing TOU tariffs to levelize the cost of smart meterinstallations.
It is argued that price incentives for C&I customers in generalhave lower responsiveness than those for residential customers,regardless of installation of enabling technologies [32]. Practically,[27] analyzed TOU pricing and its influences on C&I customers fora 12-month period. Their results show an insignificant impact ofTOU on C&I customers. The effect of TOU on large utility bills andbill volatility could have been overstated. For example, the pilotproject in Connecticut shows only a small number of firms wereadversely affected by TOU pricing [27]. Actually the reduction inelectric bills was due to a discount implicitly included in the prices,instead of behavioral response. Despite that TOU is the mostcommonly implemented pricing strategy; it induces very limited
changes in load curves for industrial customers. This finding closelymatches the results from Connecticut Light and Power [19].It isurgent and important for Europe to find alternative price mechan-isms other than TOU. Although some regions provide availablerebate programs via policy supports for CPP, we find out that theeffects of these rebates are very limited. As shown in the studies onCalifornia and Michigan [19], customers' responses are very similarfor CPP with and without rebates. The PowerCent DC and theConnecticut cases actually show a stronger effect of CPP withoutrebates, which indicates that CPP with rebates has a negativecorrelation with load reduction in those two cases. Although theconsumption behaviors are different between the U.S. and Europe,the pilot projects in the U.S. can serve as references for Europeandynamic pricing program implementation.
2.3.3. Enabling technologies and income groupsThe impact of enabling technologies has been tested by both
the U.S. and European scholars. At this point, only the case study inMichigan shows that it is ‘not helpful’. However, all other casescome to an agreement that having enabling technologies isnecessary but not sufficient for reducing power consumption.According to [4], other factors, such as the consumption patternof high-income groups and low-income groups, have to be takeninto account. It is reasonable that higher-income groups havehigher power consumption, thus customers in those groups aremore likely to rely on smart devices for utility management.In comparison, potential reduction for lower-income groups iscomparably less. The benefit for installing additional devices maybe limited for them. The study in [26] supports [4] by claiming thatdifferent customers have various power consumption patterns.It is difficult to draw a uniform conclusion on whether enablingtechnologies are helpful or not. Lastly, when it comes to evaluatingthe acceptance and influence of enabling technologies on differentincome groups, almost all case studies agree that there is nodifference between higher or lower-income groups. In Europe,researchers in Ireland and Netherlands have also studied theimpact of income and enabling technologies on dynamic pricing.The study on Ireland [25] pointed out the need to integrate theanalysis of income groups with enabling technologies. The con-clusion of the study on Netherlands [15] critically claims that
Fig. 5. The European smart meter market [31].
Z. Hu et al. / Renewable and Sustainable Energy Reviews 42 (2015) 743–751 749

enabling technologies should be designed for each consumer typerather than using a “one-size-fit-all” solution.
The types of consumers partially explain why TOU tariffsmerely work for residential consumers [27]. C&I electricity con-sumption is directly connected with their business activities, whileresidential consumers purchase electricity for self-consumption.For the residential consumers, temperature, enabling technologiesand income groups are dominant factors. The three pilot studies in[16,18,19] have pointed out the significant influence of weather onpower consumption. Price responsiveness to hot weather isstronger than that of mild and cold weather [4,19]. Comparingthe three temperature studies, [4] conducted the most compre-hensive research by categorizing five-degree temperature bins.Results were individually analyzed for effects of different enablingtechnologies as well as income levels. Their work separatedelectric appliances controlled by manual and utility-controlleddevices. [18] investigated the impact of weather based on the levelof electrification. The study of regular and all-electric customerscan provide references for many European countries with highannual electricity rates associated with weather effects. [27] and[25] share the viewpoint that residential customers are moreresponsive to prices than C&I customers in both the U.S. andEurope. However, separate studies for C&I customers are stillneeded.
3. Policy implications and conclusions
Based on the above discussions, we conclude the paper withthe following findings:
1. Limited role of smart meters. While smart meters can signifi-cantly reduce the labor cost for meter reading in Europe, theirrole in communicating with the end consumers in dynamicpricing programs is limited. Studies have shown that installa-tion of smart meters is not necessarily helpful for dynamicpricing. TOU and CPP can be implemented without smartmeters as the prices embedded in those programs are pre-defined and only updated infrequently. In comparison, RTPpricing may require a large-scale installation of smart meters toconstantly communicate the price and control signals betweenthe consumers and utilities. But there is no yet significantlysuccessful case study of such a RTP program.
2. Lack of customer engagement. DR in the U.S. has been devel-oped for more than 10 years. However, according to [19], thereare only approximately 23% of customers enrolled in DRprojects where they are available. Agreed by [1], lack ofcustomer support is a major barrier for promoting DR. Pricedisconnection and utility disincentive are the two majorreasons that lead to low customer response.● First, only 25 states in the U.S. are part of a regional
electricity market, while the utilities in the rest 25 statesare still mostly vertically integrated. The retail prices formost customers are fixed while wholesale prices fluctuatewidely in electricity markets. To address this price discon-nection, [9] suggested a more efficient method, which is toplace a small percentage of customers on wholesale elec-tricity prices that are based on marginal production costs.This price linkage will incentivize consumers to adjust theirelectricity consumption in response to the variation of thewholesale electricity prices.
● Second, utility companies lack incentives to promote DRprojects without regulatory subsidies. In most cases, theimplementation of DR leads to a reduction of utilities'revenues as the electricity consumption decreases. Regulatory
actions and incentives are important to spur the effectivenessof DR programs.
● Third, the 2009 American Recovery and Reinvestment Act'sSmart Grid Investment Grant (SGIG) program has investi-gated the low representativeness of many current customerbehavior programs[33]. The main barrier is that utilities andcustomers have different perspectives of approaching anappropriate DR tariff mechanism. Many customers initiallyconsidered environment as the primary reason for DRimplementations; however, the key actual concern forcustomers was price [34].
3. Lack of consistent tools in evaluation, measurement andverification of demand reductions. As [9] stated, ‘Currentplanning and forecasting tools are not sufficiently robust tomodel adequately the capability of DR to serve as an alternativeto building new generation and transmission and to act as aresource to alleviate transmission congestion’. Lack of uniformstandards and methodologies to analyze the cost-effectivenessof DR projects creates barriers to quantifying associated returnon investment (ROI). Meanwhile, [33] also pointed out thedifficulty of finding a convincing method to evaluate how manycustomers want to be involved in DR programs. Construction ofa commonly recognized model can largely motivate the invest-ment and implementation of DR projects. More research shouldbe done to build a standardized accurate and reliable datacollection system for DR resources to more precisely evaluatetheir contribution to reliability and their cost-effectiveness.
4. Discordant federal-state policy regulations. DR projects areprimarily regulated at the state level in deregulated states,while commission jurisdiction plays a key role in regulatedstates. According to[34], regulatory policies on dynamic pricingand state statutes in several states could create policy barriersto exploring the potential of DR, such as rules on engagingcustomers in time-based rates, especially CPP. On the otherhand, [9] mentioned that some wholesale and retail marketdesigns are not favorable to participation in DR, e.g., thestandard lengthy wholesale settlement periods utilized inISO/RTO markets could delay payment to participating retailcustomers.
Based on the above issues, we propose the following policyrecommendations:
1. There should be more investment in R&D on DR. The U.S.urgently needs a sophisticated yet commonly applied evalua-tion model for DR [9]. An immediate action would be toincrease investment in relevant R&D to develop universallyrecognized methodologies that provide fair evaluation, mea-surement and verification.
2. Customer engagement should not totally rely on enablingtechnologies. Instead, promotion of DR projects should beenhanced through public education and price adjustments.More research should be done to analyze customer behaviors.Innovative pricing mechanisms such as linking retail priceswith wholesale market prices can be implemented on certainpilot projects.
3. The coordination between federal and state level policiesshould be enhanced. Increased coherence between federalregulation, state policies, and third-party implementationscan enhance policy effectiveness and reduce barriers to projectimplementations [34]. It is important for each regulatory levelto consider the current policy context and the policy's implica-tions on all involved entities and stakeholders. Policy integra-tion could largely reduce associated risks of executing DRprojects and increase the confidence of investors, as well as
Z. Hu et al. / Renewable and Sustainable Energy Reviews 42 (2015) 743–751750

promote collaboration between policy makers and third-partyenterprises.
By discussing case studies in the U.S. and Europe, this paperreviews the major issues related to the implementation of DRprograms in those regions. A variety of associated aspects includ-ing risks and awards, enabling technologies, dynamic pricingprograms, temperatures, income groups, and customer types areinvestigated and compared between pilot studies in the U.S. andEurope. However, there are also some other key topics that needfurther investigation. For example, the implementation of RTPcould be very complicated and could potentially change thebehavior of customers based on the real-time market signals.Hence, we strongly encourage further research to investigate RTPwhen completed case studies and related data become moreavailable.
Meanwhile, DR projects in many Asian countries have juststarted. For example, China has initiated a few municipal level casestudies on industrial customers, whereas residential pilot studiesare not yet applied to real end users. Instead, the State Grid ChinaCorporation uses demonstration showrooms to illustrate similarresidential consumer behavior patterns [35]. Several Korean andJapanese utility companies are also actively engaged in DRresearch [13]. Available conclusions are not yet available at thistime. However, efforts in trying to develop feasible policy andtechnical frameworks to better adopt DR in their own systemshave been on-going. Investigations in these Asian countries willlargely contribute to the global picture of how DR is beingimplemented in different electricity markets.
Acknowledgment
This work is sponsored by KETEP (2001T100100424).
References
[1] Luthra S, Kumar S, Kharb R, Ansari M, Shimmi S. Adoption of smart gridtechnologies: an analysis of interactions among barriers. Renew. Sustain.Energy Rev. 2014;33:554–65.
[2] Faruqui A, Palmer J. Dynamic pricing and its discontents: empirical data shoedynamic pricing of electricity would benefit consumers, including the poor,The Brattle Group Report, CA; 2012.
[3] Faruqui A, Harris D, Hledik R. Unlock the 53 billion Euros savings from smartmeters in the EU: How increasing the adoption of dynamic tariffs could makeor break the EU's smart grid investment. Energy Policy 2010;38(10):6222–31.
[4] Herter K, McAuliffe P, Rosenfeld A. Observed temperature effects on hourlyresidential electric load reduction in response to an experimental critical peakpricing tariff, energy and resources group, University of California at Berkeley,CA; 2006.
[5] Strengers Y. Peak electricity demand and social practice theories: reframingthe role of change agents in the energy sector. Energy Policy 2012;44(6):226–34.
[6] Choi D, Thomas V. An electricity planning model incorporating DR. EnergyPolicy 2012;42(4):429–41.
[7] Darby S, Mckenna E. Social implications of residential DR in cool temperateclimates. Energy Policy 2012;49(10):759–69.
[8] Siano P. Demand response and smart grids: a survey. Renew Sustain EnergyRev 2014;30:490–503.
[9] Federal Energy Regulatory Commission (FERC), Assessment of DemandResponse & Advanced Metering, FERC Staff Report (Docket Number: AD-06-2-000) 2012. Available from: ⟨http://www.ferc.gov/legal/staff-reports/12-20-12-demand-response.pdf⟩.
[10] Muratori M, Schuelke-Leech B, Rizzoni G. Role of residential demand responsein modern electricity markets. Renew Sustain Energy Rev 2014;33:546–53.
[11] Soares A, Gomes A, Antunes C. Categorization of residential electricityconsumption as a basis for the assessment of the impacts of demand responseactions. Renew Sustain Energy Rev 2013;30:461–78.
[12] Lowe M, Fan H, Gereffi GUS. Smart grid: finding new ways to cut carbon andcreate jobs, center on globalization, governance & competitiveness, DukeUniversity; 2011.
[13] Yu X, Zhang Y, Yin M. Smart Meters in Korea. State Gird J 2011;11.[14] Stromback J, Dromaque C, Yassin M. The potential of smart meter enabled
programs to increase energy and systems efficiency: a mass pilot comparison,Vaasaett. European Smart Grid Industry Group; 2011.
[15] Gyamfi S, Krumdieck S, Urmee T. Residential peak electricity demand responseHighlights of some behavior issues. Renew Sustain Energy Rev 2013;25:71–7.
[16] Charles River Associates, Impact evaluation of the California statewide pricingpilot, Oakland, CA; 2005.
[17] Faruqui A, Sergici S, Akaba L. Dynamic Pricing of electricity for residentialcustomers: the evidence from Michigan. CA: The Brattle Group Report; 2012.
[18] Wolak A. Do residential customers respond to hourly prices: evidence from adynamic pricing experiment, american economic review: Papers and Proceed-ings 2011; 101(3): p. 83–7.
[19] Faruqui A, Sergici S, Akaba L. Dynamic pricing in a moderate climate: newevidence from Connecticut. The Brattle Group, MA; 2012.
[20] Hicks J. Elasticity of substitutions again: substitutions and compliments. CO:University of Colorado Press; 1932.
[21] Warren P. A review of demand-side management policy in the UK. RenewSustain Energy Rev 2014;33:554–65.
[22] Renner S, Albu M, Elburg H. European smart metering landscape report, smartregions deliverable 2.1. Vienna, Intelligence Energy Europe; 2011.
[23] Soares A, Gomes A, Antunes C. Categorization of residential electricityconsumption as a basis for the assessment of the impacts of demand responseactions. Renew Sustain Energy Rev 2014;30:461–78.
[24] Widegren K. Smart grid and smart metering – Swedish experiences. EuropeanEnvironmental Agency; 2012.
[25] Ireland Commission for Energy Regulation. Electricity Smart Metering Custo-mer Behavior Trials (CBT) Findings Report; 2011.
[26] Dam S, Bakker C, Hal J. Home energy monitors: impact over the medium term.Build Res Inf 2010;38(5):458–69.
[27] Jessoe K, Rapson D. Commercial and industrial DR under mandatory time-of-use electricity pricing. Energy Institute at Haas Working Paper Series, CA;2013.
[28] Faruqui A. From smart metering to smart pricing, Metering International, 1;2007.
[29] Pruggler N. Economic potential of DR at household level – are centralEuropean market conditions sufficient. Energy Policy 2013;60(9):487–98.
[30] EIA U.S. Electricity Consumption Statistics, U.S. Environmental InformationAgency; 2012. Available at: ⟨http://www.eia.gov/cfapps/ipdbproject/IEDIndex3.cfm?tid=44&pid=44&aid=2⟩.
[31] Sentec. The European market for Smart Electricity Meters; 2012. Available at:⟨http://www.sentec.co.uk/newsandthinking/news/rollout⟩.
[32] Aghaei J, Alizadeh M. Demand response in smart electricity grids equippedwith renewable energy source: a review. Renew Sustain Energy Rev 2013;18:64–72.
[33] DOE. analysis of customer enrollment patterns in time-based rate programs:initial results from the SGIG consumer behavior studies, U.S. Department ofEnergy; 2013.
[34] Pietsch JDR. Smart Grid—state legislative and regulatory policy action review:May 2010–June 2011, Association for DR and smart grid; 2011.
[35] Yu X, Zhang Y, Yin M. Smart meters in Korea. State Grid J 2011;11.
Z. Hu et al. / Renewable and Sustainable Energy Reviews 42 (2015) 743–751 751