Embed Size (px)
Citation preview
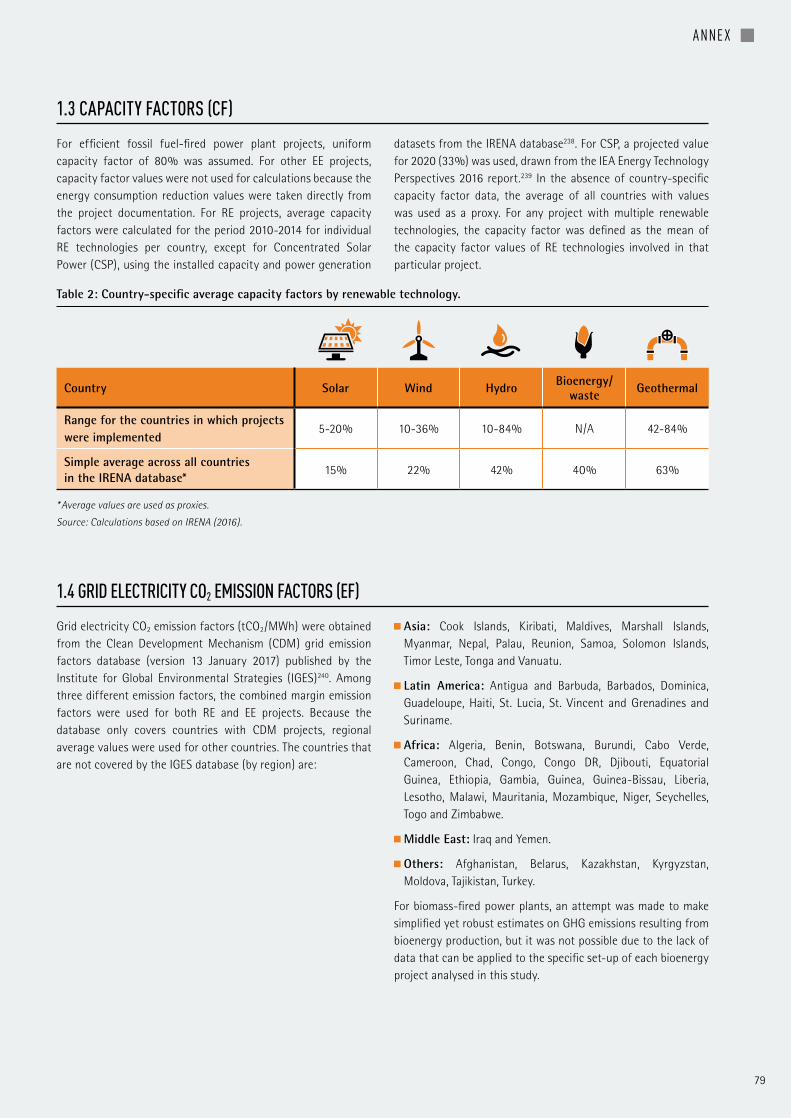
+2degC
Third Report | 2017
Renewable Energy and Energy Efficiency in Developing CountriesContributions to Reducing Global Emissions
UN Environment promotes environmentally sound practices
globally and in its own activities This publication is printed on 100 recycled paper
using vegetable - based inks and other eco-friendly practices Our distribution policy aims to
reduce UN Environmentlsquos carbon footprint
Togu Cover inside GreenDotindd 1 112509 94923 AM
A digital copy of this report is available at 1gigatoncoalitionorg
Copyright copy United Nations Environment Programme 2017
This publication may be reproduced in whole or in part and in any form for educational or non-profit purposes without special permission from the copyright holder provided acknowledgement of the source is made The United Nations Environment Programme would appreciate receiving a copy of any publication that uses this publication as a source
No use of this publication may be made for resale or for any other commercial purpose whatsoever without prior permission in writing from the United Nations Environment Programme
Disclaimer
The designations employed and the presentation of the material in this publication do not imply the expression of any opinion whatsoever on the part of the United Nations Environment Programme concerning the legal status of any country territory city or area or of its authorities or concerning delimitation of its frontiers or boundaries Moreover the views expressed do not necessarily represent the decision or the stated policy of the United Nations Environment Programme nor does citing of trade names or commercial processes constitute endorsement
ISBN No 978-92-807-3671-7
Job No DTI2132PA
Renewable Energy and Energy Efficiency in Developing CountriesContributions to Reducing Global Emissions
Third Report | 2017
+2degC
LEAD AUTHORS Yale University Angel Hsu Carlin Rosengarten
Amy Weinfurter Yihao Xie
REN21 Evan Musolino Hannah E Murdock
REVIEWERS
Niklas Houmlhne Markus Hagemann and Takeshi Kuramochi
(NewClimate Institute) Philip Drost (UN Environment)
Nathan Borgford-Parnell and Hanxiang Cong (Institute for
Governance and Sustainable Development) Zhao Xiusheng
(Tsinghua University China)
COUNTRY INITIATIVE AND DATA CONTRIBUTORS Case study support We thank and acknowledge following individuals for their valuable
assistance providing consultation feedback and information to
inform the case studies
Jaime Acuntildea (Univalle)Adedoyin Adeleke (Centre for Petroleum
Energy Economics and Law University of Ibadan) Ayooluwa Adewole
(Centre for Petroleum Energy Economics and Law University of
Ibadan) Godwin Aigbokhan (Renewable Energy Association of
Nigeria (REAN)) Habiba Ali (SOSAI Renewable Energies Company)
Centro Regional de Produccioacuten maacutes Limpia (CRPML) Corporacioacuten
Autoacutenoma Regional del Valle del Cauca (CVC) Tolu Fakunle (Centre
for Petroleum Energy Economics and Law University of Ibadan)
Eitan Hochster (Lumos Global) Janet Kajara (Kampala Capital
City Authority (KCCA)) Shehu Ibrahim Khaleel (Renewable Energy
Resources Development Initiatives (RENDANET)) Edison Masereka
(Kampala Capital City Authority (KCCA)) Nolbert Muhumuza (Awuma
Biomass) Tanya Muumlller Garcia (Secretary of Environment Mexico
City) Eleth Nakazzi (Kampala Capital City Authority (KCCA)) Ines
Restrepo-Tarquino (Univalle) Patricia Ugono (Solynta) Uvie Ugono
(Solynta) Paola Andrea Vaacutesquez (GEADES-UAO) Sandra Vaacutesquez
(El Castillo)
Multistakeholder partnerships Patrick Blake (enlighten U4E) Callum Grieve (Sustainable Energy
for All (SEforALL)) Martin Hiller (Renewable Energy and Energy
Efficiency Partnership (REEEP)) Irma Juskenaite (Climate Technology
Centre and Network (CTCN)) Tatiana Kondruchina (Climate and
Clean Air Coalition (CCAC)) Celia Martinez (District Energy in Cities
Initiative) Wei-Shiuen Ng (International Transport Forum OECD)
Eva Kelly Oberender (Renewable Energy and Energy Efficiency
Partnership (REEEP)) Ellen Paton (UK International Climate Fund
(ICF)) Quinn Reifmesser (Renewable Energy and Energy Efficiency
Partnership (REEEP)) Andrea Risotto (NDC Partnership) Nora
Steurer (The Global Alliance for Buildings and Construction (GABC))
Jukka Uosukainen (Climate Technology Centre and Network (CTCN))
Maria van Veldhuizen (Renewable Energy and Energy Efficiency
Partnership (REEEP)) Gunnar Wegner (Energizing Development and
Climate Mitigation (EnDev)) Elke Westenberger (Moroccan Climate
Change Competence Centre (4C Maroc)) Laura Williamson (REN21)
Peter Wright (Sustainable Energy for All (SEforALL))
Data gathering Markus Kurdziel (IKI) Sarah Leitner (IKI) Karoline Teien Blystad
(Norfund) Lucie Bernatkova (EIB) Cyrille Arnould (EIB) Aglaeacute Touchard-
Le Drain (EIB) Martina Jung (KfW) Milena Gonzalez Vasquez (GEF)
David Elrie Rodgers (GEF) Ichiro Sato (JICA) Yoji Ishii (JICA)
THOMSON REUTERS
A contribution from Thomson Reuters report ldquoGlobal 250
Greenhouse Gas Emitters A New Business Logicrdquo is included in
chapter 3 Lead Authors
David Lubin Constellation Research and Technology John
Moorhead BSD Consulting Timothy Nixon Thomson Reuters
The authors would like to thank and acknowledge the important
contributions of Chris Mangieri Dan Esty and Jay Emerson of Yale
University and Constellation Research and Technology
Important data and analytics support was provided by Frank Schilder
Thomson Reuters Research amp Development Adam Baron from
Thomson Reuters Content Analytics and Ian van der Vlugt from CDP
PROJECT MANAGEMENT AND COORDINATION
Zitouni Ould- Dada (UN Environment)
Rashmi Jawahar Ganesh (UN Environment)
REN21
The 1 Gigaton Coalition would like to thank and acknowledge the
invaluable assistance of REN21 namely Hannah E Murdock for
research coordination and Linh H Nguyen for research support
DESIGN AND LAYOUT Weeksde Webeagentur GmbH
ACKNOWLEDGEMENTS
5
1 INTRODUCTION 10
2 DEVELOPING COUNTRIESrsquo EFFORTS AND ACHIEVEMENTS IN ENERGY EFFICIENCY AND RENEWABLE ENERGY 13
21 POLICY DEVELOPMENT 14 211 Targets 14
212 Policy instruments 16
3
NON-STATE AND SUBNATIONAL CONTRIBUTIONS TO RENEWABLE ENERGY AND ENERGY EFFICIENCY 20
31 CASE STUDIES 22 32 EXCERPT FROM GLOBAL 250 GREENHOUSE GAS EMITTERS A NEW BUSINESS LOGIC 34
4 15- AND 2- DEGREE COMPATIBILITY A NEW APPROACH TO CLIMATE ACCOUNTING 37
41 DEVELOPING 15- AND 2- DEGREE COMPATABILITY CONDITIONS 38
42 COMPATABILITY TABLES 41
43 PROJECT-LEVEL COMPATABILITY 50
5 DATABASE ASSESSMENT 56
51 AGGREGATED IMPACT 57
52 SELECTED BILATERAL INITIATIVES 59
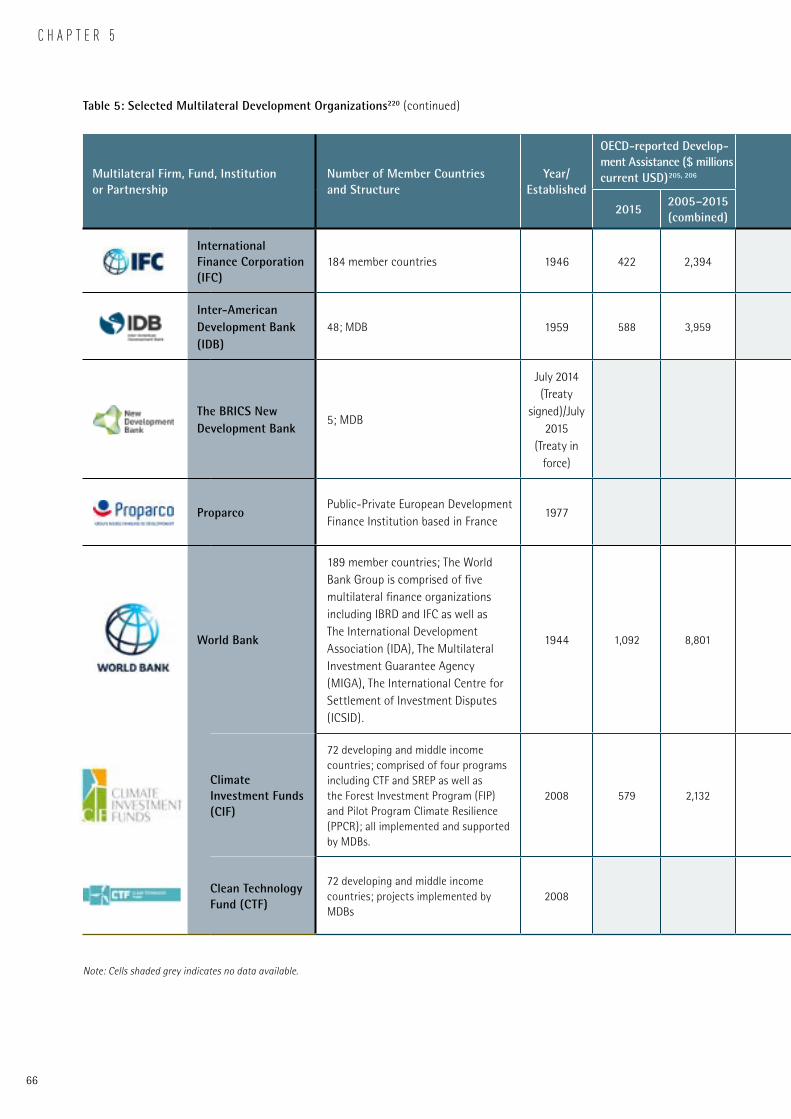
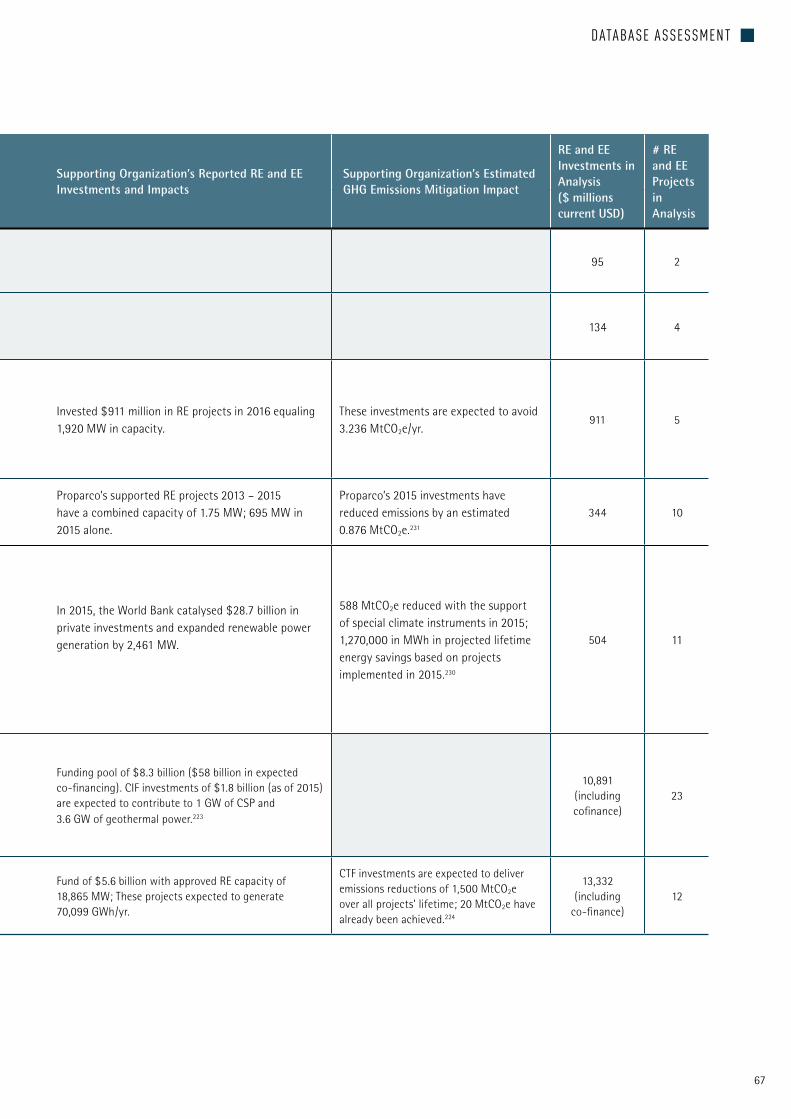
53 SELECTED MULTILATERAL INITIATIVES 63 531 Multistakeholder partnerships 68
6 CONCLUSION 75
A ANNEX I DETAILED DESCRIPTION OF MITIGATION IMPACT CALCULATIONS 77
ACKNOWLEDGEMENTS 4
FOREWORD 6
KEY MESSAGES 7
EXECUTIVE SUMMARY 8
+2degC
TABLE OF CONTENTS
References 82
Glossary 87
Acronyms 88
Impressum 89
6
Even if the pledges in the Paris Agreement on Climate Change are
implemented we will still not reduce greenhouse gas emissions
enough to meet the goals The UN Environment Emissions Gap
Report 2017 states that for the 2degC goal this shortfall could be
11 to 135 gigatonnes of carbon dioxide equivalent For the 15degC
goal it could be as much as 16 to 19 gigatonnes We urgently need
more ambitious action to close these gaps So this latest 1 Gigaton
Coalition Report helps to focus those efforts by quantifying the
progress secured through renewable energy and energy efficiency
Electricity touches almost every aspect of our lives yet nearly
a quarter of the population still lacks access to safe clean and
affordable energy Around the world people continue to seek
less polluting options for everyday needs like lighting heating
water cooking and sanitation It should be no surprise then that
renewable power capacity is growing faster than all fossil fuels
combined with a record increase of about 9 from 2015 to 2016
Particularly when bi-products include better health education
security and economic growth
Take cities which are responsible for 75 of global greenhouse gas emissions They can also be a big part of the solution by adopting
to energy efficient buildings electric transport cycle schemes and waste conversion For example in New Delhi India the health of
local communities is severely affected by growing mountains of waste being dumped in open spaces The city and private sector are
tackling this by investing in waste-to-energy-plants These reduce toxic emissions and transform waste into electricity The plantrsquos
community center offers employment and artisan training to about 200 local women For Badru Nisha this income has enabled
her to save 70000 rupees (US $1100) and build a house for relatives in Bihar state This program helps women build their skills
and confidence and provides them with some financial security and independence This is just one of many stories inspiring local
governments mayors businesses and civil society to join forces for significant environmental economic and public health benefits
This report comes at a critical moment to support the growing number of non-state actors showing leadership to deliver the Paris
Agreement We hope it will motivate donors initiatives and countries to build on their achievements while inspiring more public and
private sector stakeholders to join this global effort
FOREWORD
HE Boslashrge BrendeMinister of Foreign AffairsNorway
Erik SolheimUN Environment Executive Director and Under-Secretary- General of the United Nations
+2degC
KEY FINDINGS
R INTERNATIONALLY SUPPORTED RENEWABLE ENERGY AND ENERGY EFFICIENCY PROJECTS implemented in developing countries between 2005 and 2016 are projected to reduce greenhouse gas emissions by 06 Gigatons of carbon dioxide (GtCO2) annually in 2020 When scaled up using international climate financing commitments these efforts could deliver 14 GtCO2 in annual reductions by 2020
R INTERNATIONAL SUPPORT FOR INVESTMENTS IN RENEWABLE ENERGY AND ENERGY EFFICIENCY IS VITAL FOR DECARBONIZATION as this support provides key resources and creates enabling environments in regions critical to the global climate future International assistance accounts for only 10 of all global renewable energy and energy efficiency activities yet it has extensive impact for future climate mitigation
R DATA AVAILABILITY AND INFORMATION SHARING REMAIN A PERENNIAL CHALLENGE one that is preventing countries and supporting organizations from systematically evaluating their workrsquos impact although renewable energy and energy efficiency projects and policies are growing in developing countries The 1 Gigaton Coalition has developed a database of about 600 internationally supported projects implemented in developing countries between 2005 and 2016
R EVALUATING PROJECTS POLICIES AND SECTORSrsquo COMPATIBILITY WITH GLOBAL 15degC AND 2degC CLIMATE GOALS IS ESSENTIAL TO LINK ACTIONS WITH LONG-TERM OBJECTIVES This new method would enable bilateral and multilateral development organizations to measure the long-term impacts of supported projects
R NON-STATE AND SUBNATIONAL ACTORS HAVE TAKEN ON A LEADING ROLE IN SCALING UP CLIMATE ACTION The case studies in this report show that low-carbon forms of development ndash particularly city-based public private partnerships ndash generate multiple co-benefits These include improved environmental and human health economic stimulus and employment creation enhanced gender equality and other societal gains that support the 2030 Agenda for Sustainable Development
Developing countries are achieving low-cost emissions reductions through renewable energy (RE) and energy efficiency (EE) projects and initiatives The focus of this report is to evaluate the impact of these projects in terms of measurable greenhouse gas emissionsrsquo reductions to help close the emissions gap needed to meet the 2degC climate goal
EXECUTIVE SUMMARY
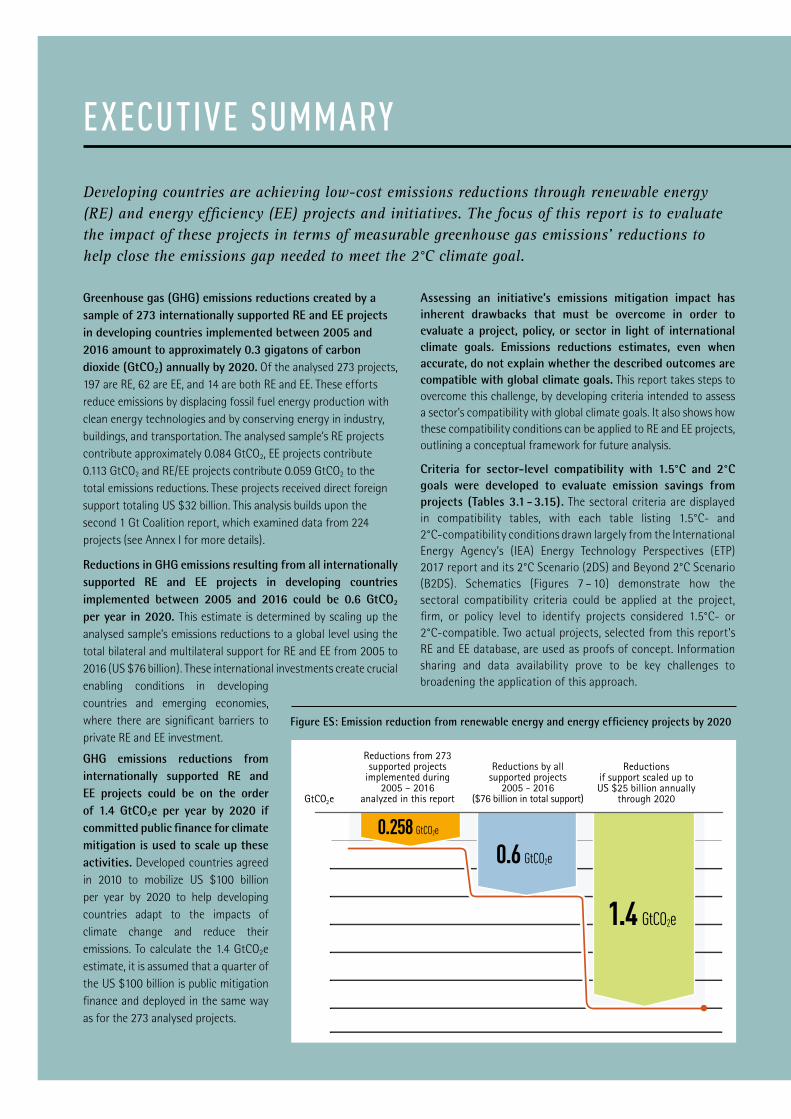
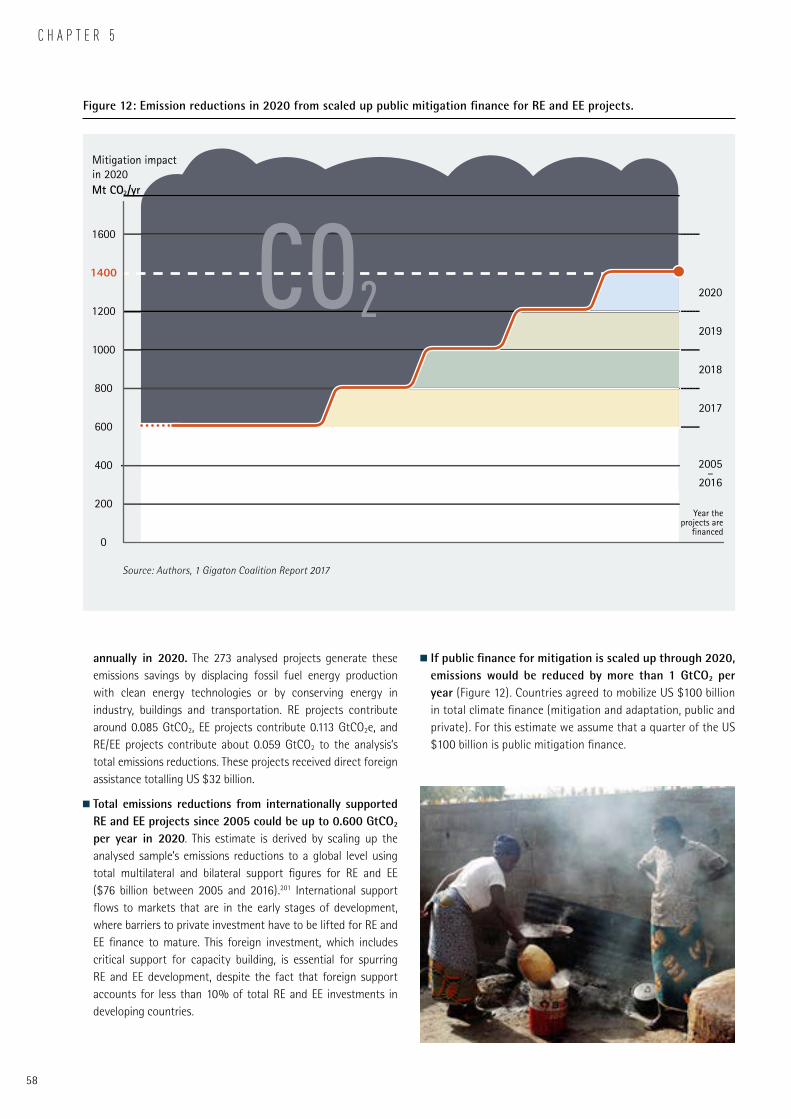
Greenhouse gas (GHG) emissions reductions created by a sample of 273 internationally supported RE and EE projects in developing countries implemented between 2005 and 2016 amount to approximately 03 gigatons of carbon dioxide (GtCO2) annually by 2020 Of the analysed 273 projects 197 are RE 62 are EE and 14 are both RE and EE These efforts reduce emissions by displacing fossil fuel energy production with clean energy technologies and by conserving energy in industry buildings and transportation The analysed samplersquos RE projects contribute approximately 0084 GtCO2 EE projects contribute 0113 GtCO2 and REEE projects contribute 0059 GtCO2 to the total emissions reductions These projects received direct foreign support totaling US $32 billion This analysis builds upon the second 1 Gt Coalition report which examined data from 224 projects (see Annex I for more details)
Reductions in GHG emissions resulting from all internationally supported RE and EE projects in developing countries implemented between 2005 and 2016 could be 06 GtCO2 per year in 2020 This estimate is determined by scaling up the analysed samplersquos emissions reductions to a global level using the total bilateral and multilateral support for RE and EE from 2005 to 2016 (US $76 billion) These international investments create crucial enabling conditions in developing countries and emerging economies where there are significant barriers to private RE and EE investment
GHG emissions reductions from internationally supported RE and EE projects could be on the order of 14 GtCO2e per year by 2020 if committed public finance for climate mitigation is used to scale up these activities Developed countries agreed in 2010 to mobilize US $100 billion per year by 2020 to help developing countries adapt to the impacts of climate change and reduce their emissions To calculate the 14 GtCO2e estimate it is assumed that a quarter of the US $100 billion is public mitigation finance and deployed in the same way as for the 273 analysed projects
Assessing an initiativersquos emissions mitigation impact has inherent drawbacks that must be overcome in order to evaluate a project policy or sector in light of international climate goals Emissions reductions estimates even when accurate do not explain whether the described outcomes are compatible with global climate goals This report takes steps to overcome this challenge by developing criteria intended to assess a sectorrsquos compatibility with global climate goals It also shows how these compatibility conditions can be applied to RE and EE projects outlining a conceptual framework for future analysis
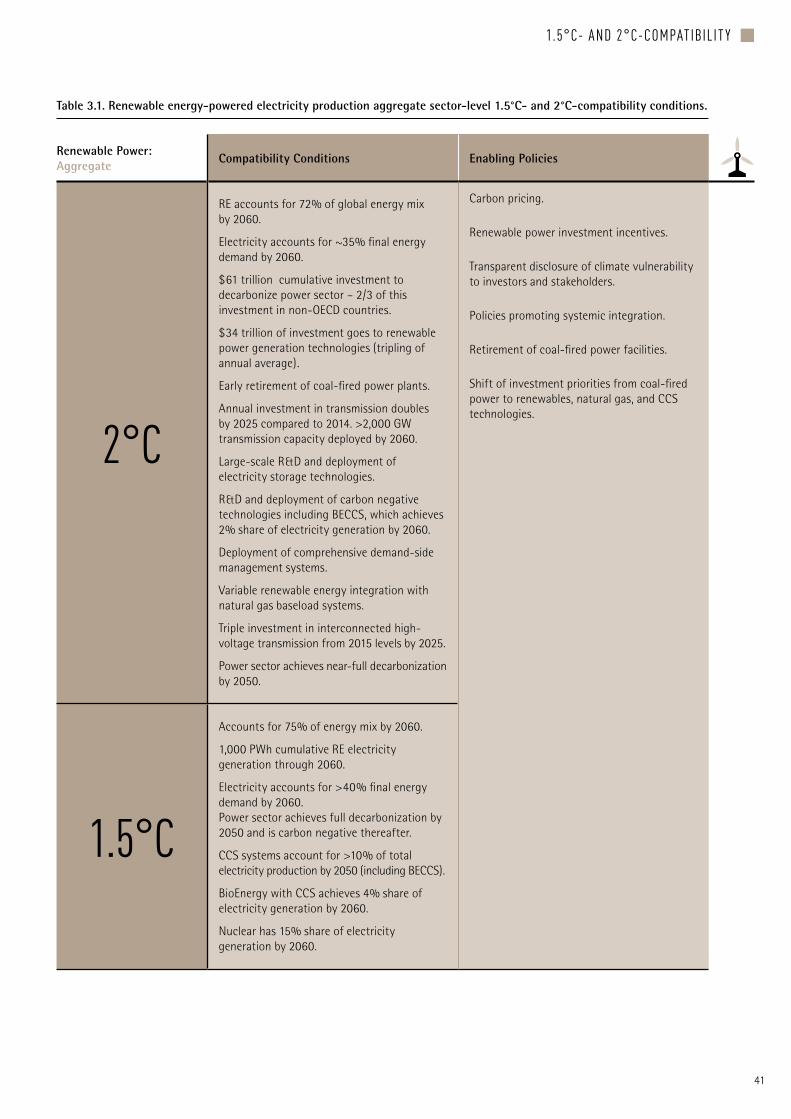
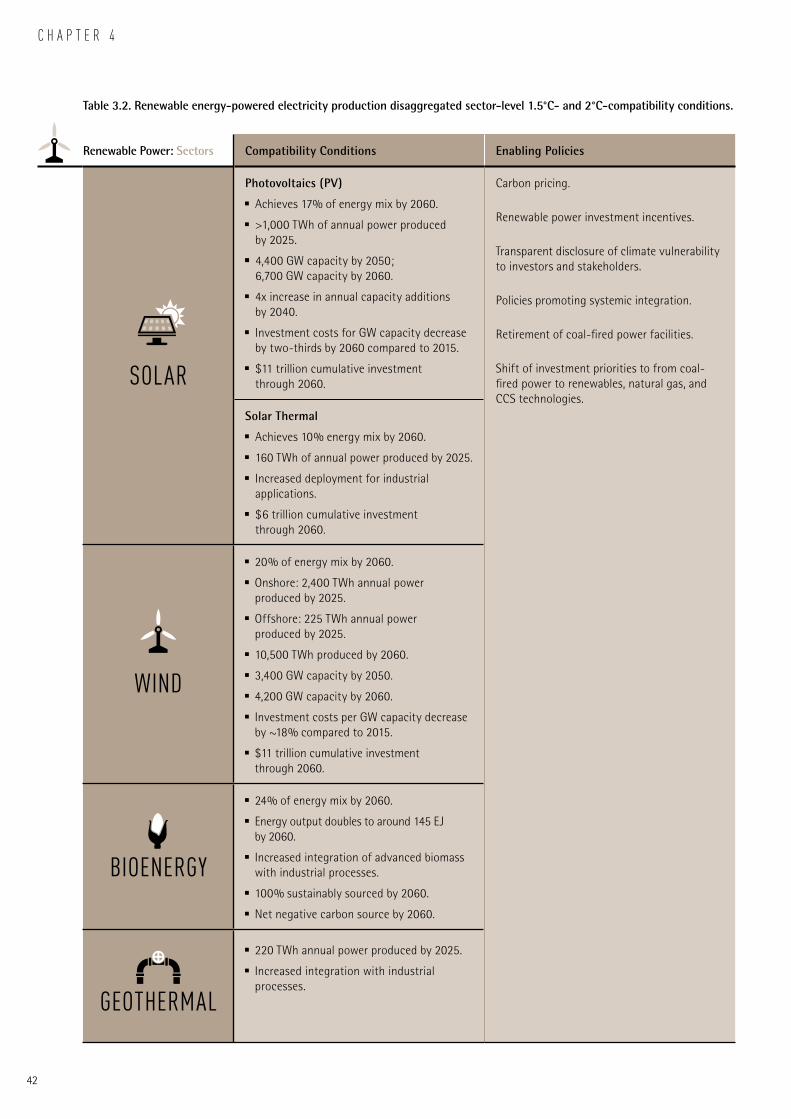
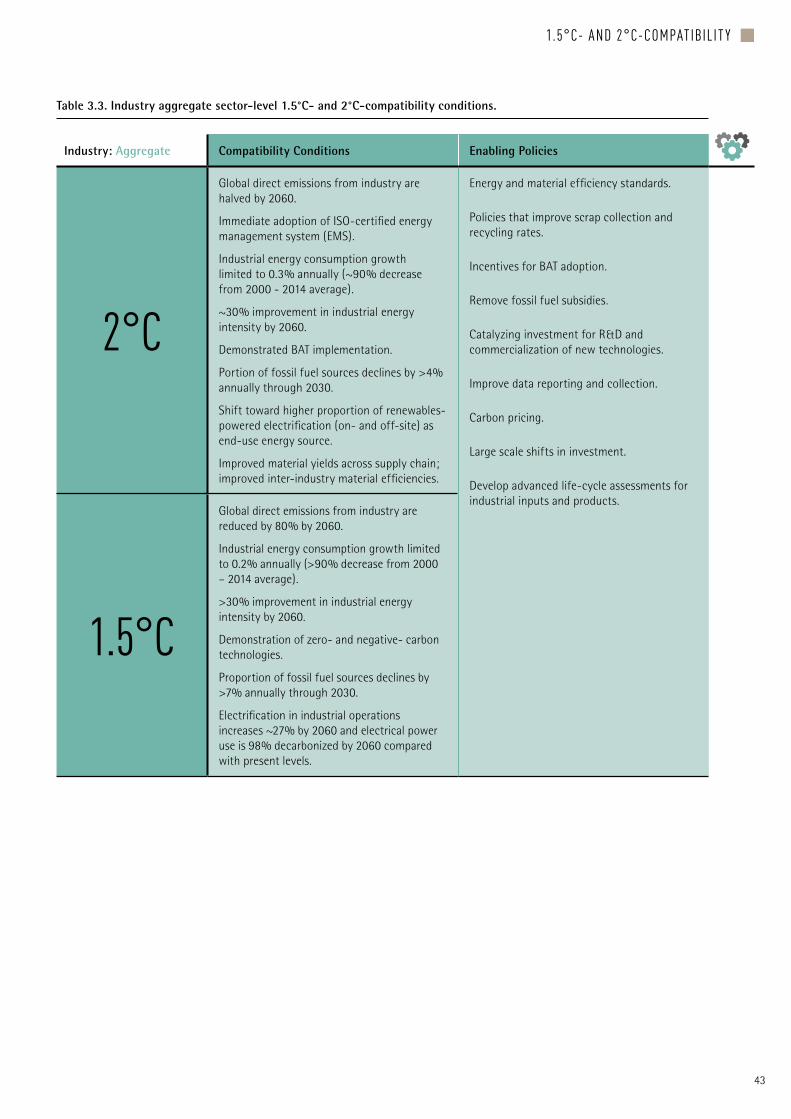
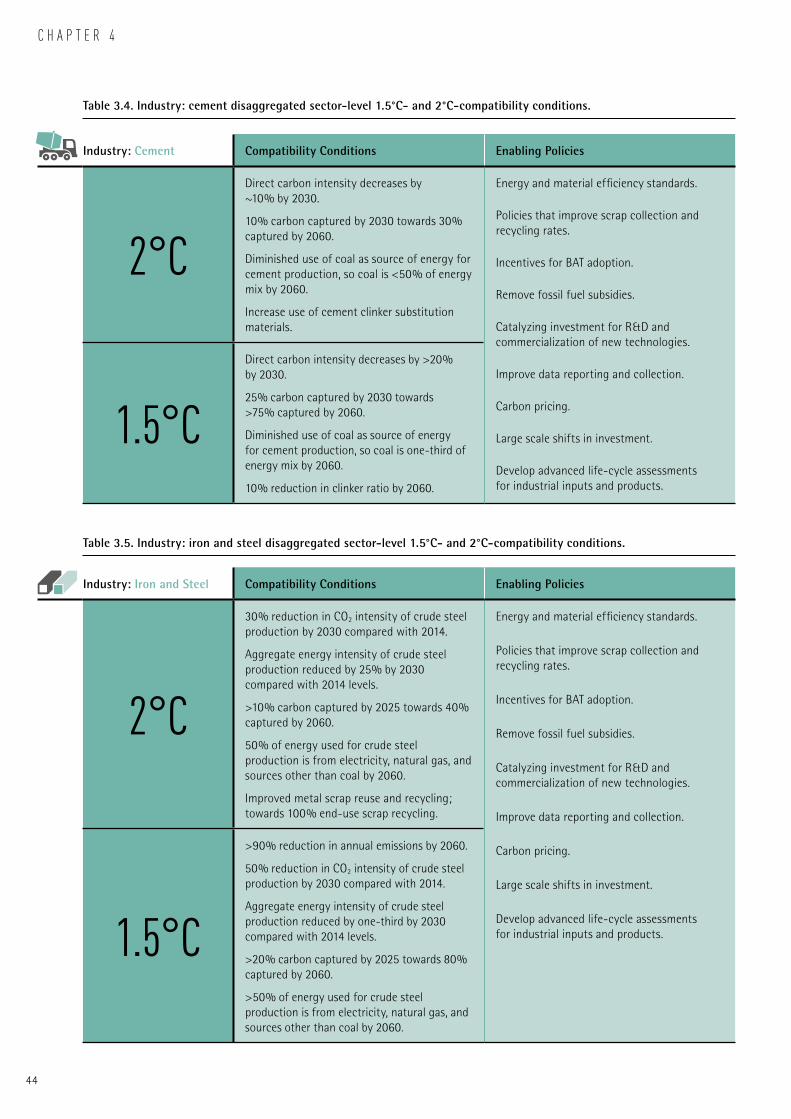
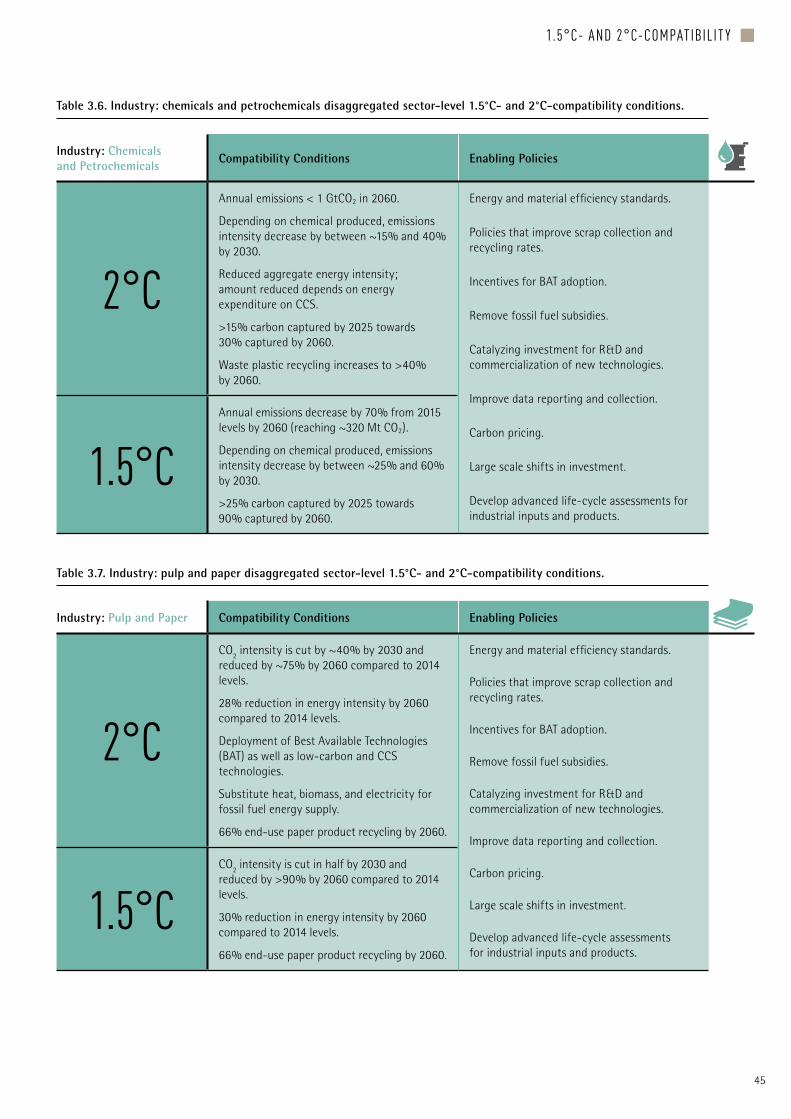
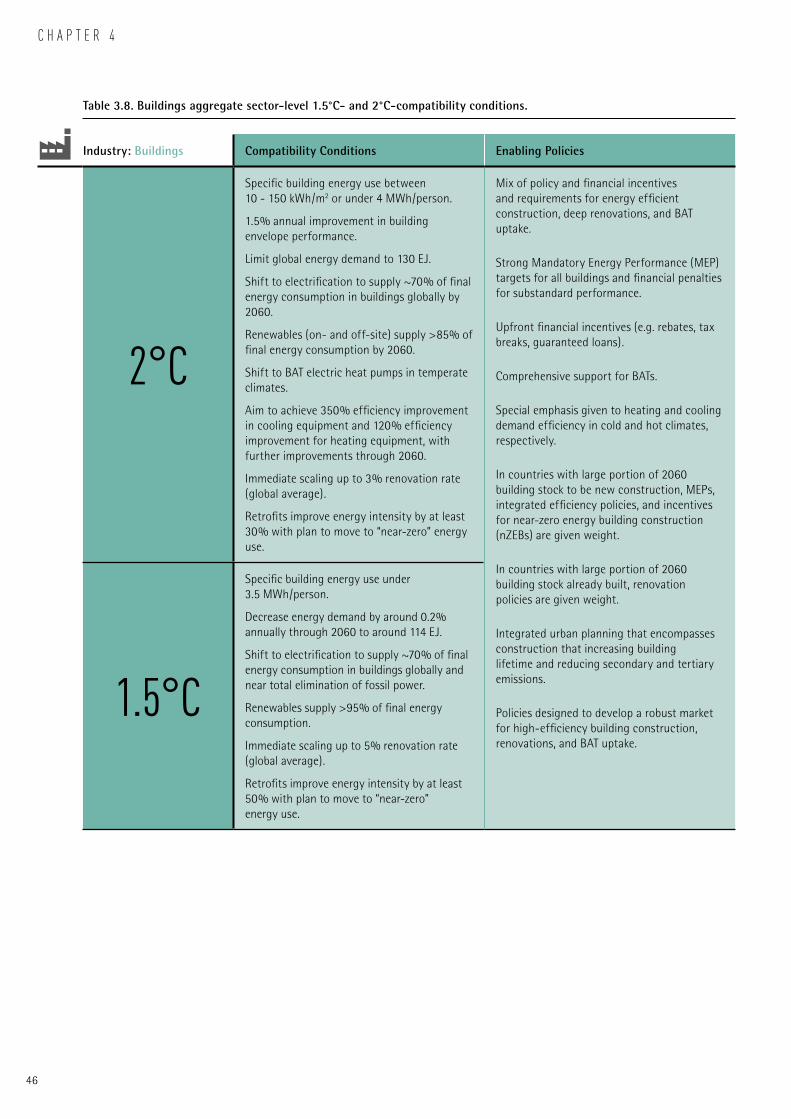
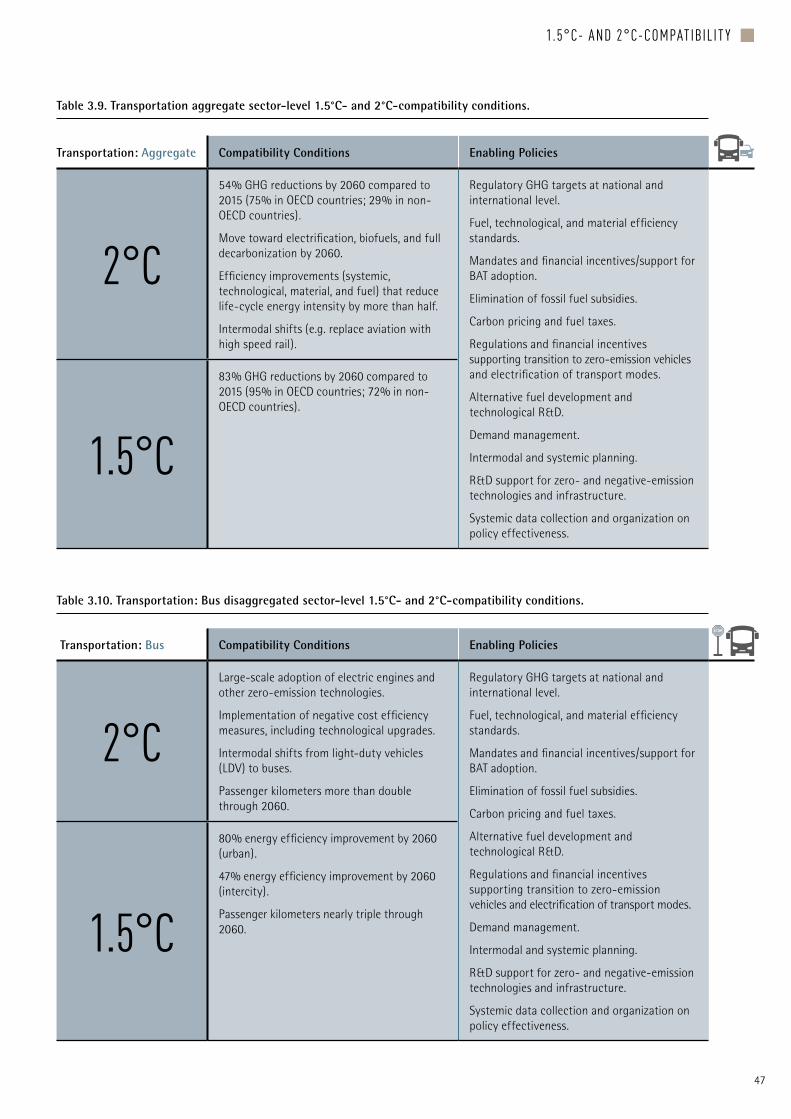
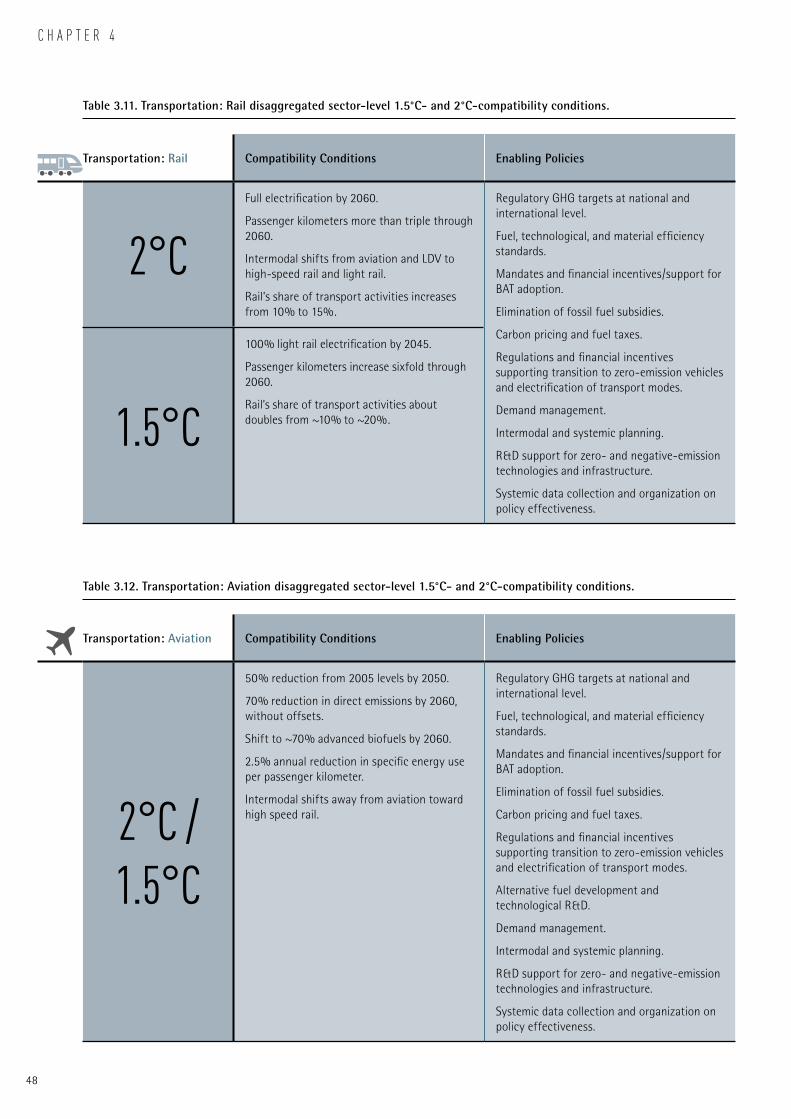
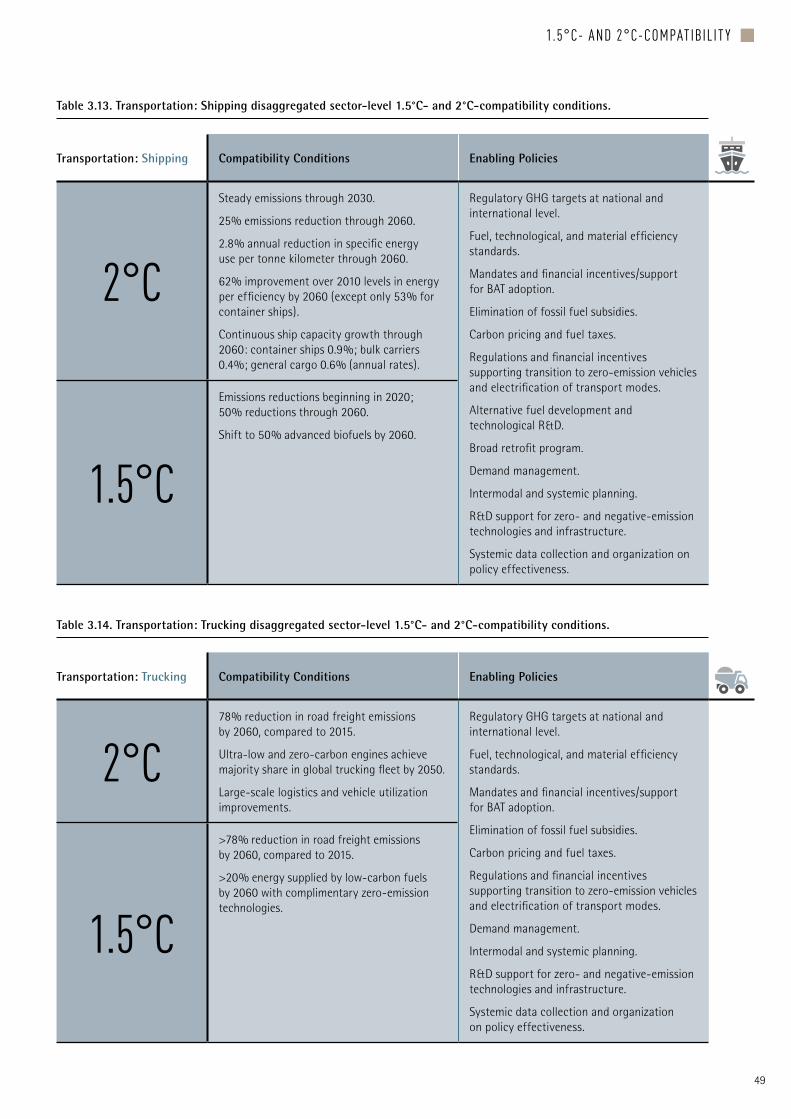
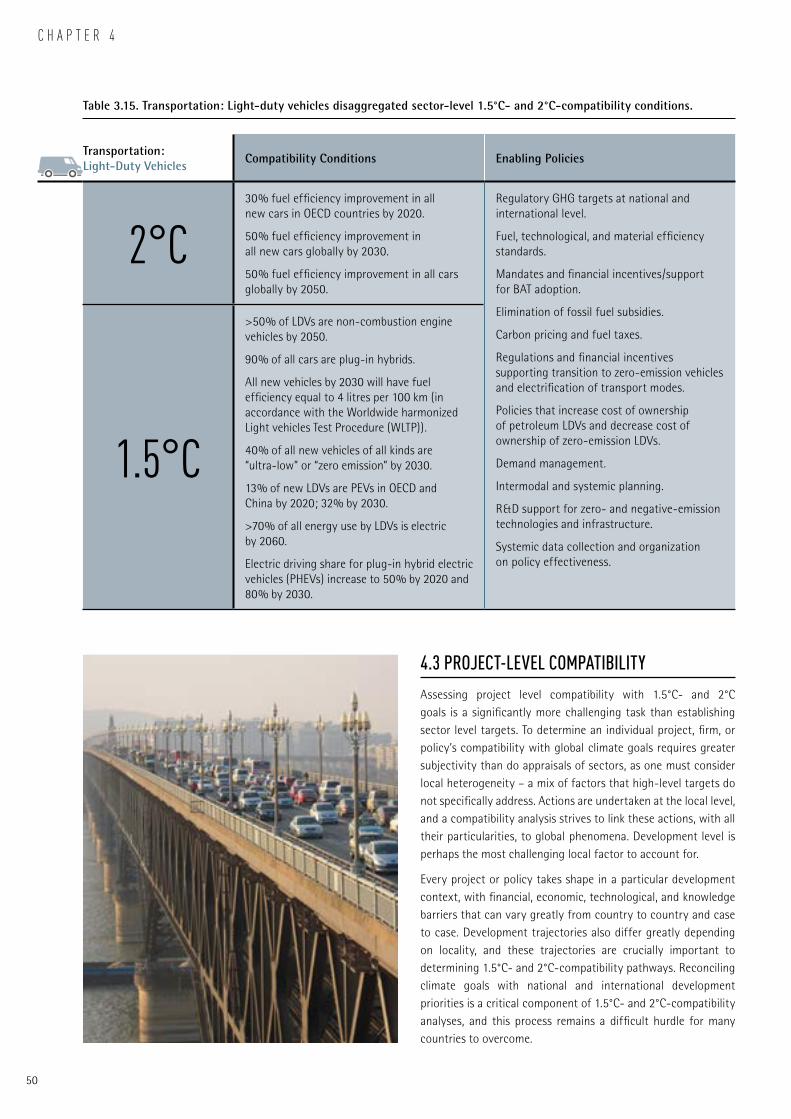
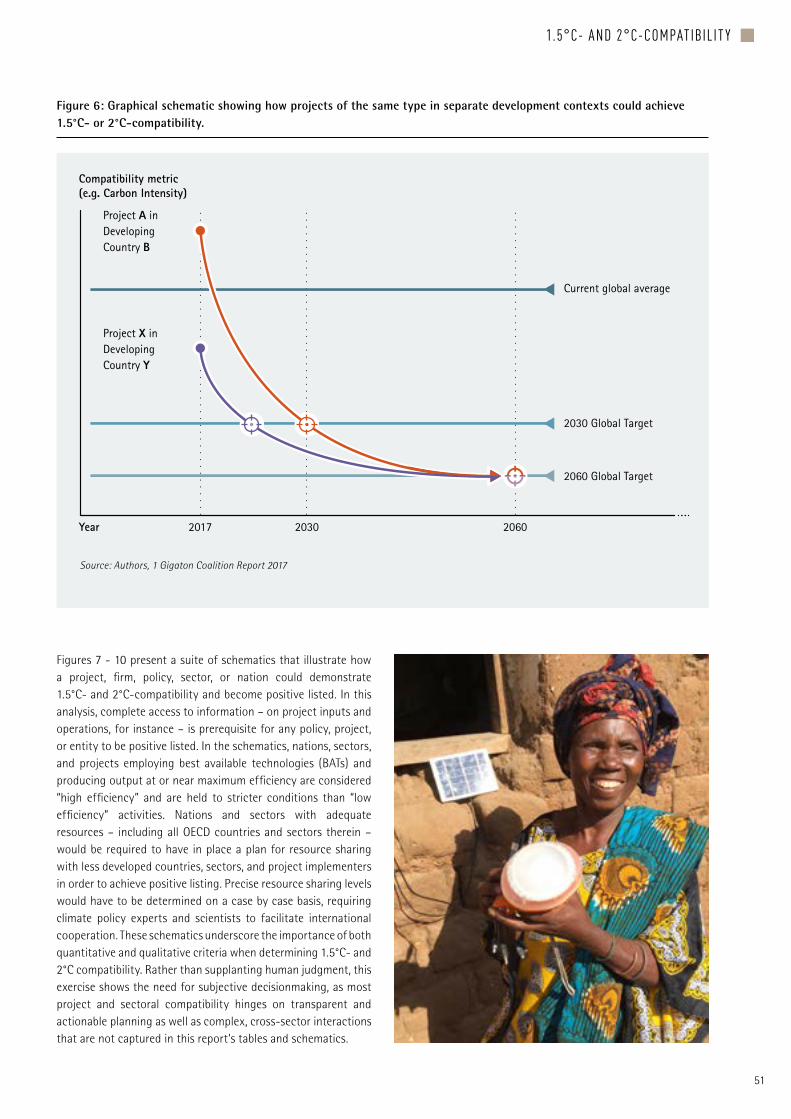
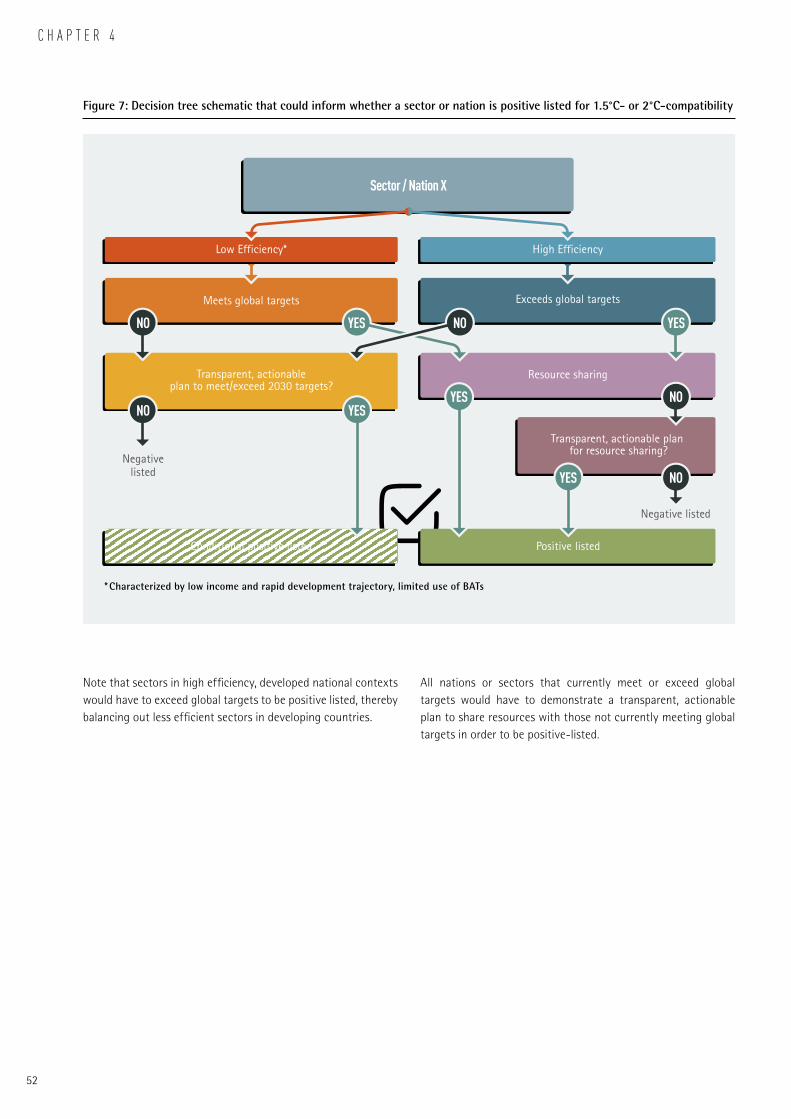
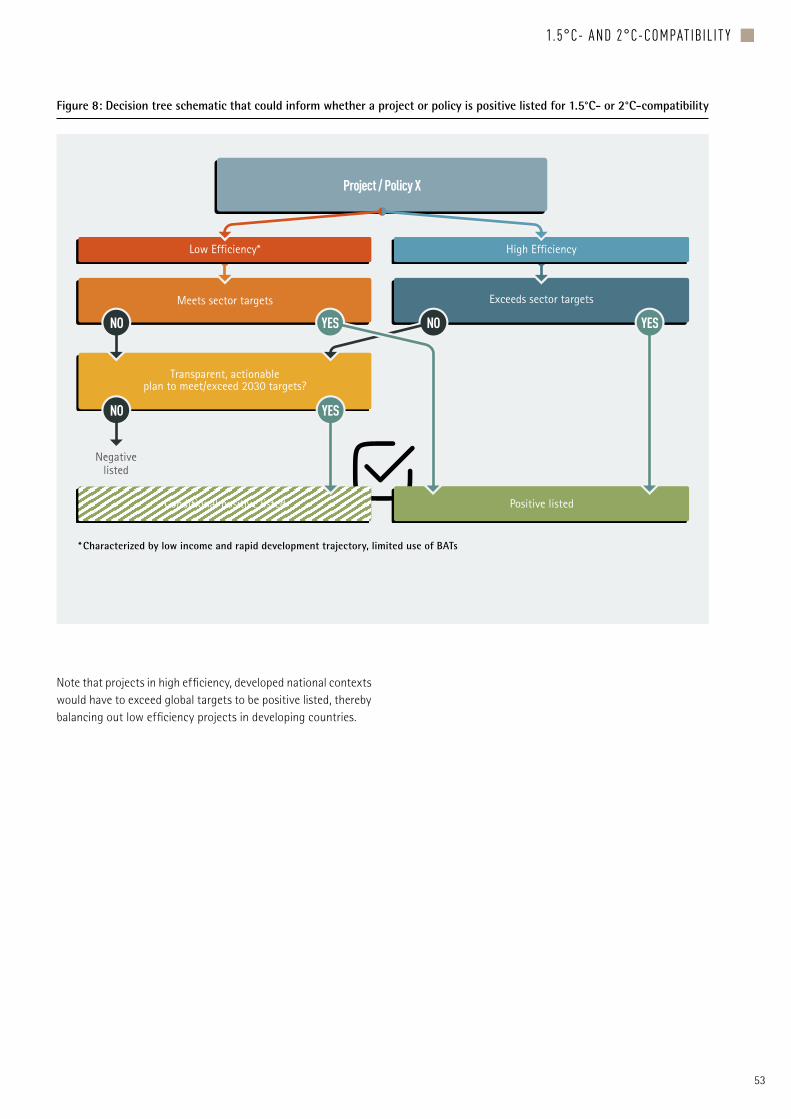
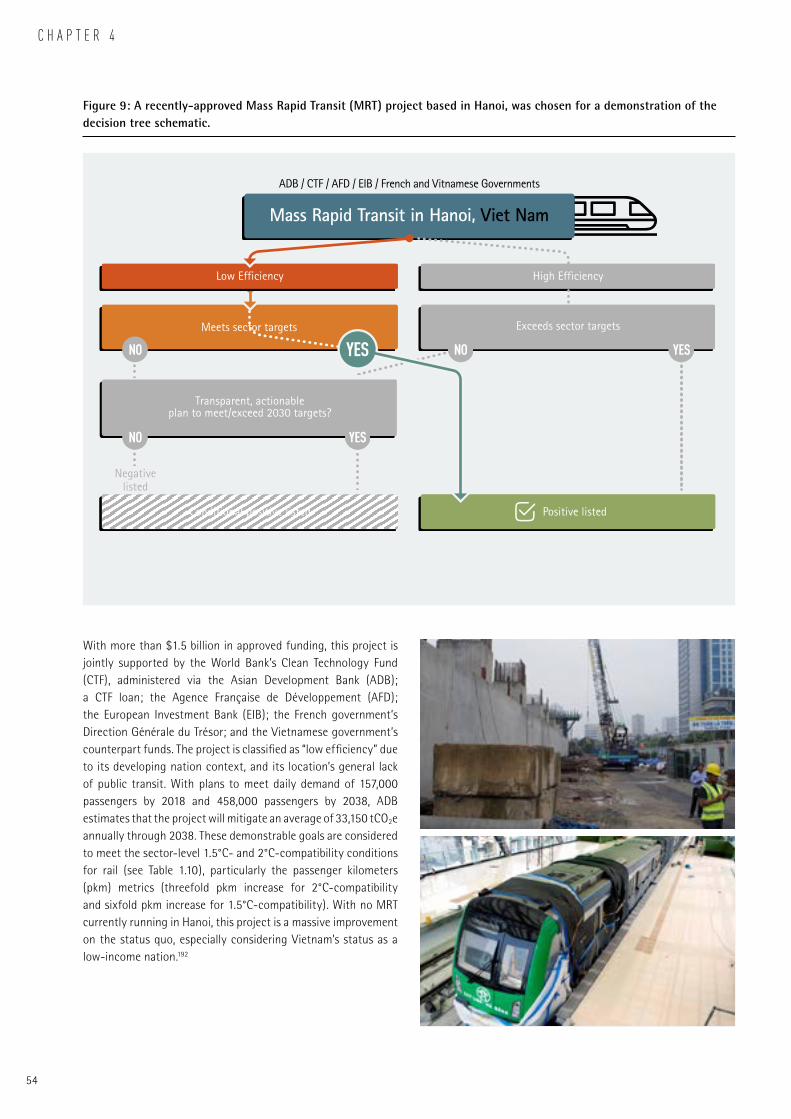
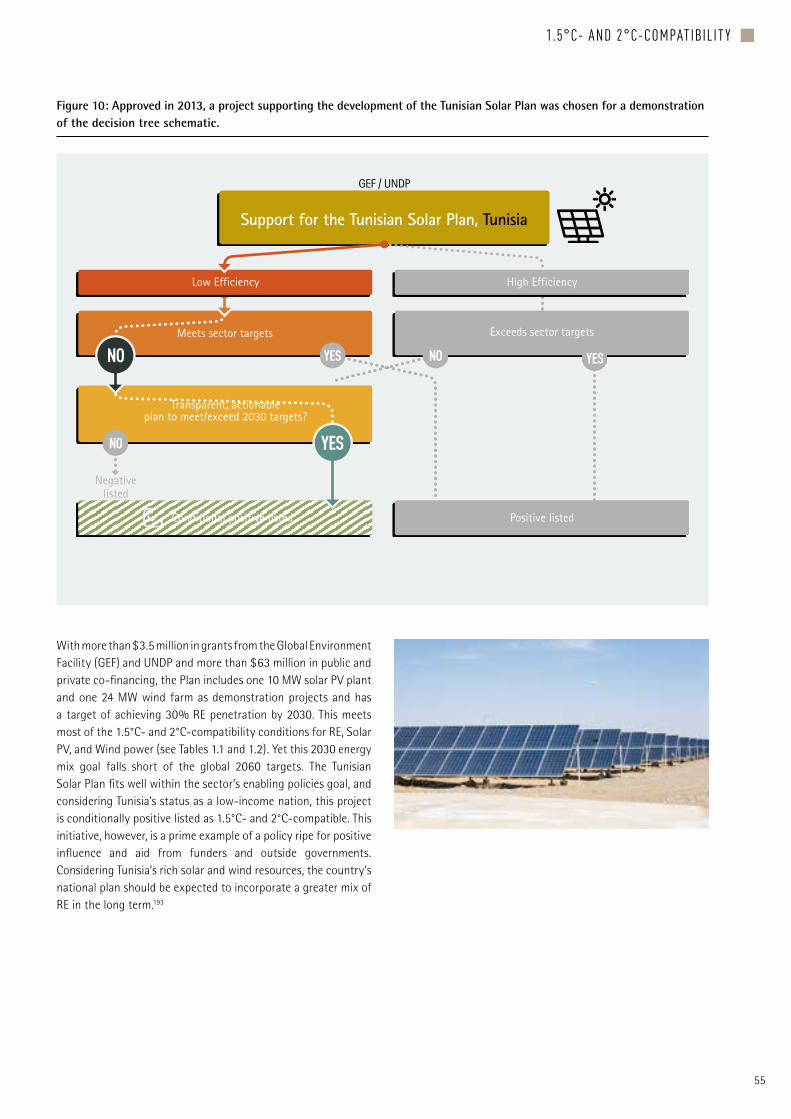
Criteria for sector-level compatibility with 15degC and 2degC goals were developed to evaluate emission savings from projects (Tables 31 - 315) The sectoral criteria are displayed in compatibility tables with each table listing 15degC- and 2degC-compatibility conditions drawn largely from the International Energy Agencyrsquos (IEA) Energy Technology Perspectives (ETP) 2017 report and its 2degC Scenario (2DS) and Beyond 2degC Scenario (B2DS) Schematics (Figures 7 ndash 10) demonstrate how the sectoral compatibility criteria could be applied at the project firm or policy level to identify projects considered 15degC- or 2degC-compatible Two actual projects selected from this reportrsquos RE and EE database are used as proofs of concept Information sharing and data availability prove to be key challenges to broadening the application of this approach
GtCO2e
Reductions from 273 supported projects
implemented during 2005 ndash 2016
analyzed in this report
Reductions by all supported projects
2005 - 2016 ($76 billion in total support)
Reductions if support scaled up to US $25 billion annually
through 2020
0258 GtCO2e 06 GtCO2e
14 GtCO2e
Figure ES Emission reduction from renewable energy and energy efficiency projects by 2020
9
EXECUTIVE SUMMARY g
City governments are increasingly collaborating with the private sector to address common challenges related to climate change and sustainable development The Intergovernmental Panel on Climate Change (IPCC) has indicated that achieving a 15degC- or 2degC-compatible future is a very challenging task yet almost all the technologies needed to build this future are commercially available today This report shows that many countries are acting to reduce emissions through RE and EE programmes and that when policies are well-designed both local and global communities benefit The six case studies presented in this report describe the social economic and environmental benefits that RE and EE programmes bring to the localities where they are implemented They highlight innovative initiatives implemented in a diverse set of cities and regions
bull NEW DELHIrsquoS municipal government has partnered with Infrastructure Leasing and Financial Services Environment (ILampFS Environment) to build a waste-to-energy plant that will save approximately 82 million tons of greenhouse gas emissions over its 25-year lifespan while reducing the landfillrsquos area and air and water pollution The project helps transition former waste-pickers to new jobs directly hiring 70 people at the new plant and has created a community center that provides support and job training to approximately 200 local women
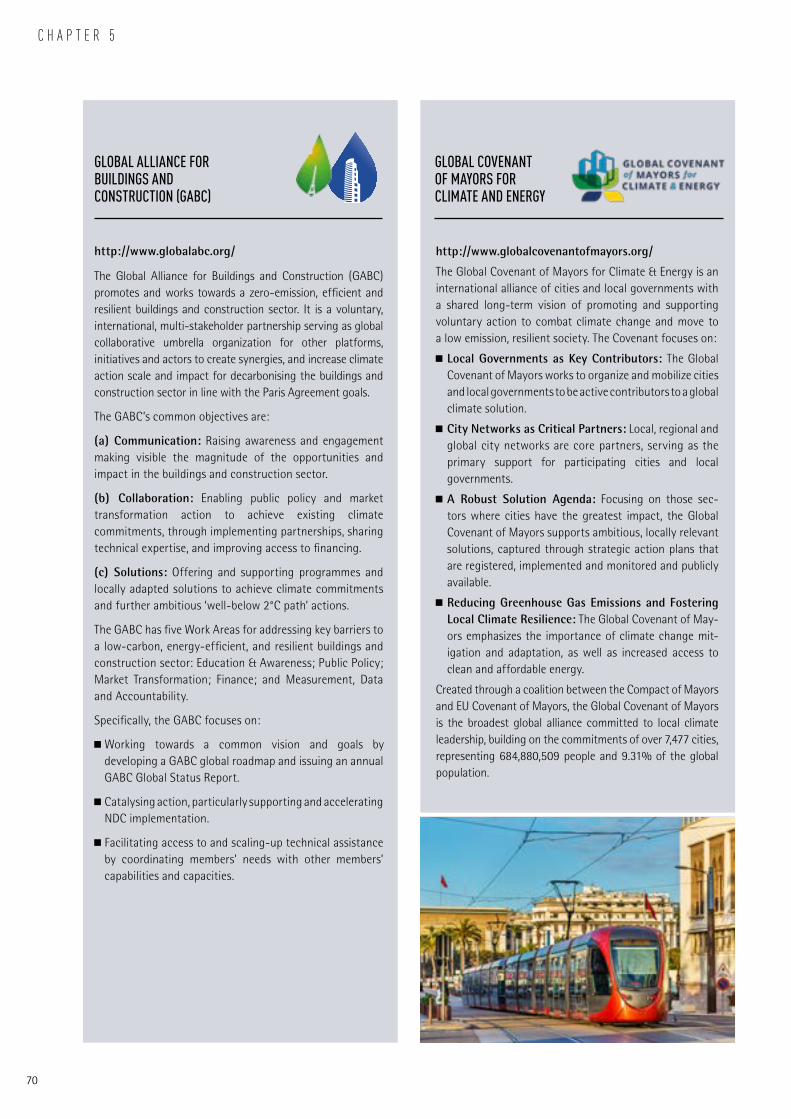
bull NANJING China worked with the electric vehicle industry to add 4300 electric vehicles to its streets between 2014 and 2015 This transition has helped the city reduce emissions by 246000 tons of carbon dioxide equivalent (CO2e) in 2014 while saving over US $71 million in lower energy bills
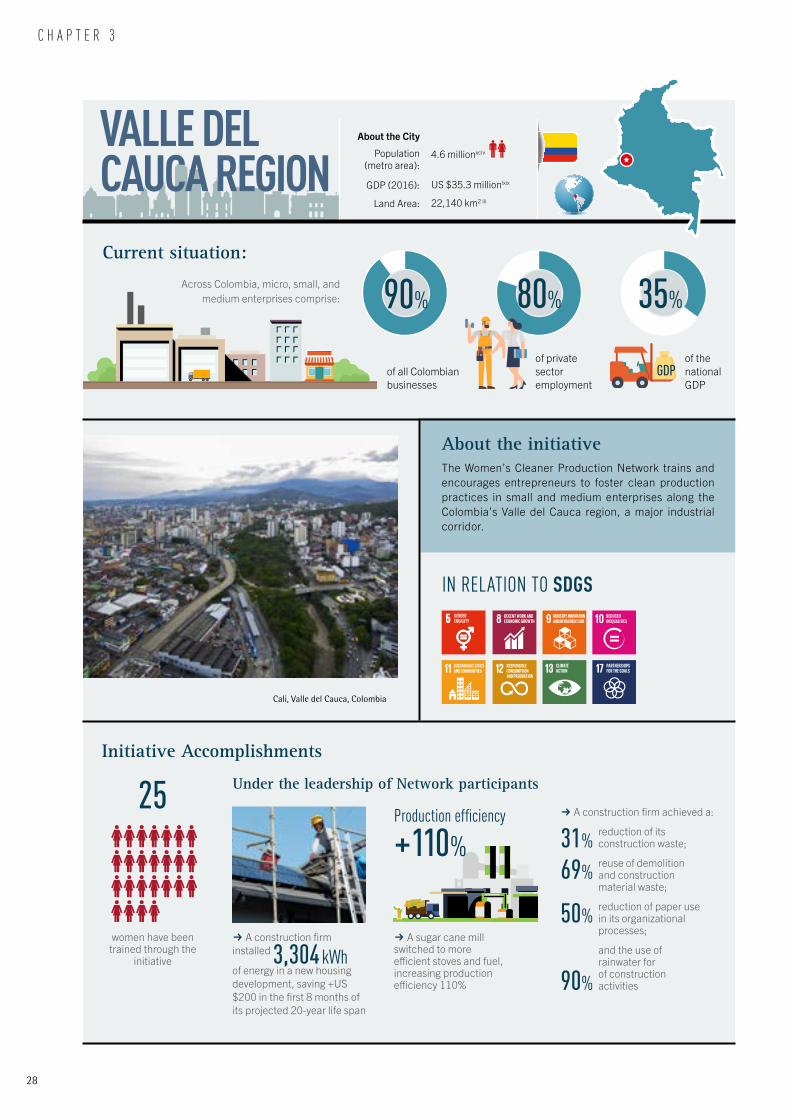
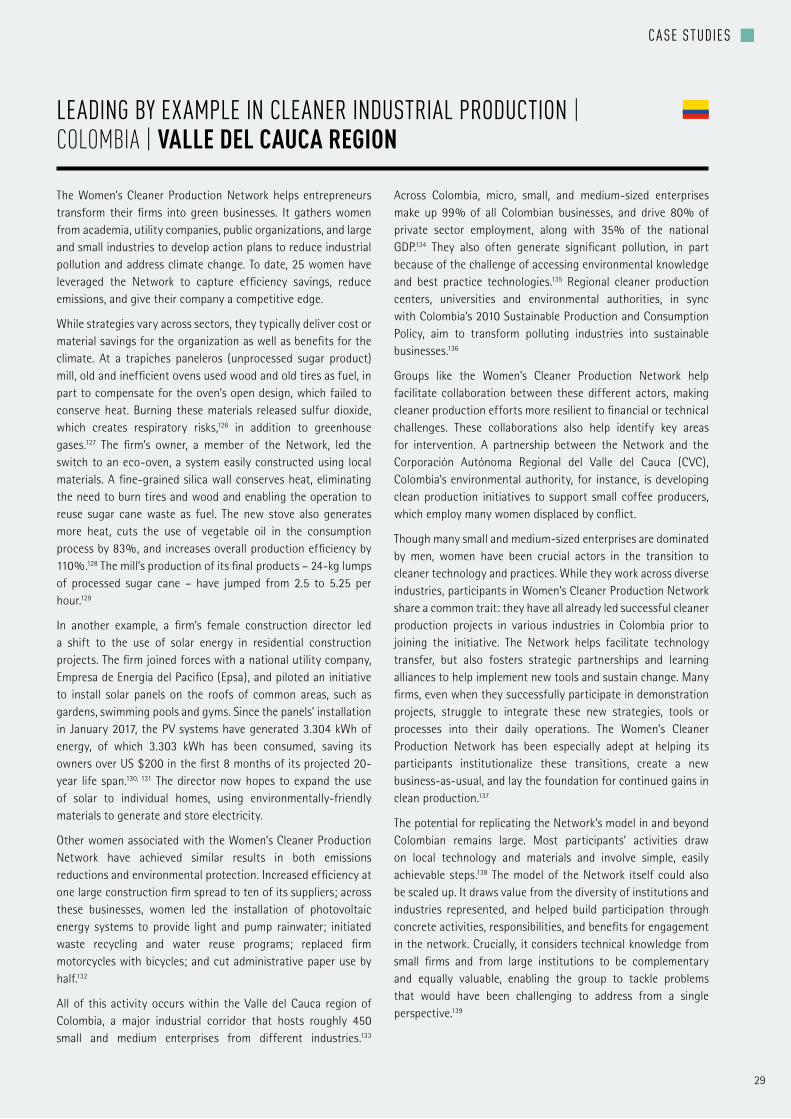
bull In the industrial VALLE DEL CAUCA corridor of Colombia The Womenrsquos Cleaner Production Network developed action plans to reduce industrial pollution and address climate change in small and medium-sized enterprises The initiative has created a host of benefits including a 110 percent increase in enterprise production efficiency and a new residential solar installation program
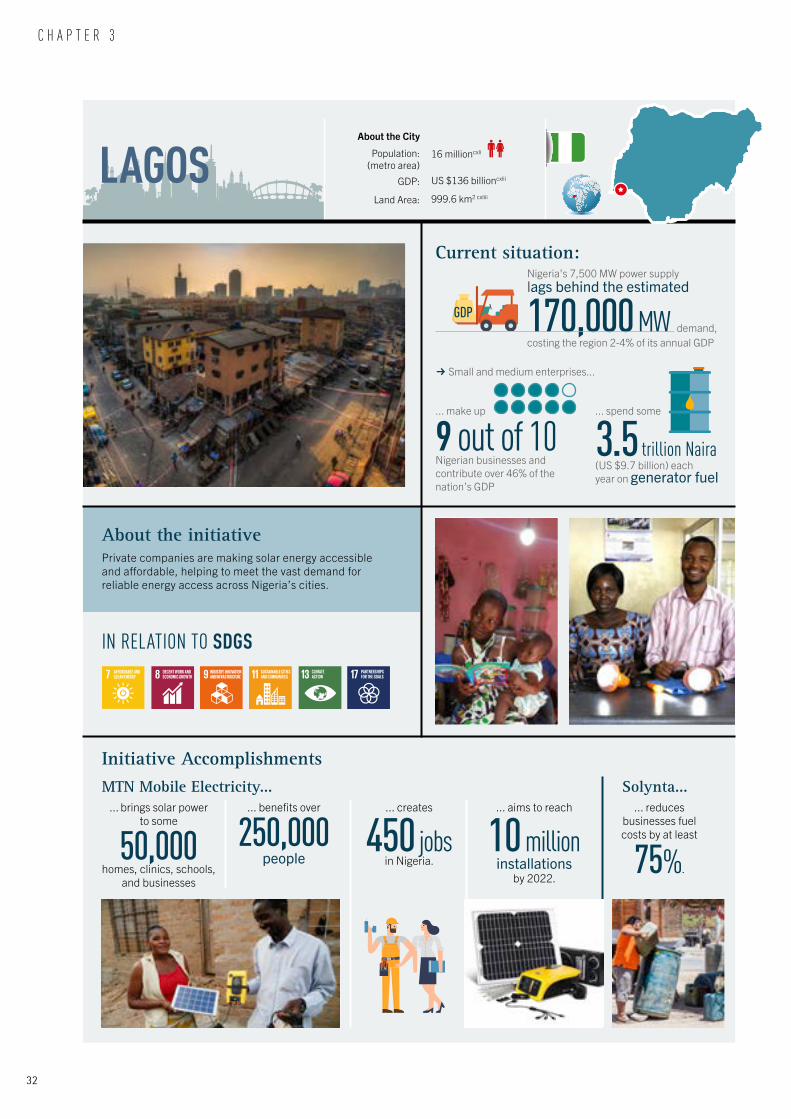
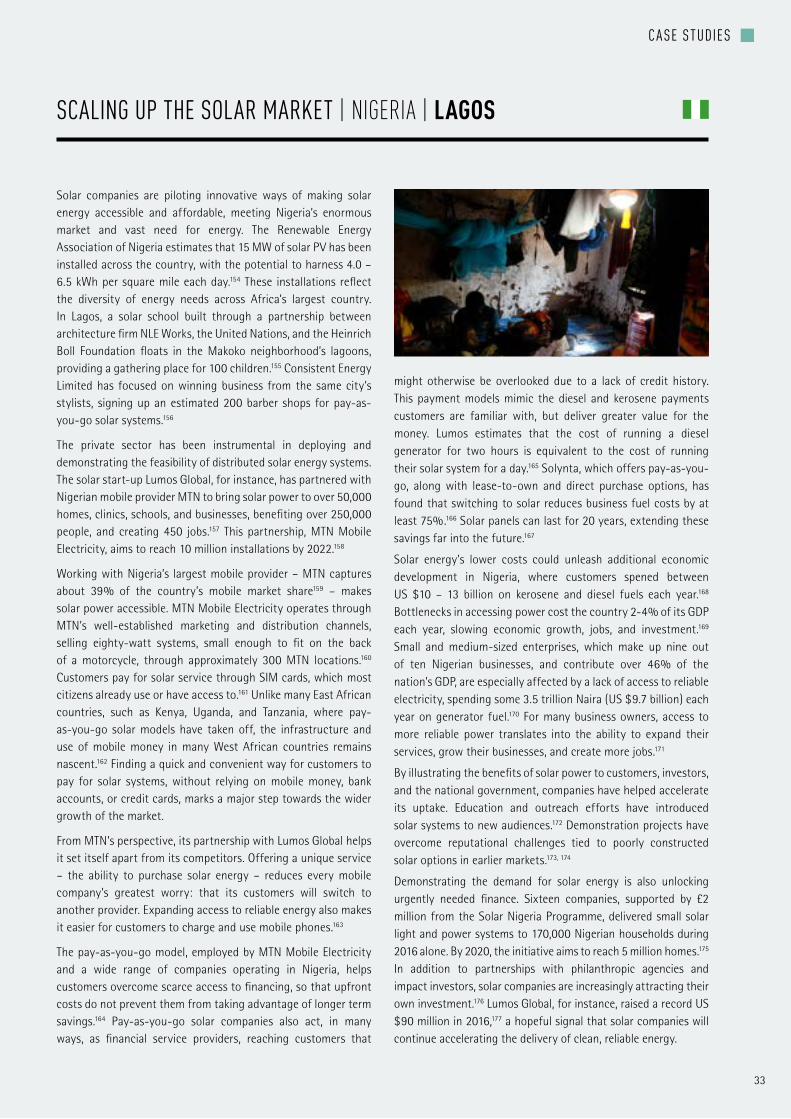
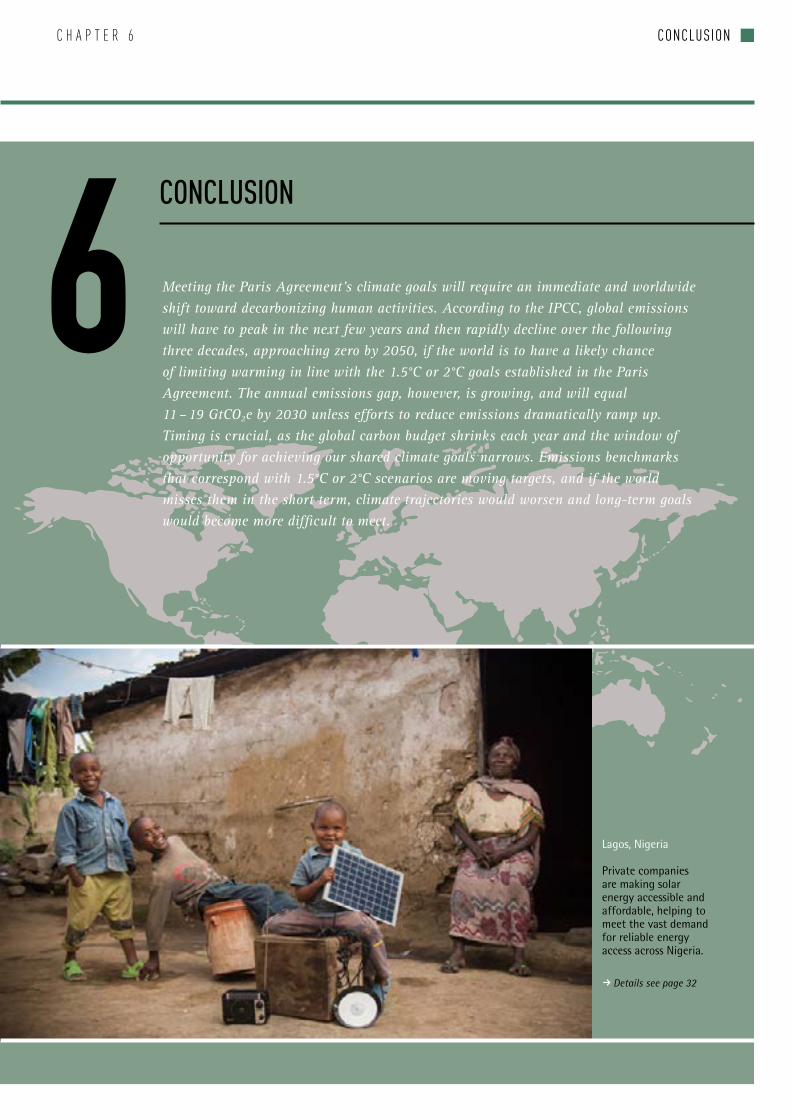
bull In LAGOS and in many other Nigerian cities private companies are piloting new approaches to make solar energy more accessible and affordable A partnership between a solar start-up and local telecommunications provider has brought solar power to 50000 homes clinics schools and businesses benefiting more than 250000 people and creating 450 new jobs
bull Ugandarsquos capital city KAMPALA has partnered with businesses to scale up an array of clean cooking technology initiatives installing 64 improved eco-stoves in 15 public schools constructing biodigesters in 10 public schools and funding companies that train women and youth to produce low-carbon briquettes from organic waste
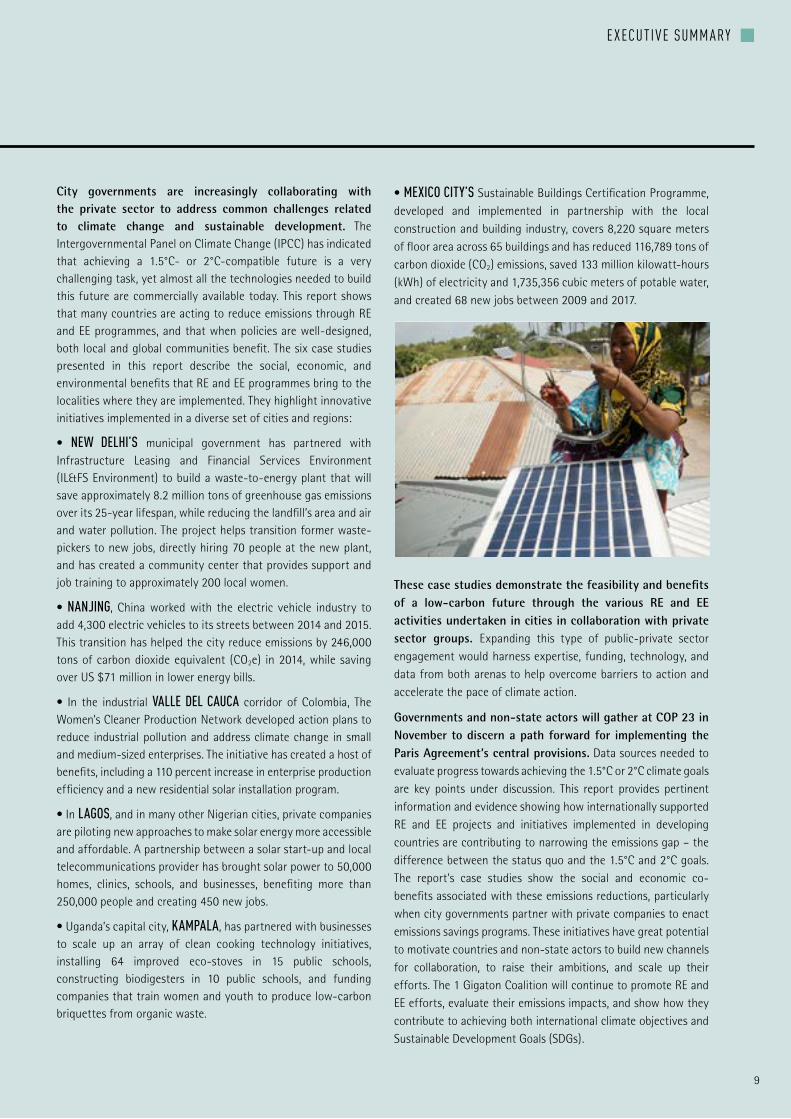
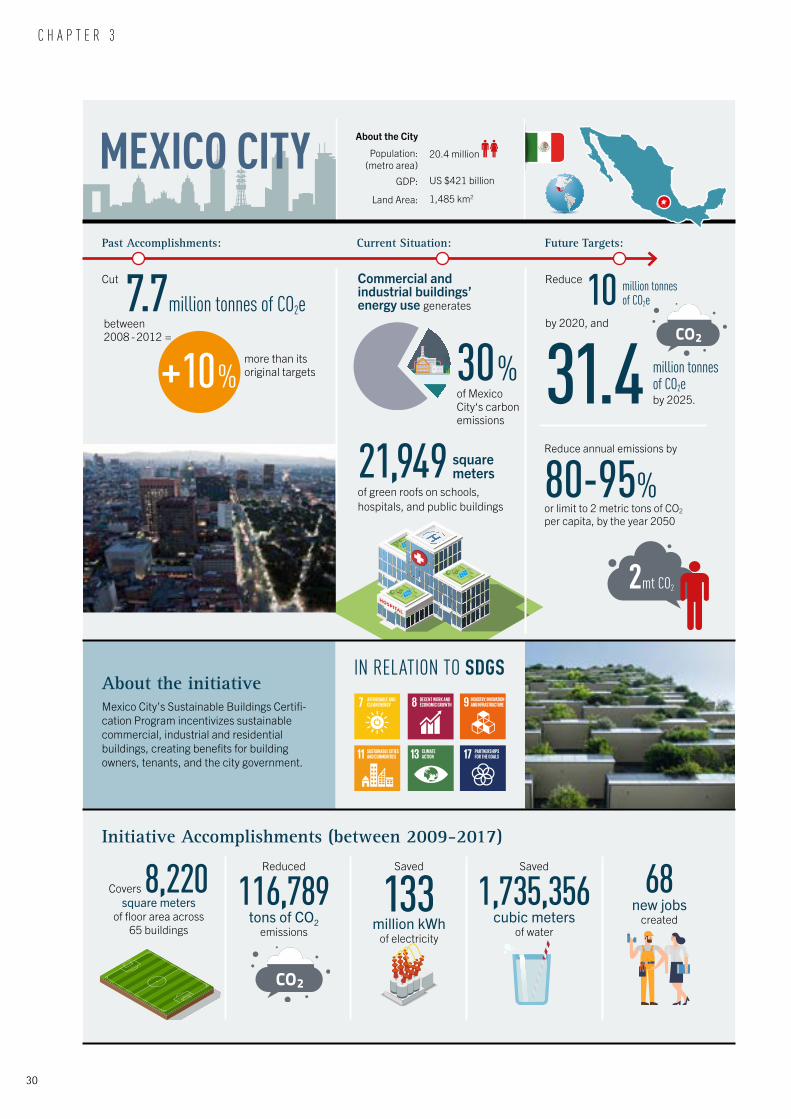
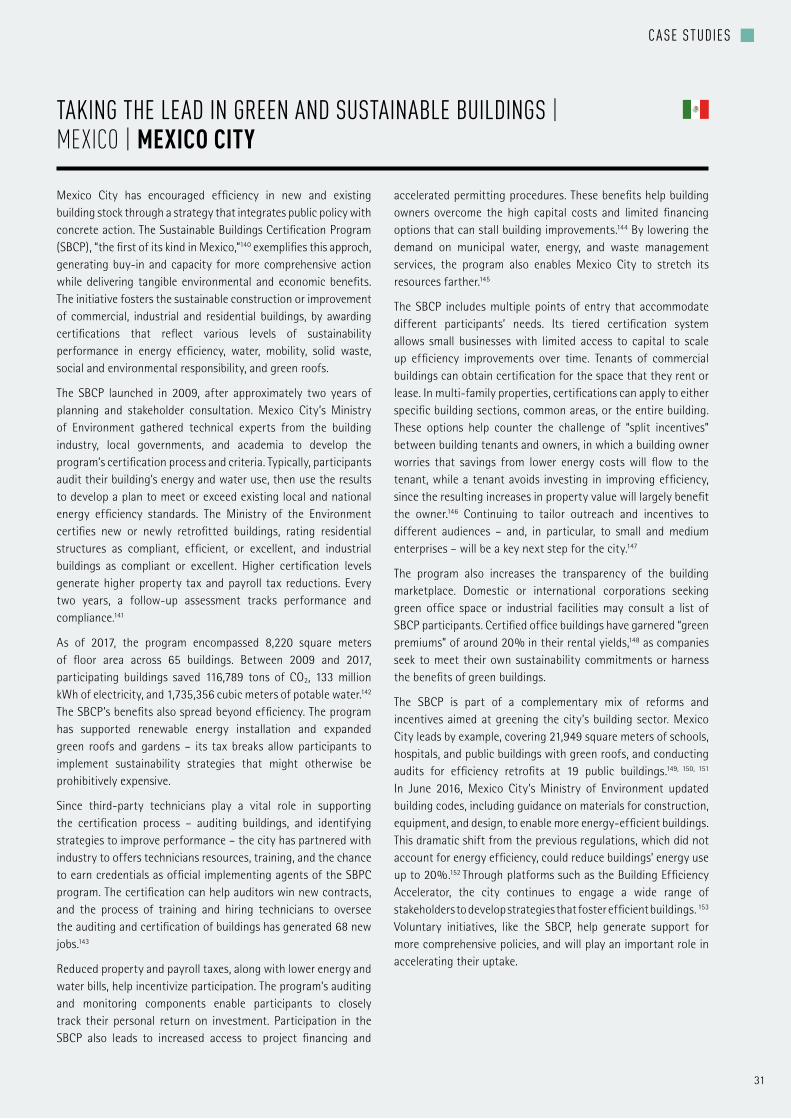
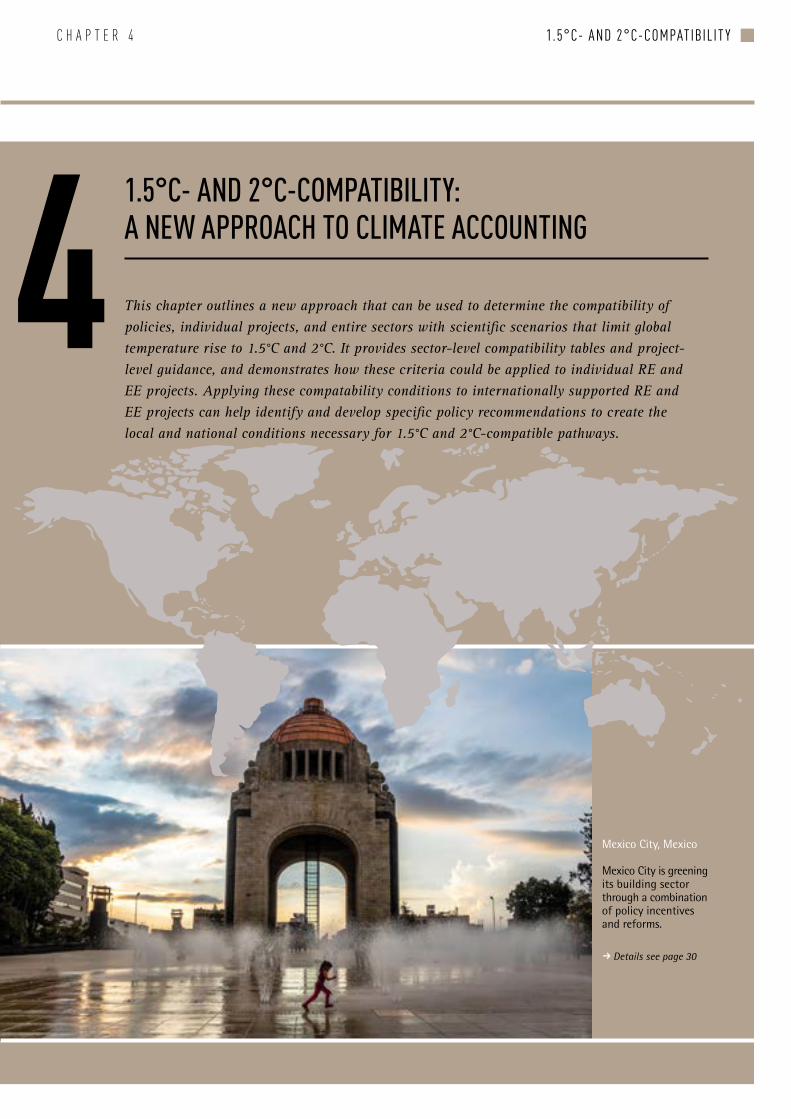
bull MEXICO CITYrsquoS Sustainable Buildings Certification Programme developed and implemented in partnership with the local construction and building industry covers 8220 square meters of floor area across 65 buildings and has reduced 116789 tons of carbon dioxide (CO2) emissions saved 133 million kilowatt-hours (kWh) of electricity and 1735356 cubic meters of potable water and created 68 new jobs between 2009 and 2017
These case studies demonstrate the feasibility and benefits of a low-carbon future through the various RE and EE activities undertaken in cities in collaboration with private sector groups Expanding this type of public-private sector engagement would harness expertise funding technology and data from both arenas to help overcome barriers to action and accelerate the pace of climate action
Governments and non-state actors will gather at COP 23 in November to discern a path forward for implementing the Paris Agreementrsquos central provisions Data sources needed to evaluate progress towards achieving the 15degC or 2degC climate goals are key points under discussion This report provides pertinent information and evidence showing how internationally supported RE and EE projects and initiatives implemented in developing countries are contributing to narrowing the emissions gap ndash the difference between the status quo and the 15degC and 2degC goals The reportrsquos case studies show the social and economic co-benefits associated with these emissions reductions particularly when city governments partner with private companies to enact emissions savings programs These initiatives have great potential to motivate countries and non-state actors to build new channels for collaboration to raise their ambitions and scale up their efforts The 1 Gigaton Coalition will continue to promote RE and EE efforts evaluate their emissions impacts and show how they contribute to achieving both international climate objectives and Sustainable Development Goals (SDGs)
C H A P T E R 1
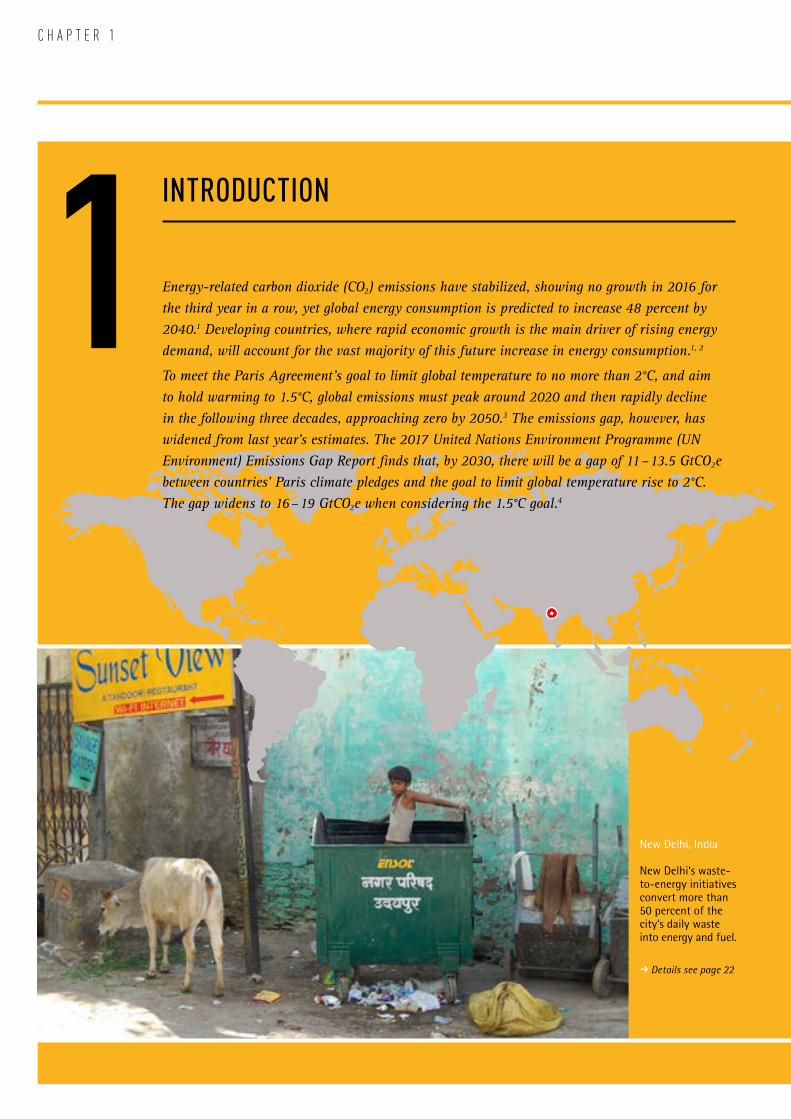
New Delhi India
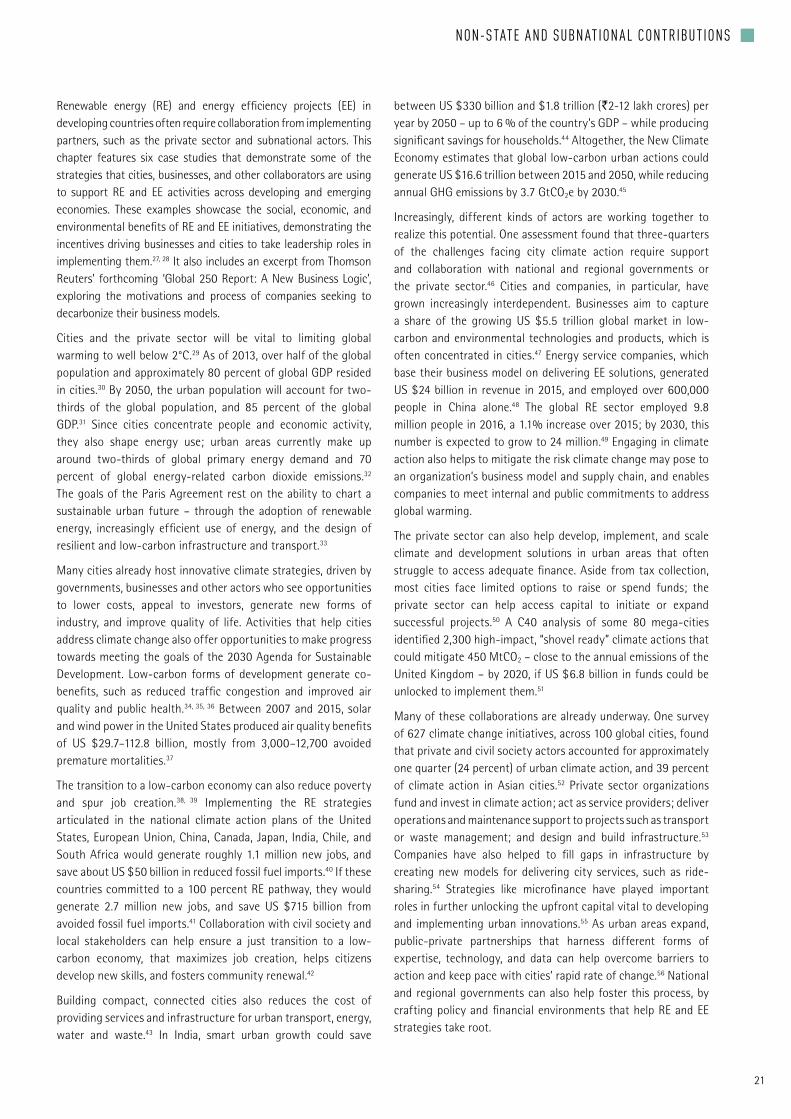
New Delhilsquos waste- to-energy initiatives convert more than 50 percent of the citylsquos daily waste into energy and fuel
R Details see page 22
INTRODUCTION
1 Energy-related carbon dioxide (CO2) emissions have stabilized showing no growth in 2016 for the third year in a row yet global energy consumption is predicted to increase 48 percent by 20401 Developing countries where rapid economic growth is the main driver of rising energy demand will account for the vast majority of this future increase in energy consumption1 2
To meet the Paris Agreementrsquos goal to limit global temperature to no more than 2degC and aim to hold warming to 15degC global emissions must peak around 2020 and then rapidly decline in the following three decades approaching zero by 20503 The emissions gap however has widened from last yearrsquos estimates The 2017 United Nations Environment Programme (UN Environment) Emissions Gap Report finds that by 2030 there will be a gap of 11 ndash 135 GtCO2e between countriesrsquo Paris climate pledges and the goal to limit global temperature rise to 2degC The gap widens to 16 ndash 19 GtCO2e when considering the 15degC goal4
11
INTRODUCTION g
Renewable energy (RE) and energy efficiency (EE) projects in developing countries are crucial means of narrowing the emissions gap and decarbonzing future energy growth In 2016 a record 1385 gigawatts (GW) of new capacity of RE was installed mostly in developing countries and emerging economies some of which have become key market players5 Evaluating how RE and EE projects translate to measurable emissions reductions to closing the emissions gap and to creating a 15degC or 2degC compatible future is the focus of this report
The climate imperative is clear we must act now and with ambition to decarbonize human activities in order to meet global climate goals The latest climate scenarios produced by the worldrsquos leading international scientific bodies show that our window to prevent dangerous global warming is rapidly narrowing as humanityrsquos carbon budget ndash the total amount of carbon dioxide that can be emitted for a likely chance of limiting global temperature rise ndash diminishes year on year The Intergovernmental Panel on Climate Change (IPCC) found in its Fifth Assessment Report (2014) that the world will warm by between 37degC to 48degC by 2100 if humanity pursues a ldquobusiness as usualrdquo pathway This level of warming scientists agree would be disastrous for human civilization To give us a better than 66 chance to limit global warming below 2degC ndash the scientific communityrsquos agreed upon threshold for what societies could reasonably manage ndash the IPCC reports that atmospheric CO2 concentrations cannot exceed 450 ppm by 2100 This limit means that the worldrsquos carbon budget through the year 2100 is less than 1000 Gt CO2e Considering a 15degC limit our carbon budget falls to under 600 Gt CO2e through 21006
UN Environmentrsquos Emissions Gap Report 2017 which focuses on the gap between the emissions nations have pledged to reduce and the mitigation needed to meet global temperature goals developed a ldquolikelyrdquo (gt66 chance of achieving the target) 2degC warming model under which annual global GHG emissions would need to stabilize around 52 GtCO2e through 2020 and then fall precipitously to 42 GtCO2e by 2030 and 23 GtCO2e by 2050 To have a greater than 50 chance of containing warming to 15degC the 2017 Gap Report projects a greater drop in annual emissions to 36 GtCO2e by 2030 ndash a significantly lower estimate than what the 2016 Emissions Gap report suggested Under both scenarios annual global emissions appear to go negative ndash meaning that more carbon is absorbed than produced ndash by 2100 These projections are starkly divergent from baseline business as usual emissions projections as well as scenarios that account for the Nationally Determined Contributions (NDCs) that countries pledged in the Paris Agreement By 2030 there is a 135 GtCO2e difference between the annual emissions in the 2017 Gap
Reportrsquos unconditional NDC scenarios and its 2degC trajectory and a 19 GtCO2e gap between the NDCs and 15degC trajectories7
This gap points to an urgent need to increase the ambition scope and scale of carbon mitigation efforts worldwide Each sector in every nation must lead the way with ambitious actions to decarbonize and governments must enact plans and policies for sharp emissions reductions if we are to meet the 15degC or 2degC targets Nearly one-half of lower middle income countries (GNI per capita between US $1006 and $3955) and one-fourth of low income countries (GNI per capita less than US $1005) have made RE a primary focus of their NDCs8 One-third of lower middle income countries and 19 percent of low-income countries have adopted EE as a main focal instrument in their NDCs9 Many of these countries lack energy access for the majority of their population suffer from the effects of poor indoor and outdoor air quality and are striving to rapidly develop their economies to reduce poverty ndash needs that can be partly addressed through RE and EE efforts Intergovernmental coordination and support are key catalysts for the requisite RE and EE initiatives as developed nations transfer expertise technologies and funding to developing countries to create enabling environments for carbon-neutral growth Yet beyond global emissions reduction goals what specific targets should nations sectors and individual firms use to guide their actions How do funding organizations policymakers and implementing groups know at what point their operations are compatible with the 15degC and 2degC targets
The growth in RE and EE projects in developing countries in the last decade demonstrates the potential for these efforts to contribute to global climate mitigation and to narrow the emissions gap A lack of data and harmonized accounting methodology however have prevented the bilateral and multilateral organizations that support these efforts from systematically evaluating their impact The 1 Gigaton Coalition supports these organizationsrsquo efforts in developing countries where growth in RE and EE projects have potential to transition economies to low-carbon trajectories The Coalition works to build a robust knowledge base and support the development of harmonized GHG accounting methods These tools will aid analysis of RE and EE initiatives that are not
12
INTRODUCTION gC H A P T E R 1
+2degC
First Report | 2015
Narrowing the Emissions Gap Contributions from renewable energy and energy efficiency activities
+2degC
Second Report
Renewable energy and energy efficiency in developing countries contributions to reducing global emissions
2016
directly captured in UN Environmentrsquos Emissions Gap Report or in other assessments of global mitigation efforts Through the compilation and assessment of developing country RE and EE efforts between countries partners and collaborative initiatives the 1 Gigaton Coalition promotes these efforts and strives to measure their contribution to reducing global greenhouse gas emissions reductions
PREVIOUS 1 GIGATON COALITION REPORTSThe 1 Gigaton Coalition has released two reports to date The 1 Gigaton Coalition 2015 report aimed to quantify RE and EE contributions to narrowing the 2020 emissions gap The 2015 report was the first of its kind to assess and quantify RE and EE projectsrsquo global climate mitigation potential This analysis used a comparison between the IEA World Energy Outlook (WEO) current policy scenarios and a no-policy scenario derived from the IPCC scenarios database to estimate the energy sectorrsquos total emissions reductions The analysis found that EE and RE projects in developing countries could result in emission reductions on the order of 4 GtCO2 in 2020 compared to a no-policy baseline scenario
The 1 Gigaton Coalition 2016 report refined the approach developed in the inaugural 2015 report expanding the database of internationally supported RE and EE projects in developing countries from 42 to 224 The larger database includes projects implemented between 2005 and 2015 receiving direct foreign support totalling US $28 billion These projects were estimated to reduce GHG emissions by an aggregate 0116 GtCO2 annually in 2020 Avoided GHG emissions were calculated by multiplying the annual energy saved or substituted by a project (determined for RE projects by using the power generation capacity and the technology- and country-specific capacity factors and for EE projects through a projectrsquos documentation) by country-specific grid electricity CO2 emission factors The 2016 report estimated that all internationally supported RE and EE projects would reduce emissions by up to 04 GtCO2 annually in 2020 and that if public finance goals for climate mitigation were met supported projects could reduce emissions by 1 GtCO2 per year in 2020
OVERVIEW OF THE 1 GIGATON COALITION 2017 REPORTThe 1 Gigaton Coalition 2017 report builds upon the first two reports further expanding the database of RE and EE projects from developing countries to calculate the mitigation impact of 273 internationally supported projects in developing countries These projects including 197 RE 62 EE and 14 RE and EE activities are located in 99 countries and supported by 12 bilateral funding agencies and 16 multilateral development banks and partnerships They are categorized for the technologies used to replace fossil fuel energy production with clean energy (ie solar wind biomass and hydroelectricity) and reduce energy consumption in the industrial building and transport sectors In total these projects received US $32 billion in direct foreign support
Evaluating RE and EE projectsrsquo mitigation impact is important to shed light on whether these efforts are reducing global emissions An essential question is whether these efforts lead to long-term decarbonization or low-carbon pathways that are compatible with global goals to limit temperature rise to 15degC and 2degC The 1 Gigaton Coalition 2017 report synthesizes a methodological approach to evaluate the 15degC- and 2degC-compatibility of RE and EE projects intending to guide bilateral and multilateral partners and implementing countries in determining which policies individual projects and entire sectors are consistent with 15degC and 2degC scenarios Drawing from other research initiatives and the International Energy Agencyrsquos (IEA) 2017 Energy Technologies Perspective (ETP) report this analysis provides criteria for 15degC and 2degC-compatibility at the sector level and demonstrates how these criteria could be applied to RE and EE projects
Providing real world examples of RE and EE initiatives in developing countries this report features six in-depth case studies of ongoing programmes and policies in cities throughout the world These case studies demonstrate the compounding benefits to human health the economy and environment that result from smartly planned RE and EE efforts The cases feature collaborative initiatives in which the public sector and private companies work together to develop implement and scale climate action
This report is organized as follows
Chapter 2 provides an overview of the current landscape of RE and EE policies in developing countries Chapter 3 presents six case studies that explore RE and EE programmes that engage the private sector to develop and implement renewable energy and energy efficiency activities The case studies highlight the multiple benefits these initiatives garner across the various cities and regions where they are implemented This chapter also includes a discussion by Thomson Reuters of the emerging low-carbon business paradigm Chapter 4 describes the 15degC- and 2degC-compatibility methods and applications developed for this report providing sector-level compatibility tables and project-level guidance Chapter 5 provides an assessment of the GHG emissions mitigation from RE and EE projects in developing countries based on calculations derived from a project database built for this report Chapter 6 concludes with the reportrsquos key implications for policymakers RE and EE supporting partners and climate actors
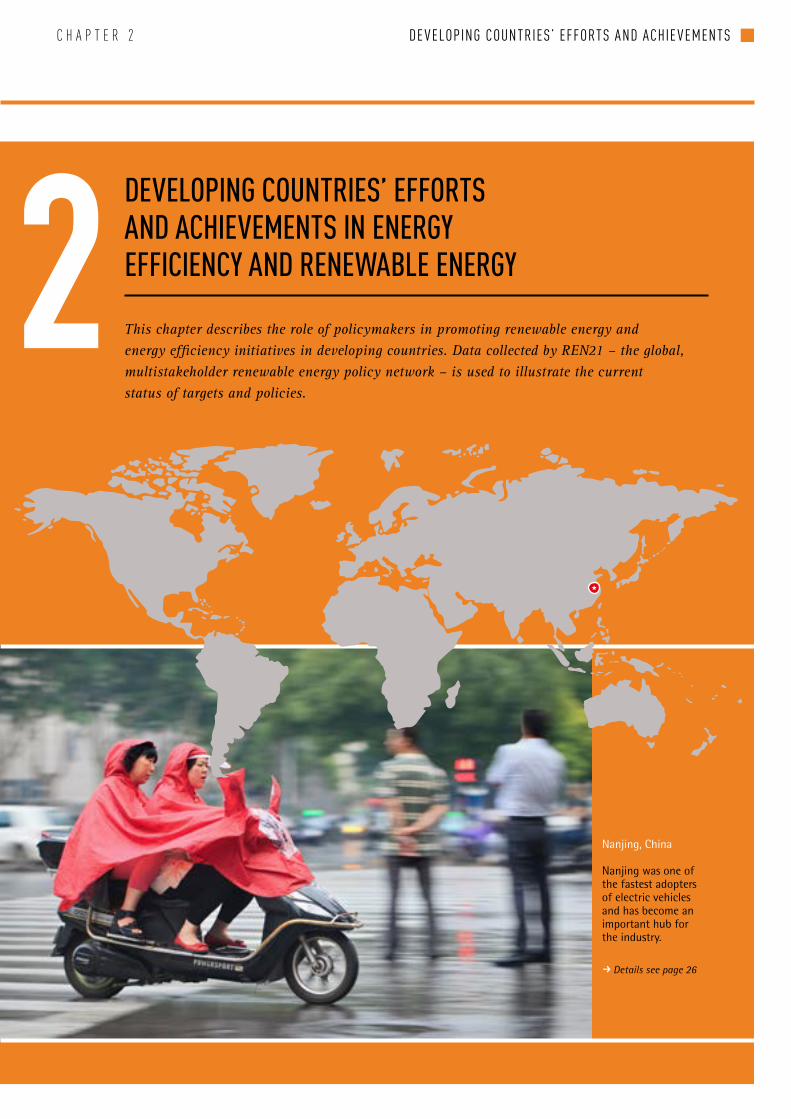
Nanjing China
Nanjing was one of the fastest adopters of electric vehicles and has become an important hub for the industry
R Details see page 26
DE VELOPING COUNTRIESrsquo EFFORTS AND ACHIE VEMENTS gC H A P T E R 2
DEVELOPING COUNTRIESrsquo EFFORTS AND ACHIEVEMENTS IN ENERGY EFFICIENCY AND RENEWABLE ENERGY2 This chapter describes the role of policymakers in promoting renewable energy and energy efficiency initiatives in developing countries Data collected by REN21 ndash the global multistakeholder renewable energy policy network ndash is used to illustrate the current status of targets and policies
14
C H A P T E R 2
21 POLICY DEVELOPMENTRenewable energy (RE) and energy efficiencyrsquos (EE) increasingly vital role in the rapid transformation of the energy sectors of industrialized emerging and developing countries continues to be stimulated in part by government actions to incentivize new technology development and deployment Policymakers have adopted a mix of policies and targets to deploy RE and EE to expand energy access provide more reliable energy services and meet growing energy demand while often simultaneously seeking to advance research and development into more advanced fuels and technologies
Recognizing the complementary nature of RE and EE at least 103 countries addressed EE and RE in the same government agency including at least 79 developing and emerging countries while an estimated 81 countries had policies or programmes combining support to both sets of technologies including approximately 75 developing or emerging countries
Adopted together RE and EE can more rapidly help meet national development goals including increasing energy security enhancing industrial competitiveness reducing pollution and environmental degradation expanding energy access and driving economic growth This can be achieved through sector-wide planning such as Chinarsquos 13th Five Year Plan adopted in 2016 which includes specific goals for both RE and EE
Indirect policy support including the removal of fossil fuel subsidies and the enactment of carbon pricing mechanisms such as carbon taxes emission trading systems and crediting approaches can also benefit the RE and EE sectors Carbon pricing policies if designed
effectively may incentivize renewable energy development and deployment across sectors by increasing the comparative costs of higher-emission technologies The removal of fossil fuel subsidies also may level the financial playing field for energy technologies as fossil fuel subsidies remain significantly higher than subsidies for renewables with estimates of the former being at least more than twice as high as those for RE This estimate rises to ten times higher when the cost of externalities and direct payments are included
Developing countries led the way on initiating subsidy reform in 2016 with 19 countries adopting some form of reduction or removal Similarly by year-end 2016 Group of 20 (G20) and Asia-Pacific Economic Cooperation (APEC) initiatives had led to 50 countries committing to phasing out fossil fuel subsidies
211 TARGETSTargets are an important tool used by policymakers to outline development strategies and encourage investment in EE and RE technologies Targets are set in a variety of ways from all-encompassing economy-wide shares of capacity generation or efficiency to calling for specific technology deployments or new developments in targeted sectors Similarly policymakers at all levels from local to stateprovincial regional and national have adopted targets to outline sector development priorities
Nearly all nations around the world have now adopted RE targets aiming for specified shares production or capacity of RE technologies Targets for RE at the national or stateprovincial level are now found in 124 developing and emerging countries
15
DE VELOPING COUNTRIESrsquo EFFORTS AND ACHIE VEMENTS g
24 33
113
53
2212
TransportHeating and Cooling
Electricity Both Final amp Primary Energy
FinalEnergy
PrimaryEnergy
Number of developing and emerging economies with RE targets by sector and type end-2016
0
20
40
60
80
120
100
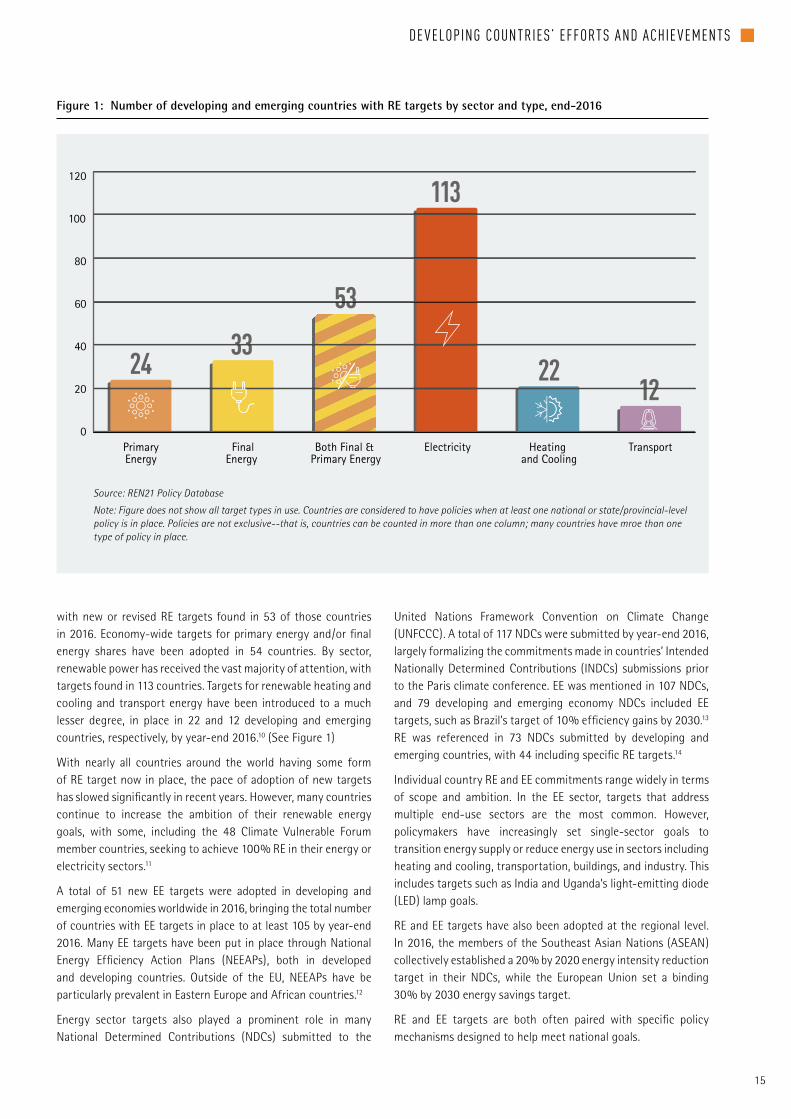
Figure 1 Number of developing and emerging countries with RE targets by sector and type end-2016
Source REN21 Policy Database
Note Figure does not show all target types in use Countries are considered to have policies when at least one national or stateprovincial-level policy is in place Policies are not exclusive--that is countries can be counted in more than one column many countries have mroe than one type of policy in place
with new or revised RE targets found in 53 of those countries in 2016 Economy-wide targets for primary energy andor final energy shares have been adopted in 54 countries By sector renewable power has received the vast majority of attention with targets found in 113 countries Targets for renewable heating and cooling and transport energy have been introduced to a much lesser degree in place in 22 and 12 developing and emerging countries respectively by year-end 201610 (See Figure 1)
With nearly all countries around the world having some form of RE target now in place the pace of adoption of new targets has slowed significantly in recent years However many countries continue to increase the ambition of their renewable energy goals with some including the 48 Climate Vulnerable Forum member countries seeking to achieve 100 RE in their energy or electricity sectors11
A total of 51 new EE targets were adopted in developing and emerging economies worldwide in 2016 bringing the total number of countries with EE targets in place to at least 105 by year-end 2016 Many EE targets have been put in place through National Energy Efficiency Action Plans (NEEAPs) both in developed and developing countries Outside of the EU NEEAPs have be particularly prevalent in Eastern Europe and African countries12
Energy sector targets also played a prominent role in many National Determined Contributions (NDCs) submitted to the
United Nations Framework Convention on Climate Change (UNFCCC) A total of 117 NDCs were submitted by year-end 2016 largely formalizing the commitments made in countriesrsquo Intended Nationally Determined Contributions (INDCs) submissions prior to the Paris climate conference EE was mentioned in 107 NDCs and 79 developing and emerging economy NDCs included EE targets such as Brazilrsquos target of 10 efficiency gains by 203013 RE was referenced in 73 NDCs submitted by developing and emerging countries with 44 including specific RE targets14
Individual country RE and EE commitments range widely in terms of scope and ambition In the EE sector targets that address multiple end-use sectors are the most common However policymakers have increasingly set single-sector goals to transition energy supply or reduce energy use in sectors including heating and cooling transportation buildings and industry This includes targets such as India and Ugandarsquos light-emitting diode (LED) lamp goals
RE and EE targets have also been adopted at the regional level In 2016 the members of the Southeast Asian Nations (ASEAN) collectively established a 20 by 2020 energy intensity reduction target in their NDCs while the European Union set a binding 30 by 2030 energy savings target
RE and EE targets are both often paired with specific policy mechanisms designed to help meet national goals
16
C H A P T E R 2
Countries with policiesand targets
Countries with policiesno targets (or no data)
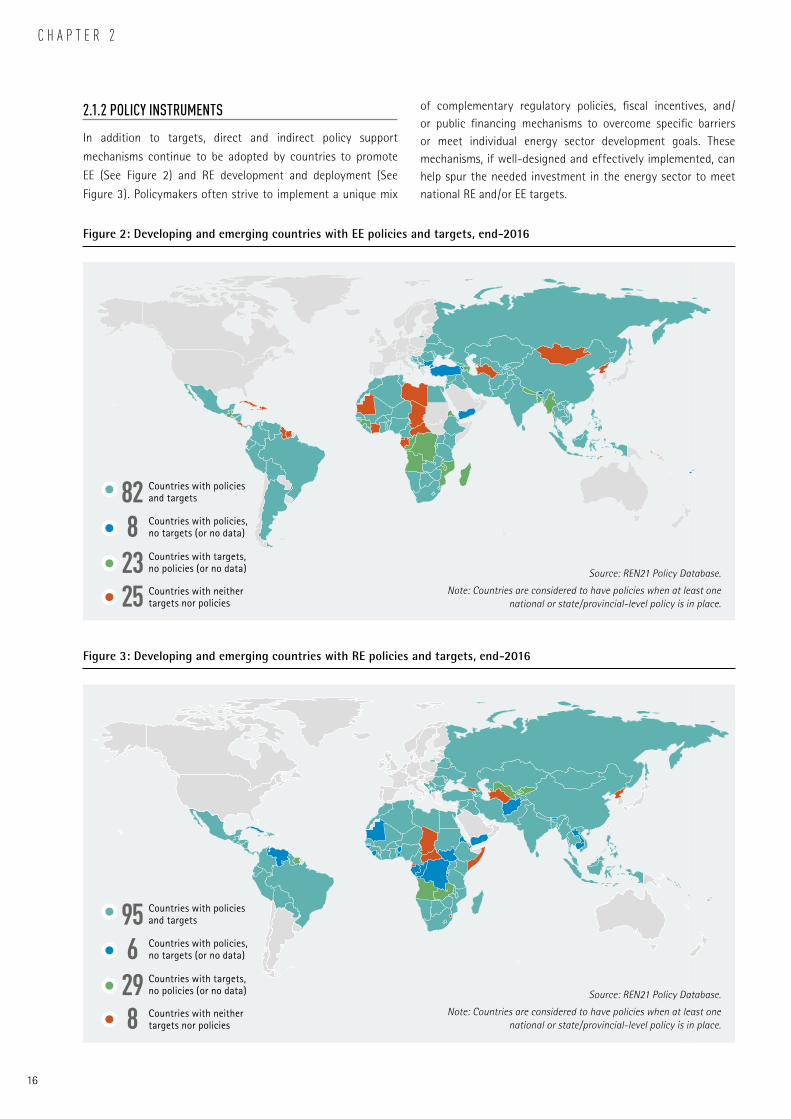
828
Countries with targetsno policies (or no data)23Countries with neither targets nor policies25
Figure 2 Developing and emerging countries with EE policies and targets end-2016
Source REN21 Policy Database
Note Countries are considered to have policies when at least one national or stateprovincial-level policy is in place
Countries with policiesand targets
Countries with policiesno targets (or no data)
956
Countries with targetsno policies (or no data)29
8 Countries with neithertargets nor policies
Figure 3 Developing and emerging countries with RE policies and targets end-2016
Source REN21 Policy Database
Note Countries are considered to have policies when at least one national or stateprovincial-level policy is in place
212 POLICY INSTRUMENTS
In addition to targets direct and indirect policy support
mechanisms continue to be adopted by countries to promote
EE (See Figure 2) and RE development and deployment (See
Figure 3) Policymakers often strive to implement a unique mix
of complementary regulatory policies fiscal incentives andor public financing mechanisms to overcome specific barriers or meet individual energy sector development goals These mechanisms if well-designed and effectively implemented can help spur the needed investment in the energy sector to meet national RE andor EE targets
17
DE VELOPING COUNTRIESrsquo EFFORTS AND ACHIE VEMENTS g
Number of mandatory targets
Number of new targets
TOTAL TARGETS
Number of awareness campaigns
Number of funds
Number of new policies
TOTAL POLICIES
0 4020 60 80 100 120
2851
105
4740
4190
Figure 4 Number of developing and emerging countries with EE targets and policies end-2016
Source REN21 Policy Database
Note Numbers indicate countries where targets and policies have been identified but not necessarily the total number of countries with policies in place
RE and EE are often adopted through differing mechanisms EE-specific promotion policies often take the shape of standards labels and codes or monitoring and auditing program while RE is often promoted through feed-in tariffs tendering or net metering Policymakers have also turned to similar mechanisms such as mandates and fiscal incentives to promote both RE and EE
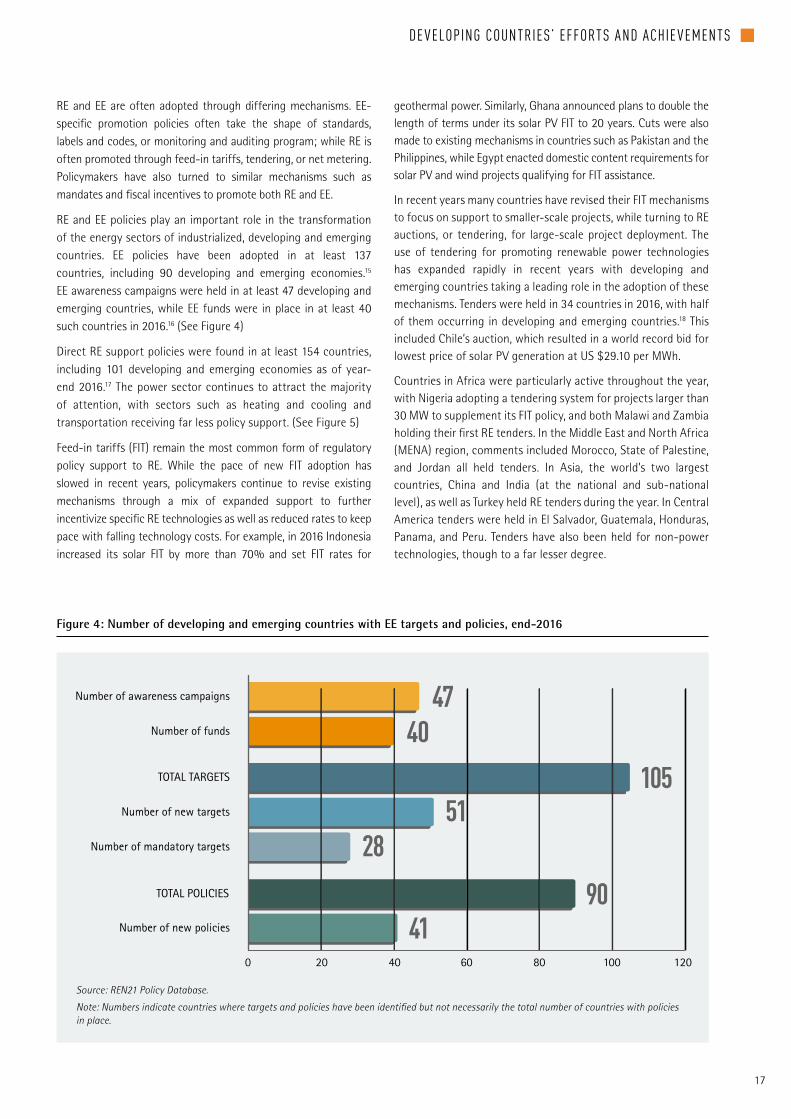
RE and EE policies play an important role in the transformation of the energy sectors of industrialized developing and emerging countries EE policies have been adopted in at least 137 countries including 90 developing and emerging economies15 EE awareness campaigns were held in at least 47 developing and emerging countries while EE funds were in place in at least 40 such countries in 201616 (See Figure 4)
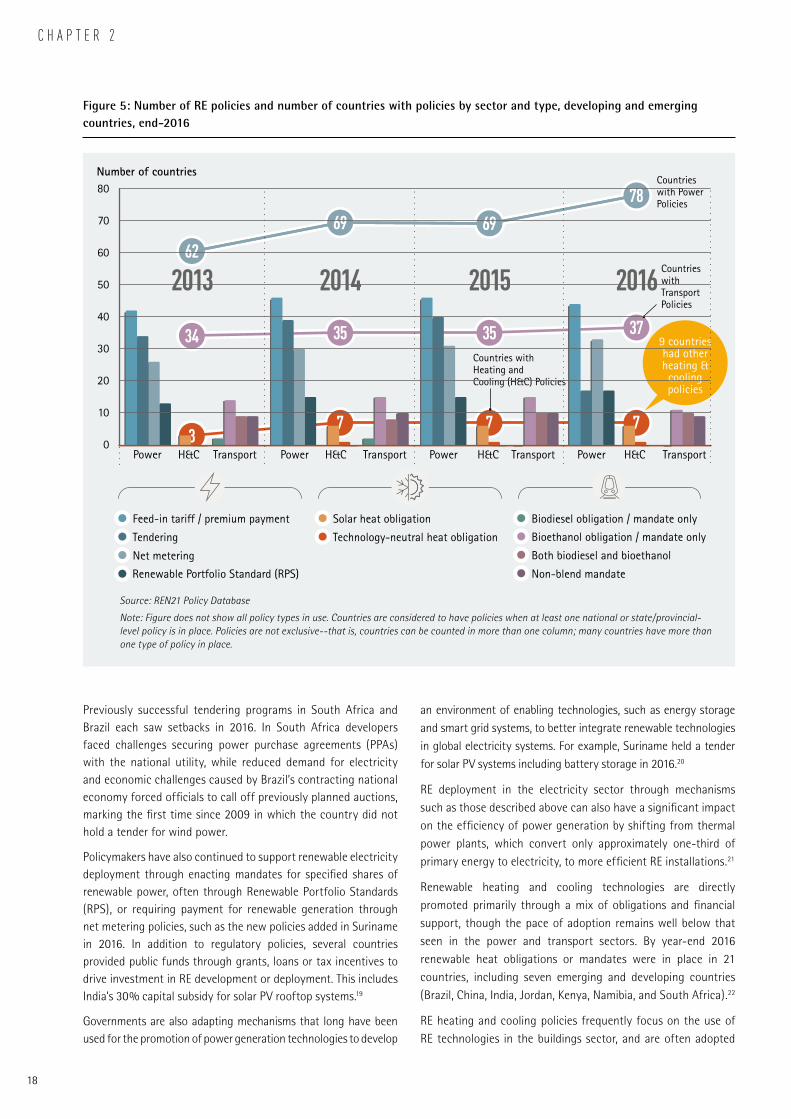
Direct RE support policies were found in at least 154 countries including 101 developing and emerging economies as of year-end 201617 The power sector continues to attract the majority of attention with sectors such as heating and cooling and transportation receiving far less policy support (See Figure 5)
Feed-in tariffs (FIT) remain the most common form of regulatory policy support to RE While the pace of new FIT adoption has slowed in recent years policymakers continue to revise existing mechanisms through a mix of expanded support to further incentivize specific RE technologies as well as reduced rates to keep pace with falling technology costs For example in 2016 Indonesia increased its solar FIT by more than 70 and set FIT rates for
geothermal power Similarly Ghana announced plans to double the length of terms under its solar PV FIT to 20 years Cuts were also made to existing mechanisms in countries such as Pakistan and the Philippines while Egypt enacted domestic content requirements for solar PV and wind projects qualifying for FIT assistance
In recent years many countries have revised their FIT mechanisms to focus on support to smaller-scale projects while turning to RE auctions or tendering for large-scale project deployment The use of tendering for promoting renewable power technologies has expanded rapidly in recent years with developing and emerging countries taking a leading role in the adoption of these mechanisms Tenders were held in 34 countries in 2016 with half of them occurring in developing and emerging countries18 This included Chilersquos auction which resulted in a world record bid for lowest price of solar PV generation at US $2910 per MWh
Countries in Africa were particularly active throughout the year with Nigeria adopting a tendering system for projects larger than 30 MW to supplement its FIT policy and both Malawi and Zambia holding their first RE tenders In the Middle East and North Africa (MENA) region comments included Morocco State of Palestine and Jordan all held tenders In Asia the worldrsquos two largest countries China and India (at the national and sub-national level) as well as Turkey held RE tenders during the year In Central America tenders were held in El Salvador Guatemala Honduras Panama and Peru Tenders have also been held for non-power technologies though to a far lesser degree
18
C H A P T E R 2
Number of countries
Power0
10
20
30
40
50
60
70
80
TransportHampC Power TransportHampC Power TransportHampC Power TransportHampC
2013 2014 2015 2016
Feed-in tariff premium payment
Tendering
Net metering
Renewable Portfolio Standard (RPS)
Solar heat obligation
Technology-neutral heat obligation
Biodiesel obligation mandate only
Bioethanol obligation mandate only
Both biodiesel and bioethanol
Non-blend mandate
Countries with PowerPolicies
Countries withTransportPolicies
Countries with Heating and Cooling (HampC) Policies
7
62
34
69
35
69
35
7
78
37
73
9 countries had other heating amp cooling policies
Figure 5 Number of RE policies and number of countries with policies by sector and type developing and emerging countries end-2016
Source REN21 Policy Database
Note Figure does not show all policy types in use Countries are considered to have policies when at least one national or stateprovincial-level policy is in place Policies are not exclusive--that is countries can be counted in more than one column many countries have more than one type of policy in place
Previously successful tendering programs in South Africa and Brazil each saw setbacks in 2016 In South Africa developers faced challenges securing power purchase agreements (PPAs) with the national utility while reduced demand for electricity and economic challenges caused by Brazilrsquos contracting national economy forced officials to call off previously planned auctions marking the first time since 2009 in which the country did not hold a tender for wind power
Policymakers have also continued to support renewable electricity deployment through enacting mandates for specified shares of renewable power often through Renewable Portfolio Standards (RPS) or requiring payment for renewable generation through net metering policies such as the new policies added in Suriname in 2016 In addition to regulatory policies several countries provided public funds through grants loans or tax incentives to drive investment in RE development or deployment This includes Indiarsquos 30 capital subsidy for solar PV rooftop systems19
Governments are also adapting mechanisms that long have been used for the promotion of power generation technologies to develop
an environment of enabling technologies such as energy storage and smart grid systems to better integrate renewable technologies in global electricity systems For example Suriname held a tender for solar PV systems including battery storage in 201620
RE deployment in the electricity sector through mechanisms such as those described above can also have a significant impact on the efficiency of power generation by shifting from thermal power plants which convert only approximately one-third of primary energy to electricity to more efficient RE installations21
Renewable heating and cooling technologies are directly promoted primarily through a mix of obligations and financial support though the pace of adoption remains well below that seen in the power and transport sectors By year-end 2016 renewable heat obligations or mandates were in place in 21 countries including seven emerging and developing countries (Brazil China India Jordan Kenya Namibia and South Africa)22
RE heating and cooling policies frequently focus on the use of RE technologies in the buildings sector and are often adopted
19
DE VELOPING COUNTRIESrsquo EFFORTS AND ACHIE VEMENTS g
in concert with building efficiency policies and regulations23 Several countries advanced EE through new or updated building codes in 2016 of which 139 are in place worldwide at the national and sub-national level including in at least 9 developing and emerging countries24 This includes Indonesiarsquos efforts to develop a Green Building Code and members of the Economic Community of West African States (ECOWAS) implementing building codes in accordance with a regional directive
Specific financial incentives including grants loans or tax incentives targeted at renewable heating and cooling technologies have been adopted in at least 8 developing and emerging economies In certain cases such as in Bulgaria support to RE heating technologies are included in broader EE financial support programs New developments in 2016 included Chilersquos extension of its solar thermal tax credit and Indiarsquos new loan incentives for solar process heat developers Renewable energy tendering has also been used to scale up deployment in the sector Bids for South Africarsquos long-awaited solar water heater tender closed in early-2016
The industrial sector also has a significant EE policy focus however the development of targeted mechanisms for the promotion of RE in industrial processes remains a challenge for policy makers For EE both Mali and Morocco now require energy audits for large industrial energy users
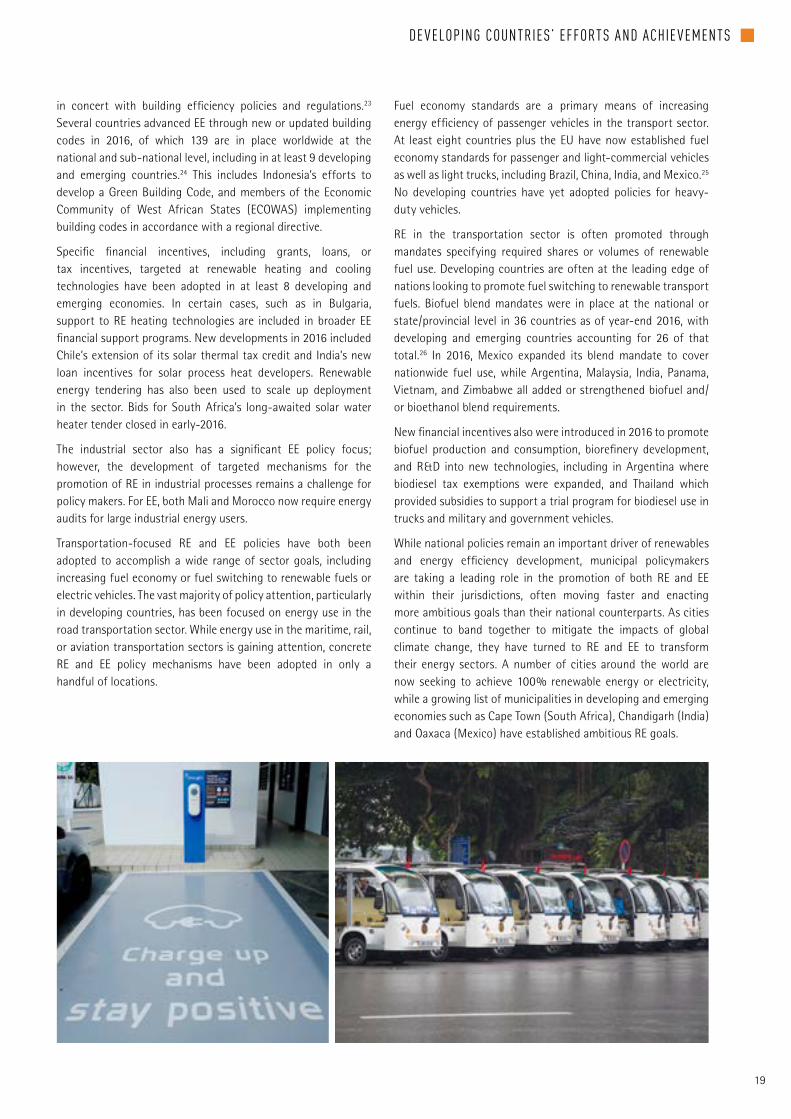
Transportation-focused RE and EE policies have both been adopted to accomplish a wide range of sector goals including increasing fuel economy or fuel switching to renewable fuels or electric vehicles The vast majority of policy attention particularly in developing countries has been focused on energy use in the road transportation sector While energy use in the maritime rail or aviation transportation sectors is gaining attention concrete RE and EE policy mechanisms have been adopted in only a handful of locations
Fuel economy standards are a primary means of increasing energy efficiency of passenger vehicles in the transport sector At least eight countries plus the EU have now established fuel economy standards for passenger and light-commercial vehicles as well as light trucks including Brazil China India and Mexico25 No developing countries have yet adopted policies for heavy-duty vehicles
RE in the transportation sector is often promoted through mandates specifying required shares or volumes of renewable fuel use Developing countries are often at the leading edge of nations looking to promote fuel switching to renewable transport fuels Biofuel blend mandates were in place at the national or stateprovincial level in 36 countries as of year-end 2016 with developing and emerging countries accounting for 26 of that total26 In 2016 Mexico expanded its blend mandate to cover nationwide fuel use while Argentina Malaysia India Panama Vietnam and Zimbabwe all added or strengthened biofuel andor bioethanol blend requirements
New financial incentives also were introduced in 2016 to promote biofuel production and consumption biorefinery development and RampD into new technologies including in Argentina where biodiesel tax exemptions were expanded and Thailand which provided subsidies to support a trial program for biodiesel use in trucks and military and government vehicles
While national policies remain an important driver of renewables and energy efficiency development municipal policymakers are taking a leading role in the promotion of both RE and EE within their jurisdictions often moving faster and enacting more ambitious goals than their national counterparts As cities continue to band together to mitigate the impacts of global climate change they have turned to RE and EE to transform their energy sectors A number of cities around the world are now seeking to achieve 100 renewable energy or electricity while a growing list of municipalities in developing and emerging economies such as Cape Town (South Africa) Chandigarh (India) and Oaxaca (Mexico) have established ambitious RE goals
C H A P T E R 3
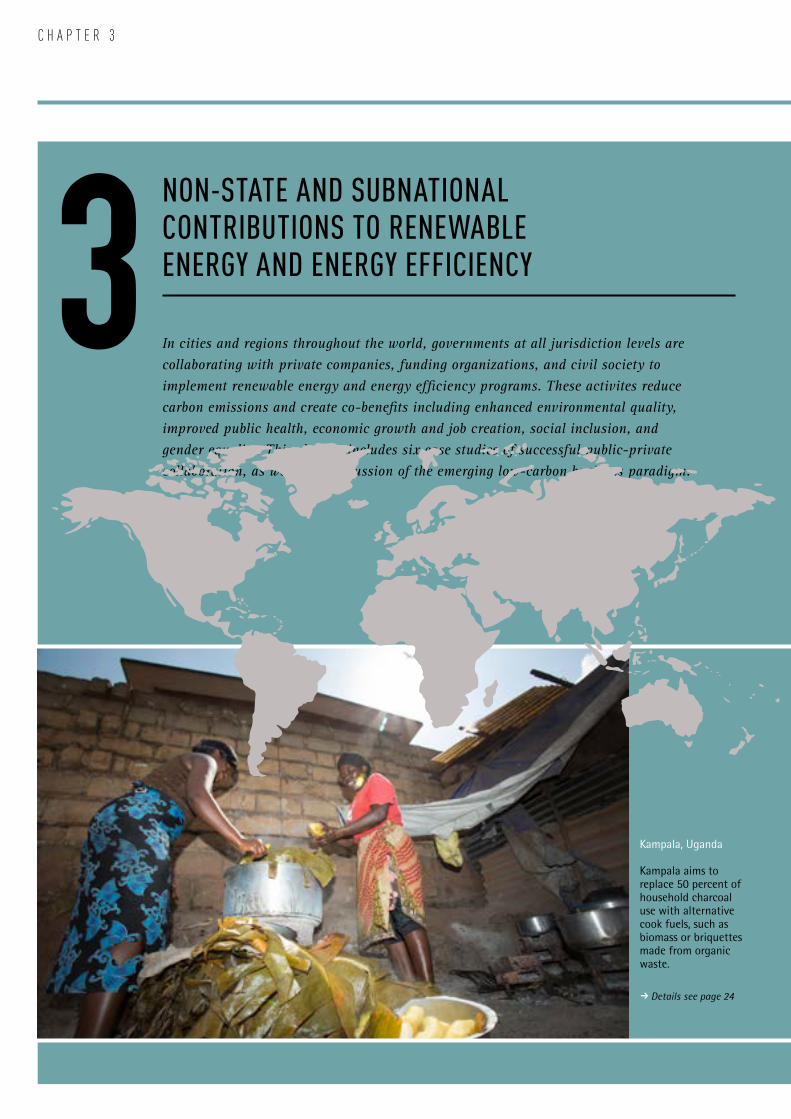
Kampala Uganda
Kampala aims to replace 50 percent of household charcoal use with alternative cook fuels such as biomass or briquettes made from organic waste
R Details see page 24
NON-STATE AND SUBNATIONAL CONTRIBUTIONS TO RENEWABLE ENERGY AND ENERGY EFFICIENCY3 In cities and regions throughout the world governments at all jurisdiction levels are collaborating with private companies funding organizations and civil society to implement renewable energy and energy efficiency programs These activites reduce carbon emissions and create co-benefits including enhanced environmental quality improved public health economic growth and job creation social inclusion and gender equality This chapter includes six case studies of successful public-private collaboration as well as a discussion of the emerging low-carbon business paradigm
21
NON-STATE AND SUBNATIONAL CONTRIBUTIONS g
Renewable energy (RE) and energy efficiency projects (EE) in developing countries often require collaboration from implementing partners such as the private sector and subnational actors This chapter features six case studies that demonstrate some of the strategies that cities businesses and other collaborators are using to support RE and EE activities across developing and emerging economies These examples showcase the social economic and environmental benefits of RE and EE initiatives demonstrating the incentives driving businesses and cities to take leadership roles in implementing them27 28 It also includes an excerpt from Thomson Reutersrsquo forthcoming lsquoGlobal 250 Report A New Business Logicrsquo exploring the motivations and process of companies seeking to decarbonize their business models
Cities and the private sector will be vital to limiting global warming to well below 2degC29 As of 2013 over half of the global population and approximately 80 percent of global GDP resided in cities30 By 2050 the urban population will account for two-thirds of the global population and 85 percent of the global GDP31 Since cities concentrate people and economic activity they also shape energy use urban areas currently make up around two-thirds of global primary energy demand and 70 percent of global energy-related carbon dioxide emissions32 The goals of the Paris Agreement rest on the ability to chart a sustainable urban future ndash through the adoption of renewable energy increasingly efficient use of energy and the design of resilient and low-carbon infrastructure and transport33
Many cities already host innovative climate strategies driven by governments businesses and other actors who see opportunities to lower costs appeal to investors generate new forms of industry and improve quality of life Activities that help cities address climate change also offer opportunities to make progress towards meeting the goals of the 2030 Agenda for Sustainable Development Low-carbon forms of development generate co-benefits such as reduced traffic congestion and improved air quality and public health34 35 36 Between 2007 and 2015 solar and wind power in the United States produced air quality benefits of US $297ndash1128 billion mostly from 3000ndash12700 avoided premature mortalities37
The transition to a low-carbon economy can also reduce poverty and spur job creation38 39 Implementing the RE strategies articulated in the national climate action plans of the United States European Union China Canada Japan India Chile and South Africa would generate roughly 11 million new jobs and save about US $50 billion in reduced fossil fuel imports40 If these countries committed to a 100 percent RE pathway they would generate 27 million new jobs and save US $715 billion from avoided fossil fuel imports41 Collaboration with civil society and local stakeholders can help ensure a just transition to a low-carbon economy that maximizes job creation helps citizens develop new skills and fosters community renewal42
Building compact connected cities also reduces the cost of providing services and infrastructure for urban transport energy water and waste43 In India smart urban growth could save
between US $330 billion and $18 trillion (₹2-12 lakh crores) per year by 2050 ndash up to 6 of the countryrsquos GDP ndash while producing significant savings for households44 Altogether the New Climate Economy estimates that global low-carbon urban actions could generate US $166 trillion between 2015 and 2050 while reducing annual GHG emissions by 37 GtCO2e by 203045
Increasingly different kinds of actors are working together to realize this potential One assessment found that three-quarters of the challenges facing city climate action require support and collaboration with national and regional governments or the private sector46 Cities and companies in particular have grown increasingly interdependent Businesses aim to capture a share of the growing US $55 trillion global market in low-carbon and environmental technologies and products which is often concentrated in cities47 Energy service companies which base their business model on delivering EE solutions generated US $24 billion in revenue in 2015 and employed over 600000 people in China alone48 The global RE sector employed 98 million people in 2016 a 11 increase over 2015 by 2030 this number is expected to grow to 24 million49 Engaging in climate action also helps to mitigate the risk climate change may pose to an organizationrsquos business model and supply chain and enables companies to meet internal and public commitments to address global warming
The private sector can also help develop implement and scale climate and development solutions in urban areas that often struggle to access adequate finance Aside from tax collection most cities face limited options to raise or spend funds the private sector can help access capital to initiate or expand successful projects50 A C40 analysis of some 80 mega-cities identified 2300 high-impact ldquoshovel readyrdquo climate actions that could mitigate 450 MtCO2 ndash close to the annual emissions of the United Kingdom ndash by 2020 if US $68 billion in funds could be unlocked to implement them51
Many of these collaborations are already underway One survey of 627 climate change initiatives across 100 global cities found that private and civil society actors accounted for approximately one quarter (24 percent) of urban climate action and 39 percent of climate action in Asian cities52 Private sector organizations fund and invest in climate action act as service providers deliver operations and maintenance support to projects such as transport or waste management and design and build infrastructure53 Companies have also helped to fill gaps in infrastructure by creating new models for delivering city services such as ride-sharing54 Strategies like microfinance have played important roles in further unlocking the upfront capital vital to developing and implementing urban innovations55 As urban areas expand public-private partnerships that harness different forms of expertise technology and data can help overcome barriers to action and keep pace with citiesrsquo rapid rate of change56 National and regional governments can also help foster this process by crafting policy and financial environments that help RE and EE strategies take root
Current situation
RRR
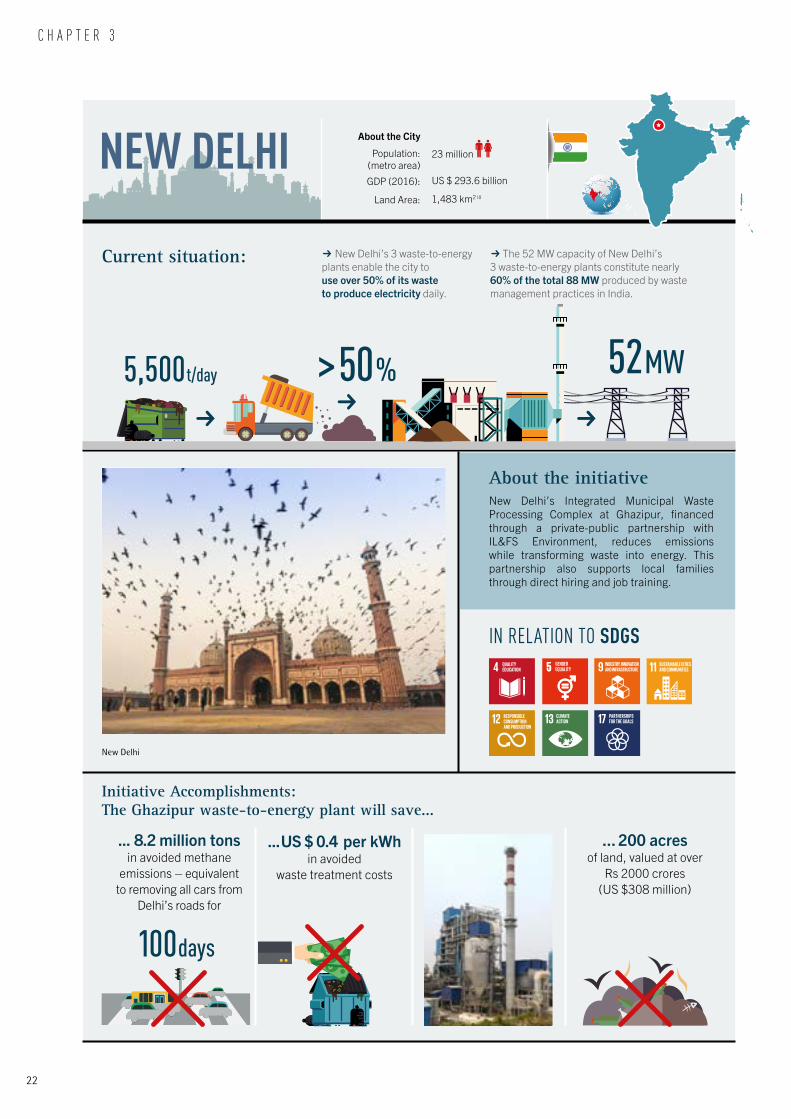
82 million tons in avoided methane
emissions ndash equivalent to removing all cars from
Delhirsquos roads for
US $ 04 per kWh in avoided
waste treatment costs
200 acres of land valued at over
Rs 2000 crores (US $308 million)
New Delhi
22
C H A P T E R 3
About the initiative New Delhirsquos Integrated Municipal Waste Processing Complex at Ghazipur financed through a private-public partnership with ILampFS Environment reduces emissions while transforming waste into energy This partnership also supports local families through direct hiring and job training
NEW DELHI About the City
Population (metro area)
GDP (2016)
Land Area
23 million
US $ 2936 billion
1483 km2 iii
R New Delhirsquos 3 waste-to-energy plants enable the city to use over 50 of its waste to produce electricity daily
R The 52 MW capacity of New Delhirsquos 3 waste-to-energy plants constitute nearly 60 of the total 88 MW produced by waste management practices in India
gt50 5500 tday 52 MW
Initiative Accomplishments The Ghazipur waste-to-energy plant will save
100 days
IN RELATION TO SDGS
23
CASE STUDIES g
Each day the Integrated Municipal Waste Processing Complex at Ghazipur New Delhi receives approximately 2000 tons of waste about 20 of the cityrsquos 9500-ton waste stream57 Through a public-private partnership between the East Delhi Municipal Corporation and the Infrastructure Leasing and Financial Services Environment (ILampFS Environment) the landfill now includes a waste-to-energy plant which generates an annual 12 MW of power58 It also produces 127 tons of fuel an alternative energy source for cement and power plants59 The Ghazipur plant which began operating in November 2015 will save a projected 82 million tons in avoided methane emissions over its 25-year life span60
The projectrsquos benefits extend beyond its climate impacts Reusing waste will prevent 200 acres of urban land valued at over Rs 2000 crores (US $308 million) from being consumed by the landfill61 62 For ILampFS Environment the plant enables it to engage in Indiarsquos environmental goods and services sector estimated to be worth Rs 250 billion (US $39 billion) and projected to grow 10 to 12 annually63 Across its operations the company reuses 95 of every tonne of municipal solid waste through recycled products or energy generation64
Converting waste to energy and avoiding the expansion of the landfill also lowers the health and safety risks of an open solid waste disposal site65 The plant reduces the amount of leachate the landfill generates saving US $04 per kWh in annual treatment costs66 In managing the Ghazipur plant ILampFS Environment relies on best-in-class technology67 and a Continuous Emission Monitoring System which publishes real-time emission parameters online to meet strict air quality standards68
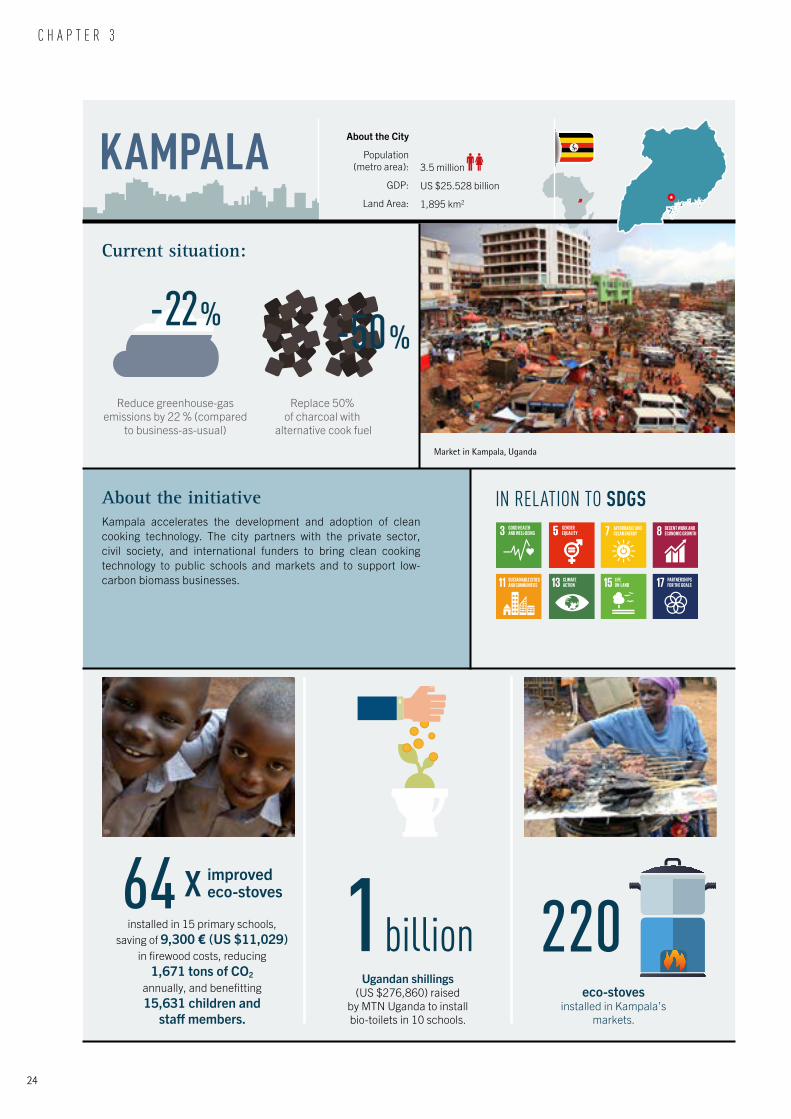
The project also focuses on supporting the surrounding community of 373 local wastepicker families who live near and work in the landfill salvaging and reselling waste Providing support and retraining to local families is critical to efforts that affect access to the landfill and its materials The Ghazipur plant employs over 70 former waste-pickers directly in the plant69 To foster financial inclusion 400 families received bank accounts and Permanent Account Number cards and kiosk banking was provided to the local community through the State Bank of India Since July 2014 2075 bank accounts have been opened70 71
ILampFS Environment also worked with a nonprofit organization Institute for Development Support (IDS) to establish Gulmeher a community center that offers employment and training to approximately 200 local women who previously earned a living collecting waste at the Ghazipur landfill72 The center which launched in May 2013 grew out of brainstorming sessions IDS held with waste-pickers ILampFS Environment and other stakeholders73 74 To help boost their future employability the center provides training in a variety of jobs75 Women reuse materials from a nearby wholesale flower market to create products including boxes cards diyas and natural holi colors76 In mid-2014 the center partnered with Delhi-based start-up Aakar Innovations to produce inexpensive sanitary napkins that low-income women can afford Aakar Innovations helped train the women and buys and re-sells the products they produce77
In 2014 the community organization converted into a private company with participants also acting as shareholders of the Gulmeher Green Producer Company Limited78 Earnings for the participating women average approximately Rs 5000-6000 (US $77-90) every month79 For Badru Nisha the first woman to join the center this income has enabled her to save 70000 Rs (US $1100) and to build a house for relatives80 In India where only 26 of women participate in the labor force compared to almost 75 of men this organization helps build womenrsquos skills and confidence81 82
Without intervention New Delhi is expected to generate roughly 15750 tons of garbage daily in 202183 For cities facing a similar challenge of managing high volumes of waste with limited land the Ghazipur plant offers a successful strategy plans for replicating it are underway in New Delhi and other Indian cities84 The cityrsquos most recently constructed waste-to-management plant Narela-Bawana also relies on a public-private partnership model and produces compost as well as energy85 As the city and its waste stream continue to grow the private sector plays a powerful role in converting challenges into opportunities for development
TRANSFORMING WASTE INTO ENERGY | INDIA | NEW DELHI
Market in Kampala Uganda
24
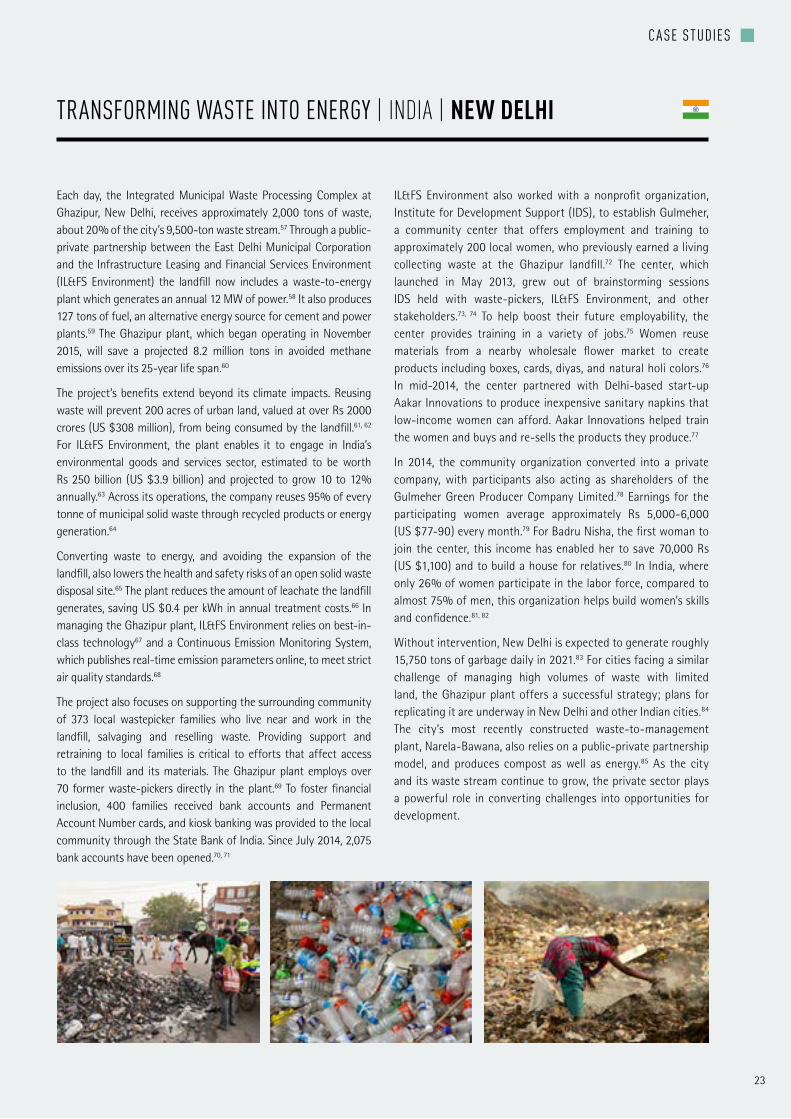
About the initiative Kampala accelerates the development and adoption of clean cooking technology The city partners with the private sector civil society and international funders to bring clean cooking technology to public schools and markets and to support low-carbon biomass businesses
installed in 15 primary schools saving of 9300 euro (US $11029)
in firewood costs reducing 1671 tons of CO2
annually and benefitting 15631 children and
staff members
Ugandan shillings (US $276860) raised
by MTN Uganda to install bio-toilets in 10 schools
eco-stoves installed in Kampalarsquos
markets
improved eco-stoves
KAMPALA
Reduce greenhouse-gas emissions by 22 (compared
to business-as-usual)
Replace 50 of charcoal with
alternative cook fuel
Current situation
-22
About the City
Population (metro area)
GDP
Land Area
35 million
US $25528 billion
1895 km2
-50
C H A P T E R 3
IN RELATION TO SDGS
64 x 2201 billion
25
Kampala has grown rapidly over the past decade becoming home to nearly 2 million people and generating approximately half of Ugandarsquos GDP86 In 2014 the city launched a five-year Climate Change Action Strategy87 to guide its rapid evolution and to ensure it ldquodrives development in the most sustainable wayrdquo88 The plan draws on a diverse array of goals ndash from planting half a million trees to creating traffic-free paths for pedestrians and bicyclists ndash to build Kampalarsquos resilience and protect its most vulnerable populations89
The early years of the Kampalarsquos Climate Change Action Strategy have focused on creating pilot projects and building partnerships that lay the groundwork for expanded action In particular the city has made great strides in implementing a complementary array of clean cooking initiatives Its Climate Change Action Strategy seeks to replace 50 of household charcoal use with alternative cook fuels such as biomass or briquettes made from organic waste90 To pursue this target Kampala provides seed capital and funding to organizations that train youth and women in making biomass briquettes brings biogas digesters and improved cook stoves to public schools and installs eco-stoves at city markets These proof-of-concept demonstrations build confidence and connections with the private sector civil society and bilateral and multilateral funders to help scale up these strategies
MTN Uganda the countryrsquos largest telecommunications company for instance has committed 1 billion Ugandan shillings (US $276860) raised through two annual city marathons to install biogas digesters in 10 public schools91 Their commitment will expand a program piloted at the Kansanga School which turns human animal and food waste into methane gas halving the amount of energy used to cook meals This biogas digester produces approximately 26 MWh annually lowering operating costs and reducing pollution from the firewood or charcoal it replaces92
A collaboration between the Kampala Capital City Authority (KCCA) and French development agency Expertise France supports a complementary effort to bring higher efficiency cooking stoves to 15 new public schools93 with technical support from the Ugandan company SIMOSHI Ltd This effort which has distributed 64 stoves supplied by Uganda Stove Manufacturers Ltd builds on the successful implementation of an eco-stove at another school94 The program has saved schools 9300 euro (US $11029) in firewood costs reduced 1671 tons of CO2 annually and benefitted 15631 children and staff members95 Earnings acquired through the Clean Development Mechanism will be reinvested in the schools to support annual maintenance monitoring and management96 Eventually the project aims to install 1500 stoves in 450 schools benefiting 340000 children and reducing 31286 tonnes of annual CO2 emissions97
Kampala also works with emerging businesses providing seed funding to organizations that train women and youth to produce
low-carbon briquettes from organic waste food scraps and other materials The briquettes burn cleanly without releasing smoke or ash and help avoid deforestation In the words of one customer they are also ldquocheap to use time-saving and energy-savingrdquo98 The briquettes have gained popularity with restaurants hotels households and poultry farmers Kampalarsquos administration is developing a program to further expand the supply of low-carbon fuel and connect producers with more markets99
In addition the city has installed 220 eco-stoves in the cityrsquos marketplaces These stoves can be linked with solar photovoltaic panels that extend stovesrsquo cooking time and can generate electricity for other uses such as lighting a kitchen or charging a battery100 This approach improves working conditions protects the health of the women who typically cook and serve food in these spaces and helps test and fine-tune this technology It also builds awareness and comfort with cleaner cooking technology among smaller business owners who often face financial barriers to the purchase of new equipment
The shift to cleaner cooking technology can deliver vital improvements in public health More than 90 of Ugandan households101 along with many restaurants schools and other places that serve and prepare food cook with wood charcoal The World Health Organization estimates exposure to cookstove smoke contributes to 13000 premature deaths every year in Uganda102 103 In Kampala over 80 of households rely on charcoal for cooking with dramatic impacts on air quality and public health104 Women and girls often face the highest levels of risk as they can spend up to five hours daily cooking in smoky kitchens and can face safety risks in traveling to forests to collect firewood105
The use of clean cooking technology also lessens the risk of fuel shortages The balance between biomass supply and demand remains fragile with large deficits in materials forecasted in and beyond the 2020rsquos106 Since Kampala concentrates Ugandarsquos economic activity and as a result its energy demand it is especially vulnerable to these projected shortfalls but also particularly well-placed to test and develop solutions107
The cityrsquos approach to promoting clean cooking technology reflects the need to ensure that the transition away from the charcoal market generates jobs and creates revenue108 Funding will also continue to be crucial to the cityrsquos ability to facilitate and accelerate the adoption of clean cooking technologies Kampala has teamed up with the World Bank and the University of Washington to develop a climate-smart capital investment plan that aligns new projects with the cityrsquos climate action goals It will continue to leverage partnerships with private and international partners to scale up public funding as it takes the next steps in its climate and development roadmap109
EXPANDING ACCESS TO CLEANER COOKING | UGANDA | KAMPALA
CASE STUDIES g
26
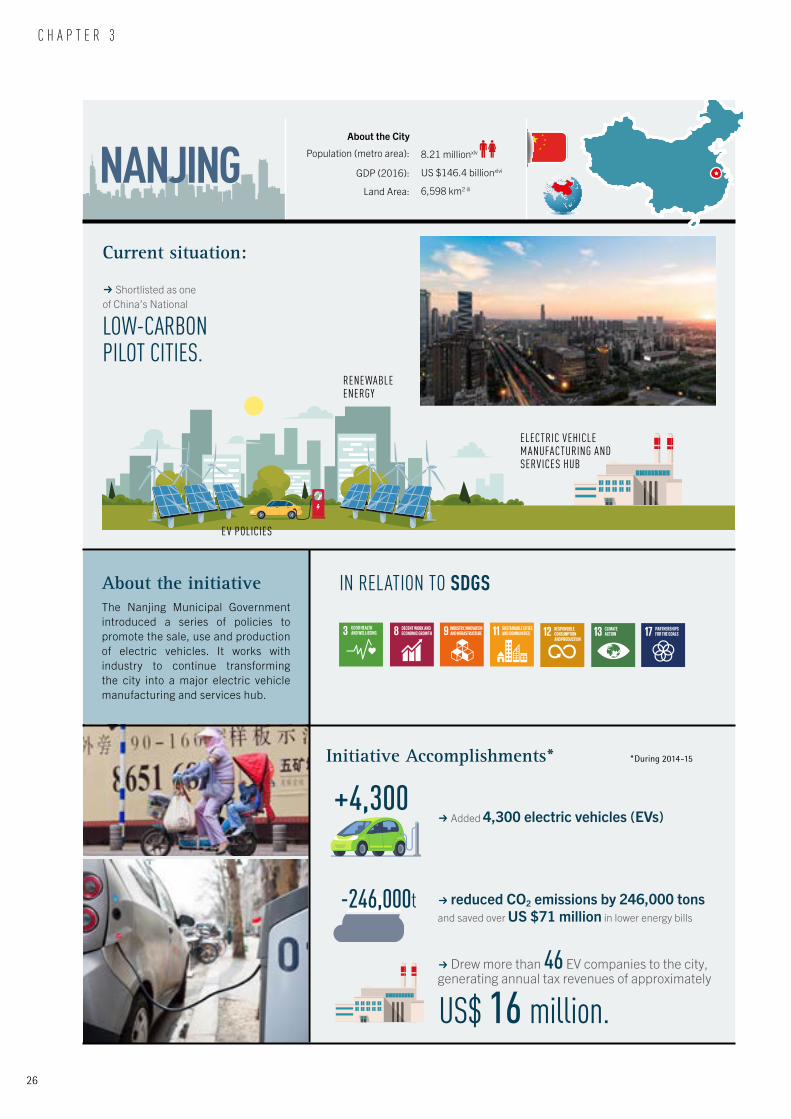
NANJINGCurrent situation
R Shortlisted as one of Chinarsquos National
LOW-CARBON PILOT CITIES
R Added 4300 electric vehicles (EVs)
About the initiative The Nanjing Municipal Government introduced a series of policies to promote the sale use and production of electric vehicles It works with industry to continue transforming the city into a major electric vehicle manufacturing and services hub
Initiative Accomplishments
+4300
-246000t
About the City
Population (metro area)
GDP (2016)
Land Area
821 millionxlv
US $1464 billionxlvi
6598 km2 iii
During 2014-15
R reduced CO2 emissions by 246000 tons
and saved over US $71 million in lower energy bills
R Drew more than 46 EV companies to the city generating annual tax revenues of approximately
C H A P T E R 3
IN RELATION TO SDGS
RENEWABLE ENERGY
EV POLICIES
ELECTRIC VEHICLE MANUFACTURING AND SERVICES HUB
US$ 16 million
27
g
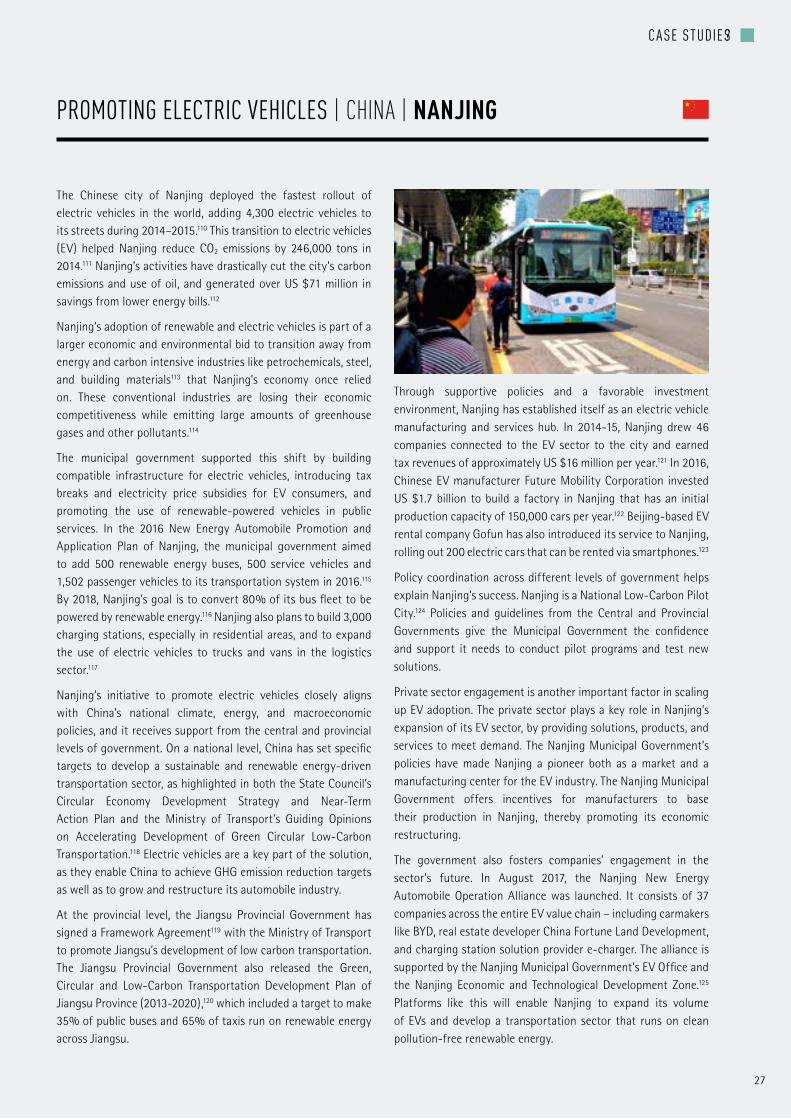
The Chinese city of Nanjing deployed the fastest rollout of electric vehicles in the world adding 4300 electric vehicles to its streets during 2014ndash2015110 This transition to electric vehicles (EV) helped Nanjing reduce CO2 emissions by 246000 tons in 2014111 Nanjingrsquos activities have drastically cut the cityrsquos carbon emissions and use of oil and generated over US $71 million in savings from lower energy bills112
Nanjingrsquos adoption of renewable and electric vehicles is part of a larger economic and environmental bid to transition away from energy and carbon intensive industries like petrochemicals steel and building materials113 that Nanjingrsquos economy once relied on These conventional industries are losing their economic competitiveness while emitting large amounts of greenhouse gases and other pollutants114
The municipal government supported this shift by building compatible infrastructure for electric vehicles introducing tax breaks and electricity price subsidies for EV consumers and promoting the use of renewable-powered vehicles in public services In the 2016 New Energy Automobile Promotion and Application Plan of Nanjing the municipal government aimed to add 500 renewable energy buses 500 service vehicles and 1502 passenger vehicles to its transportation system in 2016115 By 2018 Nanjingrsquos goal is to convert 80 of its bus fleet to be powered by renewable energy116 Nanjing also plans to build 3000 charging stations especially in residential areas and to expand the use of electric vehicles to trucks and vans in the logistics sector117
Nanjingrsquos initiative to promote electric vehicles closely aligns with Chinarsquos national climate energy and macroeconomic policies and it receives support from the central and provincial levels of government On a national level China has set specific targets to develop a sustainable and renewable energy-driven transportation sector as highlighted in both the State Councilrsquos Circular Economy Development Strategy and Near-Term Action Plan and the Ministry of Transportrsquos Guiding Opinions on Accelerating Development of Green Circular Low-Carbon Transportation118 Electric vehicles are a key part of the solution as they enable China to achieve GHG emission reduction targets as well as to grow and restructure its automobile industry
At the provincial level the Jiangsu Provincial Government has signed a Framework Agreement119 with the Ministry of Transport to promote Jiangsursquos development of low carbon transportation The Jiangsu Provincial Government also released the Green Circular and Low-Carbon Transportation Development Plan of Jiangsu Province (2013-2020)120 which included a target to make 35 of public buses and 65 of taxis run on renewable energy across Jiangsu
Through supportive policies and a favorable investment environment Nanjing has established itself as an electric vehicle manufacturing and services hub In 2014-15 Nanjing drew 46 companies connected to the EV sector to the city and earned tax revenues of approximately US $16 million per year121 In 2016 Chinese EV manufacturer Future Mobility Corporation invested US $17 billion to build a factory in Nanjing that has an initial production capacity of 150000 cars per year122 Beijing-based EV rental company Gofun has also introduced its service to Nanjing rolling out 200 electric cars that can be rented via smartphones123
Policy coordination across different levels of government helps explain Nanjingrsquos success Nanjing is a National Low-Carbon Pilot City124 Policies and guidelines from the Central and Provincial Governments give the Municipal Government the confidence and support it needs to conduct pilot programs and test new solutions
Private sector engagement is another important factor in scaling up EV adoption The private sector plays a key role in Nanjingrsquos expansion of its EV sector by providing solutions products and services to meet demand The Nanjing Municipal Governmentrsquos policies have made Nanjing a pioneer both as a market and a manufacturing center for the EV industry The Nanjing Municipal Government offers incentives for manufacturers to base their production in Nanjing thereby promoting its economic restructuring
The government also fosters companiesrsquo engagement in the sectorrsquos future In August 2017 the Nanjing New Energy Automobile Operation Alliance was launched It consists of 37 companies across the entire EV value chain ndash including carmakers like BYD real estate developer China Fortune Land Development and charging station solution provider e-charger The alliance is supported by the Nanjing Municipal Governmentrsquos EV Office and the Nanjing Economic and Technological Development Zone125 Platforms like this will enable Nanjing to expand its volume of EVs and develop a transportation sector that runs on clean pollution-free renewable energy
PROMOTING ELECTRIC VEHICLES | CHINA | NANJING
CASE STUDIES g
Current situation
Across Colombia micro small and medium enterprises comprise
of all Colombian businesses
of private sector employment
of the national GDP
women have been trained through the
initiative
Initiative Accomplishments
R A construction firm installed 3304kWh of energy in a new housing development saving +US $200 in the first 8 months of its projected 20-year life span
Under the leadership of Network participants25R A construction firm achieved a
reduction of its construction waste
reuse of demolition and construction material waste
reduction of paper use in its organizational processes
and the use of rainwater for of construction activities
3169
50
90
R A sugar cane mill switched to more efficient stoves and fuel increasing production efficiency 110
+110Production efficiency
Cali Valle del Cauca Colombia
28
About the initiative The Womenrsquos Cleaner Production Network trains and encourages entrepreneurs to foster clean production practices in small and medium enterprises along the Colombiarsquos Valle del Cauca region a major industrial corridor
VALLE DEL CAUCA REGION
C H A P T E R 3
IN RELATION TO SDGS
About the City
Population (metro area)
GDP (2016)
Land Area
46 millionxciv
US $353 millionlxix
22140 km2 iii
80 3590
GDP
29
The Womenrsquos Cleaner Production Network helps entrepreneurs transform their firms into green businesses It gathers women from academia utility companies public organizations and large and small industries to develop action plans to reduce industrial pollution and address climate change To date 25 women have leveraged the Network to capture efficiency savings reduce emissions and give their company a competitive edge
While strategies vary across sectors they typically deliver cost or material savings for the organization as well as benefits for the climate At a trapiches paneleros (unprocessed sugar product) mill old and inefficient ovens used wood and old tires as fuel in part to compensate for the ovenrsquos open design which failed to conserve heat Burning these materials released sulfur dioxide which creates respiratory risks126 in addition to greenhouse gases127 The firmrsquos owner a member of the Network led the switch to an eco-oven a system easily constructed using local materials A fine-grained silica wall conserves heat eliminating the need to burn tires and wood and enabling the operation to reuse sugar cane waste as fuel The new stove also generates more heat cuts the use of vegetable oil in the consumption process by 83 and increases overall production efficiency by 110128 The millrsquos production of its final products ndash 24-kg lumps of processed sugar cane ndash have jumped from 25 to 525 per hour129
In another example a firmrsquos female construction director led a shift to the use of solar energy in residential construction projects The firm joined forces with a national utility company Empresa de Energia del Pacifico (Epsa) and piloted an initiative to install solar panels on the roofs of common areas such as gardens swimming pools and gyms Since the panelsrsquo installation in January 2017 the PV systems have generated 3304 kWh of energy of which 3303 kWh has been consumed saving its owners over US $200 in the first 8 months of its projected 20-year life span130 131 The director now hopes to expand the use of solar to individual homes using environmentally-friendly materials to generate and store electricity
Other women associated with the Womenrsquos Cleaner Production Network have achieved similar results in both emissions reductions and environmental protection Increased efficiency at one large construction firm spread to ten of its suppliers across these businesses women led the installation of photovoltaic energy systems to provide light and pump rainwater initiated waste recycling and water reuse programs replaced firm motorcycles with bicycles and cut administrative paper use by half132
All of this activity occurs within the Valle del Cauca region of Colombia a major industrial corridor that hosts roughly 450 small and medium enterprises from different industries133
Across Colombia micro small and medium-sized enterprises make up 99 of all Colombian businesses and drive 80 of private sector employment along with 35 of the national GDP134 They also often generate significant pollution in part because of the challenge of accessing environmental knowledge and best practice technologies135 Regional cleaner production centers universities and environmental authorities in sync with Colombiarsquos 2010 Sustainable Production and Consumption Policy aim to transform polluting industries into sustainable businesses136
Groups like the Womenrsquos Cleaner Production Network help facilitate collaboration between these different actors making cleaner production efforts more resilient to financial or technical challenges These collaborations also help identify key areas for intervention A partnership between the Network and the Corporacioacuten Autoacutenoma Regional del Valle del Cauca (CVC) Colombiarsquos environmental authority for instance is developing clean production initiatives to support small coffee producers which employ many women displaced by conflict
Though many small and medium-sized enterprises are dominated by men women have been crucial actors in the transition to cleaner technology and practices While they work across diverse industries participants in Womenrsquos Cleaner Production Network share a common trait they have all already led successful cleaner production projects in various industries in Colombia prior to joining the initiative The Network helps facilitate technology transfer but also fosters strategic partnerships and learning alliances to help implement new tools and sustain change Many firms even when they successfully participate in demonstration projects struggle to integrate these new strategies tools or processes into their daily operations The Womenrsquos Cleaner Production Network has been especially adept at helping its participants institutionalize these transitions create a new business-as-usual and lay the foundation for continued gains in clean production137
The potential for replicating the Networkrsquos model in and beyond Colombian remains large Most participantsrsquo activities draw on local technology and materials and involve simple easily achievable steps138 The model of the Network itself could also be scaled up It draws value from the diversity of institutions and industries represented and helped build participation through concrete activities responsibilities and benefits for engagement in the network Crucially it considers technical knowledge from small firms and from large institutions to be complementary and equally valuable enabling the group to tackle problems that would have been challenging to address from a single perspective139
LEADING BY EXAMPLE IN CLEANER INDUSTRIAL PRODUCTION | COLOMBIA | VALLE DEL CAUCA REGION
CASE STUDIES g
30
Cut Commercial and industrial buildingsrsquo energy use generates
30 of Mexico Citylsquos carbon emissions
21949
of green roofs on schools hospitals and public buildings
square meters
Reduce
by 2020 and
Reduce annual emissions by
or limit to 2 metric tons of CO2 per capita by the year 2050
2mt CO2
more than its original targets
77million tonnes of CO2e
314
between 2008 - 2012 =
80-95
10 million tonnes of CO2e
million tonnes of CO2eby 2025
About the initiative Mexico Cityrsquos Sustainable Buildings Certifi- cation Program incentivizes sustainable commercial industrial and residential buildings creating benefits for building owners tenants and the city government
Past Accomplishments Current Situation Future Targets
MEXICO CITY
Covers 8220 square meters
of floor area across 65 buildings
Reduced
116789 tons of CO2
emissions
Saved
133 million kWh
of electricity
Saved
1735356 cubic meters
of water
68 new jobs
created
Initiative Accomplishments (between 2009-2017)
About the City
Population (metro area)
GDP
Land Area
204 million
US $421 billion
1485 km2
+10
IN RELATION TO SDGS
C H A P T E R 3
31
Mexico City has encouraged efficiency in new and existing building stock through a strategy that integrates public policy with concrete action The Sustainable Buildings Certification Program (SBCP) ldquothe first of its kind in Mexicordquo140 exemplifies this approch generating buy-in and capacity for more comprehensive action while delivering tangible environmental and economic benefits The initiative fosters the sustainable construction or improvement of commercial industrial and residential buildings by awarding certifications that reflect various levels of sustainability performance in energy efficiency water mobility solid waste social and environmental responsibility and green roofs
The SBCP launched in 2009 after approximately two years of planning and stakeholder consultation Mexico Cityrsquos Ministry of Environment gathered technical experts from the building industry local governments and academia to develop the programrsquos certification process and criteria Typically participants audit their buildingrsquos energy and water use then use the results to develop a plan to meet or exceed existing local and national energy efficiency standards The Ministry of the Environment certifies new or newly retrofitted buildings rating residential structures as compliant efficient or excellent and industrial buildings as compliant or excellent Higher certification levels generate higher property tax and payroll tax reductions Every two years a follow-up assessment tracks performance and compliance141
As of 2017 the program encompassed 8220 square meters of floor area across 65 buildings Between 2009 and 2017 participating buildings saved 116789 tons of CO2 133 million kWh of electricity and 1735356 cubic meters of potable water142 The SBCPrsquos benefits also spread beyond efficiency The program has supported renewable energy installation and expanded green roofs and gardens ndash its tax breaks allow participants to implement sustainability strategies that might otherwise be prohibitively expensive
Since third-party technicians play a vital role in supporting the certification process ndash auditing buildings and identifying strategies to improve performance ndash the city has partnered with industry to offers technicians resources training and the chance to earn credentials as official implementing agents of the SBPC program The certification can help auditors win new contracts and the process of training and hiring technicians to oversee the auditing and certification of buildings has generated 68 new jobs143
Reduced property and payroll taxes along with lower energy and water bills help incentivize participation The programrsquos auditing and monitoring components enable participants to closely track their personal return on investment Participation in the SBCP also leads to increased access to project financing and
accelerated permitting procedures These benefits help building owners overcome the high capital costs and limited financing options that can stall building improvements144 By lowering the demand on municipal water energy and waste management services the program also enables Mexico City to stretch its resources farther145
The SBCP includes multiple points of entry that accommodate different participantsrsquo needs Its tiered certification system allows small businesses with limited access to capital to scale up efficiency improvements over time Tenants of commercial buildings can obtain certification for the space that they rent or lease In multi-family properties certifications can apply to either specific building sections common areas or the entire building These options help counter the challenge of ldquosplit incentivesrdquo between building tenants and owners in which a building owner worries that savings from lower energy costs will flow to the tenant while a tenant avoids investing in improving efficiency since the resulting increases in property value will largely benefit the owner146 Continuing to tailor outreach and incentives to different audiences ndash and in particular to small and medium enterprises ndash will be a key next step for the city147
The program also increases the transparency of the building marketplace Domestic or international corporations seeking green office space or industrial facilities may consult a list of SBCP participants Certified office buildings have garnered ldquogreen premiumsrdquo of around 20 in their rental yields148 as companies seek to meet their own sustainability commitments or harness the benefits of green buildings
The SBCP is part of a complementary mix of reforms and incentives aimed at greening the cityrsquos building sector Mexico City leads by example covering 21949 square meters of schools hospitals and public buildings with green roofs and conducting audits for efficiency retrofits at 19 public buildings149 150 151 In June 2016 Mexico Cityrsquos Ministry of Environment updated building codes including guidance on materials for construction equipment and design to enable more energy-efficient buildings This dramatic shift from the previous regulations which did not account for energy efficiency could reduce buildingsrsquo energy use up to 20152 Through platforms such as the Building Efficiency Accelerator the city continues to engage a wide range of stakeholders to develop strategies that foster efficient buildings 153 Voluntary initiatives like the SBCP help generate support for more comprehensive policies and will play an important role in accelerating their uptake
TAKING THE LEAD IN GREEN AND SUSTAINABLE BUILDINGS | MEXICO | MEXICO CITY
CASE STUDIES g
brings solar power to some
50000 homes clinics schools
and businesses
benefits over
250000 people
creates
450 jobs in Nigeria
aims to reach
10million installations
by 2022
reduces businesses fuel costs by at least
75
Initiative AccomplishmentsMTN Mobile Electricity Solynta
Current situationNigeriarsquos 7500 MW power supply lags behind the estimated
170000 MW demand costing the region 2-4 of its annual GDP
make up
9 out of 10 Nigerian businesses and contribute over 46 of the nationrsquos GDP
spend some
35 trillion Naira (US $97 billion) each year on generator fuel
R Small and medium enterprises
GDP
32
About the initiative Private companies are making solar energy accessible and affordable helping to meet the vast demand for reliable energy access across Nigeriarsquos cities
LAGOS
C H A P T E R 3
About the City
Population (metro area)
GDP
Land Area
16 millioncxli
US $136 billioncxlii
9996 km2 cxliii
IN RELATION TO SDGS
33
Solar companies are piloting innovative ways of making solar energy accessible and affordable meeting Nigeriarsquos enormous market and vast need for energy The Renewable Energy Association of Nigeria estimates that 15 MW of solar PV has been installed across the country with the potential to harness 40 ndash 65 kWh per square mile each day154 These installations reflect the diversity of energy needs across Africarsquos largest country In Lagos a solar school built through a partnership between architecture firm NLE Works the United Nations and the Heinrich Boll Foundation floats in the Makoko neighborhoodrsquos lagoons providing a gathering place for 100 children155 Consistent Energy Limited has focused on winning business from the same cityrsquos stylists signing up an estimated 200 barber shops for pay-as-you-go solar systems156
The private sector has been instrumental in deploying and demonstrating the feasibility of distributed solar energy systems The solar start-up Lumos Global for instance has partnered with Nigerian mobile provider MTN to bring solar power to over 50000 homes clinics schools and businesses benefiting over 250000 people and creating 450 jobs157 This partnership MTN Mobile Electricity aims to reach 10 million installations by 2022158
Working with Nigeriarsquos largest mobile provider ndash MTN captures about 39 of the countryrsquos mobile market share159 ndash makes solar power accessible MTN Mobile Electricity operates through MTNrsquos well-established marketing and distribution channels selling eighty-watt systems small enough to fit on the back of a motorcycle through approximately 300 MTN locations160 Customers pay for solar service through SIM cards which most citizens already use or have access to161 Unlike many East African countries such as Kenya Uganda and Tanzania where pay-as-you-go solar models have taken off the infrastructure and use of mobile money in many West African countries remains nascent162 Finding a quick and convenient way for customers to pay for solar systems without relying on mobile money bank accounts or credit cards marks a major step towards the wider growth of the market
From MTNrsquos perspective its partnership with Lumos Global helps it set itself apart from its competitors Offering a unique service ndash the ability to purchase solar energy ndash reduces every mobile companyrsquos greatest worry that its customers will switch to another provider Expanding access to reliable energy also makes it easier for customers to charge and use mobile phones163
The pay-as-you-go model employed by MTN Mobile Electricity and a wide range of companies operating in Nigeria helps customers overcome scarce access to financing so that upfront costs do not prevent them from taking advantage of longer term savings164 Pay-as-you-go solar companies also act in many ways as financial service providers reaching customers that
might otherwise be overlooked due to a lack of credit history This payment models mimic the diesel and kerosene payments customers are familiar with but deliver greater value for the money Lumos estimates that the cost of running a diesel generator for two hours is equivalent to the cost of running their solar system for a day165 Solynta which offers pay-as-you-go along with lease-to-own and direct purchase options has found that switching to solar reduces business fuel costs by at least 75166 Solar panels can last for 20 years extending these savings far into the future167
Solar energyrsquos lower costs could unleash additional economic development in Nigeria where customers spened between US $10 ndash 13 billion on kerosene and diesel fuels each year168 Bottlenecks in accessing power cost the country 2-4 of its GDP each year slowing economic growth jobs and investment169 Small and medium-sized enterprises which make up nine out of ten Nigerian businesses and contribute over 46 of the nationrsquos GDP are especially affected by a lack of access to reliable electricity spending some 35 trillion Naira (US $97 billion) each year on generator fuel170 For many business owners access to more reliable power translates into the ability to expand their services grow their businesses and create more jobs171
By illustrating the benefits of solar power to customers investors and the national government companies have helped accelerate its uptake Education and outreach efforts have introduced solar systems to new audiences172 Demonstration projects have overcome reputational challenges tied to poorly constructed solar options in earlier markets173 174
Demonstrating the demand for solar energy is also unlocking urgently needed finance Sixteen companies supported by pound2 million from the Solar Nigeria Programme delivered small solar light and power systems to 170000 Nigerian households during 2016 alone By 2020 the initiative aims to reach 5 million homes175 In addition to partnerships with philanthropic agencies and impact investors solar companies are increasingly attracting their own investment176 Lumos Global for instance raised a record US $90 million in 2016177 a hopeful signal that solar companies will continue accelerating the delivery of clean reliable energy
SCALING UP THE SOLAR MARKET | NIGERIA | LAGOS
CASE STUDIES g
34
C H A P T E R 3
32 GLOBAL 250 GREENHOUSE GAS EMITTERS A NEW BUSINESS LOGICNon-state actors especially the private sector will play a critical
role in addressing climate change and reducing Greenhouse Gas
(GHG) emissions Indeed the 250 companies178 referenced in this
report along with their value chains account for approximately
one third of global annual emissions179 For years the management
teams in many large organizations have recognized the future
constraints that climate change could pose on their business
operations and outlook While many have deferred making a
strategic shift toward a low carbon future others have recognized a new business logic a historic opportunity for innovation that drives sustainable growth and competitive advantage
The good news is that some companies in the Global 250 such as Total Ingersoll Rand Toyota Iberdrola and Xcel Energy are diversifying and decarbonizing their business models Their plans begun a decade or more ago have proven business results and provide a pathway to a profitable low carbon future that
Table 1 Companies in the Global 250 include the Top 15180 (listed below) which alone account for about 10 of global annual emissions181 and therefore play crucial roles in our global transition to a low carbon economy182
Rank (2015) Company
GHG Emissions Metric Tons CO2e (Scope 1+2+3)
GHG Index
Revenues Index
Decoupling Index
Employment Index
2016 2015 2014 Baseline 2014 =100
Baseline 2014 =100
Baseline 2014 =100
Baseline 2014 =100
1 Coal India 2014314687 1869412290 108 105 97 961
2 PJSC Gazprom 1247624306 1264855340 99 106 107 1049
3 Exxon Mobil Corporation 1096498615 1145083349 96 66 69 976
4 Thyssenkrupp AG 950917000 954185140 954085140 100 95 96 964
5China Petroleum
amp Chemical Corporation
874153506 901550000 97 71 74 979
6 Rosneft OAO 835868134 829849040 101 94 93 952
7 Cummins Inc 805343388 813043062 920001660 88 91 104 1015
8 PETROCHINA Company Limited 730924555 688790000 106 76 71 976
9 Royal Dutch Shell 734160000 698868219 735119000 100 55 56 979
10 Rio Tinto 668246000 669751731 652023000 102 71 69 854
11 China Shenhua Energy 643832223 733109000 88 70 80 1030
12 Korea Electric Power Corp 634243789 666588494 95 103 110 207
13 Total 469545000 581900000 598400000 78 60 77 1019
14 Petroacuteleo Brasileiro SA ndash Petrobras 544200903 547476491 618399435 88 84 95 851
15 United Technologies Corporation 401518529 530627775 530803247 76 99 131 957
Notes 1) 2014 scope 3 emissions data for Thyssenkrup AG and United Technologies Corporation vary significantly from 2015 scope 3 data therefore the change in scope 1+2 emissions between 2015 and 2014 is used in conjunction with Thyssenkrup AGrsquos and United Technologies Corporationrsquos respective 2015 scope 3 emisssions data to determine scope 3 emissions values for 2014
2) indicates a Decoupling Index that is susceptible to fossil fuel commodity prices
35
GLOBAL 250 GREENHOUSE GAS EMIT TERS g
stretches to 2050 and beyond Looking at the Global 250 evidence is accumulating that companies who demonstrate leadership toward a decarbonize economy gain strategic advantages
CASE STUDY OF TOTAL GROUP183
Now letrsquos take a closer look at one firmrsquos journey to decarbonize operating in a very challenging business sector fossil-fuel based energy
Francersquos Total SA (Total)184 is the fourth largest publicly held oil and gas company in the world The firm is responsible for GHG emissions that place it 13th on our list of major emitters Total is today widely recognized as a leader among major fossil fuel companies for its vision of a new clean energy future and its progress on adapting a large complex business for that future
Understanding the complex process of strategy-driven business transformation requires a framework to connect actions to outcomes over the long-term The model presented here was adapted from previous work (Lubin amp Esty The Sustainability Imperative HBR 2010) to assess a firmrsquos progress in transitioning along a ldquoclimate impact management maturity curverdquo Totalrsquos climate related efforts can be traced back 20 years or more and this historical review begins with their initial recognition of the challenges that climate change poses for a major energy company and the need to address them
Stage 1 Initial Engagement ndash In 2006 Total was one of the first major fossil fuel companies to publicly acknowledge the importance of climate change as a global risk Their initial efforts focused on implementing cost-effective approaches to significantly reduce flaring gas emissions
Stage 2 Systematic Management ndash By 2008 Total lead other major oil companies in systematic reporting of GHG and climate-related performance metrics including product use and included initial target setting for improvements in the companyrsquos operational footprint
Stage 3 Transforming the Core ndash In 2009 Total launched EcoSolutions its low carbon products and services portfolio With
a series of investments in SunPower (solar) Saft (battery design) Stem (energy optimization) and BHC Energy (operational energy efficiency) Total committed to shifting its revenue base toward sustainable energy solutions
Approaching Stage 4 Creating Competitive Differentiation ndash In 2014 under the leadership of Patrick Pouyanne Totalrsquos new Chairman and CEO the company fully articulated its strategy to differentiate itself from other oil companies Going forward Total would build its future business on three strategic pillars
1) Reducing the carbon intensity of its fossil fuel product mix
2) Investing judiciously in carbon capture utilization and storage technologies and
3) Expanding its business base in ldquorenewablesrdquo which includes production storage and the distribution of clean energy and biofuels
In 2015 Total exited the coal business Totalrsquos 2016 reorganization now drives a focus on renewables and low carbon energy solutions setting policy support and goals aligned with the IPCCrsquos 2degC target
If Total is to realize the full potential of its competitive advantage in the energy sector it will need to continue to demonstrate viable decarbonization pathways consistent with the 2-degree boundary This will require continued rapid growth of its EcoSolutions portfolio revenues and leadership among the oil companies as they address the potential challenge of so called ldquostranded assetsrdquo
LEADERSHIP TRANSLATES INTO REDUCED GHG IMPACTSThe data show leadership Total has reduced emissions over the last three years well ahead of IPCC guidance with an approximate 20 aggregate decline (or roughly 130 million metric tons) in total GHG emissions across all scopes185 While emissions declined Totalrsquos carbon intensity saw a 92 average annual rate of decline in GHGBOE (greenhouse gas emissionsbarrel of oil equivalent) between 2013 and 2016 or a cumulative decline of 275 from the baseline year of 2013186 Both aggregate emissions and the GHG intensity of Totalrsquos footprint are falling significantly
LEADERSHIP REFLECTED IN FINANCIAL OUTCOMES REDUCED COST OF CAPITALTable 2 provides evidence that Totalrsquos strategy along with their ability to execute it is already generating value for the firm Thomson Reutersrsquos Eikon platform displays Totalrsquos peer-leading credit rating represented by the blue dot in the peer-scatterplot below This is a significant advantage in the capital-intensive energy sector As Total continues to extend its climate impact leadership with more renewable and low carbon solutions the increasing value of its transformed green product portfolio is likely to significantly outpace the potential declining value of its traditional high carbon products
36
The full ldquoGlobal 250 Report A New Business Logicrdquo provides answers to the following questions as a changing climate disrupts markets and ecosystems
1) Who are the 250 public companies and value chains which are responsible for the largest emissions of greenhouse gases
2) Among this critical group how are emissions trending by company over the past 3 years
3) Is there evidence that decarbonization creates a drag on financial performance or a premium
4) Given the long-term transformation challenge confronting these large emitters how can we assess a companyrsquos progress and define leadership
5) How are policy and investor leadership evolving in a post-carbon economy
The report will be available at httpsblogsthomsonreuterscomsustainability
The case studies featured in this chapter highlight the diverse benefits that renewable energy and energy efficiency activities generate These projects have catalyzed economic growth across all levels of development creating opportunities for small construction firms and multinational companies In improving air quality reducing pollution expanding energy access and creating jobs RE and EE efforts move the world closer to the
2030 Agendarsquos Sustainable Development Goals Continued action across both developed and developing countries will also be vital to meeting the Paris Agreementrsquos targets and protecting these development gains Partnerships among cities regions companies civil society and national governments can help leverage these actorsrsquo respective strengths to further accelerate the development of RE and EE solutions
GLOBAL 250 GREENHOUSE GAS EMIT TERS gC H A P T E R 3
C CC CCC B BB BBB A AA AAAAgency Rating Average
Model Implied Rating
AAA
AA
A
BBB
BB
B
CCC
CC
C
This section has been contributed by ldquoDavid Lubin Constellation Research and Technology John Moorhead BSD Consulting Timothy Nixon Thomson Reuters
Table 2 Credit ratings among Total and its leading competitors showing Totalrsquos competitive advantage on this metric
Source Starmine Thomson Reuters Eikon
PEER COMPARISON EDIT PEERS
RIC Company Name Model Score Probability of Default
Model Implied Rating
Agency Component Scores
SampP Moodylsquos
Structural Model
SmartRatios Model
Text Mining Model
TOTFPA Total SA 75 005 A+ A+- 71 47 51
RDSbL Royal Dutch Shell PLC 63 006 A A+- 60 39 27
ENIMI Eni SpA 37 011 BBB BBB+Baa1 39 12 29
BPL BP PLC 33 012 BBB A-A1 39 7 43
REPMC Repsol SA 49 009 A- BBB-Baa2 53 18 30
STLOL Statoil ASA 37 011 BBB A+- 36 16 16
GALPLS Galp Energia SGPS SA 80 004 A+ -- 51 79 75
CVXN Chevron Corp 72 005 A+ AA-Aa2 87 37 50
Peer Avg 56 008 BBB+ A-A3 55 32 40
15degC- AND 2degC-COMPATIBIL IT Y gC H A P T E R 4
Mexico City Mexico
Mexico City is greening its building sector through a combination of policy incentives and reforms
R Details see page 30
15degC- AND 2degC-COMPATIBILITY A NEW APPROACH TO CLIMATE ACCOUNTING4 This chapter outlines a new approach that can be used to determine the compatibility of policies individual projects and entire sectors with scientific scenarios that limit global temperature rise to 15degC and 2degC It provides sector-level compatibility tables and project-level guidance and demonstrates how these criteria could be applied to individual RE and EE projects Applying these compatability conditions to internationally supported RE and EE projects can help identify and develop specific policy recommendations to create the local and national conditions necessary for 15degC and 2degC-compatible pathways
38
The final chapter of the 1 Gigaton Coalition 2016 report ldquoChapter 6 A Path Forward New Concepts for Estimating GHG Impactsrdquo suggested an alternative approach to assessing climate outcomes at the project and sector levels In addition to the problematic exercise of developing a counterfactual baseline (ie a business-as-usual scenario reflecting what would have happened in the absence of specific policy intervention or technology adoption) national governmentsrsquo Paris pledges or nationally-determined contributions (NDCs) often overlap with other actions within countries making it difficult to attribute specific emissions reductions to partner-supported activities
For renewable energy (RE) projects evaluating whether a technology or policy is compatible with science-based 15degC and 2degC scenarios can be straightforward A wind farm for instance that offsets equivalent fossil-fuel based emissions from grid electricity would be 2degC-compatible Energy efficiency (EE) projects are less straightforward a certified zero energy house under the passive house standard is for example more in line with 2degC development than an energy efficient house that just exceeds current building standards Secondary effects however will also need to be taken into consideration If a bioenergy project leads to adverse land use effects and increased emissions through deforestation then this project may not be in line with a 2degC pathway These significant secondary effects may not be captured using the GHG emissions reductions accounting method employed in the first two 1 Gigaton Coalition reports
This chapter outlines a new approach that can be used to determine the compatibility of policies individual projects and entire sectors with scientific scenarios that limit global temperature rise to 15degC and 2degC Drawing from other research initiatives and the International Energy Agencyrsquos (IEA) 2017 Energy Technologies Perspective (ETP) report this chapter presents criteria for 15degC and 2degC-compatibility at the sector level It also demonstrates how these criteria could be applied to RE and EE projects drawing examples from the RE and EE database compiled for this report Creating 15degC- and 2degCcompatibility conditions and applying these standards to internationally supported RE and EE projects opens the door for researchers to make key inferences and conclusions including
g Evaluation of local and national conditions necessary for 15degC and 2degC-compatible pathways
g Determination of additional efforts needed to make projects 15degC and 2degC compatible
g Development of specific policy recommendations to address project- and sectorlevel issues that create 15degC and 2degC-incompatibilities
g Sector level aggregation of emissions outcomes and resulting policy implications
41 DEVELOPING 15degC AND 2degC-COMPATIBILITY CONDITIONSA growing community of scientists researchers and policymakers have begun to develop metrics to assess sectors companies projects and policies for their compatibility with global climate targets The Climate Action Tracker (CAT) a scientific analysis produced by three independent research organizations ndash NewClimate Institute Ecofys and Climate Analytics ndash last year produced a list of ten short-term global targets that sectors need meet in order to limit warming to 15degC These goals include building no new coal-fired power plants and reducing emissions from coal by 30 by 2025 ending the production of fossil fuel cars by 2035 constructing only fossil-free or near-zero energy buildings and quintupling renovation rates of existing structures by 2020 and achieving 100 renewable energy penetration in electricity production by 2050187
Earlier this year CAT joined forces with a consortium of other research groups convened by former UNFCCC chair Christiana Figueres to produce an analysis of five of the heaviest emitting sectors The resulting report called ldquo2020 The Climate Turning Pointrdquo and published under the collaborativersquos name ldquoMission2020rdquo isolates short-term sectoral targets that are necessary to meet the long-term 2degC climate goal Giving context to CATrsquos list of ten sectoral targets the Mission2020 report shows that these targets are achievable under current conditions and that meeting them would produce desirable economic and human health outcomes188
Sector-level targets are key tools for governments and policymakers to plan assess and implement climate actions in reference to 15degC or 2degC goals Applying global sectoral objectives at the project level however requires another layer of analysis that incorporates a host of local considerations Factors
C H A P T E R 4
39
15degC- AND 2degC-COMPATIBIL IT Y g
pertaining to a localityrsquos policies economy development level energy mix and deployed technologies need to be examined in order to develop appropriate and rigorous goals that are compatible with 15degC or 2degC pathways
Science Based Targets (SBT) is a leading international initiative that strives to assess the complex conditions that determine 2degC compatibility at the firm or project level helping private companies set their own science-based climate targets A collaboration of the Climate Disclosure Project (CDP) United Nations Global Compact World Resources Institute (WRI) and World Wildlife Fund (WWF) and with technical support from Ecofys SBT aims to institutionalize climate target setting among firms in every sector SBT considers GHG emission reduction targets to be ldquoscience-basedrdquo if they align with a level of decarbonization that the international scientific community has deemed necessary to keep global temperature rise below 2degC Using at least one of SBTrsquos seven methods for setting emission targets 293 companies have applied to have their climate benchmarks verified of which SBT has approved 61 firmsrsquo science-based targets
The NewClimate Institute has also pioneered 2degC-compatibility methods and in November 2015 published a report ldquoDeveloping 2degC-Compatible Investment Criteriardquo in which the authors outline a methodology for investors to evaluate whether their investments are compatible with a science-based 2degC scenario189 Distilling complex science and policy issues into easy-to-understand ldquopositiverdquo and ldquonegativerdquo lists NewClimate shows how investors could apply a compatibility approach to the projects they finance Employing positive and negative lists that use quantitative and qualitative conditions to determine a project or sectorrsquos climate compatibility offers some relative advantages to a counterfactual baseline approach
A positive and negative list approach incorporates minimum and dynamic quantitative benchmarks giving clear markers of
2degC-compatibility and how these thresholds change over time This process can also include decision trees and scoring methodologies that help lay-persons use the compatibility method Central to creating positive and negative lists are the conditions that must be met to classify a project to either side Developing these conditions requires the distillation of complex information into a malleable and understandable format This balance of complexity and practicability is perhaps the compatibility approachrsquos greatest strength190
To develop meaningful compatibility conditions and positive and negative lists requires robust and current science The IEArsquos Energy Technology Perspectives 2017 (ETP) provides the scientific backbone for this reportrsquos compatibility criteria as it also does for SBTrsquos analytical tools191 ETP features three scenarios through the year 2060 a Reference Technology Scenario (RTS) representing energy and climate commitments made by countries including Nationally Determined Contributions (NDCs) pledged under the Paris Agreement a 2degC Scenario (2DS) and a Beyond 2degC Scenario (B2DS) which feature rapid decarbonisation measures creating pathways that align with long-term climate goals RTS illustrates explicit international ambitions which do not produce emissions reductions compatible with stated global climate objectives RTS would nonetheless represent a large emissions cut from a historical ldquobusiness as usualrdquo scenario 2DS and B2DS are centered around 2degC and 175degC pathways respectively and depict scenarios in which clean energy technologies are pushed to practical limits These scenarios align with some of the most ambitious aspirations outlined in the Paris Agreement
This report synthesizes current research on climate compatibility and incorporates targets from ETPrsquos 2DS and B2DS to create sector-level 15degC- and 2degC-compatibility criteria and conditions Demonstrating how one could apply these conditions to RE and EE initiatives graphical and flow-chart schematics are provided
40
for guidance and an example project is drawn from a database of bilateral- and multilateral-supported projects that was compiled for this report The challenges inherent to this approach are discussed as well as how one might overcome these issues and the policy implications of results
In May of 2017 the 1 Gigaton Coalition convened a meeting of climate policy experts in Bonn Germany initiating a dialogue to inform the development of 15degC- and 2degC compatibility criteria Dialogue participants evaluated questions prepared by this reportrsquos authors and discussed research challenges This section strives to address all of the most pertinent issues that came to the fore through the Bonn dialogue Many of the challenges inherent to 15degC- and 2degC-compatibility are addressed in Tables 31 ndash 315 below and potential methods for tackling those beyond the scope of this analysis are discussed
Sector-level 15degC- and 2degC-compatibility tables were developed The tables are categorized by sector including by RE technology type and various sectors that are grouped under EE a broad categorization encompassing transportation buildings and industry Sectors are divided into sub-sectors where data availability allowed There are clear science-based targets for instance for rail shipping and aviation allowing the creation of compatibility criteria for these transportation sub-sectors The tables do not represent every societal sector ndash agriculture for example is missing as is hydropower The compatibility analysis is therefore limited to this projectrsquos research scope as well as to the availability of scientific information The tables are tools for assessing 15degC- and 2degC compatibility and they are also proofs of concept that can and should be expanded upon to the limits of current scientific knowledge
The compatibility conditions in each table were largely drawn from the IEArsquos ETP 2017 and its 2DS and B2DS models ETPrsquos sectoral targets were cross-referenced with other scientific sources and were in some cases altered according to the researcherrsquos judgement It should be noted that ETPrsquos 2DS and B2DS models correspond to a 50 percent chance of limiting temperature increases to 2degC and 175degC respectively by the year 2100 This level of uncertainty carries over to the compatibility tables and should inform the perspective of those undertaking any science-based compatibility approach In this analysis the 15degC sectoral targets do not correspond precisely to 15degC of warming The 15degC conditions are rather aspirational targets that align with a level of warming at least 025degC below 2degC It would imply a false level of certainty to assert that the emissions targets and warming trajectories in this analysis precisely align with 15degC or 2degC of warming There are also drawbacks inherent to using one report ETP as the backbone of the analysis The compatibility conditions are however based on the most current and robust science available and it is believed they provide the best estimate for 2degC and below 2degC pathways
42 COMPATIBILITY TABLES
Key factors to consider when reading the sectoral Compatibility Tables (Tables 31 ndash 315)
g All compatibility conditions must be met for a sector to be positive listed (ie compatible)
g Yet the suites of conditions in this analysis do not mean to be comprehensive there may be other conditions or a suite of conditions that must be met under alternative 15degC and 2degC scenarios
g 15degC compatibility conditions are inclusive of 2degC conditions unless otherwise noted
g 15degC and 2degC compatibility conditions are combined for some sectors depending on data availability ndash this analysis does not distinguish between 15degC and 2degC compatibility in these cases
g Enabling policies are considered to be required for positive listing except in instances in which effective proxy policies are in place
g Conditions are considered met when sectors firms or policies demonstrate alignment with long-term global targets See Figures 7 ndash 10 for illustrations of this alignment
C H A P T E R 4
41
15degC- AND 2degC-COMPATIBIL IT Y g
Renewable Power Aggregate
Compatibility Conditions Enabling Policies
2degC
RE accounts for 72 of global energy mix by 2060
Electricity accounts for ~35 final energy demand by 2060
$61 trillion cumulative investment to decarbonize power sector ndash 23 of this investment in non-OECD countries
$34 trillion of investment goes to renewable power generation technologies (tripling of annual average)
Early retirement of coal-fired power plants
Annual investment in transmission doubles by 2025 compared to 2014 gt2000 GW transmission capacity deployed by 2060
Large-scale RampD and deployment of electricity storage technologies
RampD and deployment of carbon negative technologies including BECCS which achieves 2 share of electricity generation by 2060
Deployment of comprehensive demand-side management systems
Variable renewable energy integration with natural gas baseload systems
Triple investment in interconnected high-voltage transmission from 2015 levels by 2025
Power sector achieves near-full decarbonization by 2050
Carbon pricing
Renewable power investment incentives
Transparent disclosure of climate vulnerability to investors and stakeholders
Policies promoting systemic integration
Retirement of coal-fired power facilities
Shift of investment priorities from coal-fired power to renewables natural gas and CCS technologies
15degC
Accounts for 75 of energy mix by 2060
1000 PWh cumulative RE electricity generation through 2060
Electricity accounts for gt40 final energy demand by 2060 Power sector achieves full decarbonization by 2050 and is carbon negative thereafter
CCS systems account for gt10 of total electricity production by 2050 (including BECCS)
BioEnergy with CCS achieves 4 share of electricity generation by 2060
Nuclear has 15 share of electricity generation by 2060
Table 31 Renewable energy-powered electricity production aggregate sector-level 15degC- and 2degC-compatibility conditions
42
C H A P T E R 4
Renewable Power Sectors Compatibility Conditions Enabling Policies
SOLAR
Photovoltaics (PV) Achieves 17 of energy mix by 2060
gt1000 TWh of annual power produced by 2025
4400 GW capacity by 2050 6700 GW capacity by 2060
4x increase in annual capacity additions by 2040
Investment costs for GW capacity decrease by two-thirds by 2060 compared to 2015
$11 trillion cumulative investment through 2060
Carbon pricing
Renewable power investment incentives
Transparent disclosure of climate vulnerability to investors and stakeholders
Policies promoting systemic integration
Retirement of coal-fired power facilities
Shift of investment priorities to from coal-fired power to renewables natural gas and CCS technologies
Solar Thermal Achieves 10 energy mix by 2060
160 TWh of annual power produced by 2025
Increased deployment for industrial applications
$6 trillion cumulative investment through 2060
WIND
20 of energy mix by 2060
Onshore 2400 TWh annual power produced by 2025
Offshore 225 TWh annual power produced by 2025
10500 TWh produced by 2060
3400 GW capacity by 2050
4200 GW capacity by 2060
Investment costs per GW capacity decrease by ~18 compared to 2015
$11 trillion cumulative investment through 2060
BIOENERGY
24 of energy mix by 2060
Energy output doubles to around 145 EJ by 2060
Increased integration of advanced biomass with industrial processes
100 sustainably sourced by 2060
Net negative carbon source by 2060
GEOTHERMAL
220 TWh annual power produced by 2025
Increased integration with industrial processes
Table 32 Renewable energy-powered electricity production disaggregated sector-level 15degC- and 2degC-compatibility conditions
43
15degC- AND 2degC-COMPATIBIL IT Y g
Industry Aggregate Compatibility Conditions Enabling Policies
2degC
Global direct emissions from industry are halved by 2060
Immediate adoption of ISO-certified energy management system (EMS)
Industrial energy consumption growth limited to 03 annually (~90 decrease from 2000 - 2014 average)
~30 improvement in industrial energy intensity by 2060
Demonstrated BAT implementation
Portion of fossil fuel sources declines by gt4 annually through 2030
Shift toward higher proportion of renewables-powered electrification (on- and off-site) as end-use energy source
Improved material yields across supply chain improved inter-industry material efficiencies
Energy and material efficiency standards
Policies that improve scrap collection and recycling rates
Incentives for BAT adoption
Remove fossil fuel subsidies
Catalyzing investment for RampD and commercialization of new technologies
Improve data reporting and collection
Carbon pricing
Large scale shifts in investment
Develop advanced life-cycle assessments for industrial inputs and products
15degC
Global direct emissions from industry are reduced by 80 by 2060
Industrial energy consumption growth limited to 02 annually (gt90 decrease from 2000 ndash 2014 average)
gt30 improvement in industrial energy intensity by 2060
Demonstration of zero- and negative- carbon technologies
Proportion of fossil fuel sources declines by gt7 annually through 2030
Electrification in industrial operations increases ~27 by 2060 and electrical power use is 98 decarbonized by 2060 compared with present levels
Table 33 Industry aggregate sector-level 15degC- and 2degC-compatibility conditions
44
C H A P T E R 4
Industry Cement Compatibility Conditions Enabling Policies
2degC
Direct carbon intensity decreases by ~10 by 2030
10 carbon captured by 2030 towards 30 captured by 2060
Diminished use of coal as source of energy for cement production so coal is lt50 of energy mix by 2060
Increase use of cement clinker substitution materials
Energy and material efficiency standards
Policies that improve scrap collection and recycling rates
Incentives for BAT adoption
Remove fossil fuel subsidies
Catalyzing investment for RampD and commercialization of new technologies
Improve data reporting and collection
Carbon pricing
Large scale shifts in investment
Develop advanced life-cycle assessments for industrial inputs and products
15degCDirect carbon intensity decreases by gt20 by 2030
25 carbon captured by 2030 towards gt75 captured by 2060
Diminished use of coal as source of energy for cement production so coal is one-third of energy mix by 2060
10 reduction in clinker ratio by 2060
Table 34 Industry cement disaggregated sector-level 15degC- and 2degC-compatibility conditions
Industry Iron and Steel Compatibility Conditions Enabling Policies
2degC
30 reduction in CO2 intensity of crude steel production by 2030 compared with 2014
Aggregate energy intensity of crude steel production reduced by 25 by 2030 compared with 2014 levels
gt10 carbon captured by 2025 towards 40 captured by 2060
50 of energy used for crude steel production is from electricity natural gas and sources other than coal by 2060
Improved metal scrap reuse and recycling towards 100 end-use scrap recycling
Energy and material efficiency standards
Policies that improve scrap collection and recycling rates
Incentives for BAT adoption
Remove fossil fuel subsidies
Catalyzing investment for RampD and commercialization of new technologies
Improve data reporting and collection
Carbon pricing
Large scale shifts in investment
Develop advanced life-cycle assessments for industrial inputs and products15degC
gt90 reduction in annual emissions by 2060
50 reduction in CO2 intensity of crude steel production by 2030 compared with 2014
Aggregate energy intensity of crude steel production reduced by one-third by 2030 compared with 2014 levels
gt20 carbon captured by 2025 towards 80 captured by 2060
gt50 of energy used for crude steel production is from electricity natural gas and sources other than coal by 2060
Table 35 Industry iron and steel disaggregated sector-level 15degC- and 2degC-compatibility conditions
45
15degC- AND 2degC-COMPATIBIL IT Y g
Industry Chemicals and Petrochemicals
Compatibility Conditions Enabling Policies
2degC
Annual emissions lt 1 GtCO2 in 2060
Depending on chemical produced emissions intensity decrease by between ~15 and 40 by 2030
Reduced aggregate energy intensity amount reduced depends on energy expenditure on CCS
gt15 carbon captured by 2025 towards 30 captured by 2060
Waste plastic recycling increases to gt40 by 2060
Energy and material efficiency standards
Policies that improve scrap collection and recycling rates
Incentives for BAT adoption
Remove fossil fuel subsidies
Catalyzing investment for RampD and commercialization of new technologies
Improve data reporting and collection
Carbon pricing
Large scale shifts in investment
Develop advanced life-cycle assessments for industrial inputs and products
15degCAnnual emissions decrease by 70 from 2015 levels by 2060 (reaching ~320 Mt CO2)
Depending on chemical produced emissions intensity decrease by between ~25 and 60 by 2030
gt25 carbon captured by 2025 towards 90 captured by 2060
Table 36 Industry chemicals and petrochemicals disaggregated sector-level 15degC- and 2degC-compatibility conditions
Industry Pulp and Paper Compatibility Conditions Enabling Policies
2degC
CO2 intensity is cut by ~40 by 2030 and reduced by ~75 by 2060 compared to 2014 levels
28 reduction in energy intensity by 2060 compared to 2014 levels
Deployment of Best Available Technologies (BAT) as well as low-carbon and CCS technologies
Substitute heat biomass and electricity for fossil fuel energy supply
66 end-use paper product recycling by 2060
Energy and material efficiency standards
Policies that improve scrap collection and recycling rates
Incentives for BAT adoption
Remove fossil fuel subsidies
Catalyzing investment for RampD and commercialization of new technologies
Improve data reporting and collection
Carbon pricing
Large scale shifts in investment
Develop advanced life-cycle assessments for industrial inputs and products
15degCCO2 intensity is cut in half by 2030 and reduced by gt90 by 2060 compared to 2014 levels
30 reduction in energy intensity by 2060 compared to 2014 levels
66 end-use paper product recycling by 2060
Table 37 Industry pulp and paper disaggregated sector-level 15degC- and 2degC-compatibility conditions
46
C H A P T E R 4
Industry Buildings Compatibility Conditions Enabling Policies
2degC
Specific building energy use between 10 - 150 kWhm2 or under 4 MWhperson
15 annual improvement in building envelope performance
Limit global energy demand to 130 EJ
Shift to electrification to supply ~70 of final energy consumption in buildings globally by 2060
Renewables (on- and off-site) supply gt85 of final energy consumption by 2060
Shift to BAT electric heat pumps in temperate climates
Aim to achieve 350 efficiency improvement in cooling equipment and 120 efficiency improvement for heating equipment with further improvements through 2060
Immediate scaling up to 3 renovation rate (global average)
Retrofits improve energy intensity by at least 30 with plan to move to ldquonear-zerordquo energy use
Mix of policy and financial incentives and requirements for energy efficient construction deep renovations and BAT uptake
Strong Mandatory Energy Performance (MEP) targets for all buildings and financial penalties for substandard performance
Upfront financial incentives (eg rebates tax breaks guaranteed loans)
Comprehensive support for BATs
Special emphasis given to heating and cooling demand efficiency in cold and hot climates respectively
In countries with large portion of 2060 building stock to be new construction MEPs integrated efficiency policies and incentives for near-zero energy building construction (nZEBs) are given weight
In countries with large portion of 2060 building stock already built renovation policies are given weight
Integrated urban planning that encompasses construction that increasing building lifetime and reducing secondary and tertiary emissions
Policies designed to develop a robust market for high-efficiency building construction renovations and BAT uptake
15degC
Specific building energy use under 35 MWhperson
Decrease energy demand by around 02 annually through 2060 to around 114 EJ
Shift to electrification to supply ~70 of final energy consumption in buildings globally and near total elimination of fossil power
Renewables supply gt95 of final energy consumption
Immediate scaling up to 5 renovation rate (global average)
Retrofits improve energy intensity by at least 50 with plan to move to ldquonear-zerordquo energy use
Table 38 Buildings aggregate sector-level 15degC- and 2degC-compatibility conditions
47
15degC- AND 2degC-COMPATIBIL IT Y g
Transportation Aggregate Compatibility Conditions Enabling Policies
2degC
54 GHG reductions by 2060 compared to 2015 (75 in OECD countries 29 in non-OECD countries)
Move toward electrification biofuels and full decarbonization by 2060
Efficiency improvements (systemic technological material and fuel) that reduce life-cycle energy intensity by more than half
Intermodal shifts (eg replace aviation with high speed rail)
Regulatory GHG targets at national and international level
Fuel technological and material efficiency standards
Mandates and financial incentivessupport for BAT adoption
Elimination of fossil fuel subsidies
Carbon pricing and fuel taxes
Regulations and financial incentives supporting transition to zero-emission vehicles and electrification of transport modes
Alternative fuel development and technological RampD
Demand management
Intermodal and systemic planning
RampD support for zero- and negative-emission technologies and infrastructure
Systemic data collection and organization on policy effectiveness
15degC
83 GHG reductions by 2060 compared to 2015 (95 in OECD countries 72 in non-OECD countries)
Table 39 Transportation aggregate sector-level 15degC- and 2degC-compatibility conditions
Transportation Bus Compatibility Conditions Enabling Policies
2degCLarge-scale adoption of electric engines and other zero-emission technologies
Implementation of negative cost efficiency measures including technological upgrades
Intermodal shifts from light-duty vehicles (LDV) to buses
Passenger kilometers more than double through 2060
Regulatory GHG targets at national and international level
Fuel technological and material efficiency standards
Mandates and financial incentivessupport for BAT adoption
Elimination of fossil fuel subsidies
Carbon pricing and fuel taxes
Alternative fuel development and technological RampD
Regulations and financial incentives supporting transition to zero-emission vehicles and electrification of transport modes
Demand management
Intermodal and systemic planning
RampD support for zero- and negative-emission technologies and infrastructure
Systemic data collection and organization on policy effectiveness
15degC
80 energy efficiency improvement by 2060 (urban)
47 energy efficiency improvement by 2060 (intercity)
Passenger kilometers nearly triple through 2060
Table 310 Transportation Bus disaggregated sector-level 15degC- and 2degC-compatibility conditions
48
C H A P T E R 4
Transportation Rail Compatibility Conditions Enabling Policies
2degCFull electrification by 2060
Passenger kilometers more than triple through 2060
Intermodal shifts from aviation and LDV to high-speed rail and light rail
Railrsquos share of transport activities increases from 10 to 15
Regulatory GHG targets at national and international level
Fuel technological and material efficiency standards
Mandates and financial incentivessupport for BAT adoption
Elimination of fossil fuel subsidies
Carbon pricing and fuel taxes
Regulations and financial incentives supporting transition to zero-emission vehicles and electrification of transport modes
Demand management
Intermodal and systemic planning
RampD support for zero- and negative-emission technologies and infrastructure
Systemic data collection and organization on policy effectiveness
15degC
100 light rail electrification by 2045
Passenger kilometers increase sixfold through 2060
Railrsquos share of transport activities about doubles from ~10 to ~20
Table 311 Transportation Rail disaggregated sector-level 15degC- and 2degC-compatibility conditions
Transportation Aviation Compatibility Conditions Enabling Policies
2degC
15degC
50 reduction from 2005 levels by 2050
70 reduction in direct emissions by 2060 without offsets
Shift to ~70 advanced biofuels by 2060
25 annual reduction in specific energy use per passenger kilometer
Intermodal shifts away from aviation toward high speed rail
Regulatory GHG targets at national and international level
Fuel technological and material efficiency standards
Mandates and financial incentivessupport for BAT adoption
Elimination of fossil fuel subsidies
Carbon pricing and fuel taxes
Regulations and financial incentives supporting transition to zero-emission vehicles and electrification of transport modes
Alternative fuel development and technological RampD
Demand management
Intermodal and systemic planning
RampD support for zero- and negative-emission technologies and infrastructure
Systemic data collection and organization on policy effectiveness
Table 312 Transportation Aviation disaggregated sector-level 15degC- and 2degC-compatibility conditions
49
15degC- AND 2degC-COMPATIBIL IT Y g
Transportation Shipping Compatibility Conditions Enabling Policies
2degC
Steady emissions through 2030
25 emissions reduction through 2060
28 annual reduction in specific energy use per tonne kilometer through 2060
62 improvement over 2010 levels in energy per efficiency by 2060 (except only 53 for container ships)
Continuous ship capacity growth through 2060 container ships 09 bulk carriers 04 general cargo 06 (annual rates)
Regulatory GHG targets at national and international level
Fuel technological and material efficiency standards
Mandates and financial incentivessupport for BAT adoption
Elimination of fossil fuel subsidies
Carbon pricing and fuel taxes
Regulations and financial incentives supporting transition to zero-emission vehicles and electrification of transport modes
Alternative fuel development and technological RampD
Broad retrofit program
Demand management
Intermodal and systemic planning
RampD support for zero- and negative-emission technologies and infrastructure
Systemic data collection and organization on policy effectiveness
15degC
Emissions reductions beginning in 2020 50 reductions through 2060
Shift to 50 advanced biofuels by 2060
Table 313 Transportation Shipping disaggregated sector-level 15degC- and 2degC-compatibility conditions
Transportation Trucking Compatibility Conditions Enabling Policies
2degC78 reduction in road freight emissions by 2060 compared to 2015
Ultra-low and zero-carbon engines achieve majority share in global trucking fleet by 2050
Large-scale logistics and vehicle utilization improvements
Regulatory GHG targets at national and international level
Fuel technological and material efficiency standards
Mandates and financial incentivessupport for BAT adoption
Elimination of fossil fuel subsidies
Carbon pricing and fuel taxes
Regulations and financial incentives supporting transition to zero-emission vehicles and electrification of transport modes
Demand management
Intermodal and systemic planning
RampD support for zero- and negative-emission technologies and infrastructure
Systemic data collection and organization on policy effectiveness
15degC
gt78 reduction in road freight emissions by 2060 compared to 2015
gt20 energy supplied by low-carbon fuels by 2060 with complimentary zero-emission technologies
Table 314 Transportation Trucking disaggregated sector-level 15degC- and 2degC-compatibility conditions
50
43 PROJECT-LEVEL COMPATIBILITYAssessing project level compatibility with 15degC- and 2degC goals is a significantly more challenging task than establishing sector level targets To determine an individual project firm or policyrsquos compatibility with global climate goals requires greater subjectivity than do appraisals of sectors as one must consider local heterogeneity ndash a mix of factors that high-level targets do not specifically address Actions are undertaken at the local level and a compatibility analysis strives to link these actions with all their particularities to global phenomena Development level is perhaps the most challenging local factor to account for
Every project or policy takes shape in a particular development context with financial economic technological and knowledge barriers that can vary greatly from country to country and case to case Development trajectories also differ greatly depending on locality and these trajectories are crucially important to determining 15degC- and 2degC-compatibility pathways Reconciling climate goals with national and international development priorities is a critical component of 15degC- and 2degC-compatibility analyses and this process remains a difficult hurdle for many countries to overcome
C H A P T E R 4
Transportation Light-Duty Vehicles
Compatibility Conditions Enabling Policies
2degC30 fuel efficiency improvement in all new cars in OECD countries by 2020
50 fuel efficiency improvement in all new cars globally by 2030
50 fuel efficiency improvement in all cars globally by 2050
Regulatory GHG targets at national and international level
Fuel technological and material efficiency standards
Mandates and financial incentivessupport for BAT adoption
Elimination of fossil fuel subsidies
Carbon pricing and fuel taxes
Regulations and financial incentives supporting transition to zero-emission vehicles and electrification of transport modes
Policies that increase cost of ownership of petroleum LDVs and decrease cost of ownership of zero-emission LDVs
Demand management
Intermodal and systemic planning
RampD support for zero- and negative-emission technologies and infrastructure
Systemic data collection and organization on policy effectiveness
15degC
gt50 of LDVs are non-combustion engine vehicles by 2050
90 of all cars are plug-in hybrids
All new vehicles by 2030 will have fuel efficiency equal to 4 litres per 100 km (in accordance with the Worldwide harmonized Light vehicles Test Procedure (WLTP))
40 of all new vehicles of all kinds are ldquoultra-lowrdquo or ldquozero emissionrdquo by 2030
13 of new LDVs are PEVs in OECD and China by 2020 32 by 2030
gt70 of all energy use by LDVs is electric by 2060
Electric driving share for plug-in hybrid electric vehicles (PHEVs) increase to 50 by 2020 and 80 by 2030
Table 315 Transportation Light-duty vehicles disaggregated sector-level 15degC- and 2degC-compatibility conditions
51
15degC- AND 2degC-COMPATIBIL IT Y g
Figures 7 - 10 present a suite of schematics that illustrate how a project firm policy sector or nation could demonstrate 15degC- and 2degC-compatibility and become positive listed In this analysis complete access to information ndash on project inputs and operations for instance ndash is prerequisite for any policy project or entity to be positive listed In the schematics nations sectors and projects employing best available technologies (BATs) and producing output at or near maximum efficiency are considered ldquohigh efficiencyrdquo and are held to stricter conditions than ldquolow efficiencyrdquo activities Nations and sectors with adequate resources ndash including all OECD countries and sectors therein ndashwould be required to have in place a plan for resource sharing with less developed countries sectors and project implementers in order to achieve positive listing Precise resource sharing levels would have to be determined on a case by case basis requiring climate policy experts and scientists to facilitate international cooperation These schematics underscore the importance of both quantitative and qualitative criteria when determining 15degC- and 2degC compatibility Rather than supplanting human judgment this exercise shows the need for subjective decisionmaking as most project and sectoral compatibility hinges on transparent and actionable planning as well as complex cross-sector interactions that are not captured in this reportrsquos tables and schematics
Compatibility metric (eg Carbon Intensity)
206020302017
Current global average
Project A inDevelopingCountry B
Project X inDevelopingCountry Y
2030 Global Target
2060 Global Target
Year
Figure 6 Graphical schematic showing how projects of the same type in separate development contexts could achieve 15degC- or 2degC-compatibility
Source Authors 1 Gigaton Coalition Report 2017
52
Note that sectors in high efficiency developed national contexts would have to exceed global targets to be positive listed thereby balancing out less efficient sectors in developing countries
All nations or sectors that currently meet or exceed global targets would have to demonstrate a transparent actionable plan to share resources with those not currently meeting global targets in order to be positive-listed
C H A P T E R 4
YESNO
NONO
NO
YESNO
YESYES
YES
Meets global targets Exceeds global targets
Transparent actionableplan to meetexceed 2030 targets
Transparent actionable plan for resource sharing
Conditional positive listed Positive listed
Negativelisted
Negative listed
Resource sharing
Low Efficiency High Efficiency
Sector Nation X
Figure 7 Decision tree schematic that could inform whether a sector or nation is positive listed for 15degC- or 2degC-compatibility
Characterized by low income and rapid development trajectory limited use of BATs
53
Note that projects in high efficiency developed national contexts would have to exceed global targets to be positive listed thereby balancing out low efficiency projects in developing countries
15degC- AND 2degC-COMPATIBIL IT Y g
YESNO
NO
YESNO
YES
Meets sector targets Exceeds sector targets
Transparent actionableplan to meetexceed 2030 targets
Conditional positive listed Positive listed
Low Efficiency High Efficiency
Project Policy X
Negativelisted
Figure 8 Decision tree schematic that could inform whether a project or policy is positive listed for 15degC- or 2degC-compatibility
Characterized by low income and rapid development trajectory limited use of BATs
54
With more than $15 billion in approved funding this project is jointly supported by the World Bankrsquos Clean Technology Fund (CTF) administered via the Asian Development Bank (ADB) a CTF loan the Agence Franccedilaise de Deacuteveloppement (AFD) the European Investment Bank (EIB) the French governmentrsquos Direction Geacuteneacuterale du Treacutesor and the Vietnamese governmentrsquos counterpart funds The project is classified as ldquolow efficiencyrdquo due to its developing nation context and its locationrsquos general lack of public transit With plans to meet daily demand of 157000 passengers by 2018 and 458000 passengers by 2038 ADB estimates that the project will mitigate an average of 33150 tCO2e annually through 2038 These demonstrable goals are considered to meet the sector-level 15degC- and 2degC-compatibility conditions for rail (see Table 110) particularly the passenger kilometers (pkm) metrics (threefold pkm increase for 2degC-compatibility and sixfold pkm increase for 15degC-compatibility) With no MRT currently running in Hanoi this project is a massive improvement on the status quo especially considering Vietnamrsquos status as a low-income nation192
C H A P T E R 4
NO
NO
YESNO
YES
YESMeets sector targets Exceeds sector targets
Transparent actionableplan to meetexceed 2030 targets
Conditional positive listed Positive listed
Negative listed
Low Efficiency High Efficiency
Mass Rapid Transit in Hanoi Viet Nam
ADB CTF AFD EIB French and Vitnamese Governments
Figure 9 A recently-approved Mass Rapid Transit (MRT) project based in Hanoi was chosen for a demonstration of the decision tree schematic
55
With more than $35 million in grants from the Global Environment Facility (GEF) and UNDP and more than $63 million in public and private co-financing the Plan includes one 10 MW solar PV plant and one 24 MW wind farm as demonstration projects and has a target of achieving 30 RE penetration by 2030 This meets most of the 15degC- and 2degC-compatibility conditions for RE Solar PV and Wind power (see Tables 11 and 12) Yet this 2030 energy mix goal falls short of the global 2060 targets The Tunisian Solar Plan fits well within the sectorrsquos enabling policies goal and considering Tunisiarsquos status as a low-income nation this project is conditionally positive listed as 15degC- and 2degC-compatible This initiative however is a prime example of a policy ripe for positive influence and aid from funders and outside governments Considering Tunisiarsquos rich solar and wind resources the countryrsquos national plan should be expected to incorporate a greater mix of RE in the long term193
15degC- AND 2degC-COMPATIBIL IT Y g
YES
NO
YESNO
YES
NOMeets sector targets Exceeds sector targets
Transparent actionableplan to meetexceed 2030 targets
Conditional positive listed Positive listed
Negative listed
Low Efficiency High Efficiency
Support for the Tunisian Solar Plan Tunisia
GEF UNDP
Figure 10 Approved in 2013 a project supporting the development of the Tunisian Solar Plan was chosen for a demonstration of the decision tree schematic
C H A P T E R 5
5 Building from a custom 600-project database compiled for the second 1 Gigaton Coalition report this report has expanded the analysis to assess 273 of these projects including 197 renewable energy (RE) 62 energy efficiency (EE) and 14 classified as having both RE and EE components With implementation dates ranging from 2005 through 2016 the projects are found in 99 countries Of the 273 projects 100 are supported by 12 bilateral institutions and firms in 10 different countries and another 173 projects are supported by 16 multilateral development banks and partnerships Project-level data were collected from these organizations including information on assistance levels energy capacity energy savings supported technologies and impact evaluation methodologies The resulting database was not intended to include all of the developing worldrsquos RE and EE efforts but instead exhibits a representative cross-section of bilateral- and multilateral supported projects
DATABASE ASSESSMENT
Valle De Cauca Colombia
Across Colombialsquos Valle del Cauca region entrepreneurs are transforming their firms into green businesses
R Details see page 28
57
DATABASE ASSESSMENT g
After a historic year in 2015 when global investments in renewable energy (RE) projects reached a record high of $286 billion new investment in renewables (excluding large hydro) fell to $242 billion in 2016 In developed economies new investments decreased by 14 to $125 billion while in developing economies they went down by 30 to $1166 billion194 The decrease in investment is explained by two main factors First solar photovoltaics onshore wind and offshore wind saw more than 10 decreases in average dollar capital expenditure per capacity These technologies have become more cost-competitive Second financing slowed in China Japan and some emerging markets Across different renewable technologies solar capacity additions rose from 56 GW to a historic-high 75 GW while wind capacity additions slowed down to 54 GW compared to 63 GW in 2015 Overall the total amount of new capacity installed increased from 1275 GW in 2015 to a record 1385 GW in 2016 For two years in a row renewable power comprised more than half of the worldrsquos added electric generation capacity Investment in energy efficiency also rose 9 to $231 billion in 2016195
Bilateral and multilateral development aid organizations have for decades played a key role in energy projects in developing countries196 From 2004 to 2014 development institutions in OECD countries financed more than US $247 billion for RE and EE projects in developing nations Bilateral development finance institutions such as Norwayrsquos Norfund and bilateral government agencies such as Japan International Cooperation Agency (JICA) are the vehicles for state-sponsored foreign investments Multilateral development banks (MDBs) including the Asian Development Bank (ADB) and European Investment Bank (EIB) have joined forces to finance RE and EE projects throughout the developing world investing more than US$100 billion from 2004 - 2014 according to OECD estimates197 These groups also build policy and administrative capacity among governments and businesses in recipient countries According to OECD estimates they invested US $47 billion in energy policy and administrative management in 2014 more than any other recipient sector besides electricity transmission and distribution198
51 AGGREGATED IMPACTThis section seeks to build on the 1 Gigaton Coalition 2016 Report and update the evaluation of emissions impact of bilateral- and multilateral-supported RE and EE projects in developing countries implemented from 2005 ndash 2016199 Project-level data were collected from organizations including information on assistance levels energy capacity energy savings supported technologies and impact evaluation methodologies The resulting database was not intended to include all RE and EE efforts in developing countries but instead exhibited a representative cross-section of bilateral- and multilateral-supported projects
Despite the harmonized framework for calculating GHG emissions savings from RE and EE projects that International Financial Institutions (IFIs) agreed upon in 2015 current aggregate GHG impact data are incomplete to accurately assess these effortsrsquo total effects200 The new frameworkrsquos influence has extended beyond Multilateral Development Banks (MDBs) and has been incorporated by as many bilateral groups Yet the framework is still not detailed enough to provide sufficient methodological information to meet the criteria for this analysis Organizations generally describe how their aggregate estimates attribute reductions from projects with multiple supporters and despite the harmonised framework calculation assumptions may vary widely from project to project Project-level research is therefore needed to overcome these issues
Communications with aid organization representatives and extensive desk research yielded sufficient information on 197 RE 62 EE projects and 14 REEE projects for calculating GHG emissions impact estimates The project-by-project emissions reductions estimates were made using a common calculation method that accounts for Scope 1 emissions (see Annex)
The supported projects on energy efficiency and renewable energy have significant impact on greenhouse gas emissions
g The analyzed sample of internationally supported RE and EE projects in developing countries will reduce emissions by approximately 0258 gigatons carbon dioxide (GtCO2)
The projects encompass every sector taken into evaluation for 15degC- and 2degC compatibility including wind and solar power generation geothermal small hydro and biomass energy efficiency in buildings rapid public transit systems electric vehicle deployment electricity transmission industrial efficiency and other sub-sectors The sample of internationally supported RE and EE projects in developing countries will reduce emissions by approximately 258 million tons carbon dioxide (MtCO2) annually in 2020 Total emissions reductions from internationally supported RE and EE projects from 2005 through 2015 could be up to 600 MtCO2e per year in 2020 if the samplersquos emissions reductions are scaled up to a global level using total bilateral and multilateral support figures for RE and EE (US $76 billion)
Mt CO2yr
0
800
600
400
200
1000
1200
1400
1600
2020
Year theprojects are
financed
2019
2018
2017
2005ndash
2016
Mitigation impact in 2020
CO2
Figure 12 Emission reductions in 2020 from scaled up public mitigation finance for RE and EE projects
Source Authors 1 Gigaton Coalition Report 2017
58
annually in 2020 The 273 analysed projects generate these emissions savings by displacing fossil fuel energy production with clean energy technologies or by conserving energy in industry buildings and transportation RE projects contribute around 0085 GtCO2 EE projects contribute 0113 GtCO2e and REEE projects contribute about 0059 GtCO2 to the analysisrsquos total emissions reductions These projects received direct foreign assistance totalling US $32 billion
g Total emissions reductions from internationally supported RE and EE projects since 2005 could be up to 0600 GtCO2 per year in 2020 This estimate is derived by scaling up the analysed samplersquos emissions reductions to a global level using total multilateral and bilateral support figures for RE and EE ($76 billion between 2005 and 2016)201 International support flows to markets that are in the early stages of development where barriers to private investment have to be lifted for RE and EE finance to mature This foreign investment which includes critical support for capacity building is essential for spurring RE and EE development despite the fact that foreign support accounts for less than 10 of total RE and EE investments in developing countries
g If public finance for mitigation is scaled up through 2020 emissions would be reduced by more than 1 GtCO2 per year (Figure 12) Countries agreed to mobilize US $100 billion in total climate finance (mitigation and adaptation public and private) For this estimate we assume that a quarter of the US $100 billion is public mitigation finance
C H A P T E R 5
59
52 SELECTED BILATERAL INITIATIVESOutreach to bilateral organizations and desk research yielded detailed data on 100 projects from 12 bilateral groups in nine countries China Finland France Germany Japan The Netherlands Norway United Kingdom and the United States The eight OECD countries invested more than US $9 billion in RE power generation in developing nations from 2006 ndash 2015202 Data on Chinarsquos foreign energy investments is difficult to obtain yet it is known that China has in the past 15 years begun to invest in RE abroad China has supported at least 124 solar and wind initiatives in 33 countries since 2003 Fifty-four of these investments ndash those for which financial data is available ndash sum to nearly US $40 billion203
The bilateral groups featured in this analysis include state-owned investment funds like Norwayrsquos Norfund government-owned development banks like the China Development Bank and some are private companies operating on behalf of government ministries like GIZ in Germany The full list of bilateral organizations included in this analysis is shown in Table 4 Bilateral development groups generally mobilize public funds from national budgets to finance initiatives abroad Some groups raise capital from private markets and others use both public and private financing in their operations Development institutions finance projects via grants andor loans distributed to governments of recipient nations which in turn distribute funding to ministries local agencies and firms in charge of project implementation Promoting development abroad is central to the mission of all the groups considered in this report and the analysis focuses only on funding for RE and EE projects which may comprise a relatively small portion of a bilateral organizationrsquos total portfolio
DATABASE ASSESSMENT g
60
C H A P T E R 5
Table 4 Selected Bilateral Organizations204
Note Cells shaded grey indicates no data available
Bilateral Organization Country YearEstablished
OECD-reported National Assistance for RE and EE Development (millions current US $)205 206
Bilateral Development Organizationrsquos RE and EE Achievements
Bilateral Organizationrsquos Estimated GHG Emissions Mitigation Impact
RE and EE Investments in this Analysis (millions current US $)
RE and EE Projects in this Analysis2015
2005ndash2015 (cumulative)
Agence Franccedilaise de Deacuteveloppement (AFD) France 1998 401 2533 AFDrsquos supported projects installed 1759 MW of REProjects financed from 2013 ndash 2015 abate 114 Mt CO2 annually207 1850 30
China Development Bank and China Exim Bank
China 1994 1000208 549 4
Department for International Development (DFID)International Climate Fund (ICF)
UK 19972011 59 359DFID and ICF supported projects with 230 MW of RE capacity already installed and 3610 MW of RE capacity expected over the projectsrsquo lifetime
Supported RE projects have achieved 66 Mt CO2 abatement209 207 4
Danida Denmark 1971 2 151Danida has allocated more than 1604 million DKK to projects on natural resources energy and climate changes in developing countries between 2016 and 2020
108 5
FinnFund Finland 1980 20 226US $168 million invested in ldquoEnergy and Environmental developmentrdquo from 2011 ndash 2015210 40 2
FMOThe
Netherlands1970 38 521
Established its climate investment fund Climate Investor One (CIO) in 2014 which will develop approximately 20 RE initiatives and build 10 more RE projects with cumulative 1500 MW capacity These efforts will create 2150000 MWh of additional clean electricity production and bring electricity access to approximately 6 million people
CIO aims to achieve an annual avoidance of 15 MtCO2 emissions through the 10 RE projects it builds210
189 3
Deutsche Gesellschaft fuumlr Internationale Zusammenarbeit GmbH (GIZ)212
Germany 2011 954 9899
Since 2005 GIZrsquos EE programs have achieved energy savings equal to the annual energy consumption of more than one million German households GIZ has also distributed energy-saving cookstoves to more than 10 million people GIZ currently has 39 active RE projects in developing countries with more than $480 million invested in this sector213
7 2
KfWDEG Germany 19481962DEGrsquos supported RE initiatives have an estimated annual production of 8000000 MWh equivalent to the annual consumption of approximately 9 million people
KfWrsquos supported 2015 EE projects produce an estimated 15 MtCO2eyear and its supported 2015 RE projects generate an estimated 25 MtCO2eyear though it should be noted that these projects include large hydropower and biomass plants214
1007 9
Japan International Cooperation Agency (JICA)
Japan 1974 204 4807Committed in 2014 to support RE projects with total capacity of 2900 MW
JICA supported RE projects are expected to reduce emissions by 28 MtCO2year (does not include supported EE projects)215
4726 30
NorFund Norway 1997 27 883
Supported RE projects in Africa Asia and Americas have a total installed capacity of 4800 MW with 600 MW more currently under construction These RE projects produced 18500000 MWh in 2015 alone
Norfundrsquos supported RE projects reduced emissions by an estimated 74 MtCO2 in 2015209
39 11
Overseas Private Investment Corporation (OPIC)
USA 1971 244 763In 2015 committed nearly $11 billion to RE in developing countries marking the fifth year in a row that its investments in RE have topped $1 billion217
666 5
All OECD countries 1949 21142
61
DATABASE ASSESSMENT g
Bilateral Organization Country YearEstablished
OECD-reported National Assistance for RE and EE Development (millions current US $)205 206
Bilateral Development Organizationrsquos RE and EE Achievements
Bilateral Organizationrsquos Estimated GHG Emissions Mitigation Impact
RE and EE Investments in this Analysis (millions current US $)
RE and EE Projects in this Analysis2015
2005ndash2015 (cumulative)
Agence Franccedilaise de Deacuteveloppement (AFD) France 1998 401 2533 AFDrsquos supported projects installed 1759 MW of REProjects financed from 2013 ndash 2015 abate 114 Mt CO2 annually207 1850 30
China Development Bank and China Exim Bank
China 1994 1000208 549 4
Department for International Development (DFID)International Climate Fund (ICF)
UK 19972011 59 359DFID and ICF supported projects with 230 MW of RE capacity already installed and 3610 MW of RE capacity expected over the projectsrsquo lifetime
Supported RE projects have achieved 66 Mt CO2 abatement209 207 4
Danida Denmark 1971 2 151Danida has allocated more than 1604 million DKK to projects on natural resources energy and climate changes in developing countries between 2016 and 2020
108 5
FinnFund Finland 1980 20 226US $168 million invested in ldquoEnergy and Environmental developmentrdquo from 2011 ndash 2015210 40 2
FMOThe
Netherlands1970 38 521
Established its climate investment fund Climate Investor One (CIO) in 2014 which will develop approximately 20 RE initiatives and build 10 more RE projects with cumulative 1500 MW capacity These efforts will create 2150000 MWh of additional clean electricity production and bring electricity access to approximately 6 million people
CIO aims to achieve an annual avoidance of 15 MtCO2 emissions through the 10 RE projects it builds210
189 3
Deutsche Gesellschaft fuumlr Internationale Zusammenarbeit GmbH (GIZ)212
Germany 2011 954 9899
Since 2005 GIZrsquos EE programs have achieved energy savings equal to the annual energy consumption of more than one million German households GIZ has also distributed energy-saving cookstoves to more than 10 million people GIZ currently has 39 active RE projects in developing countries with more than $480 million invested in this sector213
7 2
KfWDEG Germany 19481962DEGrsquos supported RE initiatives have an estimated annual production of 8000000 MWh equivalent to the annual consumption of approximately 9 million people
KfWrsquos supported 2015 EE projects produce an estimated 15 MtCO2eyear and its supported 2015 RE projects generate an estimated 25 MtCO2eyear though it should be noted that these projects include large hydropower and biomass plants214
1007 9
Japan International Cooperation Agency (JICA)
Japan 1974 204 4807Committed in 2014 to support RE projects with total capacity of 2900 MW
JICA supported RE projects are expected to reduce emissions by 28 MtCO2year (does not include supported EE projects)215
4726 30
NorFund Norway 1997 27 883
Supported RE projects in Africa Asia and Americas have a total installed capacity of 4800 MW with 600 MW more currently under construction These RE projects produced 18500000 MWh in 2015 alone
Norfundrsquos supported RE projects reduced emissions by an estimated 74 MtCO2 in 2015209
39 11
Overseas Private Investment Corporation (OPIC)
USA 1971 244 763In 2015 committed nearly $11 billion to RE in developing countries marking the fifth year in a row that its investments in RE have topped $1 billion217
666 5
All OECD countries 1949 21142
62
RE AND EE PROJECT DATA COLLECTION CRITERIA To be included in the analysis projects had to meet the following criteria These boundaries allowed for the calculation of each projectrsquos GHG emissions mitigation and the identification of reporting overlaps
Scope of Data
g Project location the report only considers projects in developing and emerging economies China was given special consideration as both a recipient and distributor of foreign investments
g Project focus the report only evaluates projects with an explicit RE or EE focus
g Support the report only examines projects at least partly supported by bilateral or multilateral development groups
g Timeframe the report only analyzes projects that were implemented from 2005 through 2016 Data was collected for projects that have not yet been implemented but these projects were excluded from the analysis
Types of Data
g Technology type analysis could only be performed where the technology type (for RE) or technical improvement (for EE) was given (eg solar or power system upgrade)
g Energy information To be analyzed projects had to include quantified power or capacity data This report builds on the previous 1 Gigaton Coalition reportsrsquo scope including many more RE and EE projects in its analysis RE projects employ one of only a handful of technologies with the primary goal of producing electrical power which is commonly expressed in generating capacity (MW) or power (MWh) making reporting and collecting data on these initiatives straightforward EE on the other hand is a broad classification that can refer to a multitude of different activities including initiatives that involve multiple economic sectors EE programs often involve buildings and appliances and they are also employed in industrial systems the power sector transportation and waste Any program that seeks to enhance efficiency in energy production or consumption can be considered an EE project Such an extensive classification requires a flexible methodological framework with sector-specific considerations for each project type in order to establish baselines and determine initiative outcomes (see Section 4) These complex considerations mean that EE project impacts are generally more challenging to quantify than RE project results With various types of EE programs there are varying metrics for describing project results This analysis only includes EE efforts that report energy savings resulting from project implementation a metric most often expressed in terajoules (TJ) or megawatt-hours (MWh)
C H A P T E R 5
63
DATABASE ASSESSMENT g
53 SELECTED MULTILATERAL INSTITUTIONS
Building on the data collected for the 2016 1 Gigaton Report the analysis this year includes 173 projects supported by 16 multilateral groups The multilateral institutions featured include multilateral development banks (MDBs) like the Asian Development Bank (ADB) European Investment Bank (EIB) and Inter-American Development Bank (IDB) These institutions are often intertwined as for instance the International Bank for Reconstruction and Development (IBRD) and International Finance Corporation (IFC) are both part of the extensive World Bank Group Some are affiliated with bilateral institutions such as Proparco in France which is a private sector subsidiary of the bilateral Agence Franccedilaise de Deacuteveloppement (AFD) As the name suggests multilateral development groups draw public and private funding from multiple countries to finance development initiatives throughout the world These organizations often fund projects in collaboration with each other employing multi-layered finance agreements that include grants loans and leveraged local funding
Organizational frameworks and funds that pool resources and coordinate project support among MDBs have become increasingly influential in recent years The Global Environment Facility (GEF) is perhaps the most prominent of these collaborative efforts A partnership of 18 multinational agencies representing 183 countries GEFrsquos investments support and
attract co-financing to a significant portion of the developing worldrsquos RE and EE projects218 The Climate Investment Funds (CIF) created by the World Bank in 2008 is another catalyst of MDB support CIF now consists of four programs two of which focus on developing and expanding RE in middle- and low-income countries219 These collaborations help mobilize funds and they also act as data hubs collecting information on the projects that their partners implement
MDBsrsquo collaborative approach to project finance makes double-counting individual efforts ndash ie counting individual projects more than once ndash more likely when creating an initiative database One project may have multiple groups supporting it all of whom report the initiative and its outcomes as their own This overlap means that if an analyst were to combine different sets of MDB-reported aggregated data there would be projects counted multiple times This problem of multiple attribution and double counting can debase the credibility of an otherwise sound analysis (see Section 4) With detailed project-level data on RE and EE projects this analysis is able to avoid the hazard of double-counting MDBsupported programs Any overlaps between projects in the database were discerned and appropriately addressed so that each project was only counted once Note that in Table 5 overlaps among projects from ldquoSupporting organization reportedrdquo sources are not disaggregated so these data may exhibit double counting demonstrating the difficulties of aggregating data at this level
64
C H A P T E R 5
Multilateral Firm Fund Institution or Partnership
Number of Member Countries and Structure
YearEstablished
OECD-reported Develop-ment Assistance ($ millions current USD)205 206 Supporting Organizationrsquos Reported RE and EE
Investments and ImpactsSupporting Organizationrsquos Estimated GHG Emissions Mitigation Impact
RE and EE Investments in Analysis ($ millions current USD)
RE and EE Projects in Analysis2015
2005ndash2015 (combined)
Acumen Non-profit venture fund 2001Acumen invested $128 million in breakthrough innovations and impacted 233 million lives
125 2
Asian Development Bank (ADB)
67 member countries MDB 1966 350 4227
Invested $247 billion in clean energy in 2015 (RE and EE) including 1481 GWhyear renewable electricity generation 4479 GWhyear electricity saved 37994 TJyear direct fuel saved and 618 MW newly added renewable energy generation capacity
Achieved abatement of 219 MtCO2eyear221 4390 30
African Development Bank (AfDB)
80 members MDB 1964 58 1824 43 1
Asian Infrastructure Investment Bank (AIIB)
56 countries MDB
2014 officially launched in 2016
Invested $165 million in one EE projectAchieved abatement of 16400 tCO2 per year222 165 1
European Development Fund (EDF)
EUrsquos main instrument for providing development aid to African Caribbean and Pacific (ACP) countries and to overseas countries and territories (OCTs)
1959 273 5
European Investment Bank (EIB)
28 European member states European Unionrsquos nonprofit long-term lending institution
1958As a result of $21 billion of climate lending in 2014 3000 GWh of energy was saved and 12000 GWh of energy was generated from renewable sources
Climate lending in 2014 led to avoidance of 3 MtCO2 emissions225 226 214 3
Green Climate Fund (GCF)
Established by 194 countries party to the UN Framework Convention on Climate Change in 2010 Governed by a 24-member board whose participants are equally drawn from developed and developing countries and which receives guidance from the Conference of the Parties to the Convention (COP)
2010$103 billion of support was announced by 43 state governments towards a goal of mobilizing $100 billion by 2020
Anticipated avoidance of 248 MtCO2e through 17 projects227 228 337 2
Global Environment Facility (GEF)
GEFrsquos governing structure is organized around an Assembly the Council the Secretariat 18 Agencies representing 183 countries a Scientific and Technical Advisory Panel (STAP) and the Evaluation Office GEF serves as a financial mechanism for several environmental conventions
1992 84 296
Since 1991 GEF has invested more than $42 billion in 1010 projects to mitigate climate change in 167 countries GEFrsquos investments leveraged more than $383 billion from a variety of other sources including GEF Agencies national and local governments multilateral and bilateral agencies the private sector and civil society organizations
27 billion tonnes of greenhouse gas (GHG) emissions have been removed through the GEFrsquos investment and co-financing activities around climate change mitigation from 1991 ndash 2014229
3098 76
HydroChina Investment Corp
Public company in China 2009 115 1
Table 5 Selected Multilateral Development Organizations220
Note Cells shaded grey indicates no data available
65
DATABASE ASSESSMENT g
Multilateral Firm Fund Institution or Partnership
Number of Member Countries and Structure
YearEstablished
OECD-reported Develop-ment Assistance ($ millions current USD)205 206 Supporting Organizationrsquos Reported RE and EE
Investments and ImpactsSupporting Organizationrsquos Estimated GHG Emissions Mitigation Impact
RE and EE Investments in Analysis ($ millions current USD)
RE and EE Projects in Analysis2015
2005ndash2015 (combined)
Acumen Non-profit venture fund 2001Acumen invested $128 million in breakthrough innovations and impacted 233 million lives
125 2
Asian Development Bank (ADB)
67 member countries MDB 1966 350 4227
Invested $247 billion in clean energy in 2015 (RE and EE) including 1481 GWhyear renewable electricity generation 4479 GWhyear electricity saved 37994 TJyear direct fuel saved and 618 MW newly added renewable energy generation capacity
Achieved abatement of 219 MtCO2eyear221 4390 30
African Development Bank (AfDB)
80 members MDB 1964 58 1824 43 1
Asian Infrastructure Investment Bank (AIIB)
56 countries MDB
2014 officially launched in 2016
Invested $165 million in one EE projectAchieved abatement of 16400 tCO2 per year222 165 1
European Development Fund (EDF)
EUrsquos main instrument for providing development aid to African Caribbean and Pacific (ACP) countries and to overseas countries and territories (OCTs)
1959 273 5
European Investment Bank (EIB)
28 European member states European Unionrsquos nonprofit long-term lending institution
1958As a result of $21 billion of climate lending in 2014 3000 GWh of energy was saved and 12000 GWh of energy was generated from renewable sources
Climate lending in 2014 led to avoidance of 3 MtCO2 emissions225 226 214 3
Green Climate Fund (GCF)
Established by 194 countries party to the UN Framework Convention on Climate Change in 2010 Governed by a 24-member board whose participants are equally drawn from developed and developing countries and which receives guidance from the Conference of the Parties to the Convention (COP)
2010$103 billion of support was announced by 43 state governments towards a goal of mobilizing $100 billion by 2020
Anticipated avoidance of 248 MtCO2e through 17 projects227 228 337 2
Global Environment Facility (GEF)
GEFrsquos governing structure is organized around an Assembly the Council the Secretariat 18 Agencies representing 183 countries a Scientific and Technical Advisory Panel (STAP) and the Evaluation Office GEF serves as a financial mechanism for several environmental conventions
1992 84 296
Since 1991 GEF has invested more than $42 billion in 1010 projects to mitigate climate change in 167 countries GEFrsquos investments leveraged more than $383 billion from a variety of other sources including GEF Agencies national and local governments multilateral and bilateral agencies the private sector and civil society organizations
27 billion tonnes of greenhouse gas (GHG) emissions have been removed through the GEFrsquos investment and co-financing activities around climate change mitigation from 1991 ndash 2014229
3098 76
HydroChina Investment Corp
Public company in China 2009 115 1
continue next page
66
C H A P T E R 5
Table 5 Selected Multilateral Development Organizations220 (continued)
Multilateral Firm Fund Institution or Partnership
Number of Member Countries and Structure
YearEstablished
OECD-reported Develop-ment Assistance ($ millions current USD)205 206 Supporting Organizationrsquos Reported RE and EE
Investments and ImpactsSupporting Organizationrsquos Estimated GHG Emissions Mitigation Impact
RE and EE Investments in Analysis ($ millions current USD)
RE and EE Projects in Analysis2015
2005ndash2015 (combined)
International Finance Corporation (IFC)
184 member countries 1946 422 2394 95 2
Inter-American Development Bank (IDB)
48 MDB 1959 588 3959 134 4
The BRICS New Development Bank
5 MDB
July 2014 (Treaty
signed)July 2015
(Treaty in force)
Invested $911 million in RE projects in 2016 equaling 1920 MW in capacity
These investments are expected to avoid 3236 MtCO2eyr
911 5
ProparcoPublic-Private European Development Finance Institution based in France
1977Proparcorsquos supported RE projects 2013 ndash 2015 have a combined capacity of 175 MW 695 MW in 2015 alone
Proparcorsquos 2015 investments have reduced emissions by an estimated 0876 MtCO2e231
344 10
World Bank
189 member countries The World Bank Group is comprised of five multilateral finance organizations including IBRD and IFC as well as The International Development Association (IDA) The Multilateral Investment Guarantee Agency (MIGA) The International Centre for Settlement of Investment Disputes (ICSID)
1944 1092 8801
In 2015 the World Bank catalysed $287 billion in private investments and expanded renewable power generation by 2461 MW
588 MtCO2e reduced with the support of special climate instruments in 2015 1270000 in MWh in projected lifetime energy savings based on projects implemented in 2015230
504 11
Climate Investment Funds (CIF)
72 developing and middle income countries comprised of four programs including CTF and SREP as well as the Forest Investment Program (FIP) and Pilot Program Climate Resilience (PPCR) all implemented and supported by MDBs
2008 579 2132
Funding pool of $83 billion ($58 billion in expected co-financing) CIF investments of $18 billion (as of 2015) are expected to contribute to 1 GW of CSP and 36 GW of geothermal power223
10891 (including cofinance)
23
Clean Technology Fund (CTF)
72 developing and middle income countries projects implemented by MDBs
2008Fund of $56 billion with approved RE capacity of 18865 MW These projects expected to generate 70099 GWhyr
CTF investments are expected to deliver emissions reductions of 1500 MtCO2e over all projectsrsquo lifetime 20 MtCO2e have already been achieved224
13332 (including
co-finance)12
Note Cells shaded grey indicates no data available
67
DATABASE ASSESSMENT g
Multilateral Firm Fund Institution or Partnership
Number of Member Countries and Structure
YearEstablished
OECD-reported Develop-ment Assistance ($ millions current USD)205 206 Supporting Organizationrsquos Reported RE and EE
Investments and ImpactsSupporting Organizationrsquos Estimated GHG Emissions Mitigation Impact
RE and EE Investments in Analysis ($ millions current USD)
RE and EE Projects in Analysis2015
2005ndash2015 (combined)
International Finance Corporation (IFC)
184 member countries 1946 422 2394 95 2
Inter-American Development Bank (IDB)
48 MDB 1959 588 3959 134 4
The BRICS New Development Bank
5 MDB
July 2014 (Treaty
signed)July 2015
(Treaty in force)
Invested $911 million in RE projects in 2016 equaling 1920 MW in capacity
These investments are expected to avoid 3236 MtCO2eyr
911 5
ProparcoPublic-Private European Development Finance Institution based in France
1977Proparcorsquos supported RE projects 2013 ndash 2015 have a combined capacity of 175 MW 695 MW in 2015 alone
Proparcorsquos 2015 investments have reduced emissions by an estimated 0876 MtCO2e231
344 10
World Bank
189 member countries The World Bank Group is comprised of five multilateral finance organizations including IBRD and IFC as well as The International Development Association (IDA) The Multilateral Investment Guarantee Agency (MIGA) The International Centre for Settlement of Investment Disputes (ICSID)
1944 1092 8801
In 2015 the World Bank catalysed $287 billion in private investments and expanded renewable power generation by 2461 MW
588 MtCO2e reduced with the support of special climate instruments in 2015 1270000 in MWh in projected lifetime energy savings based on projects implemented in 2015230
504 11
Climate Investment Funds (CIF)
72 developing and middle income countries comprised of four programs including CTF and SREP as well as the Forest Investment Program (FIP) and Pilot Program Climate Resilience (PPCR) all implemented and supported by MDBs
2008 579 2132
Funding pool of $83 billion ($58 billion in expected co-financing) CIF investments of $18 billion (as of 2015) are expected to contribute to 1 GW of CSP and 36 GW of geothermal power223
10891 (including cofinance)
23
Clean Technology Fund (CTF)
72 developing and middle income countries projects implemented by MDBs
2008Fund of $56 billion with approved RE capacity of 18865 MW These projects expected to generate 70099 GWhyr
CTF investments are expected to deliver emissions reductions of 1500 MtCO2e over all projectsrsquo lifetime 20 MtCO2e have already been achieved224
13332 (including
co-finance)12
68
International Financial Institutions (IFIs) are banks that have been chartered by more than one country All of the MDBs featured in this report are also IFIs These institutions adopted the ldquoInternational Financial Institution Framework for a Harmonised Approach to Greenhouse Gas Accountingrdquo in November 2015 in an important step toward developing a global methodological standard for GHG accounting232 As the IFI framework gains widespread adoption there are opportunities to add specifications that would improve and further unify the methodologies The framework in its current form could provide more detailed instructions to ensure that results are reproducible This way a third-party analysis would be able to combine GHG emissions impact estimates of different projects from multiple sources Nevertheless in many instances supporting MDBs present project-level emissions mitigation estimates citing the recently harmonised framework yet without providing the precise assumptions inherent to their calculations The IFI framework is a very promising development and widespread sharing of methodological approaches is a powerful tool for catalyzing harmonization efforts
Accounting for Scope 2 and 3 emissions remains a difficult task and a near-term goal for groups financing RE and EE projects With an annual investment of US$11 billion internationally supported RE and EE initiatives in developing countries are less than 10 of total investment Yet this class of funding can have outsized effects as foreign investment leverages other financing builds capacity in local institutions and helps mainstream RE and EE project finance233 According to OECD estimates aid groups invested US$47 billion in energy policy and administrative management in 2014 more than any other recipient sector besides electrical transmission and distribution There is however no harmonized method for estimating emissions impacts from such activities Analysts from several bilateral and multilateral institutions interviewed expressed their desires to accurately measure the outcomes of capacity building efforts as well as policy and administrative aid As funding for these initiatives grow developing rigorous and harmonized ways to do this evaluation is key to fully capturing the results of foreign investments in RE and EE projects
531 MULTISTAKEHOLDER PARTNERSHIPS
In addition to bilateral and multilateral initiatives multi-stakeholder partnerships of both public and private actors also extend financial and capacity-building support to developing countries spurring innovation and new policies This section features some examples of initiatives that are operating in developing countries as models for demonstrable mitigation impact
C H A P T E R 5
wwwccacoalitionorg
Established in 2012 the Climate and Clean Air Coalition (CCAC) is a voluntary partnership uniting governments intergovernmental and nongovernmental organizations representatives of civil society and the private sector committed to improving air quality and slowing the rate of near-term warming in the next few decades by taking concrete and substantial action to reduce short-lived climate pollutants (SLCPs) primarily methane black carbon and some hydrofluorocarbons (HFCs) Complementary to mitigating CO2 emissions fast action to reduce short-lived climate pollutants has the potential to slow expected warming by 2050 as much as 05 Celsius degrees significantly contributing to the goal of limiting warming to less than 2degC
Reducing SLCPs can also advance priorities that are complementary with the 1 Gigaton Coalitionrsquos work such as building country capacity and enhancing energy efficiency For example replacing current high Global Warming Potential (GWP) HFCs with available low- or no-GWP alternatives can also improve the efficiency of the appliances and equipment that use them potentially reducing global electricity consumption by between 02 and 07 by 2050 resulting in a cumulative reduction of about 55 Gt CO2e234
Another example of this alignment is the SNAP Initiative of the CCAC which supports twelve countries to develop a national strategy to reduce short-lived climate pollutants and identify the most cost-effective pathways to large-scale implementation of SLCP measures This initiative has resulted in a number of countries including Mexico Cote drsquoIvoire Chile and Canada submitting NDCs that integrate SLCP mitigation
CLIMATE AND CLEAN AIR COALITION (CCAC)
ctc-norg
The Climate Technology Centre and Network (CTCN) delivers tailored capacity building and technical assistance at the request of developing countries across a broad range of mitigation and adaptation technology and policy sectors As the implementation arm of the UNFCCC Technology Mechanism the CTCN is a key institution to support nations in realizing their commitments under the Paris Agreement
As countries around the world seek to scale up their energy-efficient low-carbon and climate-resilient development the CTCN plays the role of technology matchmaker mobilizing a global network of technology expertise from finance NGO private and research sectors to provide customized technology and policy support Over 200 technology transfers are currently underway in 70 countries
The Centre is the implementing arm of the UNFCCC Technology Mechanism It is hosted and managed by UN Environment and the United Nations Industrial Development Organization (UNIDO) and supported by more than 340 network institutions around the world Nationally-selected focal points (National Designated Entities) in each country coordinate requests and implementation at the national level
districtenergyinitiativeorg
The District Energy in Cities Initiative is a multi-stakeholder partnership coordinated by UN Environment with financial support from DANIDA the Global Environment Facility and the Government of Italy As one of six accelerators of the Sustainable Energy of All (SEforAll) Energy Efficiency Accelerator Platform launched at the Climate Summit in September 2014 the Initiative is supporting market transformation efforts to shift the heating and cooling sector to energy efficient and renewable energy solutions
The Initiative aims to double the rate of energy efficiency improvements for heating and cooling in buildings by 2030 helping countries meet their climate and sustainable development targets The Initiative helps local and national governments build local know-how and implement enabling policies that will accelerate investment in modern ndash low-carbon and climate resilient ndash district energy systems UN Environment is currently providing technical support to cities in eight countries including Bosnia and Herzegovina Chile China India Malaysia Morocco Russia and Serbia
Since its establishment the Secretariat has been leading and coordinating the development of as well as facilitating global access to the best relevant technical information necessary to address regulatory economic environmental and social barriers to enable successful and sustainable district energy programmes
The Initiative works with a wide range of committed partners and donors Partnerships are a key enabler for combatting climate change and fostering sustainable development and are firmly embedded in the way the initiative works at global regional and national level By joining forces with other players the initiative leverages additional resources expertise and technical know-how to help countries and cities in their effort to move towards modern district energy systems
CLIMATE TECHNOLOGY CENTRE AND NETWORK (CTCN)
DISTRICT ENERGY IN CITIES INITIATIVE (DES)
69
DATABASE ASSESSMENT g
httpunited4efficiencyorg
The enlighten initiative is a public-private partnership be-tween the UN Environment and companies such as OSRAM Philips Lighting and MEGAMAN with support from the Global Environment Facility (GEF) The initiativersquos main aim is to support countries in their transition to energy efficient lighting options enlighten has taken a regional approach to standards implementation Through this method coun-tries are able to share the costs for innovation and testing centres as well as recycling and waste schemes to manage disposal of the new products (eg lights containing mercu-ry) To date the enlighten initiative accounts for over 60 partner countries with a number of ongoing regional and national activities and projects Over the next several years the enlighten initiative ndash as the lighting chapter of United for Efficiency ndash will focus its support for countries to leap-frog to LED lighting and assisting countries and cities to im-plement efficient street lighting policies and programmes
ENLIGHTEN
70
C H A P T E R 5
httpwwwglobalabcorg
The Global Alliance for Buildings and Construction (GABC) promotes and works towards a zero-emission efficient and resilient buildings and construction sector It is a voluntary international multi-stakeholder partnership serving as global collaborative umbrella organization for other platforms initiatives and actors to create synergies and increase climate action scale and impact for decarbonising the buildings and construction sector in line with the Paris Agreement goals
The GABCrsquos common objectives are
(a) Communication Raising awareness and engagement making visible the magnitude of the opportunities and impact in the buildings and construction sector
(b) Collaboration Enabling public policy and market transformation action to achieve existing climate commitments through implementing partnerships sharing technical expertise and improving access to financing
(c) Solutions Offering and supporting programmes and locally adapted solutions to achieve climate commitments and further ambitious lsquowell-below 2degC pathrsquo actions
The GABC has five Work Areas for addressing key barriers to a low-carbon energy-efficient and resilient buildings and construction sector Education amp Awareness Public Policy Market Transformation Finance and Measurement Data and Accountability
Specifically the GABC focuses on
g Working towards a common vision and goals by developing a GABC global roadmap and issuing an annual GABC Global Status Report
g Catalysing action particularly supporting and accelerating NDC implementation
g Facilitating access to and scaling-up technical assistance by coordinating membersrsquo needs with other membersrsquo capabilities and capacities
httpwwwglobalcovenantofmayorsorg
The Global Covenant of Mayors for Climate amp Energy is an international alliance of cities and local governments with a shared long-term vision of promoting and supporting voluntary action to combat climate change and move to a low emission resilient society The Covenant focuses on
g Local Governments as Key Contributors The Global Covenant of Mayors works to organize and mobilize cities and local governments to be active contributors to a global climate solution
g City Networks as Critical Partners Local regional and global city networks are core partners serving as the primary support for participating cities and local governments
g A Robust Solution Agenda Focusing on those sec-tors where cities have the greatest impact the Global Covenant of Mayors supports ambitious locally relevant solutions captured through strategic action plans that are registered implemented and monitored and publicly available
g Reducing Greenhouse Gas Emissions and Fostering Local Climate Resilience The Global Covenant of May-ors emphasizes the importance of climate change mit-igation and adaptation as well as increased access to clean and affordable energy
Created through a coalition between the Compact of Mayors and EU Covenant of Mayors the Global Covenant of Mayors is the broadest global alliance committed to local climate leadership building on the commitments of over 7477 cities representing 684880509 people and 931 of the global population
GLOBAL ALLIANCE FOR BUILDINGS AND CONSTRUCTION (GABC)
GLOBAL COVENANT OF MAYORS FOR CLIMATE AND ENERGY
71
DATABASE ASSESSMENT g
httpswwwitf-oecdorg
The International Transport Forum (ITF) at the Organisation for Economic Development and Cooperation (OECD) is an intergovernmental organization with 59 member countries The ITF acts as a think tank for transport policy and organ-ises the Annual Summit of transport ministers It serves as a platform for discussion and pre-negotiation of policy issues across all transport modes and it analyses trends shares knowledge and promotes exchange among transport de-cision-makers and civil society The ITF also has a formal mechanism through its Corporate Partnership Board (CPB) to engage with the private sector Created in 2013 to enrich global policy discussions with a private sector perspective it brings together companies with a clear international per-spective in their activities that play an active role in trans-port and associated sectors CPB partners represent com-panies from across all transport modes and closely related areas such as energy finance or technology
Together with its member countries and corporate partners the ITF has developed a wide range of projects including transport and climate change In May 2016 the ITF Decar-bonising Transport project was launched to help decision makers establish pathways to carbon-neutral mobility This project brings together a partnership that extends far be-yond the member countries of ITF There are currently more than 50 Decarbonising Transport project partners from in-tergovernmental organisations non-governmental organi-sations national governments city networks foundations universities research institutes multilateral development banks professional and sectoral associations and the pri-vate sector
wwwendevinfo
EnDev is an international partnership with the mission to promote sustainable access to modern energy services in developing countries as a means to inclusive social eco-nomic and low carbon development EnDev is funded by six donor countries Norway the Netherlands Germany Unit-ed Kingdom Switzerland and Sweden EnDev was initiated in 2005 and is currently implemented in 26 countries in Africa Asia and Latin America with a focus on least de-veloped countries EnDev promotes sustainable access to climate-smart energy services that meet the needs of the poor long lasting affordable and appreciated by users while also fulfilling certain minimum quality criteria The most widely promoted technologies are improved cook-stoves for clean cooking solar technologies for lighting and electricity supply as well as mini-grids
EnDev has a robust monitoring system which provides donors partners and management with verified data and reliable assessments By now EnDev has facilitated sus-tainable access for more than 173 million people more than 38600 small and medium enterprises and 19400 so-cial institutions In 2016 through the measures of the pro-gramme CO2 emission reductions totalled 18 million tons per year Since beginning in 2005 EnDev has contributed to avoiding more than 85 million tons of CO2 This figure is a conservative estimate it includes various deductions for sustainability additionality free riding and replacement or repeat customers The majority of the EnDevrsquos avoided emissions are generated in the cookstove sector
INTERNATIONAL TRANSPORT FORUM AT THE ORGANISATION FOR ECONOMIC DEVELOP-MENT AND COOPERATION (OECD)
ENERGISING DEVELOPMENT (ENDEV)
72
C H A P T E R 5
wwwpfannet
The Private Financing Advisory Network is one of few actors in the climate finance space addressing the barriers to success for small and medium enterprises (SME) in developing coun-tries and emerging economies ndash a shortage of bankable proj-ects on the demand side and difficulties assessing risks and a conservative lending culture on the supply side
PFANrsquos goals are to reduce CO2 emissions promote low-carbon sustainable economic development and help facilitate the tran-sition to a low-carbon economy by increasing financing oppor-tunities for promising clean energy projects PFAN accomplishes this by coaching and mentoring high-potential climate and clean energy businesses by developing a network of investors and fi-nancial institutions with an interest in and extensive knowledge of clean energy markets and by presenting to these investors projects that have been screened for commercial viability sus-tainability and environmental and social benefits
To date PFAN has raised over US $12 billion in investment for the projects in its pipeline which have led to installing and operating over 700 MW of clean energy capacity
PFAN is a multilateral public-private partnership founded by the Climate Technology Initiative (CTI) and the United Nations Framework Convention on Climate Change (UNFCCC) It has recently been relaunched under a new hosting arrangement with the United Nations Industrial Development Organization (UNIDO) and the Renewable Energy and Energy Efficiency Partnership (REEEP) Under this arrangement PFANrsquos opera-tions are set to scale by a factor of two to five by 2020
THE PRIVATE FINANCING ADVISORY NETWORK (PFAN)
wwwren21net
REN21 is the global renewable energy policy multi-stakeholder network that connects a wide range of key actors REN21rsquos goal is to facilitate knowledge exchange policy development and joint action towards a rapid global transition to renewable energy
REN21 brings together governments non-governmental or-ganizations research and academic institutions international organizations and industry to learn from one another and build on successes that advance renewable energy To assist policy decision making REN21 provides high quality information ca-talyses discussion and debate and supports the development of thematic networks
REN21 facilitates the collection of comprehensive and time-ly information on renewable energy This information reflects
diverse viewpoints from both private and public-sector actors serving to dispel myths about renewables energy and to ca-talyse policy change It does this through six product lines the Renewables Global Status Report (GSR) which is the most fre-quently referenced report on renewable energy market indus-try and policy trends Regional Reports on renewable energy developments of particular regions Renewables Interactive Map a research tool for tracking the development of renew-able energy worldwide the Global Future Reports (GFR) which illustrate the credible possibilities for the future of renewables the Renewables Academy which offers a venue to brain-storm on future-orientated policy solutions and International Renewable Energy Conferences (IRECs) a high-level political conference series
RENEWABLE ENERGY POLICY NETWORK FOR THE 21ST CENTURY (REN21)
INTERNATIONAL RENEWABLE ENERGY AGENCY (IRENA)
wwwirenaorg
The International Renewable Energy Agency (IRENA) is an intergovernmental organization that supports countries in their transition to a sustainable energy future through ac-celerated deployment of renewable energy
IRENArsquos Roadmap for a Sustainable Energy Future REmap 2030 demonstrated that doubling the share of renewable energy in the global energy mix by 2030 is both economi-cally viable and technically feasible Through its Renewable Readiness Assessments IRENA helps countries assess local conditions and prioritize actions to achieve renewable ener-gy potentials The Agencyrsquos regional initiatives such as the African Clean Energy Corridor promote the penetration of renewable electricity in national systems and renewable en-ergy cross-border trade IRENA is organizing dialogues with a broad range of stakeholders to advance specific regional concerns including efforts to strengthen renewable energy objectives in countriesrsquo NDCs
IRENA makes its data knowledge products and tools a public good so that many can benefit from the Agencyrsquos unique mandate and reach These tools include among others a Global Atlas that consolidates renewable resource potential worldwide a Project Navigator that guides the preparation of high quality project proposals and a Sus-tainable Marketplace that facilitates access to finance to scale up investments
73
DATABASE ASSESSMENT g
www4cma
The Moroccan Climate Change Competence Centre (4C Maroc) is a national capacity building platform for multiple stakeholders concerned with climate change including government entities at all levels private companies research institutions and civil society organizations 4C Maroc acts as a hub for regional climate change information
4C Maroc works to strengthen national actorsrsquo capacities in cop-ing with climate change by collecting and developing information knowledge and skills pertaining to climate change vulnerability ad-aptation mitigation and funding in Morocco It also develops tools to improve and aid decision-making regarding climate change 4C Maroc is particularly focused on creating a link between policymakers and scientists aiming to ensure that universities and research centres get necessary funding to work on topics most relevant to improving public well-being This effortrsquos goal is to enable the public sector to make the best decisions on matters relating to climate change
MOROCCAN CLIMATE CHANGE COMPETENCE CENTRE (4C MAROC)
wwwreeeporg
REEEP invests in clean energy markets to help developing coun-tries expand modern energy services improve lives and keep low-ering CO2 emissions Leveraging a strategic portfolio of high-im-pact investments REEEP generates adapts and shares knowledge to build sustainable markets for clean energy and energy efficien-cy solutions advance energy access and combat climate change in order to facilitate economic growth where it matters most
REEEP invests in small and medium-sized enterprises (SMEs) in low and middle-income countries and develops tailor- made financing mechanisms to make clean energy technology accessible and affordable to all
Market transformation is complex and multidimensional REEEP monitors evaluates and learns from its portfolio to bet-ter understand the systems we work in identify opportunities and barriers to success and lower risk for market actors The knowledge we gain is shared with government and private sec-tor stakeholders influencing policy and investment decisions
Current major projects and activities by REEEP include man-aging the Sweden-funded Beyond the Grid Fund for Zambia which is set to bring clean energy access to 1 million Zam-bians by 2021 Powering Agrifood Value Chains a portfolio of eight promising clean energy businesses in the agrifood space market-based clean energy and energy efficiency solutions for urban water infrastructure in Southern Africa and the hosting and execution of activities of the Private Fi-nancing Advisory Network PFAN (see p 72)
Founded at the 2002 World Summit on Sustainable Devel-opment in Johannesburg REEEP works in close collaboration with a range of public and private sector partners at the early stages of clean energy market development
RENEWABLE ENERGY AND ENERGY EFFICIENCY PARTNERSHIP (REEEP)
NDC PARTNERSHIP
httpwwwndcpartnershiporg
The NDC Partnership is a global coalition of countries and in-ternational institutions working together to mobilize support and achieve ambitious climate goals while enhancing sustain-able development Launched at COP22 in Marrakesh the NDC Partnership aims to enhance cooperation so that countries have access to the technical knowledge and financial support they need to achieve large-scale climate and sustainable de-velopment targets as quickly and effectively as possible and increase global ambition over time
In-Country EngagementThe Partnership engages directly with ministries and other stakeholders to assess needs and identify opportunities for collective action across sectors regions and international partners Through the Partnership members provide target-ed and coordinated assistance so that nations can effective-ly develop and implement robust climate and development plans Leveraging the skills and resources of multiple partners towards a common objective and delivering with speed is a unique value proposition that the Partnership brings
Increasing Knowledge SharingThe Partnership raises awareness of and enhances access to cli-mate support initiatives best practices analytical tools and re-sources Information to address specific implementation needs is made available through online portals as well as communities and networks that generate opportunities for knowledge sharing
GovernanceThe NDC Partnership is guided by a Steering Committee com-prised of developed and developing nations and international institutions and is facilitated by a Support Unit hosted by the World Resources Institute in Washington and Bonn The Partner-ship is co-chaired by the Governments of Germany and Morocco
74
DATABASE ASSESSMENT gC H A P T E R 5
united4efficiencyorg
The UN Environment-GEF United for Efficiency (U4E) sup-ports developing countries and emerging economies to leap-frog their markets to energy-efficient lighting appliances and equipment with the overall objective to reduce global electricity consumption and mitigate climate change High impact appliances and equipment such as lighting residen-tial refrigerators air conditioners electric motors and dis-tribution transformers will account for close to 60 percent of global electricity consumption by 2030 The rapid deploy-ment of high-energy efficient products is a crucial piece of the pathway to keep global climate change under 2degC A global transition to energy efficient lighting appliances and equipment will save more than 2500 TWh of electricity use each year reducing CO2 emissions by 125 billion tons per an-num in 2030 Further these consumers will save US $350 billion per year in reduced electricity bills
Founding partners to U4E include the United Nations Devel-opment Programme (UNDP) the International Copper Asso-ciation (ICA) the environmental and energy efficiency NGO CLASP and the Natural Resources Defense Council (NRDC) Similar to enlighten U4E also partners with private sector manufacturers including ABB Electrolux Arccedilelik BSH Haus-geraumlte GmbH MABE and Whirlpool Corporation
UNITED FOR EFFICIENCY (U4E)
SUSTAINABLE ENERGY FOR ALL (SEforALL)
UK INTERNATIONAL CLIMATE FUND
wwwseforallorg
Sustainable Energy for All (SEforALL) was launched in 2013 as an initiative of the United Nations with a focus on moving the importance of sustainable energy for all center stage Following the adoption of the SDGs SEforALL has now tran-sitioned into an international non-profit organization with a relationship agreement with the UN that serves as a plat-form supporting a global movement to support action
SEforALL empowers leaders to broker partnerships and un-lock finance to achieve universal access to sustainable ener-gy as a contribution to a cleaner just and prosperous world for all SEforALL marshals evidence benchmarks progress tells stories of success and connects stakeholders In order to take action at the scale and speed necessary SEforALLrsquos work focuses on where we can make the greatest progress in the least amount of time
httpswwwgovukgovernmentpublicationsinterna-tional-climate-fundinternational-climate-fund
In 2010 the UK established the International Climate Fund (ICF) as a cross government programme managed by BEIS DFID and DEFRA The Fund has delivered pound387 billion in Offi-cial Development Assistance between 2011 and 2016 It now has a mature portfolio of over 200 programmes with global reach working through private sector multilateral and bilat-eral channels and has committed to spending at least pound58 billion over the next five years The ICF aims to spend half of its finances on climate mitigation and half on adaptation
Up to US $90 trillion will be invested in infrastructure globally over the next 15 years in energy cities and transport Much of this will be in developing countries where the ICF will try to influence finance flows to lower carbon investments by making visible distinctive and catalytic investments that can be scaled up and replicated by others
Since 2011 the ICF has directly supported 34 million peo-ple helping them cope with the effects of climate change and improved energy access for 12 million people ICF in-vestments have also helped prevent 92 million tonnes of C02 emissions ndashand generated US $286 billion of public invest-ment and US $650 million of private investment
CONCLUSION gC H A P T E R 6
Meeting the Paris Agreementrsquos climate goals will require an immediate and worldwide shift toward decarbonizing human activities According to the IPCC global emissions will have to peak in the next few years and then rapidly decline over the following three decades approaching zero by 2050 if the world is to have a likely chance of limiting warming in line with the 15degC or 2degC goals established in the Paris Agreement The annual emissions gap however is growing and will equal 11 ndash 19 GtCO2e by 2030 unless efforts to reduce emissions dramatically ramp up Timing is crucial as the global carbon budget shrinks each year and the window of opportunity for achieving our shared climate goals narrows Emissions benchmarks that correspond with 15degC or 2degC scenarios are moving targets and if the world misses them in the short term climate trajectories would worsen and long-term goals would become more difficult to meet
Lagos Nigeria
Private companies are making solar energy accessible and affordable helping to meet the vast demand for reliable energy access across Nigeria
R Details see page 32
CONCLUSION
6
76
Renewable energy (RE) and energy efficiency (EE) initiatives are the most prominent and effective means for cutting carbon emissions while promoting sustainable economic growth As with their timing and scale the location of these efforts is crucial to achieving global climate goals Developing countries are projected to drive almost all of the worldrsquos energy demand growth this century as well as the vast majority of new buildings new modes of transportation and new industrial activity236 These countries must balance domestic development needs with global climate goals and they cannot be expected to do so without support from the rest of the world Developing countries are installing RE facilities at a record pace accounting for more than half of the nearly 140 GW of RE that came online in 2016 These nations are also developing and implementing more RE and EE policies than ever before as documented in Chapter 2 of this report
In cities and regions throughout the world governments at all jurisdictional levels are partnering with private companies to implement RE and EE programmes achieving carbon emissions reductions as well as co-benefits for their localities including enhanced environmental quality human health economic outcomes social inclusion and gender equality Section 31 of this report details six cases from various cities and regions where public-private RE and EE initiatives are proving successful These efforts are prime examples of the global movement to decouple carbon emissions from development It is challenging however for many policymakers project supporters and implementers to determine individual RE and EE projects and policiesrsquo contributions to closing the emissions gap Judging these effortsrsquo compatibility with global 15degC and 2degC scenarios is also an unchartered territory for many actors
Evaluating internationally supported RE and EE initiativesrsquo measurable emissions reductions and creating a 15degC or 2degC-compatibility framework for RE and EE sectors and projects is the focus of this report The results show that when scaled up with proposed funding figures supported RE and EE projects in developing countries could produce 14 GtCO2e in annual reductions by 2020 The compatibility framework presents a practical alternative to using counterfactual baseline scenarios to estimate an RE or EE project or sectorrsquos impacts allowing funders policymakers project implementers and other laypeople to quickly determine if a programme project or policy is 15degC or 2degC compatible and to isolate crucial determining factors of project and sector-level compatibility The compatibility analysis illustrates the need for integrated system-focused policy promoting decarbonization in every sector This means policies that link electricity generation and transmission with end-use management regulations and standards that address upstream and downstream emissions throughout supply chains and a large-scale shift of incentives away from fossil fuels and inefficient energy use towards RE sources and system-wide efficiencies
Decarbonization is occurring throughout the world as cities and other subnational jurisdictions have aligned their actions with national governments and partnered with private firms to implement innovative RE and EE programmes Public-private partnerships particularly collaborations at the subnational level are assuming an increasingly prominent role in international climate efforts and these collaborations will be a main focus at COP23 Yet these actions are not happening at the speed or scale necessary to achieve the 15degC or 2degC goals Developed countries need to transfer resources including policy and technical expertise best available technologies and financing to developing countries in order to create the enabling environments necessary for RE and EE expansion at a scale commensurate with what international climate goals demand Nations project implementers and supporting organizations must determine which policies and programmes do in fact meet the ambitious climate goals set out in the Paris Agreement while also achieving the Sustainable Development Goals (SDGs) This report provides some of the key elements that could be used to assess projects policies and initiatives according to their promotion of global climate and sustainable development objectives
Information is a key resource that is little discussed This reportrsquos 15degC or 2degC compatibility exercise finds that data transparency and information sharing are essential components of compatibility at the national sector and project levels International efforts to improve data availability need to ramp up immediately Bilateral and multilateral development organizations are among the groups best suited to catalyze these global changes This report finds that these international organizations leverage large emissions reductions for relatively small RE and EE investments These groups are shown to foster enabling environments helping to create homegrown low carbon trajectories in developing countries International development authorities now should expand their support to advance transparency and resource transfers at an ever greater scale and speed
CONCLUSION gC H A P T E R 6
77
ANNEX g
This study performed a three-step calculation to determine the GHG mitigation impact from bilateral and multilateral-supported renewable energy (RE) and energy efficiency (EE) finance in 2020
In the first step the annual emission reduction for a project number i in 2020 were calculated as follows
CO2R2020i = ESi x EFi 1where CO2R2020 i = Direct CO2 emission reduction in 2020 by project number i (tyr) ESi = Annual energy saved or substituted by project number i (MWhyr) EF i = country-specific grid electricity CO2 emission factor for project number i (tMWh)
Whenever the project capacity size was reported ESi was calculated as follows
ESi = PCi x 8760 (hoursyr) x CFi 2where PCi Capacity of project i (MW) CF i Capacity factor of project i (dimensionless)
Following this step the analysed projectsrsquo aggregate mitigation impact was scaled up to estimate the total mitigation delivered by bilateral- and multilateral-supported RE and EE projects in developing countries between 2005 and 2016 The scale-up was done by using the following equation
CO2R2020tot2005-2016 = Sj (S CO2R2020jDataset x ) 3where CO2R2020 tot2005-2016 = total mitigation in 2020 by bilateral- and multilateral-supported RE and EE projects in developing countries committed between 2005 and 2016 (MtCO2yr) CO2R2020 jDataset = CO2 emissions reduction in 2020 estimated for a project under technology category j in the dataset developed in this analysis (MtCO2yr)
FINjtot2005-2016 = total finance committed by bilateral and multilateral institutions on technology category j between 2005 and 2016 (million current USD) FINjDataset = Finance committed by a project under technology category j in the dataset developed in this
analysis (million current USD)
In the final step the analysed projectsrsquo aggregate mitigation figure was used to estimate the expected mitigation from bilateral and multilateral support that will be committed through 2020 in line with the US $100 billion global climate finance goal237
CO2R2020tot2005-2020 = Sj (S CO2R2020jDataset x ) 4where CO2Rtot2005-2020 = total mitigation in 2020 by bilateral- and multilateral-supported RE and EE projects in 2020 in developing countries committed between 2005 and 2020 (MtCO2yr)
FINjtot2015-2020 = total finance expected to be committed by bilateral and multilateral institutions on technology category j between 2015 and 2020 (million current USD)
Further details about these steps are given in the following sections CO2 emissions generated through the construction of RE facilities are excluded as these are generally less than emissions from fossil fuel power plant construction
FINjtot2005-2016
SFINjDataset
FINjtot2005-2016 + FINjtot2015-2020
SFINjDataset
ANNEX I DETAILED DESCRIPTION OF MITIGATION IMPACT CALCULATIONS
78
11 TECHNOLOGY CATEGORIZATION (J)Technologies were categorised into the following (Table 1 Categorization of renewable energy technologies) solar photovoltaic (PV) solar thermal wind (including onshore and offshore) hydro (including large medium and small) biomasswaste and geothermal The presented categorization makes it possible to develop country- technology-specific capacity factors in a consistent manner using datasets from different sources
Projects were categorized through a word search from project descriptions For projects reporting the implementation of more than one technology the category ldquomultiple renewable technologiesrdquo was used
A N N E X
12 TOTAL ANNUAL ENERGY SAVED OR SUBSTITUTED (ES)Total annual power generation by RE projects are in most cases calculated by using the power generation capacity and the technology- and country-specific capacity factors Total annual power generation values reported by supporting institutions were used only when capacity values were not available Whereas the first method included the use of the capacity factor the grid electricity CO2 emission factor and the reported project capacity the second included only the grid electricity CO2 emission factor and the reported project power
For EE projects the amount of energy saved annually reported in the project documentation was used for the calculations
Category used in this study IRENA category OECD DAC category
Solar photovoltaic Solar PhotovoltaicSolar energy
Solar thermal Concentrated Solar Power
Geothermal energy Geothermal Energy Geothermal energy
Hydropower (excluding large and medium over 50 MW capacities)
Large Hydropower
Hydro-electric power plantsMedium Hydropower
Small Hydropower
WindOffshore Wind
Wind energyOnshore Wind
Bioenergywaste
Biogas
Biofuel-fired power plantsLiquid Biofuels
Solid Biomass
Multiple renewable technologies Energy generation renewable sources ndash multiple technologies
(Not considered)Marine
Marine energyPumped storage and mixed plants
Table 1 Categorisation of renewable energy technologies
79
ANNEX g
13 CAPACITY FACTORS (CF)For efficient fossil fuel-fired power plant projects uniform capacity factor of 80 was assumed For other EE projects capacity factor values were not used for calculations because the energy consumption reduction values were taken directly from the project documentation For RE projects average capacity factors were calculated for the period 2010-2014 for individual RE technologies per country except for Concentrated Solar Power (CSP) using the installed capacity and power generation
datasets from the IRENA database238 For CSP a projected value for 2020 (33) was used drawn from the IEA Energy Technology Perspectives 2016 report239 In the absence of country-specific capacity factor data the average of all countries with values was used as a proxy For any project with multiple renewable technologies the capacity factor was defined as the mean of the capacity factor values of RE technologies involved in that particular project
14 GRID ELECTRICITY CO2 EMISSION FACTORS (EF) Grid electricity CO2 emission factors (tCO2MWh) were obtained from the Clean Development Mechanism (CDM) grid emission factors database (version 13 January 2017) published by the Institute for Global Environmental Strategies (IGES)240 Among three different emission factors the combined margin emission factors were used for both RE and EE projects Because the database only covers countries with CDM projects regional average values were used for other countries The countries that are not covered by the IGES database (by region) are
g Asia Cook Islands Kiribati Maldives Marshall Islands Myanmar Nepal Palau Reunion Samoa Solomon Islands Timor Leste Tonga and Vanuatu
g Latin America Antigua and Barbuda Barbados Dominica Guadeloupe Haiti St Lucia St Vincent and Grenadines and Suriname
g Africa Algeria Benin Botswana Burundi Cabo Verde Cameroon Chad Congo Congo DR Djibouti Equatorial Guinea Ethiopia Gambia Guinea Guinea-Bissau Liberia Lesotho Malawi Mauritania Mozambique Niger Seychelles Togo and Zimbabwe
g Middle East Iraq and Yemen
g Others Afghanistan Belarus Kazakhstan Kyrgyzstan Moldova Tajikistan Turkey
For biomass-fired power plants an attempt was made to make simplified yet robust estimates on GHG emissions resulting from bioenergy production but it was not possible due to the lack of data that can be applied to the specific set-up of each bioenergy project analysed in this study
Table 2 Country-specific average capacity factors by renewable technology
Country Solar Wind Hydro Bioenergy waste Geothermal
Range for the countries in which projects were implemented
5-20 10-36 10-84 NA 42-84
Simple average across all countries in the IRENA database
15 22 42 40 63
Average values are used as proxies
Source Calculations based on IRENA (2016)
80
15 CALCULATED MITIGATION IMPACTS FOR THE PROJECT DATASET ASSESSED IN THIS REPORTTable 3 presents total CO2 emission reductions expected in 2020 from 273 RE and EE projects per area and technology analysed in this study
16 SCALED UP MITIGATION IMPACTS USING DEVELOPMENT FINANCE COMMITMENTSTo quantify the total mitigation impact in year 2020 delivered by bilateral- and multilateral-supported RE projects implemented from 2005 - 2015 the aggregated mitigation impact for 2020 calculated for the 273 projects was scaled up using the total finance committed (in million current US dollars) in approximately the same period Data on financial commitments to renewable technology projects were obtained from the OECD Development Assistance Committee (DAC) database241 for the years 2005 to 2015 (Table 4 Total amount of development finance committed to RE projects by all supporting partners between 2005 and 2015 (million current US dollars) Note data for 2016 is not yet available at the time of writing
The OECD DAC database does not provide finance figures for energy efficiency projects Therefore an assumption was made on the ratio between of finance for RE and EE projects the ratio for 2014 estimated by Climate Policy Initiative (CPI) in 2015242 243 was also assumed for the period 2005ndash2020
Mitigation impacts were scaled up for each RE category Shown in Table 4 the data comprised all renewable technologies and a category was added for projects with multiple RE technologies For the scaling up calculations finance data categorized as ldquomultiple RE technologiesrdquo was proportionally distributed to individual renewable energy categories while finance and carbon mitigation data categorized as ldquoREEErdquo was divided equally among the two categories The results were summed to achieve a total renewable funding per technology Solar PV and solar thermal projects are scaled up collectively as ldquosolar energyrdquo projects The results are shown in Table 5
It should be noted that the estimated CO2 emissions reductions from bioenergy projects which are uncertain due to the lack of information on land-use related emissions accounted for less than 1 of total emissions reductions from all RE projects Therefore the exclusion of indirect emissions related to biomass production is unlikely to affect our overall results
A N N E X
Table 3 CO2 emission reductions expected in 2020 from 224 RE and EE projects analysed in this study
Areatechnology Number of projectsAnnual emissions
reduction (MtCO2yr)Finance committed
(million current USD)
RE 197 849 20142
Solar Thermal 11 22 1948
Geothermal 17 149 6066
Hydro 29 25 1567
Solar PV 39 367 2719
Wind 44 154 4281
Biomasswaste 19 02 324
Multiple RE 38 131 3237
REEE 14 592 926
EE 62 1138 10831
81
Several assumptions were made to estimate the expected total mitigation impact from finance commitments made between 2005 and 2020 First it was assumed that the global finance target of US $100 billion in 2020 will be achieved Second half of this US $100 billion was assumed to address mitigation and half
of that figure was assumed to be public finance This means that the public finance for RE and EE projects would comprise 25 of the US $100 billion Third the US $25 billion was assumed to be distributed to RE and EE at the same 2014 ratio as reported by CPI
ANNEX g
Table 4 Total amount of development finance committed to RE projects by all supporting partners between 2005 and 2015 (million current US dollars)
Sector 2005 2006 2007 2008 2009 2010 2011 2012 2013 2014 2015 Total
Energy generation renewable sources ndash multiple technologies
347 274 363 734 1172 1799 2561 1763 2030 2447 1742 15233
Hydro-electric power plants
480 720 1181 442 208 716 586 997 1387 1285 806 8808
Solar energy 64 53 25 155 328 243 103 621 971 1661 718 4942
Wind energy 126 93 147 322 219 990 78 140 92 488 82 2776
Marine energy 04 00 01 01 00 05 01 01 1
Geothermal energy
225 10 8 3 43 673 397 48 290 606 372 2676
Biofuel-fired power plants
15 20 35 105 132 53 26 43 117 83 71 701
Total 1258 1171 1760 1761 2102 4474 3751 3612 4886 6571 3791 35137
Note data for 2016 is not yet available at the time of writing
Table 5 Estimated total mitigation impact in 2020 from RE and EE projects financed by bilateral and multilateral institutions between 2005 and 2015
OECD categoryTotal finance 2005-2015
(billion current USD)
Expected total emissions reduction in 2020 resulting from finance
2005 ndash 2016 (MtCO2eyr)
RE and REEE total 494 322
Biofuel-fired power plants 167 605
Solar energy 116 1025
Geothermal energy 549 166
Hydro-electric power plants 246 1711
Wind energy 607 265
EE total 262 332
Includes energy projects from waste
82
REFERENCES
R E F E R E N C E S
1 US Energy Information Administration (EIA) (2016) International Energy Outlook 2016 Washington DC Available httpswwweiagovoutlooksieo
2 International Energy Agency (IEA) (2016) World Energy Outlook Paris France Available wwwworldenergyoutlookorg
3 Mission2020 2020 The Climate Turning Point Available httpwwwmission2020global202020The20Climate20Turning20Pointpdf
4 UN Environment Programme (UNEP) (2017) The 2017 Emissions Gap Report Available httpwwwuneporgemissionsgap
5 Frankfurt School-UNEP CentreBloomberg New Energy Finance (2017) Global Trends in Renewable Energy Investment 2017 httpwwwfs-unep-centreorg (Frankfurt am Main) Available httpfs-unep-centreorgsitesdefaultfilespublicationsglobaltrendsinrenewableenergyinvestment2017pdf REN-21 (2017) 2017 Global Status Report Available httpwwwren21netwp-contentuploads20170617-8399_GSR_2017_Full_Report_0621_Optpdf
6 IPCC 2014 Climate Change 2014 Synthesis Report Contribution of Working Groups I II and III to the Fifth Assessment Report of the Intergovernmental Panel on Climate Change [Core Writing Team RK Pachauri and LA Meyer (eds)] IPCC Geneva Switzerland 151 pp
7 UNEP (2016) The Emissions Gap Report 2016 United Nations Environment Programme (UNEP) Nairobi
8 Pauw WP Cassanmagnano D Mbeva K Hein J Guarin A Brandi C Dzebo A Canales N Adams KM Atteridge A Bock T Helms J Zalewski A Frommeacute E Lindener A Muhammad D (2016) NDC Explorer German Development Institute Deutsches Institut fuumlr Entwicklungspolitik (DIE) African Centre for Technology Studies (ACTS) Stockholm Environment Institute (SEI) DOI 1023661ndc_explorer_2017_20
9 Ibid
10 REN21 Renewable Energy Policy Database
11 Renewable Energy Policy Network for the 21st Century (REN21) (2017) Renewables 2017 Global Status Report Retrieved from wwwren21netgsr
12 Renewable Energy Policy Network for the 21st Century (REN21) (2017) Renewables 2017 Global Status Report Retrieved from wwwren21netgsr
13 NDCs submitted as of late March 2017
14 Renewable Energy Policy Network for the 21st Century (REN21) (2017) Renewables 2017 Global Status Report Retrieved from wwwren21netgsr UNFCCC NDC Registry (Interim) httpwww4unfcccintndcregistryPagesHomeaspx
15 REN21 Renewable Energy Policy Database
16 REN21 (2017) 1Gigaton Coalition Survey
17 REN21 Renewable Energy Policy Database
18 REN21 Renewable Energy Policy Database
19 ldquoThe Government of India launches an ambitious rooftop solar subsidy schemerdquo Bridge to India 4 January 2016 httpwwwbridgetoindiacomblogthe-government-of-india-launches-an-ambitious-rooftop-solarsubsidyscheme
20 Roger Sallent Inter-American Development Bank (IDB) personal communication with REN21 2 December 2016
21 Thermal power plants include gas coal oil biomass and multi-fuel (eg gasoil coalbiomass) PBL Netherlands Environmental Assessment Agency and European Commission (EC) Joint Research Centre (2016) Trends in Global CO2 Emissions 2016 Report (The Hague) Available from httpwwwpblnlenpublicationstrends-in-global-co2-emissions-2016-report
22 REN21 Renewable Energy Policy Database
23 IEA (2016) Medium-Term Renewable Energy Market Report 2016 Paris IEA Avilable httpswwwieaorgnewsroomnews2016octobermedium-term-renewable-energy-market-report-2016html
24 IEA IEA Building Energy Efficiency Policies Database Available wwwieaorgbeep (accessed 22 November 2016)
25 Eight countries plus EU as of 2014 per International Council on Clean Transportation (2014) Global Passenger Vehicle Standards Available wwwtheicctorginfo-toolsglobal-passenger-vehicle-standards
26 REN21 Renewable Energy Policy Database
27 Council of European Municipalities and Regions (CEMR) European section of United Cities and Local Governments (12 May 2015) 1000 Mayors worldwide lead the fight against climate change Available httpwwwccreorgenactualitesview3177
28 Organization of Economic Development (OECD) Cities and climate change (Paris 2010)
29 Houmlhne N Drost P et al ldquoChapter Four Bridging the gap - the role of non-state actionrdquo The Emissions Gap Report 2016 (Paris United Nations Environment Programme (UNEP) 2016)
30 International Energy Agency (IEA) Energy Technology Perspectives 2016 Towards Sustainable Urban Energy Systems (Paris 2016) Available from httpswwwieaorgpublicationsfreepublicationspublicationEnergyTechnologyPerspectives2016_ExecutiveSummary_EnglishVersionpdf
31 Ibid
32 Ibid
33 Ibid
34 N Dubash D Raghunandan Girish Sant and Ashok Sreenivas ldquoIndian climate change policy exploring a cobenefits based approachrdquo Economics Politics Weekly vol 22 No 22 (2013)
35 A Gouldson N Kerr F McAnulla S Hall S Colenbrander A Sudmant J Roy S Sarkar D Chakravarty and D Ganguly ldquoThe economics of low carbon citiesrdquo Kolkata Centre for Low Carbon Futures (Leeds 2014)
36 S Akbar G Kleiman S Menon L Segafredo Climate-smart development adding up the benefits of actions that help build prosperity end poverty and combat climate change (The ClimateWorks Foundation and the World Bank 2014) Available from httpdocumentsworldbankorgcurateden794281468155721244Main-report
37 D Millstein R Wiser M Bolinger and G Barbose ldquoThe climate and air-quality benefits of wind and solar power in the United Statesrdquo Nature Energy vol 6 (2014) p17134
38 Jan Beermann Appukuttan Damodaran Kirsten Joumlrgensen and Miranda A Schreurs ldquoClimate action in Indian cities an emerging new research areardquo Journal of Integrative Environmental Sciences 13 no 1 (2016) p 55-66
39 S Akbar G Kleiman S Menon L Segafredo L Climate-smart development adding up the benefits of actions that help build prosperity end poverty and combat climate change (The ClimateWorks Foundation and the World Bank 2014) Available from httpdocumentsworldbankorgcurateden794281468155721244Main-report
40 Thomas Day Niklas Houmlhne and Sofia Gonzales Assessing the missed benefits of countriesrsquo national contributions Quantifying potential co-benefits (Bonn NewClimate Institute 2015) Available from httpsnewclimateinstitutefileswordpresscom201510cobenefits-of-indcs-october-2015pdf
41 Ibid
42 New Climate Economy (NCE) Seizing the Global Opportunity Partnerships for Better Growth and a Better Climate (2015) Available from httpnewclimateeconomyreport2015wp-contentuploadssites3201408NCE-2015_Seizing-the-Global-Opportunity_webpdf
43 Ibid
44 A Dasgupta ldquoIndia can save up to 18 trillion per year with smart ubran growthrdquo World Resources Institute (WRI) 2 Decmeber 2016 Available from httpthecityfixcomblogindia-can-save-up-to-1-8-trillion-per-year-with-smart-urban-growth-ani-dasgupta
45 New Climate Economy (NCE) Seizing the Global Opportunity Partnerships for Better Growth and a Better Climate (2015) Available from httpnewclimateeconomyreport2015wp-contentuploadssites3201408NCE-2015_Seizing-the-Global-Opportunity_webpdf
46 C40 Cities Climate Leadership Group and Arup Potential for Climate Action Cities are Just Getting Started (2015) Available from httpsissuucomc40citiesdocsc40_citypotential_2015
47 New Climate Economy (NCE) Seizing the Global Opportunity Partnerships for Better Growth and a Better Climate (2015) Available from httpnewclimateeconomyreport2015wp-contentuploadssites3201408NCE-2015_Seizing-the-Global-Opportunity_webpdf
48 International Energy Agency (IEA)Energy Efficiency Market Report 2016 (Paris 2016) Available from httpswwwieaorgeemr16filesmedium-term-energy-efficiency-2016_WEBPDF
49 International Renewable Energy Agency (IRENA) Renewable Energy Jobs Annual Review (Abu Dhabi 2017) Available from httpswwwirenaorgDocumentDownloadsPublicationsIRENA_RE_Jobs_Annual_Review_2017pdf
50 C40 Cities Climate Leadership Group Unlocking Climate Action in Megacities (New York 2015) Available from httpwwwc40orgresearchesunlocking-climate-action-in-megacities
51 Ibid
52 V Castaacuten Broto and H Bulkeley H ldquoA survey of urban climate change experiments in 100 citiesrdquo Global Environmental Change vol 23 No 1(2013) p 92ndash102
53 New Climate Economy (NCE) Seizing the Global Opportunity Partnerships for Better Growth and a Better Climate (2015) Available from httpnewclimateeconomyreport2015wp-contentuploadssites3201408NCE-2015_Seizing-the-Global-Opportunity_webpdf
83
REFERENCES g
54 A Masseen and B Lefevre ldquo4 Keys to Unlock Innovative Urban Services for Allrdquo (16 February 2016) Available from httpthecityfixcomblog4-keys-unlock-innovative-urban-service-for-all-anne-maassen-benoit-lefevre
55 Ibid
56 Global Cities Business Alliance ldquoHow cities and business can work together for growthrdquo (2016) Available from httpswwwbusinessincitiescompublicationhow-cities-and-business-can-work-together-for-growth
57 Narela waste plant opened to generate 24 MW power (11 March 2017) The Times of India Available httptimesofindiaindiatimescomcitydelhinarela-waste-plant-opened-to-generate-24mwpowerarticleshow57583891cms
58 C40 Cities Climate Leadership Group (15 November 2016) Cities100 Delhi ndash Turning Waste into Energy and Better Livelihoods Available from httpwwwc40orgcase_studiescities100-delhi-turning-waste-into-energy-and-better-livelihoods
59 Ibid
60 C40 Cities Climate Leadership Group (15 February 2016) C40 Good Practice Guides Delhi - Energy recovery Available httpwwwc40orgcase_studiesc40-good-practice-guides-delhi-energy-recovery
61 Infrastructure Leasing amp Financial Services Limited (IL amp FS) Waste to Energy Plant Ghazipur Available from httpswwwilfsindiacomour-workenvironmentwaste-to-energy-plant-ghazipur (accessed August 2017)
62 C40 Cities Climate Leadership Group (15 November 2016) Cities 100 Delhi - Turning Waste into Energy and Better Livelihoods Available httpwwwc40orgcase_studiescities100-delhi-turning-waste-into-energy-and-better-livelihoods
63 Infrastructure Leasing amp Financial Services Limited (IL amp FS) Our Work Environment Available httpswwwilfsindiacomour-workenvironment (accessed August 2017)
64 Ibid
65 C40 Cities Climate Leadership Group (15 February 2016) C40 Good Practice Guides Delhi - Energy recovery Available httpwwwc40orgcase_studiesc40-good-practice-guides-delhi-energy-recovery
66 C40 Cities Climate Leadership Group (15 November 2016) Cities 100 Delhi - Turning Waste into Energy and Better Livelihoods Available httpwwwc40orgcase_studiescities100-delhi-turning-waste-into-energy-and-better-livelihoods
67 C40 Cities Climate Leadership Group (15 February 2016) C40 Good Practice Guides Delhi - Energy recovery Available httpwwwc40orgcase_studiesc40-good-practice-guides-delhi-energy-recovery
68 Infrastructure Leasing amp Financial Services Limited (IL amp FS) Waste to Energy Plant Ghazipur Available httpswwwilfsindiacomour-workenvironmentwaste-to-energy-plant-ghazipur (accessed August 2017)
69 C40 Cities Climate Leadership Group (15 February 2016) C40 Good Practice Guides Delhi - Energy recovery Available httpwwwc40orgcase_studiesc40-good-practice-guides-delhi-energy-recovery
70 Ghazipur landfill solution soon trial run of waste-to-energy plant to begin (28 February 2015) Deccan Herald Available httpwwwdeccanheraldcomcontent462504ghazipur-landfill-solution-soon-trialhtml
71 Infrastructure Leasing amp Financial Services Limited (IL amp FS) Integrated Solid Waste Management Available from httpilfsenvcomBrochuresIntegrated-Solid-Waste-Managementpdf (accessed August 2017)
72 C40 Cities Climate Leadership Group (15 November 2016) Cities 100 Delhi - Turning Waste into Energy and Better Livelihoods Available httpwwwc40orgcase_studiescities100-delhi-turning-waste-into-energy-and-better-livelihoods
73 Pande A (1 June 2015) As New Delhi Plant Gears Up to Turn Rubbish into Energy Community Organizer is Turning Ragpickers into Artisans Global Press Journal Available httpsglobalpressjournalcomasiaindiaas-new-delhi-plant-gears-up-to-turn-rubbish-into-energy-community-organizer-is-turning-ragpickers-into-artisans
74 C40 Cities Climate Leadership Group (15 February 2016) C40 Good Practice Guides Delhi - Energy recovery Available httpwwwc40orgcase_studiesc40-good-practice-guides-delhi-energy-recovery
75 Pande A (1 June 2015) As New Delhi Plant Gears Up to Turn Rubbish into Energy Community Organizer is Turning Ragpickers into Artisans Global Press Journal Available httpsglobalpressjournalcomasiaindiaas-new-delhi-plant-gears-up-to-turn-rubbish-into-energy-community-organizer-is-turning-ragpickers-into-artisans
76 Ibid
77 Cut from a different cloth (14 September 2014) The Economist Available httpswwweconomistcomnewsbusiness21586328-building-business-around-solving-chronic-female-health-care-problem-cut-different
78 Tiwari P (July 2016) How Ghazipur wastepickers became flower artists shareholders Kenfolios Available from httpswwwkenfolioscomgulmeher
79 Cut from a different cloth (14 September 2014) The Economist Available httpswwweconomistcomnewsbusiness21586328-building-business-around-solving-chronic-female-health-care-problem-cut-different
80 Pande A (1 June 2015) As New Delhi Plant Gears Up to Turn Rubbish into Energy Community Organizer is Turning Ragpickers into Artisans Global Press Journal Available httpsglobalpressjournalcomasiaindiaas-new-delhi-plant-gears-up-to-turn-rubbish-into-energy-community-organizer-is-turning-ragpickers-into-artisans
81 Ibid
82 Chaudhary R and Verick S (2014) Female labour force participation in India and beyond International Labor Organization Available from httpwwwiloorgnewdelhiwhatwedopublicationsWCMS_324621lang--enindexhtm
83 C40 Cities Climate Leadership Group (15 November 2016) Cities 100 Delhi - Turning Waste into Energy and Better Livelihoods Available httpwwwc40orgcase_studiescities100-delhi-turning-waste-into-energy-and-better-livelihoods
84 C40 Cities Climate Leadership Group (15 February 2016) C40 Good Practice Guides Delhi - Energy recovery Available httpwwwc40orgcase_studiesc40-good-practice-guides-delhi-energy-recovery
85 Indiarsquos largest waste-to-energy plant to be launched at Narela-Bawana in March (18 February 2017) The Economic Times Available httpenergyeconomictimesindiatimescomnewspowerindias-largest-waste-to-energy-plant-to-be-launched-at-narela-bawana-in-march57217386
86 C40 Cities Climate Leadership Group Good Practice Guide Creditworthiness Available httpwwwc40orgnetworkscreditworthiness (accessed August 2017)
87 Kampala Capital City Authority Kampala Climate Change Action Available httpswwwkccagougClimate20Change (accessed July 2017)
88 Kampala Capital City Authority Kampala City Climate Action Plan Video Available httpsyoutubeatdi3DRZRAc
89 Kampala Capital City Authority (2015) Kampala Climate Change Action Energy and Climate Profile Available httpswwwkccagouguDocsEnergy20and20Climate20Profilepdf
90 Kampala Capital City Authority(2016) Kampala Climate Change Action Strategy Available httpwwwkccagouguDocsKampala20Climate20Change20Actionpdf
91 Interview with Kampala Capital City Authority staff members 3 August 2017
92 Kampala Capital City Authority(2016) Kampala Climate Change Action Strategy Available httpwwwkccagouguDocsKampala20Climate20Change20Actionpdf
93 Kampala Capital City Authority Kampala Climate Change Action Available from httpswwwkccagougClimate20Change (accessed July 2017)
94 Interview with Kampala Capital City Authority staff members 3 August 2017
95 Kampala Capital City Authority Expertise France and SIMOSHI (2017) Institutional Improved Cook Stoves in 15 KCCA Schools pilot Project supported by Expertise France
96 Ibid
97 SIMOSHI Ltd Projects Available httpwwwsimoshiorgprojects (accessed September 2017)
98 Fallon A (10 June 2016) Kampala aims to lead African cities in fight against climate change Citiscope Available httpcitiscopeorgstory2016kampala-aims-lead-african-cities-fight-against-climate-change
99 Ibid
100 Kampala Capital City Authority Kampala Climate Change Action Energy and Climate Profile Available httpswwwkccagouguDocsEnergy20and20Climate20Profilepdf
101 Fallon A (10 June 2016) Kampala aims to lead African cities in fight against climate change Citiscope Available httpcitiscopeorgstory2016kampala-aims-lead-african-cities-fight-against-climate-change
102 Global Alliance for Clean Cookstoves (6 April 2016) Alliance Launches lsquoFumbaliversquo Cookstoves Campaign in Uganda Available httpcleancookstovesorgaboutnews04-06-2016-alliance-launches-fumbalive-cookstovescampaign-in-ugandahtml
103 Kampala Capital City Authority Kampala Climate Change Action Energy and Climate Profile Available httpswwwkccagouguDocsEnergy20and20Climate20Profilepdf
104 Kampala Capital City Authority Kampala Climate Change Action Energy and Climate Profile Available httpswwwkccagouguDocsEnergy20and20Climate20Profilepdf
105 Awamu biomass energy Available httpawamuug (accessed July 2017)
106 Climate and Development Knowledge Network (CDKN) Economic assessment of the impacts of climate change in Uganda ndash National Level Assessment Accessed via Kampala Capital City Authority Kampala Climate Change Action Energy and Climate Profile Available httpswwwkccagouguDocsEnergy20and20Climate20Profilepdf
107 Kampala Capital City Authority Kampala Climate Change Action Energy and Climate Profile Available httpswwwkccagouguDocsEnergy20and20Climate20Profilepdf
108 Ibid
109 C40 Cities Climate Leadership Group Good Practice Guide Creditworthiness Available httpwwwc40orgnetworkscreditworthiness (accessed August 2017)
84
R E F E R E N C E S
110 C40 Cities Climate Leadership Group Case Study Cities100 Nanjing ndash Worldrsquos Fastest Electric Vehicle Rollout Available httpwwwc40orgcase_studiescities100-nanjing-world-s-fastest-electric-vehicle-rollout (accessed August 2017)
111 Ibid
112 Ibid
113 Nanjing Think-tank Alliance (2015) Develop Low Carbon Industries to Promote Building Nanjing as a Low-Carbon Ecological City Available httpwwwnjzxgovcnzxzz_2016jy_2016201610P020161014417408026102pdf
114 Ibid
115 Nanjing Municipal Peoplersquos Government (2016) 2016 New Energy Automobile Promotion and Application Plan of Nanjing Available httpwwwnanjinggovcnxxgkszf201607t20160712_4023115html
116 Up to 80 of Public Buses in Nanjing Could Be Renewable-Powered This Year (15 April 2017) Yangtse Evening Post Available httppicyangtsecomepaperyaowen2017-04-151236337html
117 Ibid
118 Peoplersquos Republic of China Central Government (2013) Notice of the Ministry of Transport on Issuing Accelerating Development of Green Circular Low-Carbon Transportation Available from httpwwwgovcngongbaocontent2013content_2466586htm
119 Ministry of Transport and Jiangsu Province Sign Framework Agreement on Developing Green Circular and Low-Carbon Transportation (10 June 2013) Idea Carbon Available httpwwwideacarbonorgarchives15745
120 Jiangsu Provincial Government Information Hub Notice of the General Office of Jiangsu Provincial Peoplersquos Government on Issuing Green Circular and Low-Carbon Transportation Development Plan of Jiangsu Province (2013-2020) Available httpwwwjsgovcnjsgovtjbgt201408t20140804452293html
121 C40 Cities Climate Leadership Group Case Study Cities100 Nanjing - Worldrsquos Fastest Electric Vehicle Rollout Available httpwwwc40orgcase_studiescities100-nanjing-world-s-fastest-electric-vehicle-rollout (accessed August 2017)
122 China EV Startup Future Mobility to Build $17 Billion Factory (19 January 2017) Bloomberg News Available httpswwwbloombergcomnewsarticles2017-01-19china-ev-startup-future-mobility-to-build-1-7-billion-factory
123 Gofun launches in Nanjing Ease of Parking for Renewable-Powered Cars (28 March 2017) Electrical Vehicle Resources Available httpwwwevpartnercomnews64detail-26143html
124 Nanjing and Changzhou Approved as National Low-Carbon Pilot Cities (18 February 2017) Xinhua Yangtze River Delta News Available httpcsjxinhuanetcom2017-0218c_136066174htm
125 Jia Y and Yuan J (2017) Nanjingrsquos complete industry chain EV operating alliance How to survive in the face of reduced policy subsidies The Paper Available from httpwwwthepapercnnewsDetail_forward_1776716
126 United States Environmental Protection Agency What are the harmful effects of SO2 Available httpswwwepagovso2-pollutionsulfur-dioxide-basicseffects (accessed September 2017)
127 Vaacutesquez P Restrepo-Tarquino I Acuntildea J and Vaacutesquez S (2017) Women Fostering Energy Efficiency Through Cleaner Production GEADES-UAO Univalle and El Castillo
128 Ibid
129 Ibid
130 Ibid
131 Markham D (19 October 2015) How long will solar panels last CleanTechnica Available httpscleantechnicacom20151019how-long-will-solar-panels-last
132 United Nations Framework Convention on Climate Change (UNFCCC) Momentum for Change Fostering Cleaner Production Available httpunfcccintsecretariatmomentum_for_changeitems9258php (accessed July 2017)
133 Ibid
134 Vaacutesquez P Restrepo-Tarquino I Acuntildea J and Vaacutesquez S (2017) Women Fostering Energy Efficiency Through Cleaner Production GEADES-UAO Univalle and El Castillo
135 Vaacutesquez P and Restrepo I (2016) Women learning alliances for greening manufacturing industries in developing countries From the 2016 International Conference on Sustainable Development (ICSD) September 21 and 22 2016 Columbia University New York New York Available httpic-sdorg20170203proceedings-from-icsd-2016
136 Vaacutesquez P Restrepo-Tarquino I Acuntildea J and Vaacutesquez S (2017) Women Fostering Energy Efficiency Through Cleaner Production GEADES-UAO Univalle and El Castillo
137 Vaacutesquez P and Restrepo I (2016) Women learning alliances for greening manufacturing industries in developing countries From the 2016 International Conference on Sustainable Development (ICSD) September 21 and 22 2016 Columbia University New York New York Available httpic-sdorg20170203proceedings-from-icsd-2016
138 United Nations Framework Convention on Climate Change (UNFCCC) Momentum for Change Fostering Cleaner Production Available httpunfcccintsecretariatmomentum_for_changeitems9258php (accessed July 2017)
139 Vaacutesquez P and Restrepo I (2016) Women learning alliances for greening manufacturing industries in developing countries From the 2016 International Conference on Sustainable Development (ICSD) September 21 and 22 2016 Columbia University New York New York Available httpic-sdorg20170203proceedings-from-icsd-2016
140 City of Mexico (2012) Programa de Certificacioacuten de Edificaciones Sustentables Ministry of the Environment Available httpmarthaorgmxuna-politica-con-causawp-contentuploads20130915-Certificacion-Ed ificaciones-Sustentablespdf
141 Trencher G Takagi T Nishida Y Downy F (2017) Urban Efficiency II Seven Innovative City Programmes for Existing Building Energy Efficiency Tokyo Metropolitan Government Bureau of Environment and C40 Cities Climate Leadership
142 Tanya Muumlller Garciacutea Secretary of the Environment Mexico City email correspondence 14 September 2017
143 Ibid
144 Ibid
145 Interview with Tanya Muumlller Garciacutea Secretary of the Environment Mexico City 29 August 2017
146 Trencher G Takagi T Nishida Y Downy F (2017) Urban Efficiency II Seven Innovative City Programmes for Existing Building Energy Efficiency Tokyo Metropolitan Government Bureau of Environment C40 Cities Climate Leadership
147 Interview with Tanya Muumlller Garciacutea Secretary of the Environment Mexico City 29 August 2017
148 Trencher G Takagi T Nishida Y Downy F (2017) Urban Efficiency II Seven Innovative City Programmes for Existing Building Energy Efficiency Tokyo Metropolitan Government Bureau of Environment C40 Cities Climate Leadership
149 Cuidad de Meacutexico Secretariacutea de Medio Ambiente Transition and energy efficiency priority themes for the CDMX are presented in New York Available httpwwwsedemacdmxgobmxcomunicacionnotatransicion-y-eficiencia-energetica-temas-prioritarios-para-la-cdmx-son-presentados-en-nueva-york
150 Mexico City (2016) Mexico Cityrsquos Climate Action Program 2014-2020 Progress Report 2016 Available httpwwwdatasedemacdmxgobmxcambioclimaticocdmximagesbiblioteca_ccPACCM-inglespdf
151 Jones S (24 April 2014) Can Mexico Cityrsquos roof gardens help the metropolis shrug off its smog The Guardian Available httpswwwtheguardiancomglobal-development2014apr24mexico-city-roof-gardens-pollution-smog
152 World Resources Institute (2016) Mexico City Prioritizes Building Efficiency with New Regulations httpwwwwrirosscitiesorgnewsmexico-city-prioritizes-building-efficiency-new-regulations
153 New partnership targets energy consumption in buildings to reduce emissions in Mexico City (1 April 2015) World Resources Institute Available httpwwwwrirosscitiesorgnewsnew-partnership-targets-energy-consumption-buildings-reduce-emissions-mexico-city
154 Bagu T et al (2016) Market Study Captive Power in Nigeria (A Comprehensive Guide to Project Development) Africa-EU Energy Partnership amp Africa-EU Renewable Energy Cooperation Program Available httpreancomngimgmarket_study_captive_power_nigeria_0pdf
155 Kazeem Y (21 December 2015) A floating school in Lagos has helped bring solar power to one of the cityrsquos oldest slums Quartz Media Available httpsqzcom578843a-floating-school-in-lagos-has-helped-bring-solar-power-to-one-of-the-citys-oldest-slums
156 Nigeriarsquos Solar Stylists (3 March 2017) DW News Available httpwwwdwcomennigerias-solar-stylistsa-38210081
157 Eitan Hochster Director of Business Development Lumos Global email 17 September 2017
158 Shalev A (9 February 2017) Solar Power Taking Hold in Nigeria One Mobile Phone at a Time Inside Climate News Available httpsinsideclimatenewsorgnews07022017solar-energy-nigeria-africa-renewable-energy-climate-change-lumos
159 Ibid
160 Interview with Eitan Hochster Director of Busines Development Lumos Global 30 August 2017
161 Rotshuizen S (28 July 2017) From the Practitioner Hub Interview with Ron Margalit from solar home system provider Lumos Inclusive Business Accelerator Available httpsibaventures20170728from-the-practitionerhub-interview-with-ron-margalit-from-solar-home-system-provider-lumos
162 Kazeem Y (8 October 2015) Nigerian mobile money leader Paga is doubling down on building a payments giant Quartz Available from httpsqzcom520115nigerian-mobile-money-leader-paga-is-doubling-down-on-building-a-payments-giant
163 Interview with Eitan Hochster Director of Busines Development Lumos Global 30 August 2017
164 Brent W (4 August 2016) In conversation with Leigh Vial Power for All Available httpwwwsolar-ngcom20160804vial-nigerias-solar-revolution-has-begun
165 Ibid
85
REFERENCES g
166 Agomuo Z (24 October 2014) Consumers get succour from renewable energy as power supply challenges persist Business Day Available httpswwwbusinessdayonlinecomconsumers-get-succour-from-renewal-energy-as-power-supply-challenges-persist
167 Interview with Eitan Hochster Director of Busines Development Lumos Global 30 August 2017
168 Shalev A (9 February 2017) Solar Power Taking Hold in Nigeria One Mobile Phone at a Time Inside Climate News Available httpsinsideclimatenewsorgnews07022017solar-energy-nigeria-africa-renewable-energy-climate-change-lumos
169 Africa Progress Panel (2015) Power People Planet Africa Progress Report (Geneva Africa Progress Panel) Accessed via International Renewable Energy Agency (IRENA) (2016) Solar PV in Africa Costs and Markets Available httpwwwirenaorgmenuindexaspxmnu=SubcatampPriMenuID=36ampCatID=141ampSubcatID=2744
170 Are Off-Grids the Answer to Nigeriarsquos Energy Crisis Heinrich Boll Stiftung Available from httpsngboellorgtrue-cost-electricity (accessed July 2017)
171 Interview with Eitan Hochster Director of Busines Development Lumos Global 30 August 2017
172 Interview with Uvie Ugono Founder and CEO Solynta 31 August 2017
173 Rotshuizen S (28 July 2017) From the Practitioner Hub Interview with Ron Margalit from solar home system provider Lumos Inclusive Business Accelerator Available httpsibaventures20170728from-the-practitioner-hub-interview-with-ron-margalit-from-solar-home-system-provider-lumos
174 Interview with Uvie Ugono Founder and CEO Solynta 31 August 2017
175 Solar Nigeria Programme ldquoSolar Nigeria adds 170000 solar homes in just 1 yearrdquo (16 February 2017) Available from httpwwwsolar-ngcom20170216solar-nigeria-adds-170000-solar-homes-in-just-1-year
176 Shalev A (9 February 2017) Solar Power Taking Hold in Nigeria One Mobile Phone at a Time Inside Climate News Available httpsinsideclimatenewsorgnews07022017solar-energy-nigeria-africa-renewable-energy-climate-change-lumos
177 Rotshuizen S (28 July 2017) From the Practitioner Hub Interview with Ron Margalit from solar home system provider Lumos Inclusive Business Accelerator Available httpsibaventures20170728from-the-practitioner-hub-interview-with-ron-margalit-from-solar-home-system-provider-lumos
178 Thomson Reuters and CDP have collaborated on this report to bring together the latest data from companies that do report emissions and the latest estimates for those which do not or incompletely report emissions The finance sector was excluded as there are insufficient estimates on its Scope 3 emissions
179 This is measured against total anthropogenic emissions including land use of approximately 52 Gigatons CO2e This number includes direct indirect and value chain emissions (scopes 1 2 and 3) adjusted for a double counting of 60
180 Top 15 in terms of total annual aggregate emissions In the table a GHG Index above 100 indicates an increasing emissions trend a Revenues Index above 100 indicates an increasing revenue trend a Decoupling Index above 100 indicates that revenues are increasing faster than emissions and an Employment Index above 100 indicates an increasing employment trend
181 This is measured against total anthropogenic emissions including land use of approximately 52 Gigatons CO2e This number includes direct indirect and value chain emissions (scopes 1 2 and 3) adjusted for double counting of 60
182 Values which are ldquoNArdquo for 2016 are not available yet because they are not provided by the companies in a manner which allows for peer comparison and therefore require further analysis all values will be available by end of 2017 andor in the full Global 250 Report
183 Note this is an abridged version of case study as it appears in the full Global 250 report
184 Of the examples of emerging leadership in this report Total Group represents an underlying thesis that even the most carbon intensive firms have the opportunity for transformative business model change
185 According to Total completed CDP Climate Change information request submissions
186 httpwwwannualreportscomHostedDataAnnualReportArchivetNYSE_TOT_2015pdf
187 Kuramochi et al (2016) ldquoThe ten most important short-term steps to limit warming to 15Crdquo Climate Action Tracker Available httpclimateactiontrackerorgassetspublicationspublicationsCAT_10Steps_Summarypdf
188 Mission2020 2020 The Climate Turning Point Available httpwwwmission2020global202020The20Climate20Turning20Pointpdf
189 N Hoehne et al (2015) Developing 2C Compatible Investing Criteria NewClimate Institute Germanwatch and 2deg Investing Initiative Available httpswwwnewclimateinstitutefileswordpresscom2015112criteria-finalpdf
190 Ibid
191 International Energy Agency (2017) Energy Technology Perspectives Available wwwieaorgpublicationsfreepublicationspublicationEnergyTechnologyPerspectives2017ExecutiveSummaryEnglishversionpdf
192 Asian Development Bank (2016) The Asian Development Bank and the Climate Investment Funds Country Fact Sheets Second Edition ADB Climate Change and Disaster Risk Management Division Retrieved from wwwadborgsitesdefaultfilespublication167401adb-cif-country-fact-sheets-2nd-edpdf
193 GEF (2013) GEF Secretariat Review for FullMedium-Sized Projects GEF ID 5340 Retrieved from wwwthegeforgsitesdefaultfilesproject_documents5340-2013-04-25-152137-GEFReviewSheetGEF52
194 United Nations Environment Programme (UNEP) amp Bloomberg New Energy Finance (2017) Retrieved from httpfs-unep-centreorgsitesdefaultfilespublicationsglobaltrendsinrenewableenergyinvestment2017pdf
195 International Energy Agency 2017 Global energy investment fell for a second year in 2016 as oil and gas spending continues to drop Available httpswwwieaorgnewsroomnews2017julyglobal-energy-investment-fell-for-a-second-year-in-2016-as-oil-and-gas-spending-chtml
196 Frankfurt School-UNEP CentreBloomberg New Energy Finance (2017) Global Trends in Renewable Energy Investment 2017 httpwwwfs-unep-centreorg (Frankfurt am Main) Available httpfs-unep-centreorgsitesdefaultfilespublicationsglobaltrendsinrenewableenergyinvestment2017pdf
197 Organisation for Economic Co-operation and Development (OECD) (2016) Creditor Reporting System Retrieved from httpsstatsoecdorgIndexaspxDataSetCode=CRS1
198 Organisation for Economic Co-operation and Development (OECD) (2016) Creditor Reporting System Retrieved from httpsstatsoecdorgIndexaspxDataSetCode=CRS1
199 For this analysis ldquoimplementedrdquo projects are those that have been approved by the end of 2016 and will achieve emissions by 2020
200 World Bank (2015) International Financial Institution Framework for a Harmonised Approach to Greenhouse Gas Accounting Available httpwwwworldbankorgcontentdamWorldbankdocumentIFI_Framework_for_Harmonized_Approach20to_Greenhouse_Gas_Accountingpdf
201 Organisation for Economic Co-operation and Development (OECD) (2016) Creditor Reporting System Retrieved from httpsstatsoecd orgIndexaspxDataSetCode=CRS1
202 World Bank (2015) International Financial Institution Framework for a Harmonised Approach to Greenhouse Gas Accounting Available httpwwwworldbankorgcontentdamWorldbankdocumentIFI_Framework_for_Harmonized_Approach20to_Greenhouse_Gas_Accountingpdf
203 J Bai (2013) Chinarsquos Overseas Investments in the Wind and Solar Industries Trends and Drivers Working Paper Washington DC World Resources Institute Retrieved from httpwwwwriorgpublicationchina-overseasinvestments-in-wind-and-solar-trends-and-drivers
204 Cells shaded grey indicates no data available
205 Official Development Assistance + Other Official Flows
206 Organization for Economic Cooperation and Development Creditor Reportign System Retrieved from httpsstatsoecdorgIndexaspxDataSetCode=CRS1
207 Agence Franccedilaise de Deacuteveloppment (2016) 2015 Our Work Around the World Retreived from httpwwwafdfrwebdavsiteafdsharedPUBLICATIONSColonne-droiteRapport-annuel-AFD-VApdf
208 Soular R (2016) China becomes worldrsquos biggest development lender The Third Pole Retrieved from httpswwwthethirdpolenet20160601china-becomes-worlds-biggest-development-lender
209 UK International Climate Finance (2016) 2016 UK Climate Finance Results Retrieved from httpswwwgovukgovernmentuploadssystemuploadsattachment_datafile5534022016-UK-Climate-Finance-Results2pdf
210 FinnFund (2016) Annual Report 2015 Retrieved from httpannualreportfinnfundfi2015filebank753-Annual_Report_2015pdf
211 FMO (2016) 2015 Annual Report Retrieved from httpannualreportfmonlllibrarydownloadurnuuid921394c0-bb5b-45d9-99e9-18d09fd21961fmo_annualreport2015_onlinepdfformat=save_to_diskampext=pdf
212 The International Climate Initiative (IKI) the German governmentrsquos climate funding instrument supplies the funds for many GIZ RE and EE projects GIZ is the implementing organization for these projects while IKI is the supporting institution
213 Deutsche Gesellschaft fuumlr Internationale Zusammenarbeit (GIZ) GmbH Projects Retrieved from httpswwwgizdeprojektdatenindexactionrequest_locale=en_EN
214 KfW Development Bank (24 February 2016) Presentation on KfW Development Bank 2015 Environment and Climate Commitments amp CO2 ndash Monitoring Retrieved from httpsurldefenseproofpointcomv2urlu=https-3A__wwwkfw-2Dentwicklungsbankde_PDF_Entwicklungsfinanzierung_Umwelt-2Dund-2DKlima_Zahlen-2DDaten-2DStudien_KfW-2DKlimafinanzierung-2Din-2DZahlen_Umwelt-2DKlimaneuzusagen-2D2015-5FENpdfampd=CwIFAwampc=-109dg2m7zWuuDZ0MUcV7Sdqwampr=KjRxMDLnH5mYpLVbZF3u_UtYA0frxBmccQMurQoKFFkampm=z0-IQV0b8MFl57AlNkF_zVMGgXCzaqh3KPZ-K_-AgW8amps=W9Ezfc2ZuAIrScF_-ljhjQYyn0PGffRYH23Qo_dQTgAampe=215 Retrieved from httpswwwjicagojpenglishpublicationsreportsannual2015c8h0vm00009q82bmattc8h0vm00009q82o5pdf
215 Retrieved from httpswwwjicagojpenglishpublicationsreportsannual2015c8h0vm00009q82bm-att2015_36pdf
216 Norfund (2016) 2015 Report on Operations Norwegian Investment Fund for Developing Countries Retrieved from httpsissuucommerkurgrafiskdocsnorfund_virksomhetsrapport_2016_blae=1379933435569369
217 Overseas Private Investment Corporation OPIC Annual Report 2015 Retrieved from httpswwwopicgovsitesdefaultfilesfiles2015annualreportpdf
86
R E F E R E N C E S
218 Global Environment Facility (2016) About us Retrieved from httpswwwthegeforgabout-us
219 Climate Investment Funds (2016) What we do Retrieved from httpwww-cifclimateinvestmentfundsorgabout
220 Cells shaded grey indicate no data available
221 Asian Development Bank (2016) 2015 Clean Energy Investment Project Summaries Retrieved from httpswwwadborgsitesdefaultfilespublication184537clean-energy-investment-2015pdf
222 Asian Infrastructure Investment Bank (2016) The Peoplersquos Republic of Bangladesh Distribution System Upgrade and Expansion Project Retrieved from httpswwwaiiborgenprojectsapproved2016_downloadbangladeshsummarybangladesh_distribution_system_upgrade_and_expansionpdf
223 Climate Investment Funds (2016) Empowering a Greener Future Annual Report 2015 Retrieved from httpwww-cifclimateinvestmentfundsorgsitesdefaultfilesannual-report-2015cif-annual-report-ebookpdf
224 Climate Investment Funds (2016) Empowering a Greener Future Annual Report 2015 Retrieved from httpwww-cifclimateinvestmentfundsorgsitesdefaultfilesannual-report-2015cif-annual-report-ebookpdf
225 European Investment Bank (2016) 2015 Activity Report Retrieved from httpwwweiborgattachmentsgeneralreportsar2015enpdf
226 European Investment Bank (2015) 2014 Sustainability Report Retrieved from httpwwweiborgattachmentsgeneralreportssustainability_report_2014_enpdf
227 Green Climate Fund (2016) Resources Mobilized Retrieved from httpwwwgreenclimatefundpartnerscontributorsresources-mobilized
228 Global Environment Facility Behind the Number 2015 A Closer Look at GEF Achievements Retrieved from httpswwwthegeforgsitesdefaultfilespublicationsGEF_numbers2015_CRA_bl2_web_1pdf
229 Global Environment Facility About Us Retrieved from httpswwwthegeforgabout-us
230 World Bank Group (2016) Corporate Scorecards Retrieved from httppubdocsworldbankorgen963841460405876463WBG-WBScorecardpdfzoom=100
231 Proparco (2016) Key Figures 2015 Retrieved from httpwwwproparcofrwebdavsiteproparcosharedELEMENTS_COMMUNSPDFChiffres20ClefsProparco_Key_Figures_2015_UK_Webpdf
232 World Bank (2015) International Financial Institution Framework for a Harmonised Approach to Greenhouse Gas Accounting Available httpwwwworldbankorgcontentdamWorldbankdocumentIFI_Framework_for_Harmonized_Approach20to_Greenhouse_Gas_Accountingpdf
233 Frankfurt School-UNEP CentreBNEF (2016) Global Trends in Renewable Energy Investment 2016 Retrieved from httpfs-unep-centreorgsitesdefaultfilespublicationsglobaltrendsinrenewableenergyinvestment2016lowres_0pdf
234 Houmlglund-Isaksson L Purohit P Amann M Bertok I Rafaj P Schoumlpp W Borken-Kleefeld J 2017 Cost estimates of the Kigali Amendment to phase-down hydrofluorocarbons Environmental Science amp Policy 75 138ndash147 doihttpdxdoiorg101016jenvsci201705006
235 UN Environment Programme (UNEP) (2017) The 2017 Emissions Gap Report Available httpwwwuneporgemissionsgap
236 International Energy Agency (2017) Energy Technology Perspectives Available wwwieaorgpublicationsfreepublicationspublicationEnergyTechnologyPerspectives2017ExecutiveSummaryEnglishversionpdf
237 Westphal M I Canfin P A S C A L Ballesteros A T H E N A amp Morgan J E N N I F E R (2015) Getting to $100 Billion Climate Finance Scenarios and Projections to 2020 World Resources Institute Working Paper Available at httpswwwwriorgsitesdefaultfilesgetting-to-100-billion-finalpdf
238 IRENA 2016 Data amp Statistics International Renewable Energy Agency Abu Dhabi United Arab Emirates Available at httpresourceirenairenaorggatewaydashboardtopic=4ampsubTopic=15 [Accessed September 20 2016]
239 IEA 2016 Energy Technology Perspectives 2016 Towards Sustainable Urban Energy Systems International Energy Agency Paris France
240 IGES 2016 List of grid emission factors Update August 2016 Hayama Japan Institute for Global Environmental Stratgegies (IGES) Available at httppubigesorjpmodulesenvirolibviewphpdocid=2136 [Accessed September 30 2016]
241 OECD 2016 OECDStat Query Wizard for International Development Statistics Available at httpstatsoecdorgqwids [Accessed September 30 2016]
242 Buchner BK Trabacchi Chiara Federico M Abramskiehn D amp Wang D 2015 Global Landscape of Climate Finance 2015 Climate Policy Initiative
243 USD 49 billion was identified for renewable energy projects and USD 26 billion for energy efficiency projects
87
GLOSSARY g
GLOSSARY
The entries in this glossary are adapted from definitions provided by authoritative sources such as the Intergovernmental Panel on Climate Change and UN Environment
Additionality a criterion that stipulates that emissions savings achieved by a project must not have happened anyway had the project not taken place
Baseline Scenario the scenario that would have resulted had additional mitigation efforts and policies not taken place
Bilateral Development Organization a bilateral development organization mobilizes public funds from national budgets to finance development initiatives abroad Some groups also raise capital from private markets and some use both public and private financing in their operations Development institutions generally finance projects via grants andor loans distributed to governments of recipient nations which in turn distribute funding to ministries local agencies and firms in charge of project implementation
Bottom-up analysis a method of analysis that looks at the aggregated emissions impact from individual renewable energy and energy efficiency projects
Business as usual the scenario that would have resulted had additional mitigation efforts and policies not taken place (with respect to an agreed set)
Developing Countries this report uses the same definition of developing countries as used by organizations such as the IEA or IRENA243
Double counting the situation where the same emission reductions are counted towards meeting two partiesrsquo pledges (for example if a country financially supports an initiative in a developing country and both countries count the emissions towards their own national reductions)
Emission pathway the trajectory of annual global greenhouse gas emissions over time
International Financial Institutions (IFIs) banks that have been chartered by more than one country
Multilateral Development Banks (MDBs) financial institutions that draw public and private funding from multiple countries to finance development initiatives in developing countries These organizations often fund projects in collaboration with each other employing multi-layered finance agreements that include grants loans and leveraged local funding
Scenario a hypothetical description of the future based on specific propositions such as the uptake of renewable energy technologies or the implementation of energy efficiency standards
Top-down analysis a method of analysis that uses aggregated data often supplied by organizations that support renewable energy and energy efficiency projects in developing countries to determine global impact of a certain policy measure group etc
88
A C R O N Y M S
ACRONYMS
pound British Pound
euro Euro
2DS 2degC Scenario
B2DS Beyond 2degC Scenario
AFD Agence Franccedilaise de Deacuteveloppement
ADB Asian Development Bank
APEC Asia Pacific Economic Cooperation
BAU Business as usual
BAT Best available technology
BECCS Bioenergy with carbon capture and storage
BEIS UK Department for Business Energy amp Industrial Strategy
AFD Agence Franccedilaise de Deacuteveloppement
ADB Asian Development Bank
CAT Climate Action Tracker
CCS Carbon capture and storage
CDP Carbon Disclosure Project
CF Capacity factor
CIF Climate Investment Fund
CO2 Carbon dioxide
CO2e Carbon dioxide equivalent
DEFRA Department for Environment Food amp Rural Affairs of the United Kingdom of Great Britain and Northern Ireland
DFID UK Department for International Development of the United Kingdom of Great Britain and Northern Ireland
EC European Commission
ECOWAS Economic Community of West African States
EE Energy efficiency
EIA Energy Information Administration of the United States of America
EIB European Investment Bank
EJ Exajoule
ES Energy saved or substituted
ETP Energy Technology Perspectives
EV Electric vehicle
FIT Feed-in tariff
JICA Japan International Cooperation Agency
GDP Gross domestic product
GEEREF Global Energy Efficiency and Renewable Energy Fund
GEF Global Environment Facility
GHG Greenhouse gas
GIZ Deutsche Gesellschaft fuumlr Internationale Zusammenarbeit
GNI Gross national income
Gt Gigaton
GW Gigawatt
kg kilogram
kWh Kilowatt hours
LED Light Emitting Diode
LCA Life-Cycle Analysis
LDV Light-duty vehicle
IDS Institute for Development Support
IEA International Energy Agency
IFI International Financial Institution Framework for a Harmonised Approach to Greenhouse Gas Accounting
IKI International Climate Initiative
IPCC Intergovernmental Panel on Climate Change
IRENA International Renewable Energy Agency
ISO International Organization for Standardization
MDB Multilateral development banks
MWh Megawatt-hour
NDCs Nationally Determined Contributions
NDEs National designated entities
NEEAPs National Energy Efficiency Action Plans
ODA Official development assistance
OECD Organisation for Economic Cooperation and Development
PPA Power purchase agreement
PV Photovoltaic
PWh Petawatt-hour
RampD Research and development
RE Renewable energy
REN21 Renewable Energy Policy Network for the 21st Century
REEEP Renewable Energy and Energy Efficiency Partnership
RPS Renewable Portfolio Standards
Rs Indian Rupee
RTS Reference Technology Scenario
SBCP Sustainable Buildings Certification Program
SBT Science-Based Targets
SDGs Sustainable Development Goals
SE4ALL Sustainable Energy For All
TWh Terawatt hour
UNFCCC United Nations Framework Convention on Climate Change
US $ United States Dollars
WEO World Energy Outlook
WRI World Resources Institute
WWF World Wildlife Fund
89
IMPRESSUMPICTURE RIGHTS g
IMPRESSUMPICTURE RIGHTS
Titelpage People using lights powered by Off-Grid Electricrsquos solar service mPower copy Power Africa Geothermally active groundshutterstock SvedOliver Hrsquomong ethnic minority childrenLaocai Vietnam Wind Farmshutterstock Mongkol Udomkaew
page 9 Matemwe village Zanzibar Sam EatonPRI
page 10 Udaipur India
page 13 Nanjing China
page 14 World Bank Photo Collections Fotos
page 19 Kuala Lumpur Malaysia Hanoi Vietnam
page 20 Women prepare matoke dish Kampala copy IFPRIMilo Mitchell
page 22 Jama Masjid Old Delhi India
page 23 New Delhi India New Delhi India Amravati India
page 24 Kampala Uganda
page 26 Nanjing Jianye District China Nanjing China car chargerFlickr copy Haringkan Dahlstroumlm CC BY 20
page 27 Wikimedia Commons DKMcLaren CC BY-SA 40
page 28 Cali Valle Del Cauca Colombia Creative Commons licensed by user CoCreatr on Flickr CoCreatrtypepadcom
page 30 Alameda (central park) MexicoCityFlickr Ingrid Truemper CC BY-NC 20 gardens integrated into buildingUnSplash Oliver Wendel
page 32 Lagos NigeriaFlickr Seun Ismail CC BY-NC 20 Figmentmediacouk Jessica Seldon Department for International Development (DFID) CC BY 20 Bariadi TanzaniaFlickr Russell Watkins Department for International Development (DFID) CC BY 20 Flickr Russell WatkinsDepartment for International Development CC BY 20 Uribia Colombia
page 33 Bariadi Tanzania Flickr Russell Watkins Department for International Development CC BY 20
page 35 Luxembourgshutterstock Vytautas Kielaitis
page 37 Monumento a la Revolucion Mexico City Mexico
page 38 India shutterstock singh_lens
page 39 Flickr David Mellis CC BY 20 Mwanza TanzaniaFlickr Russell Watkins Department for International Development (DFID)
page 40 Lambarene Gabon Africa Tay Son streetHanoi Vietnam
page 50 Nanjing Yangtze River BridgeFlickr Jack No1 CC BY 30
page 51 Bariadi TanzaniaFlickr Russell WatkinsDepartment for International Development (DFID) CC BY 20
page 54 Hanoi Vietnam Hanoi Metro Hanoi Vietnamwikimedia commons Autumnruv CC BY-SA 40
page 55 gobi desert central asia
page 56 Plaza de Caicedo Cali Colombia
page 58 Kokemnoure Burkina Faso
page 59 shutterstock LIUSHENGFILM
page 62 barefoot-bannerjpg
page 63 Kampala Uganda
page 69 shutterstock Srdjan Randjelovic
page 70 Casablanca Morocco
page 71 Mexico City Mexico Rwanda camp for internally displaced people (IDP) Tawila North DarfurFlickr Albert Gonzalez Farran UNAMID CC BY-NC-ND 20
page 74 Morocco shutterstock
page 75 People using lights powered by Off-Grid Electricrsquos solar service mPower copy Power Africa
page 87 Siem Reap Cambodia
page 89 Isla Contoy Mexico
+2degC
UN Environment
PO Box 30552 Nairobi Kenya
Tel ++254-(0)20-762 1234
Fax ++254-(0)20-762 3927
uneppubuneporg
Email 1gigatonuneporg
www1gigatoncoalitionorg
ISBN 978-92-807-3671-7
Job Nr DTI2132PA
UN Environment promotes environmentally sound practices
globally and in its own activities This publication is printed on 100 recycled paper
using vegetable - based inks and other eco-friendly practices Our distribution policy aims to
reduce UN Environmentlsquos carbon footprint
Togu Cover inside GreenDotindd 1 112509 94923 AM
A digital copy of this report is available at 1gigatoncoalitionorg
Copyright copy United Nations Environment Programme 2017
This publication may be reproduced in whole or in part and in any form for educational or non-profit purposes without special permission from the copyright holder provided acknowledgement of the source is made The United Nations Environment Programme would appreciate receiving a copy of any publication that uses this publication as a source
No use of this publication may be made for resale or for any other commercial purpose whatsoever without prior permission in writing from the United Nations Environment Programme
Disclaimer
The designations employed and the presentation of the material in this publication do not imply the expression of any opinion whatsoever on the part of the United Nations Environment Programme concerning the legal status of any country territory city or area or of its authorities or concerning delimitation of its frontiers or boundaries Moreover the views expressed do not necessarily represent the decision or the stated policy of the United Nations Environment Programme nor does citing of trade names or commercial processes constitute endorsement
ISBN No 978-92-807-3671-7
Job No DTI2132PA
Renewable Energy and Energy Efficiency in Developing CountriesContributions to Reducing Global Emissions
Third Report | 2017
+2degC
LEAD AUTHORS Yale University Angel Hsu Carlin Rosengarten
Amy Weinfurter Yihao Xie
REN21 Evan Musolino Hannah E Murdock
REVIEWERS
Niklas Houmlhne Markus Hagemann and Takeshi Kuramochi
(NewClimate Institute) Philip Drost (UN Environment)
Nathan Borgford-Parnell and Hanxiang Cong (Institute for
Governance and Sustainable Development) Zhao Xiusheng
(Tsinghua University China)
COUNTRY INITIATIVE AND DATA CONTRIBUTORS Case study support We thank and acknowledge following individuals for their valuable
assistance providing consultation feedback and information to
inform the case studies
Jaime Acuntildea (Univalle)Adedoyin Adeleke (Centre for Petroleum
Energy Economics and Law University of Ibadan) Ayooluwa Adewole
(Centre for Petroleum Energy Economics and Law University of
Ibadan) Godwin Aigbokhan (Renewable Energy Association of
Nigeria (REAN)) Habiba Ali (SOSAI Renewable Energies Company)
Centro Regional de Produccioacuten maacutes Limpia (CRPML) Corporacioacuten
Autoacutenoma Regional del Valle del Cauca (CVC) Tolu Fakunle (Centre
for Petroleum Energy Economics and Law University of Ibadan)
Eitan Hochster (Lumos Global) Janet Kajara (Kampala Capital
City Authority (KCCA)) Shehu Ibrahim Khaleel (Renewable Energy
Resources Development Initiatives (RENDANET)) Edison Masereka
(Kampala Capital City Authority (KCCA)) Nolbert Muhumuza (Awuma
Biomass) Tanya Muumlller Garcia (Secretary of Environment Mexico
City) Eleth Nakazzi (Kampala Capital City Authority (KCCA)) Ines
Restrepo-Tarquino (Univalle) Patricia Ugono (Solynta) Uvie Ugono
(Solynta) Paola Andrea Vaacutesquez (GEADES-UAO) Sandra Vaacutesquez
(El Castillo)
Multistakeholder partnerships Patrick Blake (enlighten U4E) Callum Grieve (Sustainable Energy
for All (SEforALL)) Martin Hiller (Renewable Energy and Energy
Efficiency Partnership (REEEP)) Irma Juskenaite (Climate Technology
Centre and Network (CTCN)) Tatiana Kondruchina (Climate and
Clean Air Coalition (CCAC)) Celia Martinez (District Energy in Cities
Initiative) Wei-Shiuen Ng (International Transport Forum OECD)
Eva Kelly Oberender (Renewable Energy and Energy Efficiency
Partnership (REEEP)) Ellen Paton (UK International Climate Fund
(ICF)) Quinn Reifmesser (Renewable Energy and Energy Efficiency
Partnership (REEEP)) Andrea Risotto (NDC Partnership) Nora
Steurer (The Global Alliance for Buildings and Construction (GABC))
Jukka Uosukainen (Climate Technology Centre and Network (CTCN))
Maria van Veldhuizen (Renewable Energy and Energy Efficiency
Partnership (REEEP)) Gunnar Wegner (Energizing Development and
Climate Mitigation (EnDev)) Elke Westenberger (Moroccan Climate
Change Competence Centre (4C Maroc)) Laura Williamson (REN21)
Peter Wright (Sustainable Energy for All (SEforALL))
Data gathering Markus Kurdziel (IKI) Sarah Leitner (IKI) Karoline Teien Blystad
(Norfund) Lucie Bernatkova (EIB) Cyrille Arnould (EIB) Aglaeacute Touchard-
Le Drain (EIB) Martina Jung (KfW) Milena Gonzalez Vasquez (GEF)
David Elrie Rodgers (GEF) Ichiro Sato (JICA) Yoji Ishii (JICA)
THOMSON REUTERS
A contribution from Thomson Reuters report ldquoGlobal 250
Greenhouse Gas Emitters A New Business Logicrdquo is included in
chapter 3 Lead Authors
David Lubin Constellation Research and Technology John
Moorhead BSD Consulting Timothy Nixon Thomson Reuters
The authors would like to thank and acknowledge the important
contributions of Chris Mangieri Dan Esty and Jay Emerson of Yale
University and Constellation Research and Technology
Important data and analytics support was provided by Frank Schilder
Thomson Reuters Research amp Development Adam Baron from
Thomson Reuters Content Analytics and Ian van der Vlugt from CDP
PROJECT MANAGEMENT AND COORDINATION
Zitouni Ould- Dada (UN Environment)
Rashmi Jawahar Ganesh (UN Environment)
REN21
The 1 Gigaton Coalition would like to thank and acknowledge the
invaluable assistance of REN21 namely Hannah E Murdock for
research coordination and Linh H Nguyen for research support
DESIGN AND LAYOUT Weeksde Webeagentur GmbH
ACKNOWLEDGEMENTS
5
1 INTRODUCTION 10
2 DEVELOPING COUNTRIESrsquo EFFORTS AND ACHIEVEMENTS IN ENERGY EFFICIENCY AND RENEWABLE ENERGY 13
21 POLICY DEVELOPMENT 14 211 Targets 14
212 Policy instruments 16
3
NON-STATE AND SUBNATIONAL CONTRIBUTIONS TO RENEWABLE ENERGY AND ENERGY EFFICIENCY 20
31 CASE STUDIES 22 32 EXCERPT FROM GLOBAL 250 GREENHOUSE GAS EMITTERS A NEW BUSINESS LOGIC 34
4 15- AND 2- DEGREE COMPATIBILITY A NEW APPROACH TO CLIMATE ACCOUNTING 37
41 DEVELOPING 15- AND 2- DEGREE COMPATABILITY CONDITIONS 38
42 COMPATABILITY TABLES 41
43 PROJECT-LEVEL COMPATABILITY 50
5 DATABASE ASSESSMENT 56
51 AGGREGATED IMPACT 57
52 SELECTED BILATERAL INITIATIVES 59
53 SELECTED MULTILATERAL INITIATIVES 63 531 Multistakeholder partnerships 68
6 CONCLUSION 75
A ANNEX I DETAILED DESCRIPTION OF MITIGATION IMPACT CALCULATIONS 77
ACKNOWLEDGEMENTS 4
FOREWORD 6
KEY MESSAGES 7
EXECUTIVE SUMMARY 8
+2degC
TABLE OF CONTENTS
References 82
Glossary 87
Acronyms 88
Impressum 89
6
Even if the pledges in the Paris Agreement on Climate Change are
implemented we will still not reduce greenhouse gas emissions
enough to meet the goals The UN Environment Emissions Gap
Report 2017 states that for the 2degC goal this shortfall could be
11 to 135 gigatonnes of carbon dioxide equivalent For the 15degC
goal it could be as much as 16 to 19 gigatonnes We urgently need
more ambitious action to close these gaps So this latest 1 Gigaton
Coalition Report helps to focus those efforts by quantifying the
progress secured through renewable energy and energy efficiency
Electricity touches almost every aspect of our lives yet nearly
a quarter of the population still lacks access to safe clean and
affordable energy Around the world people continue to seek
less polluting options for everyday needs like lighting heating
water cooking and sanitation It should be no surprise then that
renewable power capacity is growing faster than all fossil fuels
combined with a record increase of about 9 from 2015 to 2016
Particularly when bi-products include better health education
security and economic growth
Take cities which are responsible for 75 of global greenhouse gas emissions They can also be a big part of the solution by adopting
to energy efficient buildings electric transport cycle schemes and waste conversion For example in New Delhi India the health of
local communities is severely affected by growing mountains of waste being dumped in open spaces The city and private sector are
tackling this by investing in waste-to-energy-plants These reduce toxic emissions and transform waste into electricity The plantrsquos
community center offers employment and artisan training to about 200 local women For Badru Nisha this income has enabled
her to save 70000 rupees (US $1100) and build a house for relatives in Bihar state This program helps women build their skills
and confidence and provides them with some financial security and independence This is just one of many stories inspiring local
governments mayors businesses and civil society to join forces for significant environmental economic and public health benefits
This report comes at a critical moment to support the growing number of non-state actors showing leadership to deliver the Paris
Agreement We hope it will motivate donors initiatives and countries to build on their achievements while inspiring more public and
private sector stakeholders to join this global effort
FOREWORD
HE Boslashrge BrendeMinister of Foreign AffairsNorway
Erik SolheimUN Environment Executive Director and Under-Secretary- General of the United Nations
+2degC
KEY FINDINGS
R INTERNATIONALLY SUPPORTED RENEWABLE ENERGY AND ENERGY EFFICIENCY PROJECTS implemented in developing countries between 2005 and 2016 are projected to reduce greenhouse gas emissions by 06 Gigatons of carbon dioxide (GtCO2) annually in 2020 When scaled up using international climate financing commitments these efforts could deliver 14 GtCO2 in annual reductions by 2020
R INTERNATIONAL SUPPORT FOR INVESTMENTS IN RENEWABLE ENERGY AND ENERGY EFFICIENCY IS VITAL FOR DECARBONIZATION as this support provides key resources and creates enabling environments in regions critical to the global climate future International assistance accounts for only 10 of all global renewable energy and energy efficiency activities yet it has extensive impact for future climate mitigation
R DATA AVAILABILITY AND INFORMATION SHARING REMAIN A PERENNIAL CHALLENGE one that is preventing countries and supporting organizations from systematically evaluating their workrsquos impact although renewable energy and energy efficiency projects and policies are growing in developing countries The 1 Gigaton Coalition has developed a database of about 600 internationally supported projects implemented in developing countries between 2005 and 2016
R EVALUATING PROJECTS POLICIES AND SECTORSrsquo COMPATIBILITY WITH GLOBAL 15degC AND 2degC CLIMATE GOALS IS ESSENTIAL TO LINK ACTIONS WITH LONG-TERM OBJECTIVES This new method would enable bilateral and multilateral development organizations to measure the long-term impacts of supported projects
R NON-STATE AND SUBNATIONAL ACTORS HAVE TAKEN ON A LEADING ROLE IN SCALING UP CLIMATE ACTION The case studies in this report show that low-carbon forms of development ndash particularly city-based public private partnerships ndash generate multiple co-benefits These include improved environmental and human health economic stimulus and employment creation enhanced gender equality and other societal gains that support the 2030 Agenda for Sustainable Development
Developing countries are achieving low-cost emissions reductions through renewable energy (RE) and energy efficiency (EE) projects and initiatives The focus of this report is to evaluate the impact of these projects in terms of measurable greenhouse gas emissionsrsquo reductions to help close the emissions gap needed to meet the 2degC climate goal
EXECUTIVE SUMMARY
Greenhouse gas (GHG) emissions reductions created by a sample of 273 internationally supported RE and EE projects in developing countries implemented between 2005 and 2016 amount to approximately 03 gigatons of carbon dioxide (GtCO2) annually by 2020 Of the analysed 273 projects 197 are RE 62 are EE and 14 are both RE and EE These efforts reduce emissions by displacing fossil fuel energy production with clean energy technologies and by conserving energy in industry buildings and transportation The analysed samplersquos RE projects contribute approximately 0084 GtCO2 EE projects contribute 0113 GtCO2 and REEE projects contribute 0059 GtCO2 to the total emissions reductions These projects received direct foreign support totaling US $32 billion This analysis builds upon the second 1 Gt Coalition report which examined data from 224 projects (see Annex I for more details)
Reductions in GHG emissions resulting from all internationally supported RE and EE projects in developing countries implemented between 2005 and 2016 could be 06 GtCO2 per year in 2020 This estimate is determined by scaling up the analysed samplersquos emissions reductions to a global level using the total bilateral and multilateral support for RE and EE from 2005 to 2016 (US $76 billion) These international investments create crucial enabling conditions in developing countries and emerging economies where there are significant barriers to private RE and EE investment
GHG emissions reductions from internationally supported RE and EE projects could be on the order of 14 GtCO2e per year by 2020 if committed public finance for climate mitigation is used to scale up these activities Developed countries agreed in 2010 to mobilize US $100 billion per year by 2020 to help developing countries adapt to the impacts of climate change and reduce their emissions To calculate the 14 GtCO2e estimate it is assumed that a quarter of the US $100 billion is public mitigation finance and deployed in the same way as for the 273 analysed projects
Assessing an initiativersquos emissions mitigation impact has inherent drawbacks that must be overcome in order to evaluate a project policy or sector in light of international climate goals Emissions reductions estimates even when accurate do not explain whether the described outcomes are compatible with global climate goals This report takes steps to overcome this challenge by developing criteria intended to assess a sectorrsquos compatibility with global climate goals It also shows how these compatibility conditions can be applied to RE and EE projects outlining a conceptual framework for future analysis
Criteria for sector-level compatibility with 15degC and 2degC goals were developed to evaluate emission savings from projects (Tables 31 - 315) The sectoral criteria are displayed in compatibility tables with each table listing 15degC- and 2degC-compatibility conditions drawn largely from the International Energy Agencyrsquos (IEA) Energy Technology Perspectives (ETP) 2017 report and its 2degC Scenario (2DS) and Beyond 2degC Scenario (B2DS) Schematics (Figures 7 ndash 10) demonstrate how the sectoral compatibility criteria could be applied at the project firm or policy level to identify projects considered 15degC- or 2degC-compatible Two actual projects selected from this reportrsquos RE and EE database are used as proofs of concept Information sharing and data availability prove to be key challenges to broadening the application of this approach
GtCO2e
Reductions from 273 supported projects
implemented during 2005 ndash 2016
analyzed in this report
Reductions by all supported projects
2005 - 2016 ($76 billion in total support)
Reductions if support scaled up to US $25 billion annually
through 2020
0258 GtCO2e 06 GtCO2e
14 GtCO2e
Figure ES Emission reduction from renewable energy and energy efficiency projects by 2020
9
EXECUTIVE SUMMARY g
City governments are increasingly collaborating with the private sector to address common challenges related to climate change and sustainable development The Intergovernmental Panel on Climate Change (IPCC) has indicated that achieving a 15degC- or 2degC-compatible future is a very challenging task yet almost all the technologies needed to build this future are commercially available today This report shows that many countries are acting to reduce emissions through RE and EE programmes and that when policies are well-designed both local and global communities benefit The six case studies presented in this report describe the social economic and environmental benefits that RE and EE programmes bring to the localities where they are implemented They highlight innovative initiatives implemented in a diverse set of cities and regions
bull NEW DELHIrsquoS municipal government has partnered with Infrastructure Leasing and Financial Services Environment (ILampFS Environment) to build a waste-to-energy plant that will save approximately 82 million tons of greenhouse gas emissions over its 25-year lifespan while reducing the landfillrsquos area and air and water pollution The project helps transition former waste-pickers to new jobs directly hiring 70 people at the new plant and has created a community center that provides support and job training to approximately 200 local women
bull NANJING China worked with the electric vehicle industry to add 4300 electric vehicles to its streets between 2014 and 2015 This transition has helped the city reduce emissions by 246000 tons of carbon dioxide equivalent (CO2e) in 2014 while saving over US $71 million in lower energy bills
bull In the industrial VALLE DEL CAUCA corridor of Colombia The Womenrsquos Cleaner Production Network developed action plans to reduce industrial pollution and address climate change in small and medium-sized enterprises The initiative has created a host of benefits including a 110 percent increase in enterprise production efficiency and a new residential solar installation program
bull In LAGOS and in many other Nigerian cities private companies are piloting new approaches to make solar energy more accessible and affordable A partnership between a solar start-up and local telecommunications provider has brought solar power to 50000 homes clinics schools and businesses benefiting more than 250000 people and creating 450 new jobs
bull Ugandarsquos capital city KAMPALA has partnered with businesses to scale up an array of clean cooking technology initiatives installing 64 improved eco-stoves in 15 public schools constructing biodigesters in 10 public schools and funding companies that train women and youth to produce low-carbon briquettes from organic waste
bull MEXICO CITYrsquoS Sustainable Buildings Certification Programme developed and implemented in partnership with the local construction and building industry covers 8220 square meters of floor area across 65 buildings and has reduced 116789 tons of carbon dioxide (CO2) emissions saved 133 million kilowatt-hours (kWh) of electricity and 1735356 cubic meters of potable water and created 68 new jobs between 2009 and 2017
These case studies demonstrate the feasibility and benefits of a low-carbon future through the various RE and EE activities undertaken in cities in collaboration with private sector groups Expanding this type of public-private sector engagement would harness expertise funding technology and data from both arenas to help overcome barriers to action and accelerate the pace of climate action
Governments and non-state actors will gather at COP 23 in November to discern a path forward for implementing the Paris Agreementrsquos central provisions Data sources needed to evaluate progress towards achieving the 15degC or 2degC climate goals are key points under discussion This report provides pertinent information and evidence showing how internationally supported RE and EE projects and initiatives implemented in developing countries are contributing to narrowing the emissions gap ndash the difference between the status quo and the 15degC and 2degC goals The reportrsquos case studies show the social and economic co-benefits associated with these emissions reductions particularly when city governments partner with private companies to enact emissions savings programs These initiatives have great potential to motivate countries and non-state actors to build new channels for collaboration to raise their ambitions and scale up their efforts The 1 Gigaton Coalition will continue to promote RE and EE efforts evaluate their emissions impacts and show how they contribute to achieving both international climate objectives and Sustainable Development Goals (SDGs)
C H A P T E R 1
New Delhi India
New Delhilsquos waste- to-energy initiatives convert more than 50 percent of the citylsquos daily waste into energy and fuel
R Details see page 22
INTRODUCTION
1 Energy-related carbon dioxide (CO2) emissions have stabilized showing no growth in 2016 for the third year in a row yet global energy consumption is predicted to increase 48 percent by 20401 Developing countries where rapid economic growth is the main driver of rising energy demand will account for the vast majority of this future increase in energy consumption1 2
To meet the Paris Agreementrsquos goal to limit global temperature to no more than 2degC and aim to hold warming to 15degC global emissions must peak around 2020 and then rapidly decline in the following three decades approaching zero by 20503 The emissions gap however has widened from last yearrsquos estimates The 2017 United Nations Environment Programme (UN Environment) Emissions Gap Report finds that by 2030 there will be a gap of 11 ndash 135 GtCO2e between countriesrsquo Paris climate pledges and the goal to limit global temperature rise to 2degC The gap widens to 16 ndash 19 GtCO2e when considering the 15degC goal4
11
INTRODUCTION g
Renewable energy (RE) and energy efficiency (EE) projects in developing countries are crucial means of narrowing the emissions gap and decarbonzing future energy growth In 2016 a record 1385 gigawatts (GW) of new capacity of RE was installed mostly in developing countries and emerging economies some of which have become key market players5 Evaluating how RE and EE projects translate to measurable emissions reductions to closing the emissions gap and to creating a 15degC or 2degC compatible future is the focus of this report
The climate imperative is clear we must act now and with ambition to decarbonize human activities in order to meet global climate goals The latest climate scenarios produced by the worldrsquos leading international scientific bodies show that our window to prevent dangerous global warming is rapidly narrowing as humanityrsquos carbon budget ndash the total amount of carbon dioxide that can be emitted for a likely chance of limiting global temperature rise ndash diminishes year on year The Intergovernmental Panel on Climate Change (IPCC) found in its Fifth Assessment Report (2014) that the world will warm by between 37degC to 48degC by 2100 if humanity pursues a ldquobusiness as usualrdquo pathway This level of warming scientists agree would be disastrous for human civilization To give us a better than 66 chance to limit global warming below 2degC ndash the scientific communityrsquos agreed upon threshold for what societies could reasonably manage ndash the IPCC reports that atmospheric CO2 concentrations cannot exceed 450 ppm by 2100 This limit means that the worldrsquos carbon budget through the year 2100 is less than 1000 Gt CO2e Considering a 15degC limit our carbon budget falls to under 600 Gt CO2e through 21006
UN Environmentrsquos Emissions Gap Report 2017 which focuses on the gap between the emissions nations have pledged to reduce and the mitigation needed to meet global temperature goals developed a ldquolikelyrdquo (gt66 chance of achieving the target) 2degC warming model under which annual global GHG emissions would need to stabilize around 52 GtCO2e through 2020 and then fall precipitously to 42 GtCO2e by 2030 and 23 GtCO2e by 2050 To have a greater than 50 chance of containing warming to 15degC the 2017 Gap Report projects a greater drop in annual emissions to 36 GtCO2e by 2030 ndash a significantly lower estimate than what the 2016 Emissions Gap report suggested Under both scenarios annual global emissions appear to go negative ndash meaning that more carbon is absorbed than produced ndash by 2100 These projections are starkly divergent from baseline business as usual emissions projections as well as scenarios that account for the Nationally Determined Contributions (NDCs) that countries pledged in the Paris Agreement By 2030 there is a 135 GtCO2e difference between the annual emissions in the 2017 Gap
Reportrsquos unconditional NDC scenarios and its 2degC trajectory and a 19 GtCO2e gap between the NDCs and 15degC trajectories7
This gap points to an urgent need to increase the ambition scope and scale of carbon mitigation efforts worldwide Each sector in every nation must lead the way with ambitious actions to decarbonize and governments must enact plans and policies for sharp emissions reductions if we are to meet the 15degC or 2degC targets Nearly one-half of lower middle income countries (GNI per capita between US $1006 and $3955) and one-fourth of low income countries (GNI per capita less than US $1005) have made RE a primary focus of their NDCs8 One-third of lower middle income countries and 19 percent of low-income countries have adopted EE as a main focal instrument in their NDCs9 Many of these countries lack energy access for the majority of their population suffer from the effects of poor indoor and outdoor air quality and are striving to rapidly develop their economies to reduce poverty ndash needs that can be partly addressed through RE and EE efforts Intergovernmental coordination and support are key catalysts for the requisite RE and EE initiatives as developed nations transfer expertise technologies and funding to developing countries to create enabling environments for carbon-neutral growth Yet beyond global emissions reduction goals what specific targets should nations sectors and individual firms use to guide their actions How do funding organizations policymakers and implementing groups know at what point their operations are compatible with the 15degC and 2degC targets
The growth in RE and EE projects in developing countries in the last decade demonstrates the potential for these efforts to contribute to global climate mitigation and to narrow the emissions gap A lack of data and harmonized accounting methodology however have prevented the bilateral and multilateral organizations that support these efforts from systematically evaluating their impact The 1 Gigaton Coalition supports these organizationsrsquo efforts in developing countries where growth in RE and EE projects have potential to transition economies to low-carbon trajectories The Coalition works to build a robust knowledge base and support the development of harmonized GHG accounting methods These tools will aid analysis of RE and EE initiatives that are not
12
INTRODUCTION gC H A P T E R 1
+2degC
First Report | 2015
Narrowing the Emissions Gap Contributions from renewable energy and energy efficiency activities
+2degC
Second Report
Renewable energy and energy efficiency in developing countries contributions to reducing global emissions
2016
directly captured in UN Environmentrsquos Emissions Gap Report or in other assessments of global mitigation efforts Through the compilation and assessment of developing country RE and EE efforts between countries partners and collaborative initiatives the 1 Gigaton Coalition promotes these efforts and strives to measure their contribution to reducing global greenhouse gas emissions reductions
PREVIOUS 1 GIGATON COALITION REPORTSThe 1 Gigaton Coalition has released two reports to date The 1 Gigaton Coalition 2015 report aimed to quantify RE and EE contributions to narrowing the 2020 emissions gap The 2015 report was the first of its kind to assess and quantify RE and EE projectsrsquo global climate mitigation potential This analysis used a comparison between the IEA World Energy Outlook (WEO) current policy scenarios and a no-policy scenario derived from the IPCC scenarios database to estimate the energy sectorrsquos total emissions reductions The analysis found that EE and RE projects in developing countries could result in emission reductions on the order of 4 GtCO2 in 2020 compared to a no-policy baseline scenario
The 1 Gigaton Coalition 2016 report refined the approach developed in the inaugural 2015 report expanding the database of internationally supported RE and EE projects in developing countries from 42 to 224 The larger database includes projects implemented between 2005 and 2015 receiving direct foreign support totalling US $28 billion These projects were estimated to reduce GHG emissions by an aggregate 0116 GtCO2 annually in 2020 Avoided GHG emissions were calculated by multiplying the annual energy saved or substituted by a project (determined for RE projects by using the power generation capacity and the technology- and country-specific capacity factors and for EE projects through a projectrsquos documentation) by country-specific grid electricity CO2 emission factors The 2016 report estimated that all internationally supported RE and EE projects would reduce emissions by up to 04 GtCO2 annually in 2020 and that if public finance goals for climate mitigation were met supported projects could reduce emissions by 1 GtCO2 per year in 2020
OVERVIEW OF THE 1 GIGATON COALITION 2017 REPORTThe 1 Gigaton Coalition 2017 report builds upon the first two reports further expanding the database of RE and EE projects from developing countries to calculate the mitigation impact of 273 internationally supported projects in developing countries These projects including 197 RE 62 EE and 14 RE and EE activities are located in 99 countries and supported by 12 bilateral funding agencies and 16 multilateral development banks and partnerships They are categorized for the technologies used to replace fossil fuel energy production with clean energy (ie solar wind biomass and hydroelectricity) and reduce energy consumption in the industrial building and transport sectors In total these projects received US $32 billion in direct foreign support
Evaluating RE and EE projectsrsquo mitigation impact is important to shed light on whether these efforts are reducing global emissions An essential question is whether these efforts lead to long-term decarbonization or low-carbon pathways that are compatible with global goals to limit temperature rise to 15degC and 2degC The 1 Gigaton Coalition 2017 report synthesizes a methodological approach to evaluate the 15degC- and 2degC-compatibility of RE and EE projects intending to guide bilateral and multilateral partners and implementing countries in determining which policies individual projects and entire sectors are consistent with 15degC and 2degC scenarios Drawing from other research initiatives and the International Energy Agencyrsquos (IEA) 2017 Energy Technologies Perspective (ETP) report this analysis provides criteria for 15degC and 2degC-compatibility at the sector level and demonstrates how these criteria could be applied to RE and EE projects
Providing real world examples of RE and EE initiatives in developing countries this report features six in-depth case studies of ongoing programmes and policies in cities throughout the world These case studies demonstrate the compounding benefits to human health the economy and environment that result from smartly planned RE and EE efforts The cases feature collaborative initiatives in which the public sector and private companies work together to develop implement and scale climate action
This report is organized as follows
Chapter 2 provides an overview of the current landscape of RE and EE policies in developing countries Chapter 3 presents six case studies that explore RE and EE programmes that engage the private sector to develop and implement renewable energy and energy efficiency activities The case studies highlight the multiple benefits these initiatives garner across the various cities and regions where they are implemented This chapter also includes a discussion by Thomson Reuters of the emerging low-carbon business paradigm Chapter 4 describes the 15degC- and 2degC-compatibility methods and applications developed for this report providing sector-level compatibility tables and project-level guidance Chapter 5 provides an assessment of the GHG emissions mitigation from RE and EE projects in developing countries based on calculations derived from a project database built for this report Chapter 6 concludes with the reportrsquos key implications for policymakers RE and EE supporting partners and climate actors
Nanjing China
Nanjing was one of the fastest adopters of electric vehicles and has become an important hub for the industry
R Details see page 26
DE VELOPING COUNTRIESrsquo EFFORTS AND ACHIE VEMENTS gC H A P T E R 2
DEVELOPING COUNTRIESrsquo EFFORTS AND ACHIEVEMENTS IN ENERGY EFFICIENCY AND RENEWABLE ENERGY2 This chapter describes the role of policymakers in promoting renewable energy and energy efficiency initiatives in developing countries Data collected by REN21 ndash the global multistakeholder renewable energy policy network ndash is used to illustrate the current status of targets and policies
14
C H A P T E R 2
21 POLICY DEVELOPMENTRenewable energy (RE) and energy efficiencyrsquos (EE) increasingly vital role in the rapid transformation of the energy sectors of industrialized emerging and developing countries continues to be stimulated in part by government actions to incentivize new technology development and deployment Policymakers have adopted a mix of policies and targets to deploy RE and EE to expand energy access provide more reliable energy services and meet growing energy demand while often simultaneously seeking to advance research and development into more advanced fuels and technologies
Recognizing the complementary nature of RE and EE at least 103 countries addressed EE and RE in the same government agency including at least 79 developing and emerging countries while an estimated 81 countries had policies or programmes combining support to both sets of technologies including approximately 75 developing or emerging countries
Adopted together RE and EE can more rapidly help meet national development goals including increasing energy security enhancing industrial competitiveness reducing pollution and environmental degradation expanding energy access and driving economic growth This can be achieved through sector-wide planning such as Chinarsquos 13th Five Year Plan adopted in 2016 which includes specific goals for both RE and EE
Indirect policy support including the removal of fossil fuel subsidies and the enactment of carbon pricing mechanisms such as carbon taxes emission trading systems and crediting approaches can also benefit the RE and EE sectors Carbon pricing policies if designed
effectively may incentivize renewable energy development and deployment across sectors by increasing the comparative costs of higher-emission technologies The removal of fossil fuel subsidies also may level the financial playing field for energy technologies as fossil fuel subsidies remain significantly higher than subsidies for renewables with estimates of the former being at least more than twice as high as those for RE This estimate rises to ten times higher when the cost of externalities and direct payments are included
Developing countries led the way on initiating subsidy reform in 2016 with 19 countries adopting some form of reduction or removal Similarly by year-end 2016 Group of 20 (G20) and Asia-Pacific Economic Cooperation (APEC) initiatives had led to 50 countries committing to phasing out fossil fuel subsidies
211 TARGETSTargets are an important tool used by policymakers to outline development strategies and encourage investment in EE and RE technologies Targets are set in a variety of ways from all-encompassing economy-wide shares of capacity generation or efficiency to calling for specific technology deployments or new developments in targeted sectors Similarly policymakers at all levels from local to stateprovincial regional and national have adopted targets to outline sector development priorities
Nearly all nations around the world have now adopted RE targets aiming for specified shares production or capacity of RE technologies Targets for RE at the national or stateprovincial level are now found in 124 developing and emerging countries
15
DE VELOPING COUNTRIESrsquo EFFORTS AND ACHIE VEMENTS g
24 33
113
53
2212
TransportHeating and Cooling
Electricity Both Final amp Primary Energy
FinalEnergy
PrimaryEnergy
Number of developing and emerging economies with RE targets by sector and type end-2016
0
20
40
60
80
120
100
Figure 1 Number of developing and emerging countries with RE targets by sector and type end-2016
Source REN21 Policy Database
Note Figure does not show all target types in use Countries are considered to have policies when at least one national or stateprovincial-level policy is in place Policies are not exclusive--that is countries can be counted in more than one column many countries have mroe than one type of policy in place
with new or revised RE targets found in 53 of those countries in 2016 Economy-wide targets for primary energy andor final energy shares have been adopted in 54 countries By sector renewable power has received the vast majority of attention with targets found in 113 countries Targets for renewable heating and cooling and transport energy have been introduced to a much lesser degree in place in 22 and 12 developing and emerging countries respectively by year-end 201610 (See Figure 1)
With nearly all countries around the world having some form of RE target now in place the pace of adoption of new targets has slowed significantly in recent years However many countries continue to increase the ambition of their renewable energy goals with some including the 48 Climate Vulnerable Forum member countries seeking to achieve 100 RE in their energy or electricity sectors11
A total of 51 new EE targets were adopted in developing and emerging economies worldwide in 2016 bringing the total number of countries with EE targets in place to at least 105 by year-end 2016 Many EE targets have been put in place through National Energy Efficiency Action Plans (NEEAPs) both in developed and developing countries Outside of the EU NEEAPs have be particularly prevalent in Eastern Europe and African countries12
Energy sector targets also played a prominent role in many National Determined Contributions (NDCs) submitted to the
United Nations Framework Convention on Climate Change (UNFCCC) A total of 117 NDCs were submitted by year-end 2016 largely formalizing the commitments made in countriesrsquo Intended Nationally Determined Contributions (INDCs) submissions prior to the Paris climate conference EE was mentioned in 107 NDCs and 79 developing and emerging economy NDCs included EE targets such as Brazilrsquos target of 10 efficiency gains by 203013 RE was referenced in 73 NDCs submitted by developing and emerging countries with 44 including specific RE targets14
Individual country RE and EE commitments range widely in terms of scope and ambition In the EE sector targets that address multiple end-use sectors are the most common However policymakers have increasingly set single-sector goals to transition energy supply or reduce energy use in sectors including heating and cooling transportation buildings and industry This includes targets such as India and Ugandarsquos light-emitting diode (LED) lamp goals
RE and EE targets have also been adopted at the regional level In 2016 the members of the Southeast Asian Nations (ASEAN) collectively established a 20 by 2020 energy intensity reduction target in their NDCs while the European Union set a binding 30 by 2030 energy savings target
RE and EE targets are both often paired with specific policy mechanisms designed to help meet national goals
16
C H A P T E R 2
Countries with policiesand targets
Countries with policiesno targets (or no data)
828
Countries with targetsno policies (or no data)23Countries with neither targets nor policies25
Figure 2 Developing and emerging countries with EE policies and targets end-2016
Source REN21 Policy Database
Note Countries are considered to have policies when at least one national or stateprovincial-level policy is in place
Countries with policiesand targets
Countries with policiesno targets (or no data)
956
Countries with targetsno policies (or no data)29
8 Countries with neithertargets nor policies
Figure 3 Developing and emerging countries with RE policies and targets end-2016
Source REN21 Policy Database
Note Countries are considered to have policies when at least one national or stateprovincial-level policy is in place
212 POLICY INSTRUMENTS
In addition to targets direct and indirect policy support
mechanisms continue to be adopted by countries to promote
EE (See Figure 2) and RE development and deployment (See
Figure 3) Policymakers often strive to implement a unique mix
of complementary regulatory policies fiscal incentives andor public financing mechanisms to overcome specific barriers or meet individual energy sector development goals These mechanisms if well-designed and effectively implemented can help spur the needed investment in the energy sector to meet national RE andor EE targets
17
DE VELOPING COUNTRIESrsquo EFFORTS AND ACHIE VEMENTS g
Number of mandatory targets
Number of new targets
TOTAL TARGETS
Number of awareness campaigns
Number of funds
Number of new policies
TOTAL POLICIES
0 4020 60 80 100 120
2851
105
4740
4190
Figure 4 Number of developing and emerging countries with EE targets and policies end-2016
Source REN21 Policy Database
Note Numbers indicate countries where targets and policies have been identified but not necessarily the total number of countries with policies in place
RE and EE are often adopted through differing mechanisms EE-specific promotion policies often take the shape of standards labels and codes or monitoring and auditing program while RE is often promoted through feed-in tariffs tendering or net metering Policymakers have also turned to similar mechanisms such as mandates and fiscal incentives to promote both RE and EE
RE and EE policies play an important role in the transformation of the energy sectors of industrialized developing and emerging countries EE policies have been adopted in at least 137 countries including 90 developing and emerging economies15 EE awareness campaigns were held in at least 47 developing and emerging countries while EE funds were in place in at least 40 such countries in 201616 (See Figure 4)
Direct RE support policies were found in at least 154 countries including 101 developing and emerging economies as of year-end 201617 The power sector continues to attract the majority of attention with sectors such as heating and cooling and transportation receiving far less policy support (See Figure 5)
Feed-in tariffs (FIT) remain the most common form of regulatory policy support to RE While the pace of new FIT adoption has slowed in recent years policymakers continue to revise existing mechanisms through a mix of expanded support to further incentivize specific RE technologies as well as reduced rates to keep pace with falling technology costs For example in 2016 Indonesia increased its solar FIT by more than 70 and set FIT rates for
geothermal power Similarly Ghana announced plans to double the length of terms under its solar PV FIT to 20 years Cuts were also made to existing mechanisms in countries such as Pakistan and the Philippines while Egypt enacted domestic content requirements for solar PV and wind projects qualifying for FIT assistance
In recent years many countries have revised their FIT mechanisms to focus on support to smaller-scale projects while turning to RE auctions or tendering for large-scale project deployment The use of tendering for promoting renewable power technologies has expanded rapidly in recent years with developing and emerging countries taking a leading role in the adoption of these mechanisms Tenders were held in 34 countries in 2016 with half of them occurring in developing and emerging countries18 This included Chilersquos auction which resulted in a world record bid for lowest price of solar PV generation at US $2910 per MWh
Countries in Africa were particularly active throughout the year with Nigeria adopting a tendering system for projects larger than 30 MW to supplement its FIT policy and both Malawi and Zambia holding their first RE tenders In the Middle East and North Africa (MENA) region comments included Morocco State of Palestine and Jordan all held tenders In Asia the worldrsquos two largest countries China and India (at the national and sub-national level) as well as Turkey held RE tenders during the year In Central America tenders were held in El Salvador Guatemala Honduras Panama and Peru Tenders have also been held for non-power technologies though to a far lesser degree
18
C H A P T E R 2
Number of countries
Power0
10
20
30
40
50
60
70
80
TransportHampC Power TransportHampC Power TransportHampC Power TransportHampC
2013 2014 2015 2016
Feed-in tariff premium payment
Tendering
Net metering
Renewable Portfolio Standard (RPS)
Solar heat obligation
Technology-neutral heat obligation
Biodiesel obligation mandate only
Bioethanol obligation mandate only
Both biodiesel and bioethanol
Non-blend mandate
Countries with PowerPolicies
Countries withTransportPolicies
Countries with Heating and Cooling (HampC) Policies
7
62
34
69
35
69
35
7
78
37
73
9 countries had other heating amp cooling policies
Figure 5 Number of RE policies and number of countries with policies by sector and type developing and emerging countries end-2016
Source REN21 Policy Database
Note Figure does not show all policy types in use Countries are considered to have policies when at least one national or stateprovincial-level policy is in place Policies are not exclusive--that is countries can be counted in more than one column many countries have more than one type of policy in place
Previously successful tendering programs in South Africa and Brazil each saw setbacks in 2016 In South Africa developers faced challenges securing power purchase agreements (PPAs) with the national utility while reduced demand for electricity and economic challenges caused by Brazilrsquos contracting national economy forced officials to call off previously planned auctions marking the first time since 2009 in which the country did not hold a tender for wind power
Policymakers have also continued to support renewable electricity deployment through enacting mandates for specified shares of renewable power often through Renewable Portfolio Standards (RPS) or requiring payment for renewable generation through net metering policies such as the new policies added in Suriname in 2016 In addition to regulatory policies several countries provided public funds through grants loans or tax incentives to drive investment in RE development or deployment This includes Indiarsquos 30 capital subsidy for solar PV rooftop systems19
Governments are also adapting mechanisms that long have been used for the promotion of power generation technologies to develop
an environment of enabling technologies such as energy storage and smart grid systems to better integrate renewable technologies in global electricity systems For example Suriname held a tender for solar PV systems including battery storage in 201620
RE deployment in the electricity sector through mechanisms such as those described above can also have a significant impact on the efficiency of power generation by shifting from thermal power plants which convert only approximately one-third of primary energy to electricity to more efficient RE installations21
Renewable heating and cooling technologies are directly promoted primarily through a mix of obligations and financial support though the pace of adoption remains well below that seen in the power and transport sectors By year-end 2016 renewable heat obligations or mandates were in place in 21 countries including seven emerging and developing countries (Brazil China India Jordan Kenya Namibia and South Africa)22
RE heating and cooling policies frequently focus on the use of RE technologies in the buildings sector and are often adopted
19
DE VELOPING COUNTRIESrsquo EFFORTS AND ACHIE VEMENTS g
in concert with building efficiency policies and regulations23 Several countries advanced EE through new or updated building codes in 2016 of which 139 are in place worldwide at the national and sub-national level including in at least 9 developing and emerging countries24 This includes Indonesiarsquos efforts to develop a Green Building Code and members of the Economic Community of West African States (ECOWAS) implementing building codes in accordance with a regional directive
Specific financial incentives including grants loans or tax incentives targeted at renewable heating and cooling technologies have been adopted in at least 8 developing and emerging economies In certain cases such as in Bulgaria support to RE heating technologies are included in broader EE financial support programs New developments in 2016 included Chilersquos extension of its solar thermal tax credit and Indiarsquos new loan incentives for solar process heat developers Renewable energy tendering has also been used to scale up deployment in the sector Bids for South Africarsquos long-awaited solar water heater tender closed in early-2016
The industrial sector also has a significant EE policy focus however the development of targeted mechanisms for the promotion of RE in industrial processes remains a challenge for policy makers For EE both Mali and Morocco now require energy audits for large industrial energy users
Transportation-focused RE and EE policies have both been adopted to accomplish a wide range of sector goals including increasing fuel economy or fuel switching to renewable fuels or electric vehicles The vast majority of policy attention particularly in developing countries has been focused on energy use in the road transportation sector While energy use in the maritime rail or aviation transportation sectors is gaining attention concrete RE and EE policy mechanisms have been adopted in only a handful of locations
Fuel economy standards are a primary means of increasing energy efficiency of passenger vehicles in the transport sector At least eight countries plus the EU have now established fuel economy standards for passenger and light-commercial vehicles as well as light trucks including Brazil China India and Mexico25 No developing countries have yet adopted policies for heavy-duty vehicles
RE in the transportation sector is often promoted through mandates specifying required shares or volumes of renewable fuel use Developing countries are often at the leading edge of nations looking to promote fuel switching to renewable transport fuels Biofuel blend mandates were in place at the national or stateprovincial level in 36 countries as of year-end 2016 with developing and emerging countries accounting for 26 of that total26 In 2016 Mexico expanded its blend mandate to cover nationwide fuel use while Argentina Malaysia India Panama Vietnam and Zimbabwe all added or strengthened biofuel andor bioethanol blend requirements
New financial incentives also were introduced in 2016 to promote biofuel production and consumption biorefinery development and RampD into new technologies including in Argentina where biodiesel tax exemptions were expanded and Thailand which provided subsidies to support a trial program for biodiesel use in trucks and military and government vehicles
While national policies remain an important driver of renewables and energy efficiency development municipal policymakers are taking a leading role in the promotion of both RE and EE within their jurisdictions often moving faster and enacting more ambitious goals than their national counterparts As cities continue to band together to mitigate the impacts of global climate change they have turned to RE and EE to transform their energy sectors A number of cities around the world are now seeking to achieve 100 renewable energy or electricity while a growing list of municipalities in developing and emerging economies such as Cape Town (South Africa) Chandigarh (India) and Oaxaca (Mexico) have established ambitious RE goals
C H A P T E R 3
Kampala Uganda
Kampala aims to replace 50 percent of household charcoal use with alternative cook fuels such as biomass or briquettes made from organic waste
R Details see page 24
NON-STATE AND SUBNATIONAL CONTRIBUTIONS TO RENEWABLE ENERGY AND ENERGY EFFICIENCY3 In cities and regions throughout the world governments at all jurisdiction levels are collaborating with private companies funding organizations and civil society to implement renewable energy and energy efficiency programs These activites reduce carbon emissions and create co-benefits including enhanced environmental quality improved public health economic growth and job creation social inclusion and gender equality This chapter includes six case studies of successful public-private collaboration as well as a discussion of the emerging low-carbon business paradigm
21
NON-STATE AND SUBNATIONAL CONTRIBUTIONS g
Renewable energy (RE) and energy efficiency projects (EE) in developing countries often require collaboration from implementing partners such as the private sector and subnational actors This chapter features six case studies that demonstrate some of the strategies that cities businesses and other collaborators are using to support RE and EE activities across developing and emerging economies These examples showcase the social economic and environmental benefits of RE and EE initiatives demonstrating the incentives driving businesses and cities to take leadership roles in implementing them27 28 It also includes an excerpt from Thomson Reutersrsquo forthcoming lsquoGlobal 250 Report A New Business Logicrsquo exploring the motivations and process of companies seeking to decarbonize their business models
Cities and the private sector will be vital to limiting global warming to well below 2degC29 As of 2013 over half of the global population and approximately 80 percent of global GDP resided in cities30 By 2050 the urban population will account for two-thirds of the global population and 85 percent of the global GDP31 Since cities concentrate people and economic activity they also shape energy use urban areas currently make up around two-thirds of global primary energy demand and 70 percent of global energy-related carbon dioxide emissions32 The goals of the Paris Agreement rest on the ability to chart a sustainable urban future ndash through the adoption of renewable energy increasingly efficient use of energy and the design of resilient and low-carbon infrastructure and transport33
Many cities already host innovative climate strategies driven by governments businesses and other actors who see opportunities to lower costs appeal to investors generate new forms of industry and improve quality of life Activities that help cities address climate change also offer opportunities to make progress towards meeting the goals of the 2030 Agenda for Sustainable Development Low-carbon forms of development generate co-benefits such as reduced traffic congestion and improved air quality and public health34 35 36 Between 2007 and 2015 solar and wind power in the United States produced air quality benefits of US $297ndash1128 billion mostly from 3000ndash12700 avoided premature mortalities37
The transition to a low-carbon economy can also reduce poverty and spur job creation38 39 Implementing the RE strategies articulated in the national climate action plans of the United States European Union China Canada Japan India Chile and South Africa would generate roughly 11 million new jobs and save about US $50 billion in reduced fossil fuel imports40 If these countries committed to a 100 percent RE pathway they would generate 27 million new jobs and save US $715 billion from avoided fossil fuel imports41 Collaboration with civil society and local stakeholders can help ensure a just transition to a low-carbon economy that maximizes job creation helps citizens develop new skills and fosters community renewal42
Building compact connected cities also reduces the cost of providing services and infrastructure for urban transport energy water and waste43 In India smart urban growth could save
between US $330 billion and $18 trillion (₹2-12 lakh crores) per year by 2050 ndash up to 6 of the countryrsquos GDP ndash while producing significant savings for households44 Altogether the New Climate Economy estimates that global low-carbon urban actions could generate US $166 trillion between 2015 and 2050 while reducing annual GHG emissions by 37 GtCO2e by 203045
Increasingly different kinds of actors are working together to realize this potential One assessment found that three-quarters of the challenges facing city climate action require support and collaboration with national and regional governments or the private sector46 Cities and companies in particular have grown increasingly interdependent Businesses aim to capture a share of the growing US $55 trillion global market in low-carbon and environmental technologies and products which is often concentrated in cities47 Energy service companies which base their business model on delivering EE solutions generated US $24 billion in revenue in 2015 and employed over 600000 people in China alone48 The global RE sector employed 98 million people in 2016 a 11 increase over 2015 by 2030 this number is expected to grow to 24 million49 Engaging in climate action also helps to mitigate the risk climate change may pose to an organizationrsquos business model and supply chain and enables companies to meet internal and public commitments to address global warming
The private sector can also help develop implement and scale climate and development solutions in urban areas that often struggle to access adequate finance Aside from tax collection most cities face limited options to raise or spend funds the private sector can help access capital to initiate or expand successful projects50 A C40 analysis of some 80 mega-cities identified 2300 high-impact ldquoshovel readyrdquo climate actions that could mitigate 450 MtCO2 ndash close to the annual emissions of the United Kingdom ndash by 2020 if US $68 billion in funds could be unlocked to implement them51
Many of these collaborations are already underway One survey of 627 climate change initiatives across 100 global cities found that private and civil society actors accounted for approximately one quarter (24 percent) of urban climate action and 39 percent of climate action in Asian cities52 Private sector organizations fund and invest in climate action act as service providers deliver operations and maintenance support to projects such as transport or waste management and design and build infrastructure53 Companies have also helped to fill gaps in infrastructure by creating new models for delivering city services such as ride-sharing54 Strategies like microfinance have played important roles in further unlocking the upfront capital vital to developing and implementing urban innovations55 As urban areas expand public-private partnerships that harness different forms of expertise technology and data can help overcome barriers to action and keep pace with citiesrsquo rapid rate of change56 National and regional governments can also help foster this process by crafting policy and financial environments that help RE and EE strategies take root
Current situation
RRR
82 million tons in avoided methane
emissions ndash equivalent to removing all cars from
Delhirsquos roads for
US $ 04 per kWh in avoided
waste treatment costs
200 acres of land valued at over
Rs 2000 crores (US $308 million)
New Delhi
22
C H A P T E R 3
About the initiative New Delhirsquos Integrated Municipal Waste Processing Complex at Ghazipur financed through a private-public partnership with ILampFS Environment reduces emissions while transforming waste into energy This partnership also supports local families through direct hiring and job training
NEW DELHI About the City
Population (metro area)
GDP (2016)
Land Area
23 million
US $ 2936 billion
1483 km2 iii
R New Delhirsquos 3 waste-to-energy plants enable the city to use over 50 of its waste to produce electricity daily
R The 52 MW capacity of New Delhirsquos 3 waste-to-energy plants constitute nearly 60 of the total 88 MW produced by waste management practices in India
gt50 5500 tday 52 MW
Initiative Accomplishments The Ghazipur waste-to-energy plant will save
100 days
IN RELATION TO SDGS
23
CASE STUDIES g
Each day the Integrated Municipal Waste Processing Complex at Ghazipur New Delhi receives approximately 2000 tons of waste about 20 of the cityrsquos 9500-ton waste stream57 Through a public-private partnership between the East Delhi Municipal Corporation and the Infrastructure Leasing and Financial Services Environment (ILampFS Environment) the landfill now includes a waste-to-energy plant which generates an annual 12 MW of power58 It also produces 127 tons of fuel an alternative energy source for cement and power plants59 The Ghazipur plant which began operating in November 2015 will save a projected 82 million tons in avoided methane emissions over its 25-year life span60
The projectrsquos benefits extend beyond its climate impacts Reusing waste will prevent 200 acres of urban land valued at over Rs 2000 crores (US $308 million) from being consumed by the landfill61 62 For ILampFS Environment the plant enables it to engage in Indiarsquos environmental goods and services sector estimated to be worth Rs 250 billion (US $39 billion) and projected to grow 10 to 12 annually63 Across its operations the company reuses 95 of every tonne of municipal solid waste through recycled products or energy generation64
Converting waste to energy and avoiding the expansion of the landfill also lowers the health and safety risks of an open solid waste disposal site65 The plant reduces the amount of leachate the landfill generates saving US $04 per kWh in annual treatment costs66 In managing the Ghazipur plant ILampFS Environment relies on best-in-class technology67 and a Continuous Emission Monitoring System which publishes real-time emission parameters online to meet strict air quality standards68
The project also focuses on supporting the surrounding community of 373 local wastepicker families who live near and work in the landfill salvaging and reselling waste Providing support and retraining to local families is critical to efforts that affect access to the landfill and its materials The Ghazipur plant employs over 70 former waste-pickers directly in the plant69 To foster financial inclusion 400 families received bank accounts and Permanent Account Number cards and kiosk banking was provided to the local community through the State Bank of India Since July 2014 2075 bank accounts have been opened70 71
ILampFS Environment also worked with a nonprofit organization Institute for Development Support (IDS) to establish Gulmeher a community center that offers employment and training to approximately 200 local women who previously earned a living collecting waste at the Ghazipur landfill72 The center which launched in May 2013 grew out of brainstorming sessions IDS held with waste-pickers ILampFS Environment and other stakeholders73 74 To help boost their future employability the center provides training in a variety of jobs75 Women reuse materials from a nearby wholesale flower market to create products including boxes cards diyas and natural holi colors76 In mid-2014 the center partnered with Delhi-based start-up Aakar Innovations to produce inexpensive sanitary napkins that low-income women can afford Aakar Innovations helped train the women and buys and re-sells the products they produce77
In 2014 the community organization converted into a private company with participants also acting as shareholders of the Gulmeher Green Producer Company Limited78 Earnings for the participating women average approximately Rs 5000-6000 (US $77-90) every month79 For Badru Nisha the first woman to join the center this income has enabled her to save 70000 Rs (US $1100) and to build a house for relatives80 In India where only 26 of women participate in the labor force compared to almost 75 of men this organization helps build womenrsquos skills and confidence81 82
Without intervention New Delhi is expected to generate roughly 15750 tons of garbage daily in 202183 For cities facing a similar challenge of managing high volumes of waste with limited land the Ghazipur plant offers a successful strategy plans for replicating it are underway in New Delhi and other Indian cities84 The cityrsquos most recently constructed waste-to-management plant Narela-Bawana also relies on a public-private partnership model and produces compost as well as energy85 As the city and its waste stream continue to grow the private sector plays a powerful role in converting challenges into opportunities for development
TRANSFORMING WASTE INTO ENERGY | INDIA | NEW DELHI
Market in Kampala Uganda
24
About the initiative Kampala accelerates the development and adoption of clean cooking technology The city partners with the private sector civil society and international funders to bring clean cooking technology to public schools and markets and to support low-carbon biomass businesses
installed in 15 primary schools saving of 9300 euro (US $11029)
in firewood costs reducing 1671 tons of CO2
annually and benefitting 15631 children and
staff members
Ugandan shillings (US $276860) raised
by MTN Uganda to install bio-toilets in 10 schools
eco-stoves installed in Kampalarsquos
markets
improved eco-stoves
KAMPALA
Reduce greenhouse-gas emissions by 22 (compared
to business-as-usual)
Replace 50 of charcoal with
alternative cook fuel
Current situation
-22
About the City
Population (metro area)
GDP
Land Area
35 million
US $25528 billion
1895 km2
-50
C H A P T E R 3
IN RELATION TO SDGS
64 x 2201 billion
25
Kampala has grown rapidly over the past decade becoming home to nearly 2 million people and generating approximately half of Ugandarsquos GDP86 In 2014 the city launched a five-year Climate Change Action Strategy87 to guide its rapid evolution and to ensure it ldquodrives development in the most sustainable wayrdquo88 The plan draws on a diverse array of goals ndash from planting half a million trees to creating traffic-free paths for pedestrians and bicyclists ndash to build Kampalarsquos resilience and protect its most vulnerable populations89
The early years of the Kampalarsquos Climate Change Action Strategy have focused on creating pilot projects and building partnerships that lay the groundwork for expanded action In particular the city has made great strides in implementing a complementary array of clean cooking initiatives Its Climate Change Action Strategy seeks to replace 50 of household charcoal use with alternative cook fuels such as biomass or briquettes made from organic waste90 To pursue this target Kampala provides seed capital and funding to organizations that train youth and women in making biomass briquettes brings biogas digesters and improved cook stoves to public schools and installs eco-stoves at city markets These proof-of-concept demonstrations build confidence and connections with the private sector civil society and bilateral and multilateral funders to help scale up these strategies
MTN Uganda the countryrsquos largest telecommunications company for instance has committed 1 billion Ugandan shillings (US $276860) raised through two annual city marathons to install biogas digesters in 10 public schools91 Their commitment will expand a program piloted at the Kansanga School which turns human animal and food waste into methane gas halving the amount of energy used to cook meals This biogas digester produces approximately 26 MWh annually lowering operating costs and reducing pollution from the firewood or charcoal it replaces92
A collaboration between the Kampala Capital City Authority (KCCA) and French development agency Expertise France supports a complementary effort to bring higher efficiency cooking stoves to 15 new public schools93 with technical support from the Ugandan company SIMOSHI Ltd This effort which has distributed 64 stoves supplied by Uganda Stove Manufacturers Ltd builds on the successful implementation of an eco-stove at another school94 The program has saved schools 9300 euro (US $11029) in firewood costs reduced 1671 tons of CO2 annually and benefitted 15631 children and staff members95 Earnings acquired through the Clean Development Mechanism will be reinvested in the schools to support annual maintenance monitoring and management96 Eventually the project aims to install 1500 stoves in 450 schools benefiting 340000 children and reducing 31286 tonnes of annual CO2 emissions97
Kampala also works with emerging businesses providing seed funding to organizations that train women and youth to produce
low-carbon briquettes from organic waste food scraps and other materials The briquettes burn cleanly without releasing smoke or ash and help avoid deforestation In the words of one customer they are also ldquocheap to use time-saving and energy-savingrdquo98 The briquettes have gained popularity with restaurants hotels households and poultry farmers Kampalarsquos administration is developing a program to further expand the supply of low-carbon fuel and connect producers with more markets99
In addition the city has installed 220 eco-stoves in the cityrsquos marketplaces These stoves can be linked with solar photovoltaic panels that extend stovesrsquo cooking time and can generate electricity for other uses such as lighting a kitchen or charging a battery100 This approach improves working conditions protects the health of the women who typically cook and serve food in these spaces and helps test and fine-tune this technology It also builds awareness and comfort with cleaner cooking technology among smaller business owners who often face financial barriers to the purchase of new equipment
The shift to cleaner cooking technology can deliver vital improvements in public health More than 90 of Ugandan households101 along with many restaurants schools and other places that serve and prepare food cook with wood charcoal The World Health Organization estimates exposure to cookstove smoke contributes to 13000 premature deaths every year in Uganda102 103 In Kampala over 80 of households rely on charcoal for cooking with dramatic impacts on air quality and public health104 Women and girls often face the highest levels of risk as they can spend up to five hours daily cooking in smoky kitchens and can face safety risks in traveling to forests to collect firewood105
The use of clean cooking technology also lessens the risk of fuel shortages The balance between biomass supply and demand remains fragile with large deficits in materials forecasted in and beyond the 2020rsquos106 Since Kampala concentrates Ugandarsquos economic activity and as a result its energy demand it is especially vulnerable to these projected shortfalls but also particularly well-placed to test and develop solutions107
The cityrsquos approach to promoting clean cooking technology reflects the need to ensure that the transition away from the charcoal market generates jobs and creates revenue108 Funding will also continue to be crucial to the cityrsquos ability to facilitate and accelerate the adoption of clean cooking technologies Kampala has teamed up with the World Bank and the University of Washington to develop a climate-smart capital investment plan that aligns new projects with the cityrsquos climate action goals It will continue to leverage partnerships with private and international partners to scale up public funding as it takes the next steps in its climate and development roadmap109
EXPANDING ACCESS TO CLEANER COOKING | UGANDA | KAMPALA
CASE STUDIES g
26
NANJINGCurrent situation
R Shortlisted as one of Chinarsquos National
LOW-CARBON PILOT CITIES
R Added 4300 electric vehicles (EVs)
About the initiative The Nanjing Municipal Government introduced a series of policies to promote the sale use and production of electric vehicles It works with industry to continue transforming the city into a major electric vehicle manufacturing and services hub
Initiative Accomplishments
+4300
-246000t
About the City
Population (metro area)
GDP (2016)
Land Area
821 millionxlv
US $1464 billionxlvi
6598 km2 iii
During 2014-15
R reduced CO2 emissions by 246000 tons
and saved over US $71 million in lower energy bills
R Drew more than 46 EV companies to the city generating annual tax revenues of approximately
C H A P T E R 3
IN RELATION TO SDGS
RENEWABLE ENERGY
EV POLICIES
ELECTRIC VEHICLE MANUFACTURING AND SERVICES HUB
US$ 16 million
27
g
The Chinese city of Nanjing deployed the fastest rollout of electric vehicles in the world adding 4300 electric vehicles to its streets during 2014ndash2015110 This transition to electric vehicles (EV) helped Nanjing reduce CO2 emissions by 246000 tons in 2014111 Nanjingrsquos activities have drastically cut the cityrsquos carbon emissions and use of oil and generated over US $71 million in savings from lower energy bills112
Nanjingrsquos adoption of renewable and electric vehicles is part of a larger economic and environmental bid to transition away from energy and carbon intensive industries like petrochemicals steel and building materials113 that Nanjingrsquos economy once relied on These conventional industries are losing their economic competitiveness while emitting large amounts of greenhouse gases and other pollutants114
The municipal government supported this shift by building compatible infrastructure for electric vehicles introducing tax breaks and electricity price subsidies for EV consumers and promoting the use of renewable-powered vehicles in public services In the 2016 New Energy Automobile Promotion and Application Plan of Nanjing the municipal government aimed to add 500 renewable energy buses 500 service vehicles and 1502 passenger vehicles to its transportation system in 2016115 By 2018 Nanjingrsquos goal is to convert 80 of its bus fleet to be powered by renewable energy116 Nanjing also plans to build 3000 charging stations especially in residential areas and to expand the use of electric vehicles to trucks and vans in the logistics sector117
Nanjingrsquos initiative to promote electric vehicles closely aligns with Chinarsquos national climate energy and macroeconomic policies and it receives support from the central and provincial levels of government On a national level China has set specific targets to develop a sustainable and renewable energy-driven transportation sector as highlighted in both the State Councilrsquos Circular Economy Development Strategy and Near-Term Action Plan and the Ministry of Transportrsquos Guiding Opinions on Accelerating Development of Green Circular Low-Carbon Transportation118 Electric vehicles are a key part of the solution as they enable China to achieve GHG emission reduction targets as well as to grow and restructure its automobile industry
At the provincial level the Jiangsu Provincial Government has signed a Framework Agreement119 with the Ministry of Transport to promote Jiangsursquos development of low carbon transportation The Jiangsu Provincial Government also released the Green Circular and Low-Carbon Transportation Development Plan of Jiangsu Province (2013-2020)120 which included a target to make 35 of public buses and 65 of taxis run on renewable energy across Jiangsu
Through supportive policies and a favorable investment environment Nanjing has established itself as an electric vehicle manufacturing and services hub In 2014-15 Nanjing drew 46 companies connected to the EV sector to the city and earned tax revenues of approximately US $16 million per year121 In 2016 Chinese EV manufacturer Future Mobility Corporation invested US $17 billion to build a factory in Nanjing that has an initial production capacity of 150000 cars per year122 Beijing-based EV rental company Gofun has also introduced its service to Nanjing rolling out 200 electric cars that can be rented via smartphones123
Policy coordination across different levels of government helps explain Nanjingrsquos success Nanjing is a National Low-Carbon Pilot City124 Policies and guidelines from the Central and Provincial Governments give the Municipal Government the confidence and support it needs to conduct pilot programs and test new solutions
Private sector engagement is another important factor in scaling up EV adoption The private sector plays a key role in Nanjingrsquos expansion of its EV sector by providing solutions products and services to meet demand The Nanjing Municipal Governmentrsquos policies have made Nanjing a pioneer both as a market and a manufacturing center for the EV industry The Nanjing Municipal Government offers incentives for manufacturers to base their production in Nanjing thereby promoting its economic restructuring
The government also fosters companiesrsquo engagement in the sectorrsquos future In August 2017 the Nanjing New Energy Automobile Operation Alliance was launched It consists of 37 companies across the entire EV value chain ndash including carmakers like BYD real estate developer China Fortune Land Development and charging station solution provider e-charger The alliance is supported by the Nanjing Municipal Governmentrsquos EV Office and the Nanjing Economic and Technological Development Zone125 Platforms like this will enable Nanjing to expand its volume of EVs and develop a transportation sector that runs on clean pollution-free renewable energy
PROMOTING ELECTRIC VEHICLES | CHINA | NANJING
CASE STUDIES g
Current situation
Across Colombia micro small and medium enterprises comprise
of all Colombian businesses
of private sector employment
of the national GDP
women have been trained through the
initiative
Initiative Accomplishments
R A construction firm installed 3304kWh of energy in a new housing development saving +US $200 in the first 8 months of its projected 20-year life span
Under the leadership of Network participants25R A construction firm achieved a
reduction of its construction waste
reuse of demolition and construction material waste
reduction of paper use in its organizational processes
and the use of rainwater for of construction activities
3169
50
90
R A sugar cane mill switched to more efficient stoves and fuel increasing production efficiency 110
+110Production efficiency
Cali Valle del Cauca Colombia
28
About the initiative The Womenrsquos Cleaner Production Network trains and encourages entrepreneurs to foster clean production practices in small and medium enterprises along the Colombiarsquos Valle del Cauca region a major industrial corridor
VALLE DEL CAUCA REGION
C H A P T E R 3
IN RELATION TO SDGS
About the City
Population (metro area)
GDP (2016)
Land Area
46 millionxciv
US $353 millionlxix
22140 km2 iii
80 3590
GDP
29
The Womenrsquos Cleaner Production Network helps entrepreneurs transform their firms into green businesses It gathers women from academia utility companies public organizations and large and small industries to develop action plans to reduce industrial pollution and address climate change To date 25 women have leveraged the Network to capture efficiency savings reduce emissions and give their company a competitive edge
While strategies vary across sectors they typically deliver cost or material savings for the organization as well as benefits for the climate At a trapiches paneleros (unprocessed sugar product) mill old and inefficient ovens used wood and old tires as fuel in part to compensate for the ovenrsquos open design which failed to conserve heat Burning these materials released sulfur dioxide which creates respiratory risks126 in addition to greenhouse gases127 The firmrsquos owner a member of the Network led the switch to an eco-oven a system easily constructed using local materials A fine-grained silica wall conserves heat eliminating the need to burn tires and wood and enabling the operation to reuse sugar cane waste as fuel The new stove also generates more heat cuts the use of vegetable oil in the consumption process by 83 and increases overall production efficiency by 110128 The millrsquos production of its final products ndash 24-kg lumps of processed sugar cane ndash have jumped from 25 to 525 per hour129
In another example a firmrsquos female construction director led a shift to the use of solar energy in residential construction projects The firm joined forces with a national utility company Empresa de Energia del Pacifico (Epsa) and piloted an initiative to install solar panels on the roofs of common areas such as gardens swimming pools and gyms Since the panelsrsquo installation in January 2017 the PV systems have generated 3304 kWh of energy of which 3303 kWh has been consumed saving its owners over US $200 in the first 8 months of its projected 20-year life span130 131 The director now hopes to expand the use of solar to individual homes using environmentally-friendly materials to generate and store electricity
Other women associated with the Womenrsquos Cleaner Production Network have achieved similar results in both emissions reductions and environmental protection Increased efficiency at one large construction firm spread to ten of its suppliers across these businesses women led the installation of photovoltaic energy systems to provide light and pump rainwater initiated waste recycling and water reuse programs replaced firm motorcycles with bicycles and cut administrative paper use by half132
All of this activity occurs within the Valle del Cauca region of Colombia a major industrial corridor that hosts roughly 450 small and medium enterprises from different industries133
Across Colombia micro small and medium-sized enterprises make up 99 of all Colombian businesses and drive 80 of private sector employment along with 35 of the national GDP134 They also often generate significant pollution in part because of the challenge of accessing environmental knowledge and best practice technologies135 Regional cleaner production centers universities and environmental authorities in sync with Colombiarsquos 2010 Sustainable Production and Consumption Policy aim to transform polluting industries into sustainable businesses136
Groups like the Womenrsquos Cleaner Production Network help facilitate collaboration between these different actors making cleaner production efforts more resilient to financial or technical challenges These collaborations also help identify key areas for intervention A partnership between the Network and the Corporacioacuten Autoacutenoma Regional del Valle del Cauca (CVC) Colombiarsquos environmental authority for instance is developing clean production initiatives to support small coffee producers which employ many women displaced by conflict
Though many small and medium-sized enterprises are dominated by men women have been crucial actors in the transition to cleaner technology and practices While they work across diverse industries participants in Womenrsquos Cleaner Production Network share a common trait they have all already led successful cleaner production projects in various industries in Colombia prior to joining the initiative The Network helps facilitate technology transfer but also fosters strategic partnerships and learning alliances to help implement new tools and sustain change Many firms even when they successfully participate in demonstration projects struggle to integrate these new strategies tools or processes into their daily operations The Womenrsquos Cleaner Production Network has been especially adept at helping its participants institutionalize these transitions create a new business-as-usual and lay the foundation for continued gains in clean production137
The potential for replicating the Networkrsquos model in and beyond Colombian remains large Most participantsrsquo activities draw on local technology and materials and involve simple easily achievable steps138 The model of the Network itself could also be scaled up It draws value from the diversity of institutions and industries represented and helped build participation through concrete activities responsibilities and benefits for engagement in the network Crucially it considers technical knowledge from small firms and from large institutions to be complementary and equally valuable enabling the group to tackle problems that would have been challenging to address from a single perspective139
LEADING BY EXAMPLE IN CLEANER INDUSTRIAL PRODUCTION | COLOMBIA | VALLE DEL CAUCA REGION
CASE STUDIES g
30
Cut Commercial and industrial buildingsrsquo energy use generates
30 of Mexico Citylsquos carbon emissions
21949
of green roofs on schools hospitals and public buildings
square meters
Reduce
by 2020 and
Reduce annual emissions by
or limit to 2 metric tons of CO2 per capita by the year 2050
2mt CO2
more than its original targets
77million tonnes of CO2e
314
between 2008 - 2012 =
80-95
10 million tonnes of CO2e
million tonnes of CO2eby 2025
About the initiative Mexico Cityrsquos Sustainable Buildings Certifi- cation Program incentivizes sustainable commercial industrial and residential buildings creating benefits for building owners tenants and the city government
Past Accomplishments Current Situation Future Targets
MEXICO CITY
Covers 8220 square meters
of floor area across 65 buildings
Reduced
116789 tons of CO2
emissions
Saved
133 million kWh
of electricity
Saved
1735356 cubic meters
of water
68 new jobs
created
Initiative Accomplishments (between 2009-2017)
About the City
Population (metro area)
GDP
Land Area
204 million
US $421 billion
1485 km2
+10
IN RELATION TO SDGS
C H A P T E R 3
31
Mexico City has encouraged efficiency in new and existing building stock through a strategy that integrates public policy with concrete action The Sustainable Buildings Certification Program (SBCP) ldquothe first of its kind in Mexicordquo140 exemplifies this approch generating buy-in and capacity for more comprehensive action while delivering tangible environmental and economic benefits The initiative fosters the sustainable construction or improvement of commercial industrial and residential buildings by awarding certifications that reflect various levels of sustainability performance in energy efficiency water mobility solid waste social and environmental responsibility and green roofs
The SBCP launched in 2009 after approximately two years of planning and stakeholder consultation Mexico Cityrsquos Ministry of Environment gathered technical experts from the building industry local governments and academia to develop the programrsquos certification process and criteria Typically participants audit their buildingrsquos energy and water use then use the results to develop a plan to meet or exceed existing local and national energy efficiency standards The Ministry of the Environment certifies new or newly retrofitted buildings rating residential structures as compliant efficient or excellent and industrial buildings as compliant or excellent Higher certification levels generate higher property tax and payroll tax reductions Every two years a follow-up assessment tracks performance and compliance141
As of 2017 the program encompassed 8220 square meters of floor area across 65 buildings Between 2009 and 2017 participating buildings saved 116789 tons of CO2 133 million kWh of electricity and 1735356 cubic meters of potable water142 The SBCPrsquos benefits also spread beyond efficiency The program has supported renewable energy installation and expanded green roofs and gardens ndash its tax breaks allow participants to implement sustainability strategies that might otherwise be prohibitively expensive
Since third-party technicians play a vital role in supporting the certification process ndash auditing buildings and identifying strategies to improve performance ndash the city has partnered with industry to offers technicians resources training and the chance to earn credentials as official implementing agents of the SBPC program The certification can help auditors win new contracts and the process of training and hiring technicians to oversee the auditing and certification of buildings has generated 68 new jobs143
Reduced property and payroll taxes along with lower energy and water bills help incentivize participation The programrsquos auditing and monitoring components enable participants to closely track their personal return on investment Participation in the SBCP also leads to increased access to project financing and
accelerated permitting procedures These benefits help building owners overcome the high capital costs and limited financing options that can stall building improvements144 By lowering the demand on municipal water energy and waste management services the program also enables Mexico City to stretch its resources farther145
The SBCP includes multiple points of entry that accommodate different participantsrsquo needs Its tiered certification system allows small businesses with limited access to capital to scale up efficiency improvements over time Tenants of commercial buildings can obtain certification for the space that they rent or lease In multi-family properties certifications can apply to either specific building sections common areas or the entire building These options help counter the challenge of ldquosplit incentivesrdquo between building tenants and owners in which a building owner worries that savings from lower energy costs will flow to the tenant while a tenant avoids investing in improving efficiency since the resulting increases in property value will largely benefit the owner146 Continuing to tailor outreach and incentives to different audiences ndash and in particular to small and medium enterprises ndash will be a key next step for the city147
The program also increases the transparency of the building marketplace Domestic or international corporations seeking green office space or industrial facilities may consult a list of SBCP participants Certified office buildings have garnered ldquogreen premiumsrdquo of around 20 in their rental yields148 as companies seek to meet their own sustainability commitments or harness the benefits of green buildings
The SBCP is part of a complementary mix of reforms and incentives aimed at greening the cityrsquos building sector Mexico City leads by example covering 21949 square meters of schools hospitals and public buildings with green roofs and conducting audits for efficiency retrofits at 19 public buildings149 150 151 In June 2016 Mexico Cityrsquos Ministry of Environment updated building codes including guidance on materials for construction equipment and design to enable more energy-efficient buildings This dramatic shift from the previous regulations which did not account for energy efficiency could reduce buildingsrsquo energy use up to 20152 Through platforms such as the Building Efficiency Accelerator the city continues to engage a wide range of stakeholders to develop strategies that foster efficient buildings 153 Voluntary initiatives like the SBCP help generate support for more comprehensive policies and will play an important role in accelerating their uptake
TAKING THE LEAD IN GREEN AND SUSTAINABLE BUILDINGS | MEXICO | MEXICO CITY
CASE STUDIES g
brings solar power to some
50000 homes clinics schools
and businesses
benefits over
250000 people
creates
450 jobs in Nigeria
aims to reach
10million installations
by 2022
reduces businesses fuel costs by at least
75
Initiative AccomplishmentsMTN Mobile Electricity Solynta
Current situationNigeriarsquos 7500 MW power supply lags behind the estimated
170000 MW demand costing the region 2-4 of its annual GDP
make up
9 out of 10 Nigerian businesses and contribute over 46 of the nationrsquos GDP
spend some
35 trillion Naira (US $97 billion) each year on generator fuel
R Small and medium enterprises
GDP
32
About the initiative Private companies are making solar energy accessible and affordable helping to meet the vast demand for reliable energy access across Nigeriarsquos cities
LAGOS
C H A P T E R 3
About the City
Population (metro area)
GDP
Land Area
16 millioncxli
US $136 billioncxlii
9996 km2 cxliii
IN RELATION TO SDGS
33
Solar companies are piloting innovative ways of making solar energy accessible and affordable meeting Nigeriarsquos enormous market and vast need for energy The Renewable Energy Association of Nigeria estimates that 15 MW of solar PV has been installed across the country with the potential to harness 40 ndash 65 kWh per square mile each day154 These installations reflect the diversity of energy needs across Africarsquos largest country In Lagos a solar school built through a partnership between architecture firm NLE Works the United Nations and the Heinrich Boll Foundation floats in the Makoko neighborhoodrsquos lagoons providing a gathering place for 100 children155 Consistent Energy Limited has focused on winning business from the same cityrsquos stylists signing up an estimated 200 barber shops for pay-as-you-go solar systems156
The private sector has been instrumental in deploying and demonstrating the feasibility of distributed solar energy systems The solar start-up Lumos Global for instance has partnered with Nigerian mobile provider MTN to bring solar power to over 50000 homes clinics schools and businesses benefiting over 250000 people and creating 450 jobs157 This partnership MTN Mobile Electricity aims to reach 10 million installations by 2022158
Working with Nigeriarsquos largest mobile provider ndash MTN captures about 39 of the countryrsquos mobile market share159 ndash makes solar power accessible MTN Mobile Electricity operates through MTNrsquos well-established marketing and distribution channels selling eighty-watt systems small enough to fit on the back of a motorcycle through approximately 300 MTN locations160 Customers pay for solar service through SIM cards which most citizens already use or have access to161 Unlike many East African countries such as Kenya Uganda and Tanzania where pay-as-you-go solar models have taken off the infrastructure and use of mobile money in many West African countries remains nascent162 Finding a quick and convenient way for customers to pay for solar systems without relying on mobile money bank accounts or credit cards marks a major step towards the wider growth of the market
From MTNrsquos perspective its partnership with Lumos Global helps it set itself apart from its competitors Offering a unique service ndash the ability to purchase solar energy ndash reduces every mobile companyrsquos greatest worry that its customers will switch to another provider Expanding access to reliable energy also makes it easier for customers to charge and use mobile phones163
The pay-as-you-go model employed by MTN Mobile Electricity and a wide range of companies operating in Nigeria helps customers overcome scarce access to financing so that upfront costs do not prevent them from taking advantage of longer term savings164 Pay-as-you-go solar companies also act in many ways as financial service providers reaching customers that
might otherwise be overlooked due to a lack of credit history This payment models mimic the diesel and kerosene payments customers are familiar with but deliver greater value for the money Lumos estimates that the cost of running a diesel generator for two hours is equivalent to the cost of running their solar system for a day165 Solynta which offers pay-as-you-go along with lease-to-own and direct purchase options has found that switching to solar reduces business fuel costs by at least 75166 Solar panels can last for 20 years extending these savings far into the future167
Solar energyrsquos lower costs could unleash additional economic development in Nigeria where customers spened between US $10 ndash 13 billion on kerosene and diesel fuels each year168 Bottlenecks in accessing power cost the country 2-4 of its GDP each year slowing economic growth jobs and investment169 Small and medium-sized enterprises which make up nine out of ten Nigerian businesses and contribute over 46 of the nationrsquos GDP are especially affected by a lack of access to reliable electricity spending some 35 trillion Naira (US $97 billion) each year on generator fuel170 For many business owners access to more reliable power translates into the ability to expand their services grow their businesses and create more jobs171
By illustrating the benefits of solar power to customers investors and the national government companies have helped accelerate its uptake Education and outreach efforts have introduced solar systems to new audiences172 Demonstration projects have overcome reputational challenges tied to poorly constructed solar options in earlier markets173 174
Demonstrating the demand for solar energy is also unlocking urgently needed finance Sixteen companies supported by pound2 million from the Solar Nigeria Programme delivered small solar light and power systems to 170000 Nigerian households during 2016 alone By 2020 the initiative aims to reach 5 million homes175 In addition to partnerships with philanthropic agencies and impact investors solar companies are increasingly attracting their own investment176 Lumos Global for instance raised a record US $90 million in 2016177 a hopeful signal that solar companies will continue accelerating the delivery of clean reliable energy
SCALING UP THE SOLAR MARKET | NIGERIA | LAGOS
CASE STUDIES g
34
C H A P T E R 3
32 GLOBAL 250 GREENHOUSE GAS EMITTERS A NEW BUSINESS LOGICNon-state actors especially the private sector will play a critical
role in addressing climate change and reducing Greenhouse Gas
(GHG) emissions Indeed the 250 companies178 referenced in this
report along with their value chains account for approximately
one third of global annual emissions179 For years the management
teams in many large organizations have recognized the future
constraints that climate change could pose on their business
operations and outlook While many have deferred making a
strategic shift toward a low carbon future others have recognized a new business logic a historic opportunity for innovation that drives sustainable growth and competitive advantage
The good news is that some companies in the Global 250 such as Total Ingersoll Rand Toyota Iberdrola and Xcel Energy are diversifying and decarbonizing their business models Their plans begun a decade or more ago have proven business results and provide a pathway to a profitable low carbon future that
Table 1 Companies in the Global 250 include the Top 15180 (listed below) which alone account for about 10 of global annual emissions181 and therefore play crucial roles in our global transition to a low carbon economy182
Rank (2015) Company
GHG Emissions Metric Tons CO2e (Scope 1+2+3)
GHG Index
Revenues Index
Decoupling Index
Employment Index
2016 2015 2014 Baseline 2014 =100
Baseline 2014 =100
Baseline 2014 =100
Baseline 2014 =100
1 Coal India 2014314687 1869412290 108 105 97 961
2 PJSC Gazprom 1247624306 1264855340 99 106 107 1049
3 Exxon Mobil Corporation 1096498615 1145083349 96 66 69 976
4 Thyssenkrupp AG 950917000 954185140 954085140 100 95 96 964
5China Petroleum
amp Chemical Corporation
874153506 901550000 97 71 74 979
6 Rosneft OAO 835868134 829849040 101 94 93 952
7 Cummins Inc 805343388 813043062 920001660 88 91 104 1015
8 PETROCHINA Company Limited 730924555 688790000 106 76 71 976
9 Royal Dutch Shell 734160000 698868219 735119000 100 55 56 979
10 Rio Tinto 668246000 669751731 652023000 102 71 69 854
11 China Shenhua Energy 643832223 733109000 88 70 80 1030
12 Korea Electric Power Corp 634243789 666588494 95 103 110 207
13 Total 469545000 581900000 598400000 78 60 77 1019
14 Petroacuteleo Brasileiro SA ndash Petrobras 544200903 547476491 618399435 88 84 95 851
15 United Technologies Corporation 401518529 530627775 530803247 76 99 131 957
Notes 1) 2014 scope 3 emissions data for Thyssenkrup AG and United Technologies Corporation vary significantly from 2015 scope 3 data therefore the change in scope 1+2 emissions between 2015 and 2014 is used in conjunction with Thyssenkrup AGrsquos and United Technologies Corporationrsquos respective 2015 scope 3 emisssions data to determine scope 3 emissions values for 2014
2) indicates a Decoupling Index that is susceptible to fossil fuel commodity prices
35
GLOBAL 250 GREENHOUSE GAS EMIT TERS g
stretches to 2050 and beyond Looking at the Global 250 evidence is accumulating that companies who demonstrate leadership toward a decarbonize economy gain strategic advantages
CASE STUDY OF TOTAL GROUP183
Now letrsquos take a closer look at one firmrsquos journey to decarbonize operating in a very challenging business sector fossil-fuel based energy
Francersquos Total SA (Total)184 is the fourth largest publicly held oil and gas company in the world The firm is responsible for GHG emissions that place it 13th on our list of major emitters Total is today widely recognized as a leader among major fossil fuel companies for its vision of a new clean energy future and its progress on adapting a large complex business for that future
Understanding the complex process of strategy-driven business transformation requires a framework to connect actions to outcomes over the long-term The model presented here was adapted from previous work (Lubin amp Esty The Sustainability Imperative HBR 2010) to assess a firmrsquos progress in transitioning along a ldquoclimate impact management maturity curverdquo Totalrsquos climate related efforts can be traced back 20 years or more and this historical review begins with their initial recognition of the challenges that climate change poses for a major energy company and the need to address them
Stage 1 Initial Engagement ndash In 2006 Total was one of the first major fossil fuel companies to publicly acknowledge the importance of climate change as a global risk Their initial efforts focused on implementing cost-effective approaches to significantly reduce flaring gas emissions
Stage 2 Systematic Management ndash By 2008 Total lead other major oil companies in systematic reporting of GHG and climate-related performance metrics including product use and included initial target setting for improvements in the companyrsquos operational footprint
Stage 3 Transforming the Core ndash In 2009 Total launched EcoSolutions its low carbon products and services portfolio With
a series of investments in SunPower (solar) Saft (battery design) Stem (energy optimization) and BHC Energy (operational energy efficiency) Total committed to shifting its revenue base toward sustainable energy solutions
Approaching Stage 4 Creating Competitive Differentiation ndash In 2014 under the leadership of Patrick Pouyanne Totalrsquos new Chairman and CEO the company fully articulated its strategy to differentiate itself from other oil companies Going forward Total would build its future business on three strategic pillars
1) Reducing the carbon intensity of its fossil fuel product mix
2) Investing judiciously in carbon capture utilization and storage technologies and
3) Expanding its business base in ldquorenewablesrdquo which includes production storage and the distribution of clean energy and biofuels
In 2015 Total exited the coal business Totalrsquos 2016 reorganization now drives a focus on renewables and low carbon energy solutions setting policy support and goals aligned with the IPCCrsquos 2degC target
If Total is to realize the full potential of its competitive advantage in the energy sector it will need to continue to demonstrate viable decarbonization pathways consistent with the 2-degree boundary This will require continued rapid growth of its EcoSolutions portfolio revenues and leadership among the oil companies as they address the potential challenge of so called ldquostranded assetsrdquo
LEADERSHIP TRANSLATES INTO REDUCED GHG IMPACTSThe data show leadership Total has reduced emissions over the last three years well ahead of IPCC guidance with an approximate 20 aggregate decline (or roughly 130 million metric tons) in total GHG emissions across all scopes185 While emissions declined Totalrsquos carbon intensity saw a 92 average annual rate of decline in GHGBOE (greenhouse gas emissionsbarrel of oil equivalent) between 2013 and 2016 or a cumulative decline of 275 from the baseline year of 2013186 Both aggregate emissions and the GHG intensity of Totalrsquos footprint are falling significantly
LEADERSHIP REFLECTED IN FINANCIAL OUTCOMES REDUCED COST OF CAPITALTable 2 provides evidence that Totalrsquos strategy along with their ability to execute it is already generating value for the firm Thomson Reutersrsquos Eikon platform displays Totalrsquos peer-leading credit rating represented by the blue dot in the peer-scatterplot below This is a significant advantage in the capital-intensive energy sector As Total continues to extend its climate impact leadership with more renewable and low carbon solutions the increasing value of its transformed green product portfolio is likely to significantly outpace the potential declining value of its traditional high carbon products
36
The full ldquoGlobal 250 Report A New Business Logicrdquo provides answers to the following questions as a changing climate disrupts markets and ecosystems
1) Who are the 250 public companies and value chains which are responsible for the largest emissions of greenhouse gases
2) Among this critical group how are emissions trending by company over the past 3 years
3) Is there evidence that decarbonization creates a drag on financial performance or a premium
4) Given the long-term transformation challenge confronting these large emitters how can we assess a companyrsquos progress and define leadership
5) How are policy and investor leadership evolving in a post-carbon economy
The report will be available at httpsblogsthomsonreuterscomsustainability
The case studies featured in this chapter highlight the diverse benefits that renewable energy and energy efficiency activities generate These projects have catalyzed economic growth across all levels of development creating opportunities for small construction firms and multinational companies In improving air quality reducing pollution expanding energy access and creating jobs RE and EE efforts move the world closer to the
2030 Agendarsquos Sustainable Development Goals Continued action across both developed and developing countries will also be vital to meeting the Paris Agreementrsquos targets and protecting these development gains Partnerships among cities regions companies civil society and national governments can help leverage these actorsrsquo respective strengths to further accelerate the development of RE and EE solutions
GLOBAL 250 GREENHOUSE GAS EMIT TERS gC H A P T E R 3
C CC CCC B BB BBB A AA AAAAgency Rating Average
Model Implied Rating
AAA
AA
A
BBB
BB
B
CCC
CC
C
This section has been contributed by ldquoDavid Lubin Constellation Research and Technology John Moorhead BSD Consulting Timothy Nixon Thomson Reuters
Table 2 Credit ratings among Total and its leading competitors showing Totalrsquos competitive advantage on this metric
Source Starmine Thomson Reuters Eikon
PEER COMPARISON EDIT PEERS
RIC Company Name Model Score Probability of Default
Model Implied Rating
Agency Component Scores
SampP Moodylsquos
Structural Model
SmartRatios Model
Text Mining Model
TOTFPA Total SA 75 005 A+ A+- 71 47 51
RDSbL Royal Dutch Shell PLC 63 006 A A+- 60 39 27
ENIMI Eni SpA 37 011 BBB BBB+Baa1 39 12 29
BPL BP PLC 33 012 BBB A-A1 39 7 43
REPMC Repsol SA 49 009 A- BBB-Baa2 53 18 30
STLOL Statoil ASA 37 011 BBB A+- 36 16 16
GALPLS Galp Energia SGPS SA 80 004 A+ -- 51 79 75
CVXN Chevron Corp 72 005 A+ AA-Aa2 87 37 50
Peer Avg 56 008 BBB+ A-A3 55 32 40
15degC- AND 2degC-COMPATIBIL IT Y gC H A P T E R 4
Mexico City Mexico
Mexico City is greening its building sector through a combination of policy incentives and reforms
R Details see page 30
15degC- AND 2degC-COMPATIBILITY A NEW APPROACH TO CLIMATE ACCOUNTING4 This chapter outlines a new approach that can be used to determine the compatibility of policies individual projects and entire sectors with scientific scenarios that limit global temperature rise to 15degC and 2degC It provides sector-level compatibility tables and project-level guidance and demonstrates how these criteria could be applied to individual RE and EE projects Applying these compatability conditions to internationally supported RE and EE projects can help identify and develop specific policy recommendations to create the local and national conditions necessary for 15degC and 2degC-compatible pathways
38
The final chapter of the 1 Gigaton Coalition 2016 report ldquoChapter 6 A Path Forward New Concepts for Estimating GHG Impactsrdquo suggested an alternative approach to assessing climate outcomes at the project and sector levels In addition to the problematic exercise of developing a counterfactual baseline (ie a business-as-usual scenario reflecting what would have happened in the absence of specific policy intervention or technology adoption) national governmentsrsquo Paris pledges or nationally-determined contributions (NDCs) often overlap with other actions within countries making it difficult to attribute specific emissions reductions to partner-supported activities
For renewable energy (RE) projects evaluating whether a technology or policy is compatible with science-based 15degC and 2degC scenarios can be straightforward A wind farm for instance that offsets equivalent fossil-fuel based emissions from grid electricity would be 2degC-compatible Energy efficiency (EE) projects are less straightforward a certified zero energy house under the passive house standard is for example more in line with 2degC development than an energy efficient house that just exceeds current building standards Secondary effects however will also need to be taken into consideration If a bioenergy project leads to adverse land use effects and increased emissions through deforestation then this project may not be in line with a 2degC pathway These significant secondary effects may not be captured using the GHG emissions reductions accounting method employed in the first two 1 Gigaton Coalition reports
This chapter outlines a new approach that can be used to determine the compatibility of policies individual projects and entire sectors with scientific scenarios that limit global temperature rise to 15degC and 2degC Drawing from other research initiatives and the International Energy Agencyrsquos (IEA) 2017 Energy Technologies Perspective (ETP) report this chapter presents criteria for 15degC and 2degC-compatibility at the sector level It also demonstrates how these criteria could be applied to RE and EE projects drawing examples from the RE and EE database compiled for this report Creating 15degC- and 2degCcompatibility conditions and applying these standards to internationally supported RE and EE projects opens the door for researchers to make key inferences and conclusions including
g Evaluation of local and national conditions necessary for 15degC and 2degC-compatible pathways
g Determination of additional efforts needed to make projects 15degC and 2degC compatible
g Development of specific policy recommendations to address project- and sectorlevel issues that create 15degC and 2degC-incompatibilities
g Sector level aggregation of emissions outcomes and resulting policy implications
41 DEVELOPING 15degC AND 2degC-COMPATIBILITY CONDITIONSA growing community of scientists researchers and policymakers have begun to develop metrics to assess sectors companies projects and policies for their compatibility with global climate targets The Climate Action Tracker (CAT) a scientific analysis produced by three independent research organizations ndash NewClimate Institute Ecofys and Climate Analytics ndash last year produced a list of ten short-term global targets that sectors need meet in order to limit warming to 15degC These goals include building no new coal-fired power plants and reducing emissions from coal by 30 by 2025 ending the production of fossil fuel cars by 2035 constructing only fossil-free or near-zero energy buildings and quintupling renovation rates of existing structures by 2020 and achieving 100 renewable energy penetration in electricity production by 2050187
Earlier this year CAT joined forces with a consortium of other research groups convened by former UNFCCC chair Christiana Figueres to produce an analysis of five of the heaviest emitting sectors The resulting report called ldquo2020 The Climate Turning Pointrdquo and published under the collaborativersquos name ldquoMission2020rdquo isolates short-term sectoral targets that are necessary to meet the long-term 2degC climate goal Giving context to CATrsquos list of ten sectoral targets the Mission2020 report shows that these targets are achievable under current conditions and that meeting them would produce desirable economic and human health outcomes188
Sector-level targets are key tools for governments and policymakers to plan assess and implement climate actions in reference to 15degC or 2degC goals Applying global sectoral objectives at the project level however requires another layer of analysis that incorporates a host of local considerations Factors
C H A P T E R 4
39
15degC- AND 2degC-COMPATIBIL IT Y g
pertaining to a localityrsquos policies economy development level energy mix and deployed technologies need to be examined in order to develop appropriate and rigorous goals that are compatible with 15degC or 2degC pathways
Science Based Targets (SBT) is a leading international initiative that strives to assess the complex conditions that determine 2degC compatibility at the firm or project level helping private companies set their own science-based climate targets A collaboration of the Climate Disclosure Project (CDP) United Nations Global Compact World Resources Institute (WRI) and World Wildlife Fund (WWF) and with technical support from Ecofys SBT aims to institutionalize climate target setting among firms in every sector SBT considers GHG emission reduction targets to be ldquoscience-basedrdquo if they align with a level of decarbonization that the international scientific community has deemed necessary to keep global temperature rise below 2degC Using at least one of SBTrsquos seven methods for setting emission targets 293 companies have applied to have their climate benchmarks verified of which SBT has approved 61 firmsrsquo science-based targets
The NewClimate Institute has also pioneered 2degC-compatibility methods and in November 2015 published a report ldquoDeveloping 2degC-Compatible Investment Criteriardquo in which the authors outline a methodology for investors to evaluate whether their investments are compatible with a science-based 2degC scenario189 Distilling complex science and policy issues into easy-to-understand ldquopositiverdquo and ldquonegativerdquo lists NewClimate shows how investors could apply a compatibility approach to the projects they finance Employing positive and negative lists that use quantitative and qualitative conditions to determine a project or sectorrsquos climate compatibility offers some relative advantages to a counterfactual baseline approach
A positive and negative list approach incorporates minimum and dynamic quantitative benchmarks giving clear markers of
2degC-compatibility and how these thresholds change over time This process can also include decision trees and scoring methodologies that help lay-persons use the compatibility method Central to creating positive and negative lists are the conditions that must be met to classify a project to either side Developing these conditions requires the distillation of complex information into a malleable and understandable format This balance of complexity and practicability is perhaps the compatibility approachrsquos greatest strength190
To develop meaningful compatibility conditions and positive and negative lists requires robust and current science The IEArsquos Energy Technology Perspectives 2017 (ETP) provides the scientific backbone for this reportrsquos compatibility criteria as it also does for SBTrsquos analytical tools191 ETP features three scenarios through the year 2060 a Reference Technology Scenario (RTS) representing energy and climate commitments made by countries including Nationally Determined Contributions (NDCs) pledged under the Paris Agreement a 2degC Scenario (2DS) and a Beyond 2degC Scenario (B2DS) which feature rapid decarbonisation measures creating pathways that align with long-term climate goals RTS illustrates explicit international ambitions which do not produce emissions reductions compatible with stated global climate objectives RTS would nonetheless represent a large emissions cut from a historical ldquobusiness as usualrdquo scenario 2DS and B2DS are centered around 2degC and 175degC pathways respectively and depict scenarios in which clean energy technologies are pushed to practical limits These scenarios align with some of the most ambitious aspirations outlined in the Paris Agreement
This report synthesizes current research on climate compatibility and incorporates targets from ETPrsquos 2DS and B2DS to create sector-level 15degC- and 2degC-compatibility criteria and conditions Demonstrating how one could apply these conditions to RE and EE initiatives graphical and flow-chart schematics are provided
40
for guidance and an example project is drawn from a database of bilateral- and multilateral-supported projects that was compiled for this report The challenges inherent to this approach are discussed as well as how one might overcome these issues and the policy implications of results
In May of 2017 the 1 Gigaton Coalition convened a meeting of climate policy experts in Bonn Germany initiating a dialogue to inform the development of 15degC- and 2degC compatibility criteria Dialogue participants evaluated questions prepared by this reportrsquos authors and discussed research challenges This section strives to address all of the most pertinent issues that came to the fore through the Bonn dialogue Many of the challenges inherent to 15degC- and 2degC-compatibility are addressed in Tables 31 ndash 315 below and potential methods for tackling those beyond the scope of this analysis are discussed
Sector-level 15degC- and 2degC-compatibility tables were developed The tables are categorized by sector including by RE technology type and various sectors that are grouped under EE a broad categorization encompassing transportation buildings and industry Sectors are divided into sub-sectors where data availability allowed There are clear science-based targets for instance for rail shipping and aviation allowing the creation of compatibility criteria for these transportation sub-sectors The tables do not represent every societal sector ndash agriculture for example is missing as is hydropower The compatibility analysis is therefore limited to this projectrsquos research scope as well as to the availability of scientific information The tables are tools for assessing 15degC- and 2degC compatibility and they are also proofs of concept that can and should be expanded upon to the limits of current scientific knowledge
The compatibility conditions in each table were largely drawn from the IEArsquos ETP 2017 and its 2DS and B2DS models ETPrsquos sectoral targets were cross-referenced with other scientific sources and were in some cases altered according to the researcherrsquos judgement It should be noted that ETPrsquos 2DS and B2DS models correspond to a 50 percent chance of limiting temperature increases to 2degC and 175degC respectively by the year 2100 This level of uncertainty carries over to the compatibility tables and should inform the perspective of those undertaking any science-based compatibility approach In this analysis the 15degC sectoral targets do not correspond precisely to 15degC of warming The 15degC conditions are rather aspirational targets that align with a level of warming at least 025degC below 2degC It would imply a false level of certainty to assert that the emissions targets and warming trajectories in this analysis precisely align with 15degC or 2degC of warming There are also drawbacks inherent to using one report ETP as the backbone of the analysis The compatibility conditions are however based on the most current and robust science available and it is believed they provide the best estimate for 2degC and below 2degC pathways
42 COMPATIBILITY TABLES
Key factors to consider when reading the sectoral Compatibility Tables (Tables 31 ndash 315)
g All compatibility conditions must be met for a sector to be positive listed (ie compatible)
g Yet the suites of conditions in this analysis do not mean to be comprehensive there may be other conditions or a suite of conditions that must be met under alternative 15degC and 2degC scenarios
g 15degC compatibility conditions are inclusive of 2degC conditions unless otherwise noted
g 15degC and 2degC compatibility conditions are combined for some sectors depending on data availability ndash this analysis does not distinguish between 15degC and 2degC compatibility in these cases
g Enabling policies are considered to be required for positive listing except in instances in which effective proxy policies are in place
g Conditions are considered met when sectors firms or policies demonstrate alignment with long-term global targets See Figures 7 ndash 10 for illustrations of this alignment
C H A P T E R 4
41
15degC- AND 2degC-COMPATIBIL IT Y g
Renewable Power Aggregate
Compatibility Conditions Enabling Policies
2degC
RE accounts for 72 of global energy mix by 2060
Electricity accounts for ~35 final energy demand by 2060
$61 trillion cumulative investment to decarbonize power sector ndash 23 of this investment in non-OECD countries
$34 trillion of investment goes to renewable power generation technologies (tripling of annual average)
Early retirement of coal-fired power plants
Annual investment in transmission doubles by 2025 compared to 2014 gt2000 GW transmission capacity deployed by 2060
Large-scale RampD and deployment of electricity storage technologies
RampD and deployment of carbon negative technologies including BECCS which achieves 2 share of electricity generation by 2060
Deployment of comprehensive demand-side management systems
Variable renewable energy integration with natural gas baseload systems
Triple investment in interconnected high-voltage transmission from 2015 levels by 2025
Power sector achieves near-full decarbonization by 2050
Carbon pricing
Renewable power investment incentives
Transparent disclosure of climate vulnerability to investors and stakeholders
Policies promoting systemic integration
Retirement of coal-fired power facilities
Shift of investment priorities from coal-fired power to renewables natural gas and CCS technologies
15degC
Accounts for 75 of energy mix by 2060
1000 PWh cumulative RE electricity generation through 2060
Electricity accounts for gt40 final energy demand by 2060 Power sector achieves full decarbonization by 2050 and is carbon negative thereafter
CCS systems account for gt10 of total electricity production by 2050 (including BECCS)
BioEnergy with CCS achieves 4 share of electricity generation by 2060
Nuclear has 15 share of electricity generation by 2060
Table 31 Renewable energy-powered electricity production aggregate sector-level 15degC- and 2degC-compatibility conditions
42
C H A P T E R 4
Renewable Power Sectors Compatibility Conditions Enabling Policies
SOLAR
Photovoltaics (PV) Achieves 17 of energy mix by 2060
gt1000 TWh of annual power produced by 2025
4400 GW capacity by 2050 6700 GW capacity by 2060
4x increase in annual capacity additions by 2040
Investment costs for GW capacity decrease by two-thirds by 2060 compared to 2015
$11 trillion cumulative investment through 2060
Carbon pricing
Renewable power investment incentives
Transparent disclosure of climate vulnerability to investors and stakeholders
Policies promoting systemic integration
Retirement of coal-fired power facilities
Shift of investment priorities to from coal-fired power to renewables natural gas and CCS technologies
Solar Thermal Achieves 10 energy mix by 2060
160 TWh of annual power produced by 2025
Increased deployment for industrial applications
$6 trillion cumulative investment through 2060
WIND
20 of energy mix by 2060
Onshore 2400 TWh annual power produced by 2025
Offshore 225 TWh annual power produced by 2025
10500 TWh produced by 2060
3400 GW capacity by 2050
4200 GW capacity by 2060
Investment costs per GW capacity decrease by ~18 compared to 2015
$11 trillion cumulative investment through 2060
BIOENERGY
24 of energy mix by 2060
Energy output doubles to around 145 EJ by 2060
Increased integration of advanced biomass with industrial processes
100 sustainably sourced by 2060
Net negative carbon source by 2060
GEOTHERMAL
220 TWh annual power produced by 2025
Increased integration with industrial processes
Table 32 Renewable energy-powered electricity production disaggregated sector-level 15degC- and 2degC-compatibility conditions
43
15degC- AND 2degC-COMPATIBIL IT Y g
Industry Aggregate Compatibility Conditions Enabling Policies
2degC
Global direct emissions from industry are halved by 2060
Immediate adoption of ISO-certified energy management system (EMS)
Industrial energy consumption growth limited to 03 annually (~90 decrease from 2000 - 2014 average)
~30 improvement in industrial energy intensity by 2060
Demonstrated BAT implementation
Portion of fossil fuel sources declines by gt4 annually through 2030
Shift toward higher proportion of renewables-powered electrification (on- and off-site) as end-use energy source
Improved material yields across supply chain improved inter-industry material efficiencies
Energy and material efficiency standards
Policies that improve scrap collection and recycling rates
Incentives for BAT adoption
Remove fossil fuel subsidies
Catalyzing investment for RampD and commercialization of new technologies
Improve data reporting and collection
Carbon pricing
Large scale shifts in investment
Develop advanced life-cycle assessments for industrial inputs and products
15degC
Global direct emissions from industry are reduced by 80 by 2060
Industrial energy consumption growth limited to 02 annually (gt90 decrease from 2000 ndash 2014 average)
gt30 improvement in industrial energy intensity by 2060
Demonstration of zero- and negative- carbon technologies
Proportion of fossil fuel sources declines by gt7 annually through 2030
Electrification in industrial operations increases ~27 by 2060 and electrical power use is 98 decarbonized by 2060 compared with present levels
Table 33 Industry aggregate sector-level 15degC- and 2degC-compatibility conditions
44
C H A P T E R 4
Industry Cement Compatibility Conditions Enabling Policies
2degC
Direct carbon intensity decreases by ~10 by 2030
10 carbon captured by 2030 towards 30 captured by 2060
Diminished use of coal as source of energy for cement production so coal is lt50 of energy mix by 2060
Increase use of cement clinker substitution materials
Energy and material efficiency standards
Policies that improve scrap collection and recycling rates
Incentives for BAT adoption
Remove fossil fuel subsidies
Catalyzing investment for RampD and commercialization of new technologies
Improve data reporting and collection
Carbon pricing
Large scale shifts in investment
Develop advanced life-cycle assessments for industrial inputs and products
15degCDirect carbon intensity decreases by gt20 by 2030
25 carbon captured by 2030 towards gt75 captured by 2060
Diminished use of coal as source of energy for cement production so coal is one-third of energy mix by 2060
10 reduction in clinker ratio by 2060
Table 34 Industry cement disaggregated sector-level 15degC- and 2degC-compatibility conditions
Industry Iron and Steel Compatibility Conditions Enabling Policies
2degC
30 reduction in CO2 intensity of crude steel production by 2030 compared with 2014
Aggregate energy intensity of crude steel production reduced by 25 by 2030 compared with 2014 levels
gt10 carbon captured by 2025 towards 40 captured by 2060
50 of energy used for crude steel production is from electricity natural gas and sources other than coal by 2060
Improved metal scrap reuse and recycling towards 100 end-use scrap recycling
Energy and material efficiency standards
Policies that improve scrap collection and recycling rates
Incentives for BAT adoption
Remove fossil fuel subsidies
Catalyzing investment for RampD and commercialization of new technologies
Improve data reporting and collection
Carbon pricing
Large scale shifts in investment
Develop advanced life-cycle assessments for industrial inputs and products15degC
gt90 reduction in annual emissions by 2060
50 reduction in CO2 intensity of crude steel production by 2030 compared with 2014
Aggregate energy intensity of crude steel production reduced by one-third by 2030 compared with 2014 levels
gt20 carbon captured by 2025 towards 80 captured by 2060
gt50 of energy used for crude steel production is from electricity natural gas and sources other than coal by 2060
Table 35 Industry iron and steel disaggregated sector-level 15degC- and 2degC-compatibility conditions
45
15degC- AND 2degC-COMPATIBIL IT Y g
Industry Chemicals and Petrochemicals
Compatibility Conditions Enabling Policies
2degC
Annual emissions lt 1 GtCO2 in 2060
Depending on chemical produced emissions intensity decrease by between ~15 and 40 by 2030
Reduced aggregate energy intensity amount reduced depends on energy expenditure on CCS
gt15 carbon captured by 2025 towards 30 captured by 2060
Waste plastic recycling increases to gt40 by 2060
Energy and material efficiency standards
Policies that improve scrap collection and recycling rates
Incentives for BAT adoption
Remove fossil fuel subsidies
Catalyzing investment for RampD and commercialization of new technologies
Improve data reporting and collection
Carbon pricing
Large scale shifts in investment
Develop advanced life-cycle assessments for industrial inputs and products
15degCAnnual emissions decrease by 70 from 2015 levels by 2060 (reaching ~320 Mt CO2)
Depending on chemical produced emissions intensity decrease by between ~25 and 60 by 2030
gt25 carbon captured by 2025 towards 90 captured by 2060
Table 36 Industry chemicals and petrochemicals disaggregated sector-level 15degC- and 2degC-compatibility conditions
Industry Pulp and Paper Compatibility Conditions Enabling Policies
2degC
CO2 intensity is cut by ~40 by 2030 and reduced by ~75 by 2060 compared to 2014 levels
28 reduction in energy intensity by 2060 compared to 2014 levels
Deployment of Best Available Technologies (BAT) as well as low-carbon and CCS technologies
Substitute heat biomass and electricity for fossil fuel energy supply
66 end-use paper product recycling by 2060
Energy and material efficiency standards
Policies that improve scrap collection and recycling rates
Incentives for BAT adoption
Remove fossil fuel subsidies
Catalyzing investment for RampD and commercialization of new technologies
Improve data reporting and collection
Carbon pricing
Large scale shifts in investment
Develop advanced life-cycle assessments for industrial inputs and products
15degCCO2 intensity is cut in half by 2030 and reduced by gt90 by 2060 compared to 2014 levels
30 reduction in energy intensity by 2060 compared to 2014 levels
66 end-use paper product recycling by 2060
Table 37 Industry pulp and paper disaggregated sector-level 15degC- and 2degC-compatibility conditions
46
C H A P T E R 4
Industry Buildings Compatibility Conditions Enabling Policies
2degC
Specific building energy use between 10 - 150 kWhm2 or under 4 MWhperson
15 annual improvement in building envelope performance
Limit global energy demand to 130 EJ
Shift to electrification to supply ~70 of final energy consumption in buildings globally by 2060
Renewables (on- and off-site) supply gt85 of final energy consumption by 2060
Shift to BAT electric heat pumps in temperate climates
Aim to achieve 350 efficiency improvement in cooling equipment and 120 efficiency improvement for heating equipment with further improvements through 2060
Immediate scaling up to 3 renovation rate (global average)
Retrofits improve energy intensity by at least 30 with plan to move to ldquonear-zerordquo energy use
Mix of policy and financial incentives and requirements for energy efficient construction deep renovations and BAT uptake
Strong Mandatory Energy Performance (MEP) targets for all buildings and financial penalties for substandard performance
Upfront financial incentives (eg rebates tax breaks guaranteed loans)
Comprehensive support for BATs
Special emphasis given to heating and cooling demand efficiency in cold and hot climates respectively
In countries with large portion of 2060 building stock to be new construction MEPs integrated efficiency policies and incentives for near-zero energy building construction (nZEBs) are given weight
In countries with large portion of 2060 building stock already built renovation policies are given weight
Integrated urban planning that encompasses construction that increasing building lifetime and reducing secondary and tertiary emissions
Policies designed to develop a robust market for high-efficiency building construction renovations and BAT uptake
15degC
Specific building energy use under 35 MWhperson
Decrease energy demand by around 02 annually through 2060 to around 114 EJ
Shift to electrification to supply ~70 of final energy consumption in buildings globally and near total elimination of fossil power
Renewables supply gt95 of final energy consumption
Immediate scaling up to 5 renovation rate (global average)
Retrofits improve energy intensity by at least 50 with plan to move to ldquonear-zerordquo energy use
Table 38 Buildings aggregate sector-level 15degC- and 2degC-compatibility conditions
47
15degC- AND 2degC-COMPATIBIL IT Y g
Transportation Aggregate Compatibility Conditions Enabling Policies
2degC
54 GHG reductions by 2060 compared to 2015 (75 in OECD countries 29 in non-OECD countries)
Move toward electrification biofuels and full decarbonization by 2060
Efficiency improvements (systemic technological material and fuel) that reduce life-cycle energy intensity by more than half
Intermodal shifts (eg replace aviation with high speed rail)
Regulatory GHG targets at national and international level
Fuel technological and material efficiency standards
Mandates and financial incentivessupport for BAT adoption
Elimination of fossil fuel subsidies
Carbon pricing and fuel taxes
Regulations and financial incentives supporting transition to zero-emission vehicles and electrification of transport modes
Alternative fuel development and technological RampD
Demand management
Intermodal and systemic planning
RampD support for zero- and negative-emission technologies and infrastructure
Systemic data collection and organization on policy effectiveness
15degC
83 GHG reductions by 2060 compared to 2015 (95 in OECD countries 72 in non-OECD countries)
Table 39 Transportation aggregate sector-level 15degC- and 2degC-compatibility conditions
Transportation Bus Compatibility Conditions Enabling Policies
2degCLarge-scale adoption of electric engines and other zero-emission technologies
Implementation of negative cost efficiency measures including technological upgrades
Intermodal shifts from light-duty vehicles (LDV) to buses
Passenger kilometers more than double through 2060
Regulatory GHG targets at national and international level
Fuel technological and material efficiency standards
Mandates and financial incentivessupport for BAT adoption
Elimination of fossil fuel subsidies
Carbon pricing and fuel taxes
Alternative fuel development and technological RampD
Regulations and financial incentives supporting transition to zero-emission vehicles and electrification of transport modes
Demand management
Intermodal and systemic planning
RampD support for zero- and negative-emission technologies and infrastructure
Systemic data collection and organization on policy effectiveness
15degC
80 energy efficiency improvement by 2060 (urban)
47 energy efficiency improvement by 2060 (intercity)
Passenger kilometers nearly triple through 2060
Table 310 Transportation Bus disaggregated sector-level 15degC- and 2degC-compatibility conditions
48
C H A P T E R 4
Transportation Rail Compatibility Conditions Enabling Policies
2degCFull electrification by 2060
Passenger kilometers more than triple through 2060
Intermodal shifts from aviation and LDV to high-speed rail and light rail
Railrsquos share of transport activities increases from 10 to 15
Regulatory GHG targets at national and international level
Fuel technological and material efficiency standards
Mandates and financial incentivessupport for BAT adoption
Elimination of fossil fuel subsidies
Carbon pricing and fuel taxes
Regulations and financial incentives supporting transition to zero-emission vehicles and electrification of transport modes
Demand management
Intermodal and systemic planning
RampD support for zero- and negative-emission technologies and infrastructure
Systemic data collection and organization on policy effectiveness
15degC
100 light rail electrification by 2045
Passenger kilometers increase sixfold through 2060
Railrsquos share of transport activities about doubles from ~10 to ~20
Table 311 Transportation Rail disaggregated sector-level 15degC- and 2degC-compatibility conditions
Transportation Aviation Compatibility Conditions Enabling Policies
2degC
15degC
50 reduction from 2005 levels by 2050
70 reduction in direct emissions by 2060 without offsets
Shift to ~70 advanced biofuels by 2060
25 annual reduction in specific energy use per passenger kilometer
Intermodal shifts away from aviation toward high speed rail
Regulatory GHG targets at national and international level
Fuel technological and material efficiency standards
Mandates and financial incentivessupport for BAT adoption
Elimination of fossil fuel subsidies
Carbon pricing and fuel taxes
Regulations and financial incentives supporting transition to zero-emission vehicles and electrification of transport modes
Alternative fuel development and technological RampD
Demand management
Intermodal and systemic planning
RampD support for zero- and negative-emission technologies and infrastructure
Systemic data collection and organization on policy effectiveness
Table 312 Transportation Aviation disaggregated sector-level 15degC- and 2degC-compatibility conditions
49
15degC- AND 2degC-COMPATIBIL IT Y g
Transportation Shipping Compatibility Conditions Enabling Policies
2degC
Steady emissions through 2030
25 emissions reduction through 2060
28 annual reduction in specific energy use per tonne kilometer through 2060
62 improvement over 2010 levels in energy per efficiency by 2060 (except only 53 for container ships)
Continuous ship capacity growth through 2060 container ships 09 bulk carriers 04 general cargo 06 (annual rates)
Regulatory GHG targets at national and international level
Fuel technological and material efficiency standards
Mandates and financial incentivessupport for BAT adoption
Elimination of fossil fuel subsidies
Carbon pricing and fuel taxes
Regulations and financial incentives supporting transition to zero-emission vehicles and electrification of transport modes
Alternative fuel development and technological RampD
Broad retrofit program
Demand management
Intermodal and systemic planning
RampD support for zero- and negative-emission technologies and infrastructure
Systemic data collection and organization on policy effectiveness
15degC
Emissions reductions beginning in 2020 50 reductions through 2060
Shift to 50 advanced biofuels by 2060
Table 313 Transportation Shipping disaggregated sector-level 15degC- and 2degC-compatibility conditions
Transportation Trucking Compatibility Conditions Enabling Policies
2degC78 reduction in road freight emissions by 2060 compared to 2015
Ultra-low and zero-carbon engines achieve majority share in global trucking fleet by 2050
Large-scale logistics and vehicle utilization improvements
Regulatory GHG targets at national and international level
Fuel technological and material efficiency standards
Mandates and financial incentivessupport for BAT adoption
Elimination of fossil fuel subsidies
Carbon pricing and fuel taxes
Regulations and financial incentives supporting transition to zero-emission vehicles and electrification of transport modes
Demand management
Intermodal and systemic planning
RampD support for zero- and negative-emission technologies and infrastructure
Systemic data collection and organization on policy effectiveness
15degC
gt78 reduction in road freight emissions by 2060 compared to 2015
gt20 energy supplied by low-carbon fuels by 2060 with complimentary zero-emission technologies
Table 314 Transportation Trucking disaggregated sector-level 15degC- and 2degC-compatibility conditions
50
43 PROJECT-LEVEL COMPATIBILITYAssessing project level compatibility with 15degC- and 2degC goals is a significantly more challenging task than establishing sector level targets To determine an individual project firm or policyrsquos compatibility with global climate goals requires greater subjectivity than do appraisals of sectors as one must consider local heterogeneity ndash a mix of factors that high-level targets do not specifically address Actions are undertaken at the local level and a compatibility analysis strives to link these actions with all their particularities to global phenomena Development level is perhaps the most challenging local factor to account for
Every project or policy takes shape in a particular development context with financial economic technological and knowledge barriers that can vary greatly from country to country and case to case Development trajectories also differ greatly depending on locality and these trajectories are crucially important to determining 15degC- and 2degC-compatibility pathways Reconciling climate goals with national and international development priorities is a critical component of 15degC- and 2degC-compatibility analyses and this process remains a difficult hurdle for many countries to overcome
C H A P T E R 4
Transportation Light-Duty Vehicles
Compatibility Conditions Enabling Policies
2degC30 fuel efficiency improvement in all new cars in OECD countries by 2020
50 fuel efficiency improvement in all new cars globally by 2030
50 fuel efficiency improvement in all cars globally by 2050
Regulatory GHG targets at national and international level
Fuel technological and material efficiency standards
Mandates and financial incentivessupport for BAT adoption
Elimination of fossil fuel subsidies
Carbon pricing and fuel taxes
Regulations and financial incentives supporting transition to zero-emission vehicles and electrification of transport modes
Policies that increase cost of ownership of petroleum LDVs and decrease cost of ownership of zero-emission LDVs
Demand management
Intermodal and systemic planning
RampD support for zero- and negative-emission technologies and infrastructure
Systemic data collection and organization on policy effectiveness
15degC
gt50 of LDVs are non-combustion engine vehicles by 2050
90 of all cars are plug-in hybrids
All new vehicles by 2030 will have fuel efficiency equal to 4 litres per 100 km (in accordance with the Worldwide harmonized Light vehicles Test Procedure (WLTP))
40 of all new vehicles of all kinds are ldquoultra-lowrdquo or ldquozero emissionrdquo by 2030
13 of new LDVs are PEVs in OECD and China by 2020 32 by 2030
gt70 of all energy use by LDVs is electric by 2060
Electric driving share for plug-in hybrid electric vehicles (PHEVs) increase to 50 by 2020 and 80 by 2030
Table 315 Transportation Light-duty vehicles disaggregated sector-level 15degC- and 2degC-compatibility conditions
51
15degC- AND 2degC-COMPATIBIL IT Y g
Figures 7 - 10 present a suite of schematics that illustrate how a project firm policy sector or nation could demonstrate 15degC- and 2degC-compatibility and become positive listed In this analysis complete access to information ndash on project inputs and operations for instance ndash is prerequisite for any policy project or entity to be positive listed In the schematics nations sectors and projects employing best available technologies (BATs) and producing output at or near maximum efficiency are considered ldquohigh efficiencyrdquo and are held to stricter conditions than ldquolow efficiencyrdquo activities Nations and sectors with adequate resources ndash including all OECD countries and sectors therein ndashwould be required to have in place a plan for resource sharing with less developed countries sectors and project implementers in order to achieve positive listing Precise resource sharing levels would have to be determined on a case by case basis requiring climate policy experts and scientists to facilitate international cooperation These schematics underscore the importance of both quantitative and qualitative criteria when determining 15degC- and 2degC compatibility Rather than supplanting human judgment this exercise shows the need for subjective decisionmaking as most project and sectoral compatibility hinges on transparent and actionable planning as well as complex cross-sector interactions that are not captured in this reportrsquos tables and schematics
Compatibility metric (eg Carbon Intensity)
206020302017
Current global average
Project A inDevelopingCountry B
Project X inDevelopingCountry Y
2030 Global Target
2060 Global Target
Year
Figure 6 Graphical schematic showing how projects of the same type in separate development contexts could achieve 15degC- or 2degC-compatibility
Source Authors 1 Gigaton Coalition Report 2017
52
Note that sectors in high efficiency developed national contexts would have to exceed global targets to be positive listed thereby balancing out less efficient sectors in developing countries
All nations or sectors that currently meet or exceed global targets would have to demonstrate a transparent actionable plan to share resources with those not currently meeting global targets in order to be positive-listed
C H A P T E R 4
YESNO
NONO
NO
YESNO
YESYES
YES
Meets global targets Exceeds global targets
Transparent actionableplan to meetexceed 2030 targets
Transparent actionable plan for resource sharing
Conditional positive listed Positive listed
Negativelisted
Negative listed
Resource sharing
Low Efficiency High Efficiency
Sector Nation X
Figure 7 Decision tree schematic that could inform whether a sector or nation is positive listed for 15degC- or 2degC-compatibility
Characterized by low income and rapid development trajectory limited use of BATs
53
Note that projects in high efficiency developed national contexts would have to exceed global targets to be positive listed thereby balancing out low efficiency projects in developing countries
15degC- AND 2degC-COMPATIBIL IT Y g
YESNO
NO
YESNO
YES
Meets sector targets Exceeds sector targets
Transparent actionableplan to meetexceed 2030 targets
Conditional positive listed Positive listed
Low Efficiency High Efficiency
Project Policy X
Negativelisted
Figure 8 Decision tree schematic that could inform whether a project or policy is positive listed for 15degC- or 2degC-compatibility
Characterized by low income and rapid development trajectory limited use of BATs
54
With more than $15 billion in approved funding this project is jointly supported by the World Bankrsquos Clean Technology Fund (CTF) administered via the Asian Development Bank (ADB) a CTF loan the Agence Franccedilaise de Deacuteveloppement (AFD) the European Investment Bank (EIB) the French governmentrsquos Direction Geacuteneacuterale du Treacutesor and the Vietnamese governmentrsquos counterpart funds The project is classified as ldquolow efficiencyrdquo due to its developing nation context and its locationrsquos general lack of public transit With plans to meet daily demand of 157000 passengers by 2018 and 458000 passengers by 2038 ADB estimates that the project will mitigate an average of 33150 tCO2e annually through 2038 These demonstrable goals are considered to meet the sector-level 15degC- and 2degC-compatibility conditions for rail (see Table 110) particularly the passenger kilometers (pkm) metrics (threefold pkm increase for 2degC-compatibility and sixfold pkm increase for 15degC-compatibility) With no MRT currently running in Hanoi this project is a massive improvement on the status quo especially considering Vietnamrsquos status as a low-income nation192
C H A P T E R 4
NO
NO
YESNO
YES
YESMeets sector targets Exceeds sector targets
Transparent actionableplan to meetexceed 2030 targets
Conditional positive listed Positive listed
Negative listed
Low Efficiency High Efficiency
Mass Rapid Transit in Hanoi Viet Nam
ADB CTF AFD EIB French and Vitnamese Governments
Figure 9 A recently-approved Mass Rapid Transit (MRT) project based in Hanoi was chosen for a demonstration of the decision tree schematic
55
With more than $35 million in grants from the Global Environment Facility (GEF) and UNDP and more than $63 million in public and private co-financing the Plan includes one 10 MW solar PV plant and one 24 MW wind farm as demonstration projects and has a target of achieving 30 RE penetration by 2030 This meets most of the 15degC- and 2degC-compatibility conditions for RE Solar PV and Wind power (see Tables 11 and 12) Yet this 2030 energy mix goal falls short of the global 2060 targets The Tunisian Solar Plan fits well within the sectorrsquos enabling policies goal and considering Tunisiarsquos status as a low-income nation this project is conditionally positive listed as 15degC- and 2degC-compatible This initiative however is a prime example of a policy ripe for positive influence and aid from funders and outside governments Considering Tunisiarsquos rich solar and wind resources the countryrsquos national plan should be expected to incorporate a greater mix of RE in the long term193
15degC- AND 2degC-COMPATIBIL IT Y g
YES
NO
YESNO
YES
NOMeets sector targets Exceeds sector targets
Transparent actionableplan to meetexceed 2030 targets
Conditional positive listed Positive listed
Negative listed
Low Efficiency High Efficiency
Support for the Tunisian Solar Plan Tunisia
GEF UNDP
Figure 10 Approved in 2013 a project supporting the development of the Tunisian Solar Plan was chosen for a demonstration of the decision tree schematic
C H A P T E R 5
5 Building from a custom 600-project database compiled for the second 1 Gigaton Coalition report this report has expanded the analysis to assess 273 of these projects including 197 renewable energy (RE) 62 energy efficiency (EE) and 14 classified as having both RE and EE components With implementation dates ranging from 2005 through 2016 the projects are found in 99 countries Of the 273 projects 100 are supported by 12 bilateral institutions and firms in 10 different countries and another 173 projects are supported by 16 multilateral development banks and partnerships Project-level data were collected from these organizations including information on assistance levels energy capacity energy savings supported technologies and impact evaluation methodologies The resulting database was not intended to include all of the developing worldrsquos RE and EE efforts but instead exhibits a representative cross-section of bilateral- and multilateral supported projects
DATABASE ASSESSMENT
Valle De Cauca Colombia
Across Colombialsquos Valle del Cauca region entrepreneurs are transforming their firms into green businesses
R Details see page 28
57
DATABASE ASSESSMENT g
After a historic year in 2015 when global investments in renewable energy (RE) projects reached a record high of $286 billion new investment in renewables (excluding large hydro) fell to $242 billion in 2016 In developed economies new investments decreased by 14 to $125 billion while in developing economies they went down by 30 to $1166 billion194 The decrease in investment is explained by two main factors First solar photovoltaics onshore wind and offshore wind saw more than 10 decreases in average dollar capital expenditure per capacity These technologies have become more cost-competitive Second financing slowed in China Japan and some emerging markets Across different renewable technologies solar capacity additions rose from 56 GW to a historic-high 75 GW while wind capacity additions slowed down to 54 GW compared to 63 GW in 2015 Overall the total amount of new capacity installed increased from 1275 GW in 2015 to a record 1385 GW in 2016 For two years in a row renewable power comprised more than half of the worldrsquos added electric generation capacity Investment in energy efficiency also rose 9 to $231 billion in 2016195
Bilateral and multilateral development aid organizations have for decades played a key role in energy projects in developing countries196 From 2004 to 2014 development institutions in OECD countries financed more than US $247 billion for RE and EE projects in developing nations Bilateral development finance institutions such as Norwayrsquos Norfund and bilateral government agencies such as Japan International Cooperation Agency (JICA) are the vehicles for state-sponsored foreign investments Multilateral development banks (MDBs) including the Asian Development Bank (ADB) and European Investment Bank (EIB) have joined forces to finance RE and EE projects throughout the developing world investing more than US$100 billion from 2004 - 2014 according to OECD estimates197 These groups also build policy and administrative capacity among governments and businesses in recipient countries According to OECD estimates they invested US $47 billion in energy policy and administrative management in 2014 more than any other recipient sector besides electricity transmission and distribution198
51 AGGREGATED IMPACTThis section seeks to build on the 1 Gigaton Coalition 2016 Report and update the evaluation of emissions impact of bilateral- and multilateral-supported RE and EE projects in developing countries implemented from 2005 ndash 2016199 Project-level data were collected from organizations including information on assistance levels energy capacity energy savings supported technologies and impact evaluation methodologies The resulting database was not intended to include all RE and EE efforts in developing countries but instead exhibited a representative cross-section of bilateral- and multilateral-supported projects
Despite the harmonized framework for calculating GHG emissions savings from RE and EE projects that International Financial Institutions (IFIs) agreed upon in 2015 current aggregate GHG impact data are incomplete to accurately assess these effortsrsquo total effects200 The new frameworkrsquos influence has extended beyond Multilateral Development Banks (MDBs) and has been incorporated by as many bilateral groups Yet the framework is still not detailed enough to provide sufficient methodological information to meet the criteria for this analysis Organizations generally describe how their aggregate estimates attribute reductions from projects with multiple supporters and despite the harmonised framework calculation assumptions may vary widely from project to project Project-level research is therefore needed to overcome these issues
Communications with aid organization representatives and extensive desk research yielded sufficient information on 197 RE 62 EE projects and 14 REEE projects for calculating GHG emissions impact estimates The project-by-project emissions reductions estimates were made using a common calculation method that accounts for Scope 1 emissions (see Annex)
The supported projects on energy efficiency and renewable energy have significant impact on greenhouse gas emissions
g The analyzed sample of internationally supported RE and EE projects in developing countries will reduce emissions by approximately 0258 gigatons carbon dioxide (GtCO2)
The projects encompass every sector taken into evaluation for 15degC- and 2degC compatibility including wind and solar power generation geothermal small hydro and biomass energy efficiency in buildings rapid public transit systems electric vehicle deployment electricity transmission industrial efficiency and other sub-sectors The sample of internationally supported RE and EE projects in developing countries will reduce emissions by approximately 258 million tons carbon dioxide (MtCO2) annually in 2020 Total emissions reductions from internationally supported RE and EE projects from 2005 through 2015 could be up to 600 MtCO2e per year in 2020 if the samplersquos emissions reductions are scaled up to a global level using total bilateral and multilateral support figures for RE and EE (US $76 billion)
Mt CO2yr
0
800
600
400
200
1000
1200
1400
1600
2020
Year theprojects are
financed
2019
2018
2017
2005ndash
2016
Mitigation impact in 2020
CO2
Figure 12 Emission reductions in 2020 from scaled up public mitigation finance for RE and EE projects
Source Authors 1 Gigaton Coalition Report 2017
58
annually in 2020 The 273 analysed projects generate these emissions savings by displacing fossil fuel energy production with clean energy technologies or by conserving energy in industry buildings and transportation RE projects contribute around 0085 GtCO2 EE projects contribute 0113 GtCO2e and REEE projects contribute about 0059 GtCO2 to the analysisrsquos total emissions reductions These projects received direct foreign assistance totalling US $32 billion
g Total emissions reductions from internationally supported RE and EE projects since 2005 could be up to 0600 GtCO2 per year in 2020 This estimate is derived by scaling up the analysed samplersquos emissions reductions to a global level using total multilateral and bilateral support figures for RE and EE ($76 billion between 2005 and 2016)201 International support flows to markets that are in the early stages of development where barriers to private investment have to be lifted for RE and EE finance to mature This foreign investment which includes critical support for capacity building is essential for spurring RE and EE development despite the fact that foreign support accounts for less than 10 of total RE and EE investments in developing countries
g If public finance for mitigation is scaled up through 2020 emissions would be reduced by more than 1 GtCO2 per year (Figure 12) Countries agreed to mobilize US $100 billion in total climate finance (mitigation and adaptation public and private) For this estimate we assume that a quarter of the US $100 billion is public mitigation finance
C H A P T E R 5
59
52 SELECTED BILATERAL INITIATIVESOutreach to bilateral organizations and desk research yielded detailed data on 100 projects from 12 bilateral groups in nine countries China Finland France Germany Japan The Netherlands Norway United Kingdom and the United States The eight OECD countries invested more than US $9 billion in RE power generation in developing nations from 2006 ndash 2015202 Data on Chinarsquos foreign energy investments is difficult to obtain yet it is known that China has in the past 15 years begun to invest in RE abroad China has supported at least 124 solar and wind initiatives in 33 countries since 2003 Fifty-four of these investments ndash those for which financial data is available ndash sum to nearly US $40 billion203
The bilateral groups featured in this analysis include state-owned investment funds like Norwayrsquos Norfund government-owned development banks like the China Development Bank and some are private companies operating on behalf of government ministries like GIZ in Germany The full list of bilateral organizations included in this analysis is shown in Table 4 Bilateral development groups generally mobilize public funds from national budgets to finance initiatives abroad Some groups raise capital from private markets and others use both public and private financing in their operations Development institutions finance projects via grants andor loans distributed to governments of recipient nations which in turn distribute funding to ministries local agencies and firms in charge of project implementation Promoting development abroad is central to the mission of all the groups considered in this report and the analysis focuses only on funding for RE and EE projects which may comprise a relatively small portion of a bilateral organizationrsquos total portfolio
DATABASE ASSESSMENT g
60
C H A P T E R 5
Table 4 Selected Bilateral Organizations204
Note Cells shaded grey indicates no data available
Bilateral Organization Country YearEstablished
OECD-reported National Assistance for RE and EE Development (millions current US $)205 206
Bilateral Development Organizationrsquos RE and EE Achievements
Bilateral Organizationrsquos Estimated GHG Emissions Mitigation Impact
RE and EE Investments in this Analysis (millions current US $)
RE and EE Projects in this Analysis2015
2005ndash2015 (cumulative)
Agence Franccedilaise de Deacuteveloppement (AFD) France 1998 401 2533 AFDrsquos supported projects installed 1759 MW of REProjects financed from 2013 ndash 2015 abate 114 Mt CO2 annually207 1850 30
China Development Bank and China Exim Bank
China 1994 1000208 549 4
Department for International Development (DFID)International Climate Fund (ICF)
UK 19972011 59 359DFID and ICF supported projects with 230 MW of RE capacity already installed and 3610 MW of RE capacity expected over the projectsrsquo lifetime
Supported RE projects have achieved 66 Mt CO2 abatement209 207 4
Danida Denmark 1971 2 151Danida has allocated more than 1604 million DKK to projects on natural resources energy and climate changes in developing countries between 2016 and 2020
108 5
FinnFund Finland 1980 20 226US $168 million invested in ldquoEnergy and Environmental developmentrdquo from 2011 ndash 2015210 40 2
FMOThe
Netherlands1970 38 521
Established its climate investment fund Climate Investor One (CIO) in 2014 which will develop approximately 20 RE initiatives and build 10 more RE projects with cumulative 1500 MW capacity These efforts will create 2150000 MWh of additional clean electricity production and bring electricity access to approximately 6 million people
CIO aims to achieve an annual avoidance of 15 MtCO2 emissions through the 10 RE projects it builds210
189 3
Deutsche Gesellschaft fuumlr Internationale Zusammenarbeit GmbH (GIZ)212
Germany 2011 954 9899
Since 2005 GIZrsquos EE programs have achieved energy savings equal to the annual energy consumption of more than one million German households GIZ has also distributed energy-saving cookstoves to more than 10 million people GIZ currently has 39 active RE projects in developing countries with more than $480 million invested in this sector213
7 2
KfWDEG Germany 19481962DEGrsquos supported RE initiatives have an estimated annual production of 8000000 MWh equivalent to the annual consumption of approximately 9 million people
KfWrsquos supported 2015 EE projects produce an estimated 15 MtCO2eyear and its supported 2015 RE projects generate an estimated 25 MtCO2eyear though it should be noted that these projects include large hydropower and biomass plants214
1007 9
Japan International Cooperation Agency (JICA)
Japan 1974 204 4807Committed in 2014 to support RE projects with total capacity of 2900 MW
JICA supported RE projects are expected to reduce emissions by 28 MtCO2year (does not include supported EE projects)215
4726 30
NorFund Norway 1997 27 883
Supported RE projects in Africa Asia and Americas have a total installed capacity of 4800 MW with 600 MW more currently under construction These RE projects produced 18500000 MWh in 2015 alone
Norfundrsquos supported RE projects reduced emissions by an estimated 74 MtCO2 in 2015209
39 11
Overseas Private Investment Corporation (OPIC)
USA 1971 244 763In 2015 committed nearly $11 billion to RE in developing countries marking the fifth year in a row that its investments in RE have topped $1 billion217
666 5
All OECD countries 1949 21142
61
DATABASE ASSESSMENT g
Bilateral Organization Country YearEstablished
OECD-reported National Assistance for RE and EE Development (millions current US $)205 206
Bilateral Development Organizationrsquos RE and EE Achievements
Bilateral Organizationrsquos Estimated GHG Emissions Mitigation Impact
RE and EE Investments in this Analysis (millions current US $)
RE and EE Projects in this Analysis2015
2005ndash2015 (cumulative)
Agence Franccedilaise de Deacuteveloppement (AFD) France 1998 401 2533 AFDrsquos supported projects installed 1759 MW of REProjects financed from 2013 ndash 2015 abate 114 Mt CO2 annually207 1850 30
China Development Bank and China Exim Bank
China 1994 1000208 549 4
Department for International Development (DFID)International Climate Fund (ICF)
UK 19972011 59 359DFID and ICF supported projects with 230 MW of RE capacity already installed and 3610 MW of RE capacity expected over the projectsrsquo lifetime
Supported RE projects have achieved 66 Mt CO2 abatement209 207 4
Danida Denmark 1971 2 151Danida has allocated more than 1604 million DKK to projects on natural resources energy and climate changes in developing countries between 2016 and 2020
108 5
FinnFund Finland 1980 20 226US $168 million invested in ldquoEnergy and Environmental developmentrdquo from 2011 ndash 2015210 40 2
FMOThe
Netherlands1970 38 521
Established its climate investment fund Climate Investor One (CIO) in 2014 which will develop approximately 20 RE initiatives and build 10 more RE projects with cumulative 1500 MW capacity These efforts will create 2150000 MWh of additional clean electricity production and bring electricity access to approximately 6 million people
CIO aims to achieve an annual avoidance of 15 MtCO2 emissions through the 10 RE projects it builds210
189 3
Deutsche Gesellschaft fuumlr Internationale Zusammenarbeit GmbH (GIZ)212
Germany 2011 954 9899
Since 2005 GIZrsquos EE programs have achieved energy savings equal to the annual energy consumption of more than one million German households GIZ has also distributed energy-saving cookstoves to more than 10 million people GIZ currently has 39 active RE projects in developing countries with more than $480 million invested in this sector213
7 2
KfWDEG Germany 19481962DEGrsquos supported RE initiatives have an estimated annual production of 8000000 MWh equivalent to the annual consumption of approximately 9 million people
KfWrsquos supported 2015 EE projects produce an estimated 15 MtCO2eyear and its supported 2015 RE projects generate an estimated 25 MtCO2eyear though it should be noted that these projects include large hydropower and biomass plants214
1007 9
Japan International Cooperation Agency (JICA)
Japan 1974 204 4807Committed in 2014 to support RE projects with total capacity of 2900 MW
JICA supported RE projects are expected to reduce emissions by 28 MtCO2year (does not include supported EE projects)215
4726 30
NorFund Norway 1997 27 883
Supported RE projects in Africa Asia and Americas have a total installed capacity of 4800 MW with 600 MW more currently under construction These RE projects produced 18500000 MWh in 2015 alone
Norfundrsquos supported RE projects reduced emissions by an estimated 74 MtCO2 in 2015209
39 11
Overseas Private Investment Corporation (OPIC)
USA 1971 244 763In 2015 committed nearly $11 billion to RE in developing countries marking the fifth year in a row that its investments in RE have topped $1 billion217
666 5
All OECD countries 1949 21142
62
RE AND EE PROJECT DATA COLLECTION CRITERIA To be included in the analysis projects had to meet the following criteria These boundaries allowed for the calculation of each projectrsquos GHG emissions mitigation and the identification of reporting overlaps
Scope of Data
g Project location the report only considers projects in developing and emerging economies China was given special consideration as both a recipient and distributor of foreign investments
g Project focus the report only evaluates projects with an explicit RE or EE focus
g Support the report only examines projects at least partly supported by bilateral or multilateral development groups
g Timeframe the report only analyzes projects that were implemented from 2005 through 2016 Data was collected for projects that have not yet been implemented but these projects were excluded from the analysis
Types of Data
g Technology type analysis could only be performed where the technology type (for RE) or technical improvement (for EE) was given (eg solar or power system upgrade)
g Energy information To be analyzed projects had to include quantified power or capacity data This report builds on the previous 1 Gigaton Coalition reportsrsquo scope including many more RE and EE projects in its analysis RE projects employ one of only a handful of technologies with the primary goal of producing electrical power which is commonly expressed in generating capacity (MW) or power (MWh) making reporting and collecting data on these initiatives straightforward EE on the other hand is a broad classification that can refer to a multitude of different activities including initiatives that involve multiple economic sectors EE programs often involve buildings and appliances and they are also employed in industrial systems the power sector transportation and waste Any program that seeks to enhance efficiency in energy production or consumption can be considered an EE project Such an extensive classification requires a flexible methodological framework with sector-specific considerations for each project type in order to establish baselines and determine initiative outcomes (see Section 4) These complex considerations mean that EE project impacts are generally more challenging to quantify than RE project results With various types of EE programs there are varying metrics for describing project results This analysis only includes EE efforts that report energy savings resulting from project implementation a metric most often expressed in terajoules (TJ) or megawatt-hours (MWh)
C H A P T E R 5
63
DATABASE ASSESSMENT g
53 SELECTED MULTILATERAL INSTITUTIONS
Building on the data collected for the 2016 1 Gigaton Report the analysis this year includes 173 projects supported by 16 multilateral groups The multilateral institutions featured include multilateral development banks (MDBs) like the Asian Development Bank (ADB) European Investment Bank (EIB) and Inter-American Development Bank (IDB) These institutions are often intertwined as for instance the International Bank for Reconstruction and Development (IBRD) and International Finance Corporation (IFC) are both part of the extensive World Bank Group Some are affiliated with bilateral institutions such as Proparco in France which is a private sector subsidiary of the bilateral Agence Franccedilaise de Deacuteveloppement (AFD) As the name suggests multilateral development groups draw public and private funding from multiple countries to finance development initiatives throughout the world These organizations often fund projects in collaboration with each other employing multi-layered finance agreements that include grants loans and leveraged local funding
Organizational frameworks and funds that pool resources and coordinate project support among MDBs have become increasingly influential in recent years The Global Environment Facility (GEF) is perhaps the most prominent of these collaborative efforts A partnership of 18 multinational agencies representing 183 countries GEFrsquos investments support and
attract co-financing to a significant portion of the developing worldrsquos RE and EE projects218 The Climate Investment Funds (CIF) created by the World Bank in 2008 is another catalyst of MDB support CIF now consists of four programs two of which focus on developing and expanding RE in middle- and low-income countries219 These collaborations help mobilize funds and they also act as data hubs collecting information on the projects that their partners implement
MDBsrsquo collaborative approach to project finance makes double-counting individual efforts ndash ie counting individual projects more than once ndash more likely when creating an initiative database One project may have multiple groups supporting it all of whom report the initiative and its outcomes as their own This overlap means that if an analyst were to combine different sets of MDB-reported aggregated data there would be projects counted multiple times This problem of multiple attribution and double counting can debase the credibility of an otherwise sound analysis (see Section 4) With detailed project-level data on RE and EE projects this analysis is able to avoid the hazard of double-counting MDBsupported programs Any overlaps between projects in the database were discerned and appropriately addressed so that each project was only counted once Note that in Table 5 overlaps among projects from ldquoSupporting organization reportedrdquo sources are not disaggregated so these data may exhibit double counting demonstrating the difficulties of aggregating data at this level
64
C H A P T E R 5
Multilateral Firm Fund Institution or Partnership
Number of Member Countries and Structure
YearEstablished
OECD-reported Develop-ment Assistance ($ millions current USD)205 206 Supporting Organizationrsquos Reported RE and EE
Investments and ImpactsSupporting Organizationrsquos Estimated GHG Emissions Mitigation Impact
RE and EE Investments in Analysis ($ millions current USD)
RE and EE Projects in Analysis2015
2005ndash2015 (combined)
Acumen Non-profit venture fund 2001Acumen invested $128 million in breakthrough innovations and impacted 233 million lives
125 2
Asian Development Bank (ADB)
67 member countries MDB 1966 350 4227
Invested $247 billion in clean energy in 2015 (RE and EE) including 1481 GWhyear renewable electricity generation 4479 GWhyear electricity saved 37994 TJyear direct fuel saved and 618 MW newly added renewable energy generation capacity
Achieved abatement of 219 MtCO2eyear221 4390 30
African Development Bank (AfDB)
80 members MDB 1964 58 1824 43 1
Asian Infrastructure Investment Bank (AIIB)
56 countries MDB
2014 officially launched in 2016
Invested $165 million in one EE projectAchieved abatement of 16400 tCO2 per year222 165 1
European Development Fund (EDF)
EUrsquos main instrument for providing development aid to African Caribbean and Pacific (ACP) countries and to overseas countries and territories (OCTs)
1959 273 5
European Investment Bank (EIB)
28 European member states European Unionrsquos nonprofit long-term lending institution
1958As a result of $21 billion of climate lending in 2014 3000 GWh of energy was saved and 12000 GWh of energy was generated from renewable sources
Climate lending in 2014 led to avoidance of 3 MtCO2 emissions225 226 214 3
Green Climate Fund (GCF)
Established by 194 countries party to the UN Framework Convention on Climate Change in 2010 Governed by a 24-member board whose participants are equally drawn from developed and developing countries and which receives guidance from the Conference of the Parties to the Convention (COP)
2010$103 billion of support was announced by 43 state governments towards a goal of mobilizing $100 billion by 2020
Anticipated avoidance of 248 MtCO2e through 17 projects227 228 337 2
Global Environment Facility (GEF)
GEFrsquos governing structure is organized around an Assembly the Council the Secretariat 18 Agencies representing 183 countries a Scientific and Technical Advisory Panel (STAP) and the Evaluation Office GEF serves as a financial mechanism for several environmental conventions
1992 84 296
Since 1991 GEF has invested more than $42 billion in 1010 projects to mitigate climate change in 167 countries GEFrsquos investments leveraged more than $383 billion from a variety of other sources including GEF Agencies national and local governments multilateral and bilateral agencies the private sector and civil society organizations
27 billion tonnes of greenhouse gas (GHG) emissions have been removed through the GEFrsquos investment and co-financing activities around climate change mitigation from 1991 ndash 2014229
3098 76
HydroChina Investment Corp
Public company in China 2009 115 1
Table 5 Selected Multilateral Development Organizations220
Note Cells shaded grey indicates no data available
65
DATABASE ASSESSMENT g
Multilateral Firm Fund Institution or Partnership
Number of Member Countries and Structure
YearEstablished
OECD-reported Develop-ment Assistance ($ millions current USD)205 206 Supporting Organizationrsquos Reported RE and EE
Investments and ImpactsSupporting Organizationrsquos Estimated GHG Emissions Mitigation Impact
RE and EE Investments in Analysis ($ millions current USD)
RE and EE Projects in Analysis2015
2005ndash2015 (combined)
Acumen Non-profit venture fund 2001Acumen invested $128 million in breakthrough innovations and impacted 233 million lives
125 2
Asian Development Bank (ADB)
67 member countries MDB 1966 350 4227
Invested $247 billion in clean energy in 2015 (RE and EE) including 1481 GWhyear renewable electricity generation 4479 GWhyear electricity saved 37994 TJyear direct fuel saved and 618 MW newly added renewable energy generation capacity
Achieved abatement of 219 MtCO2eyear221 4390 30
African Development Bank (AfDB)
80 members MDB 1964 58 1824 43 1
Asian Infrastructure Investment Bank (AIIB)
56 countries MDB
2014 officially launched in 2016
Invested $165 million in one EE projectAchieved abatement of 16400 tCO2 per year222 165 1
European Development Fund (EDF)
EUrsquos main instrument for providing development aid to African Caribbean and Pacific (ACP) countries and to overseas countries and territories (OCTs)
1959 273 5
European Investment Bank (EIB)
28 European member states European Unionrsquos nonprofit long-term lending institution
1958As a result of $21 billion of climate lending in 2014 3000 GWh of energy was saved and 12000 GWh of energy was generated from renewable sources
Climate lending in 2014 led to avoidance of 3 MtCO2 emissions225 226 214 3
Green Climate Fund (GCF)
Established by 194 countries party to the UN Framework Convention on Climate Change in 2010 Governed by a 24-member board whose participants are equally drawn from developed and developing countries and which receives guidance from the Conference of the Parties to the Convention (COP)
2010$103 billion of support was announced by 43 state governments towards a goal of mobilizing $100 billion by 2020
Anticipated avoidance of 248 MtCO2e through 17 projects227 228 337 2
Global Environment Facility (GEF)
GEFrsquos governing structure is organized around an Assembly the Council the Secretariat 18 Agencies representing 183 countries a Scientific and Technical Advisory Panel (STAP) and the Evaluation Office GEF serves as a financial mechanism for several environmental conventions
1992 84 296
Since 1991 GEF has invested more than $42 billion in 1010 projects to mitigate climate change in 167 countries GEFrsquos investments leveraged more than $383 billion from a variety of other sources including GEF Agencies national and local governments multilateral and bilateral agencies the private sector and civil society organizations
27 billion tonnes of greenhouse gas (GHG) emissions have been removed through the GEFrsquos investment and co-financing activities around climate change mitigation from 1991 ndash 2014229
3098 76
HydroChina Investment Corp
Public company in China 2009 115 1
continue next page
66
C H A P T E R 5
Table 5 Selected Multilateral Development Organizations220 (continued)
Multilateral Firm Fund Institution or Partnership
Number of Member Countries and Structure
YearEstablished
OECD-reported Develop-ment Assistance ($ millions current USD)205 206 Supporting Organizationrsquos Reported RE and EE
Investments and ImpactsSupporting Organizationrsquos Estimated GHG Emissions Mitigation Impact
RE and EE Investments in Analysis ($ millions current USD)
RE and EE Projects in Analysis2015
2005ndash2015 (combined)
International Finance Corporation (IFC)
184 member countries 1946 422 2394 95 2
Inter-American Development Bank (IDB)
48 MDB 1959 588 3959 134 4
The BRICS New Development Bank
5 MDB
July 2014 (Treaty
signed)July 2015
(Treaty in force)
Invested $911 million in RE projects in 2016 equaling 1920 MW in capacity
These investments are expected to avoid 3236 MtCO2eyr
911 5
ProparcoPublic-Private European Development Finance Institution based in France
1977Proparcorsquos supported RE projects 2013 ndash 2015 have a combined capacity of 175 MW 695 MW in 2015 alone
Proparcorsquos 2015 investments have reduced emissions by an estimated 0876 MtCO2e231
344 10
World Bank
189 member countries The World Bank Group is comprised of five multilateral finance organizations including IBRD and IFC as well as The International Development Association (IDA) The Multilateral Investment Guarantee Agency (MIGA) The International Centre for Settlement of Investment Disputes (ICSID)
1944 1092 8801
In 2015 the World Bank catalysed $287 billion in private investments and expanded renewable power generation by 2461 MW
588 MtCO2e reduced with the support of special climate instruments in 2015 1270000 in MWh in projected lifetime energy savings based on projects implemented in 2015230
504 11
Climate Investment Funds (CIF)
72 developing and middle income countries comprised of four programs including CTF and SREP as well as the Forest Investment Program (FIP) and Pilot Program Climate Resilience (PPCR) all implemented and supported by MDBs
2008 579 2132
Funding pool of $83 billion ($58 billion in expected co-financing) CIF investments of $18 billion (as of 2015) are expected to contribute to 1 GW of CSP and 36 GW of geothermal power223
10891 (including cofinance)
23
Clean Technology Fund (CTF)
72 developing and middle income countries projects implemented by MDBs
2008Fund of $56 billion with approved RE capacity of 18865 MW These projects expected to generate 70099 GWhyr
CTF investments are expected to deliver emissions reductions of 1500 MtCO2e over all projectsrsquo lifetime 20 MtCO2e have already been achieved224
13332 (including
co-finance)12
Note Cells shaded grey indicates no data available
67
DATABASE ASSESSMENT g
Multilateral Firm Fund Institution or Partnership
Number of Member Countries and Structure
YearEstablished
OECD-reported Develop-ment Assistance ($ millions current USD)205 206 Supporting Organizationrsquos Reported RE and EE
Investments and ImpactsSupporting Organizationrsquos Estimated GHG Emissions Mitigation Impact
RE and EE Investments in Analysis ($ millions current USD)
RE and EE Projects in Analysis2015
2005ndash2015 (combined)
International Finance Corporation (IFC)
184 member countries 1946 422 2394 95 2
Inter-American Development Bank (IDB)
48 MDB 1959 588 3959 134 4
The BRICS New Development Bank
5 MDB
July 2014 (Treaty
signed)July 2015
(Treaty in force)
Invested $911 million in RE projects in 2016 equaling 1920 MW in capacity
These investments are expected to avoid 3236 MtCO2eyr
911 5
ProparcoPublic-Private European Development Finance Institution based in France
1977Proparcorsquos supported RE projects 2013 ndash 2015 have a combined capacity of 175 MW 695 MW in 2015 alone
Proparcorsquos 2015 investments have reduced emissions by an estimated 0876 MtCO2e231
344 10
World Bank
189 member countries The World Bank Group is comprised of five multilateral finance organizations including IBRD and IFC as well as The International Development Association (IDA) The Multilateral Investment Guarantee Agency (MIGA) The International Centre for Settlement of Investment Disputes (ICSID)
1944 1092 8801
In 2015 the World Bank catalysed $287 billion in private investments and expanded renewable power generation by 2461 MW
588 MtCO2e reduced with the support of special climate instruments in 2015 1270000 in MWh in projected lifetime energy savings based on projects implemented in 2015230
504 11
Climate Investment Funds (CIF)
72 developing and middle income countries comprised of four programs including CTF and SREP as well as the Forest Investment Program (FIP) and Pilot Program Climate Resilience (PPCR) all implemented and supported by MDBs
2008 579 2132
Funding pool of $83 billion ($58 billion in expected co-financing) CIF investments of $18 billion (as of 2015) are expected to contribute to 1 GW of CSP and 36 GW of geothermal power223
10891 (including cofinance)
23
Clean Technology Fund (CTF)
72 developing and middle income countries projects implemented by MDBs
2008Fund of $56 billion with approved RE capacity of 18865 MW These projects expected to generate 70099 GWhyr
CTF investments are expected to deliver emissions reductions of 1500 MtCO2e over all projectsrsquo lifetime 20 MtCO2e have already been achieved224
13332 (including
co-finance)12
68
International Financial Institutions (IFIs) are banks that have been chartered by more than one country All of the MDBs featured in this report are also IFIs These institutions adopted the ldquoInternational Financial Institution Framework for a Harmonised Approach to Greenhouse Gas Accountingrdquo in November 2015 in an important step toward developing a global methodological standard for GHG accounting232 As the IFI framework gains widespread adoption there are opportunities to add specifications that would improve and further unify the methodologies The framework in its current form could provide more detailed instructions to ensure that results are reproducible This way a third-party analysis would be able to combine GHG emissions impact estimates of different projects from multiple sources Nevertheless in many instances supporting MDBs present project-level emissions mitigation estimates citing the recently harmonised framework yet without providing the precise assumptions inherent to their calculations The IFI framework is a very promising development and widespread sharing of methodological approaches is a powerful tool for catalyzing harmonization efforts
Accounting for Scope 2 and 3 emissions remains a difficult task and a near-term goal for groups financing RE and EE projects With an annual investment of US$11 billion internationally supported RE and EE initiatives in developing countries are less than 10 of total investment Yet this class of funding can have outsized effects as foreign investment leverages other financing builds capacity in local institutions and helps mainstream RE and EE project finance233 According to OECD estimates aid groups invested US$47 billion in energy policy and administrative management in 2014 more than any other recipient sector besides electrical transmission and distribution There is however no harmonized method for estimating emissions impacts from such activities Analysts from several bilateral and multilateral institutions interviewed expressed their desires to accurately measure the outcomes of capacity building efforts as well as policy and administrative aid As funding for these initiatives grow developing rigorous and harmonized ways to do this evaluation is key to fully capturing the results of foreign investments in RE and EE projects
531 MULTISTAKEHOLDER PARTNERSHIPS
In addition to bilateral and multilateral initiatives multi-stakeholder partnerships of both public and private actors also extend financial and capacity-building support to developing countries spurring innovation and new policies This section features some examples of initiatives that are operating in developing countries as models for demonstrable mitigation impact
C H A P T E R 5
wwwccacoalitionorg
Established in 2012 the Climate and Clean Air Coalition (CCAC) is a voluntary partnership uniting governments intergovernmental and nongovernmental organizations representatives of civil society and the private sector committed to improving air quality and slowing the rate of near-term warming in the next few decades by taking concrete and substantial action to reduce short-lived climate pollutants (SLCPs) primarily methane black carbon and some hydrofluorocarbons (HFCs) Complementary to mitigating CO2 emissions fast action to reduce short-lived climate pollutants has the potential to slow expected warming by 2050 as much as 05 Celsius degrees significantly contributing to the goal of limiting warming to less than 2degC
Reducing SLCPs can also advance priorities that are complementary with the 1 Gigaton Coalitionrsquos work such as building country capacity and enhancing energy efficiency For example replacing current high Global Warming Potential (GWP) HFCs with available low- or no-GWP alternatives can also improve the efficiency of the appliances and equipment that use them potentially reducing global electricity consumption by between 02 and 07 by 2050 resulting in a cumulative reduction of about 55 Gt CO2e234
Another example of this alignment is the SNAP Initiative of the CCAC which supports twelve countries to develop a national strategy to reduce short-lived climate pollutants and identify the most cost-effective pathways to large-scale implementation of SLCP measures This initiative has resulted in a number of countries including Mexico Cote drsquoIvoire Chile and Canada submitting NDCs that integrate SLCP mitigation
CLIMATE AND CLEAN AIR COALITION (CCAC)
ctc-norg
The Climate Technology Centre and Network (CTCN) delivers tailored capacity building and technical assistance at the request of developing countries across a broad range of mitigation and adaptation technology and policy sectors As the implementation arm of the UNFCCC Technology Mechanism the CTCN is a key institution to support nations in realizing their commitments under the Paris Agreement
As countries around the world seek to scale up their energy-efficient low-carbon and climate-resilient development the CTCN plays the role of technology matchmaker mobilizing a global network of technology expertise from finance NGO private and research sectors to provide customized technology and policy support Over 200 technology transfers are currently underway in 70 countries
The Centre is the implementing arm of the UNFCCC Technology Mechanism It is hosted and managed by UN Environment and the United Nations Industrial Development Organization (UNIDO) and supported by more than 340 network institutions around the world Nationally-selected focal points (National Designated Entities) in each country coordinate requests and implementation at the national level
districtenergyinitiativeorg
The District Energy in Cities Initiative is a multi-stakeholder partnership coordinated by UN Environment with financial support from DANIDA the Global Environment Facility and the Government of Italy As one of six accelerators of the Sustainable Energy of All (SEforAll) Energy Efficiency Accelerator Platform launched at the Climate Summit in September 2014 the Initiative is supporting market transformation efforts to shift the heating and cooling sector to energy efficient and renewable energy solutions
The Initiative aims to double the rate of energy efficiency improvements for heating and cooling in buildings by 2030 helping countries meet their climate and sustainable development targets The Initiative helps local and national governments build local know-how and implement enabling policies that will accelerate investment in modern ndash low-carbon and climate resilient ndash district energy systems UN Environment is currently providing technical support to cities in eight countries including Bosnia and Herzegovina Chile China India Malaysia Morocco Russia and Serbia
Since its establishment the Secretariat has been leading and coordinating the development of as well as facilitating global access to the best relevant technical information necessary to address regulatory economic environmental and social barriers to enable successful and sustainable district energy programmes
The Initiative works with a wide range of committed partners and donors Partnerships are a key enabler for combatting climate change and fostering sustainable development and are firmly embedded in the way the initiative works at global regional and national level By joining forces with other players the initiative leverages additional resources expertise and technical know-how to help countries and cities in their effort to move towards modern district energy systems
CLIMATE TECHNOLOGY CENTRE AND NETWORK (CTCN)
DISTRICT ENERGY IN CITIES INITIATIVE (DES)
69
DATABASE ASSESSMENT g
httpunited4efficiencyorg
The enlighten initiative is a public-private partnership be-tween the UN Environment and companies such as OSRAM Philips Lighting and MEGAMAN with support from the Global Environment Facility (GEF) The initiativersquos main aim is to support countries in their transition to energy efficient lighting options enlighten has taken a regional approach to standards implementation Through this method coun-tries are able to share the costs for innovation and testing centres as well as recycling and waste schemes to manage disposal of the new products (eg lights containing mercu-ry) To date the enlighten initiative accounts for over 60 partner countries with a number of ongoing regional and national activities and projects Over the next several years the enlighten initiative ndash as the lighting chapter of United for Efficiency ndash will focus its support for countries to leap-frog to LED lighting and assisting countries and cities to im-plement efficient street lighting policies and programmes
ENLIGHTEN
70
C H A P T E R 5
httpwwwglobalabcorg
The Global Alliance for Buildings and Construction (GABC) promotes and works towards a zero-emission efficient and resilient buildings and construction sector It is a voluntary international multi-stakeholder partnership serving as global collaborative umbrella organization for other platforms initiatives and actors to create synergies and increase climate action scale and impact for decarbonising the buildings and construction sector in line with the Paris Agreement goals
The GABCrsquos common objectives are
(a) Communication Raising awareness and engagement making visible the magnitude of the opportunities and impact in the buildings and construction sector
(b) Collaboration Enabling public policy and market transformation action to achieve existing climate commitments through implementing partnerships sharing technical expertise and improving access to financing
(c) Solutions Offering and supporting programmes and locally adapted solutions to achieve climate commitments and further ambitious lsquowell-below 2degC pathrsquo actions
The GABC has five Work Areas for addressing key barriers to a low-carbon energy-efficient and resilient buildings and construction sector Education amp Awareness Public Policy Market Transformation Finance and Measurement Data and Accountability
Specifically the GABC focuses on
g Working towards a common vision and goals by developing a GABC global roadmap and issuing an annual GABC Global Status Report
g Catalysing action particularly supporting and accelerating NDC implementation
g Facilitating access to and scaling-up technical assistance by coordinating membersrsquo needs with other membersrsquo capabilities and capacities
httpwwwglobalcovenantofmayorsorg
The Global Covenant of Mayors for Climate amp Energy is an international alliance of cities and local governments with a shared long-term vision of promoting and supporting voluntary action to combat climate change and move to a low emission resilient society The Covenant focuses on
g Local Governments as Key Contributors The Global Covenant of Mayors works to organize and mobilize cities and local governments to be active contributors to a global climate solution
g City Networks as Critical Partners Local regional and global city networks are core partners serving as the primary support for participating cities and local governments
g A Robust Solution Agenda Focusing on those sec-tors where cities have the greatest impact the Global Covenant of Mayors supports ambitious locally relevant solutions captured through strategic action plans that are registered implemented and monitored and publicly available
g Reducing Greenhouse Gas Emissions and Fostering Local Climate Resilience The Global Covenant of May-ors emphasizes the importance of climate change mit-igation and adaptation as well as increased access to clean and affordable energy
Created through a coalition between the Compact of Mayors and EU Covenant of Mayors the Global Covenant of Mayors is the broadest global alliance committed to local climate leadership building on the commitments of over 7477 cities representing 684880509 people and 931 of the global population
GLOBAL ALLIANCE FOR BUILDINGS AND CONSTRUCTION (GABC)
GLOBAL COVENANT OF MAYORS FOR CLIMATE AND ENERGY
71
DATABASE ASSESSMENT g
httpswwwitf-oecdorg
The International Transport Forum (ITF) at the Organisation for Economic Development and Cooperation (OECD) is an intergovernmental organization with 59 member countries The ITF acts as a think tank for transport policy and organ-ises the Annual Summit of transport ministers It serves as a platform for discussion and pre-negotiation of policy issues across all transport modes and it analyses trends shares knowledge and promotes exchange among transport de-cision-makers and civil society The ITF also has a formal mechanism through its Corporate Partnership Board (CPB) to engage with the private sector Created in 2013 to enrich global policy discussions with a private sector perspective it brings together companies with a clear international per-spective in their activities that play an active role in trans-port and associated sectors CPB partners represent com-panies from across all transport modes and closely related areas such as energy finance or technology
Together with its member countries and corporate partners the ITF has developed a wide range of projects including transport and climate change In May 2016 the ITF Decar-bonising Transport project was launched to help decision makers establish pathways to carbon-neutral mobility This project brings together a partnership that extends far be-yond the member countries of ITF There are currently more than 50 Decarbonising Transport project partners from in-tergovernmental organisations non-governmental organi-sations national governments city networks foundations universities research institutes multilateral development banks professional and sectoral associations and the pri-vate sector
wwwendevinfo
EnDev is an international partnership with the mission to promote sustainable access to modern energy services in developing countries as a means to inclusive social eco-nomic and low carbon development EnDev is funded by six donor countries Norway the Netherlands Germany Unit-ed Kingdom Switzerland and Sweden EnDev was initiated in 2005 and is currently implemented in 26 countries in Africa Asia and Latin America with a focus on least de-veloped countries EnDev promotes sustainable access to climate-smart energy services that meet the needs of the poor long lasting affordable and appreciated by users while also fulfilling certain minimum quality criteria The most widely promoted technologies are improved cook-stoves for clean cooking solar technologies for lighting and electricity supply as well as mini-grids
EnDev has a robust monitoring system which provides donors partners and management with verified data and reliable assessments By now EnDev has facilitated sus-tainable access for more than 173 million people more than 38600 small and medium enterprises and 19400 so-cial institutions In 2016 through the measures of the pro-gramme CO2 emission reductions totalled 18 million tons per year Since beginning in 2005 EnDev has contributed to avoiding more than 85 million tons of CO2 This figure is a conservative estimate it includes various deductions for sustainability additionality free riding and replacement or repeat customers The majority of the EnDevrsquos avoided emissions are generated in the cookstove sector
INTERNATIONAL TRANSPORT FORUM AT THE ORGANISATION FOR ECONOMIC DEVELOP-MENT AND COOPERATION (OECD)
ENERGISING DEVELOPMENT (ENDEV)
72
C H A P T E R 5
wwwpfannet
The Private Financing Advisory Network is one of few actors in the climate finance space addressing the barriers to success for small and medium enterprises (SME) in developing coun-tries and emerging economies ndash a shortage of bankable proj-ects on the demand side and difficulties assessing risks and a conservative lending culture on the supply side
PFANrsquos goals are to reduce CO2 emissions promote low-carbon sustainable economic development and help facilitate the tran-sition to a low-carbon economy by increasing financing oppor-tunities for promising clean energy projects PFAN accomplishes this by coaching and mentoring high-potential climate and clean energy businesses by developing a network of investors and fi-nancial institutions with an interest in and extensive knowledge of clean energy markets and by presenting to these investors projects that have been screened for commercial viability sus-tainability and environmental and social benefits
To date PFAN has raised over US $12 billion in investment for the projects in its pipeline which have led to installing and operating over 700 MW of clean energy capacity
PFAN is a multilateral public-private partnership founded by the Climate Technology Initiative (CTI) and the United Nations Framework Convention on Climate Change (UNFCCC) It has recently been relaunched under a new hosting arrangement with the United Nations Industrial Development Organization (UNIDO) and the Renewable Energy and Energy Efficiency Partnership (REEEP) Under this arrangement PFANrsquos opera-tions are set to scale by a factor of two to five by 2020
THE PRIVATE FINANCING ADVISORY NETWORK (PFAN)
wwwren21net
REN21 is the global renewable energy policy multi-stakeholder network that connects a wide range of key actors REN21rsquos goal is to facilitate knowledge exchange policy development and joint action towards a rapid global transition to renewable energy
REN21 brings together governments non-governmental or-ganizations research and academic institutions international organizations and industry to learn from one another and build on successes that advance renewable energy To assist policy decision making REN21 provides high quality information ca-talyses discussion and debate and supports the development of thematic networks
REN21 facilitates the collection of comprehensive and time-ly information on renewable energy This information reflects
diverse viewpoints from both private and public-sector actors serving to dispel myths about renewables energy and to ca-talyse policy change It does this through six product lines the Renewables Global Status Report (GSR) which is the most fre-quently referenced report on renewable energy market indus-try and policy trends Regional Reports on renewable energy developments of particular regions Renewables Interactive Map a research tool for tracking the development of renew-able energy worldwide the Global Future Reports (GFR) which illustrate the credible possibilities for the future of renewables the Renewables Academy which offers a venue to brain-storm on future-orientated policy solutions and International Renewable Energy Conferences (IRECs) a high-level political conference series
RENEWABLE ENERGY POLICY NETWORK FOR THE 21ST CENTURY (REN21)
INTERNATIONAL RENEWABLE ENERGY AGENCY (IRENA)
wwwirenaorg
The International Renewable Energy Agency (IRENA) is an intergovernmental organization that supports countries in their transition to a sustainable energy future through ac-celerated deployment of renewable energy
IRENArsquos Roadmap for a Sustainable Energy Future REmap 2030 demonstrated that doubling the share of renewable energy in the global energy mix by 2030 is both economi-cally viable and technically feasible Through its Renewable Readiness Assessments IRENA helps countries assess local conditions and prioritize actions to achieve renewable ener-gy potentials The Agencyrsquos regional initiatives such as the African Clean Energy Corridor promote the penetration of renewable electricity in national systems and renewable en-ergy cross-border trade IRENA is organizing dialogues with a broad range of stakeholders to advance specific regional concerns including efforts to strengthen renewable energy objectives in countriesrsquo NDCs
IRENA makes its data knowledge products and tools a public good so that many can benefit from the Agencyrsquos unique mandate and reach These tools include among others a Global Atlas that consolidates renewable resource potential worldwide a Project Navigator that guides the preparation of high quality project proposals and a Sus-tainable Marketplace that facilitates access to finance to scale up investments
73
DATABASE ASSESSMENT g
www4cma
The Moroccan Climate Change Competence Centre (4C Maroc) is a national capacity building platform for multiple stakeholders concerned with climate change including government entities at all levels private companies research institutions and civil society organizations 4C Maroc acts as a hub for regional climate change information
4C Maroc works to strengthen national actorsrsquo capacities in cop-ing with climate change by collecting and developing information knowledge and skills pertaining to climate change vulnerability ad-aptation mitigation and funding in Morocco It also develops tools to improve and aid decision-making regarding climate change 4C Maroc is particularly focused on creating a link between policymakers and scientists aiming to ensure that universities and research centres get necessary funding to work on topics most relevant to improving public well-being This effortrsquos goal is to enable the public sector to make the best decisions on matters relating to climate change
MOROCCAN CLIMATE CHANGE COMPETENCE CENTRE (4C MAROC)
wwwreeeporg
REEEP invests in clean energy markets to help developing coun-tries expand modern energy services improve lives and keep low-ering CO2 emissions Leveraging a strategic portfolio of high-im-pact investments REEEP generates adapts and shares knowledge to build sustainable markets for clean energy and energy efficien-cy solutions advance energy access and combat climate change in order to facilitate economic growth where it matters most
REEEP invests in small and medium-sized enterprises (SMEs) in low and middle-income countries and develops tailor- made financing mechanisms to make clean energy technology accessible and affordable to all
Market transformation is complex and multidimensional REEEP monitors evaluates and learns from its portfolio to bet-ter understand the systems we work in identify opportunities and barriers to success and lower risk for market actors The knowledge we gain is shared with government and private sec-tor stakeholders influencing policy and investment decisions
Current major projects and activities by REEEP include man-aging the Sweden-funded Beyond the Grid Fund for Zambia which is set to bring clean energy access to 1 million Zam-bians by 2021 Powering Agrifood Value Chains a portfolio of eight promising clean energy businesses in the agrifood space market-based clean energy and energy efficiency solutions for urban water infrastructure in Southern Africa and the hosting and execution of activities of the Private Fi-nancing Advisory Network PFAN (see p 72)
Founded at the 2002 World Summit on Sustainable Devel-opment in Johannesburg REEEP works in close collaboration with a range of public and private sector partners at the early stages of clean energy market development
RENEWABLE ENERGY AND ENERGY EFFICIENCY PARTNERSHIP (REEEP)
NDC PARTNERSHIP
httpwwwndcpartnershiporg
The NDC Partnership is a global coalition of countries and in-ternational institutions working together to mobilize support and achieve ambitious climate goals while enhancing sustain-able development Launched at COP22 in Marrakesh the NDC Partnership aims to enhance cooperation so that countries have access to the technical knowledge and financial support they need to achieve large-scale climate and sustainable de-velopment targets as quickly and effectively as possible and increase global ambition over time
In-Country EngagementThe Partnership engages directly with ministries and other stakeholders to assess needs and identify opportunities for collective action across sectors regions and international partners Through the Partnership members provide target-ed and coordinated assistance so that nations can effective-ly develop and implement robust climate and development plans Leveraging the skills and resources of multiple partners towards a common objective and delivering with speed is a unique value proposition that the Partnership brings
Increasing Knowledge SharingThe Partnership raises awareness of and enhances access to cli-mate support initiatives best practices analytical tools and re-sources Information to address specific implementation needs is made available through online portals as well as communities and networks that generate opportunities for knowledge sharing
GovernanceThe NDC Partnership is guided by a Steering Committee com-prised of developed and developing nations and international institutions and is facilitated by a Support Unit hosted by the World Resources Institute in Washington and Bonn The Partner-ship is co-chaired by the Governments of Germany and Morocco
74
DATABASE ASSESSMENT gC H A P T E R 5
united4efficiencyorg
The UN Environment-GEF United for Efficiency (U4E) sup-ports developing countries and emerging economies to leap-frog their markets to energy-efficient lighting appliances and equipment with the overall objective to reduce global electricity consumption and mitigate climate change High impact appliances and equipment such as lighting residen-tial refrigerators air conditioners electric motors and dis-tribution transformers will account for close to 60 percent of global electricity consumption by 2030 The rapid deploy-ment of high-energy efficient products is a crucial piece of the pathway to keep global climate change under 2degC A global transition to energy efficient lighting appliances and equipment will save more than 2500 TWh of electricity use each year reducing CO2 emissions by 125 billion tons per an-num in 2030 Further these consumers will save US $350 billion per year in reduced electricity bills
Founding partners to U4E include the United Nations Devel-opment Programme (UNDP) the International Copper Asso-ciation (ICA) the environmental and energy efficiency NGO CLASP and the Natural Resources Defense Council (NRDC) Similar to enlighten U4E also partners with private sector manufacturers including ABB Electrolux Arccedilelik BSH Haus-geraumlte GmbH MABE and Whirlpool Corporation
UNITED FOR EFFICIENCY (U4E)
SUSTAINABLE ENERGY FOR ALL (SEforALL)
UK INTERNATIONAL CLIMATE FUND
wwwseforallorg
Sustainable Energy for All (SEforALL) was launched in 2013 as an initiative of the United Nations with a focus on moving the importance of sustainable energy for all center stage Following the adoption of the SDGs SEforALL has now tran-sitioned into an international non-profit organization with a relationship agreement with the UN that serves as a plat-form supporting a global movement to support action
SEforALL empowers leaders to broker partnerships and un-lock finance to achieve universal access to sustainable ener-gy as a contribution to a cleaner just and prosperous world for all SEforALL marshals evidence benchmarks progress tells stories of success and connects stakeholders In order to take action at the scale and speed necessary SEforALLrsquos work focuses on where we can make the greatest progress in the least amount of time
httpswwwgovukgovernmentpublicationsinterna-tional-climate-fundinternational-climate-fund
In 2010 the UK established the International Climate Fund (ICF) as a cross government programme managed by BEIS DFID and DEFRA The Fund has delivered pound387 billion in Offi-cial Development Assistance between 2011 and 2016 It now has a mature portfolio of over 200 programmes with global reach working through private sector multilateral and bilat-eral channels and has committed to spending at least pound58 billion over the next five years The ICF aims to spend half of its finances on climate mitigation and half on adaptation
Up to US $90 trillion will be invested in infrastructure globally over the next 15 years in energy cities and transport Much of this will be in developing countries where the ICF will try to influence finance flows to lower carbon investments by making visible distinctive and catalytic investments that can be scaled up and replicated by others
Since 2011 the ICF has directly supported 34 million peo-ple helping them cope with the effects of climate change and improved energy access for 12 million people ICF in-vestments have also helped prevent 92 million tonnes of C02 emissions ndashand generated US $286 billion of public invest-ment and US $650 million of private investment
CONCLUSION gC H A P T E R 6
Meeting the Paris Agreementrsquos climate goals will require an immediate and worldwide shift toward decarbonizing human activities According to the IPCC global emissions will have to peak in the next few years and then rapidly decline over the following three decades approaching zero by 2050 if the world is to have a likely chance of limiting warming in line with the 15degC or 2degC goals established in the Paris Agreement The annual emissions gap however is growing and will equal 11 ndash 19 GtCO2e by 2030 unless efforts to reduce emissions dramatically ramp up Timing is crucial as the global carbon budget shrinks each year and the window of opportunity for achieving our shared climate goals narrows Emissions benchmarks that correspond with 15degC or 2degC scenarios are moving targets and if the world misses them in the short term climate trajectories would worsen and long-term goals would become more difficult to meet
Lagos Nigeria
Private companies are making solar energy accessible and affordable helping to meet the vast demand for reliable energy access across Nigeria
R Details see page 32
CONCLUSION
6
76
Renewable energy (RE) and energy efficiency (EE) initiatives are the most prominent and effective means for cutting carbon emissions while promoting sustainable economic growth As with their timing and scale the location of these efforts is crucial to achieving global climate goals Developing countries are projected to drive almost all of the worldrsquos energy demand growth this century as well as the vast majority of new buildings new modes of transportation and new industrial activity236 These countries must balance domestic development needs with global climate goals and they cannot be expected to do so without support from the rest of the world Developing countries are installing RE facilities at a record pace accounting for more than half of the nearly 140 GW of RE that came online in 2016 These nations are also developing and implementing more RE and EE policies than ever before as documented in Chapter 2 of this report
In cities and regions throughout the world governments at all jurisdictional levels are partnering with private companies to implement RE and EE programmes achieving carbon emissions reductions as well as co-benefits for their localities including enhanced environmental quality human health economic outcomes social inclusion and gender equality Section 31 of this report details six cases from various cities and regions where public-private RE and EE initiatives are proving successful These efforts are prime examples of the global movement to decouple carbon emissions from development It is challenging however for many policymakers project supporters and implementers to determine individual RE and EE projects and policiesrsquo contributions to closing the emissions gap Judging these effortsrsquo compatibility with global 15degC and 2degC scenarios is also an unchartered territory for many actors
Evaluating internationally supported RE and EE initiativesrsquo measurable emissions reductions and creating a 15degC or 2degC-compatibility framework for RE and EE sectors and projects is the focus of this report The results show that when scaled up with proposed funding figures supported RE and EE projects in developing countries could produce 14 GtCO2e in annual reductions by 2020 The compatibility framework presents a practical alternative to using counterfactual baseline scenarios to estimate an RE or EE project or sectorrsquos impacts allowing funders policymakers project implementers and other laypeople to quickly determine if a programme project or policy is 15degC or 2degC compatible and to isolate crucial determining factors of project and sector-level compatibility The compatibility analysis illustrates the need for integrated system-focused policy promoting decarbonization in every sector This means policies that link electricity generation and transmission with end-use management regulations and standards that address upstream and downstream emissions throughout supply chains and a large-scale shift of incentives away from fossil fuels and inefficient energy use towards RE sources and system-wide efficiencies
Decarbonization is occurring throughout the world as cities and other subnational jurisdictions have aligned their actions with national governments and partnered with private firms to implement innovative RE and EE programmes Public-private partnerships particularly collaborations at the subnational level are assuming an increasingly prominent role in international climate efforts and these collaborations will be a main focus at COP23 Yet these actions are not happening at the speed or scale necessary to achieve the 15degC or 2degC goals Developed countries need to transfer resources including policy and technical expertise best available technologies and financing to developing countries in order to create the enabling environments necessary for RE and EE expansion at a scale commensurate with what international climate goals demand Nations project implementers and supporting organizations must determine which policies and programmes do in fact meet the ambitious climate goals set out in the Paris Agreement while also achieving the Sustainable Development Goals (SDGs) This report provides some of the key elements that could be used to assess projects policies and initiatives according to their promotion of global climate and sustainable development objectives
Information is a key resource that is little discussed This reportrsquos 15degC or 2degC compatibility exercise finds that data transparency and information sharing are essential components of compatibility at the national sector and project levels International efforts to improve data availability need to ramp up immediately Bilateral and multilateral development organizations are among the groups best suited to catalyze these global changes This report finds that these international organizations leverage large emissions reductions for relatively small RE and EE investments These groups are shown to foster enabling environments helping to create homegrown low carbon trajectories in developing countries International development authorities now should expand their support to advance transparency and resource transfers at an ever greater scale and speed
CONCLUSION gC H A P T E R 6
77
ANNEX g
This study performed a three-step calculation to determine the GHG mitigation impact from bilateral and multilateral-supported renewable energy (RE) and energy efficiency (EE) finance in 2020
In the first step the annual emission reduction for a project number i in 2020 were calculated as follows
CO2R2020i = ESi x EFi 1where CO2R2020 i = Direct CO2 emission reduction in 2020 by project number i (tyr) ESi = Annual energy saved or substituted by project number i (MWhyr) EF i = country-specific grid electricity CO2 emission factor for project number i (tMWh)
Whenever the project capacity size was reported ESi was calculated as follows
ESi = PCi x 8760 (hoursyr) x CFi 2where PCi Capacity of project i (MW) CF i Capacity factor of project i (dimensionless)
Following this step the analysed projectsrsquo aggregate mitigation impact was scaled up to estimate the total mitigation delivered by bilateral- and multilateral-supported RE and EE projects in developing countries between 2005 and 2016 The scale-up was done by using the following equation
CO2R2020tot2005-2016 = Sj (S CO2R2020jDataset x ) 3where CO2R2020 tot2005-2016 = total mitigation in 2020 by bilateral- and multilateral-supported RE and EE projects in developing countries committed between 2005 and 2016 (MtCO2yr) CO2R2020 jDataset = CO2 emissions reduction in 2020 estimated for a project under technology category j in the dataset developed in this analysis (MtCO2yr)
FINjtot2005-2016 = total finance committed by bilateral and multilateral institutions on technology category j between 2005 and 2016 (million current USD) FINjDataset = Finance committed by a project under technology category j in the dataset developed in this
analysis (million current USD)
In the final step the analysed projectsrsquo aggregate mitigation figure was used to estimate the expected mitigation from bilateral and multilateral support that will be committed through 2020 in line with the US $100 billion global climate finance goal237
CO2R2020tot2005-2020 = Sj (S CO2R2020jDataset x ) 4where CO2Rtot2005-2020 = total mitigation in 2020 by bilateral- and multilateral-supported RE and EE projects in 2020 in developing countries committed between 2005 and 2020 (MtCO2yr)
FINjtot2015-2020 = total finance expected to be committed by bilateral and multilateral institutions on technology category j between 2015 and 2020 (million current USD)
Further details about these steps are given in the following sections CO2 emissions generated through the construction of RE facilities are excluded as these are generally less than emissions from fossil fuel power plant construction
FINjtot2005-2016
SFINjDataset
FINjtot2005-2016 + FINjtot2015-2020
SFINjDataset
ANNEX I DETAILED DESCRIPTION OF MITIGATION IMPACT CALCULATIONS
78
11 TECHNOLOGY CATEGORIZATION (J)Technologies were categorised into the following (Table 1 Categorization of renewable energy technologies) solar photovoltaic (PV) solar thermal wind (including onshore and offshore) hydro (including large medium and small) biomasswaste and geothermal The presented categorization makes it possible to develop country- technology-specific capacity factors in a consistent manner using datasets from different sources
Projects were categorized through a word search from project descriptions For projects reporting the implementation of more than one technology the category ldquomultiple renewable technologiesrdquo was used
A N N E X
12 TOTAL ANNUAL ENERGY SAVED OR SUBSTITUTED (ES)Total annual power generation by RE projects are in most cases calculated by using the power generation capacity and the technology- and country-specific capacity factors Total annual power generation values reported by supporting institutions were used only when capacity values were not available Whereas the first method included the use of the capacity factor the grid electricity CO2 emission factor and the reported project capacity the second included only the grid electricity CO2 emission factor and the reported project power
For EE projects the amount of energy saved annually reported in the project documentation was used for the calculations
Category used in this study IRENA category OECD DAC category
Solar photovoltaic Solar PhotovoltaicSolar energy
Solar thermal Concentrated Solar Power
Geothermal energy Geothermal Energy Geothermal energy
Hydropower (excluding large and medium over 50 MW capacities)
Large Hydropower
Hydro-electric power plantsMedium Hydropower
Small Hydropower
WindOffshore Wind
Wind energyOnshore Wind
Bioenergywaste
Biogas
Biofuel-fired power plantsLiquid Biofuels
Solid Biomass
Multiple renewable technologies Energy generation renewable sources ndash multiple technologies
(Not considered)Marine
Marine energyPumped storage and mixed plants
Table 1 Categorisation of renewable energy technologies
79
ANNEX g
13 CAPACITY FACTORS (CF)For efficient fossil fuel-fired power plant projects uniform capacity factor of 80 was assumed For other EE projects capacity factor values were not used for calculations because the energy consumption reduction values were taken directly from the project documentation For RE projects average capacity factors were calculated for the period 2010-2014 for individual RE technologies per country except for Concentrated Solar Power (CSP) using the installed capacity and power generation
datasets from the IRENA database238 For CSP a projected value for 2020 (33) was used drawn from the IEA Energy Technology Perspectives 2016 report239 In the absence of country-specific capacity factor data the average of all countries with values was used as a proxy For any project with multiple renewable technologies the capacity factor was defined as the mean of the capacity factor values of RE technologies involved in that particular project
14 GRID ELECTRICITY CO2 EMISSION FACTORS (EF) Grid electricity CO2 emission factors (tCO2MWh) were obtained from the Clean Development Mechanism (CDM) grid emission factors database (version 13 January 2017) published by the Institute for Global Environmental Strategies (IGES)240 Among three different emission factors the combined margin emission factors were used for both RE and EE projects Because the database only covers countries with CDM projects regional average values were used for other countries The countries that are not covered by the IGES database (by region) are
g Asia Cook Islands Kiribati Maldives Marshall Islands Myanmar Nepal Palau Reunion Samoa Solomon Islands Timor Leste Tonga and Vanuatu
g Latin America Antigua and Barbuda Barbados Dominica Guadeloupe Haiti St Lucia St Vincent and Grenadines and Suriname
g Africa Algeria Benin Botswana Burundi Cabo Verde Cameroon Chad Congo Congo DR Djibouti Equatorial Guinea Ethiopia Gambia Guinea Guinea-Bissau Liberia Lesotho Malawi Mauritania Mozambique Niger Seychelles Togo and Zimbabwe
g Middle East Iraq and Yemen
g Others Afghanistan Belarus Kazakhstan Kyrgyzstan Moldova Tajikistan Turkey
For biomass-fired power plants an attempt was made to make simplified yet robust estimates on GHG emissions resulting from bioenergy production but it was not possible due to the lack of data that can be applied to the specific set-up of each bioenergy project analysed in this study
Table 2 Country-specific average capacity factors by renewable technology
Country Solar Wind Hydro Bioenergy waste Geothermal
Range for the countries in which projects were implemented
5-20 10-36 10-84 NA 42-84
Simple average across all countries in the IRENA database
15 22 42 40 63
Average values are used as proxies
Source Calculations based on IRENA (2016)
80
15 CALCULATED MITIGATION IMPACTS FOR THE PROJECT DATASET ASSESSED IN THIS REPORTTable 3 presents total CO2 emission reductions expected in 2020 from 273 RE and EE projects per area and technology analysed in this study
16 SCALED UP MITIGATION IMPACTS USING DEVELOPMENT FINANCE COMMITMENTSTo quantify the total mitigation impact in year 2020 delivered by bilateral- and multilateral-supported RE projects implemented from 2005 - 2015 the aggregated mitigation impact for 2020 calculated for the 273 projects was scaled up using the total finance committed (in million current US dollars) in approximately the same period Data on financial commitments to renewable technology projects were obtained from the OECD Development Assistance Committee (DAC) database241 for the years 2005 to 2015 (Table 4 Total amount of development finance committed to RE projects by all supporting partners between 2005 and 2015 (million current US dollars) Note data for 2016 is not yet available at the time of writing
The OECD DAC database does not provide finance figures for energy efficiency projects Therefore an assumption was made on the ratio between of finance for RE and EE projects the ratio for 2014 estimated by Climate Policy Initiative (CPI) in 2015242 243 was also assumed for the period 2005ndash2020
Mitigation impacts were scaled up for each RE category Shown in Table 4 the data comprised all renewable technologies and a category was added for projects with multiple RE technologies For the scaling up calculations finance data categorized as ldquomultiple RE technologiesrdquo was proportionally distributed to individual renewable energy categories while finance and carbon mitigation data categorized as ldquoREEErdquo was divided equally among the two categories The results were summed to achieve a total renewable funding per technology Solar PV and solar thermal projects are scaled up collectively as ldquosolar energyrdquo projects The results are shown in Table 5
It should be noted that the estimated CO2 emissions reductions from bioenergy projects which are uncertain due to the lack of information on land-use related emissions accounted for less than 1 of total emissions reductions from all RE projects Therefore the exclusion of indirect emissions related to biomass production is unlikely to affect our overall results
A N N E X
Table 3 CO2 emission reductions expected in 2020 from 224 RE and EE projects analysed in this study
Areatechnology Number of projectsAnnual emissions
reduction (MtCO2yr)Finance committed
(million current USD)
RE 197 849 20142
Solar Thermal 11 22 1948
Geothermal 17 149 6066
Hydro 29 25 1567
Solar PV 39 367 2719
Wind 44 154 4281
Biomasswaste 19 02 324
Multiple RE 38 131 3237
REEE 14 592 926
EE 62 1138 10831
81
Several assumptions were made to estimate the expected total mitigation impact from finance commitments made between 2005 and 2020 First it was assumed that the global finance target of US $100 billion in 2020 will be achieved Second half of this US $100 billion was assumed to address mitigation and half
of that figure was assumed to be public finance This means that the public finance for RE and EE projects would comprise 25 of the US $100 billion Third the US $25 billion was assumed to be distributed to RE and EE at the same 2014 ratio as reported by CPI
ANNEX g
Table 4 Total amount of development finance committed to RE projects by all supporting partners between 2005 and 2015 (million current US dollars)
Sector 2005 2006 2007 2008 2009 2010 2011 2012 2013 2014 2015 Total
Energy generation renewable sources ndash multiple technologies
347 274 363 734 1172 1799 2561 1763 2030 2447 1742 15233
Hydro-electric power plants
480 720 1181 442 208 716 586 997 1387 1285 806 8808
Solar energy 64 53 25 155 328 243 103 621 971 1661 718 4942
Wind energy 126 93 147 322 219 990 78 140 92 488 82 2776
Marine energy 04 00 01 01 00 05 01 01 1
Geothermal energy
225 10 8 3 43 673 397 48 290 606 372 2676
Biofuel-fired power plants
15 20 35 105 132 53 26 43 117 83 71 701
Total 1258 1171 1760 1761 2102 4474 3751 3612 4886 6571 3791 35137
Note data for 2016 is not yet available at the time of writing
Table 5 Estimated total mitigation impact in 2020 from RE and EE projects financed by bilateral and multilateral institutions between 2005 and 2015
OECD categoryTotal finance 2005-2015
(billion current USD)
Expected total emissions reduction in 2020 resulting from finance
2005 ndash 2016 (MtCO2eyr)
RE and REEE total 494 322
Biofuel-fired power plants 167 605
Solar energy 116 1025
Geothermal energy 549 166
Hydro-electric power plants 246 1711
Wind energy 607 265
EE total 262 332
Includes energy projects from waste
82
REFERENCES
R E F E R E N C E S
1 US Energy Information Administration (EIA) (2016) International Energy Outlook 2016 Washington DC Available httpswwweiagovoutlooksieo
2 International Energy Agency (IEA) (2016) World Energy Outlook Paris France Available wwwworldenergyoutlookorg
3 Mission2020 2020 The Climate Turning Point Available httpwwwmission2020global202020The20Climate20Turning20Pointpdf
4 UN Environment Programme (UNEP) (2017) The 2017 Emissions Gap Report Available httpwwwuneporgemissionsgap
5 Frankfurt School-UNEP CentreBloomberg New Energy Finance (2017) Global Trends in Renewable Energy Investment 2017 httpwwwfs-unep-centreorg (Frankfurt am Main) Available httpfs-unep-centreorgsitesdefaultfilespublicationsglobaltrendsinrenewableenergyinvestment2017pdf REN-21 (2017) 2017 Global Status Report Available httpwwwren21netwp-contentuploads20170617-8399_GSR_2017_Full_Report_0621_Optpdf
6 IPCC 2014 Climate Change 2014 Synthesis Report Contribution of Working Groups I II and III to the Fifth Assessment Report of the Intergovernmental Panel on Climate Change [Core Writing Team RK Pachauri and LA Meyer (eds)] IPCC Geneva Switzerland 151 pp
7 UNEP (2016) The Emissions Gap Report 2016 United Nations Environment Programme (UNEP) Nairobi
8 Pauw WP Cassanmagnano D Mbeva K Hein J Guarin A Brandi C Dzebo A Canales N Adams KM Atteridge A Bock T Helms J Zalewski A Frommeacute E Lindener A Muhammad D (2016) NDC Explorer German Development Institute Deutsches Institut fuumlr Entwicklungspolitik (DIE) African Centre for Technology Studies (ACTS) Stockholm Environment Institute (SEI) DOI 1023661ndc_explorer_2017_20
9 Ibid
10 REN21 Renewable Energy Policy Database
11 Renewable Energy Policy Network for the 21st Century (REN21) (2017) Renewables 2017 Global Status Report Retrieved from wwwren21netgsr
12 Renewable Energy Policy Network for the 21st Century (REN21) (2017) Renewables 2017 Global Status Report Retrieved from wwwren21netgsr
13 NDCs submitted as of late March 2017
14 Renewable Energy Policy Network for the 21st Century (REN21) (2017) Renewables 2017 Global Status Report Retrieved from wwwren21netgsr UNFCCC NDC Registry (Interim) httpwww4unfcccintndcregistryPagesHomeaspx
15 REN21 Renewable Energy Policy Database
16 REN21 (2017) 1Gigaton Coalition Survey
17 REN21 Renewable Energy Policy Database
18 REN21 Renewable Energy Policy Database
19 ldquoThe Government of India launches an ambitious rooftop solar subsidy schemerdquo Bridge to India 4 January 2016 httpwwwbridgetoindiacomblogthe-government-of-india-launches-an-ambitious-rooftop-solarsubsidyscheme
20 Roger Sallent Inter-American Development Bank (IDB) personal communication with REN21 2 December 2016
21 Thermal power plants include gas coal oil biomass and multi-fuel (eg gasoil coalbiomass) PBL Netherlands Environmental Assessment Agency and European Commission (EC) Joint Research Centre (2016) Trends in Global CO2 Emissions 2016 Report (The Hague) Available from httpwwwpblnlenpublicationstrends-in-global-co2-emissions-2016-report
22 REN21 Renewable Energy Policy Database
23 IEA (2016) Medium-Term Renewable Energy Market Report 2016 Paris IEA Avilable httpswwwieaorgnewsroomnews2016octobermedium-term-renewable-energy-market-report-2016html
24 IEA IEA Building Energy Efficiency Policies Database Available wwwieaorgbeep (accessed 22 November 2016)
25 Eight countries plus EU as of 2014 per International Council on Clean Transportation (2014) Global Passenger Vehicle Standards Available wwwtheicctorginfo-toolsglobal-passenger-vehicle-standards
26 REN21 Renewable Energy Policy Database
27 Council of European Municipalities and Regions (CEMR) European section of United Cities and Local Governments (12 May 2015) 1000 Mayors worldwide lead the fight against climate change Available httpwwwccreorgenactualitesview3177
28 Organization of Economic Development (OECD) Cities and climate change (Paris 2010)
29 Houmlhne N Drost P et al ldquoChapter Four Bridging the gap - the role of non-state actionrdquo The Emissions Gap Report 2016 (Paris United Nations Environment Programme (UNEP) 2016)
30 International Energy Agency (IEA) Energy Technology Perspectives 2016 Towards Sustainable Urban Energy Systems (Paris 2016) Available from httpswwwieaorgpublicationsfreepublicationspublicationEnergyTechnologyPerspectives2016_ExecutiveSummary_EnglishVersionpdf
31 Ibid
32 Ibid
33 Ibid
34 N Dubash D Raghunandan Girish Sant and Ashok Sreenivas ldquoIndian climate change policy exploring a cobenefits based approachrdquo Economics Politics Weekly vol 22 No 22 (2013)
35 A Gouldson N Kerr F McAnulla S Hall S Colenbrander A Sudmant J Roy S Sarkar D Chakravarty and D Ganguly ldquoThe economics of low carbon citiesrdquo Kolkata Centre for Low Carbon Futures (Leeds 2014)
36 S Akbar G Kleiman S Menon L Segafredo Climate-smart development adding up the benefits of actions that help build prosperity end poverty and combat climate change (The ClimateWorks Foundation and the World Bank 2014) Available from httpdocumentsworldbankorgcurateden794281468155721244Main-report
37 D Millstein R Wiser M Bolinger and G Barbose ldquoThe climate and air-quality benefits of wind and solar power in the United Statesrdquo Nature Energy vol 6 (2014) p17134
38 Jan Beermann Appukuttan Damodaran Kirsten Joumlrgensen and Miranda A Schreurs ldquoClimate action in Indian cities an emerging new research areardquo Journal of Integrative Environmental Sciences 13 no 1 (2016) p 55-66
39 S Akbar G Kleiman S Menon L Segafredo L Climate-smart development adding up the benefits of actions that help build prosperity end poverty and combat climate change (The ClimateWorks Foundation and the World Bank 2014) Available from httpdocumentsworldbankorgcurateden794281468155721244Main-report
40 Thomas Day Niklas Houmlhne and Sofia Gonzales Assessing the missed benefits of countriesrsquo national contributions Quantifying potential co-benefits (Bonn NewClimate Institute 2015) Available from httpsnewclimateinstitutefileswordpresscom201510cobenefits-of-indcs-october-2015pdf
41 Ibid
42 New Climate Economy (NCE) Seizing the Global Opportunity Partnerships for Better Growth and a Better Climate (2015) Available from httpnewclimateeconomyreport2015wp-contentuploadssites3201408NCE-2015_Seizing-the-Global-Opportunity_webpdf
43 Ibid
44 A Dasgupta ldquoIndia can save up to 18 trillion per year with smart ubran growthrdquo World Resources Institute (WRI) 2 Decmeber 2016 Available from httpthecityfixcomblogindia-can-save-up-to-1-8-trillion-per-year-with-smart-urban-growth-ani-dasgupta
45 New Climate Economy (NCE) Seizing the Global Opportunity Partnerships for Better Growth and a Better Climate (2015) Available from httpnewclimateeconomyreport2015wp-contentuploadssites3201408NCE-2015_Seizing-the-Global-Opportunity_webpdf
46 C40 Cities Climate Leadership Group and Arup Potential for Climate Action Cities are Just Getting Started (2015) Available from httpsissuucomc40citiesdocsc40_citypotential_2015
47 New Climate Economy (NCE) Seizing the Global Opportunity Partnerships for Better Growth and a Better Climate (2015) Available from httpnewclimateeconomyreport2015wp-contentuploadssites3201408NCE-2015_Seizing-the-Global-Opportunity_webpdf
48 International Energy Agency (IEA)Energy Efficiency Market Report 2016 (Paris 2016) Available from httpswwwieaorgeemr16filesmedium-term-energy-efficiency-2016_WEBPDF
49 International Renewable Energy Agency (IRENA) Renewable Energy Jobs Annual Review (Abu Dhabi 2017) Available from httpswwwirenaorgDocumentDownloadsPublicationsIRENA_RE_Jobs_Annual_Review_2017pdf
50 C40 Cities Climate Leadership Group Unlocking Climate Action in Megacities (New York 2015) Available from httpwwwc40orgresearchesunlocking-climate-action-in-megacities
51 Ibid
52 V Castaacuten Broto and H Bulkeley H ldquoA survey of urban climate change experiments in 100 citiesrdquo Global Environmental Change vol 23 No 1(2013) p 92ndash102
53 New Climate Economy (NCE) Seizing the Global Opportunity Partnerships for Better Growth and a Better Climate (2015) Available from httpnewclimateeconomyreport2015wp-contentuploadssites3201408NCE-2015_Seizing-the-Global-Opportunity_webpdf
83
REFERENCES g
54 A Masseen and B Lefevre ldquo4 Keys to Unlock Innovative Urban Services for Allrdquo (16 February 2016) Available from httpthecityfixcomblog4-keys-unlock-innovative-urban-service-for-all-anne-maassen-benoit-lefevre
55 Ibid
56 Global Cities Business Alliance ldquoHow cities and business can work together for growthrdquo (2016) Available from httpswwwbusinessincitiescompublicationhow-cities-and-business-can-work-together-for-growth
57 Narela waste plant opened to generate 24 MW power (11 March 2017) The Times of India Available httptimesofindiaindiatimescomcitydelhinarela-waste-plant-opened-to-generate-24mwpowerarticleshow57583891cms
58 C40 Cities Climate Leadership Group (15 November 2016) Cities100 Delhi ndash Turning Waste into Energy and Better Livelihoods Available from httpwwwc40orgcase_studiescities100-delhi-turning-waste-into-energy-and-better-livelihoods
59 Ibid
60 C40 Cities Climate Leadership Group (15 February 2016) C40 Good Practice Guides Delhi - Energy recovery Available httpwwwc40orgcase_studiesc40-good-practice-guides-delhi-energy-recovery
61 Infrastructure Leasing amp Financial Services Limited (IL amp FS) Waste to Energy Plant Ghazipur Available from httpswwwilfsindiacomour-workenvironmentwaste-to-energy-plant-ghazipur (accessed August 2017)
62 C40 Cities Climate Leadership Group (15 November 2016) Cities 100 Delhi - Turning Waste into Energy and Better Livelihoods Available httpwwwc40orgcase_studiescities100-delhi-turning-waste-into-energy-and-better-livelihoods
63 Infrastructure Leasing amp Financial Services Limited (IL amp FS) Our Work Environment Available httpswwwilfsindiacomour-workenvironment (accessed August 2017)
64 Ibid
65 C40 Cities Climate Leadership Group (15 February 2016) C40 Good Practice Guides Delhi - Energy recovery Available httpwwwc40orgcase_studiesc40-good-practice-guides-delhi-energy-recovery
66 C40 Cities Climate Leadership Group (15 November 2016) Cities 100 Delhi - Turning Waste into Energy and Better Livelihoods Available httpwwwc40orgcase_studiescities100-delhi-turning-waste-into-energy-and-better-livelihoods
67 C40 Cities Climate Leadership Group (15 February 2016) C40 Good Practice Guides Delhi - Energy recovery Available httpwwwc40orgcase_studiesc40-good-practice-guides-delhi-energy-recovery
68 Infrastructure Leasing amp Financial Services Limited (IL amp FS) Waste to Energy Plant Ghazipur Available httpswwwilfsindiacomour-workenvironmentwaste-to-energy-plant-ghazipur (accessed August 2017)
69 C40 Cities Climate Leadership Group (15 February 2016) C40 Good Practice Guides Delhi - Energy recovery Available httpwwwc40orgcase_studiesc40-good-practice-guides-delhi-energy-recovery
70 Ghazipur landfill solution soon trial run of waste-to-energy plant to begin (28 February 2015) Deccan Herald Available httpwwwdeccanheraldcomcontent462504ghazipur-landfill-solution-soon-trialhtml
71 Infrastructure Leasing amp Financial Services Limited (IL amp FS) Integrated Solid Waste Management Available from httpilfsenvcomBrochuresIntegrated-Solid-Waste-Managementpdf (accessed August 2017)
72 C40 Cities Climate Leadership Group (15 November 2016) Cities 100 Delhi - Turning Waste into Energy and Better Livelihoods Available httpwwwc40orgcase_studiescities100-delhi-turning-waste-into-energy-and-better-livelihoods
73 Pande A (1 June 2015) As New Delhi Plant Gears Up to Turn Rubbish into Energy Community Organizer is Turning Ragpickers into Artisans Global Press Journal Available httpsglobalpressjournalcomasiaindiaas-new-delhi-plant-gears-up-to-turn-rubbish-into-energy-community-organizer-is-turning-ragpickers-into-artisans
74 C40 Cities Climate Leadership Group (15 February 2016) C40 Good Practice Guides Delhi - Energy recovery Available httpwwwc40orgcase_studiesc40-good-practice-guides-delhi-energy-recovery
75 Pande A (1 June 2015) As New Delhi Plant Gears Up to Turn Rubbish into Energy Community Organizer is Turning Ragpickers into Artisans Global Press Journal Available httpsglobalpressjournalcomasiaindiaas-new-delhi-plant-gears-up-to-turn-rubbish-into-energy-community-organizer-is-turning-ragpickers-into-artisans
76 Ibid
77 Cut from a different cloth (14 September 2014) The Economist Available httpswwweconomistcomnewsbusiness21586328-building-business-around-solving-chronic-female-health-care-problem-cut-different
78 Tiwari P (July 2016) How Ghazipur wastepickers became flower artists shareholders Kenfolios Available from httpswwwkenfolioscomgulmeher
79 Cut from a different cloth (14 September 2014) The Economist Available httpswwweconomistcomnewsbusiness21586328-building-business-around-solving-chronic-female-health-care-problem-cut-different
80 Pande A (1 June 2015) As New Delhi Plant Gears Up to Turn Rubbish into Energy Community Organizer is Turning Ragpickers into Artisans Global Press Journal Available httpsglobalpressjournalcomasiaindiaas-new-delhi-plant-gears-up-to-turn-rubbish-into-energy-community-organizer-is-turning-ragpickers-into-artisans
81 Ibid
82 Chaudhary R and Verick S (2014) Female labour force participation in India and beyond International Labor Organization Available from httpwwwiloorgnewdelhiwhatwedopublicationsWCMS_324621lang--enindexhtm
83 C40 Cities Climate Leadership Group (15 November 2016) Cities 100 Delhi - Turning Waste into Energy and Better Livelihoods Available httpwwwc40orgcase_studiescities100-delhi-turning-waste-into-energy-and-better-livelihoods
84 C40 Cities Climate Leadership Group (15 February 2016) C40 Good Practice Guides Delhi - Energy recovery Available httpwwwc40orgcase_studiesc40-good-practice-guides-delhi-energy-recovery
85 Indiarsquos largest waste-to-energy plant to be launched at Narela-Bawana in March (18 February 2017) The Economic Times Available httpenergyeconomictimesindiatimescomnewspowerindias-largest-waste-to-energy-plant-to-be-launched-at-narela-bawana-in-march57217386
86 C40 Cities Climate Leadership Group Good Practice Guide Creditworthiness Available httpwwwc40orgnetworkscreditworthiness (accessed August 2017)
87 Kampala Capital City Authority Kampala Climate Change Action Available httpswwwkccagougClimate20Change (accessed July 2017)
88 Kampala Capital City Authority Kampala City Climate Action Plan Video Available httpsyoutubeatdi3DRZRAc
89 Kampala Capital City Authority (2015) Kampala Climate Change Action Energy and Climate Profile Available httpswwwkccagouguDocsEnergy20and20Climate20Profilepdf
90 Kampala Capital City Authority(2016) Kampala Climate Change Action Strategy Available httpwwwkccagouguDocsKampala20Climate20Change20Actionpdf
91 Interview with Kampala Capital City Authority staff members 3 August 2017
92 Kampala Capital City Authority(2016) Kampala Climate Change Action Strategy Available httpwwwkccagouguDocsKampala20Climate20Change20Actionpdf
93 Kampala Capital City Authority Kampala Climate Change Action Available from httpswwwkccagougClimate20Change (accessed July 2017)
94 Interview with Kampala Capital City Authority staff members 3 August 2017
95 Kampala Capital City Authority Expertise France and SIMOSHI (2017) Institutional Improved Cook Stoves in 15 KCCA Schools pilot Project supported by Expertise France
96 Ibid
97 SIMOSHI Ltd Projects Available httpwwwsimoshiorgprojects (accessed September 2017)
98 Fallon A (10 June 2016) Kampala aims to lead African cities in fight against climate change Citiscope Available httpcitiscopeorgstory2016kampala-aims-lead-african-cities-fight-against-climate-change
99 Ibid
100 Kampala Capital City Authority Kampala Climate Change Action Energy and Climate Profile Available httpswwwkccagouguDocsEnergy20and20Climate20Profilepdf
101 Fallon A (10 June 2016) Kampala aims to lead African cities in fight against climate change Citiscope Available httpcitiscopeorgstory2016kampala-aims-lead-african-cities-fight-against-climate-change
102 Global Alliance for Clean Cookstoves (6 April 2016) Alliance Launches lsquoFumbaliversquo Cookstoves Campaign in Uganda Available httpcleancookstovesorgaboutnews04-06-2016-alliance-launches-fumbalive-cookstovescampaign-in-ugandahtml
103 Kampala Capital City Authority Kampala Climate Change Action Energy and Climate Profile Available httpswwwkccagouguDocsEnergy20and20Climate20Profilepdf
104 Kampala Capital City Authority Kampala Climate Change Action Energy and Climate Profile Available httpswwwkccagouguDocsEnergy20and20Climate20Profilepdf
105 Awamu biomass energy Available httpawamuug (accessed July 2017)
106 Climate and Development Knowledge Network (CDKN) Economic assessment of the impacts of climate change in Uganda ndash National Level Assessment Accessed via Kampala Capital City Authority Kampala Climate Change Action Energy and Climate Profile Available httpswwwkccagouguDocsEnergy20and20Climate20Profilepdf
107 Kampala Capital City Authority Kampala Climate Change Action Energy and Climate Profile Available httpswwwkccagouguDocsEnergy20and20Climate20Profilepdf
108 Ibid
109 C40 Cities Climate Leadership Group Good Practice Guide Creditworthiness Available httpwwwc40orgnetworkscreditworthiness (accessed August 2017)
84
R E F E R E N C E S
110 C40 Cities Climate Leadership Group Case Study Cities100 Nanjing ndash Worldrsquos Fastest Electric Vehicle Rollout Available httpwwwc40orgcase_studiescities100-nanjing-world-s-fastest-electric-vehicle-rollout (accessed August 2017)
111 Ibid
112 Ibid
113 Nanjing Think-tank Alliance (2015) Develop Low Carbon Industries to Promote Building Nanjing as a Low-Carbon Ecological City Available httpwwwnjzxgovcnzxzz_2016jy_2016201610P020161014417408026102pdf
114 Ibid
115 Nanjing Municipal Peoplersquos Government (2016) 2016 New Energy Automobile Promotion and Application Plan of Nanjing Available httpwwwnanjinggovcnxxgkszf201607t20160712_4023115html
116 Up to 80 of Public Buses in Nanjing Could Be Renewable-Powered This Year (15 April 2017) Yangtse Evening Post Available httppicyangtsecomepaperyaowen2017-04-151236337html
117 Ibid
118 Peoplersquos Republic of China Central Government (2013) Notice of the Ministry of Transport on Issuing Accelerating Development of Green Circular Low-Carbon Transportation Available from httpwwwgovcngongbaocontent2013content_2466586htm
119 Ministry of Transport and Jiangsu Province Sign Framework Agreement on Developing Green Circular and Low-Carbon Transportation (10 June 2013) Idea Carbon Available httpwwwideacarbonorgarchives15745
120 Jiangsu Provincial Government Information Hub Notice of the General Office of Jiangsu Provincial Peoplersquos Government on Issuing Green Circular and Low-Carbon Transportation Development Plan of Jiangsu Province (2013-2020) Available httpwwwjsgovcnjsgovtjbgt201408t20140804452293html
121 C40 Cities Climate Leadership Group Case Study Cities100 Nanjing - Worldrsquos Fastest Electric Vehicle Rollout Available httpwwwc40orgcase_studiescities100-nanjing-world-s-fastest-electric-vehicle-rollout (accessed August 2017)
122 China EV Startup Future Mobility to Build $17 Billion Factory (19 January 2017) Bloomberg News Available httpswwwbloombergcomnewsarticles2017-01-19china-ev-startup-future-mobility-to-build-1-7-billion-factory
123 Gofun launches in Nanjing Ease of Parking for Renewable-Powered Cars (28 March 2017) Electrical Vehicle Resources Available httpwwwevpartnercomnews64detail-26143html
124 Nanjing and Changzhou Approved as National Low-Carbon Pilot Cities (18 February 2017) Xinhua Yangtze River Delta News Available httpcsjxinhuanetcom2017-0218c_136066174htm
125 Jia Y and Yuan J (2017) Nanjingrsquos complete industry chain EV operating alliance How to survive in the face of reduced policy subsidies The Paper Available from httpwwwthepapercnnewsDetail_forward_1776716
126 United States Environmental Protection Agency What are the harmful effects of SO2 Available httpswwwepagovso2-pollutionsulfur-dioxide-basicseffects (accessed September 2017)
127 Vaacutesquez P Restrepo-Tarquino I Acuntildea J and Vaacutesquez S (2017) Women Fostering Energy Efficiency Through Cleaner Production GEADES-UAO Univalle and El Castillo
128 Ibid
129 Ibid
130 Ibid
131 Markham D (19 October 2015) How long will solar panels last CleanTechnica Available httpscleantechnicacom20151019how-long-will-solar-panels-last
132 United Nations Framework Convention on Climate Change (UNFCCC) Momentum for Change Fostering Cleaner Production Available httpunfcccintsecretariatmomentum_for_changeitems9258php (accessed July 2017)
133 Ibid
134 Vaacutesquez P Restrepo-Tarquino I Acuntildea J and Vaacutesquez S (2017) Women Fostering Energy Efficiency Through Cleaner Production GEADES-UAO Univalle and El Castillo
135 Vaacutesquez P and Restrepo I (2016) Women learning alliances for greening manufacturing industries in developing countries From the 2016 International Conference on Sustainable Development (ICSD) September 21 and 22 2016 Columbia University New York New York Available httpic-sdorg20170203proceedings-from-icsd-2016
136 Vaacutesquez P Restrepo-Tarquino I Acuntildea J and Vaacutesquez S (2017) Women Fostering Energy Efficiency Through Cleaner Production GEADES-UAO Univalle and El Castillo
137 Vaacutesquez P and Restrepo I (2016) Women learning alliances for greening manufacturing industries in developing countries From the 2016 International Conference on Sustainable Development (ICSD) September 21 and 22 2016 Columbia University New York New York Available httpic-sdorg20170203proceedings-from-icsd-2016
138 United Nations Framework Convention on Climate Change (UNFCCC) Momentum for Change Fostering Cleaner Production Available httpunfcccintsecretariatmomentum_for_changeitems9258php (accessed July 2017)
139 Vaacutesquez P and Restrepo I (2016) Women learning alliances for greening manufacturing industries in developing countries From the 2016 International Conference on Sustainable Development (ICSD) September 21 and 22 2016 Columbia University New York New York Available httpic-sdorg20170203proceedings-from-icsd-2016
140 City of Mexico (2012) Programa de Certificacioacuten de Edificaciones Sustentables Ministry of the Environment Available httpmarthaorgmxuna-politica-con-causawp-contentuploads20130915-Certificacion-Ed ificaciones-Sustentablespdf
141 Trencher G Takagi T Nishida Y Downy F (2017) Urban Efficiency II Seven Innovative City Programmes for Existing Building Energy Efficiency Tokyo Metropolitan Government Bureau of Environment and C40 Cities Climate Leadership
142 Tanya Muumlller Garciacutea Secretary of the Environment Mexico City email correspondence 14 September 2017
143 Ibid
144 Ibid
145 Interview with Tanya Muumlller Garciacutea Secretary of the Environment Mexico City 29 August 2017
146 Trencher G Takagi T Nishida Y Downy F (2017) Urban Efficiency II Seven Innovative City Programmes for Existing Building Energy Efficiency Tokyo Metropolitan Government Bureau of Environment C40 Cities Climate Leadership
147 Interview with Tanya Muumlller Garciacutea Secretary of the Environment Mexico City 29 August 2017
148 Trencher G Takagi T Nishida Y Downy F (2017) Urban Efficiency II Seven Innovative City Programmes for Existing Building Energy Efficiency Tokyo Metropolitan Government Bureau of Environment C40 Cities Climate Leadership
149 Cuidad de Meacutexico Secretariacutea de Medio Ambiente Transition and energy efficiency priority themes for the CDMX are presented in New York Available httpwwwsedemacdmxgobmxcomunicacionnotatransicion-y-eficiencia-energetica-temas-prioritarios-para-la-cdmx-son-presentados-en-nueva-york
150 Mexico City (2016) Mexico Cityrsquos Climate Action Program 2014-2020 Progress Report 2016 Available httpwwwdatasedemacdmxgobmxcambioclimaticocdmximagesbiblioteca_ccPACCM-inglespdf
151 Jones S (24 April 2014) Can Mexico Cityrsquos roof gardens help the metropolis shrug off its smog The Guardian Available httpswwwtheguardiancomglobal-development2014apr24mexico-city-roof-gardens-pollution-smog
152 World Resources Institute (2016) Mexico City Prioritizes Building Efficiency with New Regulations httpwwwwrirosscitiesorgnewsmexico-city-prioritizes-building-efficiency-new-regulations
153 New partnership targets energy consumption in buildings to reduce emissions in Mexico City (1 April 2015) World Resources Institute Available httpwwwwrirosscitiesorgnewsnew-partnership-targets-energy-consumption-buildings-reduce-emissions-mexico-city
154 Bagu T et al (2016) Market Study Captive Power in Nigeria (A Comprehensive Guide to Project Development) Africa-EU Energy Partnership amp Africa-EU Renewable Energy Cooperation Program Available httpreancomngimgmarket_study_captive_power_nigeria_0pdf
155 Kazeem Y (21 December 2015) A floating school in Lagos has helped bring solar power to one of the cityrsquos oldest slums Quartz Media Available httpsqzcom578843a-floating-school-in-lagos-has-helped-bring-solar-power-to-one-of-the-citys-oldest-slums
156 Nigeriarsquos Solar Stylists (3 March 2017) DW News Available httpwwwdwcomennigerias-solar-stylistsa-38210081
157 Eitan Hochster Director of Business Development Lumos Global email 17 September 2017
158 Shalev A (9 February 2017) Solar Power Taking Hold in Nigeria One Mobile Phone at a Time Inside Climate News Available httpsinsideclimatenewsorgnews07022017solar-energy-nigeria-africa-renewable-energy-climate-change-lumos
159 Ibid
160 Interview with Eitan Hochster Director of Busines Development Lumos Global 30 August 2017
161 Rotshuizen S (28 July 2017) From the Practitioner Hub Interview with Ron Margalit from solar home system provider Lumos Inclusive Business Accelerator Available httpsibaventures20170728from-the-practitionerhub-interview-with-ron-margalit-from-solar-home-system-provider-lumos
162 Kazeem Y (8 October 2015) Nigerian mobile money leader Paga is doubling down on building a payments giant Quartz Available from httpsqzcom520115nigerian-mobile-money-leader-paga-is-doubling-down-on-building-a-payments-giant
163 Interview with Eitan Hochster Director of Busines Development Lumos Global 30 August 2017
164 Brent W (4 August 2016) In conversation with Leigh Vial Power for All Available httpwwwsolar-ngcom20160804vial-nigerias-solar-revolution-has-begun
165 Ibid
85
REFERENCES g
166 Agomuo Z (24 October 2014) Consumers get succour from renewable energy as power supply challenges persist Business Day Available httpswwwbusinessdayonlinecomconsumers-get-succour-from-renewal-energy-as-power-supply-challenges-persist
167 Interview with Eitan Hochster Director of Busines Development Lumos Global 30 August 2017
168 Shalev A (9 February 2017) Solar Power Taking Hold in Nigeria One Mobile Phone at a Time Inside Climate News Available httpsinsideclimatenewsorgnews07022017solar-energy-nigeria-africa-renewable-energy-climate-change-lumos
169 Africa Progress Panel (2015) Power People Planet Africa Progress Report (Geneva Africa Progress Panel) Accessed via International Renewable Energy Agency (IRENA) (2016) Solar PV in Africa Costs and Markets Available httpwwwirenaorgmenuindexaspxmnu=SubcatampPriMenuID=36ampCatID=141ampSubcatID=2744
170 Are Off-Grids the Answer to Nigeriarsquos Energy Crisis Heinrich Boll Stiftung Available from httpsngboellorgtrue-cost-electricity (accessed July 2017)
171 Interview with Eitan Hochster Director of Busines Development Lumos Global 30 August 2017
172 Interview with Uvie Ugono Founder and CEO Solynta 31 August 2017
173 Rotshuizen S (28 July 2017) From the Practitioner Hub Interview with Ron Margalit from solar home system provider Lumos Inclusive Business Accelerator Available httpsibaventures20170728from-the-practitioner-hub-interview-with-ron-margalit-from-solar-home-system-provider-lumos
174 Interview with Uvie Ugono Founder and CEO Solynta 31 August 2017
175 Solar Nigeria Programme ldquoSolar Nigeria adds 170000 solar homes in just 1 yearrdquo (16 February 2017) Available from httpwwwsolar-ngcom20170216solar-nigeria-adds-170000-solar-homes-in-just-1-year
176 Shalev A (9 February 2017) Solar Power Taking Hold in Nigeria One Mobile Phone at a Time Inside Climate News Available httpsinsideclimatenewsorgnews07022017solar-energy-nigeria-africa-renewable-energy-climate-change-lumos
177 Rotshuizen S (28 July 2017) From the Practitioner Hub Interview with Ron Margalit from solar home system provider Lumos Inclusive Business Accelerator Available httpsibaventures20170728from-the-practitioner-hub-interview-with-ron-margalit-from-solar-home-system-provider-lumos
178 Thomson Reuters and CDP have collaborated on this report to bring together the latest data from companies that do report emissions and the latest estimates for those which do not or incompletely report emissions The finance sector was excluded as there are insufficient estimates on its Scope 3 emissions
179 This is measured against total anthropogenic emissions including land use of approximately 52 Gigatons CO2e This number includes direct indirect and value chain emissions (scopes 1 2 and 3) adjusted for a double counting of 60
180 Top 15 in terms of total annual aggregate emissions In the table a GHG Index above 100 indicates an increasing emissions trend a Revenues Index above 100 indicates an increasing revenue trend a Decoupling Index above 100 indicates that revenues are increasing faster than emissions and an Employment Index above 100 indicates an increasing employment trend
181 This is measured against total anthropogenic emissions including land use of approximately 52 Gigatons CO2e This number includes direct indirect and value chain emissions (scopes 1 2 and 3) adjusted for double counting of 60
182 Values which are ldquoNArdquo for 2016 are not available yet because they are not provided by the companies in a manner which allows for peer comparison and therefore require further analysis all values will be available by end of 2017 andor in the full Global 250 Report
183 Note this is an abridged version of case study as it appears in the full Global 250 report
184 Of the examples of emerging leadership in this report Total Group represents an underlying thesis that even the most carbon intensive firms have the opportunity for transformative business model change
185 According to Total completed CDP Climate Change information request submissions
186 httpwwwannualreportscomHostedDataAnnualReportArchivetNYSE_TOT_2015pdf
187 Kuramochi et al (2016) ldquoThe ten most important short-term steps to limit warming to 15Crdquo Climate Action Tracker Available httpclimateactiontrackerorgassetspublicationspublicationsCAT_10Steps_Summarypdf
188 Mission2020 2020 The Climate Turning Point Available httpwwwmission2020global202020The20Climate20Turning20Pointpdf
189 N Hoehne et al (2015) Developing 2C Compatible Investing Criteria NewClimate Institute Germanwatch and 2deg Investing Initiative Available httpswwwnewclimateinstitutefileswordpresscom2015112criteria-finalpdf
190 Ibid
191 International Energy Agency (2017) Energy Technology Perspectives Available wwwieaorgpublicationsfreepublicationspublicationEnergyTechnologyPerspectives2017ExecutiveSummaryEnglishversionpdf
192 Asian Development Bank (2016) The Asian Development Bank and the Climate Investment Funds Country Fact Sheets Second Edition ADB Climate Change and Disaster Risk Management Division Retrieved from wwwadborgsitesdefaultfilespublication167401adb-cif-country-fact-sheets-2nd-edpdf
193 GEF (2013) GEF Secretariat Review for FullMedium-Sized Projects GEF ID 5340 Retrieved from wwwthegeforgsitesdefaultfilesproject_documents5340-2013-04-25-152137-GEFReviewSheetGEF52
194 United Nations Environment Programme (UNEP) amp Bloomberg New Energy Finance (2017) Retrieved from httpfs-unep-centreorgsitesdefaultfilespublicationsglobaltrendsinrenewableenergyinvestment2017pdf
195 International Energy Agency 2017 Global energy investment fell for a second year in 2016 as oil and gas spending continues to drop Available httpswwwieaorgnewsroomnews2017julyglobal-energy-investment-fell-for-a-second-year-in-2016-as-oil-and-gas-spending-chtml
196 Frankfurt School-UNEP CentreBloomberg New Energy Finance (2017) Global Trends in Renewable Energy Investment 2017 httpwwwfs-unep-centreorg (Frankfurt am Main) Available httpfs-unep-centreorgsitesdefaultfilespublicationsglobaltrendsinrenewableenergyinvestment2017pdf
197 Organisation for Economic Co-operation and Development (OECD) (2016) Creditor Reporting System Retrieved from httpsstatsoecdorgIndexaspxDataSetCode=CRS1
198 Organisation for Economic Co-operation and Development (OECD) (2016) Creditor Reporting System Retrieved from httpsstatsoecdorgIndexaspxDataSetCode=CRS1
199 For this analysis ldquoimplementedrdquo projects are those that have been approved by the end of 2016 and will achieve emissions by 2020
200 World Bank (2015) International Financial Institution Framework for a Harmonised Approach to Greenhouse Gas Accounting Available httpwwwworldbankorgcontentdamWorldbankdocumentIFI_Framework_for_Harmonized_Approach20to_Greenhouse_Gas_Accountingpdf
201 Organisation for Economic Co-operation and Development (OECD) (2016) Creditor Reporting System Retrieved from httpsstatsoecd orgIndexaspxDataSetCode=CRS1
202 World Bank (2015) International Financial Institution Framework for a Harmonised Approach to Greenhouse Gas Accounting Available httpwwwworldbankorgcontentdamWorldbankdocumentIFI_Framework_for_Harmonized_Approach20to_Greenhouse_Gas_Accountingpdf
203 J Bai (2013) Chinarsquos Overseas Investments in the Wind and Solar Industries Trends and Drivers Working Paper Washington DC World Resources Institute Retrieved from httpwwwwriorgpublicationchina-overseasinvestments-in-wind-and-solar-trends-and-drivers
204 Cells shaded grey indicates no data available
205 Official Development Assistance + Other Official Flows
206 Organization for Economic Cooperation and Development Creditor Reportign System Retrieved from httpsstatsoecdorgIndexaspxDataSetCode=CRS1
207 Agence Franccedilaise de Deacuteveloppment (2016) 2015 Our Work Around the World Retreived from httpwwwafdfrwebdavsiteafdsharedPUBLICATIONSColonne-droiteRapport-annuel-AFD-VApdf
208 Soular R (2016) China becomes worldrsquos biggest development lender The Third Pole Retrieved from httpswwwthethirdpolenet20160601china-becomes-worlds-biggest-development-lender
209 UK International Climate Finance (2016) 2016 UK Climate Finance Results Retrieved from httpswwwgovukgovernmentuploadssystemuploadsattachment_datafile5534022016-UK-Climate-Finance-Results2pdf
210 FinnFund (2016) Annual Report 2015 Retrieved from httpannualreportfinnfundfi2015filebank753-Annual_Report_2015pdf
211 FMO (2016) 2015 Annual Report Retrieved from httpannualreportfmonlllibrarydownloadurnuuid921394c0-bb5b-45d9-99e9-18d09fd21961fmo_annualreport2015_onlinepdfformat=save_to_diskampext=pdf
212 The International Climate Initiative (IKI) the German governmentrsquos climate funding instrument supplies the funds for many GIZ RE and EE projects GIZ is the implementing organization for these projects while IKI is the supporting institution
213 Deutsche Gesellschaft fuumlr Internationale Zusammenarbeit (GIZ) GmbH Projects Retrieved from httpswwwgizdeprojektdatenindexactionrequest_locale=en_EN
214 KfW Development Bank (24 February 2016) Presentation on KfW Development Bank 2015 Environment and Climate Commitments amp CO2 ndash Monitoring Retrieved from httpsurldefenseproofpointcomv2urlu=https-3A__wwwkfw-2Dentwicklungsbankde_PDF_Entwicklungsfinanzierung_Umwelt-2Dund-2DKlima_Zahlen-2DDaten-2DStudien_KfW-2DKlimafinanzierung-2Din-2DZahlen_Umwelt-2DKlimaneuzusagen-2D2015-5FENpdfampd=CwIFAwampc=-109dg2m7zWuuDZ0MUcV7Sdqwampr=KjRxMDLnH5mYpLVbZF3u_UtYA0frxBmccQMurQoKFFkampm=z0-IQV0b8MFl57AlNkF_zVMGgXCzaqh3KPZ-K_-AgW8amps=W9Ezfc2ZuAIrScF_-ljhjQYyn0PGffRYH23Qo_dQTgAampe=215 Retrieved from httpswwwjicagojpenglishpublicationsreportsannual2015c8h0vm00009q82bmattc8h0vm00009q82o5pdf
215 Retrieved from httpswwwjicagojpenglishpublicationsreportsannual2015c8h0vm00009q82bm-att2015_36pdf
216 Norfund (2016) 2015 Report on Operations Norwegian Investment Fund for Developing Countries Retrieved from httpsissuucommerkurgrafiskdocsnorfund_virksomhetsrapport_2016_blae=1379933435569369
217 Overseas Private Investment Corporation OPIC Annual Report 2015 Retrieved from httpswwwopicgovsitesdefaultfilesfiles2015annualreportpdf
86
R E F E R E N C E S
218 Global Environment Facility (2016) About us Retrieved from httpswwwthegeforgabout-us
219 Climate Investment Funds (2016) What we do Retrieved from httpwww-cifclimateinvestmentfundsorgabout
220 Cells shaded grey indicate no data available
221 Asian Development Bank (2016) 2015 Clean Energy Investment Project Summaries Retrieved from httpswwwadborgsitesdefaultfilespublication184537clean-energy-investment-2015pdf
222 Asian Infrastructure Investment Bank (2016) The Peoplersquos Republic of Bangladesh Distribution System Upgrade and Expansion Project Retrieved from httpswwwaiiborgenprojectsapproved2016_downloadbangladeshsummarybangladesh_distribution_system_upgrade_and_expansionpdf
223 Climate Investment Funds (2016) Empowering a Greener Future Annual Report 2015 Retrieved from httpwww-cifclimateinvestmentfundsorgsitesdefaultfilesannual-report-2015cif-annual-report-ebookpdf
224 Climate Investment Funds (2016) Empowering a Greener Future Annual Report 2015 Retrieved from httpwww-cifclimateinvestmentfundsorgsitesdefaultfilesannual-report-2015cif-annual-report-ebookpdf
225 European Investment Bank (2016) 2015 Activity Report Retrieved from httpwwweiborgattachmentsgeneralreportsar2015enpdf
226 European Investment Bank (2015) 2014 Sustainability Report Retrieved from httpwwweiborgattachmentsgeneralreportssustainability_report_2014_enpdf
227 Green Climate Fund (2016) Resources Mobilized Retrieved from httpwwwgreenclimatefundpartnerscontributorsresources-mobilized
228 Global Environment Facility Behind the Number 2015 A Closer Look at GEF Achievements Retrieved from httpswwwthegeforgsitesdefaultfilespublicationsGEF_numbers2015_CRA_bl2_web_1pdf
229 Global Environment Facility About Us Retrieved from httpswwwthegeforgabout-us
230 World Bank Group (2016) Corporate Scorecards Retrieved from httppubdocsworldbankorgen963841460405876463WBG-WBScorecardpdfzoom=100
231 Proparco (2016) Key Figures 2015 Retrieved from httpwwwproparcofrwebdavsiteproparcosharedELEMENTS_COMMUNSPDFChiffres20ClefsProparco_Key_Figures_2015_UK_Webpdf
232 World Bank (2015) International Financial Institution Framework for a Harmonised Approach to Greenhouse Gas Accounting Available httpwwwworldbankorgcontentdamWorldbankdocumentIFI_Framework_for_Harmonized_Approach20to_Greenhouse_Gas_Accountingpdf
233 Frankfurt School-UNEP CentreBNEF (2016) Global Trends in Renewable Energy Investment 2016 Retrieved from httpfs-unep-centreorgsitesdefaultfilespublicationsglobaltrendsinrenewableenergyinvestment2016lowres_0pdf
234 Houmlglund-Isaksson L Purohit P Amann M Bertok I Rafaj P Schoumlpp W Borken-Kleefeld J 2017 Cost estimates of the Kigali Amendment to phase-down hydrofluorocarbons Environmental Science amp Policy 75 138ndash147 doihttpdxdoiorg101016jenvsci201705006
235 UN Environment Programme (UNEP) (2017) The 2017 Emissions Gap Report Available httpwwwuneporgemissionsgap
236 International Energy Agency (2017) Energy Technology Perspectives Available wwwieaorgpublicationsfreepublicationspublicationEnergyTechnologyPerspectives2017ExecutiveSummaryEnglishversionpdf
237 Westphal M I Canfin P A S C A L Ballesteros A T H E N A amp Morgan J E N N I F E R (2015) Getting to $100 Billion Climate Finance Scenarios and Projections to 2020 World Resources Institute Working Paper Available at httpswwwwriorgsitesdefaultfilesgetting-to-100-billion-finalpdf
238 IRENA 2016 Data amp Statistics International Renewable Energy Agency Abu Dhabi United Arab Emirates Available at httpresourceirenairenaorggatewaydashboardtopic=4ampsubTopic=15 [Accessed September 20 2016]
239 IEA 2016 Energy Technology Perspectives 2016 Towards Sustainable Urban Energy Systems International Energy Agency Paris France
240 IGES 2016 List of grid emission factors Update August 2016 Hayama Japan Institute for Global Environmental Stratgegies (IGES) Available at httppubigesorjpmodulesenvirolibviewphpdocid=2136 [Accessed September 30 2016]
241 OECD 2016 OECDStat Query Wizard for International Development Statistics Available at httpstatsoecdorgqwids [Accessed September 30 2016]
242 Buchner BK Trabacchi Chiara Federico M Abramskiehn D amp Wang D 2015 Global Landscape of Climate Finance 2015 Climate Policy Initiative
243 USD 49 billion was identified for renewable energy projects and USD 26 billion for energy efficiency projects
87
GLOSSARY g
GLOSSARY
The entries in this glossary are adapted from definitions provided by authoritative sources such as the Intergovernmental Panel on Climate Change and UN Environment
Additionality a criterion that stipulates that emissions savings achieved by a project must not have happened anyway had the project not taken place
Baseline Scenario the scenario that would have resulted had additional mitigation efforts and policies not taken place
Bilateral Development Organization a bilateral development organization mobilizes public funds from national budgets to finance development initiatives abroad Some groups also raise capital from private markets and some use both public and private financing in their operations Development institutions generally finance projects via grants andor loans distributed to governments of recipient nations which in turn distribute funding to ministries local agencies and firms in charge of project implementation
Bottom-up analysis a method of analysis that looks at the aggregated emissions impact from individual renewable energy and energy efficiency projects
Business as usual the scenario that would have resulted had additional mitigation efforts and policies not taken place (with respect to an agreed set)
Developing Countries this report uses the same definition of developing countries as used by organizations such as the IEA or IRENA243
Double counting the situation where the same emission reductions are counted towards meeting two partiesrsquo pledges (for example if a country financially supports an initiative in a developing country and both countries count the emissions towards their own national reductions)
Emission pathway the trajectory of annual global greenhouse gas emissions over time
International Financial Institutions (IFIs) banks that have been chartered by more than one country
Multilateral Development Banks (MDBs) financial institutions that draw public and private funding from multiple countries to finance development initiatives in developing countries These organizations often fund projects in collaboration with each other employing multi-layered finance agreements that include grants loans and leveraged local funding
Scenario a hypothetical description of the future based on specific propositions such as the uptake of renewable energy technologies or the implementation of energy efficiency standards
Top-down analysis a method of analysis that uses aggregated data often supplied by organizations that support renewable energy and energy efficiency projects in developing countries to determine global impact of a certain policy measure group etc
88
A C R O N Y M S
ACRONYMS
pound British Pound
euro Euro
2DS 2degC Scenario
B2DS Beyond 2degC Scenario
AFD Agence Franccedilaise de Deacuteveloppement
ADB Asian Development Bank
APEC Asia Pacific Economic Cooperation
BAU Business as usual
BAT Best available technology
BECCS Bioenergy with carbon capture and storage
BEIS UK Department for Business Energy amp Industrial Strategy
AFD Agence Franccedilaise de Deacuteveloppement
ADB Asian Development Bank
CAT Climate Action Tracker
CCS Carbon capture and storage
CDP Carbon Disclosure Project
CF Capacity factor
CIF Climate Investment Fund
CO2 Carbon dioxide
CO2e Carbon dioxide equivalent
DEFRA Department for Environment Food amp Rural Affairs of the United Kingdom of Great Britain and Northern Ireland
DFID UK Department for International Development of the United Kingdom of Great Britain and Northern Ireland
EC European Commission
ECOWAS Economic Community of West African States
EE Energy efficiency
EIA Energy Information Administration of the United States of America
EIB European Investment Bank
EJ Exajoule
ES Energy saved or substituted
ETP Energy Technology Perspectives
EV Electric vehicle
FIT Feed-in tariff
JICA Japan International Cooperation Agency
GDP Gross domestic product
GEEREF Global Energy Efficiency and Renewable Energy Fund
GEF Global Environment Facility
GHG Greenhouse gas
GIZ Deutsche Gesellschaft fuumlr Internationale Zusammenarbeit
GNI Gross national income
Gt Gigaton
GW Gigawatt
kg kilogram
kWh Kilowatt hours
LED Light Emitting Diode
LCA Life-Cycle Analysis
LDV Light-duty vehicle
IDS Institute for Development Support
IEA International Energy Agency
IFI International Financial Institution Framework for a Harmonised Approach to Greenhouse Gas Accounting
IKI International Climate Initiative
IPCC Intergovernmental Panel on Climate Change
IRENA International Renewable Energy Agency
ISO International Organization for Standardization
MDB Multilateral development banks
MWh Megawatt-hour
NDCs Nationally Determined Contributions
NDEs National designated entities
NEEAPs National Energy Efficiency Action Plans
ODA Official development assistance
OECD Organisation for Economic Cooperation and Development
PPA Power purchase agreement
PV Photovoltaic
PWh Petawatt-hour
RampD Research and development
RE Renewable energy
REN21 Renewable Energy Policy Network for the 21st Century
REEEP Renewable Energy and Energy Efficiency Partnership
RPS Renewable Portfolio Standards
Rs Indian Rupee
RTS Reference Technology Scenario
SBCP Sustainable Buildings Certification Program
SBT Science-Based Targets
SDGs Sustainable Development Goals
SE4ALL Sustainable Energy For All
TWh Terawatt hour
UNFCCC United Nations Framework Convention on Climate Change
US $ United States Dollars
WEO World Energy Outlook
WRI World Resources Institute
WWF World Wildlife Fund
89
IMPRESSUMPICTURE RIGHTS g
IMPRESSUMPICTURE RIGHTS
Titelpage People using lights powered by Off-Grid Electricrsquos solar service mPower copy Power Africa Geothermally active groundshutterstock SvedOliver Hrsquomong ethnic minority childrenLaocai Vietnam Wind Farmshutterstock Mongkol Udomkaew
page 9 Matemwe village Zanzibar Sam EatonPRI
page 10 Udaipur India
page 13 Nanjing China
page 14 World Bank Photo Collections Fotos
page 19 Kuala Lumpur Malaysia Hanoi Vietnam
page 20 Women prepare matoke dish Kampala copy IFPRIMilo Mitchell
page 22 Jama Masjid Old Delhi India
page 23 New Delhi India New Delhi India Amravati India
page 24 Kampala Uganda
page 26 Nanjing Jianye District China Nanjing China car chargerFlickr copy Haringkan Dahlstroumlm CC BY 20
page 27 Wikimedia Commons DKMcLaren CC BY-SA 40
page 28 Cali Valle Del Cauca Colombia Creative Commons licensed by user CoCreatr on Flickr CoCreatrtypepadcom
page 30 Alameda (central park) MexicoCityFlickr Ingrid Truemper CC BY-NC 20 gardens integrated into buildingUnSplash Oliver Wendel
page 32 Lagos NigeriaFlickr Seun Ismail CC BY-NC 20 Figmentmediacouk Jessica Seldon Department for International Development (DFID) CC BY 20 Bariadi TanzaniaFlickr Russell Watkins Department for International Development (DFID) CC BY 20 Flickr Russell WatkinsDepartment for International Development CC BY 20 Uribia Colombia
page 33 Bariadi Tanzania Flickr Russell Watkins Department for International Development CC BY 20
page 35 Luxembourgshutterstock Vytautas Kielaitis
page 37 Monumento a la Revolucion Mexico City Mexico
page 38 India shutterstock singh_lens
page 39 Flickr David Mellis CC BY 20 Mwanza TanzaniaFlickr Russell Watkins Department for International Development (DFID)
page 40 Lambarene Gabon Africa Tay Son streetHanoi Vietnam
page 50 Nanjing Yangtze River BridgeFlickr Jack No1 CC BY 30
page 51 Bariadi TanzaniaFlickr Russell WatkinsDepartment for International Development (DFID) CC BY 20
page 54 Hanoi Vietnam Hanoi Metro Hanoi Vietnamwikimedia commons Autumnruv CC BY-SA 40
page 55 gobi desert central asia
page 56 Plaza de Caicedo Cali Colombia
page 58 Kokemnoure Burkina Faso
page 59 shutterstock LIUSHENGFILM
page 62 barefoot-bannerjpg
page 63 Kampala Uganda
page 69 shutterstock Srdjan Randjelovic
page 70 Casablanca Morocco
page 71 Mexico City Mexico Rwanda camp for internally displaced people (IDP) Tawila North DarfurFlickr Albert Gonzalez Farran UNAMID CC BY-NC-ND 20
page 74 Morocco shutterstock
page 75 People using lights powered by Off-Grid Electricrsquos solar service mPower copy Power Africa
page 87 Siem Reap Cambodia
page 89 Isla Contoy Mexico
+2degC
UN Environment
PO Box 30552 Nairobi Kenya
Tel ++254-(0)20-762 1234
Fax ++254-(0)20-762 3927
uneppubuneporg
Email 1gigatonuneporg
www1gigatoncoalitionorg
ISBN 978-92-807-3671-7
Job Nr DTI2132PA
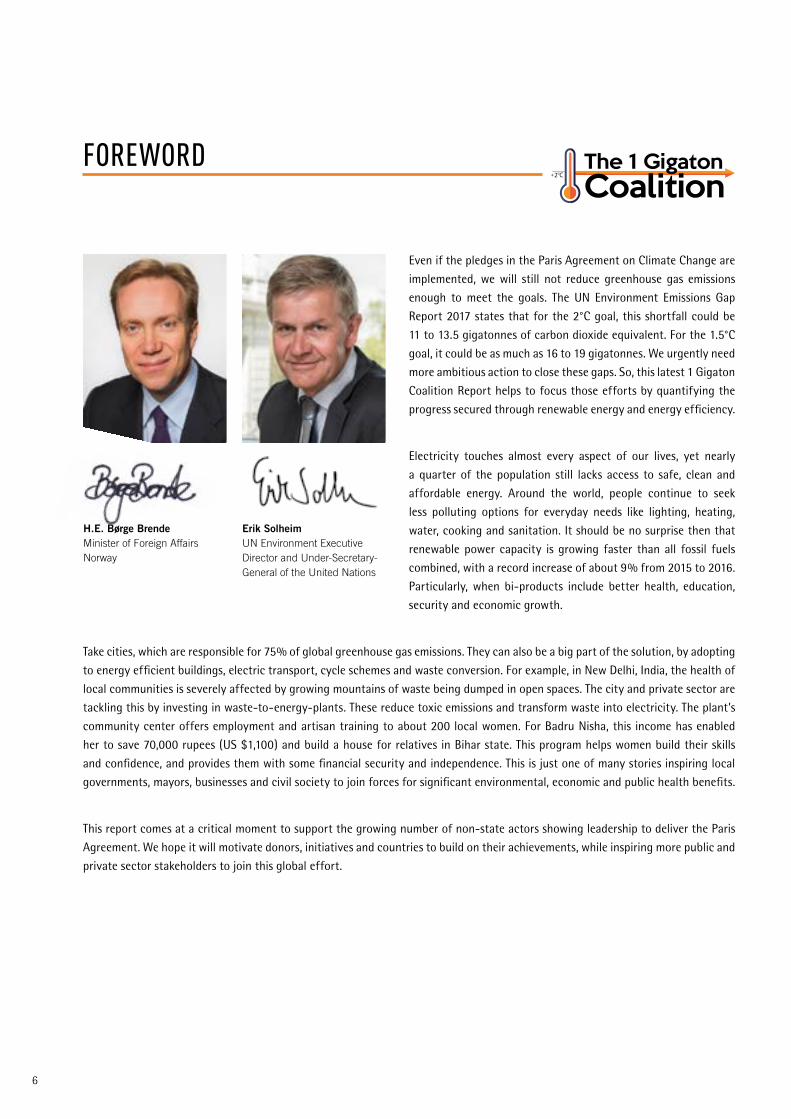
6
Even if the pledges in the Paris Agreement on Climate Change are
implemented we will still not reduce greenhouse gas emissions
enough to meet the goals The UN Environment Emissions Gap
Report 2017 states that for the 2degC goal this shortfall could be
11 to 135 gigatonnes of carbon dioxide equivalent For the 15degC
goal it could be as much as 16 to 19 gigatonnes We urgently need
more ambitious action to close these gaps So this latest 1 Gigaton
Coalition Report helps to focus those efforts by quantifying the
progress secured through renewable energy and energy efficiency
Electricity touches almost every aspect of our lives yet nearly
a quarter of the population still lacks access to safe clean and
affordable energy Around the world people continue to seek
less polluting options for everyday needs like lighting heating
water cooking and sanitation It should be no surprise then that
renewable power capacity is growing faster than all fossil fuels
combined with a record increase of about 9 from 2015 to 2016
Particularly when bi-products include better health education
security and economic growth
Take cities which are responsible for 75 of global greenhouse gas emissions They can also be a big part of the solution by adopting
to energy efficient buildings electric transport cycle schemes and waste conversion For example in New Delhi India the health of
local communities is severely affected by growing mountains of waste being dumped in open spaces The city and private sector are
tackling this by investing in waste-to-energy-plants These reduce toxic emissions and transform waste into electricity The plantrsquos
community center offers employment and artisan training to about 200 local women For Badru Nisha this income has enabled
her to save 70000 rupees (US $1100) and build a house for relatives in Bihar state This program helps women build their skills
and confidence and provides them with some financial security and independence This is just one of many stories inspiring local
governments mayors businesses and civil society to join forces for significant environmental economic and public health benefits
This report comes at a critical moment to support the growing number of non-state actors showing leadership to deliver the Paris
Agreement We hope it will motivate donors initiatives and countries to build on their achievements while inspiring more public and
private sector stakeholders to join this global effort
FOREWORD
HE Boslashrge BrendeMinister of Foreign AffairsNorway
Erik SolheimUN Environment Executive Director and Under-Secretary- General of the United Nations
+2degC
KEY FINDINGS
R INTERNATIONALLY SUPPORTED RENEWABLE ENERGY AND ENERGY EFFICIENCY PROJECTS implemented in developing countries between 2005 and 2016 are projected to reduce greenhouse gas emissions by 06 Gigatons of carbon dioxide (GtCO2) annually in 2020 When scaled up using international climate financing commitments these efforts could deliver 14 GtCO2 in annual reductions by 2020
R INTERNATIONAL SUPPORT FOR INVESTMENTS IN RENEWABLE ENERGY AND ENERGY EFFICIENCY IS VITAL FOR DECARBONIZATION as this support provides key resources and creates enabling environments in regions critical to the global climate future International assistance accounts for only 10 of all global renewable energy and energy efficiency activities yet it has extensive impact for future climate mitigation
R DATA AVAILABILITY AND INFORMATION SHARING REMAIN A PERENNIAL CHALLENGE one that is preventing countries and supporting organizations from systematically evaluating their workrsquos impact although renewable energy and energy efficiency projects and policies are growing in developing countries The 1 Gigaton Coalition has developed a database of about 600 internationally supported projects implemented in developing countries between 2005 and 2016
R EVALUATING PROJECTS POLICIES AND SECTORSrsquo COMPATIBILITY WITH GLOBAL 15degC AND 2degC CLIMATE GOALS IS ESSENTIAL TO LINK ACTIONS WITH LONG-TERM OBJECTIVES This new method would enable bilateral and multilateral development organizations to measure the long-term impacts of supported projects
R NON-STATE AND SUBNATIONAL ACTORS HAVE TAKEN ON A LEADING ROLE IN SCALING UP CLIMATE ACTION The case studies in this report show that low-carbon forms of development ndash particularly city-based public private partnerships ndash generate multiple co-benefits These include improved environmental and human health economic stimulus and employment creation enhanced gender equality and other societal gains that support the 2030 Agenda for Sustainable Development
Developing countries are achieving low-cost emissions reductions through renewable energy (RE) and energy efficiency (EE) projects and initiatives The focus of this report is to evaluate the impact of these projects in terms of measurable greenhouse gas emissionsrsquo reductions to help close the emissions gap needed to meet the 2degC climate goal
EXECUTIVE SUMMARY
Greenhouse gas (GHG) emissions reductions created by a sample of 273 internationally supported RE and EE projects in developing countries implemented between 2005 and 2016 amount to approximately 03 gigatons of carbon dioxide (GtCO2) annually by 2020 Of the analysed 273 projects 197 are RE 62 are EE and 14 are both RE and EE These efforts reduce emissions by displacing fossil fuel energy production with clean energy technologies and by conserving energy in industry buildings and transportation The analysed samplersquos RE projects contribute approximately 0084 GtCO2 EE projects contribute 0113 GtCO2 and REEE projects contribute 0059 GtCO2 to the total emissions reductions These projects received direct foreign support totaling US $32 billion This analysis builds upon the second 1 Gt Coalition report which examined data from 224 projects (see Annex I for more details)
Reductions in GHG emissions resulting from all internationally supported RE and EE projects in developing countries implemented between 2005 and 2016 could be 06 GtCO2 per year in 2020 This estimate is determined by scaling up the analysed samplersquos emissions reductions to a global level using the total bilateral and multilateral support for RE and EE from 2005 to 2016 (US $76 billion) These international investments create crucial enabling conditions in developing countries and emerging economies where there are significant barriers to private RE and EE investment
GHG emissions reductions from internationally supported RE and EE projects could be on the order of 14 GtCO2e per year by 2020 if committed public finance for climate mitigation is used to scale up these activities Developed countries agreed in 2010 to mobilize US $100 billion per year by 2020 to help developing countries adapt to the impacts of climate change and reduce their emissions To calculate the 14 GtCO2e estimate it is assumed that a quarter of the US $100 billion is public mitigation finance and deployed in the same way as for the 273 analysed projects
Assessing an initiativersquos emissions mitigation impact has inherent drawbacks that must be overcome in order to evaluate a project policy or sector in light of international climate goals Emissions reductions estimates even when accurate do not explain whether the described outcomes are compatible with global climate goals This report takes steps to overcome this challenge by developing criteria intended to assess a sectorrsquos compatibility with global climate goals It also shows how these compatibility conditions can be applied to RE and EE projects outlining a conceptual framework for future analysis
Criteria for sector-level compatibility with 15degC and 2degC goals were developed to evaluate emission savings from projects (Tables 31 - 315) The sectoral criteria are displayed in compatibility tables with each table listing 15degC- and 2degC-compatibility conditions drawn largely from the International Energy Agencyrsquos (IEA) Energy Technology Perspectives (ETP) 2017 report and its 2degC Scenario (2DS) and Beyond 2degC Scenario (B2DS) Schematics (Figures 7 ndash 10) demonstrate how the sectoral compatibility criteria could be applied at the project firm or policy level to identify projects considered 15degC- or 2degC-compatible Two actual projects selected from this reportrsquos RE and EE database are used as proofs of concept Information sharing and data availability prove to be key challenges to broadening the application of this approach
GtCO2e
Reductions from 273 supported projects
implemented during 2005 ndash 2016
analyzed in this report
Reductions by all supported projects
2005 - 2016 ($76 billion in total support)
Reductions if support scaled up to US $25 billion annually
through 2020
0258 GtCO2e 06 GtCO2e
14 GtCO2e
Figure ES Emission reduction from renewable energy and energy efficiency projects by 2020
9
EXECUTIVE SUMMARY g
City governments are increasingly collaborating with the private sector to address common challenges related to climate change and sustainable development The Intergovernmental Panel on Climate Change (IPCC) has indicated that achieving a 15degC- or 2degC-compatible future is a very challenging task yet almost all the technologies needed to build this future are commercially available today This report shows that many countries are acting to reduce emissions through RE and EE programmes and that when policies are well-designed both local and global communities benefit The six case studies presented in this report describe the social economic and environmental benefits that RE and EE programmes bring to the localities where they are implemented They highlight innovative initiatives implemented in a diverse set of cities and regions
bull NEW DELHIrsquoS municipal government has partnered with Infrastructure Leasing and Financial Services Environment (ILampFS Environment) to build a waste-to-energy plant that will save approximately 82 million tons of greenhouse gas emissions over its 25-year lifespan while reducing the landfillrsquos area and air and water pollution The project helps transition former waste-pickers to new jobs directly hiring 70 people at the new plant and has created a community center that provides support and job training to approximately 200 local women
bull NANJING China worked with the electric vehicle industry to add 4300 electric vehicles to its streets between 2014 and 2015 This transition has helped the city reduce emissions by 246000 tons of carbon dioxide equivalent (CO2e) in 2014 while saving over US $71 million in lower energy bills
bull In the industrial VALLE DEL CAUCA corridor of Colombia The Womenrsquos Cleaner Production Network developed action plans to reduce industrial pollution and address climate change in small and medium-sized enterprises The initiative has created a host of benefits including a 110 percent increase in enterprise production efficiency and a new residential solar installation program
bull In LAGOS and in many other Nigerian cities private companies are piloting new approaches to make solar energy more accessible and affordable A partnership between a solar start-up and local telecommunications provider has brought solar power to 50000 homes clinics schools and businesses benefiting more than 250000 people and creating 450 new jobs
bull Ugandarsquos capital city KAMPALA has partnered with businesses to scale up an array of clean cooking technology initiatives installing 64 improved eco-stoves in 15 public schools constructing biodigesters in 10 public schools and funding companies that train women and youth to produce low-carbon briquettes from organic waste
bull MEXICO CITYrsquoS Sustainable Buildings Certification Programme developed and implemented in partnership with the local construction and building industry covers 8220 square meters of floor area across 65 buildings and has reduced 116789 tons of carbon dioxide (CO2) emissions saved 133 million kilowatt-hours (kWh) of electricity and 1735356 cubic meters of potable water and created 68 new jobs between 2009 and 2017
These case studies demonstrate the feasibility and benefits of a low-carbon future through the various RE and EE activities undertaken in cities in collaboration with private sector groups Expanding this type of public-private sector engagement would harness expertise funding technology and data from both arenas to help overcome barriers to action and accelerate the pace of climate action
Governments and non-state actors will gather at COP 23 in November to discern a path forward for implementing the Paris Agreementrsquos central provisions Data sources needed to evaluate progress towards achieving the 15degC or 2degC climate goals are key points under discussion This report provides pertinent information and evidence showing how internationally supported RE and EE projects and initiatives implemented in developing countries are contributing to narrowing the emissions gap ndash the difference between the status quo and the 15degC and 2degC goals The reportrsquos case studies show the social and economic co-benefits associated with these emissions reductions particularly when city governments partner with private companies to enact emissions savings programs These initiatives have great potential to motivate countries and non-state actors to build new channels for collaboration to raise their ambitions and scale up their efforts The 1 Gigaton Coalition will continue to promote RE and EE efforts evaluate their emissions impacts and show how they contribute to achieving both international climate objectives and Sustainable Development Goals (SDGs)
C H A P T E R 1
New Delhi India
New Delhilsquos waste- to-energy initiatives convert more than 50 percent of the citylsquos daily waste into energy and fuel
R Details see page 22
INTRODUCTION
1 Energy-related carbon dioxide (CO2) emissions have stabilized showing no growth in 2016 for the third year in a row yet global energy consumption is predicted to increase 48 percent by 20401 Developing countries where rapid economic growth is the main driver of rising energy demand will account for the vast majority of this future increase in energy consumption1 2
To meet the Paris Agreementrsquos goal to limit global temperature to no more than 2degC and aim to hold warming to 15degC global emissions must peak around 2020 and then rapidly decline in the following three decades approaching zero by 20503 The emissions gap however has widened from last yearrsquos estimates The 2017 United Nations Environment Programme (UN Environment) Emissions Gap Report finds that by 2030 there will be a gap of 11 ndash 135 GtCO2e between countriesrsquo Paris climate pledges and the goal to limit global temperature rise to 2degC The gap widens to 16 ndash 19 GtCO2e when considering the 15degC goal4
11
INTRODUCTION g
Renewable energy (RE) and energy efficiency (EE) projects in developing countries are crucial means of narrowing the emissions gap and decarbonzing future energy growth In 2016 a record 1385 gigawatts (GW) of new capacity of RE was installed mostly in developing countries and emerging economies some of which have become key market players5 Evaluating how RE and EE projects translate to measurable emissions reductions to closing the emissions gap and to creating a 15degC or 2degC compatible future is the focus of this report
The climate imperative is clear we must act now and with ambition to decarbonize human activities in order to meet global climate goals The latest climate scenarios produced by the worldrsquos leading international scientific bodies show that our window to prevent dangerous global warming is rapidly narrowing as humanityrsquos carbon budget ndash the total amount of carbon dioxide that can be emitted for a likely chance of limiting global temperature rise ndash diminishes year on year The Intergovernmental Panel on Climate Change (IPCC) found in its Fifth Assessment Report (2014) that the world will warm by between 37degC to 48degC by 2100 if humanity pursues a ldquobusiness as usualrdquo pathway This level of warming scientists agree would be disastrous for human civilization To give us a better than 66 chance to limit global warming below 2degC ndash the scientific communityrsquos agreed upon threshold for what societies could reasonably manage ndash the IPCC reports that atmospheric CO2 concentrations cannot exceed 450 ppm by 2100 This limit means that the worldrsquos carbon budget through the year 2100 is less than 1000 Gt CO2e Considering a 15degC limit our carbon budget falls to under 600 Gt CO2e through 21006
UN Environmentrsquos Emissions Gap Report 2017 which focuses on the gap between the emissions nations have pledged to reduce and the mitigation needed to meet global temperature goals developed a ldquolikelyrdquo (gt66 chance of achieving the target) 2degC warming model under which annual global GHG emissions would need to stabilize around 52 GtCO2e through 2020 and then fall precipitously to 42 GtCO2e by 2030 and 23 GtCO2e by 2050 To have a greater than 50 chance of containing warming to 15degC the 2017 Gap Report projects a greater drop in annual emissions to 36 GtCO2e by 2030 ndash a significantly lower estimate than what the 2016 Emissions Gap report suggested Under both scenarios annual global emissions appear to go negative ndash meaning that more carbon is absorbed than produced ndash by 2100 These projections are starkly divergent from baseline business as usual emissions projections as well as scenarios that account for the Nationally Determined Contributions (NDCs) that countries pledged in the Paris Agreement By 2030 there is a 135 GtCO2e difference between the annual emissions in the 2017 Gap
Reportrsquos unconditional NDC scenarios and its 2degC trajectory and a 19 GtCO2e gap between the NDCs and 15degC trajectories7
This gap points to an urgent need to increase the ambition scope and scale of carbon mitigation efforts worldwide Each sector in every nation must lead the way with ambitious actions to decarbonize and governments must enact plans and policies for sharp emissions reductions if we are to meet the 15degC or 2degC targets Nearly one-half of lower middle income countries (GNI per capita between US $1006 and $3955) and one-fourth of low income countries (GNI per capita less than US $1005) have made RE a primary focus of their NDCs8 One-third of lower middle income countries and 19 percent of low-income countries have adopted EE as a main focal instrument in their NDCs9 Many of these countries lack energy access for the majority of their population suffer from the effects of poor indoor and outdoor air quality and are striving to rapidly develop their economies to reduce poverty ndash needs that can be partly addressed through RE and EE efforts Intergovernmental coordination and support are key catalysts for the requisite RE and EE initiatives as developed nations transfer expertise technologies and funding to developing countries to create enabling environments for carbon-neutral growth Yet beyond global emissions reduction goals what specific targets should nations sectors and individual firms use to guide their actions How do funding organizations policymakers and implementing groups know at what point their operations are compatible with the 15degC and 2degC targets
The growth in RE and EE projects in developing countries in the last decade demonstrates the potential for these efforts to contribute to global climate mitigation and to narrow the emissions gap A lack of data and harmonized accounting methodology however have prevented the bilateral and multilateral organizations that support these efforts from systematically evaluating their impact The 1 Gigaton Coalition supports these organizationsrsquo efforts in developing countries where growth in RE and EE projects have potential to transition economies to low-carbon trajectories The Coalition works to build a robust knowledge base and support the development of harmonized GHG accounting methods These tools will aid analysis of RE and EE initiatives that are not
12
INTRODUCTION gC H A P T E R 1
+2degC
First Report | 2015
Narrowing the Emissions Gap Contributions from renewable energy and energy efficiency activities
+2degC
Second Report
Renewable energy and energy efficiency in developing countries contributions to reducing global emissions
2016
directly captured in UN Environmentrsquos Emissions Gap Report or in other assessments of global mitigation efforts Through the compilation and assessment of developing country RE and EE efforts between countries partners and collaborative initiatives the 1 Gigaton Coalition promotes these efforts and strives to measure their contribution to reducing global greenhouse gas emissions reductions
PREVIOUS 1 GIGATON COALITION REPORTSThe 1 Gigaton Coalition has released two reports to date The 1 Gigaton Coalition 2015 report aimed to quantify RE and EE contributions to narrowing the 2020 emissions gap The 2015 report was the first of its kind to assess and quantify RE and EE projectsrsquo global climate mitigation potential This analysis used a comparison between the IEA World Energy Outlook (WEO) current policy scenarios and a no-policy scenario derived from the IPCC scenarios database to estimate the energy sectorrsquos total emissions reductions The analysis found that EE and RE projects in developing countries could result in emission reductions on the order of 4 GtCO2 in 2020 compared to a no-policy baseline scenario
The 1 Gigaton Coalition 2016 report refined the approach developed in the inaugural 2015 report expanding the database of internationally supported RE and EE projects in developing countries from 42 to 224 The larger database includes projects implemented between 2005 and 2015 receiving direct foreign support totalling US $28 billion These projects were estimated to reduce GHG emissions by an aggregate 0116 GtCO2 annually in 2020 Avoided GHG emissions were calculated by multiplying the annual energy saved or substituted by a project (determined for RE projects by using the power generation capacity and the technology- and country-specific capacity factors and for EE projects through a projectrsquos documentation) by country-specific grid electricity CO2 emission factors The 2016 report estimated that all internationally supported RE and EE projects would reduce emissions by up to 04 GtCO2 annually in 2020 and that if public finance goals for climate mitigation were met supported projects could reduce emissions by 1 GtCO2 per year in 2020
OVERVIEW OF THE 1 GIGATON COALITION 2017 REPORTThe 1 Gigaton Coalition 2017 report builds upon the first two reports further expanding the database of RE and EE projects from developing countries to calculate the mitigation impact of 273 internationally supported projects in developing countries These projects including 197 RE 62 EE and 14 RE and EE activities are located in 99 countries and supported by 12 bilateral funding agencies and 16 multilateral development banks and partnerships They are categorized for the technologies used to replace fossil fuel energy production with clean energy (ie solar wind biomass and hydroelectricity) and reduce energy consumption in the industrial building and transport sectors In total these projects received US $32 billion in direct foreign support
Evaluating RE and EE projectsrsquo mitigation impact is important to shed light on whether these efforts are reducing global emissions An essential question is whether these efforts lead to long-term decarbonization or low-carbon pathways that are compatible with global goals to limit temperature rise to 15degC and 2degC The 1 Gigaton Coalition 2017 report synthesizes a methodological approach to evaluate the 15degC- and 2degC-compatibility of RE and EE projects intending to guide bilateral and multilateral partners and implementing countries in determining which policies individual projects and entire sectors are consistent with 15degC and 2degC scenarios Drawing from other research initiatives and the International Energy Agencyrsquos (IEA) 2017 Energy Technologies Perspective (ETP) report this analysis provides criteria for 15degC and 2degC-compatibility at the sector level and demonstrates how these criteria could be applied to RE and EE projects
Providing real world examples of RE and EE initiatives in developing countries this report features six in-depth case studies of ongoing programmes and policies in cities throughout the world These case studies demonstrate the compounding benefits to human health the economy and environment that result from smartly planned RE and EE efforts The cases feature collaborative initiatives in which the public sector and private companies work together to develop implement and scale climate action
This report is organized as follows
Chapter 2 provides an overview of the current landscape of RE and EE policies in developing countries Chapter 3 presents six case studies that explore RE and EE programmes that engage the private sector to develop and implement renewable energy and energy efficiency activities The case studies highlight the multiple benefits these initiatives garner across the various cities and regions where they are implemented This chapter also includes a discussion by Thomson Reuters of the emerging low-carbon business paradigm Chapter 4 describes the 15degC- and 2degC-compatibility methods and applications developed for this report providing sector-level compatibility tables and project-level guidance Chapter 5 provides an assessment of the GHG emissions mitigation from RE and EE projects in developing countries based on calculations derived from a project database built for this report Chapter 6 concludes with the reportrsquos key implications for policymakers RE and EE supporting partners and climate actors
Nanjing China
Nanjing was one of the fastest adopters of electric vehicles and has become an important hub for the industry
R Details see page 26
DE VELOPING COUNTRIESrsquo EFFORTS AND ACHIE VEMENTS gC H A P T E R 2
DEVELOPING COUNTRIESrsquo EFFORTS AND ACHIEVEMENTS IN ENERGY EFFICIENCY AND RENEWABLE ENERGY2 This chapter describes the role of policymakers in promoting renewable energy and energy efficiency initiatives in developing countries Data collected by REN21 ndash the global multistakeholder renewable energy policy network ndash is used to illustrate the current status of targets and policies
14
C H A P T E R 2
21 POLICY DEVELOPMENTRenewable energy (RE) and energy efficiencyrsquos (EE) increasingly vital role in the rapid transformation of the energy sectors of industrialized emerging and developing countries continues to be stimulated in part by government actions to incentivize new technology development and deployment Policymakers have adopted a mix of policies and targets to deploy RE and EE to expand energy access provide more reliable energy services and meet growing energy demand while often simultaneously seeking to advance research and development into more advanced fuels and technologies
Recognizing the complementary nature of RE and EE at least 103 countries addressed EE and RE in the same government agency including at least 79 developing and emerging countries while an estimated 81 countries had policies or programmes combining support to both sets of technologies including approximately 75 developing or emerging countries
Adopted together RE and EE can more rapidly help meet national development goals including increasing energy security enhancing industrial competitiveness reducing pollution and environmental degradation expanding energy access and driving economic growth This can be achieved through sector-wide planning such as Chinarsquos 13th Five Year Plan adopted in 2016 which includes specific goals for both RE and EE
Indirect policy support including the removal of fossil fuel subsidies and the enactment of carbon pricing mechanisms such as carbon taxes emission trading systems and crediting approaches can also benefit the RE and EE sectors Carbon pricing policies if designed
effectively may incentivize renewable energy development and deployment across sectors by increasing the comparative costs of higher-emission technologies The removal of fossil fuel subsidies also may level the financial playing field for energy technologies as fossil fuel subsidies remain significantly higher than subsidies for renewables with estimates of the former being at least more than twice as high as those for RE This estimate rises to ten times higher when the cost of externalities and direct payments are included
Developing countries led the way on initiating subsidy reform in 2016 with 19 countries adopting some form of reduction or removal Similarly by year-end 2016 Group of 20 (G20) and Asia-Pacific Economic Cooperation (APEC) initiatives had led to 50 countries committing to phasing out fossil fuel subsidies
211 TARGETSTargets are an important tool used by policymakers to outline development strategies and encourage investment in EE and RE technologies Targets are set in a variety of ways from all-encompassing economy-wide shares of capacity generation or efficiency to calling for specific technology deployments or new developments in targeted sectors Similarly policymakers at all levels from local to stateprovincial regional and national have adopted targets to outline sector development priorities
Nearly all nations around the world have now adopted RE targets aiming for specified shares production or capacity of RE technologies Targets for RE at the national or stateprovincial level are now found in 124 developing and emerging countries
15
DE VELOPING COUNTRIESrsquo EFFORTS AND ACHIE VEMENTS g
24 33
113
53
2212
TransportHeating and Cooling
Electricity Both Final amp Primary Energy
FinalEnergy
PrimaryEnergy
Number of developing and emerging economies with RE targets by sector and type end-2016
0
20
40
60
80
120
100
Figure 1 Number of developing and emerging countries with RE targets by sector and type end-2016
Source REN21 Policy Database
Note Figure does not show all target types in use Countries are considered to have policies when at least one national or stateprovincial-level policy is in place Policies are not exclusive--that is countries can be counted in more than one column many countries have mroe than one type of policy in place
with new or revised RE targets found in 53 of those countries in 2016 Economy-wide targets for primary energy andor final energy shares have been adopted in 54 countries By sector renewable power has received the vast majority of attention with targets found in 113 countries Targets for renewable heating and cooling and transport energy have been introduced to a much lesser degree in place in 22 and 12 developing and emerging countries respectively by year-end 201610 (See Figure 1)
With nearly all countries around the world having some form of RE target now in place the pace of adoption of new targets has slowed significantly in recent years However many countries continue to increase the ambition of their renewable energy goals with some including the 48 Climate Vulnerable Forum member countries seeking to achieve 100 RE in their energy or electricity sectors11
A total of 51 new EE targets were adopted in developing and emerging economies worldwide in 2016 bringing the total number of countries with EE targets in place to at least 105 by year-end 2016 Many EE targets have been put in place through National Energy Efficiency Action Plans (NEEAPs) both in developed and developing countries Outside of the EU NEEAPs have be particularly prevalent in Eastern Europe and African countries12
Energy sector targets also played a prominent role in many National Determined Contributions (NDCs) submitted to the
United Nations Framework Convention on Climate Change (UNFCCC) A total of 117 NDCs were submitted by year-end 2016 largely formalizing the commitments made in countriesrsquo Intended Nationally Determined Contributions (INDCs) submissions prior to the Paris climate conference EE was mentioned in 107 NDCs and 79 developing and emerging economy NDCs included EE targets such as Brazilrsquos target of 10 efficiency gains by 203013 RE was referenced in 73 NDCs submitted by developing and emerging countries with 44 including specific RE targets14
Individual country RE and EE commitments range widely in terms of scope and ambition In the EE sector targets that address multiple end-use sectors are the most common However policymakers have increasingly set single-sector goals to transition energy supply or reduce energy use in sectors including heating and cooling transportation buildings and industry This includes targets such as India and Ugandarsquos light-emitting diode (LED) lamp goals
RE and EE targets have also been adopted at the regional level In 2016 the members of the Southeast Asian Nations (ASEAN) collectively established a 20 by 2020 energy intensity reduction target in their NDCs while the European Union set a binding 30 by 2030 energy savings target
RE and EE targets are both often paired with specific policy mechanisms designed to help meet national goals
16
C H A P T E R 2
Countries with policiesand targets
Countries with policiesno targets (or no data)
828
Countries with targetsno policies (or no data)23Countries with neither targets nor policies25
Figure 2 Developing and emerging countries with EE policies and targets end-2016
Source REN21 Policy Database
Note Countries are considered to have policies when at least one national or stateprovincial-level policy is in place
Countries with policiesand targets
Countries with policiesno targets (or no data)
956
Countries with targetsno policies (or no data)29
8 Countries with neithertargets nor policies
Figure 3 Developing and emerging countries with RE policies and targets end-2016
Source REN21 Policy Database
Note Countries are considered to have policies when at least one national or stateprovincial-level policy is in place
212 POLICY INSTRUMENTS
In addition to targets direct and indirect policy support
mechanisms continue to be adopted by countries to promote
EE (See Figure 2) and RE development and deployment (See
Figure 3) Policymakers often strive to implement a unique mix
of complementary regulatory policies fiscal incentives andor public financing mechanisms to overcome specific barriers or meet individual energy sector development goals These mechanisms if well-designed and effectively implemented can help spur the needed investment in the energy sector to meet national RE andor EE targets
17
DE VELOPING COUNTRIESrsquo EFFORTS AND ACHIE VEMENTS g
Number of mandatory targets
Number of new targets
TOTAL TARGETS
Number of awareness campaigns
Number of funds
Number of new policies
TOTAL POLICIES
0 4020 60 80 100 120
2851
105
4740
4190
Figure 4 Number of developing and emerging countries with EE targets and policies end-2016
Source REN21 Policy Database
Note Numbers indicate countries where targets and policies have been identified but not necessarily the total number of countries with policies in place
RE and EE are often adopted through differing mechanisms EE-specific promotion policies often take the shape of standards labels and codes or monitoring and auditing program while RE is often promoted through feed-in tariffs tendering or net metering Policymakers have also turned to similar mechanisms such as mandates and fiscal incentives to promote both RE and EE
RE and EE policies play an important role in the transformation of the energy sectors of industrialized developing and emerging countries EE policies have been adopted in at least 137 countries including 90 developing and emerging economies15 EE awareness campaigns were held in at least 47 developing and emerging countries while EE funds were in place in at least 40 such countries in 201616 (See Figure 4)
Direct RE support policies were found in at least 154 countries including 101 developing and emerging economies as of year-end 201617 The power sector continues to attract the majority of attention with sectors such as heating and cooling and transportation receiving far less policy support (See Figure 5)
Feed-in tariffs (FIT) remain the most common form of regulatory policy support to RE While the pace of new FIT adoption has slowed in recent years policymakers continue to revise existing mechanisms through a mix of expanded support to further incentivize specific RE technologies as well as reduced rates to keep pace with falling technology costs For example in 2016 Indonesia increased its solar FIT by more than 70 and set FIT rates for
geothermal power Similarly Ghana announced plans to double the length of terms under its solar PV FIT to 20 years Cuts were also made to existing mechanisms in countries such as Pakistan and the Philippines while Egypt enacted domestic content requirements for solar PV and wind projects qualifying for FIT assistance
In recent years many countries have revised their FIT mechanisms to focus on support to smaller-scale projects while turning to RE auctions or tendering for large-scale project deployment The use of tendering for promoting renewable power technologies has expanded rapidly in recent years with developing and emerging countries taking a leading role in the adoption of these mechanisms Tenders were held in 34 countries in 2016 with half of them occurring in developing and emerging countries18 This included Chilersquos auction which resulted in a world record bid for lowest price of solar PV generation at US $2910 per MWh
Countries in Africa were particularly active throughout the year with Nigeria adopting a tendering system for projects larger than 30 MW to supplement its FIT policy and both Malawi and Zambia holding their first RE tenders In the Middle East and North Africa (MENA) region comments included Morocco State of Palestine and Jordan all held tenders In Asia the worldrsquos two largest countries China and India (at the national and sub-national level) as well as Turkey held RE tenders during the year In Central America tenders were held in El Salvador Guatemala Honduras Panama and Peru Tenders have also been held for non-power technologies though to a far lesser degree
18
C H A P T E R 2
Number of countries
Power0
10
20
30
40
50
60
70
80
TransportHampC Power TransportHampC Power TransportHampC Power TransportHampC
2013 2014 2015 2016
Feed-in tariff premium payment
Tendering
Net metering
Renewable Portfolio Standard (RPS)
Solar heat obligation
Technology-neutral heat obligation
Biodiesel obligation mandate only
Bioethanol obligation mandate only
Both biodiesel and bioethanol
Non-blend mandate
Countries with PowerPolicies
Countries withTransportPolicies
Countries with Heating and Cooling (HampC) Policies
7
62
34
69
35
69
35
7
78
37
73
9 countries had other heating amp cooling policies
Figure 5 Number of RE policies and number of countries with policies by sector and type developing and emerging countries end-2016
Source REN21 Policy Database
Note Figure does not show all policy types in use Countries are considered to have policies when at least one national or stateprovincial-level policy is in place Policies are not exclusive--that is countries can be counted in more than one column many countries have more than one type of policy in place
Previously successful tendering programs in South Africa and Brazil each saw setbacks in 2016 In South Africa developers faced challenges securing power purchase agreements (PPAs) with the national utility while reduced demand for electricity and economic challenges caused by Brazilrsquos contracting national economy forced officials to call off previously planned auctions marking the first time since 2009 in which the country did not hold a tender for wind power
Policymakers have also continued to support renewable electricity deployment through enacting mandates for specified shares of renewable power often through Renewable Portfolio Standards (RPS) or requiring payment for renewable generation through net metering policies such as the new policies added in Suriname in 2016 In addition to regulatory policies several countries provided public funds through grants loans or tax incentives to drive investment in RE development or deployment This includes Indiarsquos 30 capital subsidy for solar PV rooftop systems19
Governments are also adapting mechanisms that long have been used for the promotion of power generation technologies to develop
an environment of enabling technologies such as energy storage and smart grid systems to better integrate renewable technologies in global electricity systems For example Suriname held a tender for solar PV systems including battery storage in 201620
RE deployment in the electricity sector through mechanisms such as those described above can also have a significant impact on the efficiency of power generation by shifting from thermal power plants which convert only approximately one-third of primary energy to electricity to more efficient RE installations21
Renewable heating and cooling technologies are directly promoted primarily through a mix of obligations and financial support though the pace of adoption remains well below that seen in the power and transport sectors By year-end 2016 renewable heat obligations or mandates were in place in 21 countries including seven emerging and developing countries (Brazil China India Jordan Kenya Namibia and South Africa)22
RE heating and cooling policies frequently focus on the use of RE technologies in the buildings sector and are often adopted
19
DE VELOPING COUNTRIESrsquo EFFORTS AND ACHIE VEMENTS g
in concert with building efficiency policies and regulations23 Several countries advanced EE through new or updated building codes in 2016 of which 139 are in place worldwide at the national and sub-national level including in at least 9 developing and emerging countries24 This includes Indonesiarsquos efforts to develop a Green Building Code and members of the Economic Community of West African States (ECOWAS) implementing building codes in accordance with a regional directive
Specific financial incentives including grants loans or tax incentives targeted at renewable heating and cooling technologies have been adopted in at least 8 developing and emerging economies In certain cases such as in Bulgaria support to RE heating technologies are included in broader EE financial support programs New developments in 2016 included Chilersquos extension of its solar thermal tax credit and Indiarsquos new loan incentives for solar process heat developers Renewable energy tendering has also been used to scale up deployment in the sector Bids for South Africarsquos long-awaited solar water heater tender closed in early-2016
The industrial sector also has a significant EE policy focus however the development of targeted mechanisms for the promotion of RE in industrial processes remains a challenge for policy makers For EE both Mali and Morocco now require energy audits for large industrial energy users
Transportation-focused RE and EE policies have both been adopted to accomplish a wide range of sector goals including increasing fuel economy or fuel switching to renewable fuels or electric vehicles The vast majority of policy attention particularly in developing countries has been focused on energy use in the road transportation sector While energy use in the maritime rail or aviation transportation sectors is gaining attention concrete RE and EE policy mechanisms have been adopted in only a handful of locations
Fuel economy standards are a primary means of increasing energy efficiency of passenger vehicles in the transport sector At least eight countries plus the EU have now established fuel economy standards for passenger and light-commercial vehicles as well as light trucks including Brazil China India and Mexico25 No developing countries have yet adopted policies for heavy-duty vehicles
RE in the transportation sector is often promoted through mandates specifying required shares or volumes of renewable fuel use Developing countries are often at the leading edge of nations looking to promote fuel switching to renewable transport fuels Biofuel blend mandates were in place at the national or stateprovincial level in 36 countries as of year-end 2016 with developing and emerging countries accounting for 26 of that total26 In 2016 Mexico expanded its blend mandate to cover nationwide fuel use while Argentina Malaysia India Panama Vietnam and Zimbabwe all added or strengthened biofuel andor bioethanol blend requirements
New financial incentives also were introduced in 2016 to promote biofuel production and consumption biorefinery development and RampD into new technologies including in Argentina where biodiesel tax exemptions were expanded and Thailand which provided subsidies to support a trial program for biodiesel use in trucks and military and government vehicles
While national policies remain an important driver of renewables and energy efficiency development municipal policymakers are taking a leading role in the promotion of both RE and EE within their jurisdictions often moving faster and enacting more ambitious goals than their national counterparts As cities continue to band together to mitigate the impacts of global climate change they have turned to RE and EE to transform their energy sectors A number of cities around the world are now seeking to achieve 100 renewable energy or electricity while a growing list of municipalities in developing and emerging economies such as Cape Town (South Africa) Chandigarh (India) and Oaxaca (Mexico) have established ambitious RE goals
C H A P T E R 3
Kampala Uganda
Kampala aims to replace 50 percent of household charcoal use with alternative cook fuels such as biomass or briquettes made from organic waste
R Details see page 24
NON-STATE AND SUBNATIONAL CONTRIBUTIONS TO RENEWABLE ENERGY AND ENERGY EFFICIENCY3 In cities and regions throughout the world governments at all jurisdiction levels are collaborating with private companies funding organizations and civil society to implement renewable energy and energy efficiency programs These activites reduce carbon emissions and create co-benefits including enhanced environmental quality improved public health economic growth and job creation social inclusion and gender equality This chapter includes six case studies of successful public-private collaboration as well as a discussion of the emerging low-carbon business paradigm
21
NON-STATE AND SUBNATIONAL CONTRIBUTIONS g
Renewable energy (RE) and energy efficiency projects (EE) in developing countries often require collaboration from implementing partners such as the private sector and subnational actors This chapter features six case studies that demonstrate some of the strategies that cities businesses and other collaborators are using to support RE and EE activities across developing and emerging economies These examples showcase the social economic and environmental benefits of RE and EE initiatives demonstrating the incentives driving businesses and cities to take leadership roles in implementing them27 28 It also includes an excerpt from Thomson Reutersrsquo forthcoming lsquoGlobal 250 Report A New Business Logicrsquo exploring the motivations and process of companies seeking to decarbonize their business models
Cities and the private sector will be vital to limiting global warming to well below 2degC29 As of 2013 over half of the global population and approximately 80 percent of global GDP resided in cities30 By 2050 the urban population will account for two-thirds of the global population and 85 percent of the global GDP31 Since cities concentrate people and economic activity they also shape energy use urban areas currently make up around two-thirds of global primary energy demand and 70 percent of global energy-related carbon dioxide emissions32 The goals of the Paris Agreement rest on the ability to chart a sustainable urban future ndash through the adoption of renewable energy increasingly efficient use of energy and the design of resilient and low-carbon infrastructure and transport33
Many cities already host innovative climate strategies driven by governments businesses and other actors who see opportunities to lower costs appeal to investors generate new forms of industry and improve quality of life Activities that help cities address climate change also offer opportunities to make progress towards meeting the goals of the 2030 Agenda for Sustainable Development Low-carbon forms of development generate co-benefits such as reduced traffic congestion and improved air quality and public health34 35 36 Between 2007 and 2015 solar and wind power in the United States produced air quality benefits of US $297ndash1128 billion mostly from 3000ndash12700 avoided premature mortalities37
The transition to a low-carbon economy can also reduce poverty and spur job creation38 39 Implementing the RE strategies articulated in the national climate action plans of the United States European Union China Canada Japan India Chile and South Africa would generate roughly 11 million new jobs and save about US $50 billion in reduced fossil fuel imports40 If these countries committed to a 100 percent RE pathway they would generate 27 million new jobs and save US $715 billion from avoided fossil fuel imports41 Collaboration with civil society and local stakeholders can help ensure a just transition to a low-carbon economy that maximizes job creation helps citizens develop new skills and fosters community renewal42
Building compact connected cities also reduces the cost of providing services and infrastructure for urban transport energy water and waste43 In India smart urban growth could save
between US $330 billion and $18 trillion (₹2-12 lakh crores) per year by 2050 ndash up to 6 of the countryrsquos GDP ndash while producing significant savings for households44 Altogether the New Climate Economy estimates that global low-carbon urban actions could generate US $166 trillion between 2015 and 2050 while reducing annual GHG emissions by 37 GtCO2e by 203045
Increasingly different kinds of actors are working together to realize this potential One assessment found that three-quarters of the challenges facing city climate action require support and collaboration with national and regional governments or the private sector46 Cities and companies in particular have grown increasingly interdependent Businesses aim to capture a share of the growing US $55 trillion global market in low-carbon and environmental technologies and products which is often concentrated in cities47 Energy service companies which base their business model on delivering EE solutions generated US $24 billion in revenue in 2015 and employed over 600000 people in China alone48 The global RE sector employed 98 million people in 2016 a 11 increase over 2015 by 2030 this number is expected to grow to 24 million49 Engaging in climate action also helps to mitigate the risk climate change may pose to an organizationrsquos business model and supply chain and enables companies to meet internal and public commitments to address global warming
The private sector can also help develop implement and scale climate and development solutions in urban areas that often struggle to access adequate finance Aside from tax collection most cities face limited options to raise or spend funds the private sector can help access capital to initiate or expand successful projects50 A C40 analysis of some 80 mega-cities identified 2300 high-impact ldquoshovel readyrdquo climate actions that could mitigate 450 MtCO2 ndash close to the annual emissions of the United Kingdom ndash by 2020 if US $68 billion in funds could be unlocked to implement them51
Many of these collaborations are already underway One survey of 627 climate change initiatives across 100 global cities found that private and civil society actors accounted for approximately one quarter (24 percent) of urban climate action and 39 percent of climate action in Asian cities52 Private sector organizations fund and invest in climate action act as service providers deliver operations and maintenance support to projects such as transport or waste management and design and build infrastructure53 Companies have also helped to fill gaps in infrastructure by creating new models for delivering city services such as ride-sharing54 Strategies like microfinance have played important roles in further unlocking the upfront capital vital to developing and implementing urban innovations55 As urban areas expand public-private partnerships that harness different forms of expertise technology and data can help overcome barriers to action and keep pace with citiesrsquo rapid rate of change56 National and regional governments can also help foster this process by crafting policy and financial environments that help RE and EE strategies take root
Current situation
RRR
82 million tons in avoided methane
emissions ndash equivalent to removing all cars from
Delhirsquos roads for
US $ 04 per kWh in avoided
waste treatment costs
200 acres of land valued at over
Rs 2000 crores (US $308 million)
New Delhi
22
C H A P T E R 3
About the initiative New Delhirsquos Integrated Municipal Waste Processing Complex at Ghazipur financed through a private-public partnership with ILampFS Environment reduces emissions while transforming waste into energy This partnership also supports local families through direct hiring and job training
NEW DELHI About the City
Population (metro area)
GDP (2016)
Land Area
23 million
US $ 2936 billion
1483 km2 iii
R New Delhirsquos 3 waste-to-energy plants enable the city to use over 50 of its waste to produce electricity daily
R The 52 MW capacity of New Delhirsquos 3 waste-to-energy plants constitute nearly 60 of the total 88 MW produced by waste management practices in India
gt50 5500 tday 52 MW
Initiative Accomplishments The Ghazipur waste-to-energy plant will save
100 days
IN RELATION TO SDGS
23
CASE STUDIES g
Each day the Integrated Municipal Waste Processing Complex at Ghazipur New Delhi receives approximately 2000 tons of waste about 20 of the cityrsquos 9500-ton waste stream57 Through a public-private partnership between the East Delhi Municipal Corporation and the Infrastructure Leasing and Financial Services Environment (ILampFS Environment) the landfill now includes a waste-to-energy plant which generates an annual 12 MW of power58 It also produces 127 tons of fuel an alternative energy source for cement and power plants59 The Ghazipur plant which began operating in November 2015 will save a projected 82 million tons in avoided methane emissions over its 25-year life span60
The projectrsquos benefits extend beyond its climate impacts Reusing waste will prevent 200 acres of urban land valued at over Rs 2000 crores (US $308 million) from being consumed by the landfill61 62 For ILampFS Environment the plant enables it to engage in Indiarsquos environmental goods and services sector estimated to be worth Rs 250 billion (US $39 billion) and projected to grow 10 to 12 annually63 Across its operations the company reuses 95 of every tonne of municipal solid waste through recycled products or energy generation64
Converting waste to energy and avoiding the expansion of the landfill also lowers the health and safety risks of an open solid waste disposal site65 The plant reduces the amount of leachate the landfill generates saving US $04 per kWh in annual treatment costs66 In managing the Ghazipur plant ILampFS Environment relies on best-in-class technology67 and a Continuous Emission Monitoring System which publishes real-time emission parameters online to meet strict air quality standards68
The project also focuses on supporting the surrounding community of 373 local wastepicker families who live near and work in the landfill salvaging and reselling waste Providing support and retraining to local families is critical to efforts that affect access to the landfill and its materials The Ghazipur plant employs over 70 former waste-pickers directly in the plant69 To foster financial inclusion 400 families received bank accounts and Permanent Account Number cards and kiosk banking was provided to the local community through the State Bank of India Since July 2014 2075 bank accounts have been opened70 71
ILampFS Environment also worked with a nonprofit organization Institute for Development Support (IDS) to establish Gulmeher a community center that offers employment and training to approximately 200 local women who previously earned a living collecting waste at the Ghazipur landfill72 The center which launched in May 2013 grew out of brainstorming sessions IDS held with waste-pickers ILampFS Environment and other stakeholders73 74 To help boost their future employability the center provides training in a variety of jobs75 Women reuse materials from a nearby wholesale flower market to create products including boxes cards diyas and natural holi colors76 In mid-2014 the center partnered with Delhi-based start-up Aakar Innovations to produce inexpensive sanitary napkins that low-income women can afford Aakar Innovations helped train the women and buys and re-sells the products they produce77
In 2014 the community organization converted into a private company with participants also acting as shareholders of the Gulmeher Green Producer Company Limited78 Earnings for the participating women average approximately Rs 5000-6000 (US $77-90) every month79 For Badru Nisha the first woman to join the center this income has enabled her to save 70000 Rs (US $1100) and to build a house for relatives80 In India where only 26 of women participate in the labor force compared to almost 75 of men this organization helps build womenrsquos skills and confidence81 82
Without intervention New Delhi is expected to generate roughly 15750 tons of garbage daily in 202183 For cities facing a similar challenge of managing high volumes of waste with limited land the Ghazipur plant offers a successful strategy plans for replicating it are underway in New Delhi and other Indian cities84 The cityrsquos most recently constructed waste-to-management plant Narela-Bawana also relies on a public-private partnership model and produces compost as well as energy85 As the city and its waste stream continue to grow the private sector plays a powerful role in converting challenges into opportunities for development
TRANSFORMING WASTE INTO ENERGY | INDIA | NEW DELHI
Market in Kampala Uganda
24
About the initiative Kampala accelerates the development and adoption of clean cooking technology The city partners with the private sector civil society and international funders to bring clean cooking technology to public schools and markets and to support low-carbon biomass businesses
installed in 15 primary schools saving of 9300 euro (US $11029)
in firewood costs reducing 1671 tons of CO2
annually and benefitting 15631 children and
staff members
Ugandan shillings (US $276860) raised
by MTN Uganda to install bio-toilets in 10 schools
eco-stoves installed in Kampalarsquos
markets
improved eco-stoves
KAMPALA
Reduce greenhouse-gas emissions by 22 (compared
to business-as-usual)
Replace 50 of charcoal with
alternative cook fuel
Current situation
-22
About the City
Population (metro area)
GDP
Land Area
35 million
US $25528 billion
1895 km2
-50
C H A P T E R 3
IN RELATION TO SDGS
64 x 2201 billion
25
Kampala has grown rapidly over the past decade becoming home to nearly 2 million people and generating approximately half of Ugandarsquos GDP86 In 2014 the city launched a five-year Climate Change Action Strategy87 to guide its rapid evolution and to ensure it ldquodrives development in the most sustainable wayrdquo88 The plan draws on a diverse array of goals ndash from planting half a million trees to creating traffic-free paths for pedestrians and bicyclists ndash to build Kampalarsquos resilience and protect its most vulnerable populations89
The early years of the Kampalarsquos Climate Change Action Strategy have focused on creating pilot projects and building partnerships that lay the groundwork for expanded action In particular the city has made great strides in implementing a complementary array of clean cooking initiatives Its Climate Change Action Strategy seeks to replace 50 of household charcoal use with alternative cook fuels such as biomass or briquettes made from organic waste90 To pursue this target Kampala provides seed capital and funding to organizations that train youth and women in making biomass briquettes brings biogas digesters and improved cook stoves to public schools and installs eco-stoves at city markets These proof-of-concept demonstrations build confidence and connections with the private sector civil society and bilateral and multilateral funders to help scale up these strategies
MTN Uganda the countryrsquos largest telecommunications company for instance has committed 1 billion Ugandan shillings (US $276860) raised through two annual city marathons to install biogas digesters in 10 public schools91 Their commitment will expand a program piloted at the Kansanga School which turns human animal and food waste into methane gas halving the amount of energy used to cook meals This biogas digester produces approximately 26 MWh annually lowering operating costs and reducing pollution from the firewood or charcoal it replaces92
A collaboration between the Kampala Capital City Authority (KCCA) and French development agency Expertise France supports a complementary effort to bring higher efficiency cooking stoves to 15 new public schools93 with technical support from the Ugandan company SIMOSHI Ltd This effort which has distributed 64 stoves supplied by Uganda Stove Manufacturers Ltd builds on the successful implementation of an eco-stove at another school94 The program has saved schools 9300 euro (US $11029) in firewood costs reduced 1671 tons of CO2 annually and benefitted 15631 children and staff members95 Earnings acquired through the Clean Development Mechanism will be reinvested in the schools to support annual maintenance monitoring and management96 Eventually the project aims to install 1500 stoves in 450 schools benefiting 340000 children and reducing 31286 tonnes of annual CO2 emissions97
Kampala also works with emerging businesses providing seed funding to organizations that train women and youth to produce
low-carbon briquettes from organic waste food scraps and other materials The briquettes burn cleanly without releasing smoke or ash and help avoid deforestation In the words of one customer they are also ldquocheap to use time-saving and energy-savingrdquo98 The briquettes have gained popularity with restaurants hotels households and poultry farmers Kampalarsquos administration is developing a program to further expand the supply of low-carbon fuel and connect producers with more markets99
In addition the city has installed 220 eco-stoves in the cityrsquos marketplaces These stoves can be linked with solar photovoltaic panels that extend stovesrsquo cooking time and can generate electricity for other uses such as lighting a kitchen or charging a battery100 This approach improves working conditions protects the health of the women who typically cook and serve food in these spaces and helps test and fine-tune this technology It also builds awareness and comfort with cleaner cooking technology among smaller business owners who often face financial barriers to the purchase of new equipment
The shift to cleaner cooking technology can deliver vital improvements in public health More than 90 of Ugandan households101 along with many restaurants schools and other places that serve and prepare food cook with wood charcoal The World Health Organization estimates exposure to cookstove smoke contributes to 13000 premature deaths every year in Uganda102 103 In Kampala over 80 of households rely on charcoal for cooking with dramatic impacts on air quality and public health104 Women and girls often face the highest levels of risk as they can spend up to five hours daily cooking in smoky kitchens and can face safety risks in traveling to forests to collect firewood105
The use of clean cooking technology also lessens the risk of fuel shortages The balance between biomass supply and demand remains fragile with large deficits in materials forecasted in and beyond the 2020rsquos106 Since Kampala concentrates Ugandarsquos economic activity and as a result its energy demand it is especially vulnerable to these projected shortfalls but also particularly well-placed to test and develop solutions107
The cityrsquos approach to promoting clean cooking technology reflects the need to ensure that the transition away from the charcoal market generates jobs and creates revenue108 Funding will also continue to be crucial to the cityrsquos ability to facilitate and accelerate the adoption of clean cooking technologies Kampala has teamed up with the World Bank and the University of Washington to develop a climate-smart capital investment plan that aligns new projects with the cityrsquos climate action goals It will continue to leverage partnerships with private and international partners to scale up public funding as it takes the next steps in its climate and development roadmap109
EXPANDING ACCESS TO CLEANER COOKING | UGANDA | KAMPALA
CASE STUDIES g
26
NANJINGCurrent situation
R Shortlisted as one of Chinarsquos National
LOW-CARBON PILOT CITIES
R Added 4300 electric vehicles (EVs)
About the initiative The Nanjing Municipal Government introduced a series of policies to promote the sale use and production of electric vehicles It works with industry to continue transforming the city into a major electric vehicle manufacturing and services hub
Initiative Accomplishments
+4300
-246000t
About the City
Population (metro area)
GDP (2016)
Land Area
821 millionxlv
US $1464 billionxlvi
6598 km2 iii
During 2014-15
R reduced CO2 emissions by 246000 tons
and saved over US $71 million in lower energy bills
R Drew more than 46 EV companies to the city generating annual tax revenues of approximately
C H A P T E R 3
IN RELATION TO SDGS
RENEWABLE ENERGY
EV POLICIES
ELECTRIC VEHICLE MANUFACTURING AND SERVICES HUB
US$ 16 million
27
g
The Chinese city of Nanjing deployed the fastest rollout of electric vehicles in the world adding 4300 electric vehicles to its streets during 2014ndash2015110 This transition to electric vehicles (EV) helped Nanjing reduce CO2 emissions by 246000 tons in 2014111 Nanjingrsquos activities have drastically cut the cityrsquos carbon emissions and use of oil and generated over US $71 million in savings from lower energy bills112
Nanjingrsquos adoption of renewable and electric vehicles is part of a larger economic and environmental bid to transition away from energy and carbon intensive industries like petrochemicals steel and building materials113 that Nanjingrsquos economy once relied on These conventional industries are losing their economic competitiveness while emitting large amounts of greenhouse gases and other pollutants114
The municipal government supported this shift by building compatible infrastructure for electric vehicles introducing tax breaks and electricity price subsidies for EV consumers and promoting the use of renewable-powered vehicles in public services In the 2016 New Energy Automobile Promotion and Application Plan of Nanjing the municipal government aimed to add 500 renewable energy buses 500 service vehicles and 1502 passenger vehicles to its transportation system in 2016115 By 2018 Nanjingrsquos goal is to convert 80 of its bus fleet to be powered by renewable energy116 Nanjing also plans to build 3000 charging stations especially in residential areas and to expand the use of electric vehicles to trucks and vans in the logistics sector117
Nanjingrsquos initiative to promote electric vehicles closely aligns with Chinarsquos national climate energy and macroeconomic policies and it receives support from the central and provincial levels of government On a national level China has set specific targets to develop a sustainable and renewable energy-driven transportation sector as highlighted in both the State Councilrsquos Circular Economy Development Strategy and Near-Term Action Plan and the Ministry of Transportrsquos Guiding Opinions on Accelerating Development of Green Circular Low-Carbon Transportation118 Electric vehicles are a key part of the solution as they enable China to achieve GHG emission reduction targets as well as to grow and restructure its automobile industry
At the provincial level the Jiangsu Provincial Government has signed a Framework Agreement119 with the Ministry of Transport to promote Jiangsursquos development of low carbon transportation The Jiangsu Provincial Government also released the Green Circular and Low-Carbon Transportation Development Plan of Jiangsu Province (2013-2020)120 which included a target to make 35 of public buses and 65 of taxis run on renewable energy across Jiangsu
Through supportive policies and a favorable investment environment Nanjing has established itself as an electric vehicle manufacturing and services hub In 2014-15 Nanjing drew 46 companies connected to the EV sector to the city and earned tax revenues of approximately US $16 million per year121 In 2016 Chinese EV manufacturer Future Mobility Corporation invested US $17 billion to build a factory in Nanjing that has an initial production capacity of 150000 cars per year122 Beijing-based EV rental company Gofun has also introduced its service to Nanjing rolling out 200 electric cars that can be rented via smartphones123
Policy coordination across different levels of government helps explain Nanjingrsquos success Nanjing is a National Low-Carbon Pilot City124 Policies and guidelines from the Central and Provincial Governments give the Municipal Government the confidence and support it needs to conduct pilot programs and test new solutions
Private sector engagement is another important factor in scaling up EV adoption The private sector plays a key role in Nanjingrsquos expansion of its EV sector by providing solutions products and services to meet demand The Nanjing Municipal Governmentrsquos policies have made Nanjing a pioneer both as a market and a manufacturing center for the EV industry The Nanjing Municipal Government offers incentives for manufacturers to base their production in Nanjing thereby promoting its economic restructuring
The government also fosters companiesrsquo engagement in the sectorrsquos future In August 2017 the Nanjing New Energy Automobile Operation Alliance was launched It consists of 37 companies across the entire EV value chain ndash including carmakers like BYD real estate developer China Fortune Land Development and charging station solution provider e-charger The alliance is supported by the Nanjing Municipal Governmentrsquos EV Office and the Nanjing Economic and Technological Development Zone125 Platforms like this will enable Nanjing to expand its volume of EVs and develop a transportation sector that runs on clean pollution-free renewable energy
PROMOTING ELECTRIC VEHICLES | CHINA | NANJING
CASE STUDIES g
Current situation
Across Colombia micro small and medium enterprises comprise
of all Colombian businesses
of private sector employment
of the national GDP
women have been trained through the
initiative
Initiative Accomplishments
R A construction firm installed 3304kWh of energy in a new housing development saving +US $200 in the first 8 months of its projected 20-year life span
Under the leadership of Network participants25R A construction firm achieved a
reduction of its construction waste
reuse of demolition and construction material waste
reduction of paper use in its organizational processes
and the use of rainwater for of construction activities
3169
50
90
R A sugar cane mill switched to more efficient stoves and fuel increasing production efficiency 110
+110Production efficiency
Cali Valle del Cauca Colombia
28
About the initiative The Womenrsquos Cleaner Production Network trains and encourages entrepreneurs to foster clean production practices in small and medium enterprises along the Colombiarsquos Valle del Cauca region a major industrial corridor
VALLE DEL CAUCA REGION
C H A P T E R 3
IN RELATION TO SDGS
About the City
Population (metro area)
GDP (2016)
Land Area
46 millionxciv
US $353 millionlxix
22140 km2 iii
80 3590
GDP
29
The Womenrsquos Cleaner Production Network helps entrepreneurs transform their firms into green businesses It gathers women from academia utility companies public organizations and large and small industries to develop action plans to reduce industrial pollution and address climate change To date 25 women have leveraged the Network to capture efficiency savings reduce emissions and give their company a competitive edge
While strategies vary across sectors they typically deliver cost or material savings for the organization as well as benefits for the climate At a trapiches paneleros (unprocessed sugar product) mill old and inefficient ovens used wood and old tires as fuel in part to compensate for the ovenrsquos open design which failed to conserve heat Burning these materials released sulfur dioxide which creates respiratory risks126 in addition to greenhouse gases127 The firmrsquos owner a member of the Network led the switch to an eco-oven a system easily constructed using local materials A fine-grained silica wall conserves heat eliminating the need to burn tires and wood and enabling the operation to reuse sugar cane waste as fuel The new stove also generates more heat cuts the use of vegetable oil in the consumption process by 83 and increases overall production efficiency by 110128 The millrsquos production of its final products ndash 24-kg lumps of processed sugar cane ndash have jumped from 25 to 525 per hour129
In another example a firmrsquos female construction director led a shift to the use of solar energy in residential construction projects The firm joined forces with a national utility company Empresa de Energia del Pacifico (Epsa) and piloted an initiative to install solar panels on the roofs of common areas such as gardens swimming pools and gyms Since the panelsrsquo installation in January 2017 the PV systems have generated 3304 kWh of energy of which 3303 kWh has been consumed saving its owners over US $200 in the first 8 months of its projected 20-year life span130 131 The director now hopes to expand the use of solar to individual homes using environmentally-friendly materials to generate and store electricity
Other women associated with the Womenrsquos Cleaner Production Network have achieved similar results in both emissions reductions and environmental protection Increased efficiency at one large construction firm spread to ten of its suppliers across these businesses women led the installation of photovoltaic energy systems to provide light and pump rainwater initiated waste recycling and water reuse programs replaced firm motorcycles with bicycles and cut administrative paper use by half132
All of this activity occurs within the Valle del Cauca region of Colombia a major industrial corridor that hosts roughly 450 small and medium enterprises from different industries133
Across Colombia micro small and medium-sized enterprises make up 99 of all Colombian businesses and drive 80 of private sector employment along with 35 of the national GDP134 They also often generate significant pollution in part because of the challenge of accessing environmental knowledge and best practice technologies135 Regional cleaner production centers universities and environmental authorities in sync with Colombiarsquos 2010 Sustainable Production and Consumption Policy aim to transform polluting industries into sustainable businesses136
Groups like the Womenrsquos Cleaner Production Network help facilitate collaboration between these different actors making cleaner production efforts more resilient to financial or technical challenges These collaborations also help identify key areas for intervention A partnership between the Network and the Corporacioacuten Autoacutenoma Regional del Valle del Cauca (CVC) Colombiarsquos environmental authority for instance is developing clean production initiatives to support small coffee producers which employ many women displaced by conflict
Though many small and medium-sized enterprises are dominated by men women have been crucial actors in the transition to cleaner technology and practices While they work across diverse industries participants in Womenrsquos Cleaner Production Network share a common trait they have all already led successful cleaner production projects in various industries in Colombia prior to joining the initiative The Network helps facilitate technology transfer but also fosters strategic partnerships and learning alliances to help implement new tools and sustain change Many firms even when they successfully participate in demonstration projects struggle to integrate these new strategies tools or processes into their daily operations The Womenrsquos Cleaner Production Network has been especially adept at helping its participants institutionalize these transitions create a new business-as-usual and lay the foundation for continued gains in clean production137
The potential for replicating the Networkrsquos model in and beyond Colombian remains large Most participantsrsquo activities draw on local technology and materials and involve simple easily achievable steps138 The model of the Network itself could also be scaled up It draws value from the diversity of institutions and industries represented and helped build participation through concrete activities responsibilities and benefits for engagement in the network Crucially it considers technical knowledge from small firms and from large institutions to be complementary and equally valuable enabling the group to tackle problems that would have been challenging to address from a single perspective139
LEADING BY EXAMPLE IN CLEANER INDUSTRIAL PRODUCTION | COLOMBIA | VALLE DEL CAUCA REGION
CASE STUDIES g
30
Cut Commercial and industrial buildingsrsquo energy use generates
30 of Mexico Citylsquos carbon emissions
21949
of green roofs on schools hospitals and public buildings
square meters
Reduce
by 2020 and
Reduce annual emissions by
or limit to 2 metric tons of CO2 per capita by the year 2050
2mt CO2
more than its original targets
77million tonnes of CO2e
314
between 2008 - 2012 =
80-95
10 million tonnes of CO2e
million tonnes of CO2eby 2025
About the initiative Mexico Cityrsquos Sustainable Buildings Certifi- cation Program incentivizes sustainable commercial industrial and residential buildings creating benefits for building owners tenants and the city government
Past Accomplishments Current Situation Future Targets
MEXICO CITY
Covers 8220 square meters
of floor area across 65 buildings
Reduced
116789 tons of CO2
emissions
Saved
133 million kWh
of electricity
Saved
1735356 cubic meters
of water
68 new jobs
created
Initiative Accomplishments (between 2009-2017)
About the City
Population (metro area)
GDP
Land Area
204 million
US $421 billion
1485 km2
+10
IN RELATION TO SDGS
C H A P T E R 3
31
Mexico City has encouraged efficiency in new and existing building stock through a strategy that integrates public policy with concrete action The Sustainable Buildings Certification Program (SBCP) ldquothe first of its kind in Mexicordquo140 exemplifies this approch generating buy-in and capacity for more comprehensive action while delivering tangible environmental and economic benefits The initiative fosters the sustainable construction or improvement of commercial industrial and residential buildings by awarding certifications that reflect various levels of sustainability performance in energy efficiency water mobility solid waste social and environmental responsibility and green roofs
The SBCP launched in 2009 after approximately two years of planning and stakeholder consultation Mexico Cityrsquos Ministry of Environment gathered technical experts from the building industry local governments and academia to develop the programrsquos certification process and criteria Typically participants audit their buildingrsquos energy and water use then use the results to develop a plan to meet or exceed existing local and national energy efficiency standards The Ministry of the Environment certifies new or newly retrofitted buildings rating residential structures as compliant efficient or excellent and industrial buildings as compliant or excellent Higher certification levels generate higher property tax and payroll tax reductions Every two years a follow-up assessment tracks performance and compliance141
As of 2017 the program encompassed 8220 square meters of floor area across 65 buildings Between 2009 and 2017 participating buildings saved 116789 tons of CO2 133 million kWh of electricity and 1735356 cubic meters of potable water142 The SBCPrsquos benefits also spread beyond efficiency The program has supported renewable energy installation and expanded green roofs and gardens ndash its tax breaks allow participants to implement sustainability strategies that might otherwise be prohibitively expensive
Since third-party technicians play a vital role in supporting the certification process ndash auditing buildings and identifying strategies to improve performance ndash the city has partnered with industry to offers technicians resources training and the chance to earn credentials as official implementing agents of the SBPC program The certification can help auditors win new contracts and the process of training and hiring technicians to oversee the auditing and certification of buildings has generated 68 new jobs143
Reduced property and payroll taxes along with lower energy and water bills help incentivize participation The programrsquos auditing and monitoring components enable participants to closely track their personal return on investment Participation in the SBCP also leads to increased access to project financing and
accelerated permitting procedures These benefits help building owners overcome the high capital costs and limited financing options that can stall building improvements144 By lowering the demand on municipal water energy and waste management services the program also enables Mexico City to stretch its resources farther145
The SBCP includes multiple points of entry that accommodate different participantsrsquo needs Its tiered certification system allows small businesses with limited access to capital to scale up efficiency improvements over time Tenants of commercial buildings can obtain certification for the space that they rent or lease In multi-family properties certifications can apply to either specific building sections common areas or the entire building These options help counter the challenge of ldquosplit incentivesrdquo between building tenants and owners in which a building owner worries that savings from lower energy costs will flow to the tenant while a tenant avoids investing in improving efficiency since the resulting increases in property value will largely benefit the owner146 Continuing to tailor outreach and incentives to different audiences ndash and in particular to small and medium enterprises ndash will be a key next step for the city147
The program also increases the transparency of the building marketplace Domestic or international corporations seeking green office space or industrial facilities may consult a list of SBCP participants Certified office buildings have garnered ldquogreen premiumsrdquo of around 20 in their rental yields148 as companies seek to meet their own sustainability commitments or harness the benefits of green buildings
The SBCP is part of a complementary mix of reforms and incentives aimed at greening the cityrsquos building sector Mexico City leads by example covering 21949 square meters of schools hospitals and public buildings with green roofs and conducting audits for efficiency retrofits at 19 public buildings149 150 151 In June 2016 Mexico Cityrsquos Ministry of Environment updated building codes including guidance on materials for construction equipment and design to enable more energy-efficient buildings This dramatic shift from the previous regulations which did not account for energy efficiency could reduce buildingsrsquo energy use up to 20152 Through platforms such as the Building Efficiency Accelerator the city continues to engage a wide range of stakeholders to develop strategies that foster efficient buildings 153 Voluntary initiatives like the SBCP help generate support for more comprehensive policies and will play an important role in accelerating their uptake
TAKING THE LEAD IN GREEN AND SUSTAINABLE BUILDINGS | MEXICO | MEXICO CITY
CASE STUDIES g
brings solar power to some
50000 homes clinics schools
and businesses
benefits over
250000 people
creates
450 jobs in Nigeria
aims to reach
10million installations
by 2022
reduces businesses fuel costs by at least
75
Initiative AccomplishmentsMTN Mobile Electricity Solynta
Current situationNigeriarsquos 7500 MW power supply lags behind the estimated
170000 MW demand costing the region 2-4 of its annual GDP
make up
9 out of 10 Nigerian businesses and contribute over 46 of the nationrsquos GDP
spend some
35 trillion Naira (US $97 billion) each year on generator fuel
R Small and medium enterprises
GDP
32
About the initiative Private companies are making solar energy accessible and affordable helping to meet the vast demand for reliable energy access across Nigeriarsquos cities
LAGOS
C H A P T E R 3
About the City
Population (metro area)
GDP
Land Area
16 millioncxli
US $136 billioncxlii
9996 km2 cxliii
IN RELATION TO SDGS
33
Solar companies are piloting innovative ways of making solar energy accessible and affordable meeting Nigeriarsquos enormous market and vast need for energy The Renewable Energy Association of Nigeria estimates that 15 MW of solar PV has been installed across the country with the potential to harness 40 ndash 65 kWh per square mile each day154 These installations reflect the diversity of energy needs across Africarsquos largest country In Lagos a solar school built through a partnership between architecture firm NLE Works the United Nations and the Heinrich Boll Foundation floats in the Makoko neighborhoodrsquos lagoons providing a gathering place for 100 children155 Consistent Energy Limited has focused on winning business from the same cityrsquos stylists signing up an estimated 200 barber shops for pay-as-you-go solar systems156
The private sector has been instrumental in deploying and demonstrating the feasibility of distributed solar energy systems The solar start-up Lumos Global for instance has partnered with Nigerian mobile provider MTN to bring solar power to over 50000 homes clinics schools and businesses benefiting over 250000 people and creating 450 jobs157 This partnership MTN Mobile Electricity aims to reach 10 million installations by 2022158
Working with Nigeriarsquos largest mobile provider ndash MTN captures about 39 of the countryrsquos mobile market share159 ndash makes solar power accessible MTN Mobile Electricity operates through MTNrsquos well-established marketing and distribution channels selling eighty-watt systems small enough to fit on the back of a motorcycle through approximately 300 MTN locations160 Customers pay for solar service through SIM cards which most citizens already use or have access to161 Unlike many East African countries such as Kenya Uganda and Tanzania where pay-as-you-go solar models have taken off the infrastructure and use of mobile money in many West African countries remains nascent162 Finding a quick and convenient way for customers to pay for solar systems without relying on mobile money bank accounts or credit cards marks a major step towards the wider growth of the market
From MTNrsquos perspective its partnership with Lumos Global helps it set itself apart from its competitors Offering a unique service ndash the ability to purchase solar energy ndash reduces every mobile companyrsquos greatest worry that its customers will switch to another provider Expanding access to reliable energy also makes it easier for customers to charge and use mobile phones163
The pay-as-you-go model employed by MTN Mobile Electricity and a wide range of companies operating in Nigeria helps customers overcome scarce access to financing so that upfront costs do not prevent them from taking advantage of longer term savings164 Pay-as-you-go solar companies also act in many ways as financial service providers reaching customers that
might otherwise be overlooked due to a lack of credit history This payment models mimic the diesel and kerosene payments customers are familiar with but deliver greater value for the money Lumos estimates that the cost of running a diesel generator for two hours is equivalent to the cost of running their solar system for a day165 Solynta which offers pay-as-you-go along with lease-to-own and direct purchase options has found that switching to solar reduces business fuel costs by at least 75166 Solar panels can last for 20 years extending these savings far into the future167
Solar energyrsquos lower costs could unleash additional economic development in Nigeria where customers spened between US $10 ndash 13 billion on kerosene and diesel fuels each year168 Bottlenecks in accessing power cost the country 2-4 of its GDP each year slowing economic growth jobs and investment169 Small and medium-sized enterprises which make up nine out of ten Nigerian businesses and contribute over 46 of the nationrsquos GDP are especially affected by a lack of access to reliable electricity spending some 35 trillion Naira (US $97 billion) each year on generator fuel170 For many business owners access to more reliable power translates into the ability to expand their services grow their businesses and create more jobs171
By illustrating the benefits of solar power to customers investors and the national government companies have helped accelerate its uptake Education and outreach efforts have introduced solar systems to new audiences172 Demonstration projects have overcome reputational challenges tied to poorly constructed solar options in earlier markets173 174
Demonstrating the demand for solar energy is also unlocking urgently needed finance Sixteen companies supported by pound2 million from the Solar Nigeria Programme delivered small solar light and power systems to 170000 Nigerian households during 2016 alone By 2020 the initiative aims to reach 5 million homes175 In addition to partnerships with philanthropic agencies and impact investors solar companies are increasingly attracting their own investment176 Lumos Global for instance raised a record US $90 million in 2016177 a hopeful signal that solar companies will continue accelerating the delivery of clean reliable energy
SCALING UP THE SOLAR MARKET | NIGERIA | LAGOS
CASE STUDIES g
34
C H A P T E R 3
32 GLOBAL 250 GREENHOUSE GAS EMITTERS A NEW BUSINESS LOGICNon-state actors especially the private sector will play a critical
role in addressing climate change and reducing Greenhouse Gas
(GHG) emissions Indeed the 250 companies178 referenced in this
report along with their value chains account for approximately
one third of global annual emissions179 For years the management
teams in many large organizations have recognized the future
constraints that climate change could pose on their business
operations and outlook While many have deferred making a
strategic shift toward a low carbon future others have recognized a new business logic a historic opportunity for innovation that drives sustainable growth and competitive advantage
The good news is that some companies in the Global 250 such as Total Ingersoll Rand Toyota Iberdrola and Xcel Energy are diversifying and decarbonizing their business models Their plans begun a decade or more ago have proven business results and provide a pathway to a profitable low carbon future that
Table 1 Companies in the Global 250 include the Top 15180 (listed below) which alone account for about 10 of global annual emissions181 and therefore play crucial roles in our global transition to a low carbon economy182
Rank (2015) Company
GHG Emissions Metric Tons CO2e (Scope 1+2+3)
GHG Index
Revenues Index
Decoupling Index
Employment Index
2016 2015 2014 Baseline 2014 =100
Baseline 2014 =100
Baseline 2014 =100
Baseline 2014 =100
1 Coal India 2014314687 1869412290 108 105 97 961
2 PJSC Gazprom 1247624306 1264855340 99 106 107 1049
3 Exxon Mobil Corporation 1096498615 1145083349 96 66 69 976
4 Thyssenkrupp AG 950917000 954185140 954085140 100 95 96 964
5China Petroleum
amp Chemical Corporation
874153506 901550000 97 71 74 979
6 Rosneft OAO 835868134 829849040 101 94 93 952
7 Cummins Inc 805343388 813043062 920001660 88 91 104 1015
8 PETROCHINA Company Limited 730924555 688790000 106 76 71 976
9 Royal Dutch Shell 734160000 698868219 735119000 100 55 56 979
10 Rio Tinto 668246000 669751731 652023000 102 71 69 854
11 China Shenhua Energy 643832223 733109000 88 70 80 1030
12 Korea Electric Power Corp 634243789 666588494 95 103 110 207
13 Total 469545000 581900000 598400000 78 60 77 1019
14 Petroacuteleo Brasileiro SA ndash Petrobras 544200903 547476491 618399435 88 84 95 851
15 United Technologies Corporation 401518529 530627775 530803247 76 99 131 957
Notes 1) 2014 scope 3 emissions data for Thyssenkrup AG and United Technologies Corporation vary significantly from 2015 scope 3 data therefore the change in scope 1+2 emissions between 2015 and 2014 is used in conjunction with Thyssenkrup AGrsquos and United Technologies Corporationrsquos respective 2015 scope 3 emisssions data to determine scope 3 emissions values for 2014
2) indicates a Decoupling Index that is susceptible to fossil fuel commodity prices
35
GLOBAL 250 GREENHOUSE GAS EMIT TERS g
stretches to 2050 and beyond Looking at the Global 250 evidence is accumulating that companies who demonstrate leadership toward a decarbonize economy gain strategic advantages
CASE STUDY OF TOTAL GROUP183
Now letrsquos take a closer look at one firmrsquos journey to decarbonize operating in a very challenging business sector fossil-fuel based energy
Francersquos Total SA (Total)184 is the fourth largest publicly held oil and gas company in the world The firm is responsible for GHG emissions that place it 13th on our list of major emitters Total is today widely recognized as a leader among major fossil fuel companies for its vision of a new clean energy future and its progress on adapting a large complex business for that future
Understanding the complex process of strategy-driven business transformation requires a framework to connect actions to outcomes over the long-term The model presented here was adapted from previous work (Lubin amp Esty The Sustainability Imperative HBR 2010) to assess a firmrsquos progress in transitioning along a ldquoclimate impact management maturity curverdquo Totalrsquos climate related efforts can be traced back 20 years or more and this historical review begins with their initial recognition of the challenges that climate change poses for a major energy company and the need to address them
Stage 1 Initial Engagement ndash In 2006 Total was one of the first major fossil fuel companies to publicly acknowledge the importance of climate change as a global risk Their initial efforts focused on implementing cost-effective approaches to significantly reduce flaring gas emissions
Stage 2 Systematic Management ndash By 2008 Total lead other major oil companies in systematic reporting of GHG and climate-related performance metrics including product use and included initial target setting for improvements in the companyrsquos operational footprint
Stage 3 Transforming the Core ndash In 2009 Total launched EcoSolutions its low carbon products and services portfolio With
a series of investments in SunPower (solar) Saft (battery design) Stem (energy optimization) and BHC Energy (operational energy efficiency) Total committed to shifting its revenue base toward sustainable energy solutions
Approaching Stage 4 Creating Competitive Differentiation ndash In 2014 under the leadership of Patrick Pouyanne Totalrsquos new Chairman and CEO the company fully articulated its strategy to differentiate itself from other oil companies Going forward Total would build its future business on three strategic pillars
1) Reducing the carbon intensity of its fossil fuel product mix
2) Investing judiciously in carbon capture utilization and storage technologies and
3) Expanding its business base in ldquorenewablesrdquo which includes production storage and the distribution of clean energy and biofuels
In 2015 Total exited the coal business Totalrsquos 2016 reorganization now drives a focus on renewables and low carbon energy solutions setting policy support and goals aligned with the IPCCrsquos 2degC target
If Total is to realize the full potential of its competitive advantage in the energy sector it will need to continue to demonstrate viable decarbonization pathways consistent with the 2-degree boundary This will require continued rapid growth of its EcoSolutions portfolio revenues and leadership among the oil companies as they address the potential challenge of so called ldquostranded assetsrdquo
LEADERSHIP TRANSLATES INTO REDUCED GHG IMPACTSThe data show leadership Total has reduced emissions over the last three years well ahead of IPCC guidance with an approximate 20 aggregate decline (or roughly 130 million metric tons) in total GHG emissions across all scopes185 While emissions declined Totalrsquos carbon intensity saw a 92 average annual rate of decline in GHGBOE (greenhouse gas emissionsbarrel of oil equivalent) between 2013 and 2016 or a cumulative decline of 275 from the baseline year of 2013186 Both aggregate emissions and the GHG intensity of Totalrsquos footprint are falling significantly
LEADERSHIP REFLECTED IN FINANCIAL OUTCOMES REDUCED COST OF CAPITALTable 2 provides evidence that Totalrsquos strategy along with their ability to execute it is already generating value for the firm Thomson Reutersrsquos Eikon platform displays Totalrsquos peer-leading credit rating represented by the blue dot in the peer-scatterplot below This is a significant advantage in the capital-intensive energy sector As Total continues to extend its climate impact leadership with more renewable and low carbon solutions the increasing value of its transformed green product portfolio is likely to significantly outpace the potential declining value of its traditional high carbon products
36
The full ldquoGlobal 250 Report A New Business Logicrdquo provides answers to the following questions as a changing climate disrupts markets and ecosystems
1) Who are the 250 public companies and value chains which are responsible for the largest emissions of greenhouse gases
2) Among this critical group how are emissions trending by company over the past 3 years
3) Is there evidence that decarbonization creates a drag on financial performance or a premium
4) Given the long-term transformation challenge confronting these large emitters how can we assess a companyrsquos progress and define leadership
5) How are policy and investor leadership evolving in a post-carbon economy
The report will be available at httpsblogsthomsonreuterscomsustainability
The case studies featured in this chapter highlight the diverse benefits that renewable energy and energy efficiency activities generate These projects have catalyzed economic growth across all levels of development creating opportunities for small construction firms and multinational companies In improving air quality reducing pollution expanding energy access and creating jobs RE and EE efforts move the world closer to the
2030 Agendarsquos Sustainable Development Goals Continued action across both developed and developing countries will also be vital to meeting the Paris Agreementrsquos targets and protecting these development gains Partnerships among cities regions companies civil society and national governments can help leverage these actorsrsquo respective strengths to further accelerate the development of RE and EE solutions
GLOBAL 250 GREENHOUSE GAS EMIT TERS gC H A P T E R 3
C CC CCC B BB BBB A AA AAAAgency Rating Average
Model Implied Rating
AAA
AA
A
BBB
BB
B
CCC
CC
C
This section has been contributed by ldquoDavid Lubin Constellation Research and Technology John Moorhead BSD Consulting Timothy Nixon Thomson Reuters
Table 2 Credit ratings among Total and its leading competitors showing Totalrsquos competitive advantage on this metric
Source Starmine Thomson Reuters Eikon
PEER COMPARISON EDIT PEERS
RIC Company Name Model Score Probability of Default
Model Implied Rating
Agency Component Scores
SampP Moodylsquos
Structural Model
SmartRatios Model
Text Mining Model
TOTFPA Total SA 75 005 A+ A+- 71 47 51
RDSbL Royal Dutch Shell PLC 63 006 A A+- 60 39 27
ENIMI Eni SpA 37 011 BBB BBB+Baa1 39 12 29
BPL BP PLC 33 012 BBB A-A1 39 7 43
REPMC Repsol SA 49 009 A- BBB-Baa2 53 18 30
STLOL Statoil ASA 37 011 BBB A+- 36 16 16
GALPLS Galp Energia SGPS SA 80 004 A+ -- 51 79 75
CVXN Chevron Corp 72 005 A+ AA-Aa2 87 37 50
Peer Avg 56 008 BBB+ A-A3 55 32 40
15degC- AND 2degC-COMPATIBIL IT Y gC H A P T E R 4
Mexico City Mexico
Mexico City is greening its building sector through a combination of policy incentives and reforms
R Details see page 30
15degC- AND 2degC-COMPATIBILITY A NEW APPROACH TO CLIMATE ACCOUNTING4 This chapter outlines a new approach that can be used to determine the compatibility of policies individual projects and entire sectors with scientific scenarios that limit global temperature rise to 15degC and 2degC It provides sector-level compatibility tables and project-level guidance and demonstrates how these criteria could be applied to individual RE and EE projects Applying these compatability conditions to internationally supported RE and EE projects can help identify and develop specific policy recommendations to create the local and national conditions necessary for 15degC and 2degC-compatible pathways
38
The final chapter of the 1 Gigaton Coalition 2016 report ldquoChapter 6 A Path Forward New Concepts for Estimating GHG Impactsrdquo suggested an alternative approach to assessing climate outcomes at the project and sector levels In addition to the problematic exercise of developing a counterfactual baseline (ie a business-as-usual scenario reflecting what would have happened in the absence of specific policy intervention or technology adoption) national governmentsrsquo Paris pledges or nationally-determined contributions (NDCs) often overlap with other actions within countries making it difficult to attribute specific emissions reductions to partner-supported activities
For renewable energy (RE) projects evaluating whether a technology or policy is compatible with science-based 15degC and 2degC scenarios can be straightforward A wind farm for instance that offsets equivalent fossil-fuel based emissions from grid electricity would be 2degC-compatible Energy efficiency (EE) projects are less straightforward a certified zero energy house under the passive house standard is for example more in line with 2degC development than an energy efficient house that just exceeds current building standards Secondary effects however will also need to be taken into consideration If a bioenergy project leads to adverse land use effects and increased emissions through deforestation then this project may not be in line with a 2degC pathway These significant secondary effects may not be captured using the GHG emissions reductions accounting method employed in the first two 1 Gigaton Coalition reports
This chapter outlines a new approach that can be used to determine the compatibility of policies individual projects and entire sectors with scientific scenarios that limit global temperature rise to 15degC and 2degC Drawing from other research initiatives and the International Energy Agencyrsquos (IEA) 2017 Energy Technologies Perspective (ETP) report this chapter presents criteria for 15degC and 2degC-compatibility at the sector level It also demonstrates how these criteria could be applied to RE and EE projects drawing examples from the RE and EE database compiled for this report Creating 15degC- and 2degCcompatibility conditions and applying these standards to internationally supported RE and EE projects opens the door for researchers to make key inferences and conclusions including
g Evaluation of local and national conditions necessary for 15degC and 2degC-compatible pathways
g Determination of additional efforts needed to make projects 15degC and 2degC compatible
g Development of specific policy recommendations to address project- and sectorlevel issues that create 15degC and 2degC-incompatibilities
g Sector level aggregation of emissions outcomes and resulting policy implications
41 DEVELOPING 15degC AND 2degC-COMPATIBILITY CONDITIONSA growing community of scientists researchers and policymakers have begun to develop metrics to assess sectors companies projects and policies for their compatibility with global climate targets The Climate Action Tracker (CAT) a scientific analysis produced by three independent research organizations ndash NewClimate Institute Ecofys and Climate Analytics ndash last year produced a list of ten short-term global targets that sectors need meet in order to limit warming to 15degC These goals include building no new coal-fired power plants and reducing emissions from coal by 30 by 2025 ending the production of fossil fuel cars by 2035 constructing only fossil-free or near-zero energy buildings and quintupling renovation rates of existing structures by 2020 and achieving 100 renewable energy penetration in electricity production by 2050187
Earlier this year CAT joined forces with a consortium of other research groups convened by former UNFCCC chair Christiana Figueres to produce an analysis of five of the heaviest emitting sectors The resulting report called ldquo2020 The Climate Turning Pointrdquo and published under the collaborativersquos name ldquoMission2020rdquo isolates short-term sectoral targets that are necessary to meet the long-term 2degC climate goal Giving context to CATrsquos list of ten sectoral targets the Mission2020 report shows that these targets are achievable under current conditions and that meeting them would produce desirable economic and human health outcomes188
Sector-level targets are key tools for governments and policymakers to plan assess and implement climate actions in reference to 15degC or 2degC goals Applying global sectoral objectives at the project level however requires another layer of analysis that incorporates a host of local considerations Factors
C H A P T E R 4
39
15degC- AND 2degC-COMPATIBIL IT Y g
pertaining to a localityrsquos policies economy development level energy mix and deployed technologies need to be examined in order to develop appropriate and rigorous goals that are compatible with 15degC or 2degC pathways
Science Based Targets (SBT) is a leading international initiative that strives to assess the complex conditions that determine 2degC compatibility at the firm or project level helping private companies set their own science-based climate targets A collaboration of the Climate Disclosure Project (CDP) United Nations Global Compact World Resources Institute (WRI) and World Wildlife Fund (WWF) and with technical support from Ecofys SBT aims to institutionalize climate target setting among firms in every sector SBT considers GHG emission reduction targets to be ldquoscience-basedrdquo if they align with a level of decarbonization that the international scientific community has deemed necessary to keep global temperature rise below 2degC Using at least one of SBTrsquos seven methods for setting emission targets 293 companies have applied to have their climate benchmarks verified of which SBT has approved 61 firmsrsquo science-based targets
The NewClimate Institute has also pioneered 2degC-compatibility methods and in November 2015 published a report ldquoDeveloping 2degC-Compatible Investment Criteriardquo in which the authors outline a methodology for investors to evaluate whether their investments are compatible with a science-based 2degC scenario189 Distilling complex science and policy issues into easy-to-understand ldquopositiverdquo and ldquonegativerdquo lists NewClimate shows how investors could apply a compatibility approach to the projects they finance Employing positive and negative lists that use quantitative and qualitative conditions to determine a project or sectorrsquos climate compatibility offers some relative advantages to a counterfactual baseline approach
A positive and negative list approach incorporates minimum and dynamic quantitative benchmarks giving clear markers of
2degC-compatibility and how these thresholds change over time This process can also include decision trees and scoring methodologies that help lay-persons use the compatibility method Central to creating positive and negative lists are the conditions that must be met to classify a project to either side Developing these conditions requires the distillation of complex information into a malleable and understandable format This balance of complexity and practicability is perhaps the compatibility approachrsquos greatest strength190
To develop meaningful compatibility conditions and positive and negative lists requires robust and current science The IEArsquos Energy Technology Perspectives 2017 (ETP) provides the scientific backbone for this reportrsquos compatibility criteria as it also does for SBTrsquos analytical tools191 ETP features three scenarios through the year 2060 a Reference Technology Scenario (RTS) representing energy and climate commitments made by countries including Nationally Determined Contributions (NDCs) pledged under the Paris Agreement a 2degC Scenario (2DS) and a Beyond 2degC Scenario (B2DS) which feature rapid decarbonisation measures creating pathways that align with long-term climate goals RTS illustrates explicit international ambitions which do not produce emissions reductions compatible with stated global climate objectives RTS would nonetheless represent a large emissions cut from a historical ldquobusiness as usualrdquo scenario 2DS and B2DS are centered around 2degC and 175degC pathways respectively and depict scenarios in which clean energy technologies are pushed to practical limits These scenarios align with some of the most ambitious aspirations outlined in the Paris Agreement
This report synthesizes current research on climate compatibility and incorporates targets from ETPrsquos 2DS and B2DS to create sector-level 15degC- and 2degC-compatibility criteria and conditions Demonstrating how one could apply these conditions to RE and EE initiatives graphical and flow-chart schematics are provided
40
for guidance and an example project is drawn from a database of bilateral- and multilateral-supported projects that was compiled for this report The challenges inherent to this approach are discussed as well as how one might overcome these issues and the policy implications of results
In May of 2017 the 1 Gigaton Coalition convened a meeting of climate policy experts in Bonn Germany initiating a dialogue to inform the development of 15degC- and 2degC compatibility criteria Dialogue participants evaluated questions prepared by this reportrsquos authors and discussed research challenges This section strives to address all of the most pertinent issues that came to the fore through the Bonn dialogue Many of the challenges inherent to 15degC- and 2degC-compatibility are addressed in Tables 31 ndash 315 below and potential methods for tackling those beyond the scope of this analysis are discussed
Sector-level 15degC- and 2degC-compatibility tables were developed The tables are categorized by sector including by RE technology type and various sectors that are grouped under EE a broad categorization encompassing transportation buildings and industry Sectors are divided into sub-sectors where data availability allowed There are clear science-based targets for instance for rail shipping and aviation allowing the creation of compatibility criteria for these transportation sub-sectors The tables do not represent every societal sector ndash agriculture for example is missing as is hydropower The compatibility analysis is therefore limited to this projectrsquos research scope as well as to the availability of scientific information The tables are tools for assessing 15degC- and 2degC compatibility and they are also proofs of concept that can and should be expanded upon to the limits of current scientific knowledge
The compatibility conditions in each table were largely drawn from the IEArsquos ETP 2017 and its 2DS and B2DS models ETPrsquos sectoral targets were cross-referenced with other scientific sources and were in some cases altered according to the researcherrsquos judgement It should be noted that ETPrsquos 2DS and B2DS models correspond to a 50 percent chance of limiting temperature increases to 2degC and 175degC respectively by the year 2100 This level of uncertainty carries over to the compatibility tables and should inform the perspective of those undertaking any science-based compatibility approach In this analysis the 15degC sectoral targets do not correspond precisely to 15degC of warming The 15degC conditions are rather aspirational targets that align with a level of warming at least 025degC below 2degC It would imply a false level of certainty to assert that the emissions targets and warming trajectories in this analysis precisely align with 15degC or 2degC of warming There are also drawbacks inherent to using one report ETP as the backbone of the analysis The compatibility conditions are however based on the most current and robust science available and it is believed they provide the best estimate for 2degC and below 2degC pathways
42 COMPATIBILITY TABLES
Key factors to consider when reading the sectoral Compatibility Tables (Tables 31 ndash 315)
g All compatibility conditions must be met for a sector to be positive listed (ie compatible)
g Yet the suites of conditions in this analysis do not mean to be comprehensive there may be other conditions or a suite of conditions that must be met under alternative 15degC and 2degC scenarios
g 15degC compatibility conditions are inclusive of 2degC conditions unless otherwise noted
g 15degC and 2degC compatibility conditions are combined for some sectors depending on data availability ndash this analysis does not distinguish between 15degC and 2degC compatibility in these cases
g Enabling policies are considered to be required for positive listing except in instances in which effective proxy policies are in place
g Conditions are considered met when sectors firms or policies demonstrate alignment with long-term global targets See Figures 7 ndash 10 for illustrations of this alignment
C H A P T E R 4
41
15degC- AND 2degC-COMPATIBIL IT Y g
Renewable Power Aggregate
Compatibility Conditions Enabling Policies
2degC
RE accounts for 72 of global energy mix by 2060
Electricity accounts for ~35 final energy demand by 2060
$61 trillion cumulative investment to decarbonize power sector ndash 23 of this investment in non-OECD countries
$34 trillion of investment goes to renewable power generation technologies (tripling of annual average)
Early retirement of coal-fired power plants
Annual investment in transmission doubles by 2025 compared to 2014 gt2000 GW transmission capacity deployed by 2060
Large-scale RampD and deployment of electricity storage technologies
RampD and deployment of carbon negative technologies including BECCS which achieves 2 share of electricity generation by 2060
Deployment of comprehensive demand-side management systems
Variable renewable energy integration with natural gas baseload systems
Triple investment in interconnected high-voltage transmission from 2015 levels by 2025
Power sector achieves near-full decarbonization by 2050
Carbon pricing
Renewable power investment incentives
Transparent disclosure of climate vulnerability to investors and stakeholders
Policies promoting systemic integration
Retirement of coal-fired power facilities
Shift of investment priorities from coal-fired power to renewables natural gas and CCS technologies
15degC
Accounts for 75 of energy mix by 2060
1000 PWh cumulative RE electricity generation through 2060
Electricity accounts for gt40 final energy demand by 2060 Power sector achieves full decarbonization by 2050 and is carbon negative thereafter
CCS systems account for gt10 of total electricity production by 2050 (including BECCS)
BioEnergy with CCS achieves 4 share of electricity generation by 2060
Nuclear has 15 share of electricity generation by 2060
Table 31 Renewable energy-powered electricity production aggregate sector-level 15degC- and 2degC-compatibility conditions
42
C H A P T E R 4
Renewable Power Sectors Compatibility Conditions Enabling Policies
SOLAR
Photovoltaics (PV) Achieves 17 of energy mix by 2060
gt1000 TWh of annual power produced by 2025
4400 GW capacity by 2050 6700 GW capacity by 2060
4x increase in annual capacity additions by 2040
Investment costs for GW capacity decrease by two-thirds by 2060 compared to 2015
$11 trillion cumulative investment through 2060
Carbon pricing
Renewable power investment incentives
Transparent disclosure of climate vulnerability to investors and stakeholders
Policies promoting systemic integration
Retirement of coal-fired power facilities
Shift of investment priorities to from coal-fired power to renewables natural gas and CCS technologies
Solar Thermal Achieves 10 energy mix by 2060
160 TWh of annual power produced by 2025
Increased deployment for industrial applications
$6 trillion cumulative investment through 2060
WIND
20 of energy mix by 2060
Onshore 2400 TWh annual power produced by 2025
Offshore 225 TWh annual power produced by 2025
10500 TWh produced by 2060
3400 GW capacity by 2050
4200 GW capacity by 2060
Investment costs per GW capacity decrease by ~18 compared to 2015
$11 trillion cumulative investment through 2060
BIOENERGY
24 of energy mix by 2060
Energy output doubles to around 145 EJ by 2060
Increased integration of advanced biomass with industrial processes
100 sustainably sourced by 2060
Net negative carbon source by 2060
GEOTHERMAL
220 TWh annual power produced by 2025
Increased integration with industrial processes
Table 32 Renewable energy-powered electricity production disaggregated sector-level 15degC- and 2degC-compatibility conditions
43
15degC- AND 2degC-COMPATIBIL IT Y g
Industry Aggregate Compatibility Conditions Enabling Policies
2degC
Global direct emissions from industry are halved by 2060
Immediate adoption of ISO-certified energy management system (EMS)
Industrial energy consumption growth limited to 03 annually (~90 decrease from 2000 - 2014 average)
~30 improvement in industrial energy intensity by 2060
Demonstrated BAT implementation
Portion of fossil fuel sources declines by gt4 annually through 2030
Shift toward higher proportion of renewables-powered electrification (on- and off-site) as end-use energy source
Improved material yields across supply chain improved inter-industry material efficiencies
Energy and material efficiency standards
Policies that improve scrap collection and recycling rates
Incentives for BAT adoption
Remove fossil fuel subsidies
Catalyzing investment for RampD and commercialization of new technologies
Improve data reporting and collection
Carbon pricing
Large scale shifts in investment
Develop advanced life-cycle assessments for industrial inputs and products
15degC
Global direct emissions from industry are reduced by 80 by 2060
Industrial energy consumption growth limited to 02 annually (gt90 decrease from 2000 ndash 2014 average)
gt30 improvement in industrial energy intensity by 2060
Demonstration of zero- and negative- carbon technologies
Proportion of fossil fuel sources declines by gt7 annually through 2030
Electrification in industrial operations increases ~27 by 2060 and electrical power use is 98 decarbonized by 2060 compared with present levels
Table 33 Industry aggregate sector-level 15degC- and 2degC-compatibility conditions
44
C H A P T E R 4
Industry Cement Compatibility Conditions Enabling Policies
2degC
Direct carbon intensity decreases by ~10 by 2030
10 carbon captured by 2030 towards 30 captured by 2060
Diminished use of coal as source of energy for cement production so coal is lt50 of energy mix by 2060
Increase use of cement clinker substitution materials
Energy and material efficiency standards
Policies that improve scrap collection and recycling rates
Incentives for BAT adoption
Remove fossil fuel subsidies
Catalyzing investment for RampD and commercialization of new technologies
Improve data reporting and collection
Carbon pricing
Large scale shifts in investment
Develop advanced life-cycle assessments for industrial inputs and products
15degCDirect carbon intensity decreases by gt20 by 2030
25 carbon captured by 2030 towards gt75 captured by 2060
Diminished use of coal as source of energy for cement production so coal is one-third of energy mix by 2060
10 reduction in clinker ratio by 2060
Table 34 Industry cement disaggregated sector-level 15degC- and 2degC-compatibility conditions
Industry Iron and Steel Compatibility Conditions Enabling Policies
2degC
30 reduction in CO2 intensity of crude steel production by 2030 compared with 2014
Aggregate energy intensity of crude steel production reduced by 25 by 2030 compared with 2014 levels
gt10 carbon captured by 2025 towards 40 captured by 2060
50 of energy used for crude steel production is from electricity natural gas and sources other than coal by 2060
Improved metal scrap reuse and recycling towards 100 end-use scrap recycling
Energy and material efficiency standards
Policies that improve scrap collection and recycling rates
Incentives for BAT adoption
Remove fossil fuel subsidies
Catalyzing investment for RampD and commercialization of new technologies
Improve data reporting and collection
Carbon pricing
Large scale shifts in investment
Develop advanced life-cycle assessments for industrial inputs and products15degC
gt90 reduction in annual emissions by 2060
50 reduction in CO2 intensity of crude steel production by 2030 compared with 2014
Aggregate energy intensity of crude steel production reduced by one-third by 2030 compared with 2014 levels
gt20 carbon captured by 2025 towards 80 captured by 2060
gt50 of energy used for crude steel production is from electricity natural gas and sources other than coal by 2060
Table 35 Industry iron and steel disaggregated sector-level 15degC- and 2degC-compatibility conditions
45
15degC- AND 2degC-COMPATIBIL IT Y g
Industry Chemicals and Petrochemicals
Compatibility Conditions Enabling Policies
2degC
Annual emissions lt 1 GtCO2 in 2060
Depending on chemical produced emissions intensity decrease by between ~15 and 40 by 2030
Reduced aggregate energy intensity amount reduced depends on energy expenditure on CCS
gt15 carbon captured by 2025 towards 30 captured by 2060
Waste plastic recycling increases to gt40 by 2060
Energy and material efficiency standards
Policies that improve scrap collection and recycling rates
Incentives for BAT adoption
Remove fossil fuel subsidies
Catalyzing investment for RampD and commercialization of new technologies
Improve data reporting and collection
Carbon pricing
Large scale shifts in investment
Develop advanced life-cycle assessments for industrial inputs and products
15degCAnnual emissions decrease by 70 from 2015 levels by 2060 (reaching ~320 Mt CO2)
Depending on chemical produced emissions intensity decrease by between ~25 and 60 by 2030
gt25 carbon captured by 2025 towards 90 captured by 2060
Table 36 Industry chemicals and petrochemicals disaggregated sector-level 15degC- and 2degC-compatibility conditions
Industry Pulp and Paper Compatibility Conditions Enabling Policies
2degC
CO2 intensity is cut by ~40 by 2030 and reduced by ~75 by 2060 compared to 2014 levels
28 reduction in energy intensity by 2060 compared to 2014 levels
Deployment of Best Available Technologies (BAT) as well as low-carbon and CCS technologies
Substitute heat biomass and electricity for fossil fuel energy supply
66 end-use paper product recycling by 2060
Energy and material efficiency standards
Policies that improve scrap collection and recycling rates
Incentives for BAT adoption
Remove fossil fuel subsidies
Catalyzing investment for RampD and commercialization of new technologies
Improve data reporting and collection
Carbon pricing
Large scale shifts in investment
Develop advanced life-cycle assessments for industrial inputs and products
15degCCO2 intensity is cut in half by 2030 and reduced by gt90 by 2060 compared to 2014 levels
30 reduction in energy intensity by 2060 compared to 2014 levels
66 end-use paper product recycling by 2060
Table 37 Industry pulp and paper disaggregated sector-level 15degC- and 2degC-compatibility conditions
46
C H A P T E R 4
Industry Buildings Compatibility Conditions Enabling Policies
2degC
Specific building energy use between 10 - 150 kWhm2 or under 4 MWhperson
15 annual improvement in building envelope performance
Limit global energy demand to 130 EJ
Shift to electrification to supply ~70 of final energy consumption in buildings globally by 2060
Renewables (on- and off-site) supply gt85 of final energy consumption by 2060
Shift to BAT electric heat pumps in temperate climates
Aim to achieve 350 efficiency improvement in cooling equipment and 120 efficiency improvement for heating equipment with further improvements through 2060
Immediate scaling up to 3 renovation rate (global average)
Retrofits improve energy intensity by at least 30 with plan to move to ldquonear-zerordquo energy use
Mix of policy and financial incentives and requirements for energy efficient construction deep renovations and BAT uptake
Strong Mandatory Energy Performance (MEP) targets for all buildings and financial penalties for substandard performance
Upfront financial incentives (eg rebates tax breaks guaranteed loans)
Comprehensive support for BATs
Special emphasis given to heating and cooling demand efficiency in cold and hot climates respectively
In countries with large portion of 2060 building stock to be new construction MEPs integrated efficiency policies and incentives for near-zero energy building construction (nZEBs) are given weight
In countries with large portion of 2060 building stock already built renovation policies are given weight
Integrated urban planning that encompasses construction that increasing building lifetime and reducing secondary and tertiary emissions
Policies designed to develop a robust market for high-efficiency building construction renovations and BAT uptake
15degC
Specific building energy use under 35 MWhperson
Decrease energy demand by around 02 annually through 2060 to around 114 EJ
Shift to electrification to supply ~70 of final energy consumption in buildings globally and near total elimination of fossil power
Renewables supply gt95 of final energy consumption
Immediate scaling up to 5 renovation rate (global average)
Retrofits improve energy intensity by at least 50 with plan to move to ldquonear-zerordquo energy use
Table 38 Buildings aggregate sector-level 15degC- and 2degC-compatibility conditions
47
15degC- AND 2degC-COMPATIBIL IT Y g
Transportation Aggregate Compatibility Conditions Enabling Policies
2degC
54 GHG reductions by 2060 compared to 2015 (75 in OECD countries 29 in non-OECD countries)
Move toward electrification biofuels and full decarbonization by 2060
Efficiency improvements (systemic technological material and fuel) that reduce life-cycle energy intensity by more than half
Intermodal shifts (eg replace aviation with high speed rail)
Regulatory GHG targets at national and international level
Fuel technological and material efficiency standards
Mandates and financial incentivessupport for BAT adoption
Elimination of fossil fuel subsidies
Carbon pricing and fuel taxes
Regulations and financial incentives supporting transition to zero-emission vehicles and electrification of transport modes
Alternative fuel development and technological RampD
Demand management
Intermodal and systemic planning
RampD support for zero- and negative-emission technologies and infrastructure
Systemic data collection and organization on policy effectiveness
15degC
83 GHG reductions by 2060 compared to 2015 (95 in OECD countries 72 in non-OECD countries)
Table 39 Transportation aggregate sector-level 15degC- and 2degC-compatibility conditions
Transportation Bus Compatibility Conditions Enabling Policies
2degCLarge-scale adoption of electric engines and other zero-emission technologies
Implementation of negative cost efficiency measures including technological upgrades
Intermodal shifts from light-duty vehicles (LDV) to buses
Passenger kilometers more than double through 2060
Regulatory GHG targets at national and international level
Fuel technological and material efficiency standards
Mandates and financial incentivessupport for BAT adoption
Elimination of fossil fuel subsidies
Carbon pricing and fuel taxes
Alternative fuel development and technological RampD
Regulations and financial incentives supporting transition to zero-emission vehicles and electrification of transport modes
Demand management
Intermodal and systemic planning
RampD support for zero- and negative-emission technologies and infrastructure
Systemic data collection and organization on policy effectiveness
15degC
80 energy efficiency improvement by 2060 (urban)
47 energy efficiency improvement by 2060 (intercity)
Passenger kilometers nearly triple through 2060
Table 310 Transportation Bus disaggregated sector-level 15degC- and 2degC-compatibility conditions
48
C H A P T E R 4
Transportation Rail Compatibility Conditions Enabling Policies
2degCFull electrification by 2060
Passenger kilometers more than triple through 2060
Intermodal shifts from aviation and LDV to high-speed rail and light rail
Railrsquos share of transport activities increases from 10 to 15
Regulatory GHG targets at national and international level
Fuel technological and material efficiency standards
Mandates and financial incentivessupport for BAT adoption
Elimination of fossil fuel subsidies
Carbon pricing and fuel taxes
Regulations and financial incentives supporting transition to zero-emission vehicles and electrification of transport modes
Demand management
Intermodal and systemic planning
RampD support for zero- and negative-emission technologies and infrastructure
Systemic data collection and organization on policy effectiveness
15degC
100 light rail electrification by 2045
Passenger kilometers increase sixfold through 2060
Railrsquos share of transport activities about doubles from ~10 to ~20
Table 311 Transportation Rail disaggregated sector-level 15degC- and 2degC-compatibility conditions
Transportation Aviation Compatibility Conditions Enabling Policies
2degC
15degC
50 reduction from 2005 levels by 2050
70 reduction in direct emissions by 2060 without offsets
Shift to ~70 advanced biofuels by 2060
25 annual reduction in specific energy use per passenger kilometer
Intermodal shifts away from aviation toward high speed rail
Regulatory GHG targets at national and international level
Fuel technological and material efficiency standards
Mandates and financial incentivessupport for BAT adoption
Elimination of fossil fuel subsidies
Carbon pricing and fuel taxes
Regulations and financial incentives supporting transition to zero-emission vehicles and electrification of transport modes
Alternative fuel development and technological RampD
Demand management
Intermodal and systemic planning
RampD support for zero- and negative-emission technologies and infrastructure
Systemic data collection and organization on policy effectiveness
Table 312 Transportation Aviation disaggregated sector-level 15degC- and 2degC-compatibility conditions
49
15degC- AND 2degC-COMPATIBIL IT Y g
Transportation Shipping Compatibility Conditions Enabling Policies
2degC
Steady emissions through 2030
25 emissions reduction through 2060
28 annual reduction in specific energy use per tonne kilometer through 2060
62 improvement over 2010 levels in energy per efficiency by 2060 (except only 53 for container ships)
Continuous ship capacity growth through 2060 container ships 09 bulk carriers 04 general cargo 06 (annual rates)
Regulatory GHG targets at national and international level
Fuel technological and material efficiency standards
Mandates and financial incentivessupport for BAT adoption
Elimination of fossil fuel subsidies
Carbon pricing and fuel taxes
Regulations and financial incentives supporting transition to zero-emission vehicles and electrification of transport modes
Alternative fuel development and technological RampD
Broad retrofit program
Demand management
Intermodal and systemic planning
RampD support for zero- and negative-emission technologies and infrastructure
Systemic data collection and organization on policy effectiveness
15degC
Emissions reductions beginning in 2020 50 reductions through 2060
Shift to 50 advanced biofuels by 2060
Table 313 Transportation Shipping disaggregated sector-level 15degC- and 2degC-compatibility conditions
Transportation Trucking Compatibility Conditions Enabling Policies
2degC78 reduction in road freight emissions by 2060 compared to 2015
Ultra-low and zero-carbon engines achieve majority share in global trucking fleet by 2050
Large-scale logistics and vehicle utilization improvements
Regulatory GHG targets at national and international level
Fuel technological and material efficiency standards
Mandates and financial incentivessupport for BAT adoption
Elimination of fossil fuel subsidies
Carbon pricing and fuel taxes
Regulations and financial incentives supporting transition to zero-emission vehicles and electrification of transport modes
Demand management
Intermodal and systemic planning
RampD support for zero- and negative-emission technologies and infrastructure
Systemic data collection and organization on policy effectiveness
15degC
gt78 reduction in road freight emissions by 2060 compared to 2015
gt20 energy supplied by low-carbon fuels by 2060 with complimentary zero-emission technologies
Table 314 Transportation Trucking disaggregated sector-level 15degC- and 2degC-compatibility conditions
50
43 PROJECT-LEVEL COMPATIBILITYAssessing project level compatibility with 15degC- and 2degC goals is a significantly more challenging task than establishing sector level targets To determine an individual project firm or policyrsquos compatibility with global climate goals requires greater subjectivity than do appraisals of sectors as one must consider local heterogeneity ndash a mix of factors that high-level targets do not specifically address Actions are undertaken at the local level and a compatibility analysis strives to link these actions with all their particularities to global phenomena Development level is perhaps the most challenging local factor to account for
Every project or policy takes shape in a particular development context with financial economic technological and knowledge barriers that can vary greatly from country to country and case to case Development trajectories also differ greatly depending on locality and these trajectories are crucially important to determining 15degC- and 2degC-compatibility pathways Reconciling climate goals with national and international development priorities is a critical component of 15degC- and 2degC-compatibility analyses and this process remains a difficult hurdle for many countries to overcome
C H A P T E R 4
Transportation Light-Duty Vehicles
Compatibility Conditions Enabling Policies
2degC30 fuel efficiency improvement in all new cars in OECD countries by 2020
50 fuel efficiency improvement in all new cars globally by 2030
50 fuel efficiency improvement in all cars globally by 2050
Regulatory GHG targets at national and international level
Fuel technological and material efficiency standards
Mandates and financial incentivessupport for BAT adoption
Elimination of fossil fuel subsidies
Carbon pricing and fuel taxes
Regulations and financial incentives supporting transition to zero-emission vehicles and electrification of transport modes
Policies that increase cost of ownership of petroleum LDVs and decrease cost of ownership of zero-emission LDVs
Demand management
Intermodal and systemic planning
RampD support for zero- and negative-emission technologies and infrastructure
Systemic data collection and organization on policy effectiveness
15degC
gt50 of LDVs are non-combustion engine vehicles by 2050
90 of all cars are plug-in hybrids
All new vehicles by 2030 will have fuel efficiency equal to 4 litres per 100 km (in accordance with the Worldwide harmonized Light vehicles Test Procedure (WLTP))
40 of all new vehicles of all kinds are ldquoultra-lowrdquo or ldquozero emissionrdquo by 2030
13 of new LDVs are PEVs in OECD and China by 2020 32 by 2030
gt70 of all energy use by LDVs is electric by 2060
Electric driving share for plug-in hybrid electric vehicles (PHEVs) increase to 50 by 2020 and 80 by 2030
Table 315 Transportation Light-duty vehicles disaggregated sector-level 15degC- and 2degC-compatibility conditions
51
15degC- AND 2degC-COMPATIBIL IT Y g
Figures 7 - 10 present a suite of schematics that illustrate how a project firm policy sector or nation could demonstrate 15degC- and 2degC-compatibility and become positive listed In this analysis complete access to information ndash on project inputs and operations for instance ndash is prerequisite for any policy project or entity to be positive listed In the schematics nations sectors and projects employing best available technologies (BATs) and producing output at or near maximum efficiency are considered ldquohigh efficiencyrdquo and are held to stricter conditions than ldquolow efficiencyrdquo activities Nations and sectors with adequate resources ndash including all OECD countries and sectors therein ndashwould be required to have in place a plan for resource sharing with less developed countries sectors and project implementers in order to achieve positive listing Precise resource sharing levels would have to be determined on a case by case basis requiring climate policy experts and scientists to facilitate international cooperation These schematics underscore the importance of both quantitative and qualitative criteria when determining 15degC- and 2degC compatibility Rather than supplanting human judgment this exercise shows the need for subjective decisionmaking as most project and sectoral compatibility hinges on transparent and actionable planning as well as complex cross-sector interactions that are not captured in this reportrsquos tables and schematics
Compatibility metric (eg Carbon Intensity)
206020302017
Current global average
Project A inDevelopingCountry B
Project X inDevelopingCountry Y
2030 Global Target
2060 Global Target
Year
Figure 6 Graphical schematic showing how projects of the same type in separate development contexts could achieve 15degC- or 2degC-compatibility
Source Authors 1 Gigaton Coalition Report 2017
52
Note that sectors in high efficiency developed national contexts would have to exceed global targets to be positive listed thereby balancing out less efficient sectors in developing countries
All nations or sectors that currently meet or exceed global targets would have to demonstrate a transparent actionable plan to share resources with those not currently meeting global targets in order to be positive-listed
C H A P T E R 4
YESNO
NONO
NO
YESNO
YESYES
YES
Meets global targets Exceeds global targets
Transparent actionableplan to meetexceed 2030 targets
Transparent actionable plan for resource sharing
Conditional positive listed Positive listed
Negativelisted
Negative listed
Resource sharing
Low Efficiency High Efficiency
Sector Nation X
Figure 7 Decision tree schematic that could inform whether a sector or nation is positive listed for 15degC- or 2degC-compatibility
Characterized by low income and rapid development trajectory limited use of BATs
53
Note that projects in high efficiency developed national contexts would have to exceed global targets to be positive listed thereby balancing out low efficiency projects in developing countries
15degC- AND 2degC-COMPATIBIL IT Y g
YESNO
NO
YESNO
YES
Meets sector targets Exceeds sector targets
Transparent actionableplan to meetexceed 2030 targets
Conditional positive listed Positive listed
Low Efficiency High Efficiency
Project Policy X
Negativelisted
Figure 8 Decision tree schematic that could inform whether a project or policy is positive listed for 15degC- or 2degC-compatibility
Characterized by low income and rapid development trajectory limited use of BATs
54
With more than $15 billion in approved funding this project is jointly supported by the World Bankrsquos Clean Technology Fund (CTF) administered via the Asian Development Bank (ADB) a CTF loan the Agence Franccedilaise de Deacuteveloppement (AFD) the European Investment Bank (EIB) the French governmentrsquos Direction Geacuteneacuterale du Treacutesor and the Vietnamese governmentrsquos counterpart funds The project is classified as ldquolow efficiencyrdquo due to its developing nation context and its locationrsquos general lack of public transit With plans to meet daily demand of 157000 passengers by 2018 and 458000 passengers by 2038 ADB estimates that the project will mitigate an average of 33150 tCO2e annually through 2038 These demonstrable goals are considered to meet the sector-level 15degC- and 2degC-compatibility conditions for rail (see Table 110) particularly the passenger kilometers (pkm) metrics (threefold pkm increase for 2degC-compatibility and sixfold pkm increase for 15degC-compatibility) With no MRT currently running in Hanoi this project is a massive improvement on the status quo especially considering Vietnamrsquos status as a low-income nation192
C H A P T E R 4
NO
NO
YESNO
YES
YESMeets sector targets Exceeds sector targets
Transparent actionableplan to meetexceed 2030 targets
Conditional positive listed Positive listed
Negative listed
Low Efficiency High Efficiency
Mass Rapid Transit in Hanoi Viet Nam
ADB CTF AFD EIB French and Vitnamese Governments
Figure 9 A recently-approved Mass Rapid Transit (MRT) project based in Hanoi was chosen for a demonstration of the decision tree schematic
55
With more than $35 million in grants from the Global Environment Facility (GEF) and UNDP and more than $63 million in public and private co-financing the Plan includes one 10 MW solar PV plant and one 24 MW wind farm as demonstration projects and has a target of achieving 30 RE penetration by 2030 This meets most of the 15degC- and 2degC-compatibility conditions for RE Solar PV and Wind power (see Tables 11 and 12) Yet this 2030 energy mix goal falls short of the global 2060 targets The Tunisian Solar Plan fits well within the sectorrsquos enabling policies goal and considering Tunisiarsquos status as a low-income nation this project is conditionally positive listed as 15degC- and 2degC-compatible This initiative however is a prime example of a policy ripe for positive influence and aid from funders and outside governments Considering Tunisiarsquos rich solar and wind resources the countryrsquos national plan should be expected to incorporate a greater mix of RE in the long term193
15degC- AND 2degC-COMPATIBIL IT Y g
YES
NO
YESNO
YES
NOMeets sector targets Exceeds sector targets
Transparent actionableplan to meetexceed 2030 targets
Conditional positive listed Positive listed
Negative listed
Low Efficiency High Efficiency
Support for the Tunisian Solar Plan Tunisia
GEF UNDP
Figure 10 Approved in 2013 a project supporting the development of the Tunisian Solar Plan was chosen for a demonstration of the decision tree schematic
C H A P T E R 5
5 Building from a custom 600-project database compiled for the second 1 Gigaton Coalition report this report has expanded the analysis to assess 273 of these projects including 197 renewable energy (RE) 62 energy efficiency (EE) and 14 classified as having both RE and EE components With implementation dates ranging from 2005 through 2016 the projects are found in 99 countries Of the 273 projects 100 are supported by 12 bilateral institutions and firms in 10 different countries and another 173 projects are supported by 16 multilateral development banks and partnerships Project-level data were collected from these organizations including information on assistance levels energy capacity energy savings supported technologies and impact evaluation methodologies The resulting database was not intended to include all of the developing worldrsquos RE and EE efforts but instead exhibits a representative cross-section of bilateral- and multilateral supported projects
DATABASE ASSESSMENT
Valle De Cauca Colombia
Across Colombialsquos Valle del Cauca region entrepreneurs are transforming their firms into green businesses
R Details see page 28
57
DATABASE ASSESSMENT g
After a historic year in 2015 when global investments in renewable energy (RE) projects reached a record high of $286 billion new investment in renewables (excluding large hydro) fell to $242 billion in 2016 In developed economies new investments decreased by 14 to $125 billion while in developing economies they went down by 30 to $1166 billion194 The decrease in investment is explained by two main factors First solar photovoltaics onshore wind and offshore wind saw more than 10 decreases in average dollar capital expenditure per capacity These technologies have become more cost-competitive Second financing slowed in China Japan and some emerging markets Across different renewable technologies solar capacity additions rose from 56 GW to a historic-high 75 GW while wind capacity additions slowed down to 54 GW compared to 63 GW in 2015 Overall the total amount of new capacity installed increased from 1275 GW in 2015 to a record 1385 GW in 2016 For two years in a row renewable power comprised more than half of the worldrsquos added electric generation capacity Investment in energy efficiency also rose 9 to $231 billion in 2016195
Bilateral and multilateral development aid organizations have for decades played a key role in energy projects in developing countries196 From 2004 to 2014 development institutions in OECD countries financed more than US $247 billion for RE and EE projects in developing nations Bilateral development finance institutions such as Norwayrsquos Norfund and bilateral government agencies such as Japan International Cooperation Agency (JICA) are the vehicles for state-sponsored foreign investments Multilateral development banks (MDBs) including the Asian Development Bank (ADB) and European Investment Bank (EIB) have joined forces to finance RE and EE projects throughout the developing world investing more than US$100 billion from 2004 - 2014 according to OECD estimates197 These groups also build policy and administrative capacity among governments and businesses in recipient countries According to OECD estimates they invested US $47 billion in energy policy and administrative management in 2014 more than any other recipient sector besides electricity transmission and distribution198
51 AGGREGATED IMPACTThis section seeks to build on the 1 Gigaton Coalition 2016 Report and update the evaluation of emissions impact of bilateral- and multilateral-supported RE and EE projects in developing countries implemented from 2005 ndash 2016199 Project-level data were collected from organizations including information on assistance levels energy capacity energy savings supported technologies and impact evaluation methodologies The resulting database was not intended to include all RE and EE efforts in developing countries but instead exhibited a representative cross-section of bilateral- and multilateral-supported projects
Despite the harmonized framework for calculating GHG emissions savings from RE and EE projects that International Financial Institutions (IFIs) agreed upon in 2015 current aggregate GHG impact data are incomplete to accurately assess these effortsrsquo total effects200 The new frameworkrsquos influence has extended beyond Multilateral Development Banks (MDBs) and has been incorporated by as many bilateral groups Yet the framework is still not detailed enough to provide sufficient methodological information to meet the criteria for this analysis Organizations generally describe how their aggregate estimates attribute reductions from projects with multiple supporters and despite the harmonised framework calculation assumptions may vary widely from project to project Project-level research is therefore needed to overcome these issues
Communications with aid organization representatives and extensive desk research yielded sufficient information on 197 RE 62 EE projects and 14 REEE projects for calculating GHG emissions impact estimates The project-by-project emissions reductions estimates were made using a common calculation method that accounts for Scope 1 emissions (see Annex)
The supported projects on energy efficiency and renewable energy have significant impact on greenhouse gas emissions
g The analyzed sample of internationally supported RE and EE projects in developing countries will reduce emissions by approximately 0258 gigatons carbon dioxide (GtCO2)
The projects encompass every sector taken into evaluation for 15degC- and 2degC compatibility including wind and solar power generation geothermal small hydro and biomass energy efficiency in buildings rapid public transit systems electric vehicle deployment electricity transmission industrial efficiency and other sub-sectors The sample of internationally supported RE and EE projects in developing countries will reduce emissions by approximately 258 million tons carbon dioxide (MtCO2) annually in 2020 Total emissions reductions from internationally supported RE and EE projects from 2005 through 2015 could be up to 600 MtCO2e per year in 2020 if the samplersquos emissions reductions are scaled up to a global level using total bilateral and multilateral support figures for RE and EE (US $76 billion)
Mt CO2yr
0
800
600
400
200
1000
1200
1400
1600
2020
Year theprojects are
financed
2019
2018
2017
2005ndash
2016
Mitigation impact in 2020
CO2
Figure 12 Emission reductions in 2020 from scaled up public mitigation finance for RE and EE projects
Source Authors 1 Gigaton Coalition Report 2017
58
annually in 2020 The 273 analysed projects generate these emissions savings by displacing fossil fuel energy production with clean energy technologies or by conserving energy in industry buildings and transportation RE projects contribute around 0085 GtCO2 EE projects contribute 0113 GtCO2e and REEE projects contribute about 0059 GtCO2 to the analysisrsquos total emissions reductions These projects received direct foreign assistance totalling US $32 billion
g Total emissions reductions from internationally supported RE and EE projects since 2005 could be up to 0600 GtCO2 per year in 2020 This estimate is derived by scaling up the analysed samplersquos emissions reductions to a global level using total multilateral and bilateral support figures for RE and EE ($76 billion between 2005 and 2016)201 International support flows to markets that are in the early stages of development where barriers to private investment have to be lifted for RE and EE finance to mature This foreign investment which includes critical support for capacity building is essential for spurring RE and EE development despite the fact that foreign support accounts for less than 10 of total RE and EE investments in developing countries
g If public finance for mitigation is scaled up through 2020 emissions would be reduced by more than 1 GtCO2 per year (Figure 12) Countries agreed to mobilize US $100 billion in total climate finance (mitigation and adaptation public and private) For this estimate we assume that a quarter of the US $100 billion is public mitigation finance
C H A P T E R 5
59
52 SELECTED BILATERAL INITIATIVESOutreach to bilateral organizations and desk research yielded detailed data on 100 projects from 12 bilateral groups in nine countries China Finland France Germany Japan The Netherlands Norway United Kingdom and the United States The eight OECD countries invested more than US $9 billion in RE power generation in developing nations from 2006 ndash 2015202 Data on Chinarsquos foreign energy investments is difficult to obtain yet it is known that China has in the past 15 years begun to invest in RE abroad China has supported at least 124 solar and wind initiatives in 33 countries since 2003 Fifty-four of these investments ndash those for which financial data is available ndash sum to nearly US $40 billion203
The bilateral groups featured in this analysis include state-owned investment funds like Norwayrsquos Norfund government-owned development banks like the China Development Bank and some are private companies operating on behalf of government ministries like GIZ in Germany The full list of bilateral organizations included in this analysis is shown in Table 4 Bilateral development groups generally mobilize public funds from national budgets to finance initiatives abroad Some groups raise capital from private markets and others use both public and private financing in their operations Development institutions finance projects via grants andor loans distributed to governments of recipient nations which in turn distribute funding to ministries local agencies and firms in charge of project implementation Promoting development abroad is central to the mission of all the groups considered in this report and the analysis focuses only on funding for RE and EE projects which may comprise a relatively small portion of a bilateral organizationrsquos total portfolio
DATABASE ASSESSMENT g
60
C H A P T E R 5
Table 4 Selected Bilateral Organizations204
Note Cells shaded grey indicates no data available
Bilateral Organization Country YearEstablished
OECD-reported National Assistance for RE and EE Development (millions current US $)205 206
Bilateral Development Organizationrsquos RE and EE Achievements
Bilateral Organizationrsquos Estimated GHG Emissions Mitigation Impact
RE and EE Investments in this Analysis (millions current US $)
RE and EE Projects in this Analysis2015
2005ndash2015 (cumulative)
Agence Franccedilaise de Deacuteveloppement (AFD) France 1998 401 2533 AFDrsquos supported projects installed 1759 MW of REProjects financed from 2013 ndash 2015 abate 114 Mt CO2 annually207 1850 30
China Development Bank and China Exim Bank
China 1994 1000208 549 4
Department for International Development (DFID)International Climate Fund (ICF)
UK 19972011 59 359DFID and ICF supported projects with 230 MW of RE capacity already installed and 3610 MW of RE capacity expected over the projectsrsquo lifetime
Supported RE projects have achieved 66 Mt CO2 abatement209 207 4
Danida Denmark 1971 2 151Danida has allocated more than 1604 million DKK to projects on natural resources energy and climate changes in developing countries between 2016 and 2020
108 5
FinnFund Finland 1980 20 226US $168 million invested in ldquoEnergy and Environmental developmentrdquo from 2011 ndash 2015210 40 2
FMOThe
Netherlands1970 38 521
Established its climate investment fund Climate Investor One (CIO) in 2014 which will develop approximately 20 RE initiatives and build 10 more RE projects with cumulative 1500 MW capacity These efforts will create 2150000 MWh of additional clean electricity production and bring electricity access to approximately 6 million people
CIO aims to achieve an annual avoidance of 15 MtCO2 emissions through the 10 RE projects it builds210
189 3
Deutsche Gesellschaft fuumlr Internationale Zusammenarbeit GmbH (GIZ)212
Germany 2011 954 9899
Since 2005 GIZrsquos EE programs have achieved energy savings equal to the annual energy consumption of more than one million German households GIZ has also distributed energy-saving cookstoves to more than 10 million people GIZ currently has 39 active RE projects in developing countries with more than $480 million invested in this sector213
7 2
KfWDEG Germany 19481962DEGrsquos supported RE initiatives have an estimated annual production of 8000000 MWh equivalent to the annual consumption of approximately 9 million people
KfWrsquos supported 2015 EE projects produce an estimated 15 MtCO2eyear and its supported 2015 RE projects generate an estimated 25 MtCO2eyear though it should be noted that these projects include large hydropower and biomass plants214
1007 9
Japan International Cooperation Agency (JICA)
Japan 1974 204 4807Committed in 2014 to support RE projects with total capacity of 2900 MW
JICA supported RE projects are expected to reduce emissions by 28 MtCO2year (does not include supported EE projects)215
4726 30
NorFund Norway 1997 27 883
Supported RE projects in Africa Asia and Americas have a total installed capacity of 4800 MW with 600 MW more currently under construction These RE projects produced 18500000 MWh in 2015 alone
Norfundrsquos supported RE projects reduced emissions by an estimated 74 MtCO2 in 2015209
39 11
Overseas Private Investment Corporation (OPIC)
USA 1971 244 763In 2015 committed nearly $11 billion to RE in developing countries marking the fifth year in a row that its investments in RE have topped $1 billion217
666 5
All OECD countries 1949 21142
61
DATABASE ASSESSMENT g
Bilateral Organization Country YearEstablished
OECD-reported National Assistance for RE and EE Development (millions current US $)205 206
Bilateral Development Organizationrsquos RE and EE Achievements
Bilateral Organizationrsquos Estimated GHG Emissions Mitigation Impact
RE and EE Investments in this Analysis (millions current US $)
RE and EE Projects in this Analysis2015
2005ndash2015 (cumulative)
Agence Franccedilaise de Deacuteveloppement (AFD) France 1998 401 2533 AFDrsquos supported projects installed 1759 MW of REProjects financed from 2013 ndash 2015 abate 114 Mt CO2 annually207 1850 30
China Development Bank and China Exim Bank
China 1994 1000208 549 4
Department for International Development (DFID)International Climate Fund (ICF)
UK 19972011 59 359DFID and ICF supported projects with 230 MW of RE capacity already installed and 3610 MW of RE capacity expected over the projectsrsquo lifetime
Supported RE projects have achieved 66 Mt CO2 abatement209 207 4
Danida Denmark 1971 2 151Danida has allocated more than 1604 million DKK to projects on natural resources energy and climate changes in developing countries between 2016 and 2020
108 5
FinnFund Finland 1980 20 226US $168 million invested in ldquoEnergy and Environmental developmentrdquo from 2011 ndash 2015210 40 2
FMOThe
Netherlands1970 38 521
Established its climate investment fund Climate Investor One (CIO) in 2014 which will develop approximately 20 RE initiatives and build 10 more RE projects with cumulative 1500 MW capacity These efforts will create 2150000 MWh of additional clean electricity production and bring electricity access to approximately 6 million people
CIO aims to achieve an annual avoidance of 15 MtCO2 emissions through the 10 RE projects it builds210
189 3
Deutsche Gesellschaft fuumlr Internationale Zusammenarbeit GmbH (GIZ)212
Germany 2011 954 9899
Since 2005 GIZrsquos EE programs have achieved energy savings equal to the annual energy consumption of more than one million German households GIZ has also distributed energy-saving cookstoves to more than 10 million people GIZ currently has 39 active RE projects in developing countries with more than $480 million invested in this sector213
7 2
KfWDEG Germany 19481962DEGrsquos supported RE initiatives have an estimated annual production of 8000000 MWh equivalent to the annual consumption of approximately 9 million people
KfWrsquos supported 2015 EE projects produce an estimated 15 MtCO2eyear and its supported 2015 RE projects generate an estimated 25 MtCO2eyear though it should be noted that these projects include large hydropower and biomass plants214
1007 9
Japan International Cooperation Agency (JICA)
Japan 1974 204 4807Committed in 2014 to support RE projects with total capacity of 2900 MW
JICA supported RE projects are expected to reduce emissions by 28 MtCO2year (does not include supported EE projects)215
4726 30
NorFund Norway 1997 27 883
Supported RE projects in Africa Asia and Americas have a total installed capacity of 4800 MW with 600 MW more currently under construction These RE projects produced 18500000 MWh in 2015 alone
Norfundrsquos supported RE projects reduced emissions by an estimated 74 MtCO2 in 2015209
39 11
Overseas Private Investment Corporation (OPIC)
USA 1971 244 763In 2015 committed nearly $11 billion to RE in developing countries marking the fifth year in a row that its investments in RE have topped $1 billion217
666 5
All OECD countries 1949 21142
62
RE AND EE PROJECT DATA COLLECTION CRITERIA To be included in the analysis projects had to meet the following criteria These boundaries allowed for the calculation of each projectrsquos GHG emissions mitigation and the identification of reporting overlaps
Scope of Data
g Project location the report only considers projects in developing and emerging economies China was given special consideration as both a recipient and distributor of foreign investments
g Project focus the report only evaluates projects with an explicit RE or EE focus
g Support the report only examines projects at least partly supported by bilateral or multilateral development groups
g Timeframe the report only analyzes projects that were implemented from 2005 through 2016 Data was collected for projects that have not yet been implemented but these projects were excluded from the analysis
Types of Data
g Technology type analysis could only be performed where the technology type (for RE) or technical improvement (for EE) was given (eg solar or power system upgrade)
g Energy information To be analyzed projects had to include quantified power or capacity data This report builds on the previous 1 Gigaton Coalition reportsrsquo scope including many more RE and EE projects in its analysis RE projects employ one of only a handful of technologies with the primary goal of producing electrical power which is commonly expressed in generating capacity (MW) or power (MWh) making reporting and collecting data on these initiatives straightforward EE on the other hand is a broad classification that can refer to a multitude of different activities including initiatives that involve multiple economic sectors EE programs often involve buildings and appliances and they are also employed in industrial systems the power sector transportation and waste Any program that seeks to enhance efficiency in energy production or consumption can be considered an EE project Such an extensive classification requires a flexible methodological framework with sector-specific considerations for each project type in order to establish baselines and determine initiative outcomes (see Section 4) These complex considerations mean that EE project impacts are generally more challenging to quantify than RE project results With various types of EE programs there are varying metrics for describing project results This analysis only includes EE efforts that report energy savings resulting from project implementation a metric most often expressed in terajoules (TJ) or megawatt-hours (MWh)
C H A P T E R 5
63
DATABASE ASSESSMENT g
53 SELECTED MULTILATERAL INSTITUTIONS
Building on the data collected for the 2016 1 Gigaton Report the analysis this year includes 173 projects supported by 16 multilateral groups The multilateral institutions featured include multilateral development banks (MDBs) like the Asian Development Bank (ADB) European Investment Bank (EIB) and Inter-American Development Bank (IDB) These institutions are often intertwined as for instance the International Bank for Reconstruction and Development (IBRD) and International Finance Corporation (IFC) are both part of the extensive World Bank Group Some are affiliated with bilateral institutions such as Proparco in France which is a private sector subsidiary of the bilateral Agence Franccedilaise de Deacuteveloppement (AFD) As the name suggests multilateral development groups draw public and private funding from multiple countries to finance development initiatives throughout the world These organizations often fund projects in collaboration with each other employing multi-layered finance agreements that include grants loans and leveraged local funding
Organizational frameworks and funds that pool resources and coordinate project support among MDBs have become increasingly influential in recent years The Global Environment Facility (GEF) is perhaps the most prominent of these collaborative efforts A partnership of 18 multinational agencies representing 183 countries GEFrsquos investments support and
attract co-financing to a significant portion of the developing worldrsquos RE and EE projects218 The Climate Investment Funds (CIF) created by the World Bank in 2008 is another catalyst of MDB support CIF now consists of four programs two of which focus on developing and expanding RE in middle- and low-income countries219 These collaborations help mobilize funds and they also act as data hubs collecting information on the projects that their partners implement
MDBsrsquo collaborative approach to project finance makes double-counting individual efforts ndash ie counting individual projects more than once ndash more likely when creating an initiative database One project may have multiple groups supporting it all of whom report the initiative and its outcomes as their own This overlap means that if an analyst were to combine different sets of MDB-reported aggregated data there would be projects counted multiple times This problem of multiple attribution and double counting can debase the credibility of an otherwise sound analysis (see Section 4) With detailed project-level data on RE and EE projects this analysis is able to avoid the hazard of double-counting MDBsupported programs Any overlaps between projects in the database were discerned and appropriately addressed so that each project was only counted once Note that in Table 5 overlaps among projects from ldquoSupporting organization reportedrdquo sources are not disaggregated so these data may exhibit double counting demonstrating the difficulties of aggregating data at this level
64
C H A P T E R 5
Multilateral Firm Fund Institution or Partnership
Number of Member Countries and Structure
YearEstablished
OECD-reported Develop-ment Assistance ($ millions current USD)205 206 Supporting Organizationrsquos Reported RE and EE
Investments and ImpactsSupporting Organizationrsquos Estimated GHG Emissions Mitigation Impact
RE and EE Investments in Analysis ($ millions current USD)
RE and EE Projects in Analysis2015
2005ndash2015 (combined)
Acumen Non-profit venture fund 2001Acumen invested $128 million in breakthrough innovations and impacted 233 million lives
125 2
Asian Development Bank (ADB)
67 member countries MDB 1966 350 4227
Invested $247 billion in clean energy in 2015 (RE and EE) including 1481 GWhyear renewable electricity generation 4479 GWhyear electricity saved 37994 TJyear direct fuel saved and 618 MW newly added renewable energy generation capacity
Achieved abatement of 219 MtCO2eyear221 4390 30
African Development Bank (AfDB)
80 members MDB 1964 58 1824 43 1
Asian Infrastructure Investment Bank (AIIB)
56 countries MDB
2014 officially launched in 2016
Invested $165 million in one EE projectAchieved abatement of 16400 tCO2 per year222 165 1
European Development Fund (EDF)
EUrsquos main instrument for providing development aid to African Caribbean and Pacific (ACP) countries and to overseas countries and territories (OCTs)
1959 273 5
European Investment Bank (EIB)
28 European member states European Unionrsquos nonprofit long-term lending institution
1958As a result of $21 billion of climate lending in 2014 3000 GWh of energy was saved and 12000 GWh of energy was generated from renewable sources
Climate lending in 2014 led to avoidance of 3 MtCO2 emissions225 226 214 3
Green Climate Fund (GCF)
Established by 194 countries party to the UN Framework Convention on Climate Change in 2010 Governed by a 24-member board whose participants are equally drawn from developed and developing countries and which receives guidance from the Conference of the Parties to the Convention (COP)
2010$103 billion of support was announced by 43 state governments towards a goal of mobilizing $100 billion by 2020
Anticipated avoidance of 248 MtCO2e through 17 projects227 228 337 2
Global Environment Facility (GEF)
GEFrsquos governing structure is organized around an Assembly the Council the Secretariat 18 Agencies representing 183 countries a Scientific and Technical Advisory Panel (STAP) and the Evaluation Office GEF serves as a financial mechanism for several environmental conventions
1992 84 296
Since 1991 GEF has invested more than $42 billion in 1010 projects to mitigate climate change in 167 countries GEFrsquos investments leveraged more than $383 billion from a variety of other sources including GEF Agencies national and local governments multilateral and bilateral agencies the private sector and civil society organizations
27 billion tonnes of greenhouse gas (GHG) emissions have been removed through the GEFrsquos investment and co-financing activities around climate change mitigation from 1991 ndash 2014229
3098 76
HydroChina Investment Corp
Public company in China 2009 115 1
Table 5 Selected Multilateral Development Organizations220
Note Cells shaded grey indicates no data available
65
DATABASE ASSESSMENT g
Multilateral Firm Fund Institution or Partnership
Number of Member Countries and Structure
YearEstablished
OECD-reported Develop-ment Assistance ($ millions current USD)205 206 Supporting Organizationrsquos Reported RE and EE
Investments and ImpactsSupporting Organizationrsquos Estimated GHG Emissions Mitigation Impact
RE and EE Investments in Analysis ($ millions current USD)
RE and EE Projects in Analysis2015
2005ndash2015 (combined)
Acumen Non-profit venture fund 2001Acumen invested $128 million in breakthrough innovations and impacted 233 million lives
125 2
Asian Development Bank (ADB)
67 member countries MDB 1966 350 4227
Invested $247 billion in clean energy in 2015 (RE and EE) including 1481 GWhyear renewable electricity generation 4479 GWhyear electricity saved 37994 TJyear direct fuel saved and 618 MW newly added renewable energy generation capacity
Achieved abatement of 219 MtCO2eyear221 4390 30
African Development Bank (AfDB)
80 members MDB 1964 58 1824 43 1
Asian Infrastructure Investment Bank (AIIB)
56 countries MDB
2014 officially launched in 2016
Invested $165 million in one EE projectAchieved abatement of 16400 tCO2 per year222 165 1
European Development Fund (EDF)
EUrsquos main instrument for providing development aid to African Caribbean and Pacific (ACP) countries and to overseas countries and territories (OCTs)
1959 273 5
European Investment Bank (EIB)
28 European member states European Unionrsquos nonprofit long-term lending institution
1958As a result of $21 billion of climate lending in 2014 3000 GWh of energy was saved and 12000 GWh of energy was generated from renewable sources
Climate lending in 2014 led to avoidance of 3 MtCO2 emissions225 226 214 3
Green Climate Fund (GCF)
Established by 194 countries party to the UN Framework Convention on Climate Change in 2010 Governed by a 24-member board whose participants are equally drawn from developed and developing countries and which receives guidance from the Conference of the Parties to the Convention (COP)
2010$103 billion of support was announced by 43 state governments towards a goal of mobilizing $100 billion by 2020
Anticipated avoidance of 248 MtCO2e through 17 projects227 228 337 2
Global Environment Facility (GEF)
GEFrsquos governing structure is organized around an Assembly the Council the Secretariat 18 Agencies representing 183 countries a Scientific and Technical Advisory Panel (STAP) and the Evaluation Office GEF serves as a financial mechanism for several environmental conventions
1992 84 296
Since 1991 GEF has invested more than $42 billion in 1010 projects to mitigate climate change in 167 countries GEFrsquos investments leveraged more than $383 billion from a variety of other sources including GEF Agencies national and local governments multilateral and bilateral agencies the private sector and civil society organizations
27 billion tonnes of greenhouse gas (GHG) emissions have been removed through the GEFrsquos investment and co-financing activities around climate change mitigation from 1991 ndash 2014229
3098 76
HydroChina Investment Corp
Public company in China 2009 115 1
continue next page
66
C H A P T E R 5
Table 5 Selected Multilateral Development Organizations220 (continued)
Multilateral Firm Fund Institution or Partnership
Number of Member Countries and Structure
YearEstablished
OECD-reported Develop-ment Assistance ($ millions current USD)205 206 Supporting Organizationrsquos Reported RE and EE
Investments and ImpactsSupporting Organizationrsquos Estimated GHG Emissions Mitigation Impact
RE and EE Investments in Analysis ($ millions current USD)
RE and EE Projects in Analysis2015
2005ndash2015 (combined)
International Finance Corporation (IFC)
184 member countries 1946 422 2394 95 2
Inter-American Development Bank (IDB)
48 MDB 1959 588 3959 134 4
The BRICS New Development Bank
5 MDB
July 2014 (Treaty
signed)July 2015
(Treaty in force)
Invested $911 million in RE projects in 2016 equaling 1920 MW in capacity
These investments are expected to avoid 3236 MtCO2eyr
911 5
ProparcoPublic-Private European Development Finance Institution based in France
1977Proparcorsquos supported RE projects 2013 ndash 2015 have a combined capacity of 175 MW 695 MW in 2015 alone
Proparcorsquos 2015 investments have reduced emissions by an estimated 0876 MtCO2e231
344 10
World Bank
189 member countries The World Bank Group is comprised of five multilateral finance organizations including IBRD and IFC as well as The International Development Association (IDA) The Multilateral Investment Guarantee Agency (MIGA) The International Centre for Settlement of Investment Disputes (ICSID)
1944 1092 8801
In 2015 the World Bank catalysed $287 billion in private investments and expanded renewable power generation by 2461 MW
588 MtCO2e reduced with the support of special climate instruments in 2015 1270000 in MWh in projected lifetime energy savings based on projects implemented in 2015230
504 11
Climate Investment Funds (CIF)
72 developing and middle income countries comprised of four programs including CTF and SREP as well as the Forest Investment Program (FIP) and Pilot Program Climate Resilience (PPCR) all implemented and supported by MDBs
2008 579 2132
Funding pool of $83 billion ($58 billion in expected co-financing) CIF investments of $18 billion (as of 2015) are expected to contribute to 1 GW of CSP and 36 GW of geothermal power223
10891 (including cofinance)
23
Clean Technology Fund (CTF)
72 developing and middle income countries projects implemented by MDBs
2008Fund of $56 billion with approved RE capacity of 18865 MW These projects expected to generate 70099 GWhyr
CTF investments are expected to deliver emissions reductions of 1500 MtCO2e over all projectsrsquo lifetime 20 MtCO2e have already been achieved224
13332 (including
co-finance)12
Note Cells shaded grey indicates no data available
67
DATABASE ASSESSMENT g
Multilateral Firm Fund Institution or Partnership
Number of Member Countries and Structure
YearEstablished
OECD-reported Develop-ment Assistance ($ millions current USD)205 206 Supporting Organizationrsquos Reported RE and EE
Investments and ImpactsSupporting Organizationrsquos Estimated GHG Emissions Mitigation Impact
RE and EE Investments in Analysis ($ millions current USD)
RE and EE Projects in Analysis2015
2005ndash2015 (combined)
International Finance Corporation (IFC)
184 member countries 1946 422 2394 95 2
Inter-American Development Bank (IDB)
48 MDB 1959 588 3959 134 4
The BRICS New Development Bank
5 MDB
July 2014 (Treaty
signed)July 2015
(Treaty in force)
Invested $911 million in RE projects in 2016 equaling 1920 MW in capacity
These investments are expected to avoid 3236 MtCO2eyr
911 5
ProparcoPublic-Private European Development Finance Institution based in France
1977Proparcorsquos supported RE projects 2013 ndash 2015 have a combined capacity of 175 MW 695 MW in 2015 alone
Proparcorsquos 2015 investments have reduced emissions by an estimated 0876 MtCO2e231
344 10
World Bank
189 member countries The World Bank Group is comprised of five multilateral finance organizations including IBRD and IFC as well as The International Development Association (IDA) The Multilateral Investment Guarantee Agency (MIGA) The International Centre for Settlement of Investment Disputes (ICSID)
1944 1092 8801
In 2015 the World Bank catalysed $287 billion in private investments and expanded renewable power generation by 2461 MW
588 MtCO2e reduced with the support of special climate instruments in 2015 1270000 in MWh in projected lifetime energy savings based on projects implemented in 2015230
504 11
Climate Investment Funds (CIF)
72 developing and middle income countries comprised of four programs including CTF and SREP as well as the Forest Investment Program (FIP) and Pilot Program Climate Resilience (PPCR) all implemented and supported by MDBs
2008 579 2132
Funding pool of $83 billion ($58 billion in expected co-financing) CIF investments of $18 billion (as of 2015) are expected to contribute to 1 GW of CSP and 36 GW of geothermal power223
10891 (including cofinance)
23
Clean Technology Fund (CTF)
72 developing and middle income countries projects implemented by MDBs
2008Fund of $56 billion with approved RE capacity of 18865 MW These projects expected to generate 70099 GWhyr
CTF investments are expected to deliver emissions reductions of 1500 MtCO2e over all projectsrsquo lifetime 20 MtCO2e have already been achieved224
13332 (including
co-finance)12
68
International Financial Institutions (IFIs) are banks that have been chartered by more than one country All of the MDBs featured in this report are also IFIs These institutions adopted the ldquoInternational Financial Institution Framework for a Harmonised Approach to Greenhouse Gas Accountingrdquo in November 2015 in an important step toward developing a global methodological standard for GHG accounting232 As the IFI framework gains widespread adoption there are opportunities to add specifications that would improve and further unify the methodologies The framework in its current form could provide more detailed instructions to ensure that results are reproducible This way a third-party analysis would be able to combine GHG emissions impact estimates of different projects from multiple sources Nevertheless in many instances supporting MDBs present project-level emissions mitigation estimates citing the recently harmonised framework yet without providing the precise assumptions inherent to their calculations The IFI framework is a very promising development and widespread sharing of methodological approaches is a powerful tool for catalyzing harmonization efforts
Accounting for Scope 2 and 3 emissions remains a difficult task and a near-term goal for groups financing RE and EE projects With an annual investment of US$11 billion internationally supported RE and EE initiatives in developing countries are less than 10 of total investment Yet this class of funding can have outsized effects as foreign investment leverages other financing builds capacity in local institutions and helps mainstream RE and EE project finance233 According to OECD estimates aid groups invested US$47 billion in energy policy and administrative management in 2014 more than any other recipient sector besides electrical transmission and distribution There is however no harmonized method for estimating emissions impacts from such activities Analysts from several bilateral and multilateral institutions interviewed expressed their desires to accurately measure the outcomes of capacity building efforts as well as policy and administrative aid As funding for these initiatives grow developing rigorous and harmonized ways to do this evaluation is key to fully capturing the results of foreign investments in RE and EE projects
531 MULTISTAKEHOLDER PARTNERSHIPS
In addition to bilateral and multilateral initiatives multi-stakeholder partnerships of both public and private actors also extend financial and capacity-building support to developing countries spurring innovation and new policies This section features some examples of initiatives that are operating in developing countries as models for demonstrable mitigation impact
C H A P T E R 5
wwwccacoalitionorg
Established in 2012 the Climate and Clean Air Coalition (CCAC) is a voluntary partnership uniting governments intergovernmental and nongovernmental organizations representatives of civil society and the private sector committed to improving air quality and slowing the rate of near-term warming in the next few decades by taking concrete and substantial action to reduce short-lived climate pollutants (SLCPs) primarily methane black carbon and some hydrofluorocarbons (HFCs) Complementary to mitigating CO2 emissions fast action to reduce short-lived climate pollutants has the potential to slow expected warming by 2050 as much as 05 Celsius degrees significantly contributing to the goal of limiting warming to less than 2degC
Reducing SLCPs can also advance priorities that are complementary with the 1 Gigaton Coalitionrsquos work such as building country capacity and enhancing energy efficiency For example replacing current high Global Warming Potential (GWP) HFCs with available low- or no-GWP alternatives can also improve the efficiency of the appliances and equipment that use them potentially reducing global electricity consumption by between 02 and 07 by 2050 resulting in a cumulative reduction of about 55 Gt CO2e234
Another example of this alignment is the SNAP Initiative of the CCAC which supports twelve countries to develop a national strategy to reduce short-lived climate pollutants and identify the most cost-effective pathways to large-scale implementation of SLCP measures This initiative has resulted in a number of countries including Mexico Cote drsquoIvoire Chile and Canada submitting NDCs that integrate SLCP mitigation
CLIMATE AND CLEAN AIR COALITION (CCAC)
ctc-norg
The Climate Technology Centre and Network (CTCN) delivers tailored capacity building and technical assistance at the request of developing countries across a broad range of mitigation and adaptation technology and policy sectors As the implementation arm of the UNFCCC Technology Mechanism the CTCN is a key institution to support nations in realizing their commitments under the Paris Agreement
As countries around the world seek to scale up their energy-efficient low-carbon and climate-resilient development the CTCN plays the role of technology matchmaker mobilizing a global network of technology expertise from finance NGO private and research sectors to provide customized technology and policy support Over 200 technology transfers are currently underway in 70 countries
The Centre is the implementing arm of the UNFCCC Technology Mechanism It is hosted and managed by UN Environment and the United Nations Industrial Development Organization (UNIDO) and supported by more than 340 network institutions around the world Nationally-selected focal points (National Designated Entities) in each country coordinate requests and implementation at the national level
districtenergyinitiativeorg
The District Energy in Cities Initiative is a multi-stakeholder partnership coordinated by UN Environment with financial support from DANIDA the Global Environment Facility and the Government of Italy As one of six accelerators of the Sustainable Energy of All (SEforAll) Energy Efficiency Accelerator Platform launched at the Climate Summit in September 2014 the Initiative is supporting market transformation efforts to shift the heating and cooling sector to energy efficient and renewable energy solutions
The Initiative aims to double the rate of energy efficiency improvements for heating and cooling in buildings by 2030 helping countries meet their climate and sustainable development targets The Initiative helps local and national governments build local know-how and implement enabling policies that will accelerate investment in modern ndash low-carbon and climate resilient ndash district energy systems UN Environment is currently providing technical support to cities in eight countries including Bosnia and Herzegovina Chile China India Malaysia Morocco Russia and Serbia
Since its establishment the Secretariat has been leading and coordinating the development of as well as facilitating global access to the best relevant technical information necessary to address regulatory economic environmental and social barriers to enable successful and sustainable district energy programmes
The Initiative works with a wide range of committed partners and donors Partnerships are a key enabler for combatting climate change and fostering sustainable development and are firmly embedded in the way the initiative works at global regional and national level By joining forces with other players the initiative leverages additional resources expertise and technical know-how to help countries and cities in their effort to move towards modern district energy systems
CLIMATE TECHNOLOGY CENTRE AND NETWORK (CTCN)
DISTRICT ENERGY IN CITIES INITIATIVE (DES)
69
DATABASE ASSESSMENT g
httpunited4efficiencyorg
The enlighten initiative is a public-private partnership be-tween the UN Environment and companies such as OSRAM Philips Lighting and MEGAMAN with support from the Global Environment Facility (GEF) The initiativersquos main aim is to support countries in their transition to energy efficient lighting options enlighten has taken a regional approach to standards implementation Through this method coun-tries are able to share the costs for innovation and testing centres as well as recycling and waste schemes to manage disposal of the new products (eg lights containing mercu-ry) To date the enlighten initiative accounts for over 60 partner countries with a number of ongoing regional and national activities and projects Over the next several years the enlighten initiative ndash as the lighting chapter of United for Efficiency ndash will focus its support for countries to leap-frog to LED lighting and assisting countries and cities to im-plement efficient street lighting policies and programmes
ENLIGHTEN
70
C H A P T E R 5
httpwwwglobalabcorg
The Global Alliance for Buildings and Construction (GABC) promotes and works towards a zero-emission efficient and resilient buildings and construction sector It is a voluntary international multi-stakeholder partnership serving as global collaborative umbrella organization for other platforms initiatives and actors to create synergies and increase climate action scale and impact for decarbonising the buildings and construction sector in line with the Paris Agreement goals
The GABCrsquos common objectives are
(a) Communication Raising awareness and engagement making visible the magnitude of the opportunities and impact in the buildings and construction sector
(b) Collaboration Enabling public policy and market transformation action to achieve existing climate commitments through implementing partnerships sharing technical expertise and improving access to financing
(c) Solutions Offering and supporting programmes and locally adapted solutions to achieve climate commitments and further ambitious lsquowell-below 2degC pathrsquo actions
The GABC has five Work Areas for addressing key barriers to a low-carbon energy-efficient and resilient buildings and construction sector Education amp Awareness Public Policy Market Transformation Finance and Measurement Data and Accountability
Specifically the GABC focuses on
g Working towards a common vision and goals by developing a GABC global roadmap and issuing an annual GABC Global Status Report
g Catalysing action particularly supporting and accelerating NDC implementation
g Facilitating access to and scaling-up technical assistance by coordinating membersrsquo needs with other membersrsquo capabilities and capacities
httpwwwglobalcovenantofmayorsorg
The Global Covenant of Mayors for Climate amp Energy is an international alliance of cities and local governments with a shared long-term vision of promoting and supporting voluntary action to combat climate change and move to a low emission resilient society The Covenant focuses on
g Local Governments as Key Contributors The Global Covenant of Mayors works to organize and mobilize cities and local governments to be active contributors to a global climate solution
g City Networks as Critical Partners Local regional and global city networks are core partners serving as the primary support for participating cities and local governments
g A Robust Solution Agenda Focusing on those sec-tors where cities have the greatest impact the Global Covenant of Mayors supports ambitious locally relevant solutions captured through strategic action plans that are registered implemented and monitored and publicly available
g Reducing Greenhouse Gas Emissions and Fostering Local Climate Resilience The Global Covenant of May-ors emphasizes the importance of climate change mit-igation and adaptation as well as increased access to clean and affordable energy
Created through a coalition between the Compact of Mayors and EU Covenant of Mayors the Global Covenant of Mayors is the broadest global alliance committed to local climate leadership building on the commitments of over 7477 cities representing 684880509 people and 931 of the global population
GLOBAL ALLIANCE FOR BUILDINGS AND CONSTRUCTION (GABC)
GLOBAL COVENANT OF MAYORS FOR CLIMATE AND ENERGY
71
DATABASE ASSESSMENT g
httpswwwitf-oecdorg
The International Transport Forum (ITF) at the Organisation for Economic Development and Cooperation (OECD) is an intergovernmental organization with 59 member countries The ITF acts as a think tank for transport policy and organ-ises the Annual Summit of transport ministers It serves as a platform for discussion and pre-negotiation of policy issues across all transport modes and it analyses trends shares knowledge and promotes exchange among transport de-cision-makers and civil society The ITF also has a formal mechanism through its Corporate Partnership Board (CPB) to engage with the private sector Created in 2013 to enrich global policy discussions with a private sector perspective it brings together companies with a clear international per-spective in their activities that play an active role in trans-port and associated sectors CPB partners represent com-panies from across all transport modes and closely related areas such as energy finance or technology
Together with its member countries and corporate partners the ITF has developed a wide range of projects including transport and climate change In May 2016 the ITF Decar-bonising Transport project was launched to help decision makers establish pathways to carbon-neutral mobility This project brings together a partnership that extends far be-yond the member countries of ITF There are currently more than 50 Decarbonising Transport project partners from in-tergovernmental organisations non-governmental organi-sations national governments city networks foundations universities research institutes multilateral development banks professional and sectoral associations and the pri-vate sector
wwwendevinfo
EnDev is an international partnership with the mission to promote sustainable access to modern energy services in developing countries as a means to inclusive social eco-nomic and low carbon development EnDev is funded by six donor countries Norway the Netherlands Germany Unit-ed Kingdom Switzerland and Sweden EnDev was initiated in 2005 and is currently implemented in 26 countries in Africa Asia and Latin America with a focus on least de-veloped countries EnDev promotes sustainable access to climate-smart energy services that meet the needs of the poor long lasting affordable and appreciated by users while also fulfilling certain minimum quality criteria The most widely promoted technologies are improved cook-stoves for clean cooking solar technologies for lighting and electricity supply as well as mini-grids
EnDev has a robust monitoring system which provides donors partners and management with verified data and reliable assessments By now EnDev has facilitated sus-tainable access for more than 173 million people more than 38600 small and medium enterprises and 19400 so-cial institutions In 2016 through the measures of the pro-gramme CO2 emission reductions totalled 18 million tons per year Since beginning in 2005 EnDev has contributed to avoiding more than 85 million tons of CO2 This figure is a conservative estimate it includes various deductions for sustainability additionality free riding and replacement or repeat customers The majority of the EnDevrsquos avoided emissions are generated in the cookstove sector
INTERNATIONAL TRANSPORT FORUM AT THE ORGANISATION FOR ECONOMIC DEVELOP-MENT AND COOPERATION (OECD)
ENERGISING DEVELOPMENT (ENDEV)
72
C H A P T E R 5
wwwpfannet
The Private Financing Advisory Network is one of few actors in the climate finance space addressing the barriers to success for small and medium enterprises (SME) in developing coun-tries and emerging economies ndash a shortage of bankable proj-ects on the demand side and difficulties assessing risks and a conservative lending culture on the supply side
PFANrsquos goals are to reduce CO2 emissions promote low-carbon sustainable economic development and help facilitate the tran-sition to a low-carbon economy by increasing financing oppor-tunities for promising clean energy projects PFAN accomplishes this by coaching and mentoring high-potential climate and clean energy businesses by developing a network of investors and fi-nancial institutions with an interest in and extensive knowledge of clean energy markets and by presenting to these investors projects that have been screened for commercial viability sus-tainability and environmental and social benefits
To date PFAN has raised over US $12 billion in investment for the projects in its pipeline which have led to installing and operating over 700 MW of clean energy capacity
PFAN is a multilateral public-private partnership founded by the Climate Technology Initiative (CTI) and the United Nations Framework Convention on Climate Change (UNFCCC) It has recently been relaunched under a new hosting arrangement with the United Nations Industrial Development Organization (UNIDO) and the Renewable Energy and Energy Efficiency Partnership (REEEP) Under this arrangement PFANrsquos opera-tions are set to scale by a factor of two to five by 2020
THE PRIVATE FINANCING ADVISORY NETWORK (PFAN)
wwwren21net
REN21 is the global renewable energy policy multi-stakeholder network that connects a wide range of key actors REN21rsquos goal is to facilitate knowledge exchange policy development and joint action towards a rapid global transition to renewable energy
REN21 brings together governments non-governmental or-ganizations research and academic institutions international organizations and industry to learn from one another and build on successes that advance renewable energy To assist policy decision making REN21 provides high quality information ca-talyses discussion and debate and supports the development of thematic networks
REN21 facilitates the collection of comprehensive and time-ly information on renewable energy This information reflects
diverse viewpoints from both private and public-sector actors serving to dispel myths about renewables energy and to ca-talyse policy change It does this through six product lines the Renewables Global Status Report (GSR) which is the most fre-quently referenced report on renewable energy market indus-try and policy trends Regional Reports on renewable energy developments of particular regions Renewables Interactive Map a research tool for tracking the development of renew-able energy worldwide the Global Future Reports (GFR) which illustrate the credible possibilities for the future of renewables the Renewables Academy which offers a venue to brain-storm on future-orientated policy solutions and International Renewable Energy Conferences (IRECs) a high-level political conference series
RENEWABLE ENERGY POLICY NETWORK FOR THE 21ST CENTURY (REN21)
INTERNATIONAL RENEWABLE ENERGY AGENCY (IRENA)
wwwirenaorg
The International Renewable Energy Agency (IRENA) is an intergovernmental organization that supports countries in their transition to a sustainable energy future through ac-celerated deployment of renewable energy
IRENArsquos Roadmap for a Sustainable Energy Future REmap 2030 demonstrated that doubling the share of renewable energy in the global energy mix by 2030 is both economi-cally viable and technically feasible Through its Renewable Readiness Assessments IRENA helps countries assess local conditions and prioritize actions to achieve renewable ener-gy potentials The Agencyrsquos regional initiatives such as the African Clean Energy Corridor promote the penetration of renewable electricity in national systems and renewable en-ergy cross-border trade IRENA is organizing dialogues with a broad range of stakeholders to advance specific regional concerns including efforts to strengthen renewable energy objectives in countriesrsquo NDCs
IRENA makes its data knowledge products and tools a public good so that many can benefit from the Agencyrsquos unique mandate and reach These tools include among others a Global Atlas that consolidates renewable resource potential worldwide a Project Navigator that guides the preparation of high quality project proposals and a Sus-tainable Marketplace that facilitates access to finance to scale up investments
73
DATABASE ASSESSMENT g
www4cma
The Moroccan Climate Change Competence Centre (4C Maroc) is a national capacity building platform for multiple stakeholders concerned with climate change including government entities at all levels private companies research institutions and civil society organizations 4C Maroc acts as a hub for regional climate change information
4C Maroc works to strengthen national actorsrsquo capacities in cop-ing with climate change by collecting and developing information knowledge and skills pertaining to climate change vulnerability ad-aptation mitigation and funding in Morocco It also develops tools to improve and aid decision-making regarding climate change 4C Maroc is particularly focused on creating a link between policymakers and scientists aiming to ensure that universities and research centres get necessary funding to work on topics most relevant to improving public well-being This effortrsquos goal is to enable the public sector to make the best decisions on matters relating to climate change
MOROCCAN CLIMATE CHANGE COMPETENCE CENTRE (4C MAROC)
wwwreeeporg
REEEP invests in clean energy markets to help developing coun-tries expand modern energy services improve lives and keep low-ering CO2 emissions Leveraging a strategic portfolio of high-im-pact investments REEEP generates adapts and shares knowledge to build sustainable markets for clean energy and energy efficien-cy solutions advance energy access and combat climate change in order to facilitate economic growth where it matters most
REEEP invests in small and medium-sized enterprises (SMEs) in low and middle-income countries and develops tailor- made financing mechanisms to make clean energy technology accessible and affordable to all
Market transformation is complex and multidimensional REEEP monitors evaluates and learns from its portfolio to bet-ter understand the systems we work in identify opportunities and barriers to success and lower risk for market actors The knowledge we gain is shared with government and private sec-tor stakeholders influencing policy and investment decisions
Current major projects and activities by REEEP include man-aging the Sweden-funded Beyond the Grid Fund for Zambia which is set to bring clean energy access to 1 million Zam-bians by 2021 Powering Agrifood Value Chains a portfolio of eight promising clean energy businesses in the agrifood space market-based clean energy and energy efficiency solutions for urban water infrastructure in Southern Africa and the hosting and execution of activities of the Private Fi-nancing Advisory Network PFAN (see p 72)
Founded at the 2002 World Summit on Sustainable Devel-opment in Johannesburg REEEP works in close collaboration with a range of public and private sector partners at the early stages of clean energy market development
RENEWABLE ENERGY AND ENERGY EFFICIENCY PARTNERSHIP (REEEP)
NDC PARTNERSHIP
httpwwwndcpartnershiporg
The NDC Partnership is a global coalition of countries and in-ternational institutions working together to mobilize support and achieve ambitious climate goals while enhancing sustain-able development Launched at COP22 in Marrakesh the NDC Partnership aims to enhance cooperation so that countries have access to the technical knowledge and financial support they need to achieve large-scale climate and sustainable de-velopment targets as quickly and effectively as possible and increase global ambition over time
In-Country EngagementThe Partnership engages directly with ministries and other stakeholders to assess needs and identify opportunities for collective action across sectors regions and international partners Through the Partnership members provide target-ed and coordinated assistance so that nations can effective-ly develop and implement robust climate and development plans Leveraging the skills and resources of multiple partners towards a common objective and delivering with speed is a unique value proposition that the Partnership brings
Increasing Knowledge SharingThe Partnership raises awareness of and enhances access to cli-mate support initiatives best practices analytical tools and re-sources Information to address specific implementation needs is made available through online portals as well as communities and networks that generate opportunities for knowledge sharing
GovernanceThe NDC Partnership is guided by a Steering Committee com-prised of developed and developing nations and international institutions and is facilitated by a Support Unit hosted by the World Resources Institute in Washington and Bonn The Partner-ship is co-chaired by the Governments of Germany and Morocco
74
DATABASE ASSESSMENT gC H A P T E R 5
united4efficiencyorg
The UN Environment-GEF United for Efficiency (U4E) sup-ports developing countries and emerging economies to leap-frog their markets to energy-efficient lighting appliances and equipment with the overall objective to reduce global electricity consumption and mitigate climate change High impact appliances and equipment such as lighting residen-tial refrigerators air conditioners electric motors and dis-tribution transformers will account for close to 60 percent of global electricity consumption by 2030 The rapid deploy-ment of high-energy efficient products is a crucial piece of the pathway to keep global climate change under 2degC A global transition to energy efficient lighting appliances and equipment will save more than 2500 TWh of electricity use each year reducing CO2 emissions by 125 billion tons per an-num in 2030 Further these consumers will save US $350 billion per year in reduced electricity bills
Founding partners to U4E include the United Nations Devel-opment Programme (UNDP) the International Copper Asso-ciation (ICA) the environmental and energy efficiency NGO CLASP and the Natural Resources Defense Council (NRDC) Similar to enlighten U4E also partners with private sector manufacturers including ABB Electrolux Arccedilelik BSH Haus-geraumlte GmbH MABE and Whirlpool Corporation
UNITED FOR EFFICIENCY (U4E)
SUSTAINABLE ENERGY FOR ALL (SEforALL)
UK INTERNATIONAL CLIMATE FUND
wwwseforallorg
Sustainable Energy for All (SEforALL) was launched in 2013 as an initiative of the United Nations with a focus on moving the importance of sustainable energy for all center stage Following the adoption of the SDGs SEforALL has now tran-sitioned into an international non-profit organization with a relationship agreement with the UN that serves as a plat-form supporting a global movement to support action
SEforALL empowers leaders to broker partnerships and un-lock finance to achieve universal access to sustainable ener-gy as a contribution to a cleaner just and prosperous world for all SEforALL marshals evidence benchmarks progress tells stories of success and connects stakeholders In order to take action at the scale and speed necessary SEforALLrsquos work focuses on where we can make the greatest progress in the least amount of time
httpswwwgovukgovernmentpublicationsinterna-tional-climate-fundinternational-climate-fund
In 2010 the UK established the International Climate Fund (ICF) as a cross government programme managed by BEIS DFID and DEFRA The Fund has delivered pound387 billion in Offi-cial Development Assistance between 2011 and 2016 It now has a mature portfolio of over 200 programmes with global reach working through private sector multilateral and bilat-eral channels and has committed to spending at least pound58 billion over the next five years The ICF aims to spend half of its finances on climate mitigation and half on adaptation
Up to US $90 trillion will be invested in infrastructure globally over the next 15 years in energy cities and transport Much of this will be in developing countries where the ICF will try to influence finance flows to lower carbon investments by making visible distinctive and catalytic investments that can be scaled up and replicated by others
Since 2011 the ICF has directly supported 34 million peo-ple helping them cope with the effects of climate change and improved energy access for 12 million people ICF in-vestments have also helped prevent 92 million tonnes of C02 emissions ndashand generated US $286 billion of public invest-ment and US $650 million of private investment
CONCLUSION gC H A P T E R 6
Meeting the Paris Agreementrsquos climate goals will require an immediate and worldwide shift toward decarbonizing human activities According to the IPCC global emissions will have to peak in the next few years and then rapidly decline over the following three decades approaching zero by 2050 if the world is to have a likely chance of limiting warming in line with the 15degC or 2degC goals established in the Paris Agreement The annual emissions gap however is growing and will equal 11 ndash 19 GtCO2e by 2030 unless efforts to reduce emissions dramatically ramp up Timing is crucial as the global carbon budget shrinks each year and the window of opportunity for achieving our shared climate goals narrows Emissions benchmarks that correspond with 15degC or 2degC scenarios are moving targets and if the world misses them in the short term climate trajectories would worsen and long-term goals would become more difficult to meet
Lagos Nigeria
Private companies are making solar energy accessible and affordable helping to meet the vast demand for reliable energy access across Nigeria
R Details see page 32
CONCLUSION
6
76
Renewable energy (RE) and energy efficiency (EE) initiatives are the most prominent and effective means for cutting carbon emissions while promoting sustainable economic growth As with their timing and scale the location of these efforts is crucial to achieving global climate goals Developing countries are projected to drive almost all of the worldrsquos energy demand growth this century as well as the vast majority of new buildings new modes of transportation and new industrial activity236 These countries must balance domestic development needs with global climate goals and they cannot be expected to do so without support from the rest of the world Developing countries are installing RE facilities at a record pace accounting for more than half of the nearly 140 GW of RE that came online in 2016 These nations are also developing and implementing more RE and EE policies than ever before as documented in Chapter 2 of this report
In cities and regions throughout the world governments at all jurisdictional levels are partnering with private companies to implement RE and EE programmes achieving carbon emissions reductions as well as co-benefits for their localities including enhanced environmental quality human health economic outcomes social inclusion and gender equality Section 31 of this report details six cases from various cities and regions where public-private RE and EE initiatives are proving successful These efforts are prime examples of the global movement to decouple carbon emissions from development It is challenging however for many policymakers project supporters and implementers to determine individual RE and EE projects and policiesrsquo contributions to closing the emissions gap Judging these effortsrsquo compatibility with global 15degC and 2degC scenarios is also an unchartered territory for many actors
Evaluating internationally supported RE and EE initiativesrsquo measurable emissions reductions and creating a 15degC or 2degC-compatibility framework for RE and EE sectors and projects is the focus of this report The results show that when scaled up with proposed funding figures supported RE and EE projects in developing countries could produce 14 GtCO2e in annual reductions by 2020 The compatibility framework presents a practical alternative to using counterfactual baseline scenarios to estimate an RE or EE project or sectorrsquos impacts allowing funders policymakers project implementers and other laypeople to quickly determine if a programme project or policy is 15degC or 2degC compatible and to isolate crucial determining factors of project and sector-level compatibility The compatibility analysis illustrates the need for integrated system-focused policy promoting decarbonization in every sector This means policies that link electricity generation and transmission with end-use management regulations and standards that address upstream and downstream emissions throughout supply chains and a large-scale shift of incentives away from fossil fuels and inefficient energy use towards RE sources and system-wide efficiencies
Decarbonization is occurring throughout the world as cities and other subnational jurisdictions have aligned their actions with national governments and partnered with private firms to implement innovative RE and EE programmes Public-private partnerships particularly collaborations at the subnational level are assuming an increasingly prominent role in international climate efforts and these collaborations will be a main focus at COP23 Yet these actions are not happening at the speed or scale necessary to achieve the 15degC or 2degC goals Developed countries need to transfer resources including policy and technical expertise best available technologies and financing to developing countries in order to create the enabling environments necessary for RE and EE expansion at a scale commensurate with what international climate goals demand Nations project implementers and supporting organizations must determine which policies and programmes do in fact meet the ambitious climate goals set out in the Paris Agreement while also achieving the Sustainable Development Goals (SDGs) This report provides some of the key elements that could be used to assess projects policies and initiatives according to their promotion of global climate and sustainable development objectives
Information is a key resource that is little discussed This reportrsquos 15degC or 2degC compatibility exercise finds that data transparency and information sharing are essential components of compatibility at the national sector and project levels International efforts to improve data availability need to ramp up immediately Bilateral and multilateral development organizations are among the groups best suited to catalyze these global changes This report finds that these international organizations leverage large emissions reductions for relatively small RE and EE investments These groups are shown to foster enabling environments helping to create homegrown low carbon trajectories in developing countries International development authorities now should expand their support to advance transparency and resource transfers at an ever greater scale and speed
CONCLUSION gC H A P T E R 6
77
ANNEX g
This study performed a three-step calculation to determine the GHG mitigation impact from bilateral and multilateral-supported renewable energy (RE) and energy efficiency (EE) finance in 2020
In the first step the annual emission reduction for a project number i in 2020 were calculated as follows
CO2R2020i = ESi x EFi 1where CO2R2020 i = Direct CO2 emission reduction in 2020 by project number i (tyr) ESi = Annual energy saved or substituted by project number i (MWhyr) EF i = country-specific grid electricity CO2 emission factor for project number i (tMWh)
Whenever the project capacity size was reported ESi was calculated as follows
ESi = PCi x 8760 (hoursyr) x CFi 2where PCi Capacity of project i (MW) CF i Capacity factor of project i (dimensionless)
Following this step the analysed projectsrsquo aggregate mitigation impact was scaled up to estimate the total mitigation delivered by bilateral- and multilateral-supported RE and EE projects in developing countries between 2005 and 2016 The scale-up was done by using the following equation
CO2R2020tot2005-2016 = Sj (S CO2R2020jDataset x ) 3where CO2R2020 tot2005-2016 = total mitigation in 2020 by bilateral- and multilateral-supported RE and EE projects in developing countries committed between 2005 and 2016 (MtCO2yr) CO2R2020 jDataset = CO2 emissions reduction in 2020 estimated for a project under technology category j in the dataset developed in this analysis (MtCO2yr)
FINjtot2005-2016 = total finance committed by bilateral and multilateral institutions on technology category j between 2005 and 2016 (million current USD) FINjDataset = Finance committed by a project under technology category j in the dataset developed in this
analysis (million current USD)
In the final step the analysed projectsrsquo aggregate mitigation figure was used to estimate the expected mitigation from bilateral and multilateral support that will be committed through 2020 in line with the US $100 billion global climate finance goal237
CO2R2020tot2005-2020 = Sj (S CO2R2020jDataset x ) 4where CO2Rtot2005-2020 = total mitigation in 2020 by bilateral- and multilateral-supported RE and EE projects in 2020 in developing countries committed between 2005 and 2020 (MtCO2yr)
FINjtot2015-2020 = total finance expected to be committed by bilateral and multilateral institutions on technology category j between 2015 and 2020 (million current USD)
Further details about these steps are given in the following sections CO2 emissions generated through the construction of RE facilities are excluded as these are generally less than emissions from fossil fuel power plant construction
FINjtot2005-2016
SFINjDataset
FINjtot2005-2016 + FINjtot2015-2020
SFINjDataset
ANNEX I DETAILED DESCRIPTION OF MITIGATION IMPACT CALCULATIONS
78
11 TECHNOLOGY CATEGORIZATION (J)Technologies were categorised into the following (Table 1 Categorization of renewable energy technologies) solar photovoltaic (PV) solar thermal wind (including onshore and offshore) hydro (including large medium and small) biomasswaste and geothermal The presented categorization makes it possible to develop country- technology-specific capacity factors in a consistent manner using datasets from different sources
Projects were categorized through a word search from project descriptions For projects reporting the implementation of more than one technology the category ldquomultiple renewable technologiesrdquo was used
A N N E X
12 TOTAL ANNUAL ENERGY SAVED OR SUBSTITUTED (ES)Total annual power generation by RE projects are in most cases calculated by using the power generation capacity and the technology- and country-specific capacity factors Total annual power generation values reported by supporting institutions were used only when capacity values were not available Whereas the first method included the use of the capacity factor the grid electricity CO2 emission factor and the reported project capacity the second included only the grid electricity CO2 emission factor and the reported project power
For EE projects the amount of energy saved annually reported in the project documentation was used for the calculations
Category used in this study IRENA category OECD DAC category
Solar photovoltaic Solar PhotovoltaicSolar energy
Solar thermal Concentrated Solar Power
Geothermal energy Geothermal Energy Geothermal energy
Hydropower (excluding large and medium over 50 MW capacities)
Large Hydropower
Hydro-electric power plantsMedium Hydropower
Small Hydropower
WindOffshore Wind
Wind energyOnshore Wind
Bioenergywaste
Biogas
Biofuel-fired power plantsLiquid Biofuels
Solid Biomass
Multiple renewable technologies Energy generation renewable sources ndash multiple technologies
(Not considered)Marine
Marine energyPumped storage and mixed plants
Table 1 Categorisation of renewable energy technologies
79
ANNEX g
13 CAPACITY FACTORS (CF)For efficient fossil fuel-fired power plant projects uniform capacity factor of 80 was assumed For other EE projects capacity factor values were not used for calculations because the energy consumption reduction values were taken directly from the project documentation For RE projects average capacity factors were calculated for the period 2010-2014 for individual RE technologies per country except for Concentrated Solar Power (CSP) using the installed capacity and power generation
datasets from the IRENA database238 For CSP a projected value for 2020 (33) was used drawn from the IEA Energy Technology Perspectives 2016 report239 In the absence of country-specific capacity factor data the average of all countries with values was used as a proxy For any project with multiple renewable technologies the capacity factor was defined as the mean of the capacity factor values of RE technologies involved in that particular project
14 GRID ELECTRICITY CO2 EMISSION FACTORS (EF) Grid electricity CO2 emission factors (tCO2MWh) were obtained from the Clean Development Mechanism (CDM) grid emission factors database (version 13 January 2017) published by the Institute for Global Environmental Strategies (IGES)240 Among three different emission factors the combined margin emission factors were used for both RE and EE projects Because the database only covers countries with CDM projects regional average values were used for other countries The countries that are not covered by the IGES database (by region) are
g Asia Cook Islands Kiribati Maldives Marshall Islands Myanmar Nepal Palau Reunion Samoa Solomon Islands Timor Leste Tonga and Vanuatu
g Latin America Antigua and Barbuda Barbados Dominica Guadeloupe Haiti St Lucia St Vincent and Grenadines and Suriname
g Africa Algeria Benin Botswana Burundi Cabo Verde Cameroon Chad Congo Congo DR Djibouti Equatorial Guinea Ethiopia Gambia Guinea Guinea-Bissau Liberia Lesotho Malawi Mauritania Mozambique Niger Seychelles Togo and Zimbabwe
g Middle East Iraq and Yemen
g Others Afghanistan Belarus Kazakhstan Kyrgyzstan Moldova Tajikistan Turkey
For biomass-fired power plants an attempt was made to make simplified yet robust estimates on GHG emissions resulting from bioenergy production but it was not possible due to the lack of data that can be applied to the specific set-up of each bioenergy project analysed in this study
Table 2 Country-specific average capacity factors by renewable technology
Country Solar Wind Hydro Bioenergy waste Geothermal
Range for the countries in which projects were implemented
5-20 10-36 10-84 NA 42-84
Simple average across all countries in the IRENA database
15 22 42 40 63
Average values are used as proxies
Source Calculations based on IRENA (2016)
80
15 CALCULATED MITIGATION IMPACTS FOR THE PROJECT DATASET ASSESSED IN THIS REPORTTable 3 presents total CO2 emission reductions expected in 2020 from 273 RE and EE projects per area and technology analysed in this study
16 SCALED UP MITIGATION IMPACTS USING DEVELOPMENT FINANCE COMMITMENTSTo quantify the total mitigation impact in year 2020 delivered by bilateral- and multilateral-supported RE projects implemented from 2005 - 2015 the aggregated mitigation impact for 2020 calculated for the 273 projects was scaled up using the total finance committed (in million current US dollars) in approximately the same period Data on financial commitments to renewable technology projects were obtained from the OECD Development Assistance Committee (DAC) database241 for the years 2005 to 2015 (Table 4 Total amount of development finance committed to RE projects by all supporting partners between 2005 and 2015 (million current US dollars) Note data for 2016 is not yet available at the time of writing
The OECD DAC database does not provide finance figures for energy efficiency projects Therefore an assumption was made on the ratio between of finance for RE and EE projects the ratio for 2014 estimated by Climate Policy Initiative (CPI) in 2015242 243 was also assumed for the period 2005ndash2020
Mitigation impacts were scaled up for each RE category Shown in Table 4 the data comprised all renewable technologies and a category was added for projects with multiple RE technologies For the scaling up calculations finance data categorized as ldquomultiple RE technologiesrdquo was proportionally distributed to individual renewable energy categories while finance and carbon mitigation data categorized as ldquoREEErdquo was divided equally among the two categories The results were summed to achieve a total renewable funding per technology Solar PV and solar thermal projects are scaled up collectively as ldquosolar energyrdquo projects The results are shown in Table 5
It should be noted that the estimated CO2 emissions reductions from bioenergy projects which are uncertain due to the lack of information on land-use related emissions accounted for less than 1 of total emissions reductions from all RE projects Therefore the exclusion of indirect emissions related to biomass production is unlikely to affect our overall results
A N N E X
Table 3 CO2 emission reductions expected in 2020 from 224 RE and EE projects analysed in this study
Areatechnology Number of projectsAnnual emissions
reduction (MtCO2yr)Finance committed
(million current USD)
RE 197 849 20142
Solar Thermal 11 22 1948
Geothermal 17 149 6066
Hydro 29 25 1567
Solar PV 39 367 2719
Wind 44 154 4281
Biomasswaste 19 02 324
Multiple RE 38 131 3237
REEE 14 592 926
EE 62 1138 10831
81
Several assumptions were made to estimate the expected total mitigation impact from finance commitments made between 2005 and 2020 First it was assumed that the global finance target of US $100 billion in 2020 will be achieved Second half of this US $100 billion was assumed to address mitigation and half
of that figure was assumed to be public finance This means that the public finance for RE and EE projects would comprise 25 of the US $100 billion Third the US $25 billion was assumed to be distributed to RE and EE at the same 2014 ratio as reported by CPI
ANNEX g
Table 4 Total amount of development finance committed to RE projects by all supporting partners between 2005 and 2015 (million current US dollars)
Sector 2005 2006 2007 2008 2009 2010 2011 2012 2013 2014 2015 Total
Energy generation renewable sources ndash multiple technologies
347 274 363 734 1172 1799 2561 1763 2030 2447 1742 15233
Hydro-electric power plants
480 720 1181 442 208 716 586 997 1387 1285 806 8808
Solar energy 64 53 25 155 328 243 103 621 971 1661 718 4942
Wind energy 126 93 147 322 219 990 78 140 92 488 82 2776
Marine energy 04 00 01 01 00 05 01 01 1
Geothermal energy
225 10 8 3 43 673 397 48 290 606 372 2676
Biofuel-fired power plants
15 20 35 105 132 53 26 43 117 83 71 701
Total 1258 1171 1760 1761 2102 4474 3751 3612 4886 6571 3791 35137
Note data for 2016 is not yet available at the time of writing
Table 5 Estimated total mitigation impact in 2020 from RE and EE projects financed by bilateral and multilateral institutions between 2005 and 2015
OECD categoryTotal finance 2005-2015
(billion current USD)
Expected total emissions reduction in 2020 resulting from finance
2005 ndash 2016 (MtCO2eyr)
RE and REEE total 494 322
Biofuel-fired power plants 167 605
Solar energy 116 1025
Geothermal energy 549 166
Hydro-electric power plants 246 1711
Wind energy 607 265
EE total 262 332
Includes energy projects from waste
82
REFERENCES
R E F E R E N C E S
1 US Energy Information Administration (EIA) (2016) International Energy Outlook 2016 Washington DC Available httpswwweiagovoutlooksieo
2 International Energy Agency (IEA) (2016) World Energy Outlook Paris France Available wwwworldenergyoutlookorg
3 Mission2020 2020 The Climate Turning Point Available httpwwwmission2020global202020The20Climate20Turning20Pointpdf
4 UN Environment Programme (UNEP) (2017) The 2017 Emissions Gap Report Available httpwwwuneporgemissionsgap
5 Frankfurt School-UNEP CentreBloomberg New Energy Finance (2017) Global Trends in Renewable Energy Investment 2017 httpwwwfs-unep-centreorg (Frankfurt am Main) Available httpfs-unep-centreorgsitesdefaultfilespublicationsglobaltrendsinrenewableenergyinvestment2017pdf REN-21 (2017) 2017 Global Status Report Available httpwwwren21netwp-contentuploads20170617-8399_GSR_2017_Full_Report_0621_Optpdf
6 IPCC 2014 Climate Change 2014 Synthesis Report Contribution of Working Groups I II and III to the Fifth Assessment Report of the Intergovernmental Panel on Climate Change [Core Writing Team RK Pachauri and LA Meyer (eds)] IPCC Geneva Switzerland 151 pp
7 UNEP (2016) The Emissions Gap Report 2016 United Nations Environment Programme (UNEP) Nairobi
8 Pauw WP Cassanmagnano D Mbeva K Hein J Guarin A Brandi C Dzebo A Canales N Adams KM Atteridge A Bock T Helms J Zalewski A Frommeacute E Lindener A Muhammad D (2016) NDC Explorer German Development Institute Deutsches Institut fuumlr Entwicklungspolitik (DIE) African Centre for Technology Studies (ACTS) Stockholm Environment Institute (SEI) DOI 1023661ndc_explorer_2017_20
9 Ibid
10 REN21 Renewable Energy Policy Database
11 Renewable Energy Policy Network for the 21st Century (REN21) (2017) Renewables 2017 Global Status Report Retrieved from wwwren21netgsr
12 Renewable Energy Policy Network for the 21st Century (REN21) (2017) Renewables 2017 Global Status Report Retrieved from wwwren21netgsr
13 NDCs submitted as of late March 2017
14 Renewable Energy Policy Network for the 21st Century (REN21) (2017) Renewables 2017 Global Status Report Retrieved from wwwren21netgsr UNFCCC NDC Registry (Interim) httpwww4unfcccintndcregistryPagesHomeaspx
15 REN21 Renewable Energy Policy Database
16 REN21 (2017) 1Gigaton Coalition Survey
17 REN21 Renewable Energy Policy Database
18 REN21 Renewable Energy Policy Database
19 ldquoThe Government of India launches an ambitious rooftop solar subsidy schemerdquo Bridge to India 4 January 2016 httpwwwbridgetoindiacomblogthe-government-of-india-launches-an-ambitious-rooftop-solarsubsidyscheme
20 Roger Sallent Inter-American Development Bank (IDB) personal communication with REN21 2 December 2016
21 Thermal power plants include gas coal oil biomass and multi-fuel (eg gasoil coalbiomass) PBL Netherlands Environmental Assessment Agency and European Commission (EC) Joint Research Centre (2016) Trends in Global CO2 Emissions 2016 Report (The Hague) Available from httpwwwpblnlenpublicationstrends-in-global-co2-emissions-2016-report
22 REN21 Renewable Energy Policy Database
23 IEA (2016) Medium-Term Renewable Energy Market Report 2016 Paris IEA Avilable httpswwwieaorgnewsroomnews2016octobermedium-term-renewable-energy-market-report-2016html
24 IEA IEA Building Energy Efficiency Policies Database Available wwwieaorgbeep (accessed 22 November 2016)
25 Eight countries plus EU as of 2014 per International Council on Clean Transportation (2014) Global Passenger Vehicle Standards Available wwwtheicctorginfo-toolsglobal-passenger-vehicle-standards
26 REN21 Renewable Energy Policy Database
27 Council of European Municipalities and Regions (CEMR) European section of United Cities and Local Governments (12 May 2015) 1000 Mayors worldwide lead the fight against climate change Available httpwwwccreorgenactualitesview3177
28 Organization of Economic Development (OECD) Cities and climate change (Paris 2010)
29 Houmlhne N Drost P et al ldquoChapter Four Bridging the gap - the role of non-state actionrdquo The Emissions Gap Report 2016 (Paris United Nations Environment Programme (UNEP) 2016)
30 International Energy Agency (IEA) Energy Technology Perspectives 2016 Towards Sustainable Urban Energy Systems (Paris 2016) Available from httpswwwieaorgpublicationsfreepublicationspublicationEnergyTechnologyPerspectives2016_ExecutiveSummary_EnglishVersionpdf
31 Ibid
32 Ibid
33 Ibid
34 N Dubash D Raghunandan Girish Sant and Ashok Sreenivas ldquoIndian climate change policy exploring a cobenefits based approachrdquo Economics Politics Weekly vol 22 No 22 (2013)
35 A Gouldson N Kerr F McAnulla S Hall S Colenbrander A Sudmant J Roy S Sarkar D Chakravarty and D Ganguly ldquoThe economics of low carbon citiesrdquo Kolkata Centre for Low Carbon Futures (Leeds 2014)
36 S Akbar G Kleiman S Menon L Segafredo Climate-smart development adding up the benefits of actions that help build prosperity end poverty and combat climate change (The ClimateWorks Foundation and the World Bank 2014) Available from httpdocumentsworldbankorgcurateden794281468155721244Main-report
37 D Millstein R Wiser M Bolinger and G Barbose ldquoThe climate and air-quality benefits of wind and solar power in the United Statesrdquo Nature Energy vol 6 (2014) p17134
38 Jan Beermann Appukuttan Damodaran Kirsten Joumlrgensen and Miranda A Schreurs ldquoClimate action in Indian cities an emerging new research areardquo Journal of Integrative Environmental Sciences 13 no 1 (2016) p 55-66
39 S Akbar G Kleiman S Menon L Segafredo L Climate-smart development adding up the benefits of actions that help build prosperity end poverty and combat climate change (The ClimateWorks Foundation and the World Bank 2014) Available from httpdocumentsworldbankorgcurateden794281468155721244Main-report
40 Thomas Day Niklas Houmlhne and Sofia Gonzales Assessing the missed benefits of countriesrsquo national contributions Quantifying potential co-benefits (Bonn NewClimate Institute 2015) Available from httpsnewclimateinstitutefileswordpresscom201510cobenefits-of-indcs-october-2015pdf
41 Ibid
42 New Climate Economy (NCE) Seizing the Global Opportunity Partnerships for Better Growth and a Better Climate (2015) Available from httpnewclimateeconomyreport2015wp-contentuploadssites3201408NCE-2015_Seizing-the-Global-Opportunity_webpdf
43 Ibid
44 A Dasgupta ldquoIndia can save up to 18 trillion per year with smart ubran growthrdquo World Resources Institute (WRI) 2 Decmeber 2016 Available from httpthecityfixcomblogindia-can-save-up-to-1-8-trillion-per-year-with-smart-urban-growth-ani-dasgupta
45 New Climate Economy (NCE) Seizing the Global Opportunity Partnerships for Better Growth and a Better Climate (2015) Available from httpnewclimateeconomyreport2015wp-contentuploadssites3201408NCE-2015_Seizing-the-Global-Opportunity_webpdf
46 C40 Cities Climate Leadership Group and Arup Potential for Climate Action Cities are Just Getting Started (2015) Available from httpsissuucomc40citiesdocsc40_citypotential_2015
47 New Climate Economy (NCE) Seizing the Global Opportunity Partnerships for Better Growth and a Better Climate (2015) Available from httpnewclimateeconomyreport2015wp-contentuploadssites3201408NCE-2015_Seizing-the-Global-Opportunity_webpdf
48 International Energy Agency (IEA)Energy Efficiency Market Report 2016 (Paris 2016) Available from httpswwwieaorgeemr16filesmedium-term-energy-efficiency-2016_WEBPDF
49 International Renewable Energy Agency (IRENA) Renewable Energy Jobs Annual Review (Abu Dhabi 2017) Available from httpswwwirenaorgDocumentDownloadsPublicationsIRENA_RE_Jobs_Annual_Review_2017pdf
50 C40 Cities Climate Leadership Group Unlocking Climate Action in Megacities (New York 2015) Available from httpwwwc40orgresearchesunlocking-climate-action-in-megacities
51 Ibid
52 V Castaacuten Broto and H Bulkeley H ldquoA survey of urban climate change experiments in 100 citiesrdquo Global Environmental Change vol 23 No 1(2013) p 92ndash102
53 New Climate Economy (NCE) Seizing the Global Opportunity Partnerships for Better Growth and a Better Climate (2015) Available from httpnewclimateeconomyreport2015wp-contentuploadssites3201408NCE-2015_Seizing-the-Global-Opportunity_webpdf
83
REFERENCES g
54 A Masseen and B Lefevre ldquo4 Keys to Unlock Innovative Urban Services for Allrdquo (16 February 2016) Available from httpthecityfixcomblog4-keys-unlock-innovative-urban-service-for-all-anne-maassen-benoit-lefevre
55 Ibid
56 Global Cities Business Alliance ldquoHow cities and business can work together for growthrdquo (2016) Available from httpswwwbusinessincitiescompublicationhow-cities-and-business-can-work-together-for-growth
57 Narela waste plant opened to generate 24 MW power (11 March 2017) The Times of India Available httptimesofindiaindiatimescomcitydelhinarela-waste-plant-opened-to-generate-24mwpowerarticleshow57583891cms
58 C40 Cities Climate Leadership Group (15 November 2016) Cities100 Delhi ndash Turning Waste into Energy and Better Livelihoods Available from httpwwwc40orgcase_studiescities100-delhi-turning-waste-into-energy-and-better-livelihoods
59 Ibid
60 C40 Cities Climate Leadership Group (15 February 2016) C40 Good Practice Guides Delhi - Energy recovery Available httpwwwc40orgcase_studiesc40-good-practice-guides-delhi-energy-recovery
61 Infrastructure Leasing amp Financial Services Limited (IL amp FS) Waste to Energy Plant Ghazipur Available from httpswwwilfsindiacomour-workenvironmentwaste-to-energy-plant-ghazipur (accessed August 2017)
62 C40 Cities Climate Leadership Group (15 November 2016) Cities 100 Delhi - Turning Waste into Energy and Better Livelihoods Available httpwwwc40orgcase_studiescities100-delhi-turning-waste-into-energy-and-better-livelihoods
63 Infrastructure Leasing amp Financial Services Limited (IL amp FS) Our Work Environment Available httpswwwilfsindiacomour-workenvironment (accessed August 2017)
64 Ibid
65 C40 Cities Climate Leadership Group (15 February 2016) C40 Good Practice Guides Delhi - Energy recovery Available httpwwwc40orgcase_studiesc40-good-practice-guides-delhi-energy-recovery
66 C40 Cities Climate Leadership Group (15 November 2016) Cities 100 Delhi - Turning Waste into Energy and Better Livelihoods Available httpwwwc40orgcase_studiescities100-delhi-turning-waste-into-energy-and-better-livelihoods
67 C40 Cities Climate Leadership Group (15 February 2016) C40 Good Practice Guides Delhi - Energy recovery Available httpwwwc40orgcase_studiesc40-good-practice-guides-delhi-energy-recovery
68 Infrastructure Leasing amp Financial Services Limited (IL amp FS) Waste to Energy Plant Ghazipur Available httpswwwilfsindiacomour-workenvironmentwaste-to-energy-plant-ghazipur (accessed August 2017)
69 C40 Cities Climate Leadership Group (15 February 2016) C40 Good Practice Guides Delhi - Energy recovery Available httpwwwc40orgcase_studiesc40-good-practice-guides-delhi-energy-recovery
70 Ghazipur landfill solution soon trial run of waste-to-energy plant to begin (28 February 2015) Deccan Herald Available httpwwwdeccanheraldcomcontent462504ghazipur-landfill-solution-soon-trialhtml
71 Infrastructure Leasing amp Financial Services Limited (IL amp FS) Integrated Solid Waste Management Available from httpilfsenvcomBrochuresIntegrated-Solid-Waste-Managementpdf (accessed August 2017)
72 C40 Cities Climate Leadership Group (15 November 2016) Cities 100 Delhi - Turning Waste into Energy and Better Livelihoods Available httpwwwc40orgcase_studiescities100-delhi-turning-waste-into-energy-and-better-livelihoods
73 Pande A (1 June 2015) As New Delhi Plant Gears Up to Turn Rubbish into Energy Community Organizer is Turning Ragpickers into Artisans Global Press Journal Available httpsglobalpressjournalcomasiaindiaas-new-delhi-plant-gears-up-to-turn-rubbish-into-energy-community-organizer-is-turning-ragpickers-into-artisans
74 C40 Cities Climate Leadership Group (15 February 2016) C40 Good Practice Guides Delhi - Energy recovery Available httpwwwc40orgcase_studiesc40-good-practice-guides-delhi-energy-recovery
75 Pande A (1 June 2015) As New Delhi Plant Gears Up to Turn Rubbish into Energy Community Organizer is Turning Ragpickers into Artisans Global Press Journal Available httpsglobalpressjournalcomasiaindiaas-new-delhi-plant-gears-up-to-turn-rubbish-into-energy-community-organizer-is-turning-ragpickers-into-artisans
76 Ibid
77 Cut from a different cloth (14 September 2014) The Economist Available httpswwweconomistcomnewsbusiness21586328-building-business-around-solving-chronic-female-health-care-problem-cut-different
78 Tiwari P (July 2016) How Ghazipur wastepickers became flower artists shareholders Kenfolios Available from httpswwwkenfolioscomgulmeher
79 Cut from a different cloth (14 September 2014) The Economist Available httpswwweconomistcomnewsbusiness21586328-building-business-around-solving-chronic-female-health-care-problem-cut-different
80 Pande A (1 June 2015) As New Delhi Plant Gears Up to Turn Rubbish into Energy Community Organizer is Turning Ragpickers into Artisans Global Press Journal Available httpsglobalpressjournalcomasiaindiaas-new-delhi-plant-gears-up-to-turn-rubbish-into-energy-community-organizer-is-turning-ragpickers-into-artisans
81 Ibid
82 Chaudhary R and Verick S (2014) Female labour force participation in India and beyond International Labor Organization Available from httpwwwiloorgnewdelhiwhatwedopublicationsWCMS_324621lang--enindexhtm
83 C40 Cities Climate Leadership Group (15 November 2016) Cities 100 Delhi - Turning Waste into Energy and Better Livelihoods Available httpwwwc40orgcase_studiescities100-delhi-turning-waste-into-energy-and-better-livelihoods
84 C40 Cities Climate Leadership Group (15 February 2016) C40 Good Practice Guides Delhi - Energy recovery Available httpwwwc40orgcase_studiesc40-good-practice-guides-delhi-energy-recovery
85 Indiarsquos largest waste-to-energy plant to be launched at Narela-Bawana in March (18 February 2017) The Economic Times Available httpenergyeconomictimesindiatimescomnewspowerindias-largest-waste-to-energy-plant-to-be-launched-at-narela-bawana-in-march57217386
86 C40 Cities Climate Leadership Group Good Practice Guide Creditworthiness Available httpwwwc40orgnetworkscreditworthiness (accessed August 2017)
87 Kampala Capital City Authority Kampala Climate Change Action Available httpswwwkccagougClimate20Change (accessed July 2017)
88 Kampala Capital City Authority Kampala City Climate Action Plan Video Available httpsyoutubeatdi3DRZRAc
89 Kampala Capital City Authority (2015) Kampala Climate Change Action Energy and Climate Profile Available httpswwwkccagouguDocsEnergy20and20Climate20Profilepdf
90 Kampala Capital City Authority(2016) Kampala Climate Change Action Strategy Available httpwwwkccagouguDocsKampala20Climate20Change20Actionpdf
91 Interview with Kampala Capital City Authority staff members 3 August 2017
92 Kampala Capital City Authority(2016) Kampala Climate Change Action Strategy Available httpwwwkccagouguDocsKampala20Climate20Change20Actionpdf
93 Kampala Capital City Authority Kampala Climate Change Action Available from httpswwwkccagougClimate20Change (accessed July 2017)
94 Interview with Kampala Capital City Authority staff members 3 August 2017
95 Kampala Capital City Authority Expertise France and SIMOSHI (2017) Institutional Improved Cook Stoves in 15 KCCA Schools pilot Project supported by Expertise France
96 Ibid
97 SIMOSHI Ltd Projects Available httpwwwsimoshiorgprojects (accessed September 2017)
98 Fallon A (10 June 2016) Kampala aims to lead African cities in fight against climate change Citiscope Available httpcitiscopeorgstory2016kampala-aims-lead-african-cities-fight-against-climate-change
99 Ibid
100 Kampala Capital City Authority Kampala Climate Change Action Energy and Climate Profile Available httpswwwkccagouguDocsEnergy20and20Climate20Profilepdf
101 Fallon A (10 June 2016) Kampala aims to lead African cities in fight against climate change Citiscope Available httpcitiscopeorgstory2016kampala-aims-lead-african-cities-fight-against-climate-change
102 Global Alliance for Clean Cookstoves (6 April 2016) Alliance Launches lsquoFumbaliversquo Cookstoves Campaign in Uganda Available httpcleancookstovesorgaboutnews04-06-2016-alliance-launches-fumbalive-cookstovescampaign-in-ugandahtml
103 Kampala Capital City Authority Kampala Climate Change Action Energy and Climate Profile Available httpswwwkccagouguDocsEnergy20and20Climate20Profilepdf
104 Kampala Capital City Authority Kampala Climate Change Action Energy and Climate Profile Available httpswwwkccagouguDocsEnergy20and20Climate20Profilepdf
105 Awamu biomass energy Available httpawamuug (accessed July 2017)
106 Climate and Development Knowledge Network (CDKN) Economic assessment of the impacts of climate change in Uganda ndash National Level Assessment Accessed via Kampala Capital City Authority Kampala Climate Change Action Energy and Climate Profile Available httpswwwkccagouguDocsEnergy20and20Climate20Profilepdf
107 Kampala Capital City Authority Kampala Climate Change Action Energy and Climate Profile Available httpswwwkccagouguDocsEnergy20and20Climate20Profilepdf
108 Ibid
109 C40 Cities Climate Leadership Group Good Practice Guide Creditworthiness Available httpwwwc40orgnetworkscreditworthiness (accessed August 2017)
84
R E F E R E N C E S
110 C40 Cities Climate Leadership Group Case Study Cities100 Nanjing ndash Worldrsquos Fastest Electric Vehicle Rollout Available httpwwwc40orgcase_studiescities100-nanjing-world-s-fastest-electric-vehicle-rollout (accessed August 2017)
111 Ibid
112 Ibid
113 Nanjing Think-tank Alliance (2015) Develop Low Carbon Industries to Promote Building Nanjing as a Low-Carbon Ecological City Available httpwwwnjzxgovcnzxzz_2016jy_2016201610P020161014417408026102pdf
114 Ibid
115 Nanjing Municipal Peoplersquos Government (2016) 2016 New Energy Automobile Promotion and Application Plan of Nanjing Available httpwwwnanjinggovcnxxgkszf201607t20160712_4023115html
116 Up to 80 of Public Buses in Nanjing Could Be Renewable-Powered This Year (15 April 2017) Yangtse Evening Post Available httppicyangtsecomepaperyaowen2017-04-151236337html
117 Ibid
118 Peoplersquos Republic of China Central Government (2013) Notice of the Ministry of Transport on Issuing Accelerating Development of Green Circular Low-Carbon Transportation Available from httpwwwgovcngongbaocontent2013content_2466586htm
119 Ministry of Transport and Jiangsu Province Sign Framework Agreement on Developing Green Circular and Low-Carbon Transportation (10 June 2013) Idea Carbon Available httpwwwideacarbonorgarchives15745
120 Jiangsu Provincial Government Information Hub Notice of the General Office of Jiangsu Provincial Peoplersquos Government on Issuing Green Circular and Low-Carbon Transportation Development Plan of Jiangsu Province (2013-2020) Available httpwwwjsgovcnjsgovtjbgt201408t20140804452293html
121 C40 Cities Climate Leadership Group Case Study Cities100 Nanjing - Worldrsquos Fastest Electric Vehicle Rollout Available httpwwwc40orgcase_studiescities100-nanjing-world-s-fastest-electric-vehicle-rollout (accessed August 2017)
122 China EV Startup Future Mobility to Build $17 Billion Factory (19 January 2017) Bloomberg News Available httpswwwbloombergcomnewsarticles2017-01-19china-ev-startup-future-mobility-to-build-1-7-billion-factory
123 Gofun launches in Nanjing Ease of Parking for Renewable-Powered Cars (28 March 2017) Electrical Vehicle Resources Available httpwwwevpartnercomnews64detail-26143html
124 Nanjing and Changzhou Approved as National Low-Carbon Pilot Cities (18 February 2017) Xinhua Yangtze River Delta News Available httpcsjxinhuanetcom2017-0218c_136066174htm
125 Jia Y and Yuan J (2017) Nanjingrsquos complete industry chain EV operating alliance How to survive in the face of reduced policy subsidies The Paper Available from httpwwwthepapercnnewsDetail_forward_1776716
126 United States Environmental Protection Agency What are the harmful effects of SO2 Available httpswwwepagovso2-pollutionsulfur-dioxide-basicseffects (accessed September 2017)
127 Vaacutesquez P Restrepo-Tarquino I Acuntildea J and Vaacutesquez S (2017) Women Fostering Energy Efficiency Through Cleaner Production GEADES-UAO Univalle and El Castillo
128 Ibid
129 Ibid
130 Ibid
131 Markham D (19 October 2015) How long will solar panels last CleanTechnica Available httpscleantechnicacom20151019how-long-will-solar-panels-last
132 United Nations Framework Convention on Climate Change (UNFCCC) Momentum for Change Fostering Cleaner Production Available httpunfcccintsecretariatmomentum_for_changeitems9258php (accessed July 2017)
133 Ibid
134 Vaacutesquez P Restrepo-Tarquino I Acuntildea J and Vaacutesquez S (2017) Women Fostering Energy Efficiency Through Cleaner Production GEADES-UAO Univalle and El Castillo
135 Vaacutesquez P and Restrepo I (2016) Women learning alliances for greening manufacturing industries in developing countries From the 2016 International Conference on Sustainable Development (ICSD) September 21 and 22 2016 Columbia University New York New York Available httpic-sdorg20170203proceedings-from-icsd-2016
136 Vaacutesquez P Restrepo-Tarquino I Acuntildea J and Vaacutesquez S (2017) Women Fostering Energy Efficiency Through Cleaner Production GEADES-UAO Univalle and El Castillo
137 Vaacutesquez P and Restrepo I (2016) Women learning alliances for greening manufacturing industries in developing countries From the 2016 International Conference on Sustainable Development (ICSD) September 21 and 22 2016 Columbia University New York New York Available httpic-sdorg20170203proceedings-from-icsd-2016
138 United Nations Framework Convention on Climate Change (UNFCCC) Momentum for Change Fostering Cleaner Production Available httpunfcccintsecretariatmomentum_for_changeitems9258php (accessed July 2017)
139 Vaacutesquez P and Restrepo I (2016) Women learning alliances for greening manufacturing industries in developing countries From the 2016 International Conference on Sustainable Development (ICSD) September 21 and 22 2016 Columbia University New York New York Available httpic-sdorg20170203proceedings-from-icsd-2016
140 City of Mexico (2012) Programa de Certificacioacuten de Edificaciones Sustentables Ministry of the Environment Available httpmarthaorgmxuna-politica-con-causawp-contentuploads20130915-Certificacion-Ed ificaciones-Sustentablespdf
141 Trencher G Takagi T Nishida Y Downy F (2017) Urban Efficiency II Seven Innovative City Programmes for Existing Building Energy Efficiency Tokyo Metropolitan Government Bureau of Environment and C40 Cities Climate Leadership
142 Tanya Muumlller Garciacutea Secretary of the Environment Mexico City email correspondence 14 September 2017
143 Ibid
144 Ibid
145 Interview with Tanya Muumlller Garciacutea Secretary of the Environment Mexico City 29 August 2017
146 Trencher G Takagi T Nishida Y Downy F (2017) Urban Efficiency II Seven Innovative City Programmes for Existing Building Energy Efficiency Tokyo Metropolitan Government Bureau of Environment C40 Cities Climate Leadership
147 Interview with Tanya Muumlller Garciacutea Secretary of the Environment Mexico City 29 August 2017
148 Trencher G Takagi T Nishida Y Downy F (2017) Urban Efficiency II Seven Innovative City Programmes for Existing Building Energy Efficiency Tokyo Metropolitan Government Bureau of Environment C40 Cities Climate Leadership
149 Cuidad de Meacutexico Secretariacutea de Medio Ambiente Transition and energy efficiency priority themes for the CDMX are presented in New York Available httpwwwsedemacdmxgobmxcomunicacionnotatransicion-y-eficiencia-energetica-temas-prioritarios-para-la-cdmx-son-presentados-en-nueva-york
150 Mexico City (2016) Mexico Cityrsquos Climate Action Program 2014-2020 Progress Report 2016 Available httpwwwdatasedemacdmxgobmxcambioclimaticocdmximagesbiblioteca_ccPACCM-inglespdf
151 Jones S (24 April 2014) Can Mexico Cityrsquos roof gardens help the metropolis shrug off its smog The Guardian Available httpswwwtheguardiancomglobal-development2014apr24mexico-city-roof-gardens-pollution-smog
152 World Resources Institute (2016) Mexico City Prioritizes Building Efficiency with New Regulations httpwwwwrirosscitiesorgnewsmexico-city-prioritizes-building-efficiency-new-regulations
153 New partnership targets energy consumption in buildings to reduce emissions in Mexico City (1 April 2015) World Resources Institute Available httpwwwwrirosscitiesorgnewsnew-partnership-targets-energy-consumption-buildings-reduce-emissions-mexico-city
154 Bagu T et al (2016) Market Study Captive Power in Nigeria (A Comprehensive Guide to Project Development) Africa-EU Energy Partnership amp Africa-EU Renewable Energy Cooperation Program Available httpreancomngimgmarket_study_captive_power_nigeria_0pdf
155 Kazeem Y (21 December 2015) A floating school in Lagos has helped bring solar power to one of the cityrsquos oldest slums Quartz Media Available httpsqzcom578843a-floating-school-in-lagos-has-helped-bring-solar-power-to-one-of-the-citys-oldest-slums
156 Nigeriarsquos Solar Stylists (3 March 2017) DW News Available httpwwwdwcomennigerias-solar-stylistsa-38210081
157 Eitan Hochster Director of Business Development Lumos Global email 17 September 2017
158 Shalev A (9 February 2017) Solar Power Taking Hold in Nigeria One Mobile Phone at a Time Inside Climate News Available httpsinsideclimatenewsorgnews07022017solar-energy-nigeria-africa-renewable-energy-climate-change-lumos
159 Ibid
160 Interview with Eitan Hochster Director of Busines Development Lumos Global 30 August 2017
161 Rotshuizen S (28 July 2017) From the Practitioner Hub Interview with Ron Margalit from solar home system provider Lumos Inclusive Business Accelerator Available httpsibaventures20170728from-the-practitionerhub-interview-with-ron-margalit-from-solar-home-system-provider-lumos
162 Kazeem Y (8 October 2015) Nigerian mobile money leader Paga is doubling down on building a payments giant Quartz Available from httpsqzcom520115nigerian-mobile-money-leader-paga-is-doubling-down-on-building-a-payments-giant
163 Interview with Eitan Hochster Director of Busines Development Lumos Global 30 August 2017
164 Brent W (4 August 2016) In conversation with Leigh Vial Power for All Available httpwwwsolar-ngcom20160804vial-nigerias-solar-revolution-has-begun
165 Ibid
85
REFERENCES g
166 Agomuo Z (24 October 2014) Consumers get succour from renewable energy as power supply challenges persist Business Day Available httpswwwbusinessdayonlinecomconsumers-get-succour-from-renewal-energy-as-power-supply-challenges-persist
167 Interview with Eitan Hochster Director of Busines Development Lumos Global 30 August 2017
168 Shalev A (9 February 2017) Solar Power Taking Hold in Nigeria One Mobile Phone at a Time Inside Climate News Available httpsinsideclimatenewsorgnews07022017solar-energy-nigeria-africa-renewable-energy-climate-change-lumos
169 Africa Progress Panel (2015) Power People Planet Africa Progress Report (Geneva Africa Progress Panel) Accessed via International Renewable Energy Agency (IRENA) (2016) Solar PV in Africa Costs and Markets Available httpwwwirenaorgmenuindexaspxmnu=SubcatampPriMenuID=36ampCatID=141ampSubcatID=2744
170 Are Off-Grids the Answer to Nigeriarsquos Energy Crisis Heinrich Boll Stiftung Available from httpsngboellorgtrue-cost-electricity (accessed July 2017)
171 Interview with Eitan Hochster Director of Busines Development Lumos Global 30 August 2017
172 Interview with Uvie Ugono Founder and CEO Solynta 31 August 2017
173 Rotshuizen S (28 July 2017) From the Practitioner Hub Interview with Ron Margalit from solar home system provider Lumos Inclusive Business Accelerator Available httpsibaventures20170728from-the-practitioner-hub-interview-with-ron-margalit-from-solar-home-system-provider-lumos
174 Interview with Uvie Ugono Founder and CEO Solynta 31 August 2017
175 Solar Nigeria Programme ldquoSolar Nigeria adds 170000 solar homes in just 1 yearrdquo (16 February 2017) Available from httpwwwsolar-ngcom20170216solar-nigeria-adds-170000-solar-homes-in-just-1-year
176 Shalev A (9 February 2017) Solar Power Taking Hold in Nigeria One Mobile Phone at a Time Inside Climate News Available httpsinsideclimatenewsorgnews07022017solar-energy-nigeria-africa-renewable-energy-climate-change-lumos
177 Rotshuizen S (28 July 2017) From the Practitioner Hub Interview with Ron Margalit from solar home system provider Lumos Inclusive Business Accelerator Available httpsibaventures20170728from-the-practitioner-hub-interview-with-ron-margalit-from-solar-home-system-provider-lumos
178 Thomson Reuters and CDP have collaborated on this report to bring together the latest data from companies that do report emissions and the latest estimates for those which do not or incompletely report emissions The finance sector was excluded as there are insufficient estimates on its Scope 3 emissions
179 This is measured against total anthropogenic emissions including land use of approximately 52 Gigatons CO2e This number includes direct indirect and value chain emissions (scopes 1 2 and 3) adjusted for a double counting of 60
180 Top 15 in terms of total annual aggregate emissions In the table a GHG Index above 100 indicates an increasing emissions trend a Revenues Index above 100 indicates an increasing revenue trend a Decoupling Index above 100 indicates that revenues are increasing faster than emissions and an Employment Index above 100 indicates an increasing employment trend
181 This is measured against total anthropogenic emissions including land use of approximately 52 Gigatons CO2e This number includes direct indirect and value chain emissions (scopes 1 2 and 3) adjusted for double counting of 60
182 Values which are ldquoNArdquo for 2016 are not available yet because they are not provided by the companies in a manner which allows for peer comparison and therefore require further analysis all values will be available by end of 2017 andor in the full Global 250 Report
183 Note this is an abridged version of case study as it appears in the full Global 250 report
184 Of the examples of emerging leadership in this report Total Group represents an underlying thesis that even the most carbon intensive firms have the opportunity for transformative business model change
185 According to Total completed CDP Climate Change information request submissions
186 httpwwwannualreportscomHostedDataAnnualReportArchivetNYSE_TOT_2015pdf
187 Kuramochi et al (2016) ldquoThe ten most important short-term steps to limit warming to 15Crdquo Climate Action Tracker Available httpclimateactiontrackerorgassetspublicationspublicationsCAT_10Steps_Summarypdf
188 Mission2020 2020 The Climate Turning Point Available httpwwwmission2020global202020The20Climate20Turning20Pointpdf
189 N Hoehne et al (2015) Developing 2C Compatible Investing Criteria NewClimate Institute Germanwatch and 2deg Investing Initiative Available httpswwwnewclimateinstitutefileswordpresscom2015112criteria-finalpdf
190 Ibid
191 International Energy Agency (2017) Energy Technology Perspectives Available wwwieaorgpublicationsfreepublicationspublicationEnergyTechnologyPerspectives2017ExecutiveSummaryEnglishversionpdf
192 Asian Development Bank (2016) The Asian Development Bank and the Climate Investment Funds Country Fact Sheets Second Edition ADB Climate Change and Disaster Risk Management Division Retrieved from wwwadborgsitesdefaultfilespublication167401adb-cif-country-fact-sheets-2nd-edpdf
193 GEF (2013) GEF Secretariat Review for FullMedium-Sized Projects GEF ID 5340 Retrieved from wwwthegeforgsitesdefaultfilesproject_documents5340-2013-04-25-152137-GEFReviewSheetGEF52
194 United Nations Environment Programme (UNEP) amp Bloomberg New Energy Finance (2017) Retrieved from httpfs-unep-centreorgsitesdefaultfilespublicationsglobaltrendsinrenewableenergyinvestment2017pdf
195 International Energy Agency 2017 Global energy investment fell for a second year in 2016 as oil and gas spending continues to drop Available httpswwwieaorgnewsroomnews2017julyglobal-energy-investment-fell-for-a-second-year-in-2016-as-oil-and-gas-spending-chtml
196 Frankfurt School-UNEP CentreBloomberg New Energy Finance (2017) Global Trends in Renewable Energy Investment 2017 httpwwwfs-unep-centreorg (Frankfurt am Main) Available httpfs-unep-centreorgsitesdefaultfilespublicationsglobaltrendsinrenewableenergyinvestment2017pdf
197 Organisation for Economic Co-operation and Development (OECD) (2016) Creditor Reporting System Retrieved from httpsstatsoecdorgIndexaspxDataSetCode=CRS1
198 Organisation for Economic Co-operation and Development (OECD) (2016) Creditor Reporting System Retrieved from httpsstatsoecdorgIndexaspxDataSetCode=CRS1
199 For this analysis ldquoimplementedrdquo projects are those that have been approved by the end of 2016 and will achieve emissions by 2020
200 World Bank (2015) International Financial Institution Framework for a Harmonised Approach to Greenhouse Gas Accounting Available httpwwwworldbankorgcontentdamWorldbankdocumentIFI_Framework_for_Harmonized_Approach20to_Greenhouse_Gas_Accountingpdf
201 Organisation for Economic Co-operation and Development (OECD) (2016) Creditor Reporting System Retrieved from httpsstatsoecd orgIndexaspxDataSetCode=CRS1
202 World Bank (2015) International Financial Institution Framework for a Harmonised Approach to Greenhouse Gas Accounting Available httpwwwworldbankorgcontentdamWorldbankdocumentIFI_Framework_for_Harmonized_Approach20to_Greenhouse_Gas_Accountingpdf
203 J Bai (2013) Chinarsquos Overseas Investments in the Wind and Solar Industries Trends and Drivers Working Paper Washington DC World Resources Institute Retrieved from httpwwwwriorgpublicationchina-overseasinvestments-in-wind-and-solar-trends-and-drivers
204 Cells shaded grey indicates no data available
205 Official Development Assistance + Other Official Flows
206 Organization for Economic Cooperation and Development Creditor Reportign System Retrieved from httpsstatsoecdorgIndexaspxDataSetCode=CRS1
207 Agence Franccedilaise de Deacuteveloppment (2016) 2015 Our Work Around the World Retreived from httpwwwafdfrwebdavsiteafdsharedPUBLICATIONSColonne-droiteRapport-annuel-AFD-VApdf
208 Soular R (2016) China becomes worldrsquos biggest development lender The Third Pole Retrieved from httpswwwthethirdpolenet20160601china-becomes-worlds-biggest-development-lender
209 UK International Climate Finance (2016) 2016 UK Climate Finance Results Retrieved from httpswwwgovukgovernmentuploadssystemuploadsattachment_datafile5534022016-UK-Climate-Finance-Results2pdf
210 FinnFund (2016) Annual Report 2015 Retrieved from httpannualreportfinnfundfi2015filebank753-Annual_Report_2015pdf
211 FMO (2016) 2015 Annual Report Retrieved from httpannualreportfmonlllibrarydownloadurnuuid921394c0-bb5b-45d9-99e9-18d09fd21961fmo_annualreport2015_onlinepdfformat=save_to_diskampext=pdf
212 The International Climate Initiative (IKI) the German governmentrsquos climate funding instrument supplies the funds for many GIZ RE and EE projects GIZ is the implementing organization for these projects while IKI is the supporting institution
213 Deutsche Gesellschaft fuumlr Internationale Zusammenarbeit (GIZ) GmbH Projects Retrieved from httpswwwgizdeprojektdatenindexactionrequest_locale=en_EN
214 KfW Development Bank (24 February 2016) Presentation on KfW Development Bank 2015 Environment and Climate Commitments amp CO2 ndash Monitoring Retrieved from httpsurldefenseproofpointcomv2urlu=https-3A__wwwkfw-2Dentwicklungsbankde_PDF_Entwicklungsfinanzierung_Umwelt-2Dund-2DKlima_Zahlen-2DDaten-2DStudien_KfW-2DKlimafinanzierung-2Din-2DZahlen_Umwelt-2DKlimaneuzusagen-2D2015-5FENpdfampd=CwIFAwampc=-109dg2m7zWuuDZ0MUcV7Sdqwampr=KjRxMDLnH5mYpLVbZF3u_UtYA0frxBmccQMurQoKFFkampm=z0-IQV0b8MFl57AlNkF_zVMGgXCzaqh3KPZ-K_-AgW8amps=W9Ezfc2ZuAIrScF_-ljhjQYyn0PGffRYH23Qo_dQTgAampe=215 Retrieved from httpswwwjicagojpenglishpublicationsreportsannual2015c8h0vm00009q82bmattc8h0vm00009q82o5pdf
215 Retrieved from httpswwwjicagojpenglishpublicationsreportsannual2015c8h0vm00009q82bm-att2015_36pdf
216 Norfund (2016) 2015 Report on Operations Norwegian Investment Fund for Developing Countries Retrieved from httpsissuucommerkurgrafiskdocsnorfund_virksomhetsrapport_2016_blae=1379933435569369
217 Overseas Private Investment Corporation OPIC Annual Report 2015 Retrieved from httpswwwopicgovsitesdefaultfilesfiles2015annualreportpdf
86
R E F E R E N C E S
218 Global Environment Facility (2016) About us Retrieved from httpswwwthegeforgabout-us
219 Climate Investment Funds (2016) What we do Retrieved from httpwww-cifclimateinvestmentfundsorgabout
220 Cells shaded grey indicate no data available
221 Asian Development Bank (2016) 2015 Clean Energy Investment Project Summaries Retrieved from httpswwwadborgsitesdefaultfilespublication184537clean-energy-investment-2015pdf
222 Asian Infrastructure Investment Bank (2016) The Peoplersquos Republic of Bangladesh Distribution System Upgrade and Expansion Project Retrieved from httpswwwaiiborgenprojectsapproved2016_downloadbangladeshsummarybangladesh_distribution_system_upgrade_and_expansionpdf
223 Climate Investment Funds (2016) Empowering a Greener Future Annual Report 2015 Retrieved from httpwww-cifclimateinvestmentfundsorgsitesdefaultfilesannual-report-2015cif-annual-report-ebookpdf
224 Climate Investment Funds (2016) Empowering a Greener Future Annual Report 2015 Retrieved from httpwww-cifclimateinvestmentfundsorgsitesdefaultfilesannual-report-2015cif-annual-report-ebookpdf
225 European Investment Bank (2016) 2015 Activity Report Retrieved from httpwwweiborgattachmentsgeneralreportsar2015enpdf
226 European Investment Bank (2015) 2014 Sustainability Report Retrieved from httpwwweiborgattachmentsgeneralreportssustainability_report_2014_enpdf
227 Green Climate Fund (2016) Resources Mobilized Retrieved from httpwwwgreenclimatefundpartnerscontributorsresources-mobilized
228 Global Environment Facility Behind the Number 2015 A Closer Look at GEF Achievements Retrieved from httpswwwthegeforgsitesdefaultfilespublicationsGEF_numbers2015_CRA_bl2_web_1pdf
229 Global Environment Facility About Us Retrieved from httpswwwthegeforgabout-us
230 World Bank Group (2016) Corporate Scorecards Retrieved from httppubdocsworldbankorgen963841460405876463WBG-WBScorecardpdfzoom=100
231 Proparco (2016) Key Figures 2015 Retrieved from httpwwwproparcofrwebdavsiteproparcosharedELEMENTS_COMMUNSPDFChiffres20ClefsProparco_Key_Figures_2015_UK_Webpdf
232 World Bank (2015) International Financial Institution Framework for a Harmonised Approach to Greenhouse Gas Accounting Available httpwwwworldbankorgcontentdamWorldbankdocumentIFI_Framework_for_Harmonized_Approach20to_Greenhouse_Gas_Accountingpdf
233 Frankfurt School-UNEP CentreBNEF (2016) Global Trends in Renewable Energy Investment 2016 Retrieved from httpfs-unep-centreorgsitesdefaultfilespublicationsglobaltrendsinrenewableenergyinvestment2016lowres_0pdf
234 Houmlglund-Isaksson L Purohit P Amann M Bertok I Rafaj P Schoumlpp W Borken-Kleefeld J 2017 Cost estimates of the Kigali Amendment to phase-down hydrofluorocarbons Environmental Science amp Policy 75 138ndash147 doihttpdxdoiorg101016jenvsci201705006
235 UN Environment Programme (UNEP) (2017) The 2017 Emissions Gap Report Available httpwwwuneporgemissionsgap
236 International Energy Agency (2017) Energy Technology Perspectives Available wwwieaorgpublicationsfreepublicationspublicationEnergyTechnologyPerspectives2017ExecutiveSummaryEnglishversionpdf
237 Westphal M I Canfin P A S C A L Ballesteros A T H E N A amp Morgan J E N N I F E R (2015) Getting to $100 Billion Climate Finance Scenarios and Projections to 2020 World Resources Institute Working Paper Available at httpswwwwriorgsitesdefaultfilesgetting-to-100-billion-finalpdf
238 IRENA 2016 Data amp Statistics International Renewable Energy Agency Abu Dhabi United Arab Emirates Available at httpresourceirenairenaorggatewaydashboardtopic=4ampsubTopic=15 [Accessed September 20 2016]
239 IEA 2016 Energy Technology Perspectives 2016 Towards Sustainable Urban Energy Systems International Energy Agency Paris France
240 IGES 2016 List of grid emission factors Update August 2016 Hayama Japan Institute for Global Environmental Stratgegies (IGES) Available at httppubigesorjpmodulesenvirolibviewphpdocid=2136 [Accessed September 30 2016]
241 OECD 2016 OECDStat Query Wizard for International Development Statistics Available at httpstatsoecdorgqwids [Accessed September 30 2016]
242 Buchner BK Trabacchi Chiara Federico M Abramskiehn D amp Wang D 2015 Global Landscape of Climate Finance 2015 Climate Policy Initiative
243 USD 49 billion was identified for renewable energy projects and USD 26 billion for energy efficiency projects
87
GLOSSARY g
GLOSSARY
The entries in this glossary are adapted from definitions provided by authoritative sources such as the Intergovernmental Panel on Climate Change and UN Environment
Additionality a criterion that stipulates that emissions savings achieved by a project must not have happened anyway had the project not taken place
Baseline Scenario the scenario that would have resulted had additional mitigation efforts and policies not taken place
Bilateral Development Organization a bilateral development organization mobilizes public funds from national budgets to finance development initiatives abroad Some groups also raise capital from private markets and some use both public and private financing in their operations Development institutions generally finance projects via grants andor loans distributed to governments of recipient nations which in turn distribute funding to ministries local agencies and firms in charge of project implementation
Bottom-up analysis a method of analysis that looks at the aggregated emissions impact from individual renewable energy and energy efficiency projects
Business as usual the scenario that would have resulted had additional mitigation efforts and policies not taken place (with respect to an agreed set)
Developing Countries this report uses the same definition of developing countries as used by organizations such as the IEA or IRENA243
Double counting the situation where the same emission reductions are counted towards meeting two partiesrsquo pledges (for example if a country financially supports an initiative in a developing country and both countries count the emissions towards their own national reductions)
Emission pathway the trajectory of annual global greenhouse gas emissions over time
International Financial Institutions (IFIs) banks that have been chartered by more than one country
Multilateral Development Banks (MDBs) financial institutions that draw public and private funding from multiple countries to finance development initiatives in developing countries These organizations often fund projects in collaboration with each other employing multi-layered finance agreements that include grants loans and leveraged local funding
Scenario a hypothetical description of the future based on specific propositions such as the uptake of renewable energy technologies or the implementation of energy efficiency standards
Top-down analysis a method of analysis that uses aggregated data often supplied by organizations that support renewable energy and energy efficiency projects in developing countries to determine global impact of a certain policy measure group etc
88
A C R O N Y M S
ACRONYMS
pound British Pound
euro Euro
2DS 2degC Scenario
B2DS Beyond 2degC Scenario
AFD Agence Franccedilaise de Deacuteveloppement
ADB Asian Development Bank
APEC Asia Pacific Economic Cooperation
BAU Business as usual
BAT Best available technology
BECCS Bioenergy with carbon capture and storage
BEIS UK Department for Business Energy amp Industrial Strategy
AFD Agence Franccedilaise de Deacuteveloppement
ADB Asian Development Bank
CAT Climate Action Tracker
CCS Carbon capture and storage
CDP Carbon Disclosure Project
CF Capacity factor
CIF Climate Investment Fund
CO2 Carbon dioxide
CO2e Carbon dioxide equivalent
DEFRA Department for Environment Food amp Rural Affairs of the United Kingdom of Great Britain and Northern Ireland
DFID UK Department for International Development of the United Kingdom of Great Britain and Northern Ireland
EC European Commission
ECOWAS Economic Community of West African States
EE Energy efficiency
EIA Energy Information Administration of the United States of America
EIB European Investment Bank
EJ Exajoule
ES Energy saved or substituted
ETP Energy Technology Perspectives
EV Electric vehicle
FIT Feed-in tariff
JICA Japan International Cooperation Agency
GDP Gross domestic product
GEEREF Global Energy Efficiency and Renewable Energy Fund
GEF Global Environment Facility
GHG Greenhouse gas
GIZ Deutsche Gesellschaft fuumlr Internationale Zusammenarbeit
GNI Gross national income
Gt Gigaton
GW Gigawatt
kg kilogram
kWh Kilowatt hours
LED Light Emitting Diode
LCA Life-Cycle Analysis
LDV Light-duty vehicle
IDS Institute for Development Support
IEA International Energy Agency
IFI International Financial Institution Framework for a Harmonised Approach to Greenhouse Gas Accounting
IKI International Climate Initiative
IPCC Intergovernmental Panel on Climate Change
IRENA International Renewable Energy Agency
ISO International Organization for Standardization
MDB Multilateral development banks
MWh Megawatt-hour
NDCs Nationally Determined Contributions
NDEs National designated entities
NEEAPs National Energy Efficiency Action Plans
ODA Official development assistance
OECD Organisation for Economic Cooperation and Development
PPA Power purchase agreement
PV Photovoltaic
PWh Petawatt-hour
RampD Research and development
RE Renewable energy
REN21 Renewable Energy Policy Network for the 21st Century
REEEP Renewable Energy and Energy Efficiency Partnership
RPS Renewable Portfolio Standards
Rs Indian Rupee
RTS Reference Technology Scenario
SBCP Sustainable Buildings Certification Program
SBT Science-Based Targets
SDGs Sustainable Development Goals
SE4ALL Sustainable Energy For All
TWh Terawatt hour
UNFCCC United Nations Framework Convention on Climate Change
US $ United States Dollars
WEO World Energy Outlook
WRI World Resources Institute
WWF World Wildlife Fund
89
IMPRESSUMPICTURE RIGHTS g
IMPRESSUMPICTURE RIGHTS
Titelpage People using lights powered by Off-Grid Electricrsquos solar service mPower copy Power Africa Geothermally active groundshutterstock SvedOliver Hrsquomong ethnic minority childrenLaocai Vietnam Wind Farmshutterstock Mongkol Udomkaew
page 9 Matemwe village Zanzibar Sam EatonPRI
page 10 Udaipur India
page 13 Nanjing China
page 14 World Bank Photo Collections Fotos
page 19 Kuala Lumpur Malaysia Hanoi Vietnam
page 20 Women prepare matoke dish Kampala copy IFPRIMilo Mitchell
page 22 Jama Masjid Old Delhi India
page 23 New Delhi India New Delhi India Amravati India
page 24 Kampala Uganda
page 26 Nanjing Jianye District China Nanjing China car chargerFlickr copy Haringkan Dahlstroumlm CC BY 20
page 27 Wikimedia Commons DKMcLaren CC BY-SA 40
page 28 Cali Valle Del Cauca Colombia Creative Commons licensed by user CoCreatr on Flickr CoCreatrtypepadcom
page 30 Alameda (central park) MexicoCityFlickr Ingrid Truemper CC BY-NC 20 gardens integrated into buildingUnSplash Oliver Wendel
page 32 Lagos NigeriaFlickr Seun Ismail CC BY-NC 20 Figmentmediacouk Jessica Seldon Department for International Development (DFID) CC BY 20 Bariadi TanzaniaFlickr Russell Watkins Department for International Development (DFID) CC BY 20 Flickr Russell WatkinsDepartment for International Development CC BY 20 Uribia Colombia
page 33 Bariadi Tanzania Flickr Russell Watkins Department for International Development CC BY 20
page 35 Luxembourgshutterstock Vytautas Kielaitis
page 37 Monumento a la Revolucion Mexico City Mexico
page 38 India shutterstock singh_lens
page 39 Flickr David Mellis CC BY 20 Mwanza TanzaniaFlickr Russell Watkins Department for International Development (DFID)
page 40 Lambarene Gabon Africa Tay Son streetHanoi Vietnam
page 50 Nanjing Yangtze River BridgeFlickr Jack No1 CC BY 30
page 51 Bariadi TanzaniaFlickr Russell WatkinsDepartment for International Development (DFID) CC BY 20
page 54 Hanoi Vietnam Hanoi Metro Hanoi Vietnamwikimedia commons Autumnruv CC BY-SA 40
page 55 gobi desert central asia
page 56 Plaza de Caicedo Cali Colombia
page 58 Kokemnoure Burkina Faso
page 59 shutterstock LIUSHENGFILM
page 62 barefoot-bannerjpg
page 63 Kampala Uganda
page 69 shutterstock Srdjan Randjelovic
page 70 Casablanca Morocco
page 71 Mexico City Mexico Rwanda camp for internally displaced people (IDP) Tawila North DarfurFlickr Albert Gonzalez Farran UNAMID CC BY-NC-ND 20
page 74 Morocco shutterstock
page 75 People using lights powered by Off-Grid Electricrsquos solar service mPower copy Power Africa
page 87 Siem Reap Cambodia
page 89 Isla Contoy Mexico
+2degC
UN Environment
PO Box 30552 Nairobi Kenya
Tel ++254-(0)20-762 1234
Fax ++254-(0)20-762 3927
uneppubuneporg
Email 1gigatonuneporg
www1gigatoncoalitionorg
ISBN 978-92-807-3671-7
Job Nr DTI2132PA