Embed Size (px)
Citation preview
Renewable Energy Growth Program Analysis
Economic, Jobs and Environmental Impacts for Program Years 2015 and 2016 and the Overall Program Years 2015 to 2019
PREPARED FOR
Rhode Island Office of Energy Resources
Rhode Island Distributed Generation Board
PREPARED BY
Mark Berkman
Jurgen Weiss
May 12, 2017

This report was prepared for the Rhode Island Office of Energy Resources and the Distributed
Generation Board. All results and any errors are the responsibility of the authors and do not
represent the opinion of The Brattle Group, Inc. or its clients.
Acknowledgement: We acknowledge the valuable contributions of Christopher Kearns of
RIOER, and Angela Gunn, Andrea Kwan and Dean Murphy of Brattle to this report and to the
underlying analysis.
Copyright © 2014 The Brattle Group, Inc.
i | brattle.com
Table of Contents
Executive Summary .............................................................................................................................. 1
I. Introduction ................................................................................................................................. 3
A. Study Objective .................................................................................................................. 3
B. Structure of Report ............................................................................................................. 3
II. Program Description ................................................................................................................... 3
III. Methodology ................................................................................................................................ 5
IV. Data and Assumptions ................................................................................................................. 7
A. Program Participation and Tariffs ..................................................................................... 7
B. Administrative Costs and Remuneration .......................................................................... 9
C. Avoided Costs of Energy, Capacity and RECs ................................................................ 10
1. Avoided Energy Costs ............................................................................................. 10
2. Avoided REC Costs ................................................................................................. 13
3. Avoided Capacity Costs .......................................................................................... 16
4. Summary of Avoided Energy, Capacity and REC Assumptions ........................... 18
D. Taxes ................................................................................................................................. 18
V. Results ........................................................................................................................................ 20
A. Impact of The REG Program During Construction Phase ............................................. 20
B. Tariff Phase Impacts ......................................................................................................... 21
C. REG Program Net Economic Impacts ............................................................................. 25
D. REG Environmental Impacts ........................................................................................... 28
1. Emissions ................................................................................................................. 28
2. Allowance Costs ...................................................................................................... 30
3. Damages Costs of Pollutants................................................................................... 31
ii | brattle.com
E. Other Benefits And Costs ................................................................................................ 33
1. Diversity .................................................................................................................. 33
2. Reliability ................................................................................................................ 34
3. Avoided Costs of Transmission & Distribution ..................................................... 34
4. Grid Integration Costs ............................................................................................ 34
5. Impact on Wholesale Prices ................................................................................... 34
6. Potential Benefits to Program Participants ........................................................... 35
VI. Conclusions ................................................................................................................................ 36
VII. Appendix A ................................................................................................................................ 38
Table of Figures
Figure 1: Implan Methodology ............................................................................................................. 6
Figure 2: AEO 2017 Natural Gas Price Projection (for Electricity Production) .............................. 12
Figure 3: New England Class I Spot REC Prices ................................................................................ 14
Figure 4: Recent Development of New England REC Prices ........................................................... 15
Figure 5: Expected Incremental Impact of REG Program on Net Present Value of State GDP ..... 26
Figure 6: Expected Incremental Impact of REG Program on RI jobs .............................................. 27
Figure 7: Marginal Emission Rates for All Generation Sources 2009-2015 ..................................... 29
Figure 8: RGGI Allowance Prices ...................................................................................................... 30
Figure 9: Value of CO2 Emissions Allowance Reductions (Nominal) for Year Ending March 31 . 31
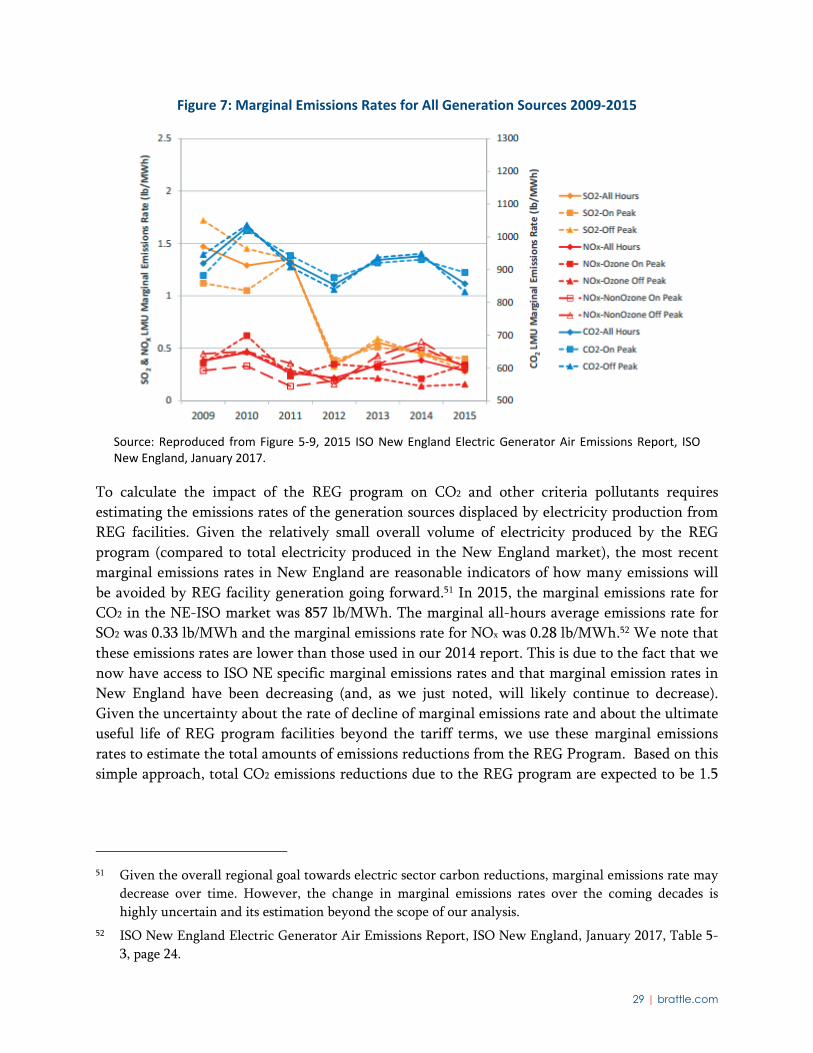
Figure 10: Net Present Value of Pollutant Damage Cost Reductions (Entire REG Program) ........ 33
iii | brattle.com
Table of Tables
Table 1: REG Total Capacity (kW installed) by REG Program Category .......................................... 4
Table 2: REG Total Investment by Class ($ millions) ......................................................................... 5
Table 3: 2015/2016 Program Year REG Tariffs by Category .............................................................. 8
Table 4: Forecast Program Year 2017-19 REG Tariffs by Category ................................................... 9
Table 5: Economic Impacts—Construction Phase ............................................................................ 21
Table 6: Revenues and Costs Associated with the REG Program in Year 8 .................................... 23
Table 7: Economic Impacts—Tariff Phase ......................................................................................... 24
Table 8: Economic Impacts—Program Life ....................................................................................... 25
Table 9: Estimated Damages per Ton of Criteria Pollutant .............................................................. 32
1 | brattle.com
Executive Summary
The Rhode Island Office of Energy Resources (OER) and Distributed Generation Board engaged
The Brattle Group to conduct a study to assess the economic, jobs, and environmental impacts of
the Renewable Energy Growth (REG) Program years 2015 and 2016 as well as to estimate, based
on the experience with program years 2015 and 2016, the expected impacts of the overall REG
program between 2015 and 2019. Since most REG tariffs remain in place between 2030 and 2040
(depending on the execution of the tariffs), we estimated the impacts over a 25 year period
through 2040. In brief, we have determined that:
The 49.4 megawatts (MW) of solar and wind projects supported by the REG program in
2015 and 2016 resulted in an investment of $126 million in 1046 projects.
By the end of the current REG program in 2019, REG investments will account for 160
MW of renewable energy capacity reflecting additional investments totaling $264
million, bringing total investment to $390 million.
This investment will contribute about $236 million on a present value basis to state GDP
through 2040. On average 88 jobs will be added in each year (close to 500 per year 2016-
2019 because of construction, but near zero on net per year 2020-2040 because while
operations and maintenance jobs grow, they are offset by losses in service jobs resulting
from modestly higher electricity prices until late in the period.
The overall investments under the 2015-2019 REG program benefit from approximately
$117 million in federal investment tax credits (ITC), about $38 million of which are
benefitting program years 2015 and 2016. To reach REG program goals without the ITC,
Rhode Island ratepayers would have to pay approximately the same amounts provided by
the ITC through correspondingly higher tariffs.
The REG investments will contribute to reducing carbon and criteria pollutant emissions.
The social costs avoided by the carbon reductions total over $51 million between now
and 2040 on a present value basis. The criteria pollutant (SO2, NOx and PM2.5) reductions
avoid social costs of about $4.9 million on a present value basis over the same period.
The net impacts highlighted above take into account the REG programmatic costs, including
ratepayer costs to fund the above-market tariffs for energy, capacity and RECs of the REG
program and are net of increased state tax revenues due to taxes paid by REG program
participants.
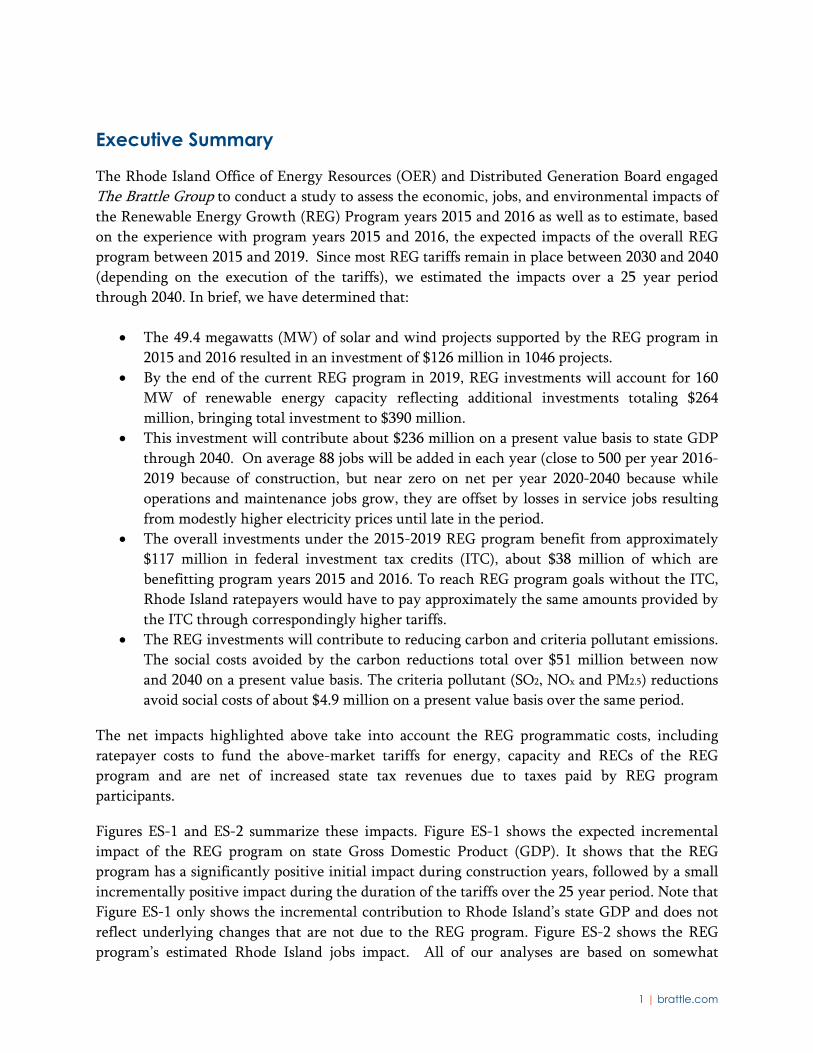
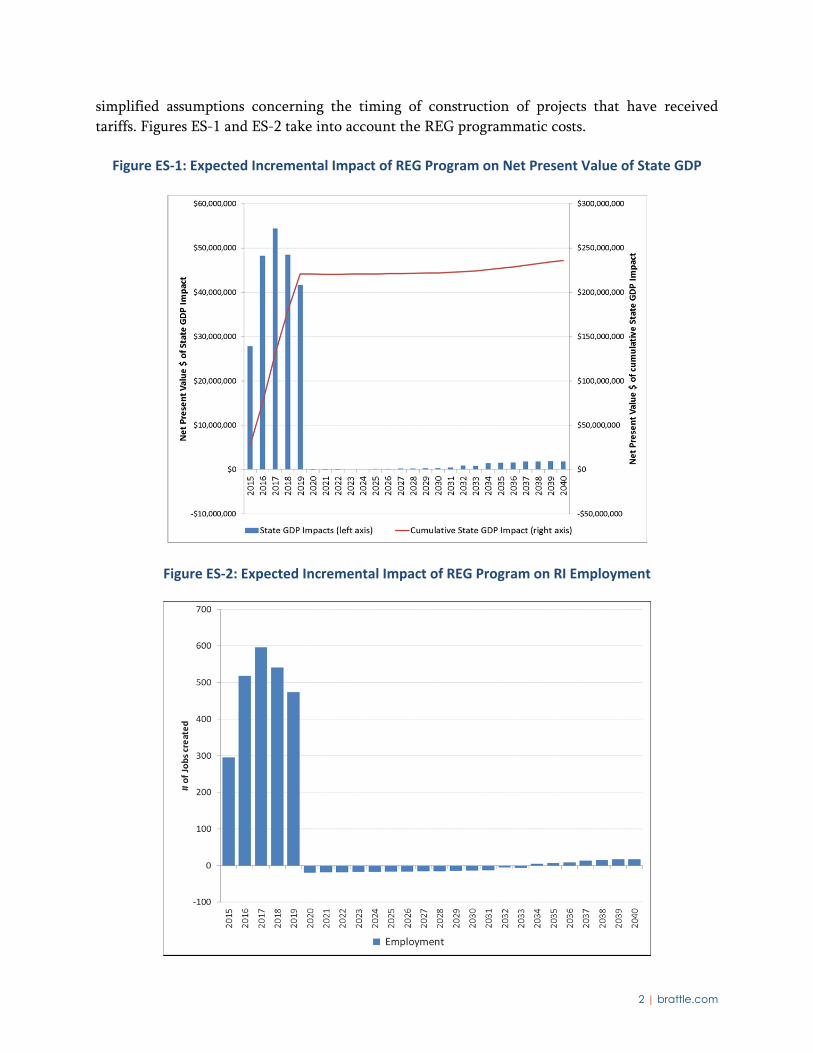
Figures ES-1 and ES-2 summarize these impacts. Figure ES-1 shows the expected incremental
impact of the REG program on state Gross Domestic Product (GDP). It shows that the REG
program has a significantly positive initial impact during construction years, followed by a small
incrementally positive impact during the duration of the tariffs over the 25 year period. Note that
Figure ES-1 only shows the incremental contribution to Rhode Island’s state GDP and does not
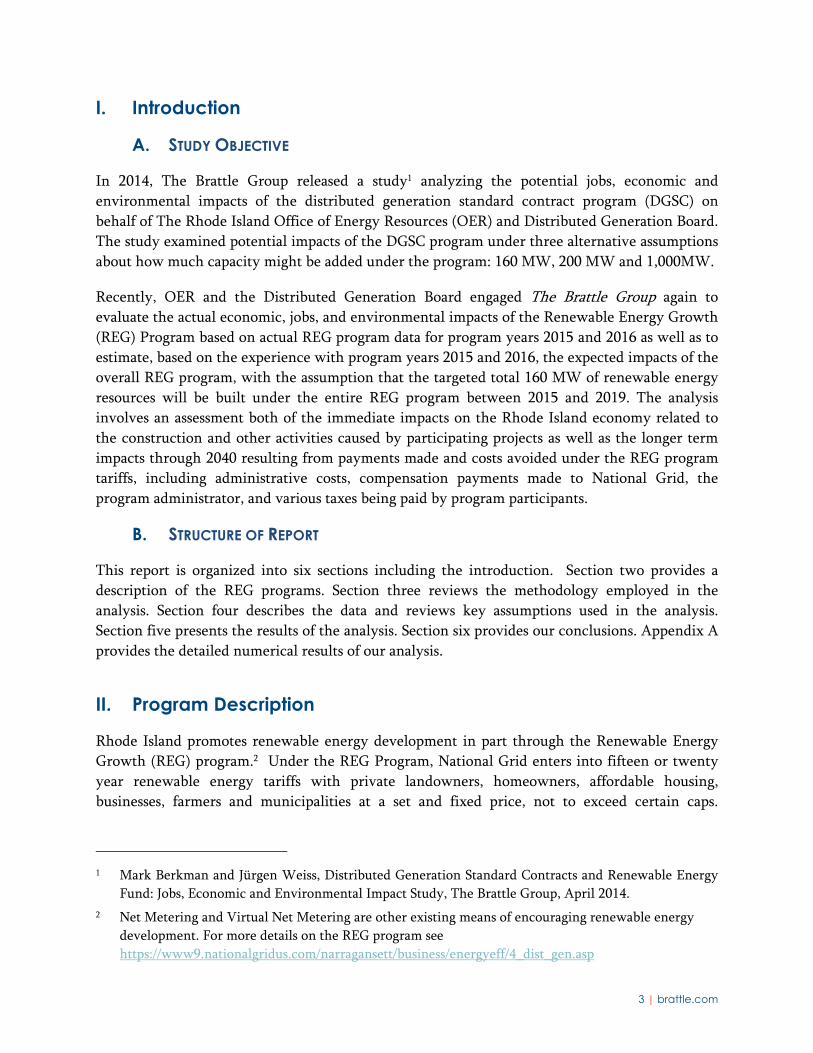
reflect underlying changes that are not due to the REG program. Figure ES-2 shows the REG
program’s estimated Rhode Island jobs impact. All of our analyses are based on somewhat
2 | brattle.com
simplified assumptions concerning the timing of construction of projects that have received
tariffs. Figures ES-1 and ES-2 take into account the REG programmatic costs.
Figure ES‐1: Expected Incremental Impact of REG Program on Net Present Value of State GDP
Figure ES‐2: Expected Incremental Impact of REG Program on RI Employment
3 | brattle.com
I. Introduction
A. STUDY OBJECTIVE
In 2014, The Brattle Group released a study1 analyzing the potential jobs, economic and
environmental impacts of the distributed generation standard contract program (DGSC) on
behalf of The Rhode Island Office of Energy Resources (OER) and Distributed Generation Board.
The study examined potential impacts of the DGSC program under three alternative assumptions
about how much capacity might be added under the program: 160 MW, 200 MW and 1,000MW.
Recently, OER and the Distributed Generation Board engaged The Brattle Group again to
evaluate the actual economic, jobs, and environmental impacts of the Renewable Energy Growth
(REG) Program based on actual REG program data for program years 2015 and 2016 as well as to
estimate, based on the experience with program years 2015 and 2016, the expected impacts of the
overall REG program, with the assumption that the targeted total 160 MW of renewable energy
resources will be built under the entire REG program between 2015 and 2019. The analysis
involves an assessment both of the immediate impacts on the Rhode Island economy related to
the construction and other activities caused by participating projects as well as the longer term
impacts through 2040 resulting from payments made and costs avoided under the REG program
tariffs, including administrative costs, compensation payments made to National Grid, the
program administrator, and various taxes being paid by program participants.
B. STRUCTURE OF REPORT
This report is organized into six sections including the introduction. Section two provides a
description of the REG programs. Section three reviews the methodology employed in the
analysis. Section four describes the data and reviews key assumptions used in the analysis.
Section five presents the results of the analysis. Section six provides our conclusions. Appendix A
provides the detailed numerical results of our analysis.
II. Program Description
Rhode Island promotes renewable energy development in part through the Renewable Energy
Growth (REG) program.2 Under the REG Program, National Grid enters into fifteen or twenty
year renewable energy tariffs with private landowners, homeowners, affordable housing,
businesses, farmers and municipalities at a set and fixed price, not to exceed certain caps.
1 Mark Berkman and Jürgen Weiss, Distributed Generation Standard Contracts and Renewable Energy
Fund: Jobs, Economic and Environmental Impact Study, The Brattle Group, April 2014.
2 Net Metering and Virtual Net Metering are other existing means of encouraging renewable energy
development. For more details on the REG program see
https://www9.nationalgridus.com/narragansett/business/energyeff/4_dist_gen.asp
4 | brattle.com
Anaerobic digestion, solar photovoltaic, small-scale hydro, and wind technology projects are
eligible.
National Grid administers the annual program and receives administrative support and
remuneration for operating the annual program. Payments made under the tariffs, administrative
expenses and the incentive payment received by National Grid are recovered from ratepayers
through a surcharge (per kWh) on electric rates.
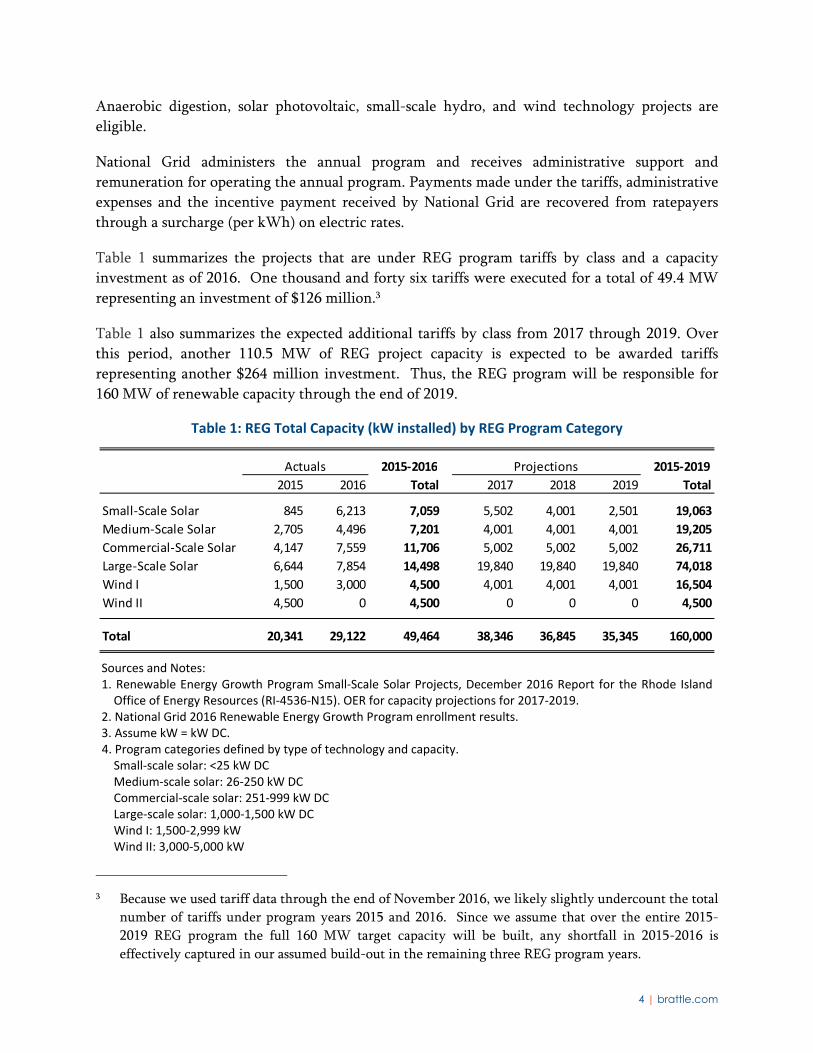
Table 1 summarizes the projects that are under REG program tariffs by class and a capacity
investment as of 2016. One thousand and forty six tariffs were executed for a total of 49.4 MW
representing an investment of $126 million.3
Table 1 also summarizes the expected additional tariffs by class from 2017 through 2019. Over
this period, another 110.5 MW of REG project capacity is expected to be awarded tariffs
representing another $264 million investment. Thus, the REG program will be responsible for
160 MW of renewable capacity through the end of 2019.
Table 1: REG Total Capacity (kW installed) by REG Program Category
Sources and Notes: 1. Renewable Energy Growth Program Small‐Scale Solar Projects, December 2016 Report for the Rhode Island Office of Energy Resources (RI‐4536‐N15). OER for capacity projections for 2017‐2019.
2. National Grid 2016 Renewable Energy Growth Program enrollment results. 3. Assume kW = kW DC. 4. Program categories defined by type of technology and capacity. Small‐scale solar: <25 kW DC Medium‐scale solar: 26‐250 kW DC Commercial‐scale solar: 251‐999 kW DC Large‐scale solar: 1,000‐1,500 kW DC Wind I: 1,500‐2,999 kW Wind II: 3,000‐5,000 kW
3 Because we used tariff data through the end of November 2016, we likely slightly undercount the total
number of tariffs under program years 2015 and 2016. Since we assume that over the entire 2015-
2019 REG program the full 160 MW target capacity will be built, any shortfall in 2015-2016 is
effectively captured in our assumed build-out in the remaining three REG program years.
Actuals 2015‐2016 Projections 2015‐2019
2015 2016 Total 2017 2018 2019 Total
Small‐Scale Solar 845 6,213 7,059 5,502 4,001 2,501 19,063
Medium‐Scale Solar 2,705 4,496 7,201 4,001 4,001 4,001 19,205
Commercial‐Scale Solar 4,147 7,559 11,706 5,002 5,002 5,002 26,711
Large‐Scale Solar 6,644 7,854 14,498 19,840 19,840 19,840 74,018
Wind I 1,500 3,000 4,500 4,001 4,001 4,001 16,504
Wind II 4,500 0 4,500 0 0 0 4,500
Total 20,341 29,122 49,464 38,346 36,845 35,345 160,000
5 | brattle.com
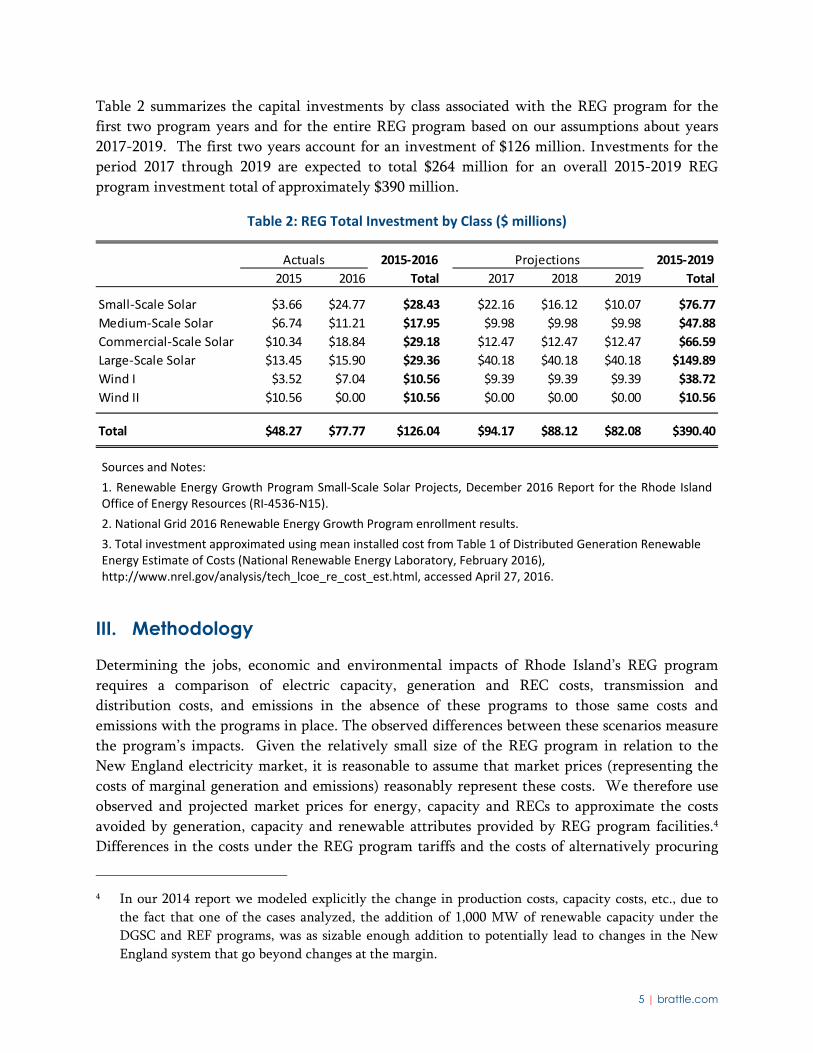
Table 2 summarizes the capital investments by class associated with the REG program for the
first two program years and for the entire REG program based on our assumptions about years
2017-2019. The first two years account for an investment of $126 million. Investments for the
period 2017 through 2019 are expected to total $264 million for an overall 2015-2019 REG
program investment total of approximately $390 million.
Table 2: REG Total Investment by Class ($ millions)
Sources and Notes:
1. Renewable Energy Growth Program Small‐Scale Solar Projects, December 2016 Report for the Rhode Island Office of Energy Resources (RI‐4536‐N15).
2. National Grid 2016 Renewable Energy Growth Program enrollment results.
3. Total investment approximated using mean installed cost from Table 1 of Distributed Generation Renewable Energy Estimate of Costs (National Renewable Energy Laboratory, February 2016), http://www.nrel.gov/analysis/tech_lcoe_re_cost_est.html, accessed April 27, 2016.
III. Methodology
Determining the jobs, economic and environmental impacts of Rhode Island’s REG program
requires a comparison of electric capacity, generation and REC costs, transmission and
distribution costs, and emissions in the absence of these programs to those same costs and
emissions with the programs in place. The observed differences between these scenarios measure
the program’s impacts. Given the relatively small size of the REG program in relation to the
New England electricity market, it is reasonable to assume that market prices (representing the
costs of marginal generation and emissions) reasonably represent these costs. We therefore use
observed and projected market prices for energy, capacity and RECs to approximate the costs
avoided by generation, capacity and renewable attributes provided by REG program facilities.4
Differences in the costs under the REG program tariffs and the costs of alternatively procuring
4 In our 2014 report we modeled explicitly the change in production costs, capacity costs, etc., due to
the fact that one of the cases analyzed, the addition of 1,000 MW of renewable capacity under the
DGSC and REF programs, was as sizable enough addition to potentially lead to changes in the New
England system that go beyond changes at the margin.
Actuals 2015‐2016 Projections 2015‐2019
2015 2016 Total 2017 2018 2019 Total
Small‐Scale Solar $3.66 $24.77 $28.43 $22.16 $16.12 $10.07 $76.77
Medium‐Scale Solar $6.74 $11.21 $17.95 $9.98 $9.98 $9.98 $47.88
Commercial‐Scale Solar $10.34 $18.84 $29.18 $12.47 $12.47 $12.47 $66.59
Large‐Scale Solar $13.45 $15.90 $29.36 $40.18 $40.18 $40.18 $149.89
Wind I $3.52 $7.04 $10.56 $9.39 $9.39 $9.39 $38.72
Wind II $10.56 $0.00 $10.56 $0.00 $0.00 $0.00 $10.56
Total $48.27 $77.77 $126.04 $94.17 $88.12 $82.08 $390.40
6 | brattle.com
energy, capacity and RECs have consequences for electricity rates and employment. These
consequences, in turn, affect economic development and government tax revenues.
To estimate the impact of the REG program on electricity generation and air quality we rely on
information about the New England electricity market in general and on information provided
by National Grid about how it will use the energy, capacity and renewable attributes from the
facilities participating in the REG program.
We estimate economic impacts using IMPLAN, which is a commercial input-output model.
IMPLAN is widely used by federal, state, and local agencies to measure the impacts of regulatory
changes and major infrastructure investments.5 IMPLAN measures changes in economic activity
including Gross Domestic Product (GDP), output, jobs, and tax revenues resulting from these
changes or investments. The necessary inputs to this model are taken from information provided
by National Grid about participating projects, the New England ISO, interviews with program
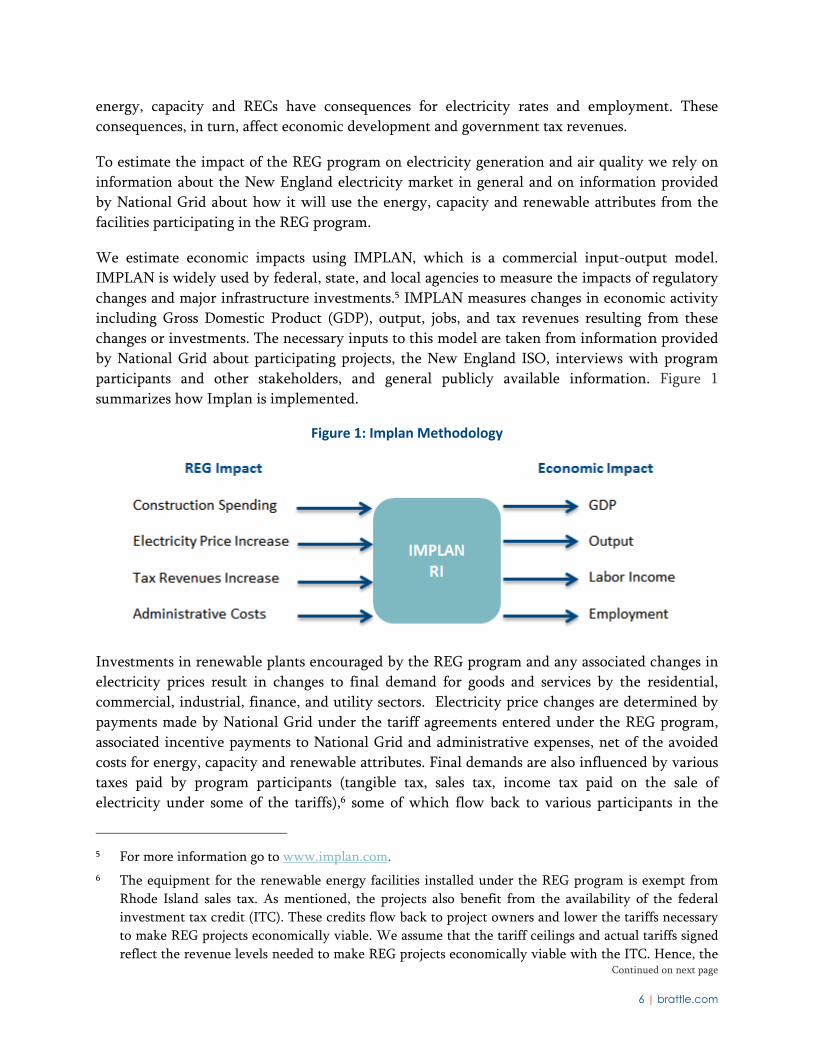
participants and other stakeholders, and general publicly available information. Figure 1
summarizes how Implan is implemented.
Figure 1: Implan Methodology
Investments in renewable plants encouraged by the REG program and any associated changes in
electricity prices result in changes to final demand for goods and services by the residential,
commercial, industrial, finance, and utility sectors. Electricity price changes are determined by
payments made by National Grid under the tariff agreements entered under the REG program,
associated incentive payments to National Grid and administrative expenses, net of the avoided
costs for energy, capacity and renewable attributes. Final demands are also influenced by various
taxes paid by program participants (tangible tax, sales tax, income tax paid on the sale of
electricity under some of the tariffs),6 some of which flow back to various participants in the
5 For more information go to www.implan.com.
6 The equipment for the renewable energy facilities installed under the REG program is exempt from
Rhode Island sales tax. As mentioned, the projects also benefit from the availability of the federal
investment tax credit (ITC). These credits flow back to project owners and lower the tariffs necessary
to make REG projects economically viable. We assume that the tariff ceilings and actual tariffs signed
reflect the revenue levels needed to make REG projects economically viable with the ITC. Hence, the Continued on next page

7 | brattle.com
Rhode Island economy, and potentially changes in income to renewable energy participants
(investors, private landowners, municipalities, affordable housing, farmers, businesses, and
households) and payments to the participating utility (National Grid) through the REG program.
IMPLAN produces estimates of economic output, employment and state tax revenues at the state
level. Economic output is a measure of economic activity, and here represents a state level GDP
reflecting the market value of all goods and services produced in one year by labor and property
supplied by residents of the state. Employment impacts are comprised of direct employees
associated with manufacturing a good or providing a service (installing solar equipment for
example), indirect employees associated with providing goods and services to the manufacturer
or primary service provider, and induced employees associated with the demand for goods and
services from households who generate additional income as direct or indirect workers.
IV. Data and Assumptions
Analyzing the jobs, economic and environmental impact of the REG program requires data and
assumptions about the capacity participating in the REG program year by program category as
well as the average tariff received by REG projects in each program year. It also requires an
estimate of the administrative costs as well as remuneration for National Grid, avoided costs of
energy, capacity and RECs, tax revenues generated by REG projects, as well as construction costs
and the Rhode Island share of construction expenditures. We describe how we account for each
of the program influences identified below.
A. PROGRAM PARTICIPATION AND TARIFFS
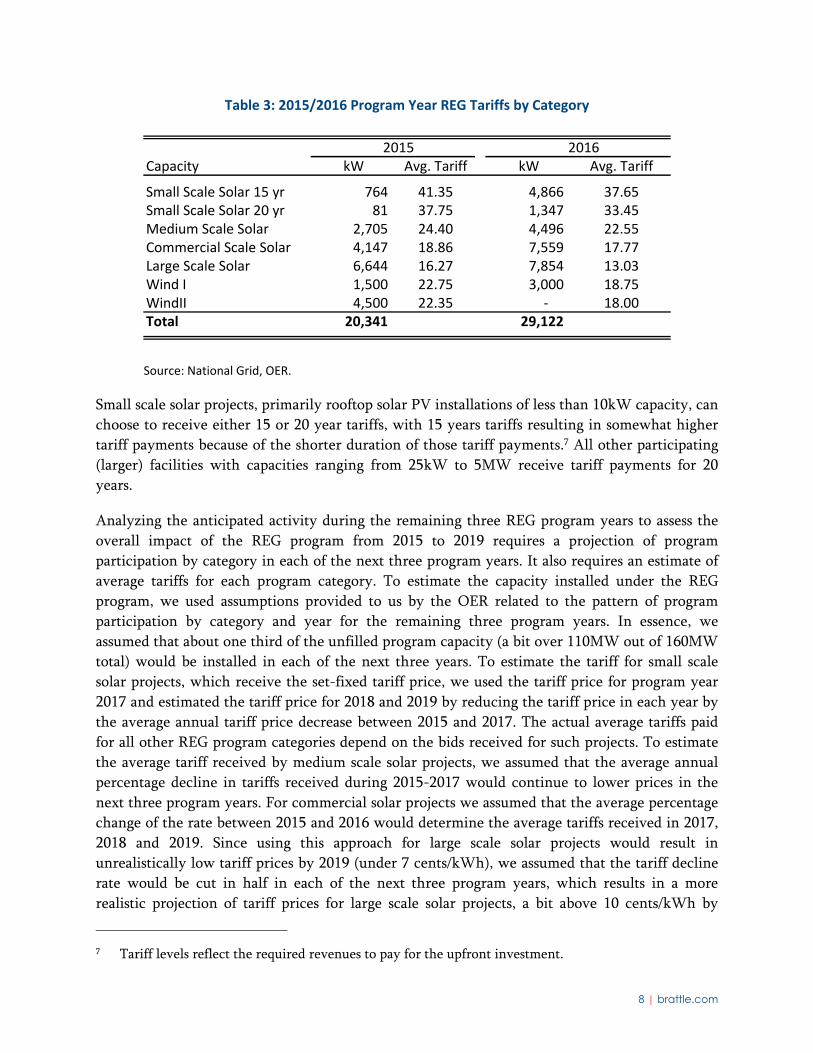
To assess the impact of the REG program, we first collected and assembled a list of actual projects
awarded tariffs in the 2015 and 2016 REG program years. Table 3 below summarizes program
participation (and average tariff) by program year and category.
Continued from previous page
benefits of the ITC to Rhode Island are already reflected in the (lower) tariff levels relative to tariffs
without the ITC.
8 | brattle.com
Table 3: 2015/2016 Program Year REG Tariffs by Category
Source: National Grid, OER.
Small scale solar projects, primarily rooftop solar PV installations of less than 10kW capacity, can
choose to receive either 15 or 20 year tariffs, with 15 years tariffs resulting in somewhat higher
tariff payments because of the shorter duration of those tariff payments.7 All other participating
(larger) facilities with capacities ranging from 25kW to 5MW receive tariff payments for 20
years.
Analyzing the anticipated activity during the remaining three REG program years to assess the
overall impact of the REG program from 2015 to 2019 requires a projection of program
participation by category in each of the next three program years. It also requires an estimate of
average tariffs for each program category. To estimate the capacity installed under the REG
program, we used assumptions provided to us by the OER related to the pattern of program
participation by category and year for the remaining three program years. In essence, we
assumed that about one third of the unfilled program capacity (a bit over 110MW out of 160MW
total) would be installed in each of the next three years. To estimate the tariff for small scale
solar projects, which receive the set-fixed tariff price, we used the tariff price for program year
2017 and estimated the tariff price for 2018 and 2019 by reducing the tariff price in each year by
the average annual tariff price decrease between 2015 and 2017. The actual average tariffs paid
for all other REG program categories depend on the bids received for such projects. To estimate
the average tariff received by medium scale solar projects, we assumed that the average annual
percentage decline in tariffs received during 2015-2017 would continue to lower prices in the
next three program years. For commercial solar projects we assumed that the average percentage
change of the rate between 2015 and 2016 would determine the average tariffs received in 2017,
2018 and 2019. Since using this approach for large scale solar projects would result in
unrealistically low tariff prices by 2019 (under 7 cents/kWh), we assumed that the tariff decline
rate would be cut in half in each of the next three program years, which results in a more
realistic projection of tariff prices for large scale solar projects, a bit above 10 cents/kWh by
7 Tariff levels reflect the required revenues to pay for the upfront investment.
2015 2016Capacity kW Avg. Tariff kW Avg. Tariff
Small Scale Solar 15 yr 764 41.35 4,866 37.65Small Scale Solar 20 yr 81 37.75 1,347 33.45Medium Scale Solar 2,705 24.40 4,496 22.55Commercial Scale Solar 4,147 18.86 7,559 17.77Large Scale Solar 6,644 16.27 7,854 13.03Wind I 1,500 22.75 3,000 18.75WindII 4,500 22.35 ‐ 18.00Total 20,341 29,122

9 | brattle.com
2019.8 For wind projects, we assumed that the tariff received would equal the tariff price in 2017
and would equal the average of the tariff received in 2016 and 2017 for the remaining two
program years, in part to reflect the fact that the tariff price for wind increased from 2016 to
2017. Table 4 below shows the assumed capacity by project category and associated average
tariffs received for the remaining three program years.
Table 4: Forecast Program Year 2017‐19 REG Tariffs by Category
Source: OER, Brattle Projections.
The capacity by program type, tariff length, and average tariff received are critical assumptions to
determine the short and long-term impacts on the Rhode Island economy from building the
facilities. These assumptions are also critical to determine the REG programs impact on
electricity costs through tariff payments made by National Grid and ultimately recovered from
ratepayers, inclusive of administrative costs and remuneration for National Grid, net of avoided
spending on energy, capacity and RECs.
B. ADMINISTRATIVE COSTS AND REMUNERATION
Administration of the REG program results in costs of the annual program. We used National
Grid’s estimate of the cost of administering the REG program. These include approximately
$900,000 for program year 2015 and $800,000 for program year 2016 to-date, plus an estimated
8 These projections remain highly uncertain, given the dynamic developments in the solar industry.
Prices for utility scale solar projects, expressed in $/MWh, the equivalent of the tariffs under the REG
program, have been falling steadily. At present, utility scale solar projects in the best US locations
receive prices as low as $50/MWh. There is however very significant variation in prices, depending on
the site and size of projects. In general, current solar projects in the Northeast receive prices between
$75 and $242/MWh (See Lazard, Lazard’s Levelized Cost of Energy Analysis – Version 10.0, page 9),
approximately 50% higher than in the Southwestern United States. Given that even large scale solar
PV projects in Rhode Island remain at the low end of the size of utility-scale projects, we expect prices
around $100/MWh (equal to a tariff of 10 cents/kWh) to be a reasonable forecast.
2017 2018 2019Capacity kW Avg. Tariff kW Avg. Tariff kW Avg. Tariff
Small Scale Solar 15 yr 4,388 34.75 3,192 31.86 1,995 29.20Small Scale Solar 20 yr 1,113 30.85 810 27.89 506 25.22Medium Scale Solar 4,001 22.75 4,001 21.99 4,001 21.25Commercial Scale Solar 5,002 16.74 5,002 15.77 5,002 14.86Large Scale Solar 19,840 11.73 19,840 11.14 19,840 10.87Wind I 4,001 19.45 4,001 19.10 4,001 19.10WindII ‐ 18.25 ‐ 18.13 ‐ 18.13Total 38,346 36,845 35,345
10 | brattle.com
$625,000 per year going forward.9 We also assumed that National Grid’s administrative costs for
bidding capacity from some of the REG projects into the capacity market would be $3,930,240,
spread over 25 years, or $157,210 per year.10 Finally, National Grid is entitled to 1.75%
remuneration for administering the REC program.11
C. AVOIDED COSTS OF ENERGY, CAPACITY AND RECS
To assess the value of avoided energy, capacity and REC related costs requires assumptions about
the wholesale energy, capacity and REC prices between now and 2040. Since each of these prices
is determined through a complex process involving multiple uncertain factors, forecasting the
value of each is, by definition, both difficult and relatively uncertain. National Grid has provided
us with its own assumptions about the forecast value of energy and REC prices and we use
National Grid’s assumptions for both, but below describe how it relates to our own assessment.
We also discuss our assumed value of capacity from REG projects National Grid is planning to
sell into the New England capacity market.
1. Avoided Energy Costs
To model the avoided energy cost of the REG program requires an assessment of how energy
production from REG facilities will impact customer energy bills over time. In theory, these
impacts can take two forms. First, energy produced from REG facilities displaces energy that
would have to be procured otherwise and hence the value of the energy procured under REG
tariffs is equal to the value of avoided energy purchases.12 Our analysis focuses on this direct
impact of REG program participant facilities on customer energy bills. A theoretical secondary
impact could be related to REG program facilities having a material impact on energy and/or
capacity prices over time. Given the small amount of energy produced by the REG program
facilities relative to the overall size of the New England market, we did not separately consider
this potential impact on customer energy costs, but discuss it in our section about other potential
benefits.
9 See Attachment PUC 1-3_Update to RR1 - COMM 3-11_to_2040_ETx_v4.xls, provided to us by
National Grid.
10 See Direct Testimony of Richard S. Hahn, In The Matter of National Grid’s Proposal To Bid Capacity
of Customer-Owned DG Facilities Into The Forward Capacity Market, Rhode Island Public Utilities
Commission, Docket No. 4676, Table 1.
11 See Joint Pre-filed Direct Testimony of Jeanne A. Lloyd and Adam S. Crary, RE Growth Factor Filing,
June 30, 2016, Page 16 of 23.
12 Note that to the extent the avoided energy would have been produced by Rhode Island power plants,
there would be a partially offsetting effect of reduced energy margins to those facilities. The impact
could be significant if the lower energy margins lead to the retirement (and associated loss of jobs and
local tax revenues) of a Rhode Island facility, but are likely much smaller if they do not result in
retirement. Given the relatively small amount of energy produced by the REG program facilities when
compared to the New England market and given that we are not aware of any Rhode Island plants
currently in danger of retirement, we did not consider this potentially offsetting effect.
11 | brattle.com
In its own calculations of the anticipated costs of the REG program, National Grid assumed an
avoided wholesale energy price of $55/MWh.13 The 2016 all-hours average locational marginal
price for the RI zone was $28.91/MWh14 (or a little under 3 cents/kWh). National Grid’s estimate
of the avoided cost of energy from REG program is therefore above recent wholesale market
prices. This difference can be due to several factors. First, the energy value of REG facilities could
be higher than the all-hours average Locational Marginal Price (LMP)15 if such facilities produce
more energy during hours with higher than average LMPs than they do in hours with below
average LMPs. We used a standard model provided by the federal National Renewable Energy
laboratory (NREL) to simulate the hourly production profile of both rooftop and open field solar
PV facilities located in Rhode Island to test to what extent the all-hour average LMP well
represents the value of output from solar PV facilities in Rhode Island and concluded that, using
2016 real time LMPs, the value of solar PV output would have been 105% of the real-time
LMP.16 Since the REG program facilities will produce electricity for decades and since this impact
analysis requires estimates through at least 2040, it is important to assess how the relationship
between all-hour average LMPs and REG facility output LMPs may evolve over time. It is
unlikely that as more solar photovoltaic (PV) facilities get added to the New England system, any
premium value of solar PV output will increase. This is because additional solar production
reduces the net demand that needs to be met by non-solar (and dispatchable) facilities setting
market prices. This in turn means that average hourly prices during hours of solar production
will likely decline as solar facilities are added to the system. The magnitude of this effect depends
on what other changes occur to the system over time. We have therefore made the simplifying
assumption – like National Grid – that the relationship of the price received by solar PV
production relative to the all-hours average price of electricity remains constant across time on a
per kWh basis.
Projecting the value of avoided energy purchases through 2040 also requires an estimate of
energy market prices over the same time period. Deriving our own independent forecast of
energy prices was beyond the scope of this report. Given the currently very low price of natural
gas and the fact that natural gas prices are the primary determinant of energy market prices in
New England, it is likely that energy prices in the future will increase, given that projections of
the natural gas price such as those made in the Annual Energy Outlook by the Energy
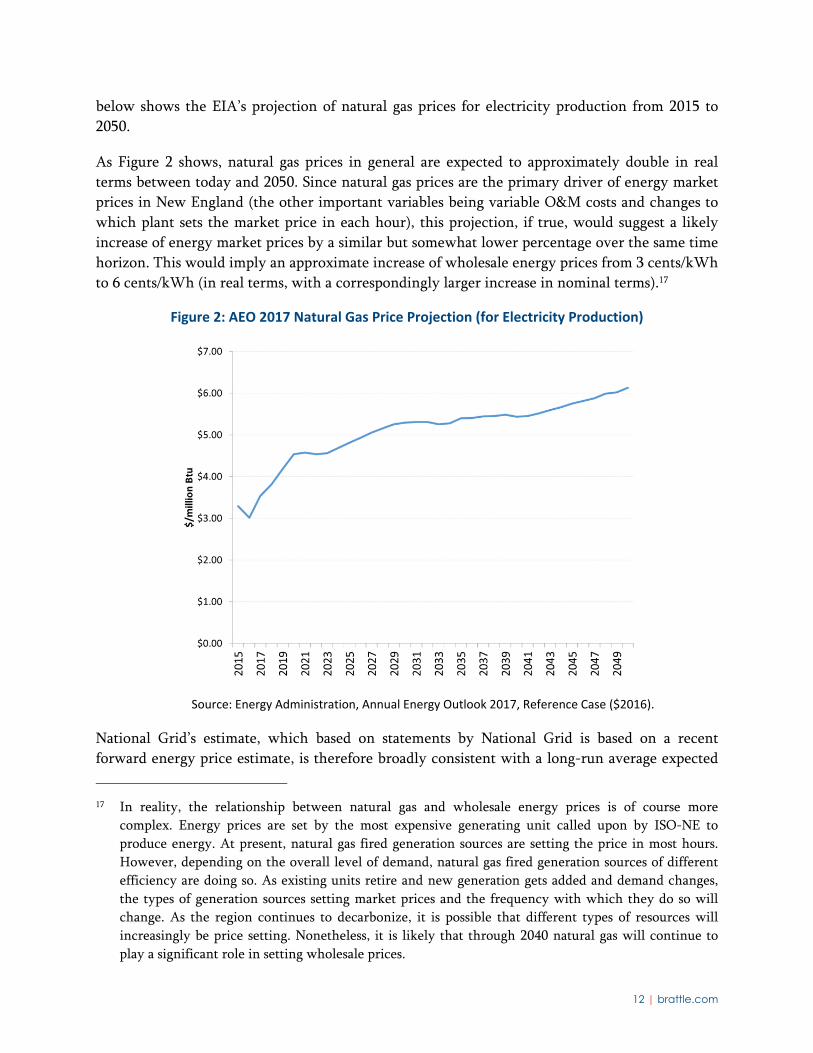
Information Administration project real increases in natural gas prices going forward. Figure 2
13 See Attachment PUC 1-3_Update to RR1 - COMM 3-11_to_2040_ETx_v4.xls, provided to us by
National Grid.
14 See ISO New England (www.iso-ne.com). We use real-time hourly LMPs to calculate the all-hours
average.
15 The LMP represents the wholesale value of electricity at a given location in the New England
wholesale electricity market administered by ISO New England.
16 See pvwatts.nrel.gov, which is freely available online. We assumed a 50/50 mix of residential and open
field installations and used a TMY3 weather station at TF Green State Airport as the reference
location.
12 | brattle.com
below shows the EIA’s projection of natural gas prices for electricity production from 2015 to
2050.
As Figure 2 shows, natural gas prices in general are expected to approximately double in real
terms between today and 2050. Since natural gas prices are the primary driver of energy market
prices in New England (the other important variables being variable O&M costs and changes to
which plant sets the market price in each hour), this projection, if true, would suggest a likely
increase of energy market prices by a similar but somewhat lower percentage over the same time
horizon. This would imply an approximate increase of wholesale energy prices from 3 cents/kWh
to 6 cents/kWh (in real terms, with a correspondingly larger increase in nominal terms).17
Figure 2: AEO 2017 Natural Gas Price Projection (for Electricity Production)
Source: Energy Administration, Annual Energy Outlook 2017, Reference Case ($2016).
National Grid’s estimate, which based on statements by National Grid is based on a recent
forward energy price estimate, is therefore broadly consistent with a long-run average expected
17 In reality, the relationship between natural gas and wholesale energy prices is of course more
complex. Energy prices are set by the most expensive generating unit called upon by ISO-NE to
produce energy. At present, natural gas fired generation sources are setting the price in most hours.
However, depending on the overall level of demand, natural gas fired generation sources of different
efficiency are doing so. As existing units retire and new generation gets added and demand changes,
the types of generation sources setting market prices and the frequency with which they do so will
change. As the region continues to decarbonize, it is possible that different types of resources will
increasingly be price setting. Nonetheless, it is likely that through 2040 natural gas will continue to
play a significant role in setting wholesale prices.
13 | brattle.com
wholesale market price, potentially including some diversity value related to the uncertainty of
future wholesale electricity prices due to potential deviations of the natural gas price from long-
term forecast prices. For these reasons, we use National Grid’s assumed avoided energy price of
5.5 cents/kWh in our analysis.
2. Avoided REC Costs
Under the REG program, participants receive a tariff payment in exchange not only for energy
and capacity, but also for environmental attributes. In particular, the REG program was at least
in part designed to create some of the supply of renewable energy necessary to meet Rhode
Island’s Renewable Energy Standard (RES) and associated renewable energy certificates (RECs).18
The production of renewable energy from REG program facilities therefore has value equal to
the avoided cost of procuring RECs outside the REG program, i.e., from other qualifying
facilities. Under the Rhode Island RES rules, renewable energy from a variety of resources
including wind, solar, small hydro, ocean energy, fuel cells using renewable fuel, and certain
biomass facilities can be used as long as they generate electricity in the markets19 administered by
ISO-NE. The avoided costs of RECs to meet the RI RES is therefore directly linked to the cost of
renewable energy (and the related cost of generating RECs) in New England overall.
Because the actual construction costs of renewable projects are private information and not
typically made public, the cost of procuring renewable energy (and RECs derived from such
renewable energy) in New England in the absence of the REG program needs to be estimated.
There are several indicators of the costs of building new renewable energy resources in New
England. They include the spot prices for RECs as well as observed prices of long-term contracts
for bundles of energy, capacity and RECs in several New England states, most importantly long-
term contracts signed in Massachusetts under Sections 83 and 83A of the Green Communities
Act.
While a potential indicator of the cost of renewable energy (more precisely of the cost above the
market value of energy and capacity from renewable resources), spot prices for RECs by
themselves can be somewhat misleading since they also reflect shorter term mismatches between
the supply of and demand for RECs. Figure 3 below shows the evolution of spot REC prices in
New England.
18 See http://programs.dsireusa.org/system/program/detail/1095 for details on the Rhode Island RES,
which requires a 10% share of renewable energy by 2016 and then grows by 1.5% per year until it
reaches 38.5% by 2035.
19 See State of Rhode Island and Providence Plantations Public Utilities Commission, Rules and
Regulations Governing the Implementation of a Renewable Energy Standard, July 25, 2007, Section 5.
14 | brattle.com
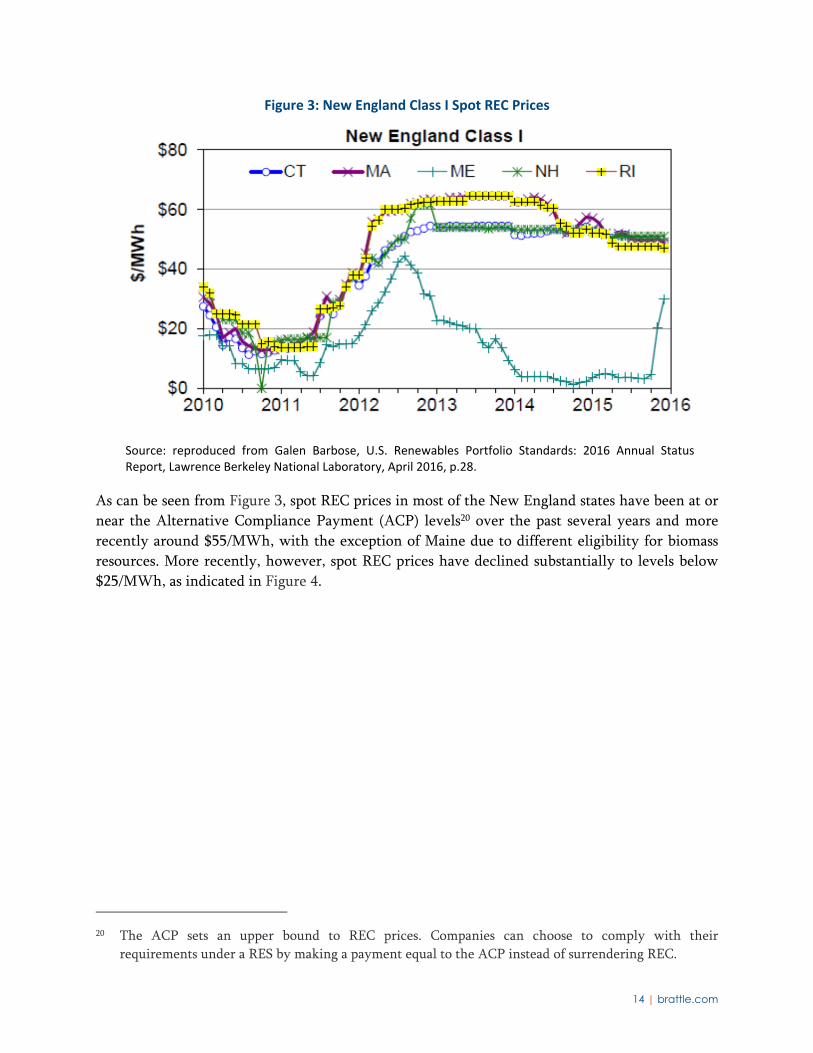
Figure 3: New England Class I Spot REC Prices
Source: reproduced from Galen Barbose, U.S. Renewables Portfolio Standards: 2016 Annual Status Report, Lawrence Berkeley National Laboratory, April 2016, p.28.
As can be seen from Figure 3, spot REC prices in most of the New England states have been at or
near the Alternative Compliance Payment (ACP) levels20 over the past several years and more
recently around $55/MWh, with the exception of Maine due to different eligibility for biomass
resources. More recently, however, spot REC prices have declined substantially to levels below
$25/MWh, as indicated in Figure 4.
20 The ACP sets an upper bound to REC prices. Companies can choose to comply with their
requirements under a RES by making a payment equal to the ACP instead of surrendering REC.

15 | brattle.com
Figure 4: Recent Development of New England REC Prices
Source: Reproduced with permission from Figure 15, Sam Newell and Jurgen Weiss, Electricity Market Impacts of the Proposed Northern Pass Transmission Project, prepared for the New Hampshire Counsel for the Public, December 30, 2016, based on SNL Financial data.
There is some evidence from recently signed long-term contracts for renewable resources that
the longer-term REC value needed to fund new renewable projects may be even lower. For
example, a relatively recent wind project PPA signed in Connecticut suggests a required long-
term REC price of $12/MWh.21
The evolution of REC price levels required to support future development of renewable energy
resources to meet current and future renewable energy obligations in New England is of course
highly uncertain. RES22 targets in several New England states will continue to increase over time
and may be further increased in light of longer term GHG emissions reductions mandates or
targets in excess of what is achievable under current RES targets. At the same time, it is likely
that there will be continued cost declines for various renewable energy technologies. It seems
reasonable to expect the value of avoided REC purchases to meet the Rhode Island RES to be
between approximately $12/MWh and $55/MWh.
21 See Power Purchase Agreement between The United Illuminating Company and Number Nine Wind
Farm, LLC as of September 19, 2013, Exhibit D, Connecticut Public Utilities Regulatory Authority,
Docket No. 13-09-19.
22 Different states use different names for their renewable energy programs, such as RES and RPS. For
convenience and to avoid confusion with the REG program, we use RES for all state level renewable
energy programs resulting in overall renewable energy targets, i.e. for both RES and RPS.
16 | brattle.com
We note that National Grid, in its REG Program Factor filing, has assumed a REC value of
$41/MWh, which is somewhat below recent (but above the most recent, as shown in Figure 4)
spot REC price levels. Nevertheless this value is in the range of reasonable REC prices. We
therefore use National Grid’s estimated REC price of $41/MWh for our analysis.
3. Avoided Capacity Costs
Renewable energy projects participating in the REG program help meet overall capacity needs in
two potential ways. First, smaller behind the meter systems are currently not allowed to
participate in the New England ISO forward capacity market (FCM), but can still have a
beneficial impact by reducing the installed capacity requirement (ICR) that forms the basis for
procuring capacity on the FCM. However, given the relatively modest size of these types of
installations, the fact that even in the near-term the impact of small scale and behind the meter
solar PV generation on the ICR is likely relatively modest and given that this impact will likely
continue to decline as more solar PV capacity is added to the New England system, we have not
attempted to estimate the magnitude of this contribution, making our estimates somewhat
conservative.
Second, separately metered solar PV (and other renewables) projects can in theory provide
capacity value through their participation in the ISO New England’s capacity market. At present,
participation is limited to resources above 100 kW in size.23 National Grid has stated that it plans
to sell capacity from non-residential REG projects of 250kW and larger into the FCM.24 The ISO
qualifies approximately 35% of the nameplate capacity of solar PV resources in the forward
capacity auctions (FCA).25 We estimate, based on National Grid’s proposal, that REG capacity of
250kW and above will be bid into the FCM beginning with FCM#12 for the summer period, i.e.
23 ISO New England, Distributed Generation/PV in the Forward Capacity Market, September 15, 2014
24 National Grid, PROPOSAL TO BID CAPACITY OF CUSTOMER-OWNED DG FACILITIES INTO
THE FORWARD CAPACITY MARKET, Joint pre-filed testimony and schedules of Stefan Nagy and
Scott McCabe, November 18, 2016, p. 13 of 34. Even though about two thirds of medium scale solar
PV projects installed in program years 2015-2016 meet the minimum threshold set by National Grid
(they are exactly 250kW in size), we have assumed that National Grid would only bid commercial and
large scale solar PV systems into the forward capacity markets. It is possible that the administrative
effort associated with bidding smaller projects (between 100kW and 249kW) into the market may
exceed the capacity market revenues that would be generated from selling such capacity. However,
even in the absence of formally bidding the capacity into the forward capacity market, REG program
facilities may have some (small) capacity value. To the extent they provide energy during peak
demand periods, they may reduce the amount of capacity needed to be procured through the forward
capacity market. For the portion of the 160 MW of REG program capacity not bid into the New
England forward capacity market, this effect is likely small.
25 Ibid.
17 | brattle.com
the months of June, July, August and September.26 We also use National Grid’s assumed capacity
contribution of 34.7%, which is based on the actual performance of four large solar PV facilities
owned by Massachusetts Electric Company, which in turn is owned by National Grid, between
2012 and 2015.27 Even though wind facilities can provide capacity in the New England market,
based on the National Grid proposal to bid only solar REG capacity in the capacity market, we
did not assume that wind project capacity under the REG program will generate capacity market
revenues, again making our estimates somewhat conservative.28
Evaluating the REG capacity benefit in the New England Forward Capacity Market requires not
only an assessment of the participating quantity, but also of the prices obtained. The correct price
to use for estimating the value of REG capacity is the estimated price of future capacity auctions.
Forecasting this value is a complex task and well beyond the scope of our analysis. However,
given the dynamics of the FCM, it is possible to place reasonable bounds on future capacity
prices. Notably, recent capacity prices in situations of surplus capacity likely provide an estimate
of the lower bound of prices. On the other hand, ISO New England’s estimate of Net CONE (Net
Cost of New Entry) provides an estimate of the upper bound of capacity prices. ISO New England
has recently proposed a change of Net Cone for FCA#12. The recently concluded FCA#11
resulted in a market-clearing price of $5.297/kW-month.29 The ISO NE also recently proposed a
Net Cone value of $8.04/kW-month for FCA#12.30 Given the uncertainty of capacity prices over
time, we have assumed a capacity value equal to the average of the most recent (FCA#11)
clearing price and ISO New England’s proposed Net Cone for FCA#12, equal to $6.685/kW-
month to estimate the capacity value of REG projects installed during REG program.
We have also used National Grid’s estimate of administrative costs for selling REG facility
capacity into the market between 2017 and 2040, equal to $3,930,240. For simplicity, we have
assumed this cost to occur in equal annual installments over 25 years.
26 Direct Testimony of Richard S. Hahn IN THE MATTER OF NATIONAL GRID’S PROPOSAL TO BID
CAPACITY OF CUSTOMER-OWNED DG FACILITIES INTO THE FORWARD CAPACITY
MARKET, Rhode Island Public Utilities Commission Docket Nr. 4676, January 20, 2017, p. 6
27 Ibid, p.9.
28 The percentage of wind generators’ nameplate capacity qualifying as capacity in the New England
ISO’s forward capacity market depends on individual facilities’ (historic) performance during winter
and summer peak. For wind facilities with nameplate capacity above 20 MW currently having a
capacity supply obligation, the average capacity qualifying for the forward capacity market is 33% in
the winter and 11% in the summer, resulting in a simple average of 22% (see ISO New England, 2016
CELT Report). Hence, to the extent National Grid will decide, as it has stated, on a case by case basis
on whether or not to bid capacity from REG projects into the capacity market, wind projects could
provide additional value not captured in our analysis.
29 ISO New England, Forward Capacity Auction #11 Results Summary.
30 ISO New England, Cost of New Entry and Offer Review Trigger Prices, Revisions to Market Rule 1,
December 6, 2016, p.4.

18 | brattle.com
Finally, a recent decision by the Rhode Island Public Utility Commission awards National Grid
10% of annual revenues generated by the sale of REC capacity into the New England capacity
market. The remaining 90% of revenues generated annually are used to offset the program costs.
4. Summary of Avoided Energy, Capacity and REC Assumptions
In its most recent REG Program Factor Filing and associated testimony31 National Grid assumed
that the energy value of electricity produced from REG Program facilities would be equal to 5.5
cents/kWh for all facilities other than the residential program facilities in all future years.
Separately, National Grid includes an assumed REC value of 4.1 cents/kWh.
National Grid’s assumptions regarding the avoided energy and REC costs due to the REG
program therefore seem at the high end of the range of reasonable assumptions.
We have made one significant change to National Grid’s calculations with respect to the energy
and REC value of REG Program facilities. We have assumed that energy produced by host owned
small-scale solar PV facilities will also avoid energy purchases with a value of 5.5 cents/kWh.32
In addition to the benefits assumed by National Grid (with the addition of the energy and REC
value of owner-owned residential solar PV systems) used in its factor filing to calculate the net
cost of the REG Program costs, we have also added the estimated capacity value benefit, net of
administrative costs, for facilities of 250kW or greater.33
D. TAXES
A number of REG program participants may be subject to various taxes. The (state) taxes paid by
REG program facilities will flow back to Rhode Island entities and therefore ultimately benefit
Rhode Island residents.
31 Joint Pre-filed Direct Testimony of Jeanne A. Lloyd and Adam S. Crary, RE Growth Factor Filing,
June 30, 2016
32 National Grid treated these systems as purely load-reducing. Ultimately, however, any kWh produced
by a REG program facility makes it unnecessary to produce such a kWh of electricity by some
alternative means, assuming overall end-use demand remains unchanged.
33 In its proposal, National Grid proposes to sell capacity from non-residential projects of 250kW or
more. (National Grid, PROPOSAL TO BID CAPACITY OF CUSTOMER-OWNED DG FACILITIES
INTO THE FORWARD CAPACITY MARKET, Joint pre-filed testimony and schedules of Stefan Nagy
and Scott McCabe, November 18, 2016, p.13). However, other exhibits in National Grid’s testimony
suggest that at least initially only commercial and large scale projects (with capacity of 251kW or
greater) may be bid into the capacity market (Ibid, Schedule NG-2). We therefore use this assumption,
which results in a qualified capacity of just below 35 MW of solar facilities, very similar to National
Grid’s assumptions (Ibid, Schedule NG-3).
19 | brattle.com
Specifically, based on recent regulations, commercial renewable projects are subject to a tangible
tax of $5/kW per annum, effective January 1, 2017.34 By the regulation, residential and projects
on manufacturing properties are exempt from the tax, as are projects having concluded
interconnection agreements on or before December 31, 2016.35 Since we were unable to verify
which of the non-residential REG projects were (or will be) on manufacturing sites, we have
assumed that the $5/kW-year tangible tax will apply to all non-residential projects under the
program.
The sale of energy, capacity and RECs under the REG program tariffs is also potentially subject to
gross earnings and sales and income taxes.36 Residential systems are exempt since they are not
deemed to be selling electricity to National Grid, but rather use the renewable systems to offset a
portion of the electricity they otherwise purchase from the grid. All customers (except exempt
manufacturing sites) under the REG program are subject to a gross earnings tax of 4%. Non-
residential customers are also subject to a 7% sales tax.37
In addition, the earnings stemming from the sales under the REG program by commercial
program participants are subject to federal and Rhode Island income taxes. Since federal taxes are
flowing out of Rhode Island, we have assumed they have no impact on the State.38 The Rhode
Island state income tax varies from 3.75% for income below $60,500 per year to 5.99% for
income above $137,500.39 Given that residential systems are exempt from the tax and since REG
sales revenues would be incremental, we have assumed that income from the sale of electricity
under the REG tariff will incur state income tax at a rate of 5.99% on the sales (minus tangible,
gross earnings and sales taxes) under REG program tariffs.
34 State of Rhode Island and Providence Plantations, Department of Administration, Office of Energy
Resources, Rules and Regulations for Commercial Renewable Energy Systems Tangible Tax Value,
Effective Date: January 1, 2017.
35 Ibid, pages 4-5.
36 The renewable equipment itself is exempt from Rhode Island sales tax, but revenues from selling
electricity by non-residential customers under REG tariffs is not.
37 National Grid, National Grid Policies Regarding Taxation and the Rhode Island Renewable Energy
Growth Program.
38 As explained above, the REG program is also benefitting from the existence of the ITC. However, our
analysis already captures the effect of the ITC in that we assume that tariff ceilings and actual tariffs
signed under the REG program are set to make REG project economically viable, recognizing that
REG projects have received and/or will receive the ITC. Absent the ITC, the tariffs required to make
REG projects economically viable would be higher as would be the rate increase needed to pay for the
above-market cost under the REG tariffs.
39 See Rhode Island Department of Revenue Division of Taxation, Inflation-adjusted amounts set for tax
year 2016, December 11, 2015.

20 | brattle.com
V. Results
In this section, we present the results of our analysis of the jobs, economic and environmental
impacts of the REG program. The impact period extends through 2040 because the tariffs
associated with the program extend through 2040.40
We first present the economic impacts between 2015 and 2019 stemming primarily from the
construction of renewable facilities under the REG program, with only a small amount of
impacts from tariffs and ongoing operations and maintenance for projects already producing
electricity during this time period. We then present impacts during the “tariff phase” of the REG
program, composed of tariff costs (tariff payments, administrative costs and remuneration, net of
avoided energy, capacity and REC costs), operations and maintenance expenses and various taxes
paid by program participants. Next we present the net jobs and economic impacts accounting for
both effects. We conclude with a discussion of the estimated environmental benefits of the REG
program. Details on our calculations are presented in Appendix A.
A. IMPACT OF THE REG PROGRAM DURING CONSTRUCTION PHASE
Renewable facilities constructed as a result of REG program participation have positive economic
impacts on Rhode Island especially during the period 2015-2019 when most of the renewable
projects will be constructed.41 Since a small portion of REG program facilities will already be
operational in this time period, the economic impacts we present also include the effect of tariffs,
operations and maintenance costs and taxes resulting from these operating facilities. Direct
effects include employment, labor income and changes to gross domestic product (GDP).
IMPLAN enables us to estimate economic impacts measured in terms of employment, labor
income, GDP and output. We can also distinguish impacts as direct, indirect, and induced. Direct
effects include impacts directly associated with the construction and operation of the
investments made as a result of the REG program. Indirect impacts account for good and services
associated with the construction and operations provided by third parties. Induced impacts
40 Since REG program participants have 24 months from the date of obtaining a tariff to entering
commercial operation, a small portion of the program impacts could extend to 2041 since some of the
tariffs under the 2019 program year with terms of 20 years may not come into force into until late
2020. Since the effect of these additional benefits is small (due to discounting), we conservatively omit
these small benefits from our analysis.
41 Since REG program participants have 24 months from obtaining a tariff to beginning commercial
operation, we had to make assumptions about the timing pattern of entry. For the purpose of
estimating the economic impact of the construction phase, we assumed construction would be
completed entirely in the program year in which a project obtained a tariff. This is in part due to the
difficulty of estimating which portions of project investment would take place when. For the tariff
payments portion of the program, we assumed that projects would begin generating electricity over
the first 24 months – spanning up to three calendar years – following and including the program
award year. We assumed a timing of entry that approximately results in the tariff payments made by
National Grid for program years 2015 and 2016.
21 | brattle.com
reflect spending by workers associated with direct and indirect activities, employment, and labor
income.
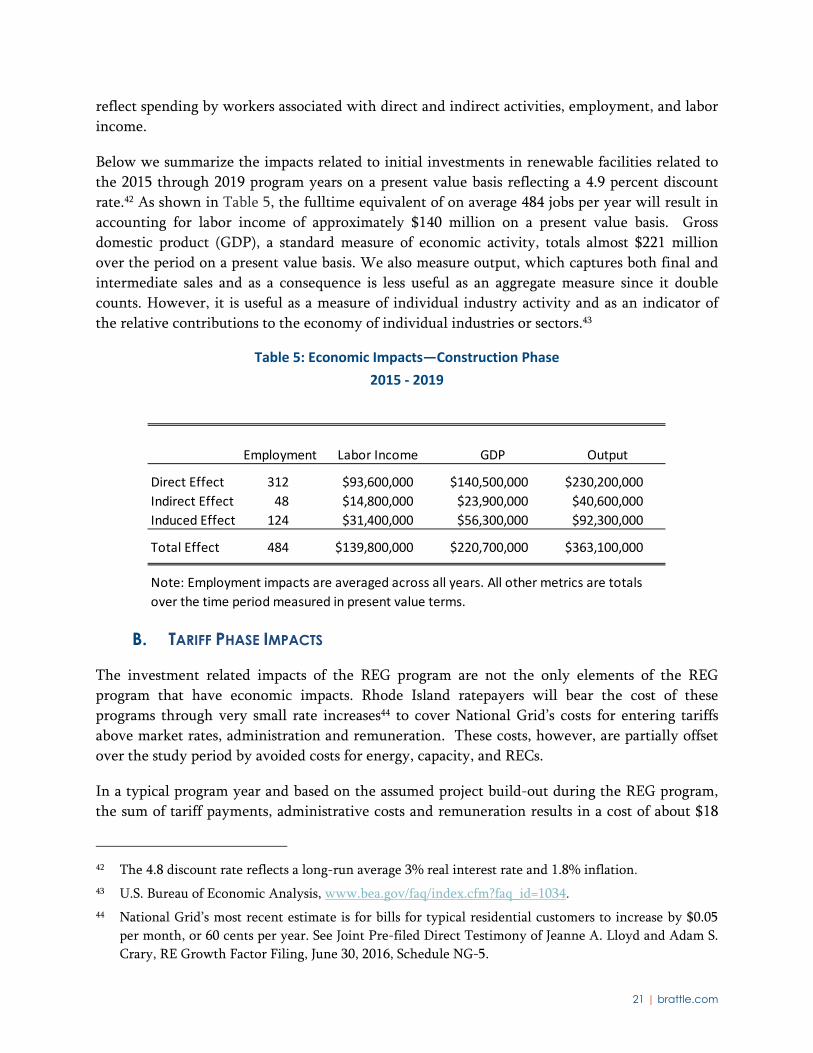
Below we summarize the impacts related to initial investments in renewable facilities related to
the 2015 through 2019 program years on a present value basis reflecting a 4.9 percent discount
rate.42 As shown in Table 5, the fulltime equivalent of on average 484 jobs per year will result in
accounting for labor income of approximately $140 million on a present value basis. Gross
domestic product (GDP), a standard measure of economic activity, totals almost $221 million
over the period on a present value basis. We also measure output, which captures both final and
intermediate sales and as a consequence is less useful as an aggregate measure since it double
counts. However, it is useful as a measure of individual industry activity and as an indicator of
the relative contributions to the economy of individual industries or sectors.43
Table 5: Economic Impacts—Construction Phase
2015 ‐ 2019
B. TARIFF PHASE IMPACTS
The investment related impacts of the REG program are not the only elements of the REG
program that have economic impacts. Rhode Island ratepayers will bear the cost of these
programs through very small rate increases44 to cover National Grid’s costs for entering tariffs
above market rates, administration and remuneration. These costs, however, are partially offset
over the study period by avoided costs for energy, capacity, and RECs.
In a typical program year and based on the assumed project build-out during the REG program,
the sum of tariff payments, administrative costs and remuneration results in a cost of about $18
42 The 4.8 discount rate reflects a long-run average 3% real interest rate and 1.8% inflation.
43 U.S. Bureau of Economic Analysis, www.bea.gov/faq/index.cfm?faq_id=1034.
44 National Grid’s most recent estimate is for bills for typical residential customers to increase by $0.05
per month, or 60 cents per year. See Joint Pre-filed Direct Testimony of Jeanne A. Lloyd and Adam S.
Crary, RE Growth Factor Filing, June 30, 2016, Schedule NG-5.
Employment Labor Income GDP Output
Direct Effect 312 $93,600,000 $140,500,000 $230,200,000
Indirect Effect 48 $14,800,000 $23,900,000 $40,600,000
Induced Effect 124 $31,400,000 $56,300,000 $92,300,000
Total Effect 484 $139,800,000 $220,700,000 $363,100,000
Note: Employment impacts are averaged across all years. All other metrics are totals
over the time period measured in present value terms.
22 | brattle.com
million in excess of the avoided energy, capacity, and REC payments from the REG projects.
Program participants also pay approximately $6 million in various Rhode Island taxes (tangible
tax, gross earnings tax, sales tax, and RI income tax). Once these additional RI government
revenues in the form of various taxes are factored in, the total net cost to Rhode Island of the
REG program is about $12 million in a typical year. Net costs are lower in early and later years as
tariff payments are not made to the full set of REG projects. The higher rates affect residential,
commercial and industrial electricity customers. We have used information by National Grid to
allocate the REG program costs to various customer classes (including government).45 The
government sector is also assumed to pay higher electricity rates, but also receives higher direct
tax revenues from REG program participants. The additional payments and revenues are used as
inputs to our economic model to estimate the economic impacts associated with these payments
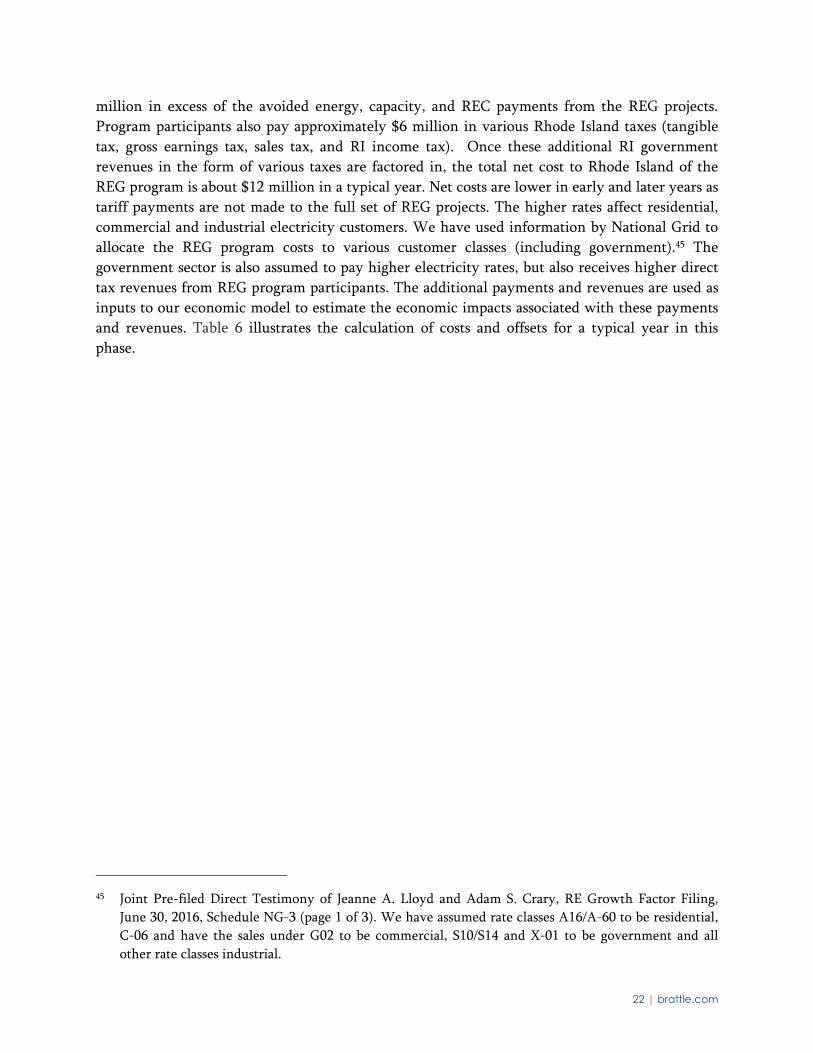
and revenues. Table 6 illustrates the calculation of costs and offsets for a typical year in this
phase.
45 Joint Pre-filed Direct Testimony of Jeanne A. Lloyd and Adam S. Crary, RE Growth Factor Filing,
June 30, 2016, Schedule NG-3 (page 1 of 3). We have assumed rate classes A16/A-60 to be residential,
C-06 and have the sales under G02 to be commercial, S10/S14 and X-01 to be government and all
other rate classes industrial.
23 | brattle.com
Table 6: Revenues and Costs Associated with the REG Program in Year 8
It is important to recognize that the results presented here are sensitive to several key
assumptions. First, the estimated impacts of program years 2017-2019 rely on our assumptions,
highlighted above, about the renewable capacity built in each of the REG program categories and
the evolution of average tariff prices for those program categories. Second, the study assumes
average avoided energy costs of $55/MWh, based on National Grid’s assumption reflecting
relatively recent forward prices for electricity. Recent wholesale market prices have been
somewhat lower than $55/MWh. If current low prices persist, the benefits of avoided energy
costs could be correspondingly lower. If on the other hand wholesale electricity prices increase
substantially, for example as a consequence of natural gas prices increasing more than forward
markets are assuming or as a consequence of prolonged periods of unexpectedly cold winter or
hot summer days, the benefits of avoided energy purchases could be larger. Similarly, future
capacity and REC prices are uncertain and could be higher or lower than we assume, resulting in
[1] Total MWh 209,311
[2] Total Tariff Costs $37,236,720
Avoided Costs
Total Energy Value REG program ‐$11,512,126
Total REC Value REG program ‐$8,581,766
Total Capacity Value REG program ‐$841,174
[3] Total Avoided Costs ‐$20,935,066
Administrative Costs
Remuneration for NG $651,643
REG Program Admin Costs $625,000
Capacity Market Admin Costs $157,210
[4] Total Administrative Costs $1,433,852
[5] Total Net Market Cost of REG Program $17,735,506
[6] Total Offsetting Tax Revenues ‐$5,768,122
[7] Total Net Program Cost $11,967,385
[1]: Estimated total MWh generated by REG projects.
[2]: Total ratepayer REG program tariff payments.
[3]: Estimated total costs avoided due to REG program.
[4]: Estimated REG program administrative costs.
[5]: [2] + [3] + [4].
[6]: Estimated additional tax revenue due to REG program.
[7]: [5] + [6].

24 | brattle.com
correspondingly higher or lower benefits from avoided capacity and REC purchases. The annual
costs and offsets for each year between 2015 and 2040 are provided in Appendix A.
Finally, adding renewable capacity may provide additional benefits including T+D savings and
protection against natural gas price spikes, which the state and New England have experienced in
recent years. At the same time, these additions may also result in higher grid costs. More
definitive calculations of these benefits are beyond the scope of this report.
Table 7 provides our estimate of impacts for the Tariff phase, 2020 and 2040, the period when the
REG tariffs are assumed to be in force.46 The economic impacts during this period are more
modest than the initial period because very little construction is expected and the impact of
higher electricity rates has some modest negative impacts. Much of the latter is offset by the
increase in economic activity associated with operations and maintenance of the renewable
investments. The impact net on employment is actually small but negative— approximately 6
jobs lost annually on average. Labor income on a present value basis, however, is modestly higher
because by the end of the period higher paying operations and maintenance (O&M) jobs and the
decline in tariff payments result in a net gain. GDP gains are small and positive on a present
value basis for the same reason. Overall, the net impacts are, as noted above, very modest. They
are certainly within the uncertainty band that surrounds these estimates suggesting that actual
employment impacts in this phase could also be zero.
Table 7: Economic Impacts—Tariff Phase
2020 ‐ 2040
46 We estimate the economic impacts between 2020 and 2040 even though tariff payments will be
staggered beginning in 2015 and are reflected in our impact results for 2015-2019. As described
earlier, the discrepancy is likely immaterial and will depend on the unknown timing pattern of when
REG program facilities will commence commercial operation. At present, the vast majority of non-
residential program participants have not reached commercial operation.
Employment Labor Income GDP Output
Direct Effect 2 $15,200,000 $35,800,000 $36,400,000
Indirect Effect ‐9 ‐$13,200,000 ‐$21,500,000 ‐$36,500,000
Induced Effect 1 $600,000 $1,000,000 $1,700,000
Total Effect ‐6 $2,600,000 $15,300,000 $1,600,000
Note: Employment impacts are averaged across all years. All other
metrics are totals over the time period measured in present value terms.

25 | brattle.com
C. REG PROGRAM NET ECONOMIC IMPACTS
In this section, we present the net impact of the REG program, namely the combined effect of
upfront investments in renewable facilities and of higher rates (and tax revenues) for electricity
consumers and the government during the time period when REG program participants receive
payments (or bill credits) under the REG program. A detailed presentation of our calculations is
shown in Appendix A. Table 8 presents the PV of the REG program for the entire period
through 2040. Eighty-eight annual jobs are associated with the program on average over the
entire program period, although as discussed above, the largest number of jobs are accounted for
during the construction period. The present value of the program’s impact on labor income over
the entire period is over $142 million. The contribution to GDP over the period also on a present
value basis is about $236 million. The present value of output is over $365 million.
Table 8: Economic Impacts—Program Life
2015 ‐ 2040
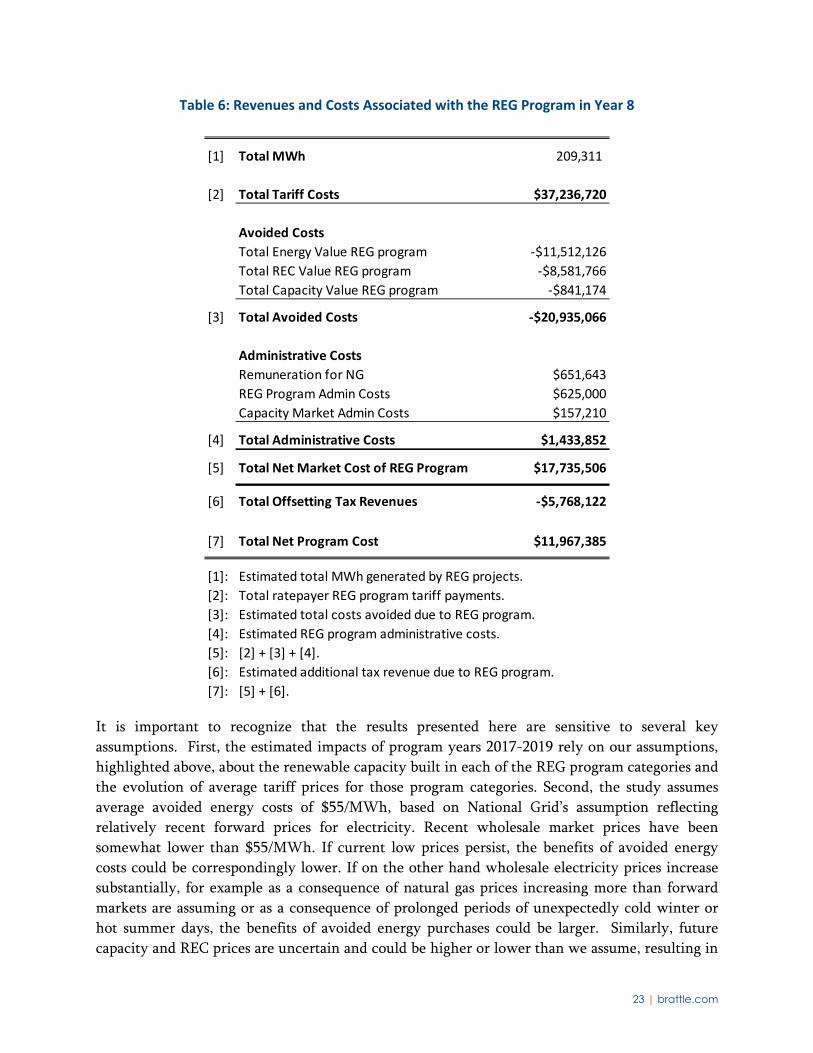
Figure 5 shows the estimated net impact of the REG program (for all program years) on RI state
GDP, presented in present value terms, both on a year by year and on a cumulative basis.
Employment Labor Income GDP Output
Direct Effect 62 $108,800,000 $176,300,000 $266,500,000
Indirect Effect 2 $1,600,000 $2,400,000 $4,100,000
Induced Effect 25 $32,000,000 $57,300,000 $94,000,000
Total Effect 88 $142,400,000 $236,000,000 $364,700,000
Note: Employment impacts are averaged across all years. All other
metrics are totals over the time period measured in present value terms.
26 | brattle.com
Figure 5: Expected Incremental Impact of REG Program on Net Present Value of State GDP
As can be seen in Figure 5, the impact of the REG program on state GDP is expected to be
strongly positive during the construction phase of the program, i.e., in the years 2015-2019,47
followed by very small negative impacts on state GDP, primarily driven by the reduction in
consumer spending in Rhode Island due to payments under the REG tariffs in excess of the
avoided payments for energy, capacity, and RECs through 2031. The increases in tariffs are small
enough to have a trivially negative impact on state GDP so that overall the REG program is
estimated to have substantially positive impacts on Rhode Island state GDP.
47 We capture the benefits from 2015 representing the first year under the program.

27 | brattle.com
Figure 6 shows the estimated net impact of the REG program on Rhode Island jobs.
Figure 6: Expected Incremental Impact of REG Program on RI jobs
Figure 6 shows that consistent with GDP, employment impacts are greatest during the
construction phase of the program (these jobs are not permanent), followed by a small negative
employment effect after the projects are completed. The small incremental loss of further jobs
after construction is the result of two (partially offsetting) factors: on the positive side, the REG
program facilities are estimated to require on average approximately 12 maintenance jobs.
Additionally, spending on new administrative services at National Grid creates approximately 9
direct and indirect jobs annually on average. On the other hand, the slightly higher rates paid by
Rhode Island electric customers to finance the costs of the REG program (tariffs, administration,
remuneration) reduce disposable income, which in turn results in an expected loss of
approximately 26 jobs per year, resulting in a net loss of about 6 jobs in each year of the program
post construction through 2034. Job impacts become positive in 2034 as tariffs and the associated
electricity rate impact decrease.
28 | brattle.com
D. REG ENVIRONMENTAL IMPACTS
As discussed in Section III, environmental impacts are measured by determining the reduction in
emissions of CO2 and the criteria pollutants compared to the emission levels absent the REG
program.48 We calculate the avoided cost of emission allowances resulting from the programs by
multiplying emission reductions induced by the program by estimated emissions allowance costs,
which in New England are currently equal to the allowance prices under the Regional
Greenhouse Gas Initiative (RGGI).49 As an alternative measure of the value of reduced emissions,
we also translate these emissions reductions into dollar damages avoided reflecting the harm to
human, health, and the environment avoided by the renewable capacity added under the REG
program. We use the current marginal emissions rates in New England to estimate avoided
emissions. By itself, this likely overstates expected emissions reductions since, based on existing
policy goals in New England, marginal emissions rates are expected to decline over the coming
decades. However, we also note that even though REG program facilities will roll-off REG tariffs
between 2035 and 2040, the emissions benefits from REG facilities are expected to continue since
typical REG program facilities have a life span in excess of the 15-20 year tariff terms, which
leads to our approach likely understating emissions reductions.50
1. Emissions
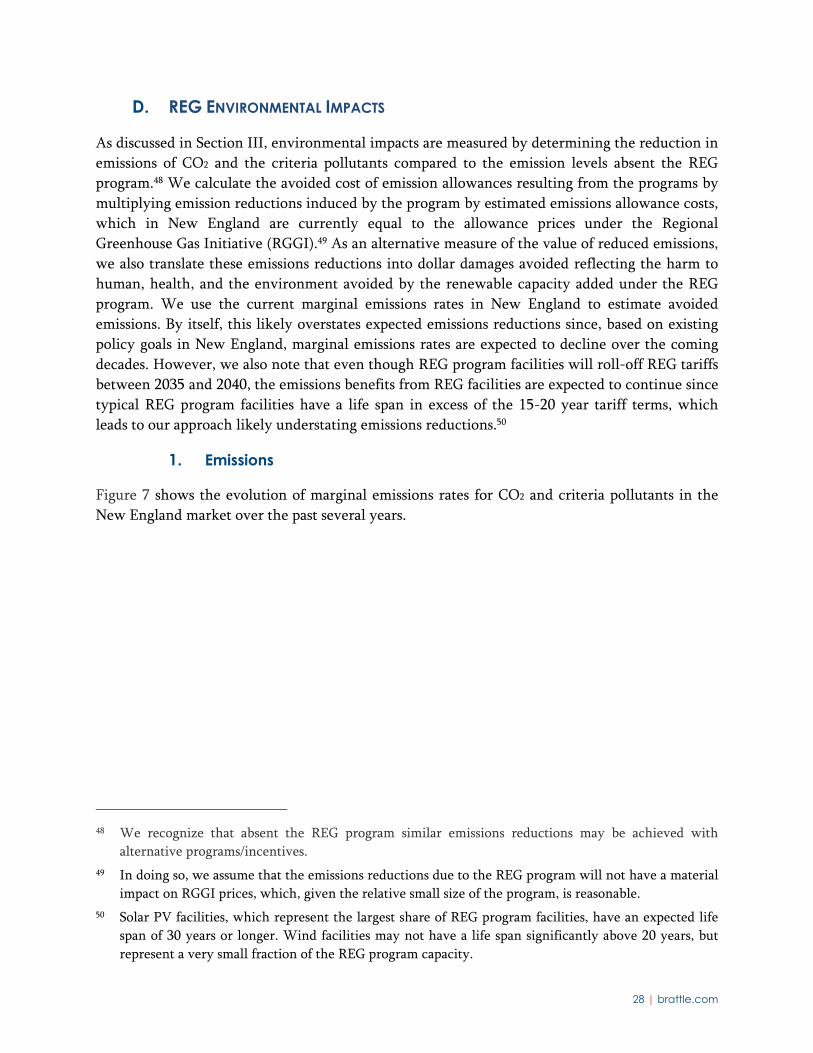
Figure 7 shows the evolution of marginal emissions rates for CO2 and criteria pollutants in the
New England market over the past several years.
48 We recognize that absent the REG program similar emissions reductions may be achieved with
alternative programs/incentives.
49 In doing so, we assume that the emissions reductions due to the REG program will not have a material
impact on RGGI prices, which, given the relative small size of the program, is reasonable.
50 Solar PV facilities, which represent the largest share of REG program facilities, have an expected life
span of 30 years or longer. Wind facilities may not have a life span significantly above 20 years, but
represent a very small fraction of the REG program capacity.
29 | brattle.com
Figure 7: Marginal Emissions Rates for All Generation Sources 2009‐2015
Source: Reproduced from Figure 5‐9, 2015 ISO New England Electric Generator Air Emissions Report, ISO New England, January 2017.
To calculate the impact of the REG program on CO2 and other criteria pollutants requires
estimating the emissions rates of the generation sources displaced by electricity production from
REG facilities. Given the relatively small overall volume of electricity produced by the REG
program (compared to total electricity produced in the New England market), the most recent
marginal emissions rates in New England are reasonable indicators of how many emissions will
be avoided by REG facility generation going forward.51 In 2015, the marginal emissions rate for
CO2 in the NE-ISO market was 857 lb/MWh. The marginal all-hours average emissions rate for
SO2 was 0.33 lb/MWh and the marginal emissions rate for NOx was 0.28 lb/MWh.52 We note that
these emissions rates are lower than those used in our 2014 report. This is due to the fact that we
now have access to ISO NE specific marginal emissions rates and that marginal emission rates in
New England have been decreasing (and, as we just noted, will likely continue to decrease).
Given the uncertainty about the rate of decline of marginal emissions rate and about the ultimate
useful life of REG program facilities beyond the tariff terms, we use these marginal emissions
rates to estimate the total amounts of emissions reductions from the REG Program. Based on this
simple approach, total CO2 emissions reductions due to the REG program are expected to be 1.5
51 Given the overall regional goal towards electric sector carbon reductions, marginal emissions rate may
decrease over time. However, the change in marginal emissions rates over the coming decades is
highly uncertain and its estimation beyond the scope of our analysis.
52 ISO New England Electric Generator Air Emissions Report, ISO New England, January 2017, Table 5-
3, page 24.

30 | brattle.com
million tons. Reductions for the criteria pollutants SOx, NOx, and PM2.5 are 582, 494, and 53 tons
respectively.53
2. Allowance Costs
Figure 8 shows recent values of RGGI allowance prices, which are the appropriate allowance
prices for estimating the value of avoided allowance costs as a result of the REG program.
Figure 8: RGGI Allowance Prices
Source: Draft 2016 RGGI Program Review Reference Case Results, RGGI, February 2, 2016, page 9.
RGGI prices going forward are highly uncertain since they not only depend on the evolution of
the New England power system over time but also on potential further changes to the RGGI
program itself. With this caveat, under current RGGI rules, RGGI prices are projected to increase
over time from current levels around $3/allowance based on the most recent auction54 to
approximately $15/allowance in nominal terms by 2030 as shown in Figure 8.
53 These estimates represent emissions reductions relative to emissions under the current New England
market. We do not attempt to estimate what emissions reductions would have occurred through other
programs in the absence of the REG program.
54 The clearing price for the last RGGI auction, auction #35, was $3 (Potomac Economics, Market
Monitor Report for Auction 35, March 10, 2017, page 8.

31 | brattle.com
Assuming that, in nominal terms, RGGI allowance prices will increase steadily from today to
2030 and then continue to grow by the same annual amount55 would result in the emissions
reductions having the value outlined in Figure 9 below.
Figure 9: Value of CO2 Emissions Allowance Reductions (Nominal) for Year Ending March 31
Discounted at 4.9% per annum,56 these allowance values sum approximately $13 million over the
entire life of the REG program.
3. Damages Costs of Pollutants
Alternatively, we also present the potential value of reduced emissions using estimated damages
caused by emissions of CO2, SOx, NOx and PM2.5.
55 The evolution of RGGI prices is highly uncertain. Given that our analysis time frame extends beyond
the time frame examined by RGGI, the projection of RGGI prices beyond 2030 is particularly
uncertain and will substantially depend on the evolution of the New England electricity supply mix as
well as potential changes to RGGI itself.
56 We use 4.9% as the discount rate, based on an estimate of the nominal risk-free rate and the nominal
discount rate we used in our 2014 report. See also Blue Chip Economic Indicators, Volume 39, No. 3.
March 10, 2014.

32 | brattle.com
The Social Cost of Carbon (SCC) is a frequently used measure of the damages caused by CO2
emissions. There are multiple measures of the social cost of carbon, depending on the choice of
discount rate, the year of assumed emissions, and whether or not average or 95th percentile
damages resulting from an incremental ton of CO2 emissions are estimated. The SCC ranges from
$10/ton to $212/ton.57 Given the wide range of estimates and typical values of the SCC often
used, we use the 2020 SCC value assuming a 3% discount rate, equal to $42/ton, for our
analysis.58
The expected PV of avoided damages from CO2 using the Social Cost of Carbon is $51 million for
the entire REG program. We also estimated the net present value of criteria pollutant reductions.
Table 9 below shows the assumed damages caused per ton of criteria pollutant.
Table 9: Estimated Damages per Ton of Criteria Pollutant
Using these damage estimates, Figure 10 shows the net present value of criteria pollutant damage
cost reductions. For comparison purposes, we also include avoided damages related to CO2 in the
figure. The net present value of all avoided pollutants (including CO2) is about $56 million.
57 See Interagency Working Group on Social Cost of Greenhouse Gases, Technical Support Document:
Technical Update of the Social Cost of Carbon for Regulatory Impact Analysis Under, Executive Order
12866, August 2016, Table ES-1. For a broader discussion of the application of the SCC at the federal
level, see Executive Office of the President, Council on Environmental Quality, Final Guidance for
Federal Departments and Agencies on Consideration of Greenhouse Gas Emissions and the Effects of
Climate Change in National Environmental Policy Act Reviews, August 1, 2016.
58 Note that since the SCC is expected to rise over time that this value is relatively conservative.
Damages ($/ton)
SO2 7,500$ Nox 2,000$ PM2.5 12,400$
33 | brattle.com
Figure 10: Net Present Value of Pollutant Damage Cost Reductions (Entire REG Program)
E. OTHER BENEFITS AND COSTS
The REG program induced renewable capacity may provide other benefits not directly captured
by the price and environmental benefits described in the report. These include avoided
transmission and distribution (T+D) costs, and reduced exposure to fuel price spikes (diversity)
and reliability. There may also be some additional costs. These costs could include higher grid
integration and management costs, which may partially offset the T+D and diversity benefits.
1. Diversity
Diversity savings capture the value of avoiding high power prices that may be caused by reliance
on power plants dependent on volatile fuel prices. Measuring the benefits of diversity requires
an understanding of the potential volatility of gas prices and their impact on wholesale electricity
prices. Since, for this evaluation, we used National Grid’s estimate of the wholesale value of
energy of $55/MWh and since this value is somewhat above current wholesale market prices,
this value likely captures at least some benefit of reduced reliance on gas-fired power generation.

34 | brattle.com
Consequently, we do not separately assess a diversity value, which we had estimated at up to $5
million on a present value basis in our 2014 study.59
2. Reliability
Although improved reliability is often cited as a benefit of increased reliance on renewable
energy, this is difficult to measure in part because it is very site specific. The location of a
renewable plant may help avoid a widespread outage (or may increase its chances), but without a
very detailed grid study, it is not easy to identify. Further, the modest addition of capacity added
by the REG program makes it unlikely that they offer a large benefit. Consequently, no
reliability value (or cost) is estimated for the REG program, even though individual projects, in
the right places, may provide some reliability benefits.
3. Avoided Costs of Transmission & Distribution
Transmission and Distribution (T+D) costs tend to be very site specific and therefore are difficult
to estimate at the level of analysis presented here. The models employed did not simulate
National Grid or ISO New England grid operations. At the time of our 2014 Report, National
Grid had reported to the Rhode Island Public Utility Commission that no T+D savings had
occurred as result of the first 23.5 MW of renewable investments under the DGSC program.60 A
pilot program by National Grid and the OER to assess T&D delay or avoidance savings resulting
from solar investment in Tiverton will not be installed until June or July 2017. Hence, at this
point, no reliable conclusions from this pilot project are available. A review of other studies
indicates that these savings could be substantial, but that the benefits are highly location specific.
For example, a national review by the National Renewable Energy Laboratory (NREL) found that
these savings ranged from $4.28 to $26.26/MWh. The “most common” was $4.84/MWh.
4. Grid Integration Costs
In addition to the savings that may be attributable to adding renewable energy capacity to the
grid, there are costs. The same NREL study cited above found that integration costs associated
with renewable energy because of the lack of centralized control, weather, and time of day
variations were not trivial. NREL reported that these costs for solar PV ranged between $2.50
and $10.90/MWh.
5. Impact on Wholesale Prices
Our 2014 Report also estimated the potential impact of additional renewable capacity under the
three program levels studied, 160MW, 200MW and 1,000MW, on wholesale electricity prices,
59 Mark Berkman and Jürgen Weiss, Distributed Generation Standard Contracts and Renewable Energy
Fund: Jobs, Economic and Environmental Impact Study, The Brattle Group, April 2014, p.26.
60 National Grid response to Records Request by the RI Public Utility Commission February 26, 2014, on
March 11, 2014. (letter from T. Teehan to L. Massaro, Commission Clerk).
35 | brattle.com
so-called wholesale price suppression. At the level relevant for the evaluation of the REG
program (160 MW), the effect on wholesale prices was expected to be quite small ($0.75 million
per year). While the REG program may lead to small and temporary declines in wholesale prices,
given the small size of the REG program relative to the New England electricity market, we have
not separately assessed the impact of the REG program on wholesale prices, but would expect the
impact to be comparable to our original estimate.61
6. Potential Benefits to Program Participants
We have estimated the impact of the REG program on electric customers through slightly higher
retail tariffs that would have to be paid to cover the total costs of the REG program in excess of
realized market values for the REG facility products, notably energy, capacity and RECs.
However, this does not capture potentially positive impacts of the REG program on program
participants. Since participation in the REG program is voluntary, program participants must
benefit from participating in the REG program. Whether those benefits are sufficient to result in
additional economic benefits to Rhode Island depends on the level of the REG program tariffs
relative to program participants’ costs, including the return they would have counted on for
making similarly risky investments in the absence of the REG program.62
Since all non-residential tariffs are the result of bids accepted by National Grid, it is reasonable to
assume that the non-residential REG program will be relatively competitive, i.e., that the
selected tariffs will be close to what is needed to just provide program participants with the
financial returns they could expect for similarly risky alternative investments. As a result, we
assume that non-residential program participants would not end up having additional disposable
income as a result of the REG program, which could be the basis of additional benefits to the
Rhode Island economy.
Residential program participants automatically receive the applicable tariff ceiling price for the
program year for 15 or 20 years. Tariff ceiling prices applicable to projects in a given program
year have been falling and are expected to continue to fall to reflect the assumption that the cost
of installing residential solar-PV systems will continue to decline. It is possible that the rate of
cost declines for small scale solar projects is somewhat quicker than the rate for tariff costs. It is
61 We also note that while lower wholesale prices represent a benefit to ratepayers in the short run, they
represent corresponding revenue losses to power generation facilities. In that sense they represent a
transfer rather than an efficiency gain. In the longer run, lower wholesale market revenues may result
in generation retirement. Also, the effect is likely temporary since wholesale prices would need to
increase to the levels required to make investment in new generating capacity economically viable.
62 Program participants would only have additional disposable income as a consequence of participating
in the REG program if the financial return for their REG project, i.e. the tariff revenue after
accounting for all expenses including tax payments, exceeded the expected return from making an
equally sized and similarly risky alternative investment. A portion of such additional disposable
income would then be assumed to be spent in Rhode Island and result in economic benefits to the
State.

36 | brattle.com
therefore possible that in some of the program years, tariff ceiling prices would be higher than
they have to be for some program participants to make investing in a residential solar PV system
beneficial.63 Such residential REG program participants may in fact find that their disposable
income increases as a result of participation in the program and they would be expected to spend
some portion of this increased income in ways that benefit the Rhode Island economy. However,
given the small aggregate size of the residential program, the uncertainty about the actual
economics of individual residential projects, and their impact on program participants’ disposable
income, we have not included this potential effect in our analysis. Our results are therefore
conservatively low with respect to this potential benefit from the REG program.
It should also be noted that there is some evidence that solar rooftops have a positive impact on
the value of homes.64 Since there is little evidence of the impact of this higher value on spending
– i.e. we don’t know whether “feeling” wealthier as a result of having a solar roof translates into
higher spending and there is no empirical basis for estimating the number of solar homes being
sold per year – we have not estimated the impact of higher home values on the RI economy. As
with tariff payments for program participants being a potential source of additional income, this
assumption also makes our impact estimates conservative.65
VI. Conclusions
We were asked to analyze the expected jobs, economic and environmental impact of the Rhode
Island REG program, based on actual results from the 2015 and 2016 program years and
estimated participation over the remaining three program years, resulting in a total of 160 MW
of renewable generation capacity in Rhode Island. In brief, we find that the REG program
promotes economic activity, employment, and reduces greenhouse gases and several of EPA’s s
criteria pollutant emissions.66
63 It is also true that installed costs for residential solar PV systems vary significantly by installer and
specific installation. Since tariff ceilings will typically reflect the expected costs of installing a typical
solar rooftop system, some residential program participants may be able to have a more attractive
project if they obtain a lower than average installation cost.
64 See for example, Sandra K. Adomatis and Ben Hoen, “An Analysis of Solar Home Paired Sales across
Six States,” The Appraisal Journal, Winter, 2016. www.appraisalinstitute.org and Samuel Dastrup,
Joshua GraffZiven, Dora Costa, and Matthew Kahn, “Understanding the Solar Home Price Premium:
Electricity Generation and “Green” Social Status, National Bureau of Economic Research, Working
Paper 17200, July 2011. www.nber.org/papers/w17200 .
65 It is our understanding that solar rooftops are generally exempt from property tax
(https://blog.pickmysolar.com/going-solar-in-rhode-island), so that solar installations on private
homes do not lead to higher tax payments.
66 While our results regarding the REG program are net positive, they do not by themselves indicate that
the program is necessarily the most cost-effective means to reach Rhode Island’s renewables targets. It
is possible that other approaches could be either more or less cost effective although we are unaware
of any alternatives to the REG Program being proposed or under consideration.
37 | brattle.com
Given the overall size of the program relative to the size of the Rhode Island economy as well as
the New England electricity market, it is not surprising that we estimate the overall impact of the
REG program to be modest. However, given that renewable technologies are capital intensive
and that in particular solar projects require a significant amount of installation labor, we estimate
that the REG program will lead to approximately 484 additional jobs per year during the
construction period, followed by a small net decrease in employment (about 6 jobs annually)
during the 15-20 year period when all projects are constructed and producing electricity under
the REG tariffs The decrease is explained by the modest number of jobs required for plant
operations offset by a modest decrease in demand for goods and services that results from the
modest increase in electricity rates effect on disposable income. The annual employment impact
averaged over the entire 2015 through 2040 period will be to add almost 90 jobs.
We also estimate the expected impact of the REG program on economic activity as measured by
state GDP to total almost $221 million during the construction phase in present value terms.
Over the tariff period, 2020-2040, GDP will increase by over $15 million on a present value basis.
The GDP impact over the entire period 2015-2040 will be about $236 million on a present value
basis.
In addition, the REG program will contribute to reducing emissions by avoiding 1.5 million tons
of CO2, 582 tons of SO2, 494 tons of NOx and 53 tons of PM2.5.67 One way to value the avoided
CO2 emissions is to look at avoided purchase of RGGI allowances. Using current and reasonably
expected future RGGI prices leads to estimated avoided RGGI allowance purchases of $13 million
in present value terms. An alternative way to value avoided emissions is to look at damages that
would occur if those same emissions were not avoided by the REG program. Using the range of
estimates for damages from the various pollutants the estimated value of avoided emissions is $56
million in present value terms. Of this total, avoided damages from carbon dioxide emissions
reductions represent a social benefit of $51 million on a PV basis. Reductions in criteria
pollutants can also be attributed to the program. The combined damages avoided by reducing
SO2, NOX, PM10, and PM2.5 emissions are $4.9 million on a PV basis.
All of these impacts are relative to a scenario without the REG program and incorporate both the
positive and negative impacts of the REG program. Since these emissions reductions are mostly
from the reduced generation of power plants located outside of Rhode Island, not all of the
benefits will be captured by Rhode Island residents. Tracing the actual exposure paths and
associated damages from pollution from these plants to determine precisely who benefits,
however, is beyond the scope of this study. Some pollution emissions are most harmful in close
proximity to the source, while other emissions do more harm downwind (or occur at the global
level).
67 We recognize similarly that, absent the REG program, existing RES mandates may require that similar
amounts of renewable resources be built and that those resources would reduce emissions by
essentially the same amounts. We therefore describe the REG Program as contributing to such
emissions reductions (mandated under RES).
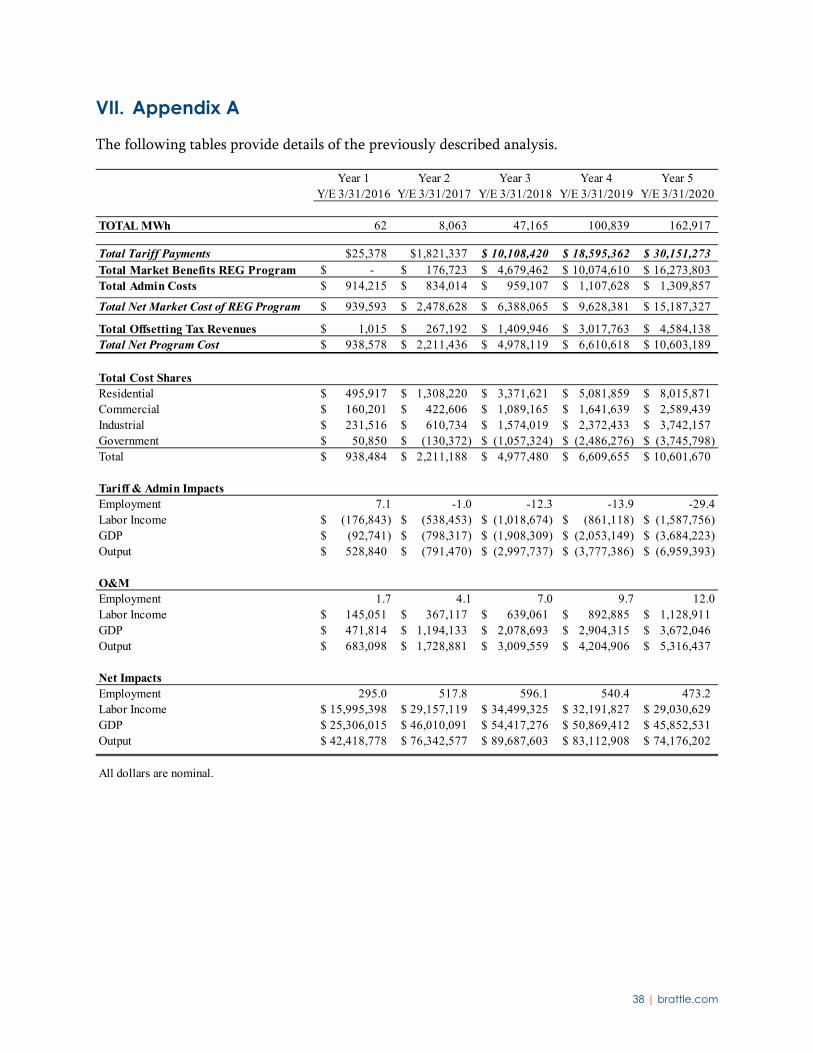
38 | brattle.com
VII. Appendix A
The following tables provide details of the previously described analysis.
Year 1 Year 2 Year 3 Year 4 Year 5Y/E 3/31/2016 Y/E 3/31/2017 Y/E 3/31/2018 Y/E 3/31/2019 Y/E 3/31/2020
TOTAL MWh 62 8,063 47,165 100,839 162,917
Total Tariff Payments $25,378 $1,821,337 10,108,420$ 18,595,362$ 30,151,273$ Total Market Benefits REG Program -$ 176,723$ 4,679,462$ 10,074,610$ 16,273,803$ Total Admin Costs 914,215$ 834,014$ 959,107$ 1,107,628$ 1,309,857$
Total Net Market Cost of REG Program 939,593$ 2,478,628$ 6,388,065$ 9,628,381$ 15,187,327$
Total Offsetting Tax Revenues 1,015$ 267,192$ 1,409,946$ 3,017,763$ 4,584,138$ Total Net Program Cost 938,578$ 2,211,436$ 4,978,119$ 6,610,618$ 10,603,189$
Total Cost SharesResidential 495,917$ 1,308,220$ 3,371,621$ 5,081,859$ 8,015,871$ Commercial 160,201$ 422,606$ 1,089,165$ 1,641,639$ 2,589,439$ Industrial 231,516$ 610,734$ 1,574,019$ 2,372,433$ 3,742,157$ Government 50,850$ (130,372)$ (1,057,324)$ (2,486,276)$ (3,745,798)$ Total 938,484$ 2,211,188$ 4,977,480$ 6,609,655$ 10,601,670$
Tariff & Admin ImpactsEmployment 7.1 -1.0 -12.3 -13.9 -29.4Labor Income (176,843)$ (538,453)$ (1,018,674)$ (861,118)$ (1,587,756)$ GDP (92,741)$ (798,317)$ (1,908,309)$ (2,053,149)$ (3,684,223)$ Output 528,840$ (791,470)$ (2,997,737)$ (3,777,386)$ (6,959,393)$
O&MEmployment 1.7 4.1 7.0 9.7 12.0Labor Income 145,051$ 367,117$ 639,061$ 892,885$ 1,128,911$ GDP 471,814$ 1,194,133$ 2,078,693$ 2,904,315$ 3,672,046$ Output 683,098$ 1,728,881$ 3,009,559$ 4,204,906$ 5,316,437$
Net ImpactsEmployment 295.0 517.8 596.1 540.4 473.2Labor Income 15,995,398$ 29,157,119$ 34,499,325$ 32,191,827$ 29,030,629$ GDP 25,306,015$ 46,010,091$ 54,417,276$ 50,869,412$ 45,852,531$ Output 42,418,778$ 76,342,577$ 89,687,603$ 83,112,908$ 74,176,202$
All dollars are nominal.
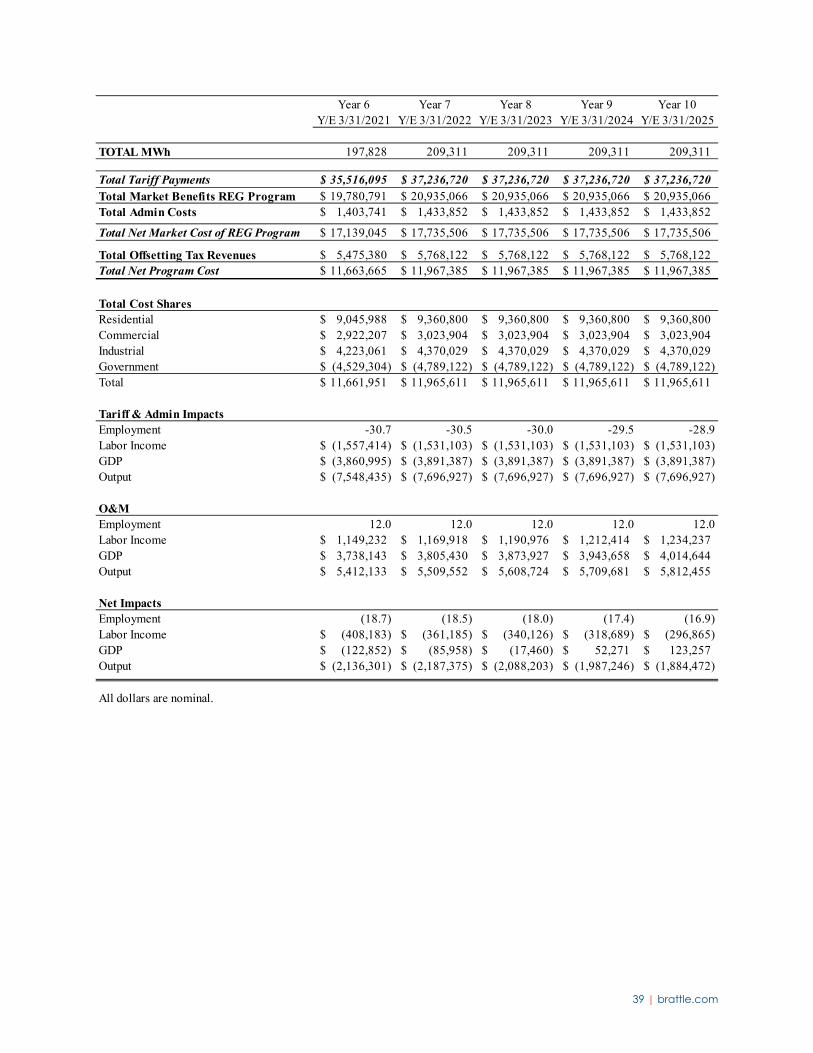
39 | brattle.com
Year 6 Year 7 Year 8 Year 9 Year 10Y/E 3/31/2021 Y/E 3/31/2022 Y/E 3/31/2023 Y/E 3/31/2024 Y/E 3/31/2025
TOTAL MWh 197,828 209,311 209,311 209,311 209,311
Total Tariff Payments 35,516,095$ 37,236,720$ 37,236,720$ 37,236,720$ 37,236,720$ Total Market Benefits REG Program 19,780,791$ 20,935,066$ 20,935,066$ 20,935,066$ 20,935,066$ Total Admin Costs 1,403,741$ 1,433,852$ 1,433,852$ 1,433,852$ 1,433,852$
Total Net Market Cost of REG Program 17,139,045$ 17,735,506$ 17,735,506$ 17,735,506$ 17,735,506$
Total Offsetting Tax Revenues 5,475,380$ 5,768,122$ 5,768,122$ 5,768,122$ 5,768,122$ Total Net Program Cost 11,663,665$ 11,967,385$ 11,967,385$ 11,967,385$ 11,967,385$
Total Cost SharesResidential 9,045,988$ 9,360,800$ 9,360,800$ 9,360,800$ 9,360,800$ Commercial 2,922,207$ 3,023,904$ 3,023,904$ 3,023,904$ 3,023,904$ Industrial 4,223,061$ 4,370,029$ 4,370,029$ 4,370,029$ 4,370,029$ Government (4,529,304)$ (4,789,122)$ (4,789,122)$ (4,789,122)$ (4,789,122)$ Total 11,661,951$ 11,965,611$ 11,965,611$ 11,965,611$ 11,965,611$
Tariff & Admin ImpactsEmployment -30.7 -30.5 -30.0 -29.5 -28.9Labor Income (1,557,414)$ (1,531,103)$ (1,531,103)$ (1,531,103)$ (1,531,103)$ GDP (3,860,995)$ (3,891,387)$ (3,891,387)$ (3,891,387)$ (3,891,387)$ Output (7,548,435)$ (7,696,927)$ (7,696,927)$ (7,696,927)$ (7,696,927)$
O&MEmployment 12.0 12.0 12.0 12.0 12.0Labor Income 1,149,232$ 1,169,918$ 1,190,976$ 1,212,414$ 1,234,237$ GDP 3,738,143$ 3,805,430$ 3,873,927$ 3,943,658$ 4,014,644$ Output 5,412,133$ 5,509,552$ 5,608,724$ 5,709,681$ 5,812,455$
Net ImpactsEmployment (18.7) (18.5) (18.0) (17.4) (16.9)Labor Income (408,183)$ (361,185)$ (340,126)$ (318,689)$ (296,865)$ GDP (122,852)$ (85,958)$ (17,460)$ 52,271$ 123,257$ Output (2,136,301)$ (2,187,375)$ (2,088,203)$ (1,987,246)$ (1,884,472)$
All dollars are nominal.
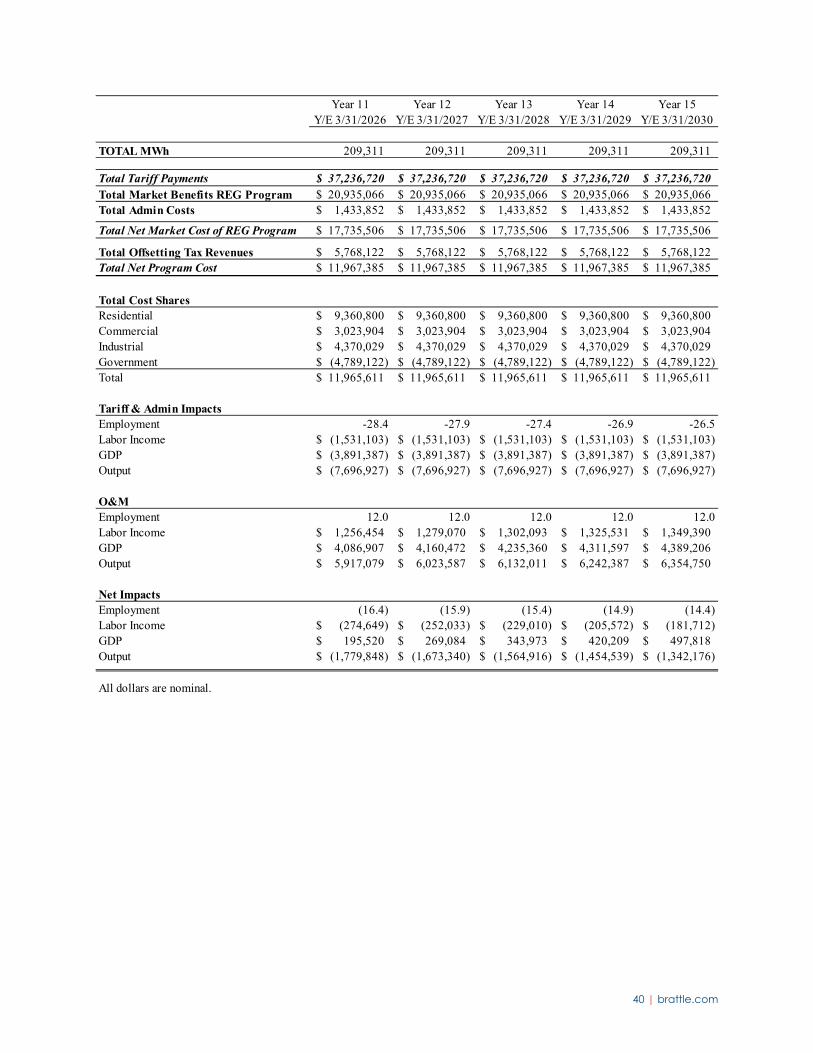
40 | brattle.com
Year 11 Year 12 Year 13 Year 14 Year 15Y/E 3/31/2026 Y/E 3/31/2027 Y/E 3/31/2028 Y/E 3/31/2029 Y/E 3/31/2030
TOTAL MWh 209,311 209,311 209,311 209,311 209,311
Total Tariff Payments 37,236,720$ 37,236,720$ 37,236,720$ 37,236,720$ 37,236,720$ Total Market Benefits REG Program 20,935,066$ 20,935,066$ 20,935,066$ 20,935,066$ 20,935,066$ Total Admin Costs 1,433,852$ 1,433,852$ 1,433,852$ 1,433,852$ 1,433,852$
Total Net Market Cost of REG Program 17,735,506$ 17,735,506$ 17,735,506$ 17,735,506$ 17,735,506$
Total Offsetting Tax Revenues 5,768,122$ 5,768,122$ 5,768,122$ 5,768,122$ 5,768,122$ Total Net Program Cost 11,967,385$ 11,967,385$ 11,967,385$ 11,967,385$ 11,967,385$
Total Cost SharesResidential 9,360,800$ 9,360,800$ 9,360,800$ 9,360,800$ 9,360,800$ Commercial 3,023,904$ 3,023,904$ 3,023,904$ 3,023,904$ 3,023,904$ Industrial 4,370,029$ 4,370,029$ 4,370,029$ 4,370,029$ 4,370,029$ Government (4,789,122)$ (4,789,122)$ (4,789,122)$ (4,789,122)$ (4,789,122)$ Total 11,965,611$ 11,965,611$ 11,965,611$ 11,965,611$ 11,965,611$
Tariff & Admin ImpactsEmployment -28.4 -27.9 -27.4 -26.9 -26.5Labor Income (1,531,103)$ (1,531,103)$ (1,531,103)$ (1,531,103)$ (1,531,103)$ GDP (3,891,387)$ (3,891,387)$ (3,891,387)$ (3,891,387)$ (3,891,387)$ Output (7,696,927)$ (7,696,927)$ (7,696,927)$ (7,696,927)$ (7,696,927)$
O&MEmployment 12.0 12.0 12.0 12.0 12.0Labor Income 1,256,454$ 1,279,070$ 1,302,093$ 1,325,531$ 1,349,390$ GDP 4,086,907$ 4,160,472$ 4,235,360$ 4,311,597$ 4,389,206$ Output 5,917,079$ 6,023,587$ 6,132,011$ 6,242,387$ 6,354,750$
Net ImpactsEmployment (16.4) (15.9) (15.4) (14.9) (14.4)Labor Income (274,649)$ (252,033)$ (229,010)$ (205,572)$ (181,712)$ GDP 195,520$ 269,084$ 343,973$ 420,209$ 497,818$ Output (1,779,848)$ (1,673,340)$ (1,564,916)$ (1,454,539)$ (1,342,176)$
All dollars are nominal.

41 | brattle.com
Year 16 Year 17 Year 18 Year 19 Year 20Y/E 3/31/2031 Y/E 3/31/2032 Y/E 3/31/2033 Y/E 3/31/2034 Y/E 3/31/2035
TOTAL MWh 209,255 208,340 202,686 202,762 193,477
Total Tariff Payments 37,213,464$ 36,857,004$ 34,762,434$ 34,910,045$ 31,618,306$ Total Market Benefits REG Program 20,929,667$ 20,841,783$ 20,298,998$ 20,306,352$ 19,414,997$ Total Admin Costs 1,433,445$ 1,427,207$ 1,390,552$ 1,393,135$ 1,335,530$
Total Net Market Cost of REG Program 17,717,243$ 17,442,428$ 15,853,988$ 15,996,829$ 13,538,838$
Total Offsetting Tax Revenues 5,767,192$ 5,752,933$ 5,669,150$ 5,675,055$ 5,543,385$ Total Net Program Cost 11,950,051$ 11,689,495$ 10,184,837$ 10,321,774$ 7,995,453$
Total Cost SharesResidential 9,351,161$ 9,206,113$ 8,367,735$ 8,443,126$ 7,145,799$ Commercial 3,020,790$ 2,973,934$ 2,703,105$ 2,727,459$ 2,308,372$ Industrial 4,365,529$ 4,297,814$ 3,906,423$ 3,941,619$ 3,335,970$ Government (4,789,200)$ (4,790,111)$ (4,794,010)$ (4,792,030)$ (4,796,041)$ Total 11,948,280$ 11,687,750$ 10,183,252$ 10,320,174$ 7,994,099$
Tariff & Admin ImpactsEmployment -25.9 -24.3 -17.3 -17.6 -7.4Labor Income (1,525,189)$ (1,436,424)$ (924,506)$ (971,904)$ (181,440)$ GDP (3,881,138)$ (3,727,220)$ (2,839,152)$ (2,920,902)$ (1,549,030)$ Output (7,679,948)$ (7,424,875)$ (5,952,661)$ (6,087,572)$ (3,812,562)$
O&MEmployment 12.0 12.0 12.0 12.0 12.0Labor Income 1,373,679$ 1,398,406$ 1,423,577$ 1,449,201$ 1,475,287$ GDP 4,468,211$ 4,548,639$ 4,630,515$ 4,713,864$ 4,798,713$ Output 6,469,136$ 6,585,580$ 6,704,121$ 6,824,795$ 6,947,641$
Net ImpactsEmployment (13.9) (12.3) (5.2) (5.5) 4.6Labor Income (151,510)$ (38,019)$ 499,071$ 477,298$ 1,293,846$ GDP 587,073$ 821,420$ 1,791,363$ 1,792,962$ 3,249,683$ Output (1,210,813)$ (839,295)$ 751,460$ 737,223$ 3,135,079$
All dollars are nominal.

42 | brattle.com
Year 21 Year 22 Year 23 Year 24 Year 25 Year 26Y/E 3/31/2036 Y/E 3/31/2037 Y/E 3/31/2038 Y/E 3/31/2039 Y/E 3/31/2040 Y/E 3/31/2040
TOTAL MWh 191,270 183,573 150,125 96,374 43,581 10,872
Total Tariff Payments 30,947,094$ 29,310,224$ 23,136,603$ 14,502,050$ 6,237,879$ 1,542,013$ Total Market Benefits REG Program 19,203,060$ 18,441,630$ 15,101,527$ 9,699,025$ 4,391,187$ 1,095,562$ Total Admin Costs 1,323,784$ 1,295,139$ 1,187,100$ 1,035,995$ 891,372$ 809,195$
Total Net Market Cost of REG Program 13,067,818$ 12,163,733$ 9,222,177$ 5,839,020$ 2,738,064$ 1,255,645$
Total Offsetting Tax Revenues 5,516,537$ 5,256,724$ 4,198,508$ 2,584,787$ 1,150,081$ 285,598$ Total Net Program Cost 7,551,281$ 6,907,010$ 5,023,669$ 3,254,233$ 1,587,983$ 970,048$
Total Cost SharesResidential 6,897,194$ 6,420,018$ 4,867,465$ 3,081,835$ 1,445,150$ 662,730$ Commercial 2,228,063$ 2,073,916$ 1,572,381$ 995,553$ 466,840$ 214,088$ Industrial 3,219,910$ 2,997,144$ 2,272,344$ 1,438,735$ 674,659$ 309,391$ Government (4,795,193)$ (4,585,285)$ (3,689,444)$ (2,262,473)$ (998,940)$ (216,286)$ Total 7,549,974$ 6,905,793$ 5,022,746$ 3,253,649$ 1,587,709$ 969,922$
Tariff & Admin ImpactsEmployment -5.4 -3.5 0.8 2.7 4.6 4.2Labor Income (31,318)$ 82,624$ 275,295$ 165,137$ 101,312$ (78,598)$ GDP (1,288,017)$ (1,028,620)$ (431,571)$ (204,981)$ 54,222$ (29,058)$ Output (3,379,108)$ (2,869,436)$ (1,540,577)$ (626,016)$ 280,980$ 438,164$
O&MEmployment 12.0 12.0 12.0 12.0 12.0 12.0Labor Income 1,501,842$ 1,528,875$ 1,556,395$ 1,584,410$ 1,612,929$ 1,641,962$ GDP 4,885,090$ 4,973,022$ 5,062,536$ 5,153,662$ 5,246,428$ 5,340,863$ Output 7,072,699$ 7,200,007$ 7,329,607$ 7,461,540$ 7,595,848$ 7,732,573$
Net ImpactsEmployment 6.6 8.5 12.9 14.7 16.6 16.2Labor Income 1,470,524$ 1,611,499$ 1,831,690$ 1,749,547$ 1,714,241$ 1,563,364$ GDP 3,597,073$ 3,944,402$ 4,630,966$ 4,948,681$ 5,300,650$ 5,311,806$ Output 3,693,591$ 4,330,572$ 5,789,031$ 6,835,524$ 7,876,828$ 8,170,737$
All dollars are nominal.