Embed Size (px)
Citation preview
© OECD/IEA 2016© OECD/IEA 2016
Heymi Bahar Project ManagerRenewable Energy DivisionInternational Energy [email protected]
Energiforsk, Stockholm, 18 January 2017
Medium-‐ Term Renewable Energy Market Report 2016
© OECD/IEA 2016
Context
n A year of records for renewable electricityØ A record amount of new capacity was installed in 2015
Ø Total capacity has now overtaken coal
n COP21 Paris Agreement gives momentum to renewables
n Local air pollution & energy security are also key drivers
n Energy investment flows confirm shift to renewables
n But policy makers need to heighten their commitments and provide investors more clarity & certainty
© OECD/IEA 2016
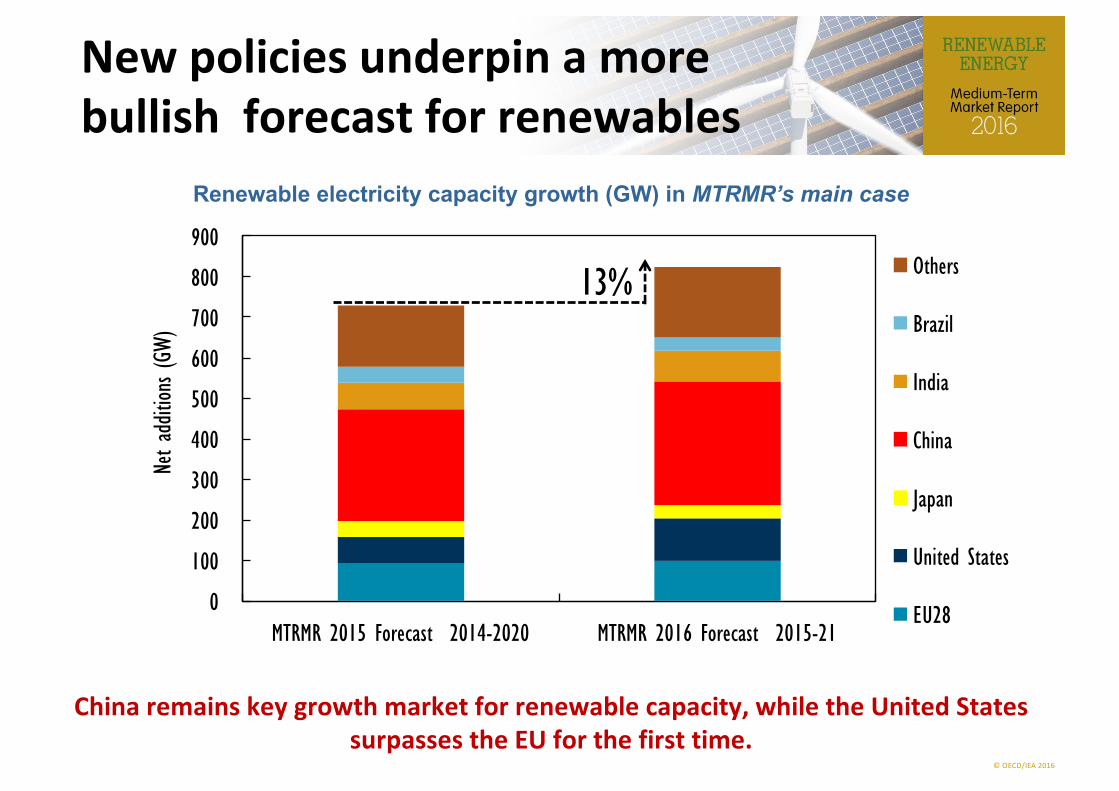
New policies underpin a more bullish forecast for renewables
China remains key growth market for renewable capacity, while the United States surpasses the EU for the first time.
Renewable electricity capacity growth (GW) in MTRMR’s main case
13%
0
100
200
300
400
500
600
700
800
900
MTRMR 2015 Forecast 2014-2020 MTRMR 2016 Forecast 2015-21
Net a
dditio
ns (G
W)
Others
Brazil
India
China
Japan
United States
EU28
© OECD/IEA 2016
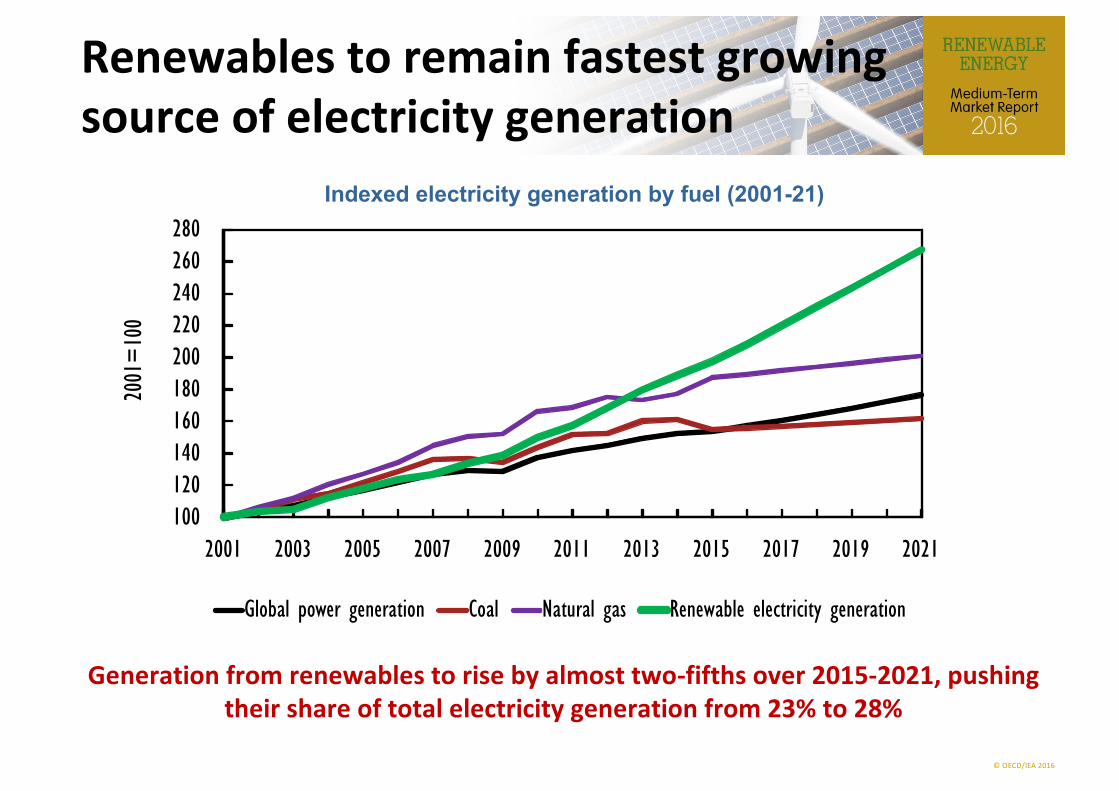
Renewables to remain fastest growing source of electricity generation
Generation from renewables to rise by almost two-‐fifths over 2015-‐2021, pushing their share of total electricity generation from 23% to 28%
Indexed electricity generation by fuel (2001-21)
100120140160180200220240260280
2001 2003 2005 2007 2009 2011 2013 2015 2017 2019 2021
2001
=10
0
Global power generation Coal Natural gas Renewable electricity generation
© OECD/IEA 2016
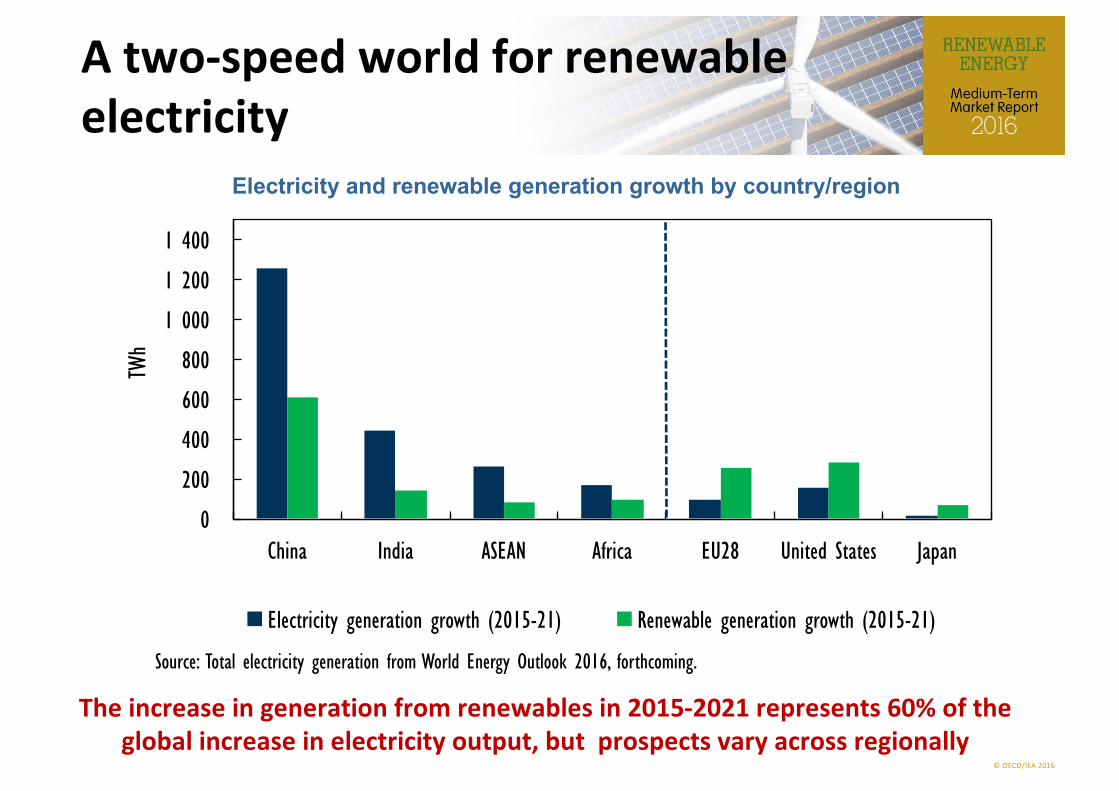
A two-‐speed world for renewable electricity
The increase in generation from renewables in 2015-‐2021 represents 60% of the global increase in electricity output, but prospects vary across regionally
Electricity and renewable generation growth by country/region
0
200
400
600
800
1 000
1 200
1 400
China India ASEAN Africa EU28 United States Japan
TWh
Electricity generation growth (2015-21) Renewable generation growth (2015-21)
Source: Total electricity generation from World Energy Outlook 2016, forthcoming.
© OECD/IEA 2016
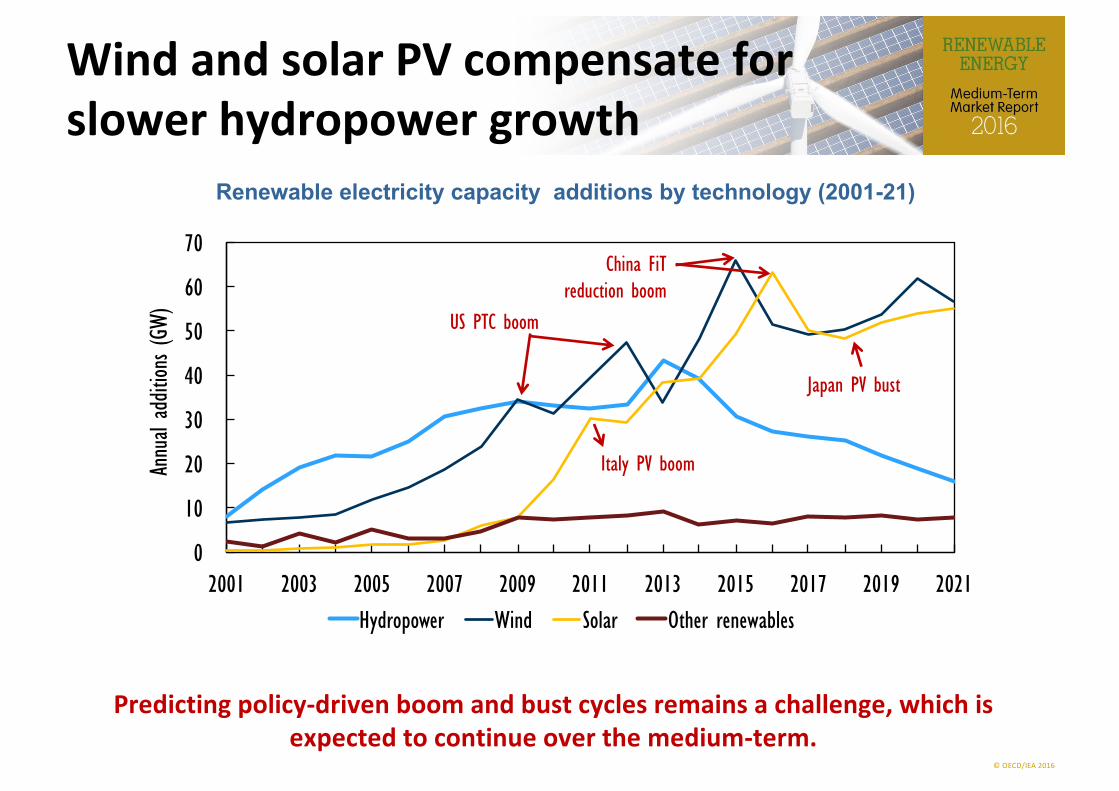
Wind and solar PV compensate for slower hydropower growth
Predicting policy-‐driven boom and bust cycles remains a challenge, which is expected to continue over the medium-‐term.
0
10
20
30
40
50
60
70
2001 2003 2005 2007 2009 2011 2013 2015 2017 2019 2021
Annu
al ad
dition
s (GW
)
Hydropower Wind Solar Other renewables
Italy PV boom
China FiTreduction boom
US PTC boom
Japan PV bust
Renewable electricity capacity additions by technology (2001-21)
© OECD/IEA 2016
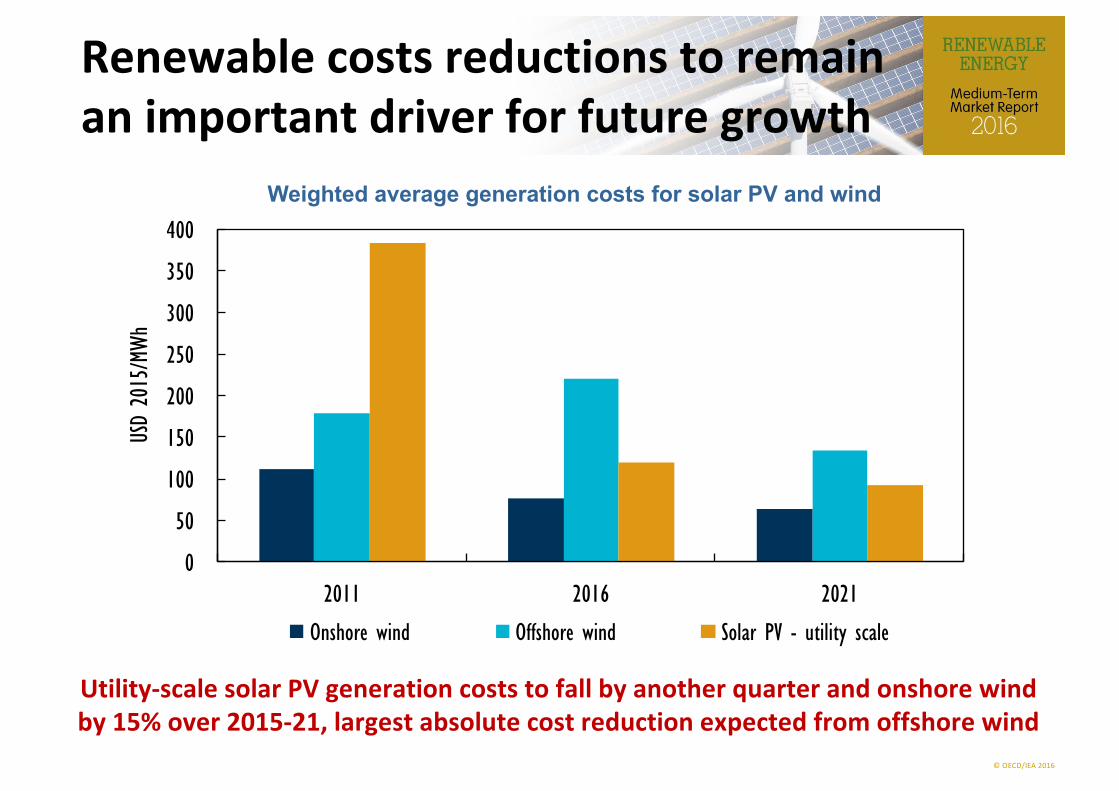
Renewable costs reductions to remain an important driver for future growth
Utility-‐scale solar PV generation costs to fall by another quarter and onshore wind by 15% over 2015-‐21, largest absolute cost reduction expected from offshore wind
Weighted average generation costs for solar PV and wind
0
50
100
150
200
250
300
350
400
2011 2016 2021
USD
2015
/MWh
Onshore wind Offshore wind Solar PV - utility scale
© OECD/IEA 2016
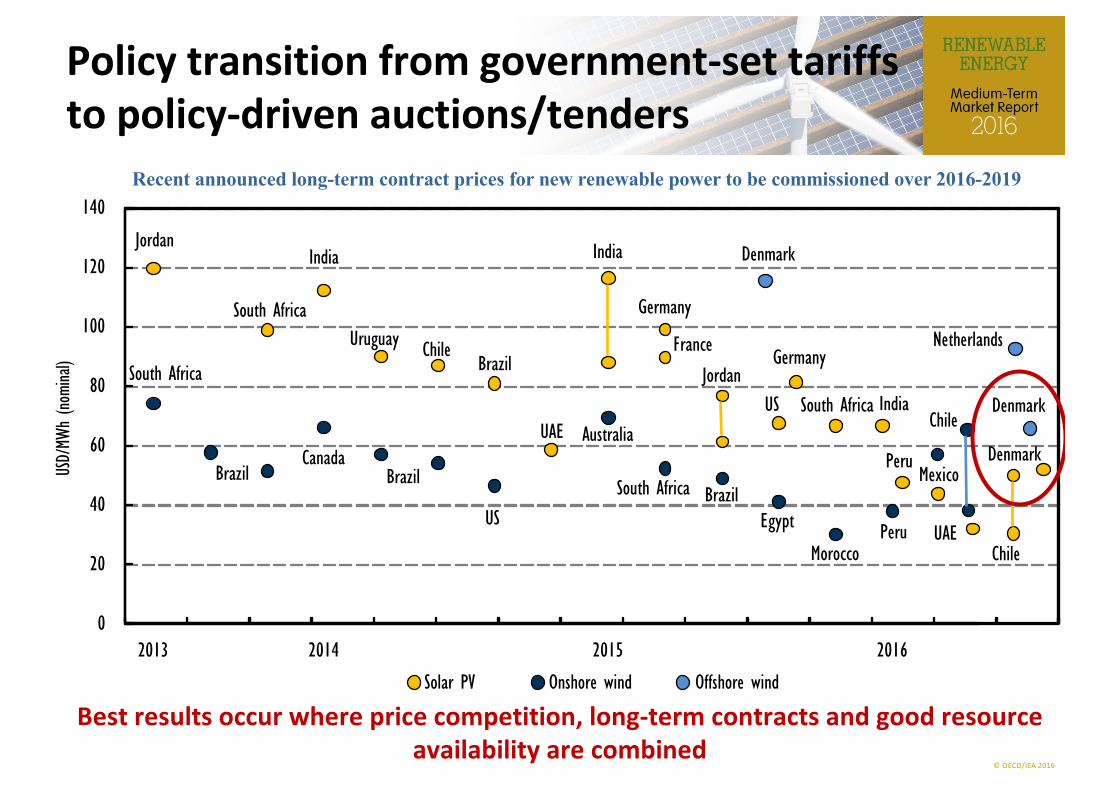
Best results occur where price competition, long-‐term contracts and good resource availability are combined
0
20
40
60
80
100
120
140
2013 2014 2015 2016
USD/
MWh
(nomi
nal)
Jordan
South Africa
BrazilCanada
Brazil
US
Australia
South Africa BrazilEgypt
MoroccoPeru
South Africa
India
Uruguay ChileBrazil
India
Germany
FranceJordan
Denmark
US South AfricaUAE
India
PeruMexico
Solar PV Onshore wind Offshore wind
GermanyNetherlands
UAE
Chile
Chile
Recent announced long-term contract prices for new renewable power to be commissioned over 2016-2019
Denmark
Denmark
Policy transition from government-‐set tariffs to policy-‐driven auctions/tenders
© OECD/IEA 2016
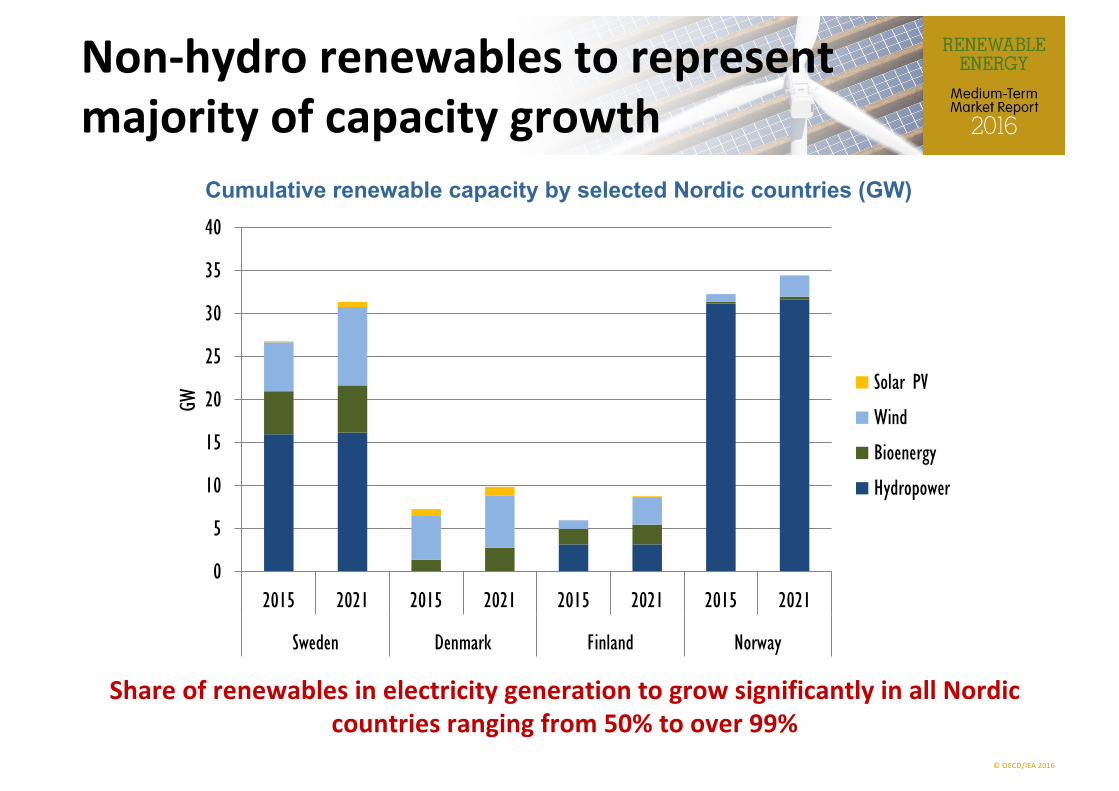
Non-‐hydro renewables to represent majority of capacity growth
Cumulative renewable capacity by selected Nordic countries (GW)
Share of renewables in electricity generation to grow significantly in all Nordic countries ranging from 50% to over 99%
0
5
10
15
20
25
30
35
40
2015 2021 2015 2021 2015 2021 2015 2021
Sweden Denmark Finland Norway
GW
Solar PV
Wind
Bioenergy
Hydropower
© OECD/IEA 2016
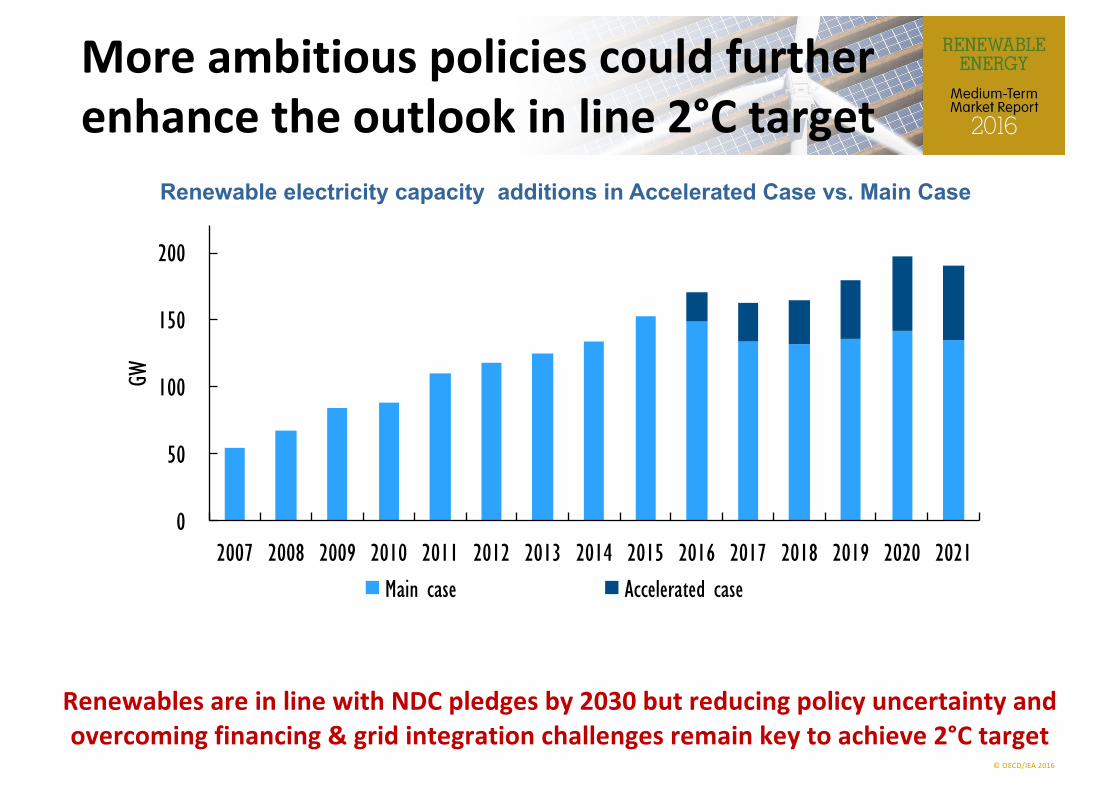
More ambitious policies could further enhance the outlook in line 2°C target
Renewables are in line with NDC pledges by 2030 but reducing policy uncertainty and overcoming financing & grid integration challenges remain key to achieve 2°C target
Renewable electricity capacity additions in Accelerated Case vs. Main Case
0
50
100
150
200
2007 2008 2009 2010 2011 2012 2013 2014 2015 2016 2017 2018 2019 2020 2021
GW
Main case Accelerated case
© OECD/IEA 2016
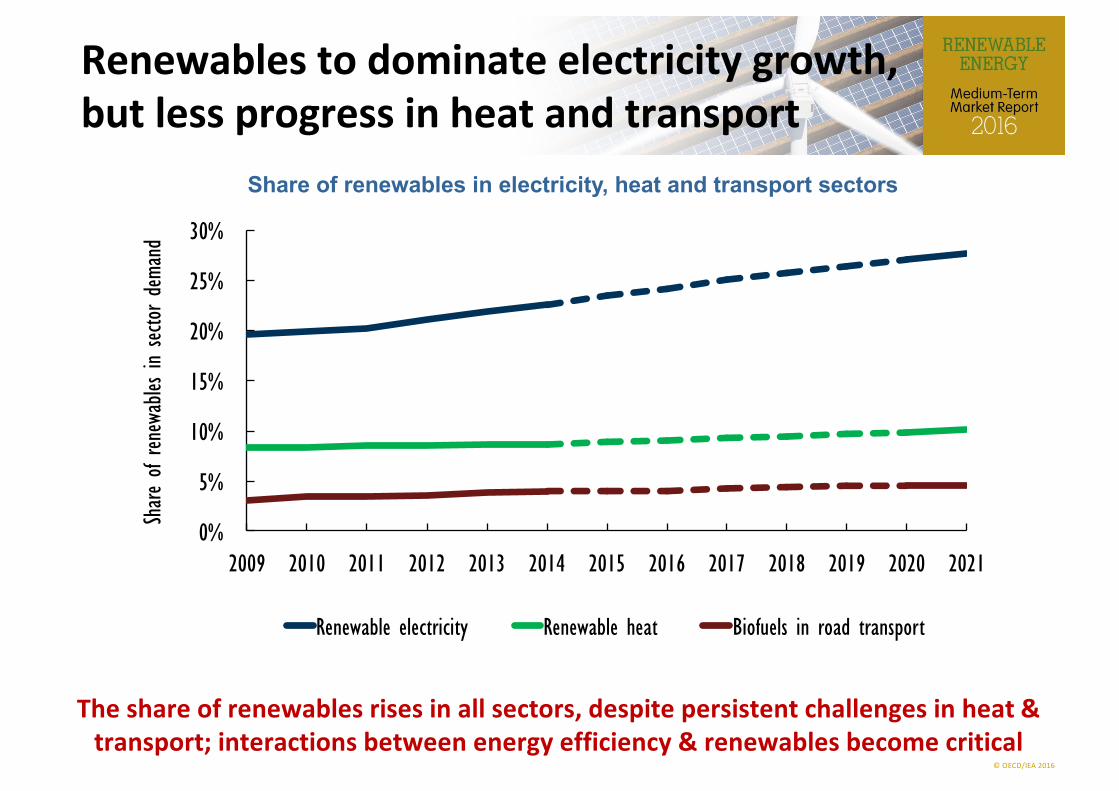
Renewables to dominate electricity growth, but less progress in heat and transport
The share of renewables rises in all sectors, despite persistent challenges in heat & transport; interactions between energy efficiency & renewables become critical
Share of renewables in electricity, heat and transport sectors
0%
5%
10%
15%
20%
25%
30%
2009 2010 2011 2012 2013 2014 2015 2016 2017 2018 2019 2020 2021
Share
of r
enew
ables
in se
ctor d
eman
d
Renewable electricity Renewable heat Biofuels in road transport
© OECD/IEA 2016
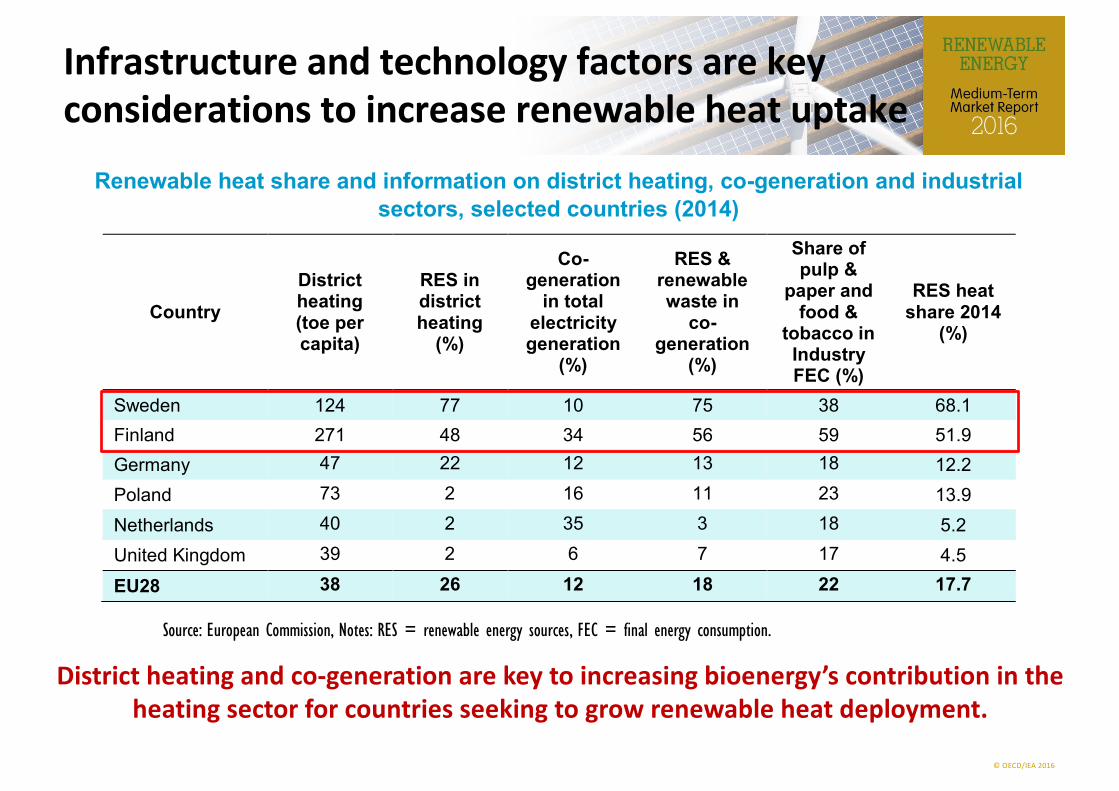
Country District heating (toe per capita)
RES in district heating (%)
Co-generation in total electricity generation
(%)
RES & renewable waste in co-
generation (%)
Share of pulp &
paper and food &
tobacco in Industry FEC (%)
RES heat share 2014
(%)
Sweden 124 77 10 75 38 68.1 Finland 271 48 34 56 59 51.9 Germany 47 22 12 13 18 12.2 Poland 73 2 16 11 23 13.9 Netherlands 40 2 35 3 18 5.2 United Kingdom 39 2 6 7 17 4.5 EU28 38 26 12 18 22 17.7
Infrastructure and technology factors are key considerations to increase renewable heat uptakeRenewable heat share and information on district heating, co-generation and industrial
sectors, selected countries (2014)
District heating and co-‐generation are key to increasing bioenergy’s contribution in the heating sector for countries seeking to grow renewable heat deployment.
Source: European Commission, Notes: RES = renewable energy sources, FEC = final energy consumption.
© OECD/IEA 2016
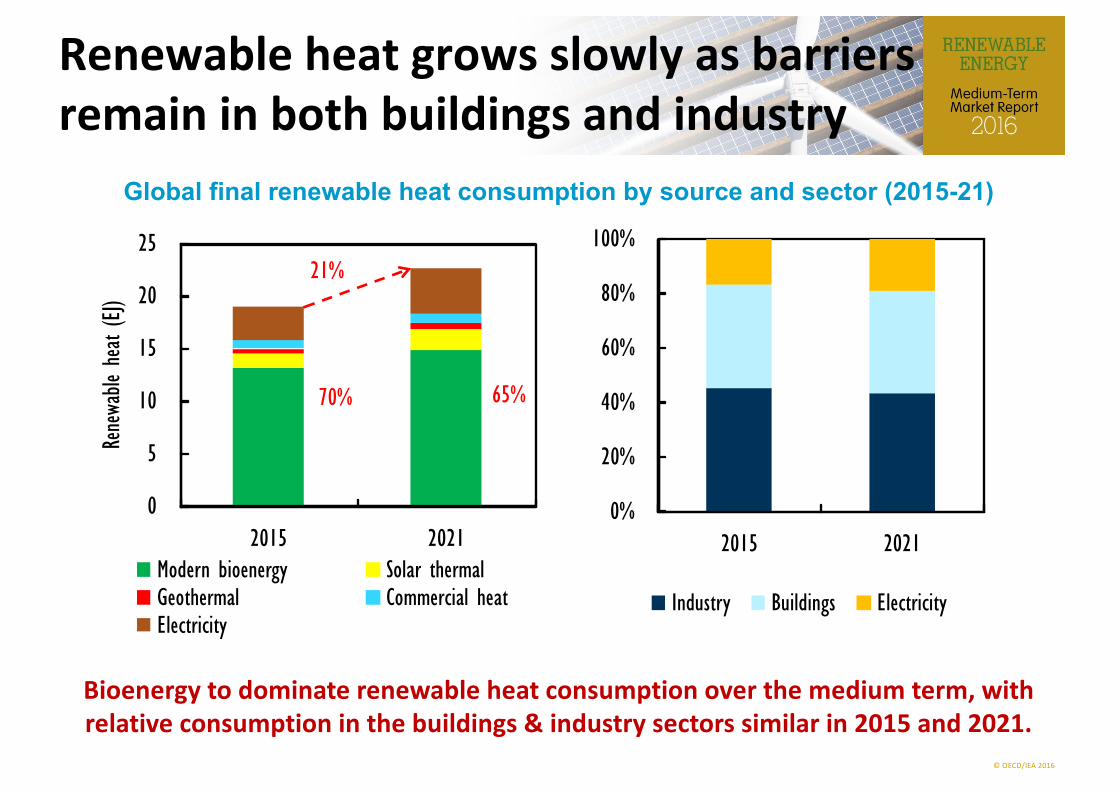
Renewable heat grows slowly as barriers remain in both buildings and industry
Bioenergy to dominate renewable heat consumption over the medium term, with relative consumption in the buildings & industry sectors similar in 2015 and 2021.
Global final renewable heat consumption by source and sector (2015-21)
0%
20%
40%
60%
80%
100%
2015 2021
Industry Buildings Electricity
0
5
10
15
20
25
2015 2021
Rene
wable
heat (
EJ)
Modern bioenergy Solar thermalGeothermal Commercial heatElectricity
21%
70% 65%
© OECD/IEA 2016
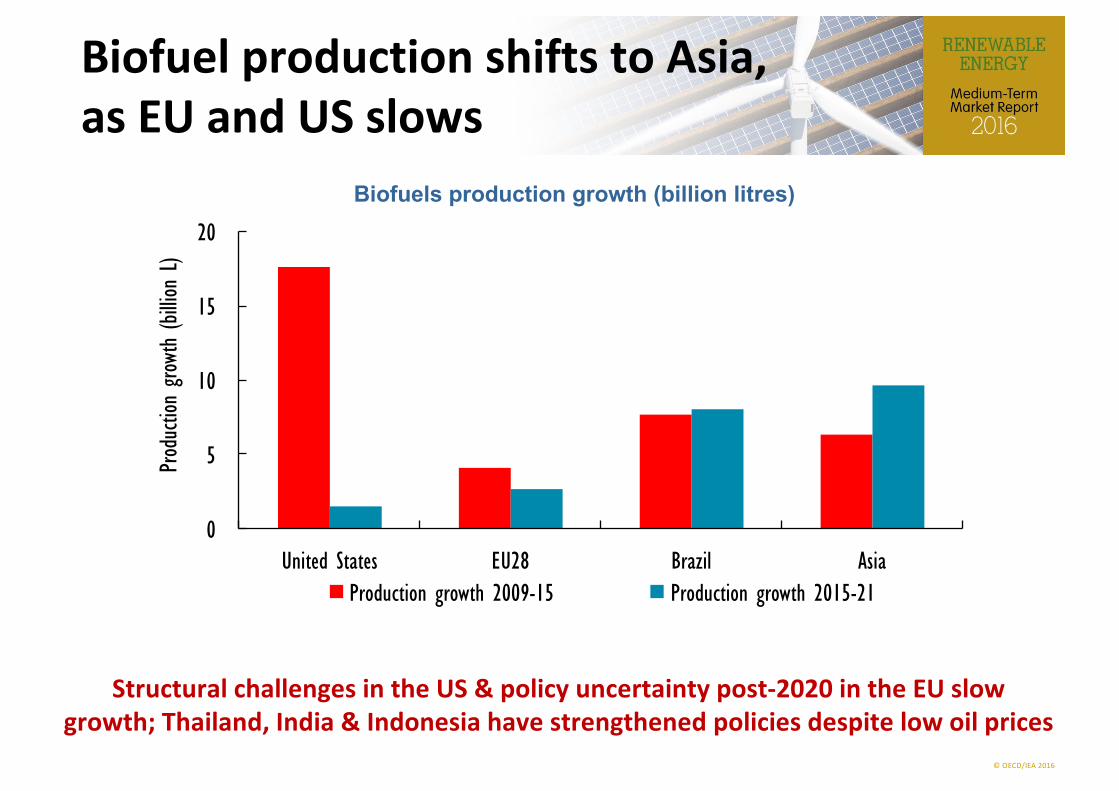
Biofuel production shifts to Asia, as EU and US slows
Structural challenges in the US & policy uncertainty post-‐2020 in the EU slow growth; Thailand, India & Indonesia have strengthened policies despite low oil prices
Biofuels production growth (billion litres)
0
5
10
15
20
United States EU28 Brazil Asia
Prod
uctio
n gro
wth
(billio
n L)
Production growth 2009-15 Production growth 2015-21
© OECD/IEA 2016
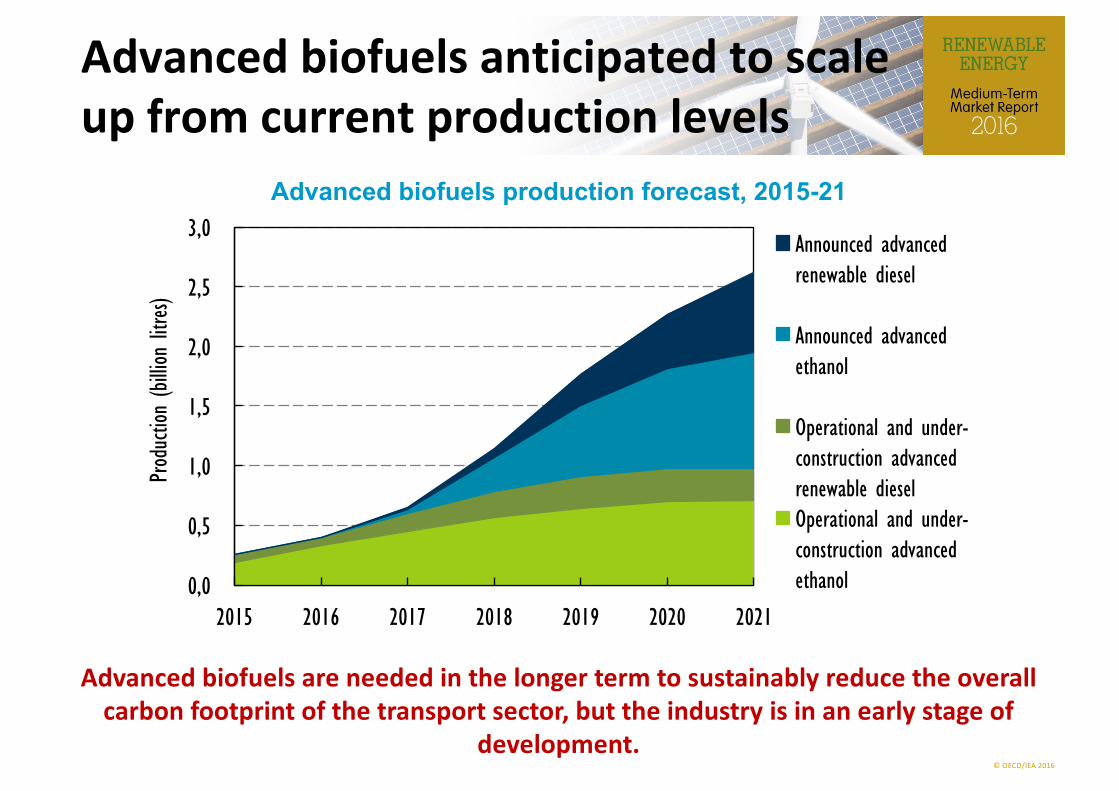
Advanced biofuels anticipated to scale up from current production levels
Advanced biofuels are needed in the longer term to sustainably reduce the overall carbon footprint of the transport sector, but the industry is in an early stage of
development.
Advanced biofuels production forecast, 2015-21
0,0
0,5
1,0
1,5
2,0
2,5
3,0
2015 2016 2017 2018 2019 2020 2021
Prod
uctio
n (bi
llion
litres)
Announced advanced renewable diesel
Announced advanced ethanol
Operational and under-construction advanced renewable dieselOperational and under-construction advanced ethanol
© OECD/IEA 2016
Some important trends to follow for businesses
n Distributed solar PV and smart home – new utility business models
n Electrification of transport – infrastructure and IT
n Off-‐grid electrification in Africa and South East Asia
n Offshore wind cheaper than onshore in Europe
n Market and auction design towards renewable integration
n Advanced biofuels – decarbonisation of aviation and shipping
n Renewable financing industry – diversification of financial products
© OECD/IEA 2016
Conclusions
n Prospects for renewables electricity revised upwards, driven by policy improvements, cost reductions & efforts to improve air quality
n The impact of lower fossil fuel prices on renewables varies by sector. Wind (onshore) & solar PV are the only technologies on track for a 2oC scenario
n Attracting investment in renewables hinges on appropriate market rules & regulations, particularly in markets with slow electricity demand growth
n Progress in renewable growth in the heat and transport sectors remains slow and needs significantly stronger policy efforts.
n IEA is working to accelerate energy transition with its analysis on policy & technology and system integration of renewables.
© OECD/IEA 2016
Thank you. Questions?
TeamYasmina Abdelilah
Heymi BaharUte Collier
Karolina DaszkiewiczPharoah Le FeuvreMegan MercerYasuhiro Sakuma
© OECD/IEA 2016
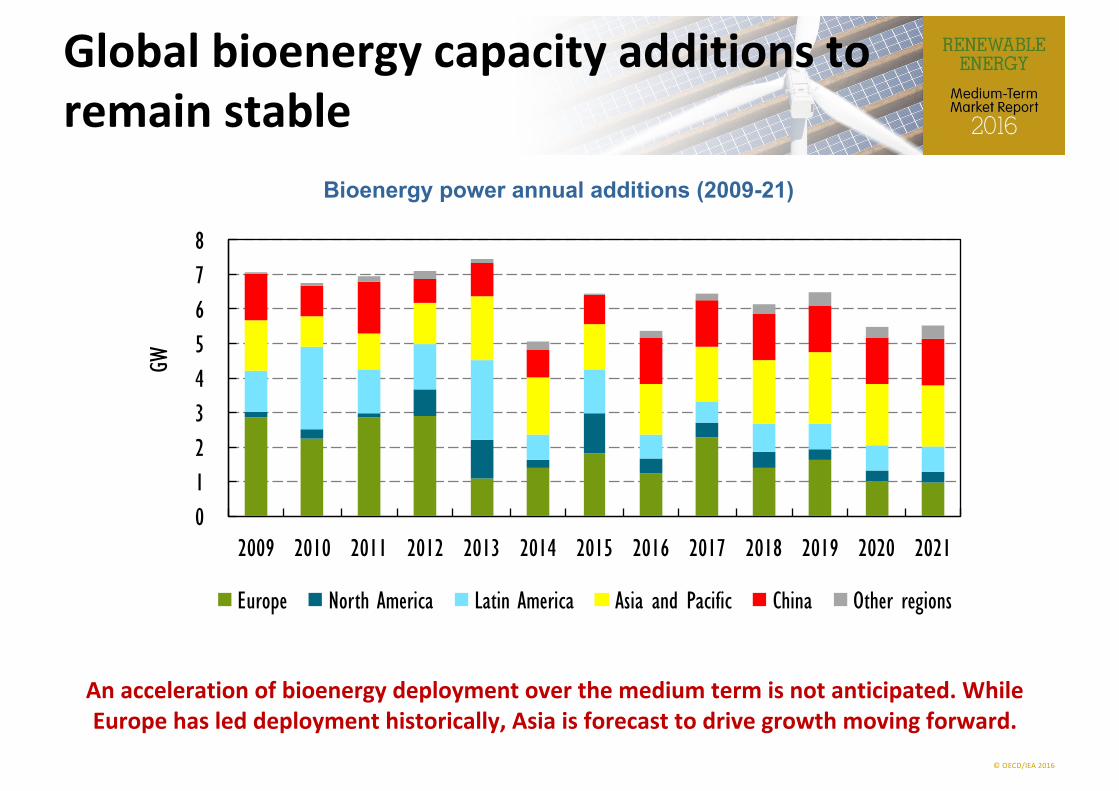
Global bioenergy capacity additions to remain stable
Bioenergy power annual additions (2009-21)
An acceleration of bioenergy deployment over the medium term is not anticipated. While Europe has led deployment historically, Asia is forecast to drive growth moving forward.
012345678
2009 2010 2011 2012 2013 2014 2015 2016 2017 2018 2019 2020 2021
GW
Europe North America Latin America Asia and Pacific China Other regions

![2015 Final Heating & Cooling Demand in the Netherlands · General context –Energy intensity • Total final energy demand (FED) [3]: 564 TWh •4.5% of EU28 •7th highest of EU28](https://img.pdfslide.net/doc/110x75/5f4399579fa13d18f002e995/2015-final-heating-cooling-demand-in-the-netherlands-general-context-aenergy.jpg)