Embed Size (px)
Citation preview
Renewable Energy Sector in the EU: itsEmployment and Export Potential
A Final Report to DG Environment
ECOTECResearch & Consulting Limited
Priestley House28-34 Albert StreetBirmingham B4 7UDUnited Kingdom
Tel: +44 (0)121 616 3600Fax: +44 (0)121 616 3699Web: www.ecotec.com


Renewable Energy Sector in the EU itsEmployment and Export Potential
A Final Report to DG Environment
C1961
Ref: 08/03/02 F:\EG\Current Contracts\C1961 Eco-Industries\Reporting\Final-sent\Re_final.doc
ECOTEC Research and Consulting Limited
Priestley House28-34 Albert StreetBirmingham B4 7UDUnited KingdomTel: +44 (0)121 616 3600Fax: +44 (0)121 616 3699
Web: www.ecotec.comE-mail: [email protected]
13b Avenue de TervurenB-1040 BrusselsBelgiumTel: +32 (0)2 743 8949Fax: +32 (0)2 743 7111
Modesto Lafuente 63 – 6aE-28003 MadridSpainTel: +34 91 535 0640Fax: +34 91 533 3663
19 Buckingham GateLondon SW1E 6LBUnited KingdomTel: +44 (0)20 7630 6090Fax: +44 (0)20 7630 6339
31-32 Park RowLeeds LS1 5JDUnited KingdomTel: +44 (0)113 244 9845Fax: +44 (0)113 244 9844

This document reflects the work of the Contractors and has been prepared for use within theEuropean Commission. It does not necessarily represent the Commission’s official position.
EXECUTIVE SUMMARY
This report provides a brief overview of the current status of renewable energy developmentsin the EU, together with an assessment of employment, manufacturing activity and exportmarkets. It also gives an overview of the current status of renewable energy exploitation inCandidate Countries.
Renewable energy in the EU
EU energy policy places a high priority on the increasing use of renewable energy, because ofthe important contribution that renewable energy can make towards improving security anddiversification of energy supply, environmental protection and social and economic cohesion.
In 1997 the EU agreed a strategy and target to double the share of renewable energies ingross domestic energy consumption, from 6% to 12% by 2010. In 2001, member statesagreed national (non-binding) targets for electricity production from renewable sources, toexpand the aggregate proportion of electricity from renewable sources in the EU from 13.9%in 1997 (3.2% excluding large hydro) to 22.1% by 2010 (12.5% excluding large hydro).
Individual member states have widely different current levels of renewable energy use, andtherefore have different national targets to 2010. There are a wide range of different supportmechanisms being used to stimulate renewable energy uptake, including quota systems, feed-in tariffs, green certificates or a combination.
Most member states now recognise that political support is necessary to overcome thebarriers that prevent a more rapid uptake of renewable technologies. These include:provision of fair and guaranteed access to electricity markets; financial measures to stimulateinvestment in renewable energy projects; fiscal measures that reflect the external costs andbenefits of energy from renewable sources (particularly through carbon or energy taxes); andpractical support from local public authorities in the siting and implementation of projects.
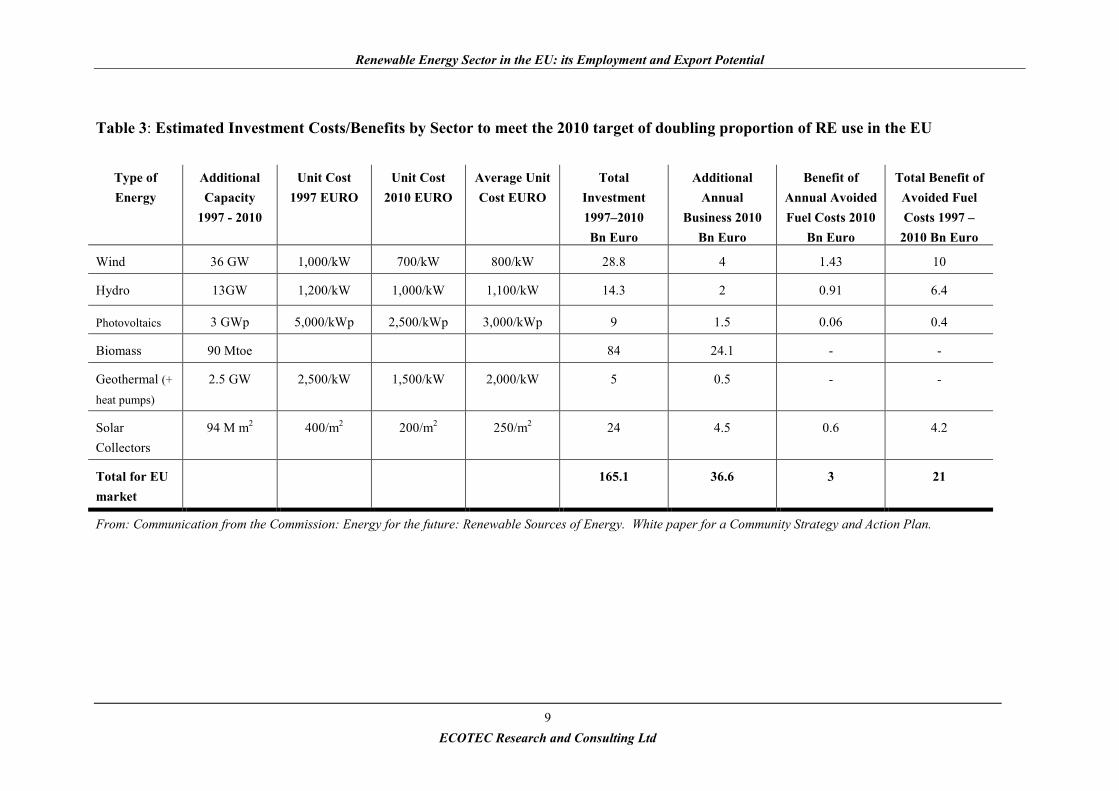
To achieve these targets by 2010 requires considerable investment from both public andprivate sector sources. The European Commission is currently promoting a short termstimulus for renewables, the “Campaign for Take-Off, 1999-2003”. This estimates thatinvestment required to meet the 2003 targets for new capacity amounts to about 20 Bn Euro,of which 20% or 4 Bn Euro is public funding. Total investment needed to achieve the 2010target amounts to some 165 Bn Euro, between 1997 and 2010.
These investments are seen across all of the renewable technologies, including wind, hydro,photovoltaics, geothermal, solar collectors, and biomass. More than half (84 Bn Euro) of thetotal investment is predicted to be targeted towards biomass projects, with a target to increasebiomass capacity in the EU by 90 Mtoe by 2010. Other important technologies include wind,with a target of 36 GW additional capacity (29 Bn Euro investment) and photovoltaics (3GWp target, 9 Bn Euro investment). Already however, these predictions are being modifiedwith new developments: wind energy in particular is expanding more rapidly that the EUpredictions, with the wind industry’s latest target for wind capacity in the EU by 2010 now

revised upwards to 60 GW. Offshore wind will also make an increasing contribution to thistarget.
Employment from renewables
Studies into the impact of renewable energy on employment demonstrate that renewableenergy has the potential to generate employment opportunities. Renewable energyproduction is more labour intensive than conventional energy production, in delivering thesame amount of energy output. It also uses less imported goods and services, particularlyduring operation, since renewable energy sources are by their nature indigenous, local energysources. A higher use of renewable energy can therefore benefit not only the nationaleconomy but is also a valuable industry at the local or regional level, where it can stimulatelocal investment and employment. Job gains are greatest in the agriculture andmanufacturing industrial sectors. Biomass technologies in particular stimulate employmentboth in the biomass energy industry and in fuel supply, including planting, harvesting,transport etc.
Opportunities for employment are provided in a range of sectors, including manufacturing,project development, construction and installation, operation and maintenance. Strongindigenous manufacturing capabilities can be further strengthened by exporting goods andservices worldwide.
An EU-wide study carried out in 1999 estimated that renewable energy has the potential tocreate over 900,000 new jobs by 2020, including 515,000 jobs in agriculture and biomass fuelsupply. Industry estimates endorse these levels of job creation. Already a number ofcountries are achieving high employment levels from renewable energy activities,particularly in the wind energy industry. Germany, for example, estimates that the turnoverof the Germany wind energy industry reached 1.7 Bn Euro, providing 25,000 direct andindirect jobs.
Export markets
Today, EU companies are amongst the world leaders in developing new renewable energytechnologies, both for domestic markets and worldwide. The strong and expanding domesticmarkets provide the basis for many EU companies to be active in worldwide markets.
The main drivers for encouraging renewable energy in developed countries (including theEU) lie in environmental protection, particularly the role that renewable energy can playtowards meeting greenhouse gas reduction targets. However, in developing countries it is theshortage of energy that it the main driver. Renewable energy can provide off-grid power inrural regions currently without access to power. Its use can also reduce the need forimporting costly fossil fuels.
Wind: The EU is the largest market for wind energy developments, with 75% of the totalworld installed capacity of 18.5 GW. The EU’s wind energy capacity is predicted to growfrom 12 GW in 2000 to 60 GW by 2010. International wind markets are predicted to

continue to grow at an average of 25% per year to at least 2006. Outside of the EU, the US isexpanding its wind energy developments, while emerging world markets include India, Chinaand South America.
Market leaders in the EU are Danish companies, which have a world market share f 40-50%.Other countries, particularly Germany and Spain, have expanding domestic markets whichare helping to underpin their export activities. Offshore wind developments in the EU areincreasing in importance, particularly for Denmark, which is establishing itself as a leader inthis new technology, building on its indigenous onshore capabilities.
Photovoltaics: The main market applications for photovoltaics are for off-grid systems andincreasingly for grid-connected systems, particularly in developed countries. World annualshipments of photovoltaic modules have expanded by more than 30% annually since 1998,reaching 278 MWp in 2000. Japanese and US companies dominate photovoltaicmanufacturing capacity, although the EU’s capacity is expanding, reaching 85 MWp by2000.
More than 75% of the total PV installed in the EU in the 1990s occurred in Germany, mainlybecause of its active market support programmes. Other EU countries are now initiatingsimilar initiatives, including Italy and the UK. Principal manufacturing capacity in the EUoccurs in Germany, Spain, the Netherlands and France, totalling 85 MWp in 2000. As well asthe inter-EU market, EU PV companies achieve exports worldwide.
Despite these indigenous manufacturing capabilities, trade code analysis indicates that the EUhas a negative trade balance in the import/export of photovoltaic products, includingsemiconductor devices and related products of relevance to the renewable photovoltaicindustry. In 1999, this trade deficit was approximately 200 M Euro (imports totallingapproximately 600 M Euro against exports of about 400 M Euro).
Biomass: Biomass is a diverse resource which includes in addition to biomass and theresidues of the wood working industry, energy crops, agricultural residues and agrofoodeffluents, manure as well as the organic fraction of municipal solid waste, source, separatedhousehold waste and sewage sludge.
Biomass resources make up by far the most important contribution towards total renewableenergy production in the EU. Biomass use covers a wide spectrum from producing heat andgenerating electricity to producing fuels for the transport sector. Biomass resources areproposed to produce more than 80% (90.2 out of 107.6 Mtoe, according to the CommissionWhite Paper) of the total additional contribution of renewables by 2010 in EU countries.These resources are predicted to add a further 230 TWh electricity production and 75 Mtoeheat production by 2010.
The EU biomass sector has increased by 13.5% between 1995-98, although some countrieshave shown a much greater increase - particularly Germany (57%) and Italy (94%).Germany, Finland and Sweden in particular have strong indigenous biomass industries, withthriving export market activities based around combustion technologies for heat and power

production. France is the leading EU country producing biofuels (particularly biodiesel andbioethanol), a resource that is likely to expand as taxation policies are changed in favour ofbiofuels as a transport fuel.
Developments in Candidate Countries
To date, biomass resources have been one of the main renewable energy resources exploitedin Candidate Countries, along with large scale hydro. This is because of the large naturalbiomass resource available in many of the Candidate Countries, and its widespread use as anon-commercial heating fuel resource. There is now an increasing interest to exploit biomassmore widely both for heating and power applications.
There is an increasing activity in assessing the potential resources available from non-biomass renewable resources in most Candidate Countries. These resources include wind,hydro, and solar thermal, as well as newer technologies such as photovoltaics. Foreigncompanies are already starting to work within many of the Candidate Countries to assist inthe development of the renewable resources, whilst indigenous capabilities are also beingdeployed to maximise the potential of renewable resources to stimulate employment and toreduce imports of fossil fuels.
Contents
Executive Summary
1.0 Introduction ......................................................................................................................11.1 What are renewable energy sources?............................................................................1
1.2 Renewable energy plant ................................................................................................1
1.3 This report .....................................................................................................................2
2.0 Policy and legislation overview .......................................................................................32.1 EU policy ......................................................................................................................3
2.2 National policies ...........................................................................................................4
2.3 Future development of RE sources in the EU...............................................................6
3.0 Expenditure ......................................................................................................................84.0 Employment ...................................................................................................................13
4.1 Impacts of RE on employment at EU level ................................................................13
4.2 Principal opportunities for employment .....................................................................14
4.3 Estimates from trade associations...............................................................................15
5.0 Markets...........................................................................................................................175.1 World RE markets.......................................................................................................17
5.1.1 Overview...........................................................................................................17
5.1.2 Market drivers and trends .................................................................................17
5.2 Technology overviews ................................................................................................18
5.2.1 Wind..................................................................................................................18
5.2.2 Photovoltaics.....................................................................................................22
5.2.3 Biomass.............................................................................................................23
6.0 Renewable Energy – Trade Code Analysis....................................................................326.1 Background and approach...........................................................................................32
6.2 Pros and cons of using trade codes .............................................................................33
6.3 Sub-sector trade code analysis ....................................................................................34
6.3.1 Instantaneous Gas Water Heaters .....................................................................35
6.3.2 Instantaneous Non Gas or Electric Water Heaters............................................37
6.3.3 Photovoltaics.....................................................................................................39
6.3.4 Photovoltaics Continued ...................................................................................41
6.3.5 Hydropower ......................................................................................................43
6.4 Conclusions.................................................................................................................48
7.0 Candidate countries ........................................................................................................50

7.1 Renewable energy consumption .................................................................................50
7.2 Candidate Country Summaries ...................................................................................55
7.2.1 Czech Republic .................................................................................................55
7.2.2 Estonia...............................................................................................................55
7.2.3 Hungary.............................................................................................................55
7.2.4 Latvia ................................................................................................................55
7.2.5 Romania ............................................................................................................56
7.2.6 Slovakia.............................................................................................................56
7.2.7 Slovenia.............................................................................................................57
7.2.8 Turkey...............................................................................................................57
7.3 Case Study: Poland .....................................................................................................58

Renewable Energy Sector in the EU: its Employment and Export Potential
1ECOTEC Research and Consulting Ltd
1.0 INTRODUCTION
1.1 What are renewable energy sources?
EUROSTAT definitions recognise the following renewable energy (RE) sources:
Solar technologies Solar photovoltaicsSolar panels
Wind energy Onshore wind energyOffshore wind energy1
Hydro Three scales of hydro plant are defined separately, namely <1MW(micro hydro), 1-10MW (small hydro), <10MW (large hydro)
Biomass There are a wide range of biomass resources currently exploited forboth power and heat, including:• Solid biomass fuels - forestry residues and other wood wastes,
energy crops, etc.• Liquid biomass resources - agro-food industries, farm slurries,
sewage sludge• Landfill gas and municipal solid wastes• Liquid biofuels - biodiesel, bioethanol, derived from a range of
energy crops or waste oilsGeothermal energy For electricity or heat
Emerging technologies not currently identified separately in EUROSTAT data compilationinclude various marine technologies, particularly tidal, wave and marine current technologies.
1.2 Renewable energy plant
The OECD defines renewable energy plant as:
“Any activity that produces equipment, technology or specific materials, designs, constructsor installs, manages or provides other services for the generation, collection or transmission
of energy from renewable sources…”2
Renewable energy plant in the OECD definition are included as a component of the“Resources Management” group, which also covers recycled materials, sustainable forestryand agriculture, eco-tourism etc.
1 Offshore wind energy resources are starting to be exploited in a number of sites, although EU-level statisticscurrently do not distinguish between offshore or onshore wind resources.2 OECD Environmental Goods and Services Manual, 1999, COM/TD/ENV(98)37/FINAL

Renewable Energy Sector in the EU: its Employment and Export Potential
2ECOTEC Research and Consulting Ltd
For the purposes of this overview, special attention has been given to wind, solar, hydro, andbiomass. Implications of new and emerging technologies will be considered whereappropriate.
1.3 This report
The objectives of this report are as follows:
• Review the political and legislative conditions for development of renewable energysources in Member States.
• Review the existing capacity and future prediction of development of renewable energysources in Europe.
• Highlight the current and predicted expenditure on renewable energy technologies inEurope.
• Describe the impact of development of renewable energy technologies on employment• Review European domestic markets and exports of renewable energy technologies.• Describe the current state of development of renewable energy technologies markets in
the Candidate countries.
Renewable Energy Sector in the EU: its Employment and Export Potential
3ECOTEC Research and Consulting Ltd
2.0 POLICY AND LEGISLATION OVERVIEW
2.1 EU policy
The promotion of renewable sources of energy is a high priority across the EU, for reasons of
• security and diversification of energy supply• environmental protection and• social and economic cohesion.
Renewable energy policy at EU level is based on the European Commission's White Paperfor a Community Strategy and Action Plan3. This strategy aims to double the share ofrenewable energies in gross domestic energy consumption across the EU from the present 6%to 12% by 2010, and includes a timetable of actions to achieve this objective.
Subsequent legislation now focuses on overcoming the various barriers to a greater level ofuptake of RE, and creating a more favourable climate for RE implementation.
In the past, national legislation tended to inhibit the uptake of RE technologies becauseenergy supply was provided through single national energy utilities. Third parties (forexample, independent electricity producers) had only limited access to power supply markets.The EU is now moving rapidly forward with the liberalisation of gas and electricity marketsboth within and between Member States, and this is creating a climate within which there isnot only greater competition but also freer access to independent producers including thoseexploiting RE technologies. The 1996 Directive on the internal market for electricity4
obliges Member States to progressively open up an increasing proportion of their nationalelectricity markets to competition. As a result, electricity prices for consumers have reduced,but the consequence of this makes it more difficult for renewable electricity to compete withconventional fossil energy without some form of financial support mechanism.
In order to address this problem, a proposal for an EU Directive on the promotion ofelectricity from renewable energy sources in the internal electricity market5, presented to theEnergy Council in May 2000, was voted through its second reading by Members of theEuropean Parliament on 3 July 2001. This Directive creates a common framework that willpromote an increased contribution of renewable energy sources to electricity production inthe internal electricity market. All Member States are required to set national (although non-binding) targets for renewables that are consistent with the objective of achieving a REcontribution of 12% of gross energy consumption (22.1% of electricity) across the EU by
3 "White Paper for a Community Strategy and Action Plan, Energy for the Future: Renewable Sources ofEnergy" (COM(97)599, 23.11.97).4 Directive 96/92/EC of the European Parliament and of the Council of 19 December 1996 concerning commonrules for the internal market in electricity.5 Proposal for a Directive of the European Parliament and of the Council on the promotion of electricity fromrenewable energy sources in the internal electricity market COM(2000)279. Amended proposal COM(2000)884, 28.12.2000.
Renewable Energy Sector in the EU: its Employment and Export Potential
4ECOTEC Research and Consulting Ltd
2010 (12.5% excluding large hydro). This compares with the 1997 contribution of REelectricity of 13.9% of electricity (3.2% excluding large hydro). Each member state is free touse its chosen means of achieving its targets, particularly its method of providing financialsupport to RE development, for example through quota systems, feed-in tariffs, greencertificates, or a combination of these.
In addition the Commission adopted the Green Paper Towards a European strategy for thesecurity of energy supply6 in November 2000. This discussion document aims to provoke awide-ranging and innovating debate on Europe's energy policy. It analyses the current energysituation and trends, and identifies the principal questions involved in deciding on a newcommon policy. In this context, it states that the EU must be prepared to place greateremphasis on the development of new and renewable energy sources.
2.2 National policies
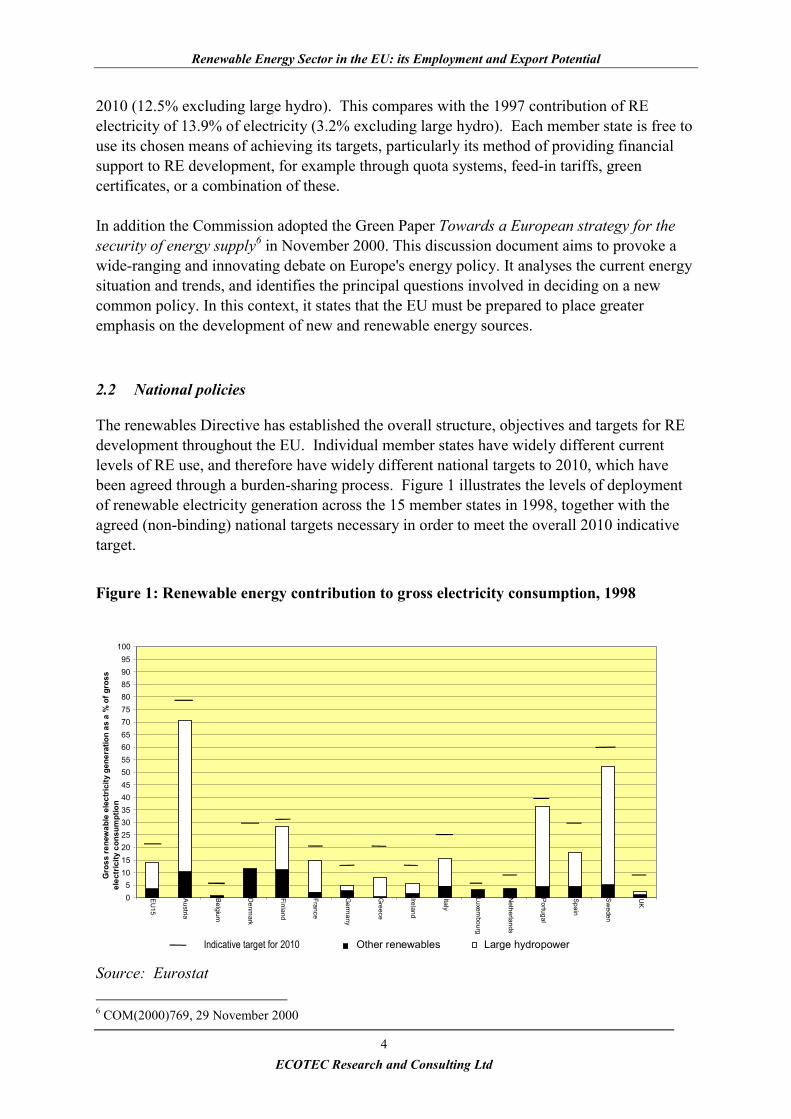
The renewables Directive has established the overall structure, objectives and targets for REdevelopment throughout the EU. Individual member states have widely different currentlevels of RE use, and therefore have widely different national targets to 2010, which havebeen agreed through a burden-sharing process. Figure 1 illustrates the levels of deploymentof renewable electricity generation across the 15 member states in 1998, together with theagreed (non-binding) national targets necessary in order to meet the overall 2010 indicativetarget.
Figure 1: Renewable energy contribution to gross electricity consumption, 1998
Source: Eurostat 6 COM(2000)769, 29 November 2000
05
101520253035404550556065707580859095
100EU
15
Austria
Belgium
Denm
ark
Finland
France
Germ
any
Greece
Ireland
Italy
Luxembourg
Netherlands
Portugal
Spain
Sw
eden
UK
Gro
ss re
new
able
ele
ctric
ity g
ener
atio
n as
a %
of g
ross
elec
tric
ity c
onsu
mpt
ion
Other renewables Large hydropower Indicative target for 2010
Renewable Energy Sector in the EU: its Employment and Export Potential
5ECOTEC Research and Consulting Ltd
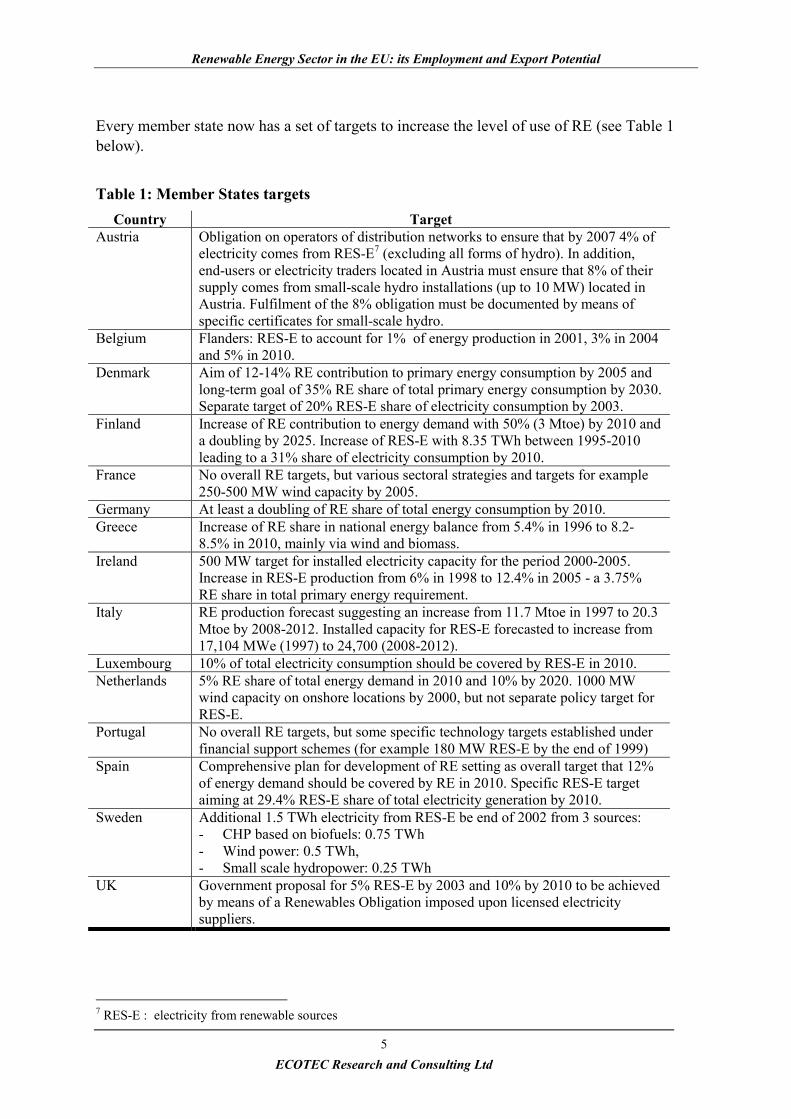
Every member state now has a set of targets to increase the level of use of RE (see Table 1below).
Table 1: Member States targetsCountry Target
Austria Obligation on operators of distribution networks to ensure that by 2007 4% ofelectricity comes from RES-E7 (excluding all forms of hydro). In addition,end-users or electricity traders located in Austria must ensure that 8% of theirsupply comes from small-scale hydro installations (up to 10 MW) located inAustria. Fulfilment of the 8% obligation must be documented by means ofspecific certificates for small-scale hydro.
Belgium Flanders: RES-E to account for 1% of energy production in 2001, 3% in 2004and 5% in 2010.
Denmark Aim of 12-14% RE contribution to primary energy consumption by 2005 andlong-term goal of 35% RE share of total primary energy consumption by 2030.Separate target of 20% RES-E share of electricity consumption by 2003.
Finland Increase of RE contribution to energy demand with 50% (3 Mtoe) by 2010 anda doubling by 2025. Increase of RES-E with 8.35 TWh between 1995-2010leading to a 31% share of electricity consumption by 2010.
France No overall RE targets, but various sectoral strategies and targets for example250-500 MW wind capacity by 2005.
Germany At least a doubling of RE share of total energy consumption by 2010.Greece Increase of RE share in national energy balance from 5.4% in 1996 to 8.2-
8.5% in 2010, mainly via wind and biomass.Ireland 500 MW target for installed electricity capacity for the period 2000-2005.
Increase in RES-E production from 6% in 1998 to 12.4% in 2005 - a 3.75%RE share in total primary energy requirement.
Italy RE production forecast suggesting an increase from 11.7 Mtoe in 1997 to 20.3Mtoe by 2008-2012. Installed capacity for RES-E forecasted to increase from17,104 MWe (1997) to 24,700 (2008-2012).
Luxembourg 10% of total electricity consumption should be covered by RES-E in 2010.Netherlands 5% RE share of total energy demand in 2010 and 10% by 2020. 1000 MW
wind capacity on onshore locations by 2000, but not separate policy target forRES-E.
Portugal No overall RE targets, but some specific technology targets established underfinancial support schemes (for example 180 MW RES-E by the end of 1999)
Spain Comprehensive plan for development of RE setting as overall target that 12%of energy demand should be covered by RE in 2010. Specific RES-E targetaiming at 29.4% RES-E share of total electricity generation by 2010.
Sweden Additional 1.5 TWh electricity from RES-E be end of 2002 from 3 sources:- CHP based on biofuels: 0.75 TWh- Wind power: 0.5 TWh,- Small scale hydropower: 0.25 TWh
UK Government proposal for 5% RES-E by 2003 and 10% by 2010 to be achievedby means of a Renewables Obligation imposed upon licensed electricitysuppliers.
7 RES-E : electricity from renewable sources
Renewable Energy Sector in the EU: its Employment and Export Potential
6ECOTEC Research and Consulting Ltd
National emphases on the rationale for promoting RE differ. These reasons are often relatedto national interests, levels of fuel security, or environmental protection considerations (seeBox 1).
Box 1 : Examples of national drivers influencing support for RE
• In Austria energy policy places a strong emphasis on improving the country's security ofenergy supply and reducing the amount of energy imports
• German energy policy is closely linked with national policies to support climateprotection. Renewable energy plays an important part in this policy, and the governmenthas actively supported financial provision towards renewables, both at national andregional level.
• The overall objective of Sweden's energy policy is to secure short and long term energysupply on economically competitive terms, with the emphasis on sustainabledevelopment.
• Danish policy seeks to replace electricity from coal with that from combined heat andpower, natural gas and renewable energy. Throughout the 1990s, a series of energystrategies have progressively raised the targets of renewable energy use.
• Irish energy policy focuses on increasing its use of indigenous energy sources and reduceits level of fossil fuel imports.
• Italian energy policy aims to reduce import dependency and to reduce greenhouse gasemissions.
2.3 Future development of RE sources in the EU
The principal drivers influencing the development of RE technologies and hence theimplementation of RE plant, focus on both technical and non-technical issues.
The RE industry is now recognised as a dynamic and expanding industry, with expandingcapabilities in a range of technologies. Research and development is helping to achieveprogressive improvements in technological capabilities, and to raise standards of plantperformance, availability, reliability, availability, etc. Demonstration projects are able toimprove confidence in plant performance by demonstrating these technologicalimprovements and encouraging replication. As a result, these improvements help to reduceunit costs, and help to make RE more cost-competitive with fossil plant.
There are a number of non-technical barriers that can limit the uptake of RE, although manyof these limitations are increasingly being overcome as RE is more widely implemented. Theprincipal non-technical support measures that need to be taken in order to achieve successfulimplementation of RE schemes can be summarised as follows:
• Political - providing strong political support, through adoption of policies in favour of RE
Renewable Energy Sector in the EU: its Employment and Export Potential
7ECOTEC Research and Consulting Ltd
• Legislative - ensuring that the energy market is accessible to independent electricityproducers, particularly through providing support for a guaranteed market and powersales for RE electricity
• Financial - providing access to financial support for investment in RE projects, throughgrants, loans, subsidies, etc.
• Fiscal - reflecting external costs and benefits of energy from RE sources compared withenergy from fossil or nuclear sources, particularly through use of carbon or energy taxes
• Role of public authorities - providing active support in the siting and implementation ofRE projects, including awareness raising and information campaigns, targeted towardspromoting the benefits of RE to the community
EU member states that have seen the greatest level of increase in RE deployment are thosethat have been most successful in implementing these support measures.

Renewable Energy Sector in the EU: its Employment and Export Potential
8ECOTEC Research and Consulting Ltd
3.0 EXPENDITURE
Achieving the EU’s agreed targets to achieve a doubling of the share of renewables in EUenergy use by 2010 requires considerable investment both from public sector and privatesector sources.
To stimulate a rapid uptake of RE in the early years after the RE White Paper, the EC issupporting a “Campaign for Take-Off”, targeted at providing initial support andimplementation activities to 2003 (see Table 2).
Public funding from all possible sources (European, national, regional, local) to stimulate theCampaign is anticipated to be in the order of 4 billion EURO.
Table 2: Targets for the Campaign for Take Off (1993-2003)
Campaign Action Proposed newinstalledcapacity
Estimatedtotal
investmentcost
(Bn Euro)
Suggestedpublic
funding(Bn Euro)
1,000,000 PV systems 1,000 MW 3 110,000 MW windfarms
10,000 MW 10 1.5
10,000 MW biomass 10,000 MW 5 1100 communities with“100% renewables”
1,500 MW 2.5 0.5
Total 20.5 4
In its 1997 White Paper on renewables (see section 2.1), the European Commission made anassessment of the total investment needed to achieve the 2010 target. In total, the investmentrequired was estimated to be 165 billion EURO, between 1997 and 2010. This analysisincluded the anticipated cost reductions as technological improvements and a greater uptakeof technologies lead to a reduction in unit costs for renewable energy installations. (SeeTable 3).
Renewable Energy Sector in the EU: its Employment and Export Potential
9ECOTEC Research and Consulting Ltd
Table 3: Estimated Investment Costs/Benefits by Sector to meet the 2010 target of doubling proportion of RE use in the EU
Type ofEnergy
AdditionalCapacity
1997 - 2010
Unit Cost1997 EURO
Unit Cost2010 EURO
Average UnitCost EURO
TotalInvestment1997–2010Bn Euro
AdditionalAnnual
Business 2010Bn Euro
Benefit ofAnnual AvoidedFuel Costs 2010
Bn Euro
Total Benefit ofAvoided FuelCosts 1997 –
2010 Bn Euro
Wind 36 GW 1,000/kW 700/kW 800/kW 28.8 4 1.43 10
Hydro 13GW 1,200/kW 1,000/kW 1,100/kW 14.3 2 0.91 6.4
Photovoltaics 3 GWp 5,000/kWp 2,500/kWp 3,000/kWp 9 1.5 0.06 0.4
Biomass 90 Mtoe 84 24.1 - -
Geothermal (+heat pumps)
2.5 GW 2,500/kW 1,500/kW 2,000/kW 5 0.5 - -
SolarCollectors
94 M m2 400/m2 200/m2 250/m2 24 4.5 0.6 4.2
Total for EUmarket
165.1 36.6 3 21
From: Communication from the Commission: Energy for the future: Renewable Sources of Energy. White paper for a Community Strategy and Action Plan.

Renewable Energy Sector in the EU its Employment and Export Potential
ECOTEC Research and Consulting Limited
11
At the national level, member states are providing a wide range of public sector financialsupport initiatives to stimulate uptake of RE. Some examples include the following:
• Germany’s Feed-In Law was established in 1991 and expanded in 2000. It providessupport for RE electricity by providing a guaranteed market and fixed price for electricityfrom RE sources. Wind energy schemes benefited considerably during the late 1990sfrom very favourable tariffs available, such that Germany is the world leader in windenergy capacity. More recently, photovoltaics installations also now benefit fromgenerous tariffs (0.99 DM/kWh, 0.51 EURO/kWh) through the Feed-In Law. In addition,the “100,000 Roofs programme”, started in 1999, provides 560 M Euro towardssupporting individuals and small and medium-sized companies to install grid-connectedPV systems. As a result, the 100,000 roofs target is predicted to be achieved by 2003.
• Denmark has led the way in exploiting wind energy since the late 1980s, and is nowworking towards a target of providing 45% of Danish electricity consumption from windpower (on- and off-shore) by 2030. This success was achieved by a combination ofpremium tariffs for electricity from wind power, together with generous subsidies towardsearly research, development and demonstration initiatives, particularly in the late 1980sand early 1990s. As a result, Danish wind energy companies are now world leaders. Theimportance of wind energy to the rural economy has long been recognised in Denmark,where the majority of turbines are privately owned (see Box).
• Finland has some of the highest use of RE, particularly of biomass, in the EU. Thegovernment has supported extensive research and development into the biomasstechnology industry, which has helped to create a strong indigenous market and exportindustry.
• Spain has rapidly expanded its use of wind energy in recent years, achieved through theprovision of generous tariffs for RE electricity, combined with active political support atregional level for new wind power installations. In particular the regions supported thedevelopment of indigenous wind manufacturing industries, in order to stimulate theregional economy. Spain now has a solid core of three totally home-based turbinemanufacturers - MADE, Ecotecnia and Desarrollos Eolicas - these have now been joinedby others which use Danish technology or are jointly owned with Danish companies.These include Gamesa Eolica, NEG Micon, Bazan-Bonus and Nordex. Rules laid down byregional governments like Galicia have kept turbine imports to a minimum.
Renewable Energy Sector in the EU its Employment and Export Potential
ECOTEC Research and Consulting Limited
12
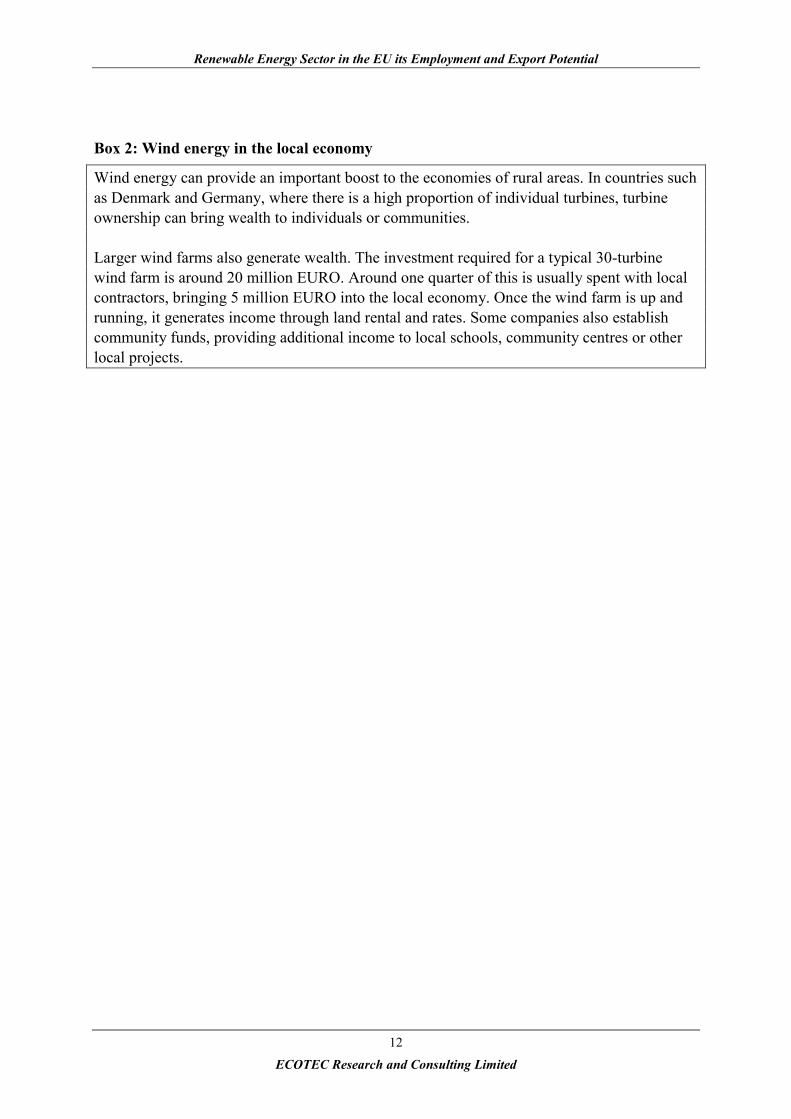
Box 2: Wind energy in the local economy
Wind energy can provide an important boost to the economies of rural areas. In countries suchas Denmark and Germany, where there is a high proportion of individual turbines, turbineownership can bring wealth to individuals or communities.
Larger wind farms also generate wealth. The investment required for a typical 30-turbinewind farm is around 20 million EURO. Around one quarter of this is usually spent with localcontractors, bringing 5 million EURO into the local economy. Once the wind farm is up andrunning, it generates income through land rental and rates. Some companies also establishcommunity funds, providing additional income to local schools, community centres or otherlocal projects.
Renewable Energy Sector in the EU its Employment and Export Potential
ECOTEC Research and Consulting Limited
13
4.0 EMPLOYMENT
4.1 Impacts of RE on employment at EU level
A study8 carried out during 1998-9 for DG XVII (Energy) of the European Commissionaimed to provide a comprehensive analysis of the impacts of renewable energy deployment onemployment from the present day to 2020. Key findings from the study were as follows:
• Energy produced from renewable sources is predicted to increase by a factor of about 2.4,from a base of 440 TWh in 1995 to 1,066 TWh by 2020. The modelling predicts increasesin the capacity and output of all the renewable energy technologies studied, and in allMember States. These predictions also represent an increase in the overall proportion offinal energy consumption in the EU provided by renewables9 from 4.3% in 1995 to 8.2%by 2020.
• The modelling predictions estimate that this increase in energy provided from renewablesources can result in the creation of over 900,000 new jobs by 2020. 385,000 jobs arepredicted to be created by 2020 from provision of renewable energy, and a further 515,000jobs from biomass fuel production. This increase takes account of the direct, indirect andsubsidy effects on employment, and jobs displaced in conventional energy technologies.
• Jobs gains are greatest from biomass technologies - both in the biomass energy industryand in fuel supply - however all technologies show long-term net job creation.
• Renewable energy technologies are in general more labour intensive than conventionalenergy technologies, in delivering the same amount of energy output.
• Jobs displaced as a result of subsidies to support renewable energy deployment aresignificantly less than corresponding job gains (both direct and indirect impacts)elsewhere in the economy.
• Job gains are greatest in the agriculture and manufacturing industrial sectors. Theconventional energy supply industry is predicted to lose less than 2% of its work force by2020 as a consequence of the shift to a greater use of energy from renewable sources.
• All technologies generate a net increase in jobs during the construction phase. For sometechnologies however there are net employment losses during the operational phase.
• Employment creation occurs in all Member States. Germany, France and Italy have thegreatest absolute employment increases, whilst Denmark, Greece and Austria achieve thehighest proportional increase relative to the size of their labour force.
8 The impact of renewables on employment and economic growth. ALTENER project 4.1030/E/97-0099 Excluding large hydro, geothermal, wave and tidal energy, which were not included in the analysis.

Renewable Energy Sector in the EU its Employment and Export Potential
ECOTEC Research and Consulting Limited
14
The results from the study are of practical benefit to many different groups, including policymakers, the renewable energy industry, regional and local authorities, investors, and will helpraise general awareness about the employment benefits from renewable energy technologies.
This net employment increase occurs because:
• renewable energy production is more labour intensive than conventional energyproduction, in delivering the same amount of energy output;
• renewable energy production uses less imported goods and services, especially during theoperational phase, and therefore results in a slightly higher multiplier effect;
• the analysis has assumed that expansion of biological fuel sources occurs withoutdisplacing employment in conventional agriculture and forestry 10.
To an extent, and more so in the earlier years, subsidies are required to enable renewables tocompete in the market with conventional energy sources. However, even when allowance ismade for jobs that would have been created from alternate deployment of these subsidies(consumers buying other goods, governments investing in alternative public services)renewables were still found to generate net jobs relative to conventional energy sources theydisplace.
4.2 Principal opportunities for employment
Opportunities for employment from the renewable energy sector occur in a wide range ofareas:
• Manufacturing - design and fabrication, component manufacture and supply, assembly,refurbishment
• Project development - a wide range of sectors contribute to the development of a REproject, including planners, surveyors, financiers, insurance, project design anddevelopers, architects, etc.
• Construction and installation of the plant includes site operations, electrical andmechanical engineering, fabrications, etc.
• Operation and maintenance of the plant requires a range of specialist and non-specialistskills, including management, servicing, fuel collection and supply (for biomass plant).
10 The rationale for this is that there is still widespread overproduction of many agricultural products due to pricesubsidies from consumers and export subsidies from the CAP even though significant areas of land are in set-aside. The political reality of how an increase in energy crop production can be brought about within theframework of CAP and international trade agreements has not been considered within this study.

Renewable Energy Sector in the EU its Employment and Export Potential
ECOTEC Research and Consulting Limited
15
4.3 Estimates from trade associations
A number of EU trade associations have made estimates of the potential employment impactsof increased deployment of individual RE technologies in the EU. These estimates arepresented in Table 4. An assessment of current employment in the wind industry, provided bythe EU’s wind energy trade association, is given in Box 3, and a similar assessment by the PVtrade association is given in Box 4.
Table 4: Job creation estimates from Trade Associations
Sector Employment Trade AssociationWind 190,000-320,000 by 2010 if
40GW wind power installed(EWEA) European Wind Energy Association
Solar PV 100,000 by 2010, if 3 GW ofsolar PV installed
(EPIA) The European Photovoltaic IndustryAssociation
Biomass 1,000,000 by 2010, ifbiomass potential is fullyexploited.
(AEBIOM) The European biomass Association
Solar 250,000 (ESIF) The European Solar Industry FederationSources: Various, as reported in the EC White Paper for a Community Strategy and ActionPlan, 1997
Box 3: Employment in the wind energy industry
Over 20,000 Europeans are directly employed in the wind energy industry, many of theseemployed in SMEs. Manufacture and installation of wind turbines employs, on average,around six people per year for every MW of newly manufactured turbines. For operation andmaintenance, between 100 and 450 people are employed per year for every TWh of electricityproduced. The number varies according to the age and type of turbines.
For every job in wind turbine and component manufacture, installation and operation andmaintenance, there is at least one more in associated sectors of the industry. This includesconsultancy, legal work, planning, research, finance, sales, marketing, publishing, andeducation.Source: European Wind Energy Association
In Germany, manufacturers of complete wind turbines and components directly employ morethan 3000 people. Just under a third of these started employment during 1998. If activitiessuch as planning, construction, operation, servicing, licensing and financing are taken intoaccount, then almost 15,000 jobs have been created, many in the economically weak areas ofnorthern Germany. In 2000, the turnover of the German wind industry reached 1.7 billionEURO, providing 25,000 direct and indirect jobs.Source: Wind Force 10. Edition 2000

Renewable Energy Sector in the EU its Employment and Export Potential
ECOTEC Research and Consulting Limited
16
Box 4 : Employment in the PV industry
The opening of new PV production facilities result in the creation of about 20 jobs per MWpof capacity. In addition, wholesale, retail and installation services associated with each MWpof systems sold provide for about 30 jobs. Most of these jobs are at the regional or local levelsince they must be located close to the end-customer. Maintenance of installed systemsprovides for on average 1 job per MWp of cumulated installed systems. In addition,employment opportunities are also created in associated sectors such as universities andresearch institutes, and in the construction industry. Most of these jobs will be realised at thelocal level through a need for new retailing and installation services close to the customer.
It is estimated that PV technology would provide in the European Union in the year 2010about 59,000 jobs to meet the EU target of 3 GWp by 2010. Taking into account exportopportunities and associated service industries, e.g. the construction section, a level of100,000 jobs is 2010 is realistic.Source: European PV Industry Association
Renewable Energy Sector in the EU its Employment and Export Potential
ECOTEC Research and Consulting Limited
17
5.0 MARKETS
5.1 World RE markets
5.1.1 Overview
Today, EU companies are amongst the world leaders in developing new RE technologies,both for domestic markets and worldwide. The EU’s RE industry will continue to expand, inparticular to meet the challenging target set by the recent EC Directive to double RE’s shareof electricity in the EU by 2010. As a result, RE companies have increasing confidence in thefuture of the market, which will help them to maintain and improve their competitive edge.The initiative will especially have significant effects on SMEs, as they constitute an importantpart of the sector.
As a result of the strong and expanding market for RE technologies in the EU, many EU REcompanies are also active in the worldwide RE market. EU hydro and PV industries, forexample, are already well established in growing markets as Latin America and Asia.
5.1.2 Market drivers and trends
The main drivers for encouraging RE in developed countries (including the EU) lie inenvironmental protection, particularly the role that RE can play towards meeting Kyototargets to reduce greenhouse gas emissions.
However, in developing countries, it is the shortage of energy that is the main driver. In manydeveloping countries, RE is one of the main opportunities for providing off-grid electricity tothe many millions of rural communities that currently do not have any power. RE also playsan important role in the overall energy mix for developing countries, by reducing the need forcostly imports of fossil fuels, and instead exploiting indigenous energy resources.
Aid agencies and other large public and private sector investment programmes, areincreasingly considering RE as a secure and cost-effective opportunity for energy provision indeveloping countries. New financing initiatives, particularly through Clean DevelopmentMechanism and Joint Implementation, will increasingly be used by developed countries as ameans of implementing RE in developing countries.
Renewable Energy Sector in the EU its Employment and Export Potential
ECOTEC Research and Consulting Limited
18
5.2 Technology overviews
5.2.1 Wind
World wind developments
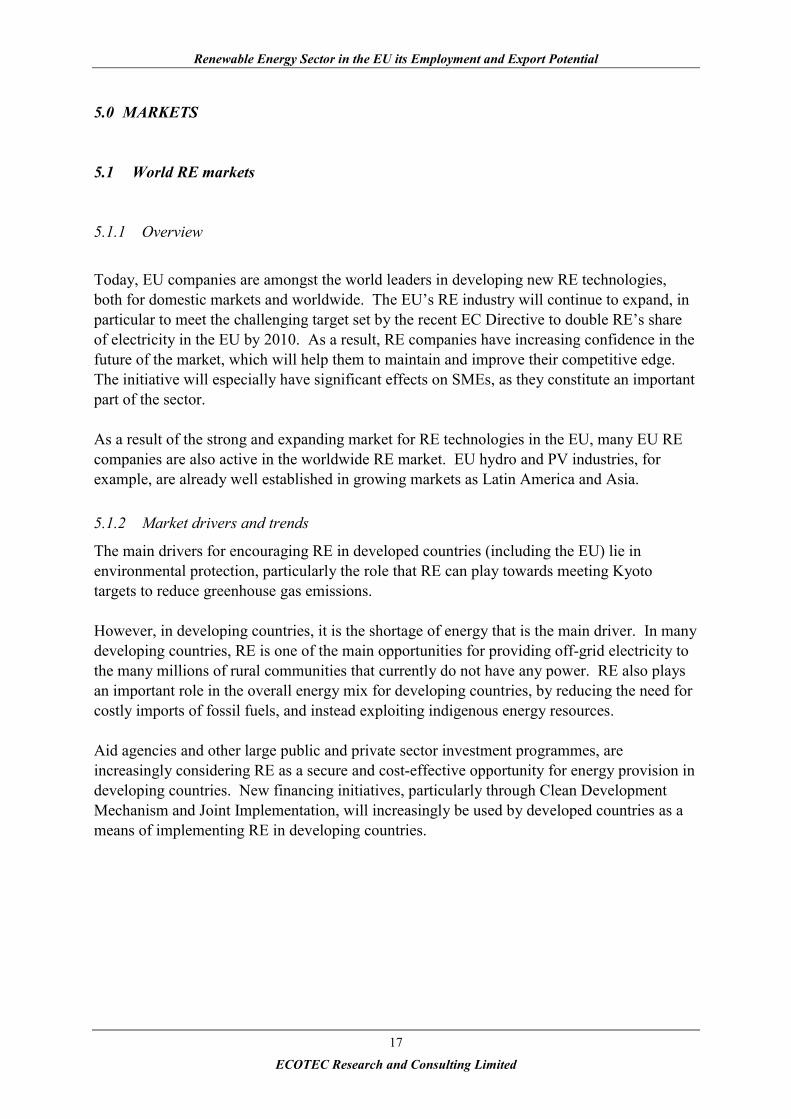
Average growth rates for wind energy installations for the five years to 1998 wereapproximately 40%, and the total capacity installed world-wide by 2000 was over 18,000 MW(see Figure 211). 75% of this capacity is in the EU, with a further 15% in North America(particularly the US). It is estimated that international wind markets will continue to grow atan average rate of 25% up to 2006.12
Emerging wind energy markets world-wide include:
• India, which currently ranks fifth in global capacity, installing a further 55 MW in 2000,bringing its total capacity up to over 1,100 MW.
• Egypt, which had 50MW come on line in 2000, backed by foreign aid and overseasinvestments.
• China, which is starting to develop a large portfolio of wind energy projects based aroundits renewable energy strategy, particularly relating to rural energy provision.
• Argentina, with planned expansion of 3,000MW of wind energy, with a first phase in 2001installing 280MW at a total investment cost of 640 M Euro.
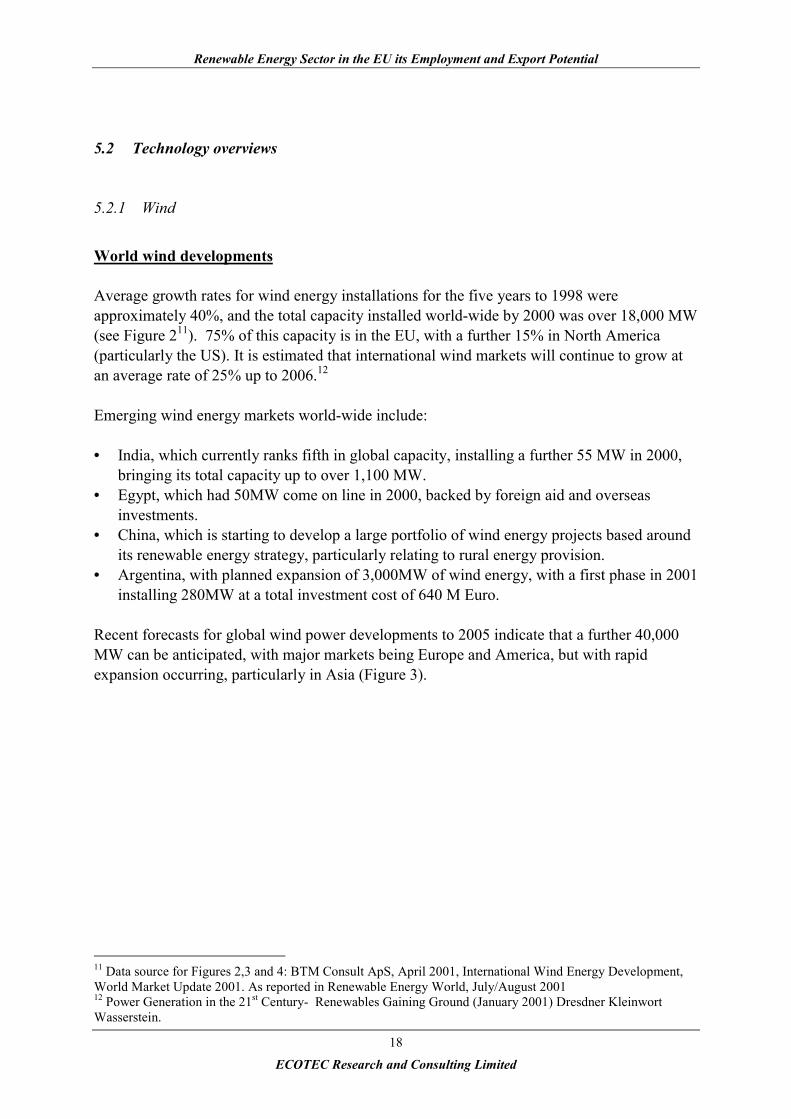
Recent forecasts for global wind power developments to 2005 indicate that a further 40,000MW can be anticipated, with major markets being Europe and America, but with rapidexpansion occurring, particularly in Asia (Figure 3).
11 Data source for Figures 2,3 and 4: BTM Consult ApS, April 2001, International Wind Energy Development,World Market Update 2001. As reported in Renewable Energy World, July/August 200112 Power Generation in the 21st Century- Renewables Gaining Ground (January 2001) Dresdner KleinwortWasserstein.
Renewable Energy Sector in the EU its Employment and Export Potential
ECOTEC Research and Consulting Limited
19
Figure 2 : Total installed wind energy capacity worldwide (2000)
America15%
Europe75%
Asia9%
Africa1%
OECD-Asia0%
Total world-wide installed capacity by 2000 = 18,449 MW
Figure 3 : Forecast for global wind energy development to 2005
0
10,000
20,000
30,000
40,000
50,000
Total Europe Total America Total Asia Total other
MW
2000 2005
EU wind energy developments
The European Wind Energy Association’s target of 40,000 MW wind capacity in the EU by2010 has recently been revised upwards to 60,000 MW, in the light of the continuedexpansion in wind energy developments throughout the EU.
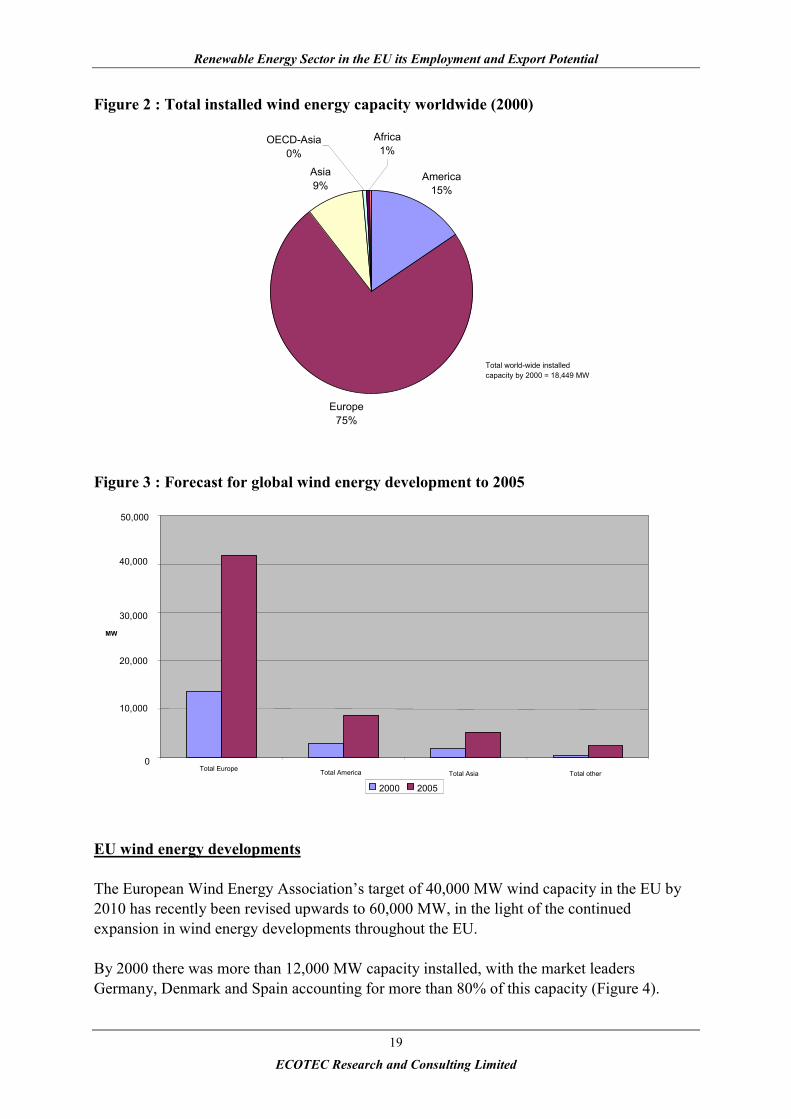
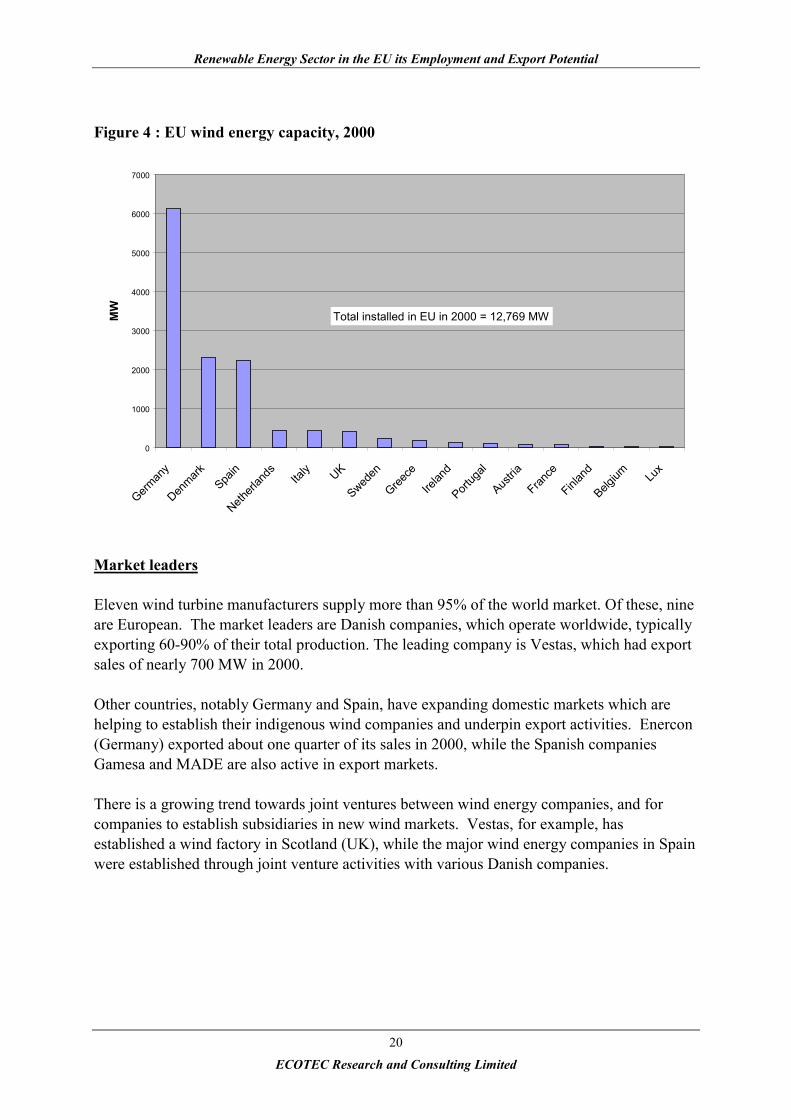
By 2000 there was more than 12,000 MW capacity installed, with the market leadersGermany, Denmark and Spain accounting for more than 80% of this capacity (Figure 4).
Renewable Energy Sector in the EU its Employment and Export Potential
ECOTEC Research and Consulting Limited
20
Figure 4 : EU wind energy capacity, 2000
0
1000
2000
3000
4000
5000
6000
7000
German
y
Denmark
Spain
Netherl
ands Ita
ly UK
Sweden
Greece
Irelan
d
Portug
al
Austria
France
Finlan
d
Belgium Lu
x
MW
Total installed in EU in 2000 = 12,769 MW
Market leaders
Eleven wind turbine manufacturers supply more than 95% of the world market. Of these, nineare European. The market leaders are Danish companies, which operate worldwide, typicallyexporting 60-90% of their total production. The leading company is Vestas, which had exportsales of nearly 700 MW in 2000.
Other countries, notably Germany and Spain, have expanding domestic markets which arehelping to establish their indigenous wind companies and underpin export activities. Enercon(Germany) exported about one quarter of its sales in 2000, while the Spanish companiesGamesa and MADE are also active in export markets.
There is a growing trend towards joint ventures between wind energy companies, and forcompanies to establish subsidiaries in new wind markets. Vestas, for example, hasestablished a wind factory in Scotland (UK), while the major wind energy companies in Spainwere established through joint venture activities with various Danish companies.
Renewable Energy Sector in the EU its Employment and Export Potential
ECOTEC Research and Consulting Limited
21
Offshore wind
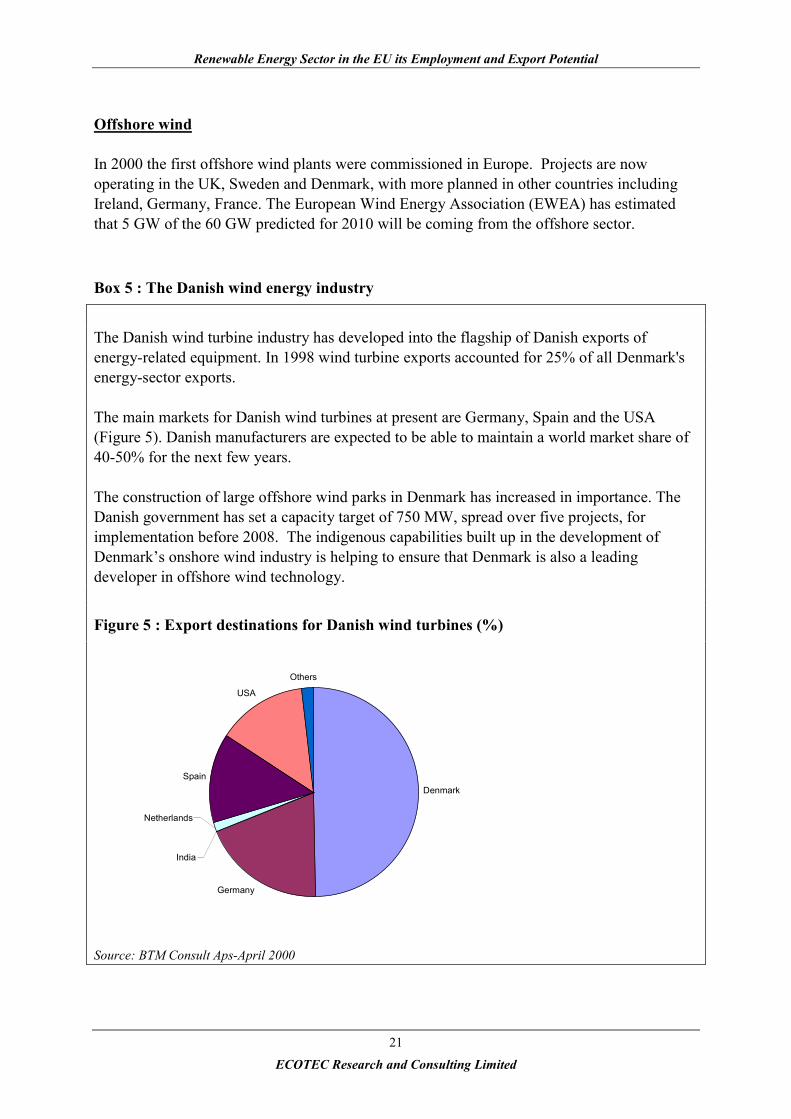
In 2000 the first offshore wind plants were commissioned in Europe. Projects are nowoperating in the UK, Sweden and Denmark, with more planned in other countries includingIreland, Germany, France. The European Wind Energy Association (EWEA) has estimatedthat 5 GW of the 60 GW predicted for 2010 will be coming from the offshore sector.
Box 5 : The Danish wind energy industry
The Danish wind turbine industry has developed into the flagship of Danish exports ofenergy-related equipment. In 1998 wind turbine exports accounted for 25% of all Denmark'senergy-sector exports.
The main markets for Danish wind turbines at present are Germany, Spain and the USA(Figure 5). Danish manufacturers are expected to be able to maintain a world market share of40-50% for the next few years.
The construction of large offshore wind parks in Denmark has increased in importance. TheDanish government has set a capacity target of 750 MW, spread over five projects, forimplementation before 2008. The indigenous capabilities built up in the development ofDenmark’s onshore wind industry is helping to ensure that Denmark is also a leadingdeveloper in offshore wind technology.
Figure 5 : Export destinations for Danish wind turbines (%)
Denmark
Germany
Spain
USA
Others
Netherlands
India
Source: BTM Consult Aps-April 2000
Renewable Energy Sector in the EU its Employment and Export Potential
ECOTEC Research and Consulting Limited
22
5.2.2 Photovoltaics
World PV markets
The world market for photovoltaics (PV) is estimated to be worth in excess of £1 billion perannum, and the potential market is enormous.
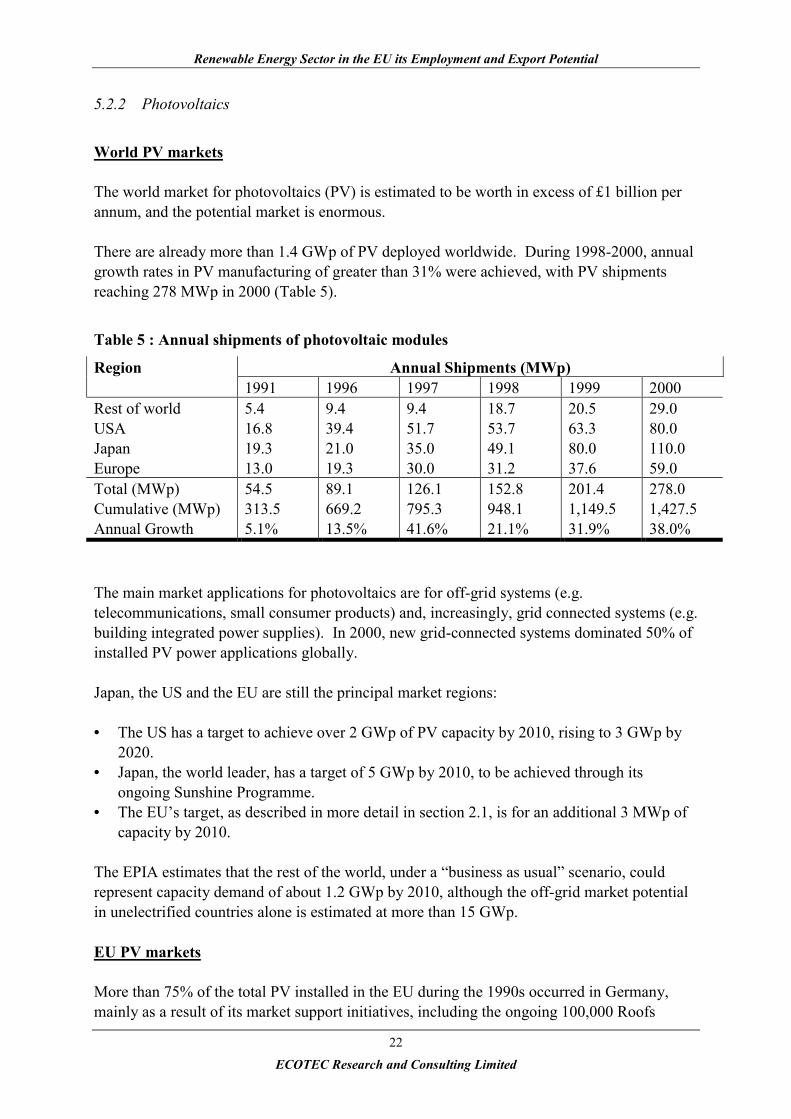
There are already more than 1.4 GWp of PV deployed worldwide. During 1998-2000, annualgrowth rates in PV manufacturing of greater than 31% were achieved, with PV shipmentsreaching 278 MWp in 2000 (Table 5).
Table 5 : Annual shipments of photovoltaic modules
Annual Shipments (MWp)Region1991 1996 1997 1998 1999 2000
Rest of worldUSAJapanEurope
5.416.819.313.0
9.439.421.019.3
9.451.735.030.0
18.753.749.131.2
20.563.380.037.6
29.080.0110.059.0
Total (MWp)Cumulative (MWp)Annual Growth
54.5313.55.1%
89.1669.213.5%
126.1795.341.6%
152.8948.121.1%
201.41,149.531.9%
278.01,427.538.0%
The main market applications for photovoltaics are for off-grid systems (e.g.telecommunications, small consumer products) and, increasingly, grid connected systems (e.g.building integrated power supplies). In 2000, new grid-connected systems dominated 50% ofinstalled PV power applications globally.
Japan, the US and the EU are still the principal market regions:
• The US has a target to achieve over 2 GWp of PV capacity by 2010, rising to 3 GWp by2020.
• Japan, the world leader, has a target of 5 GWp by 2010, to be achieved through itsongoing Sunshine Programme.
• The EU’s target, as described in more detail in section 2.1, is for an additional 3 MWp ofcapacity by 2010.
The EPIA estimates that the rest of the world, under a “business as usual” scenario, couldrepresent capacity demand of about 1.2 GWp by 2010, although the off-grid market potentialin unelectrified countries alone is estimated at more than 15 GWp.
EU PV markets
More than 75% of the total PV installed in the EU during the 1990s occurred in Germany,mainly as a result of its market support initiatives, including the ongoing 100,000 Roofs
Renewable Energy Sector in the EU its Employment and Export Potential
ECOTEC Research and Consulting Limited
23
Programme (see section 2.2). Other EU countries are now following similar initiatives toprovide financial and technical support to establish PV installation programmes, particularlyItaly, which started a PV roof programme in 2001, and the UK, which has recently establisheda series of demonstration projects on both domestic and industrial installations.
Market leaders
The top eight producers of PV cells/modules in 2000 produced 82% (235 MW) of total worldproduction. Japanese companies dominate (Sharp, Kyocera, Astro Power, Sanyo, Mitsubishi),and the US also has strong industry presence (AstroPower, Siemens Solar, BP Solar(Solarex)).
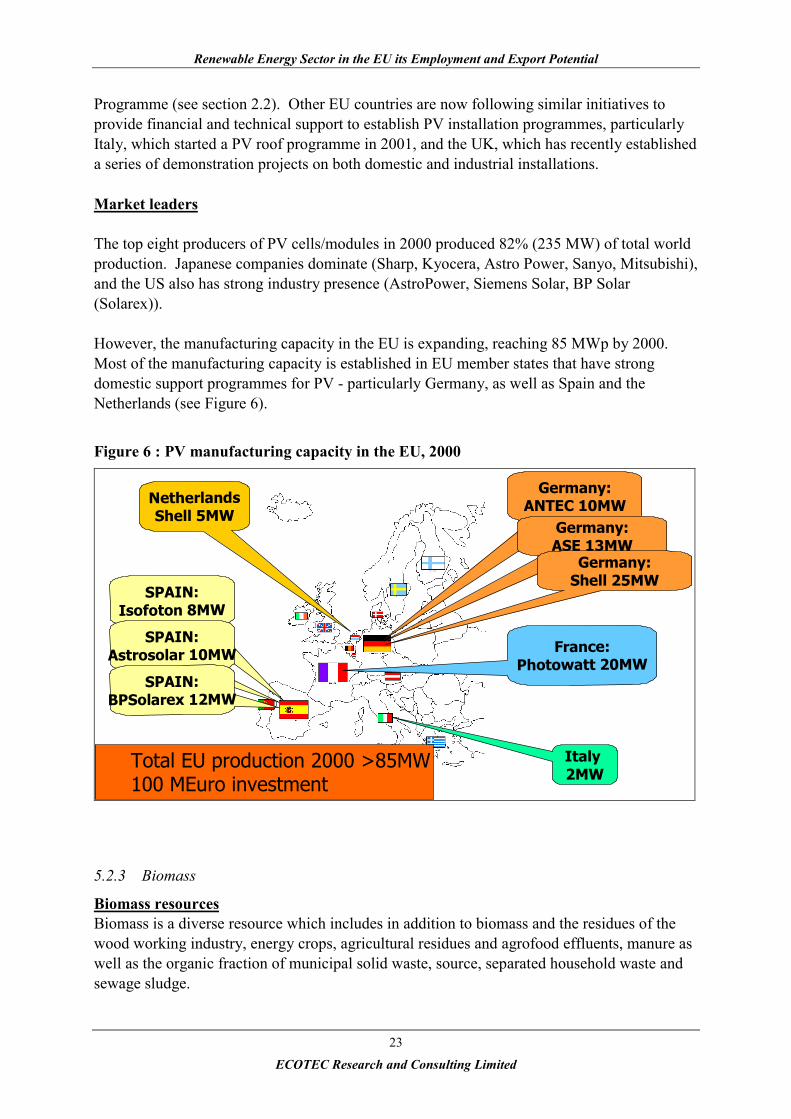
However, the manufacturing capacity in the EU is expanding, reaching 85 MWp by 2000.Most of the manufacturing capacity is established in EU member states that have strongdomestic support programmes for PV - particularly Germany, as well as Spain and theNetherlands (see Figure 6).
Figure 6 : PV manufacturing capacity in the EU, 2000
Germany:ANTEC 10MW
SPAIN:Isofoton 8MW
Italy 2MW
NetherlandsShell 5MW
Germany:ASE 13MW
Germany:Shell 25MW
France:Photowatt 20MW
SPAIN:Astrosolar 10MW
SPAIN:BPSolarex 12MW
Total EU production 2000 >85MW100 MEuro investment
5.2.3 Biomass
Biomass resourcesBiomass is a diverse resource which includes in addition to biomass and the residues of thewood working industry, energy crops, agricultural residues and agrofood effluents, manure aswell as the organic fraction of municipal solid waste, source, separated household waste andsewage sludge.
Renewable Energy Sector in the EU its Employment and Export Potential
ECOTEC Research and Consulting Limited
24
Biomass use covers a wide spectrum from producing heat and generating electricity toproducing fuels for the transport sector.
In some regions of the world, biomass is the major source of heating and cooking andrepresents about 14 percent of final global energy demand.13 It is very difficult to measure theuse of biomass because of the diversity of its applications and the fact that much of thebiomass use is non-commercial.
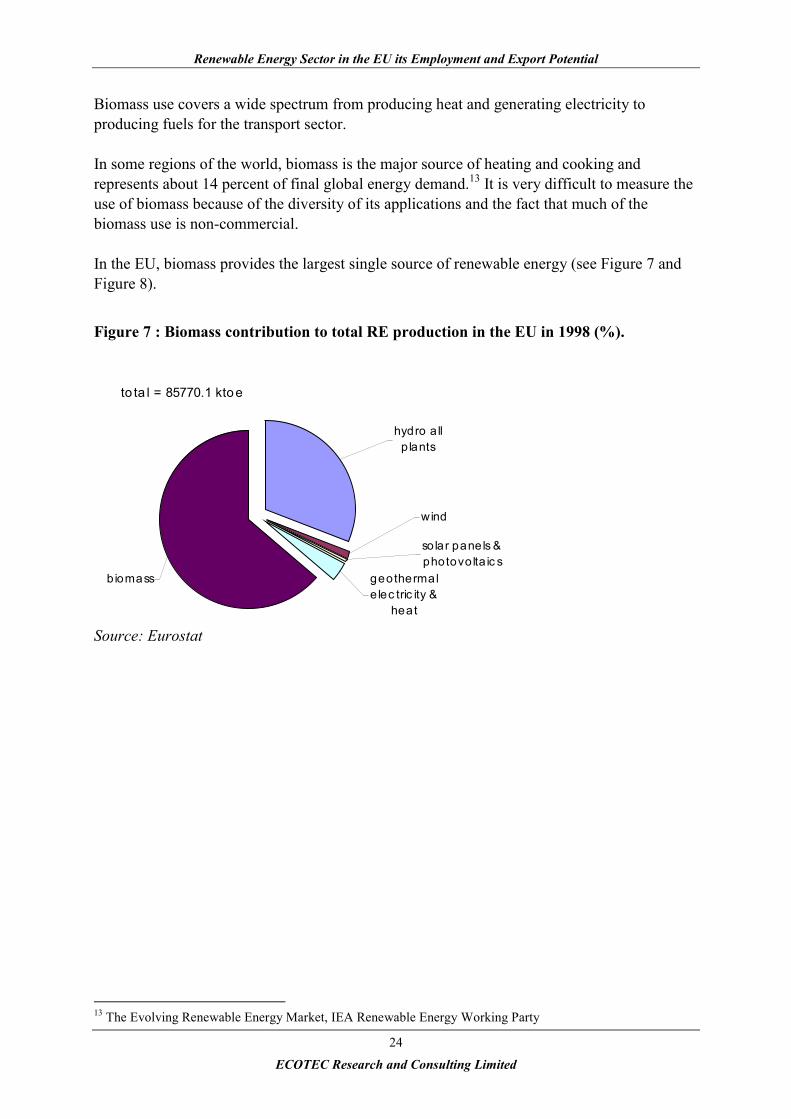
In the EU, biomass provides the largest single source of renewable energy (see Figure 7 andFigure 8).
Figure 7 : Biomass contribution to total RE production in the EU in 1998 (%).
Source: Eurostat
13 The Evolving Renewable Energy Market, IEA Renewable Energy Working Party
biomass
wind
geothermal e lec tric ity &
heat
so lar panels & photovolta ic s
hydro a ll p lants
to ta l = 85770.1 ktoe
Renewable Energy Sector in the EU its Employment and Export Potential
ECOTEC Research and Consulting Limited
25
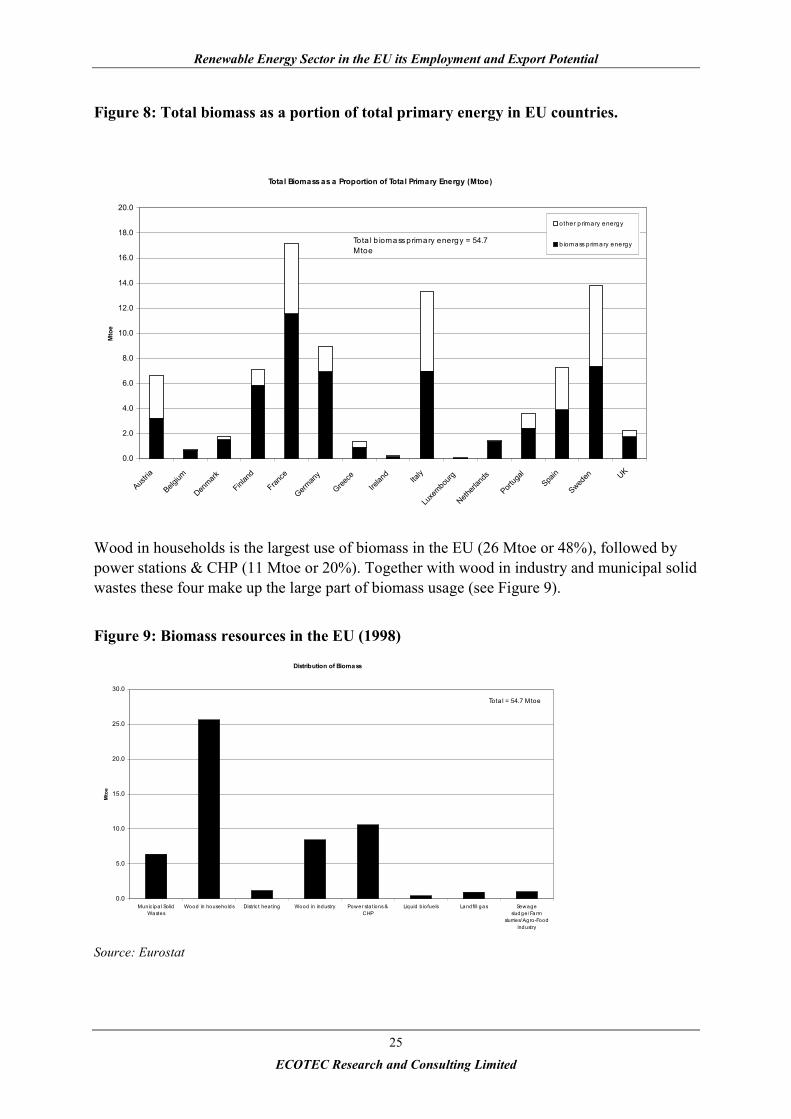
Figure 8: Total biomass as a portion of total primary energy in EU countries.
Total Biomass as a Proportion of Total Primary Energy (Mtoe)
0.0
2.0
4.0
6.0
8.0
10.0
12.0
14.0
16.0
18.0
20.0
Austria
Belgium
Denmark
Finlan
d
France
German
y
Greece
Irelan
dIta
ly
Luxe
mbourg
Netherl
ands
Portug
alSpa
in
Sweden UK
Mto
e
other p rimary energy
b iomass p rimary energyTota l b ioma ss primary energy = 54.7 Mtoe
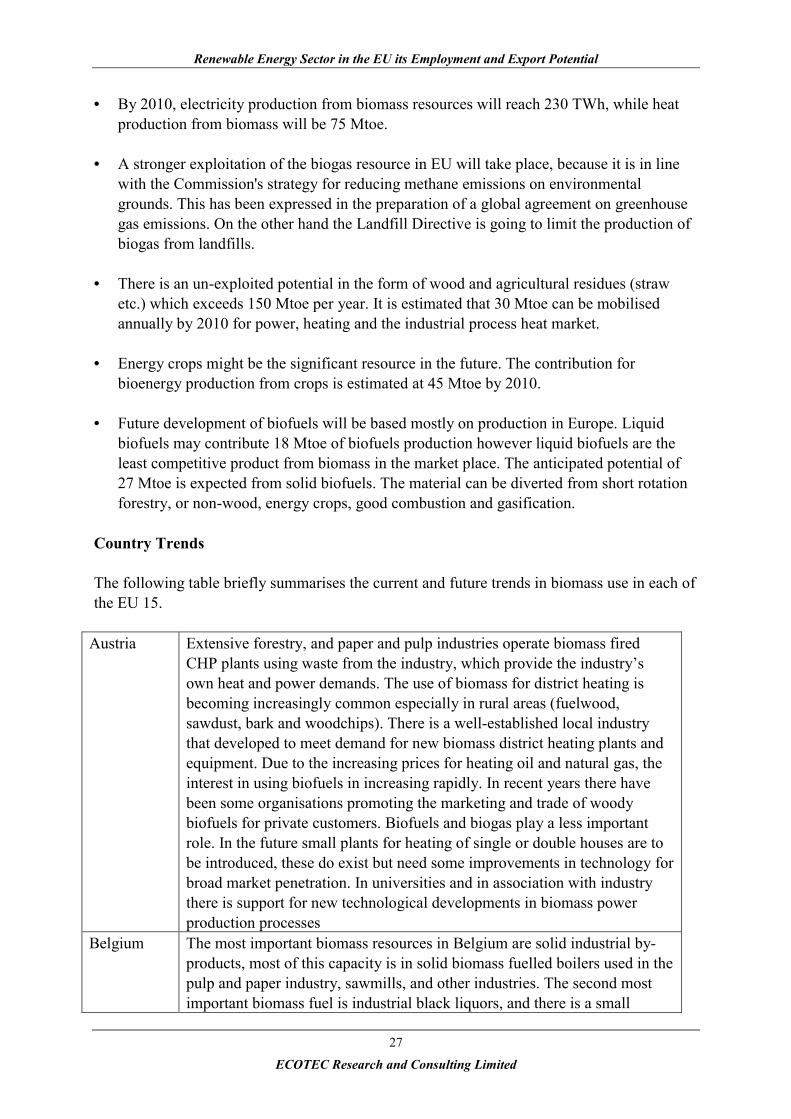
Wood in households is the largest use of biomass in the EU (26 Mtoe or 48%), followed bypower stations & CHP (11 Mtoe or 20%). Together with wood in industry and municipal solidwastes these four make up the large part of biomass usage (see Figure 9).
Figure 9: Biomass resources in the EU (1998)
Distribution of Biomass
0.0
5.0
10.0
15.0
20.0
25.0
30.0
Munic ipa l SolidWastes
Wood in households Distric t hea ting Wood in industry Power sta tions &CHP
Liquid b iofuels Land fill gas Sewagesludge/ Farm
slurries/ Agro-Foodindustry
Mto
e
Tota l = 54.7 Mtoe
Source: Eurostat

Renewable Energy Sector in the EU its Employment and Export Potential
ECOTEC Research and Consulting Limited
26
The biomass sector has shown an increase of 13.5% in the EU-15 during the period 1995-1998, although some MS have achieved much greater increases of 57% (Germany) and 94%(Italy) in the same period of time.14
The principal biomass resources currently utilised are forest residues, wood industry residues,as well as municipal wastes. Crops grown for energy use (e.g. coppice) are increasingly beingdeveloped as an agricultural fuel resource. These range of solid biofuels are used fortraditional uses (fuel wood for domestic heating etc.), and at a larger scale to provide heat forindustrial processes or district heating systems. Increasingly, wood and other biomassresources are being used for power generation, using conventional combustion systems or vianew technologies such as gasification or pyrolysis.
Liquid biofuels are increasingly being used for transport fuels in some EU countries. The twoprimary types of biodiesel and bioethanol, derived from oilseed rape, sunflower oil, wheat,sorghum. Waste oils are also an important source of biofuels.
Energy is also recovered from landfill gas, and from biogas, which is produced throughanaerobic digestion of sewage, agricultural slurries and the organic component of industrialand urban wastes. Biogas plants can become centres for the management of agriculturalmanure in rural areas. Biogas plants also play a role in the recycling of organic waste productsfrom households in cities. It is predicted that the production of biogas under controlledconditions from organic residues will increase, the collection and use of landfill gas toproduce energy remains only a second option. Landfill gas production is expected to becomeless important in the future as legislation limits the amount of biodegradable material that canbe disposed of to landfill sites. However, the emission of gases will continue for more than 10years after the closing of disposal sites. Only 2% of the potential of animal manure is used forbiogas production in Europe. A big gap exists between the available technologies and theexisting market.
Future developments
Biomass resources are proposed to produce more than 80% (90.2 out of 107.6 Mtoe,according to the Commission White Paper) of the total additional contribution of renewablesby 2010 in EU countries:
• Biogas (livestock production, sewage treatment, landfills) - 15 Mtoe• Agricultural and forest Residues - 30 Mtoe• Energy crops - 45 Mtoe
Projections by the Commission15 relating to the uptake of biomass include the following:
14 Communication from the Commission to the Council, The European Parliament, The Economic and Socialcommittee and The Committee of the Regions on the implementation of the Community Strategy and Actionplan on Renewable Energy Sources (1998-2000), Brussels, 16.02.200115 Communication from the Commission Energy for the Future: Renewable Sources of Energy White Paper for aCommunity Strategy and Action Plan.
Renewable Energy Sector in the EU its Employment and Export Potential
ECOTEC Research and Consulting Limited
27
• By 2010, electricity production from biomass resources will reach 230 TWh, while heatproduction from biomass will be 75 Mtoe.
• A stronger exploitation of the biogas resource in EU will take place, because it is in linewith the Commission's strategy for reducing methane emissions on environmentalgrounds. This has been expressed in the preparation of a global agreement on greenhousegas emissions. On the other hand the Landfill Directive is going to limit the production ofbiogas from landfills.
• There is an un-exploited potential in the form of wood and agricultural residues (strawetc.) which exceeds 150 Mtoe per year. It is estimated that 30 Mtoe can be mobilisedannually by 2010 for power, heating and the industrial process heat market.
• Energy crops might be the significant resource in the future. The contribution forbioenergy production from crops is estimated at 45 Mtoe by 2010.
• Future development of biofuels will be based mostly on production in Europe. Liquidbiofuels may contribute 18 Mtoe of biofuels production however liquid biofuels are theleast competitive product from biomass in the market place. The anticipated potential of27 Mtoe is expected from solid biofuels. The material can be diverted from short rotationforestry, or non-wood, energy crops, good combustion and gasification.
Country Trends
The following table briefly summarises the current and future trends in biomass use in each ofthe EU 15.
Austria Extensive forestry, and paper and pulp industries operate biomass firedCHP plants using waste from the industry, which provide the industry’sown heat and power demands. The use of biomass for district heating isbecoming increasingly common especially in rural areas (fuelwood,sawdust, bark and woodchips). There is a well-established local industrythat developed to meet demand for new biomass district heating plants andequipment. Due to the increasing prices for heating oil and natural gas, theinterest in using biofuels in increasing rapidly. In recent years there havebeen some organisations promoting the marketing and trade of woodybiofuels for private customers. Biofuels and biogas play a less importantrole. In the future small plants for heating of single or double houses are tobe introduced, these do exist but need some improvements in technology forbroad market penetration. In universities and in association with industrythere is support for new technological developments in biomass powerproduction processes
Belgium The most important biomass resources in Belgium are solid industrial by-products, most of this capacity is in solid biomass fuelled boilers used in thepulp and paper industry, sawmills, and other industries. The second mostimportant biomass fuel is industrial black liquors, and there is a small
Renewable Energy Sector in the EU its Employment and Export Potential
ECOTEC Research and Consulting Limited
28
proportion of domestic firewood used. The heating market will be the mostimportant area of development in the future. The current import and exportmarkets are not significant due to the poor utilisation of biomass inBelgium.
Denmark Denmark has considerable straw biomass resources. The production of thisresource is a by-product of agricultural activity, and thus depends onfinancial matters affecting the management of agricultural areas.The greatest number of biomass fuelled boilers are used in district heatingplants and municipal CHP plants. Over 75% of forest residues are alreadyutilised, and in the light of the government’s aim to increase forest area,Denmark’s total wood fuel resources will increase in the future. Denmarkhas a past record of utilising its biomass resources for heating purposes,more recently, they are increasingly being used to generate power as well.
Germany In Germany, energy crops and straw provide a large share of the biomassresources, with smaller amount of forestry residues, compared to other EUcountries. A large proportion of biomass energy production is covered byresidential use of firewood. The use of wood for heating purposes iscommon in Bavaria, with almost one third of homes using wood as anenergy source. Renewable energy promotion is now shifting towardspromotion of the direct use of biomass for heat production. Goodperformance levels and expertise are required to obtain state investmentsubsidies, thus ensuring the overall quality of installations is high. Recentlythere has been an increase in the development of wood-fuelled CHP plants,particularly in the southern forested regions (e.g. Bavaria).
Finland Finland is a leading EU country in making effective use of its extensivebiomass resources. The most important biomass resources are woodbiomass and peat. Forest residues and the industry by-products (fromFinland’s extensive forests and large forest industry) are also an importantbiomass resource, though the amount available is heavily dependent onproduction in the forest industry. CHP plants, using a range of biomassresources (wood waste, agricultural biomass, peat and black liquor) are usedextensively to provide heat and electricity for domestic and industrialpurposes. Only a small share of the forest residue resources are currentlyused, but this will increase rapidly in the near future, as several CHP plantsfor forest residues are under discussion (in industry and municipalities).District heating systems are common with about half the populationconnected, and these are increasingly using biomass as a fuel. The Finnishgovernment provided a high level of subsidy and support to R&D todevelop an indigenous biomass technology industry, helping to create astrong market, and consequently a thriving export industry, in particular incombustion technology, boilers and emissions control. Currently about 10%of the refined wood fuels are used inside Finland, the rest is exported,mainly to Denmark and Sweden.
France France has a high biomass resource of straw compared to other EU levels,but very little is used in energy production. Residential firewood is thesecond most important biomass resource in France, and is by far the highest
Renewable Energy Sector in the EU its Employment and Export Potential
ECOTEC Research and Consulting Limited
29
energy use of biomass. Most biomass boilers are in district heating plants,with some in the pulp and paper industry or sawmills, (mainly using blackliquors, bark and sawdust). France is the largest producer of biodiesel inEurope and one of few countries to give a relatively high priority to itsdevelopment, mainly to support the agricultural sector and for research.
Greece The domestic sector in Greece uses large quantities of forest wood fuel,charcoal and agricultural residues from tree pruning. A large amount ofwaste residue is produced by the Greek wood and pulp industry, only asmall amount of which is used for heat or steam production. There are manyopportunities to develop wood residue usage for energy purposes in thisindustry. Several attempts have been made at a national level to enhance theenergy exploitation of forest residues, however barriers remain; lack ofmechanisation, land relief problems, the absence of a biomass energy outputmarket and an unfavourable legal framework. In the Community SupportFramework, proposals are formed to promote the energy use of forestry andagricultural residues by developing an infrastructure for harvesting andhandling biomass chains.
Ireland By far the largest biomass resource in Ireland is peat, however, peat is notnow generally considered as a renewable resource. Excluding peat,industrial by-products represent about 42% of biomass energy use, andfirewood covers the other 58%. Together these two areas account for about1% of total primary energy requirement. Most domestic firewood is usedunseasoned in open fires, and there is potential to increase the amount usedand its efficiency by introducing the use of seasoned wood in enclosedstoves. Most of the sawmill residues are used for heat production in the fourwood panel mills in Ireland. Potential is recognised to develop CHP units inthis area. There is also significant potential to introduce refined wood fuels,and to develop energy crops and forestry residues as sources of energy.
Italy The most important biomass resource is domestic firewood. Other resourcesinclude fruit, wine, and olive prunings. There are many very small biomassfuelled plants used countrywide in pulp & paper, sawmills, and otherindustries. As the Italian bioenergy market is relatively new, biomassimport and export are nearly non-existent and hard to quantify. In Italy theproduction of renewable energy from biomass was underdeveloped until theend of the 90’s. This was mainly due to an unsettled bioenergy strategy,unwillingness of the population to accept new power plants (especiallythose using ‘waste’ biomass feedstocks) and an inability to establish supplychain agreements. The situation is currently changing. Innovative know-how is available for industrial development, employment impacts ofbiomass energy are being realised, and the possibility of planting orextending forests to increase the biomass energy sector is being explored.
Spain Spain has large and varied resources of biomass (about 20 Mtoe), but theenergy use of these resources involves less than about 20% of the potential,with most resources used in domestic applications. All of the industrialblack liquors produced by wood industries and domestic firewood resourcesavailable are utilised. Olive wastes, woody agricultural wastes, some

Renewable Energy Sector in the EU its Employment and Export Potential
ECOTEC Research and Consulting Limited
30
charcoal and some almond shells are also used for energy production.Biomass fuels are mainly used in the municipal sector for CHP, and in thepulp and paper industry. By far the largest number of biomass fuelledboilers can be found in areas such as the olive industry. There is a lack ofinfrastructure in the Spanish biomass market, which makes import andexport trading difficult. The Spanish Promotion Plan on RES puts specialimportance on the generation of electricity through biomass resources,owing to its high development potential, and the rapid expansion in thissector. It also includes aid for investment in biomass treating equipment.
Portugal The use of firewood as fuel is very significant in Portugal. There is a highutilisation rate of the solid industrial by-products and black liquors forenergy production. Current users of biomass are mainly domestic and social(schools, swimming pools) and industrial (pulp and paper mills, sawmills,panels, ceramic industry). In these cases, biomass is usually used inconjunction with fossil fuels in co-combustion processes. Portugal imports alarge amount of woodchips (5,5 mill Euro) information on the destination ofPortuguese exports and the origin of imports is not available. Currently theinternal biomass market is relatively new, with a small number of biomassusers. Expansion and growth in the future is likely, particularly in the caseof forest residues, where there are large productions and demands, with asolid supply chain connection yet to develop between the two.
Netherlands The most important biofuel is the biomass fraction fed into wasteincinerators. The Netherlands has a relatively large resource of wood waste,while other sources of biomass are quite small. Almost all the domesticresources are already used in energy production, and an additional 10 PJ offirewood is imported (mostly from Germany) and used annually. FromJanuary 2000, the ban on landfilling combustible waste streams has had astrong impact on the availability of combustible waste for energy. Currently74% of Dutch biomass utilisation is wood wastes. There are a large numberof industrial biomass plants (less municipal ones). Most of the industrialplants are small, providing heat for a sawmill, using its own by-products. Asa consequence of the ban on landfilling combustible wastes, a new industryhas emerged that aims at pre-treatment of mixed industrial waste into RDF(refuse derived fuel) pellets, part of which is utilised in Germany andBelgium in cement ovens and Sweden in district heating. Currently theexport trade is very strong, but as capacity for conversion in the Netherlandscomes online, it is not clear for how long the export market will continue tobe this strong.
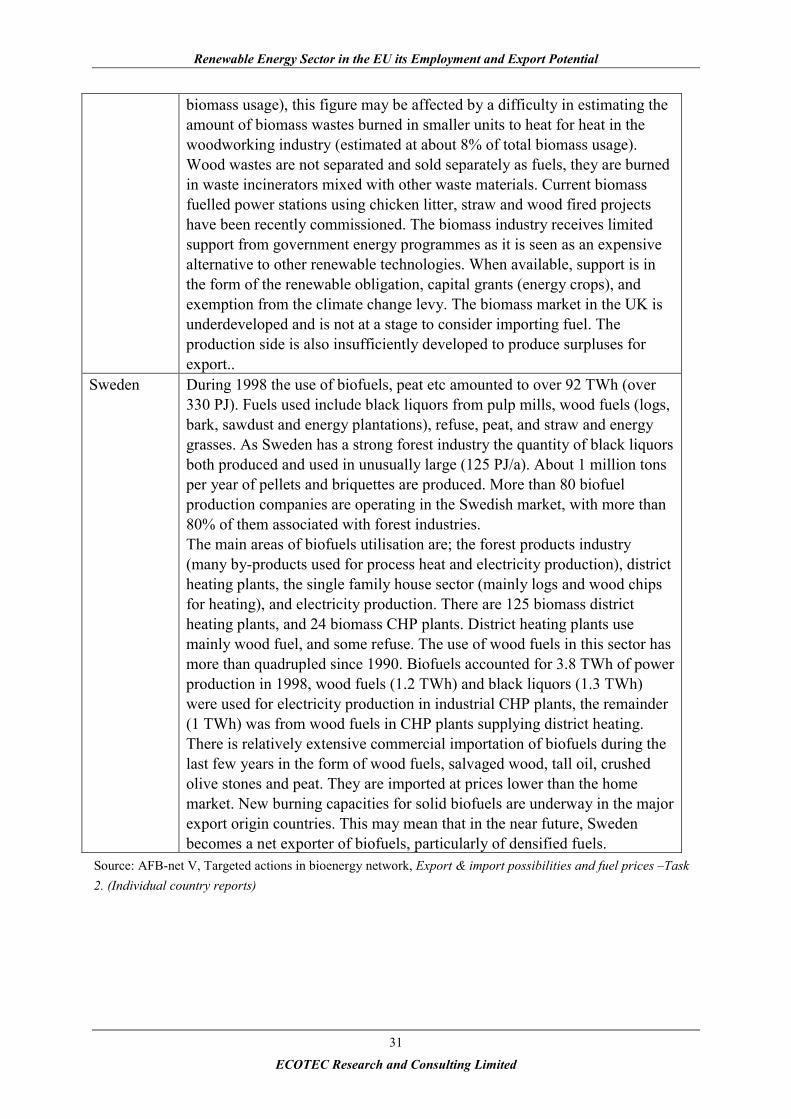
UK The most significant biomass resource is wood based waste with thepackaging and paper waste fractions accounting for the largest portion. Theother important biomass resource available in the UK is straw. The amountof SRC planted is increasing rapidly each year, (currently 1,500 ha).Provision of grant support is available for 25,000 ha of SRC or miscanthusover the next 5 to 6 years, but is dependent on heat and power plantdevelopments to purchase the resource. In practice the only biomass typelargely used in energy production is domestic firewood (90% of total
Renewable Energy Sector in the EU its Employment and Export Potential
ECOTEC Research and Consulting Limited
31
biomass usage), this figure may be affected by a difficulty in estimating theamount of biomass wastes burned in smaller units to heat for heat in thewoodworking industry (estimated at about 8% of total biomass usage).Wood wastes are not separated and sold separately as fuels, they are burnedin waste incinerators mixed with other waste materials. Current biomassfuelled power stations using chicken litter, straw and wood fired projectshave been recently commissioned. The biomass industry receives limitedsupport from government energy programmes as it is seen as an expensivealternative to other renewable technologies. When available, support is inthe form of the renewable obligation, capital grants (energy crops), andexemption from the climate change levy. The biomass market in the UK isunderdeveloped and is not at a stage to consider importing fuel. Theproduction side is also insufficiently developed to produce surpluses forexport..
Sweden During 1998 the use of biofuels, peat etc amounted to over 92 TWh (over330 PJ). Fuels used include black liquors from pulp mills, wood fuels (logs,bark, sawdust and energy plantations), refuse, peat, and straw and energygrasses. As Sweden has a strong forest industry the quantity of black liquorsboth produced and used in unusually large (125 PJ/a). About 1 million tonsper year of pellets and briquettes are produced. More than 80 biofuelproduction companies are operating in the Swedish market, with more than80% of them associated with forest industries.The main areas of biofuels utilisation are; the forest products industry(many by-products used for process heat and electricity production), districtheating plants, the single family house sector (mainly logs and wood chipsfor heating), and electricity production. There are 125 biomass districtheating plants, and 24 biomass CHP plants. District heating plants usemainly wood fuel, and some refuse. The use of wood fuels in this sector hasmore than quadrupled since 1990. Biofuels accounted for 3.8 TWh of powerproduction in 1998, wood fuels (1.2 TWh) and black liquors (1.3 TWh)were used for electricity production in industrial CHP plants, the remainder(1 TWh) was from wood fuels in CHP plants supplying district heating.There is relatively extensive commercial importation of biofuels during thelast few years in the form of wood fuels, salvaged wood, tall oil, crushedolive stones and peat. They are imported at prices lower than the homemarket. New burning capacities for solid biofuels are underway in the majorexport origin countries. This may mean that in the near future, Swedenbecomes a net exporter of biofuels, particularly of densified fuels.
Source: AFB-net V, Targeted actions in bioenergy network, Export & import possibilities and fuel prices –Task2. (Individual country reports)
Renewable Energy Sector in the EU its Employment and Export Potential
ECOTEC Research and Consulting Limited
32
6.0 RENEWABLE ENERGY – TRADE CODE ANALYSIS
This section examines the extent of trade between EU15 and non-EU export markets in aselection of renewable energy products, using a defined set of trade codes.
6.1 Background and approach
Official EU trade statistics, in value and in volume, contain data on the export of a largenumber of distinct products, each with its own “trade code”. We have used these export dataprovided by EUROSTAT, for EU15, for the period 1995-1999, to provide an assessment oftrade balances, imports and exports into and out of the EU, for various products relating torenewable energy. Such time series, or data for consecutive years, allow an analysis ofdevelopments and trends in the past, giving information on expected trends in the future.
A companion report16 produced as part of this study provides a more detailed description ofthe approach taken to analyse trade code statistics, together with an assessment of dataquality, advantages and disadvantages of using this approach. The current report uses thesame approach and therefore the details are not reproduced here.
Data for the analysis were supplied from EUROSTAT, through its COMEX trade codedatabase. Trade outside of the EU is analysed according to groups of countries, as follows:
Candidate countries N AmericaEastern Europe (non candidate) Latin AmericaMid East AfricaS Asia ChinaSE Asia (excluding China and Japan) AustralasiaJapan
(For a full listing of countries within each country grouping, please see the companion report)
Table 6 below lists the codes identified for analysis. It is clear that at present, there are only alimited number of trade codes available relating to renewable energy sources. These focusparticularly on solar sub-sectors, i.e. solar thermal water heaters and photovoltaics products.Trade codes relating to hydropower components are also included. Notable exceptions fromthis list include wind power and biomass. This is due to the apparent lack of a trade code atpresent that separately covers these industries.
16 A Review of EU Eco Industries and Global Environmental Markets
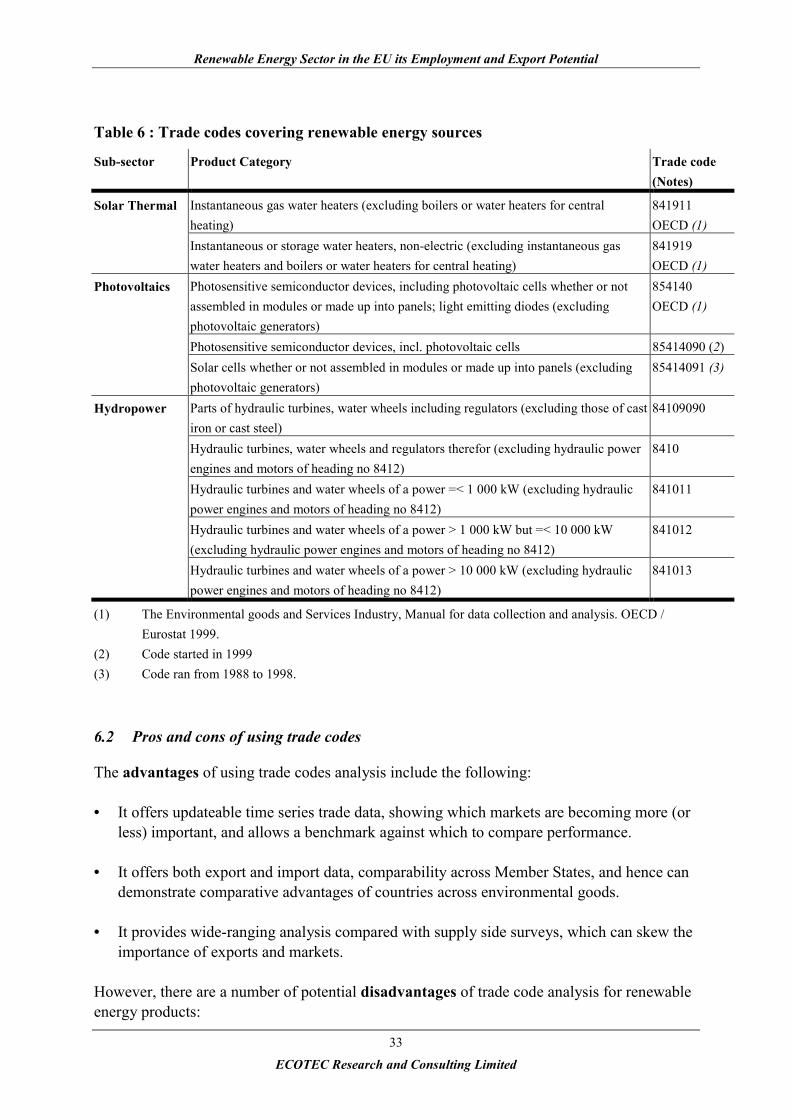
Renewable Energy Sector in the EU its Employment and Export Potential
ECOTEC Research and Consulting Limited
33
Table 6 : Trade codes covering renewable energy sources
Sub-sector Product Category Trade code(Notes)
Solar Thermal Instantaneous gas water heaters (excluding boilers or water heaters for centralheating)
841911OECD (1)
Instantaneous or storage water heaters, non-electric (excluding instantaneous gaswater heaters and boilers or water heaters for central heating)
841919OECD (1)
Photovoltaics Photosensitive semiconductor devices, including photovoltaic cells whether or notassembled in modules or made up into panels; light emitting diodes (excludingphotovoltaic generators)
854140OECD (1)
Photosensitive semiconductor devices, incl. photovoltaic cells 85414090 (2)Solar cells whether or not assembled in modules or made up into panels (excludingphotovoltaic generators)
85414091 (3)
Hydropower Parts of hydraulic turbines, water wheels including regulators (excluding those of castiron or cast steel)
84109090
Hydraulic turbines, water wheels and regulators therefor (excluding hydraulic powerengines and motors of heading no 8412)
8410
Hydraulic turbines and water wheels of a power =< 1 000 kW (excluding hydraulicpower engines and motors of heading no 8412)
841011
Hydraulic turbines and water wheels of a power > 1 000 kW but =< 10 000 kW(excluding hydraulic power engines and motors of heading no 8412)
841012
Hydraulic turbines and water wheels of a power > 10 000 kW (excluding hydraulicpower engines and motors of heading no 8412)
841013
(1) The Environmental goods and Services Industry, Manual for data collection and analysis. OECD /Eurostat 1999.
(2) Code started in 1999(3) Code ran from 1988 to 1998.
6.2 Pros and cons of using trade codes
The advantages of using trade codes analysis include the following:
• It offers updateable time series trade data, showing which markets are becoming more (orless) important, and allows a benchmark against which to compare performance.
• It offers both export and import data, comparability across Member States, and hence candemonstrate comparative advantages of countries across environmental goods.
• It provides wide-ranging analysis compared with supply side surveys, which can skew theimportance of exports and markets.
However, there are a number of potential disadvantages of trade code analysis for renewableenergy products:
Renewable Energy Sector in the EU its Employment and Export Potential
ECOTEC Research and Consulting Limited
34
• It is based on a limited set of product codes, some of which combine renewable energyproducts with products using conventional (fossil) energy sources.
• Some renewable energy product codes are not yet incorporated into the EUROSTATreporting convention - particularly wind turbines and wind components, and any aspectsof biomass technologies, including combustion equipment, fuel handling, etc.
• It is based on product codes only, so cannot consider exports or imports of services, norcan it consider combined technology and service packages.
• For biomass in particular, there is currently no measurement of biomass fuel tradeexports/imports.
• It does not provide any details about the factors which drive the markets, nor detail thedemand/preferences of the markets, which would be needed to develop appropriate marketentry strategies.
Analysing renewable energy trade codes can therefore only give a limited and incompletepicture of the status of renewable energy exports and imports. Nevertheless, the fact thatsome renewable energy products are now represented in standard EUROSTAT statisticalreporting procedures is a significant step towards standardising renewable energy products aspart of the mainstream trade reporting.
6.3 Sub-sector trade code analysis
The following sections provide the results for each of the trade listed in Table 6 of fouranalyses:
• Total EU15 trade balances (1995-1998/9): summaries of the total imports, exports andnet balances of trade for the EU15.
• Sources of imports from outside of the EU15 (1999): total value of imports into theEU15, and origin of these imports.
• Destination of exports to outside of the EU15 (1999): total value of exports from theEU15, and destination of these exports.
• Member State trade balances (1999): trade balances for each of the EU15 memberstates, showing total imports, exports and the resulting balance of trade. Imports andexports are reported for both intra-EU trade and extra-EU trade. In all of the trade balancefigures, the first column relates to imports, the second to exports, and the third column tothe trade balance.
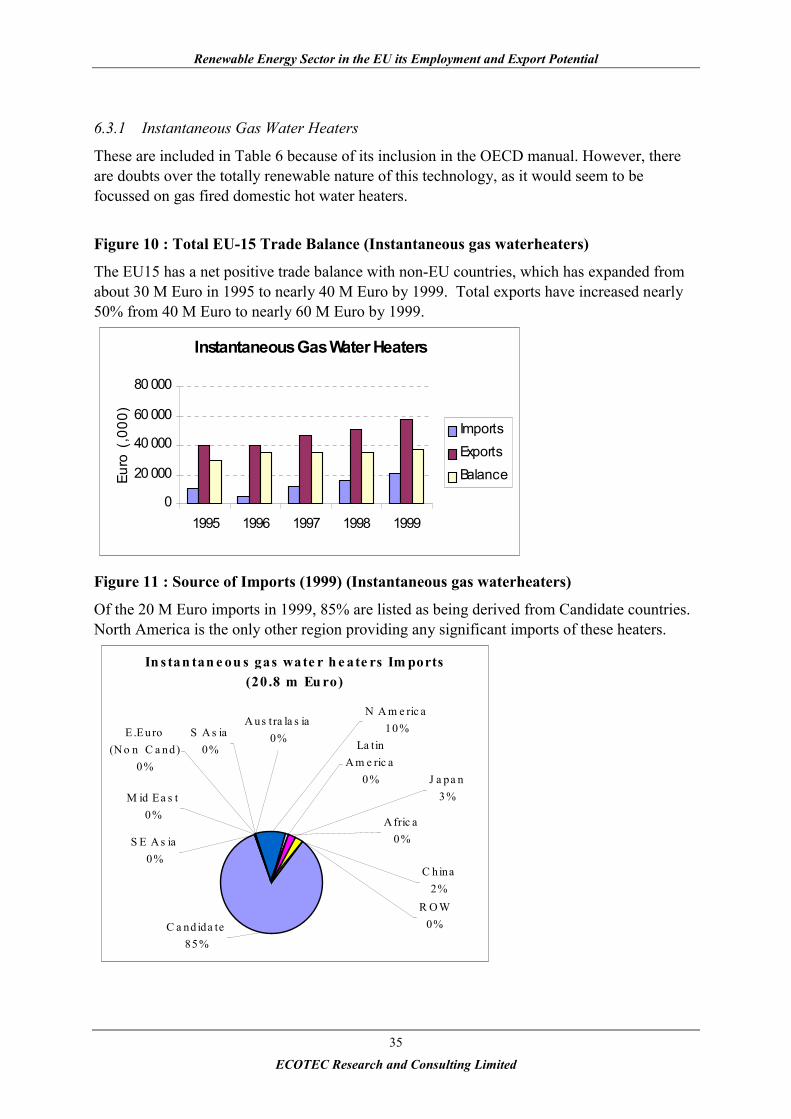
Renewable Energy Sector in the EU its Employment and Export Potential
ECOTEC Research and Consulting Limited
35
6.3.1 Instantaneous Gas Water Heaters
These are included in Table 6 because of its inclusion in the OECD manual. However, thereare doubts over the totally renewable nature of this technology, as it would seem to befocussed on gas fired domestic hot water heaters.
Figure 10 : Total EU-15 Trade Balance (Instantaneous gas waterheaters)
The EU15 has a net positive trade balance with non-EU countries, which has expanded fromabout 30 M Euro in 1995 to nearly 40 M Euro by 1999. Total exports have increased nearly50% from 40 M Euro to nearly 60 M Euro by 1999.
Instantaneous Gas Water Heaters
0
20 000
40 000
60 000
80 000
1995 1996 1997 1998 1999
Euro
(,0
00)
ImportsExportsBalance
Figure 11 : Source of Imports (1999) (Instantaneous gas waterheaters)
Of the 20 M Euro imports in 1999, 85% are listed as being derived from Candidate countries.North America is the only other region providing any significant imports of these heaters.
In s tan tan e ou s gas wate r h e ate rs Im ports (20 .8 m Eu ro)
M id Ea s t0%
S A s ia0%
J a pa n3%
E.Euro (N o n C a nd)
0%
S E A s ia0%
La tin A m e ric a
0%
A us tra la s ia0%
C hina2%
R O W0%
N A m e ric a10%
A fric a0%
C a nd ida te85%

Renewable Energy Sector in the EU its Employment and Export Potential
ECOTEC Research and Consulting Limited
36
Figure 12 : Destination of Exports (1999) (Instantaneous gas waterheaters)
The market for exports of these water heaters is very diverse. The largest proportions are toCandidate countries, North America, Latin America and Africa. A collection of smallerexport markets, combined, make up about 15% of the total export market.
Ins tantaneous gas water heaters Exports (57m Euros )
J a pa n0%
M id E a s t4%
S A s ia0%A us ta la s ia
2% S E A s ia4%
La tin A m e ric a
17%
E .E uro (N o n C a nd )
4%
C hina0%
R O W5%
N A m e ric a19%
A fric a11%
C a ndida te34%
Figure 13 : Member State Balances (1999) (Instantaneous gas waterheaters)
Germany and Italy import the greatest value of these water heaters. France, Germany andPortugal are the principal sources for export, with Portugal reported to be the most activeexporter with exports of 80 M Euro. The majority of exports are intra-EU. Italy, Spain, theUK, Austria and Belgium all have negative trade balances.
EU Member State Trade Balance 1999 - Instantaneous gas water heaters
L
I
D
NL
F
DEN EL
UKA B
FINS
P
E
IRL
-40000
-20000
0
20000
40000
60000
80000
100000 Intra EU
Extra EU
Balance
Note: 1st column relates to imports, 2nd column to exports, 3rd column to trade balance.
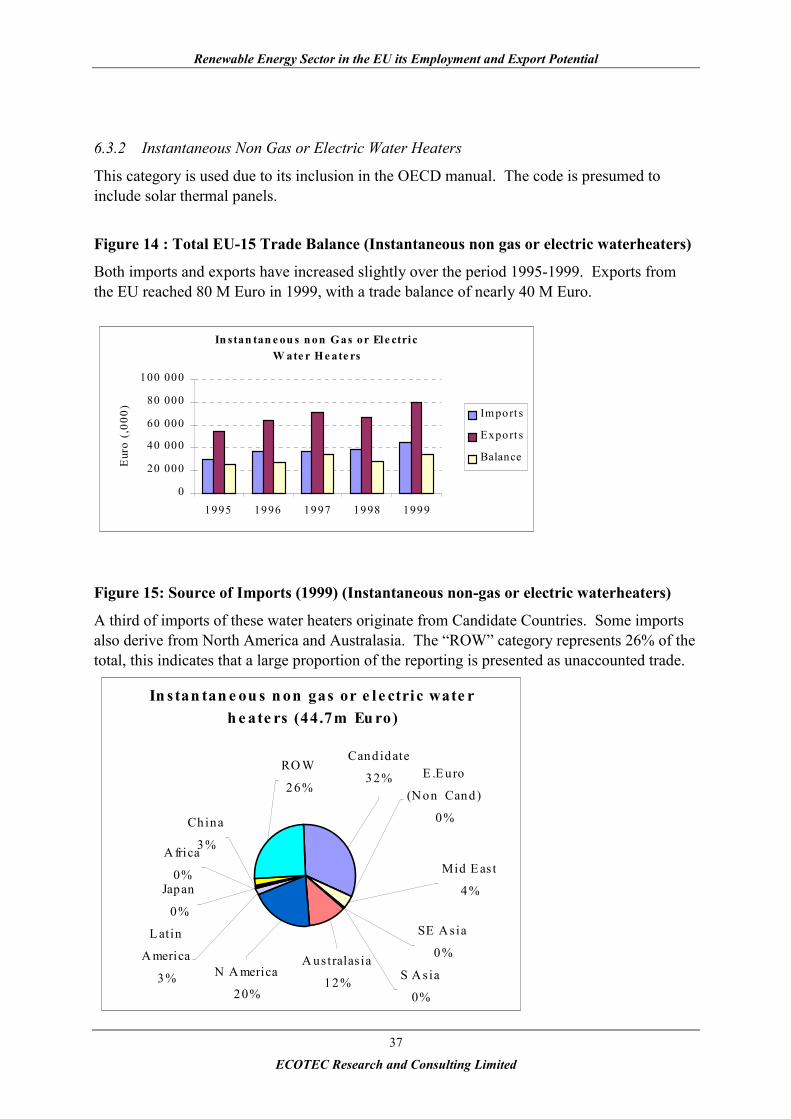
Renewable Energy Sector in the EU its Employment and Export Potential
ECOTEC Research and Consulting Limited
37
6.3.2 Instantaneous Non Gas or Electric Water Heaters
This category is used due to its inclusion in the OECD manual. The code is presumed toinclude solar thermal panels.
Figure 14 : Total EU-15 Trade Balance (Instantaneous non gas or electric waterheaters)
Both imports and exports have increased slightly over the period 1995-1999. Exports fromthe EU reached 80 M Euro in 1999, with a trade balance of nearly 40 M Euro.
In stan tan e ou s n on G as or El e ctric W ate r H e ate rs
0
20 000
40 000
60 000
80 000
100 000
1995 1996 1997 1998 1999
Eur
o (,
000) Im port s
Export s
Balance
Figure 15: Source of Imports (1999) (Instantaneous non-gas or electric waterheaters)
A third of imports of these water heaters originate from Candidate Countries. Some importsalso derive from North America and Australasia. The “ROW” category represents 26% of thetotal, this indicates that a large proportion of the reporting is presented as unaccounted trade.
In s tan tan e ou s n on gas or e l e ctric wate r h e ate rs (44.7m Eu ro)
L atin
A merica
3%
Japan
0%
S A sia
0%
Mid E ast
4%
SE A sia
0%
E .E uro
(N on Cand)
0%
A ustralas ia
12%
Candidate
32%
A frica
0%
N A merica
20%
RO W
26%
China
3%

Renewable Energy Sector in the EU its Employment and Export Potential
ECOTEC Research and Consulting Limited
38
Figure 16 : Destination of Exports (Instantaneous non-gas or electric waterheaters)
The export markets for these water heaters is diverse. Candidate Countries receive a 34%market share, but as with the imports, there is a correspondingly significant ROWclassification (25%), indicating that data reporting may not be complete.
In stan tan e ou s n on gas or e l e ctri c wate r h e ate rs (79m Eu ros)
A us tra la s ia1%
S E A s ia4%
S A s ia0%
La tin A m e ric a
2%
J a pa n1%
M id E a s t3%
E .E uro (N o n C a nd)18%
C a ndida te34%
A fric a4%
N A m e ric a7%
R O W25%
C hina1%
Figure 17 : Member State Balances (1999) (Instantaneous non-gas or electricwaterheaters)
Germany and the UK import a large amount of these water heaters, and have anaccompanying negative trade balance. Most other Member States have neutral or slightlypositive trade balances. France, Germany, UK, Denmark, Spain and Austria all reportexports, most of which are intra-EU (except for Germany, which also exports extra-EU).
EU Member State Trade Balance 1999 - Instantaneous non gas / elec water heaters
L
IRL
EP SFIN
BA
UK
EL
DENF
NL
D
I
-40000
-20000
0
20000
40000
60000
80000
100000
120000
Tho
usa
nd
Eur
os
BalanceExtra EUIntra EU
Note: 1st column relates to imports, 2nd column to exports, 3rd column to trade balance.

Renewable Energy Sector in the EU its Employment and Export Potential
ECOTEC Research and Consulting Limited
39
6.3.3 Photovoltaics
This section is incorporated due to its inclusion in OECD manual. The fact that photovoltaicgenerators are specifically excluded is worthy of consideration.
Figure 18 : Total EU-15 Trade Balance (Photovoltaics)
Although both exports and imports have increased between 1995-1999, the EU’s tradebalance in photosensitive semiconductor devices overall is negative (nearly 500 M Euro).
854140: Photosensitive sem iconductor devices
-1000 000
-500 000
0
500 000
1000 000
1500 000
1995 1996 1997 1998 1999
Euro
(,0
00)
Im p o rtsExp o rtsBa la n c e
Figure 19 : Source of Imports (1999) (Photovoltaics)
Principal sources for import of photosensitive semiconductor devices are SE Asia (25%),Japan (24%), North America (20%). There is also a large (27%) ROW component ofunallocated trade. Total value of imports was 949 M Euro in 1999.
85140: Ph otose n s i ti ve S e m i con du ctor De vi ce s (949m Eu ro)
A us tra la s ia0%
S E A s ia25%
M id E a s t0%
S A s ia0%
E .Euro (N o n C a nd)
0%
La tin A m e ric a
1%
J a pa n24%
C hina3%
R O W27%
N A m e ric a20%
A fric a0%
C a ndida te0%
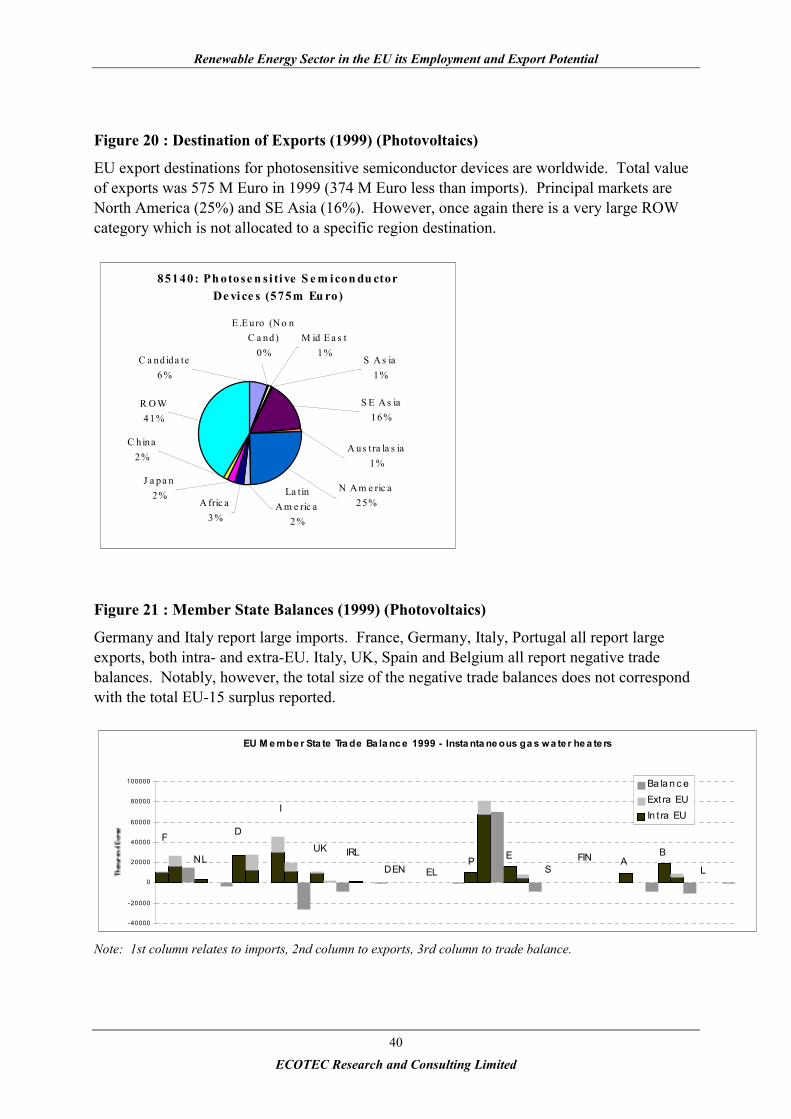
Renewable Energy Sector in the EU its Employment and Export Potential
ECOTEC Research and Consulting Limited
40
Figure 20 : Destination of Exports (1999) (Photovoltaics)
EU export destinations for photosensitive semiconductor devices are worldwide. Total valueof exports was 575 M Euro in 1999 (374 M Euro less than imports). Principal markets areNorth America (25%) and SE Asia (16%). However, once again there is a very large ROWcategory which is not allocated to a specific region destination.
85140: Ph otose n s i ti ve S e m icon du ctor De vice s (575m Eu ro)
J a pa n2%
M id E a s t1%
S A s ia1%
S E A s ia16%
A us tra la s ia1%
E .E uro (N o n C a nd)
0%
La tin A m e ric a
2%
C hina2%
R O W41%
N A m e ric a25%A fric a
3%
C a ndida te6%
Figure 21 : Member State Balances (1999) (Photovoltaics)
Germany and Italy report large imports. France, Germany, Italy, Portugal all report largeexports, both intra- and extra-EU. Italy, UK, Spain and Belgium all report negative tradebalances. Notably, however, the total size of the negative trade balances does not correspondwith the total EU-15 surplus reported.
EU M e mbe r Sta te Tra de Ba la nc e 1999 - Insta nta ne ous ga s wa te r he a te rs
L
I
D
NL
F
DEN EL
UKA
BFINS
P EIRL
-40000
-20000
0
20000
40000
60000
80000
100000 Ba la n c eExt ra EUIn t ra EU
Note: 1st column relates to imports, 2nd column to exports, 3rd column to trade balance.
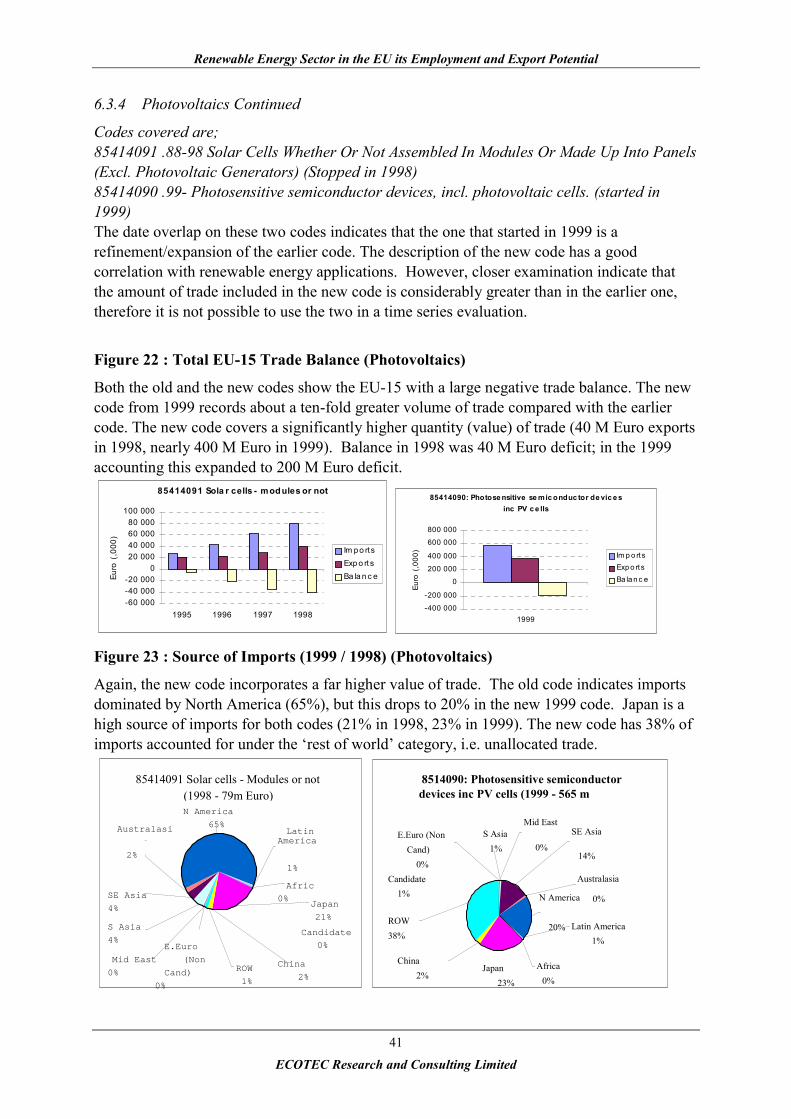
Renewable Energy Sector in the EU its Employment and Export Potential
ECOTEC Research and Consulting Limited
41
6.3.4 Photovoltaics Continued
Codes covered are;85414091 .88-98 Solar Cells Whether Or Not Assembled In Modules Or Made Up Into Panels(Excl. Photovoltaic Generators) (Stopped in 1998)85414090 .99- Photosensitive semiconductor devices, incl. photovoltaic cells. (started in1999)The date overlap on these two codes indicates that the one that started in 1999 is arefinement/expansion of the earlier code. The description of the new code has a goodcorrelation with renewable energy applications. However, closer examination indicate thatthe amount of trade included in the new code is considerably greater than in the earlier one,therefore it is not possible to use the two in a time series evaluation.
Figure 22 : Total EU-15 Trade Balance (Photovoltaics)
Both the old and the new codes show the EU-15 with a large negative trade balance. The newcode from 1999 records about a ten-fold greater volume of trade compared with the earliercode. The new code covers a significantly higher quantity (value) of trade (40 M Euro exportsin 1998, nearly 400 M Euro in 1999). Balance in 1998 was 40 M Euro deficit; in the 1999accounting this expanded to 200 M Euro deficit.
85414091 Sola r cells - modules or not
-60 000-40 000-20 000
020 00040 00060 00080 000
100 000
1995 1996 1997 1998
Euro
(,0
00)
Im po rtsExp o rt sBa la n c e
85414090: Photose nsitive se mic onduc tor de vic e s inc PV c e lls
-400 000
-200 000
0
200 000
400 000
600 000
800 000
1999
Euro
(,0
00)
Im p o rt sExp o rt sBa la n c e
Figure 23 : Source of Imports (1999 / 1998) (Photovoltaics)
Again, the new code incorporates a far higher value of trade. The old code indicates importsdominated by North America (65%), but this drops to 20% in the new 1999 code. Japan is ahigh source of imports for both codes (21% in 1998, 23% in 1999). The new code has 38% ofimports accounted for under the ‘rest of world’ category, i.e. unallocated trade.
85414091 Solar cells - Modules or not(1998 - 79m Euro)
Japan
21%
China
2%ROW
1%
N America
65%
Afric
0%
Candidate
0%
LatinAmerica
1%
Australasi
a
2%
SE Asia
4%
E.Euro
(Non
Cand)
0%
Mid East
0%
S Asia
4%
8514090: Photosensitive semiconductordevices inc PV cells (1999 - 565 m
Japan23%
S Asia1%
Mid East
0%E.Euro (Non
Cand)0%
SE Asia
14%
Australasia
0%
Latin America1%
Candidate1%
Africa0%
N America
20%ROW38%
China2%
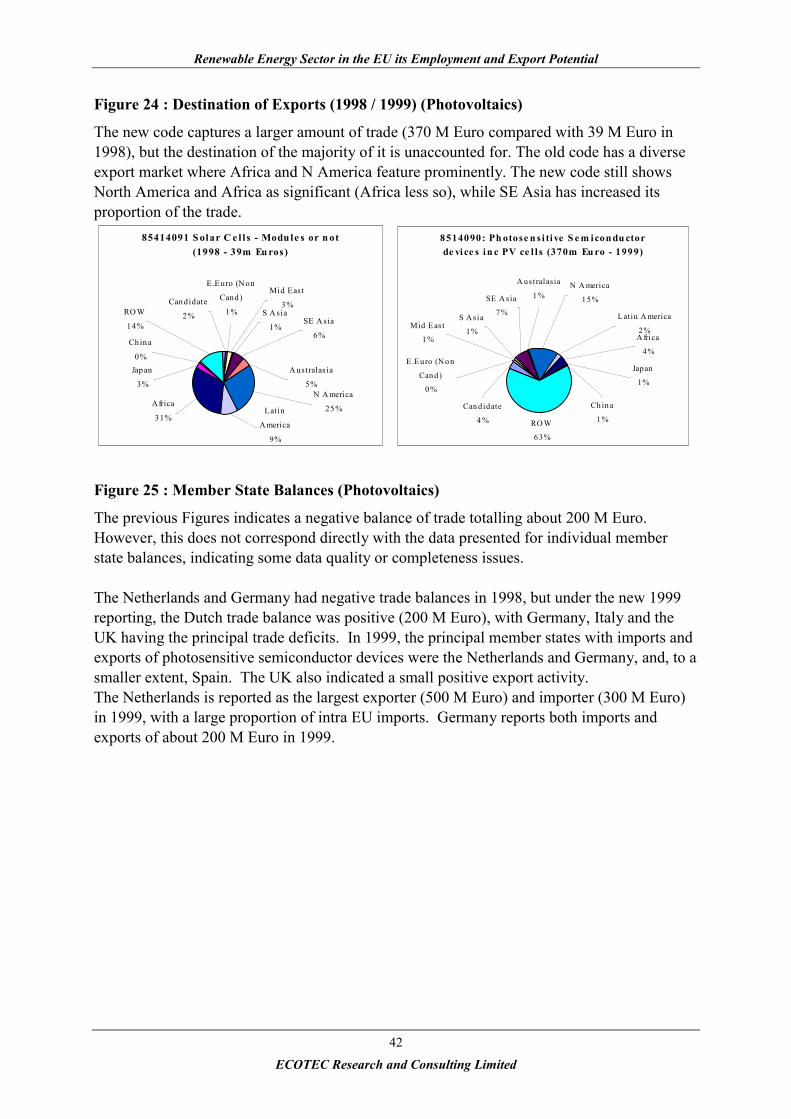
Renewable Energy Sector in the EU its Employment and Export Potential
ECOTEC Research and Consulting Limited
42
Figure 24 : Destination of Exports (1998 / 1999) (Photovoltaics)
The new code captures a larger amount of trade (370 M Euro compared with 39 M Euro in1998), but the destination of the majority of it is unaccounted for. The old code has a diverseexport market where Africa and N America feature prominently. The new code still showsNorth America and Africa as significant (Africa less so), while SE Asia has increased itsproportion of the trade.
85414091 S olar C e l l s - Module s or n ot (1998 - 39m Eu ros)
Latin
America
9%
S A sia
1%
E.Euro (N on
Cand)
1%
Mid East
3%
SE A sia
6%
A ustralas ia
5%
Japan
3%
China
0%
RO W
14%
N A merica
25%Africa
31%
Candidate
2%
8514090: Ph otose n s i ti ve S e m icon du ctor de vi ce s in c PV ce l l s (370m Eu ro - 1999)
S Asia
1%
SE A sia
7%
A ustralas ia
1 %
Mid E ast
1%
Latin A merica
2%
Japan
1%
E.Euro (No n
Can d)
0 %
Can didate
4 %
A frica
4%
N A merica
15%
RO W
63%
Ch in a
1 %
Figure 25 : Member State Balances (Photovoltaics)
The previous Figures indicates a negative balance of trade totalling about 200 M Euro.However, this does not correspond directly with the data presented for individual memberstate balances, indicating some data quality or completeness issues.
The Netherlands and Germany had negative trade balances in 1998, but under the new 1999reporting, the Dutch trade balance was positive (200 M Euro), with Germany, Italy and theUK having the principal trade deficits. In 1999, the principal member states with imports andexports of photosensitive semiconductor devices were the Netherlands and Germany, and, to asmaller extent, Spain. The UK also indicated a small positive export activity.The Netherlands is reported as the largest exporter (500 M Euro) and importer (300 M Euro)in 1999, with a large proportion of intra EU imports. Germany reports both imports andexports of about 200 M Euro in 1999.
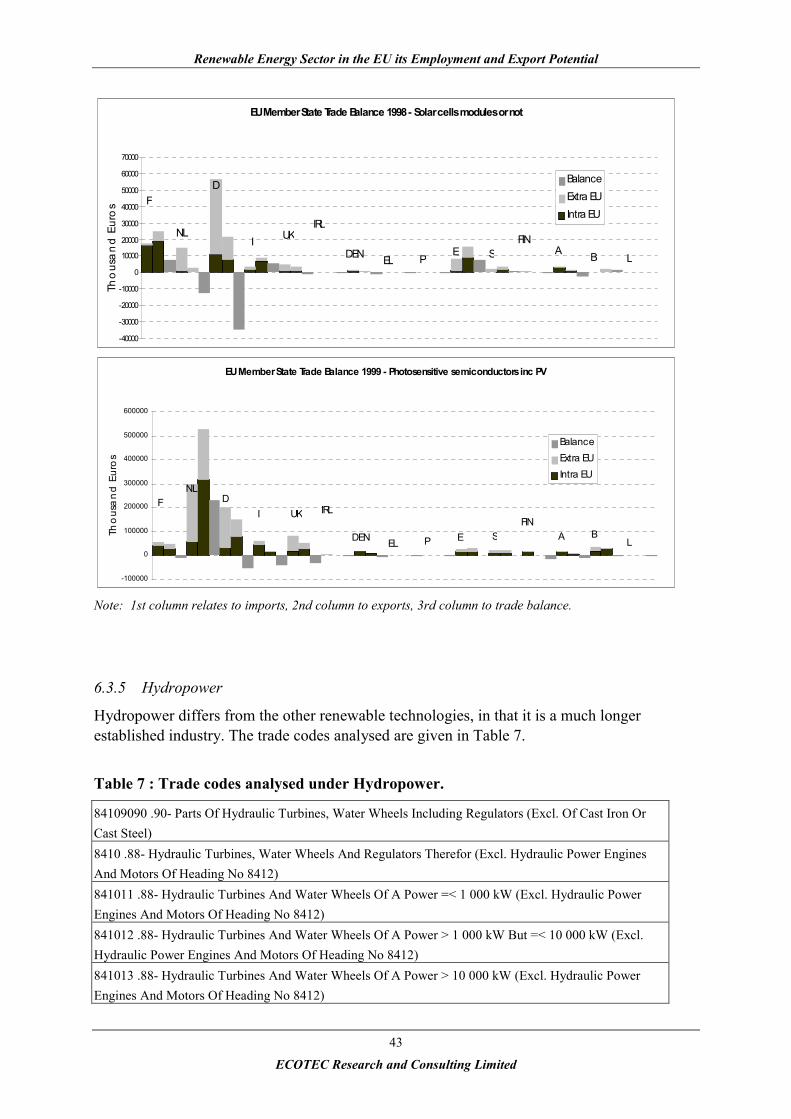
Renewable Energy Sector in the EU its Employment and Export Potential
ECOTEC Research and Consulting Limited
43
EU Member State Trade Balance 1998 - Solar cells modules or not
L
IRL
EP S
FINBA
UK
ELDEN
F
NL
D
I
-40000
-30000
-20000
-10000
0
10000
20000
30000
40000
50000
60000
70000
Tho
usa
nd
Eur
os
BalanceExtra EUIntra EU
EU Member State Trade Balance 1999 - Photosensitive semiconductors inc PV
L
IRL
EP SFIN
BA
UK
ELDEN
FNL
DI
-100000
0
100000
200000
300000
400000
500000
600000
Tho
usa
nd
Eur
os
BalanceExtra EUIntra EU
Note: 1st column relates to imports, 2nd column to exports, 3rd column to trade balance.
6.3.5 Hydropower
Hydropower differs from the other renewable technologies, in that it is a much longerestablished industry. The trade codes analysed are given in Table 7.
Table 7 : Trade codes analysed under Hydropower.
84109090 .90- Parts Of Hydraulic Turbines, Water Wheels Including Regulators (Excl. Of Cast Iron OrCast Steel)8410 .88- Hydraulic Turbines, Water Wheels And Regulators Therefor (Excl. Hydraulic Power EnginesAnd Motors Of Heading No 8412)841011 .88- Hydraulic Turbines And Water Wheels Of A Power =< 1 000 kW (Excl. Hydraulic PowerEngines And Motors Of Heading No 8412)841012 .88- Hydraulic Turbines And Water Wheels Of A Power > 1 000 kW But =< 10 000 kW (Excl.Hydraulic Power Engines And Motors Of Heading No 8412)841013 .88- Hydraulic Turbines And Water Wheels Of A Power > 10 000 kW (Excl. Hydraulic PowerEngines And Motors Of Heading No 8412)
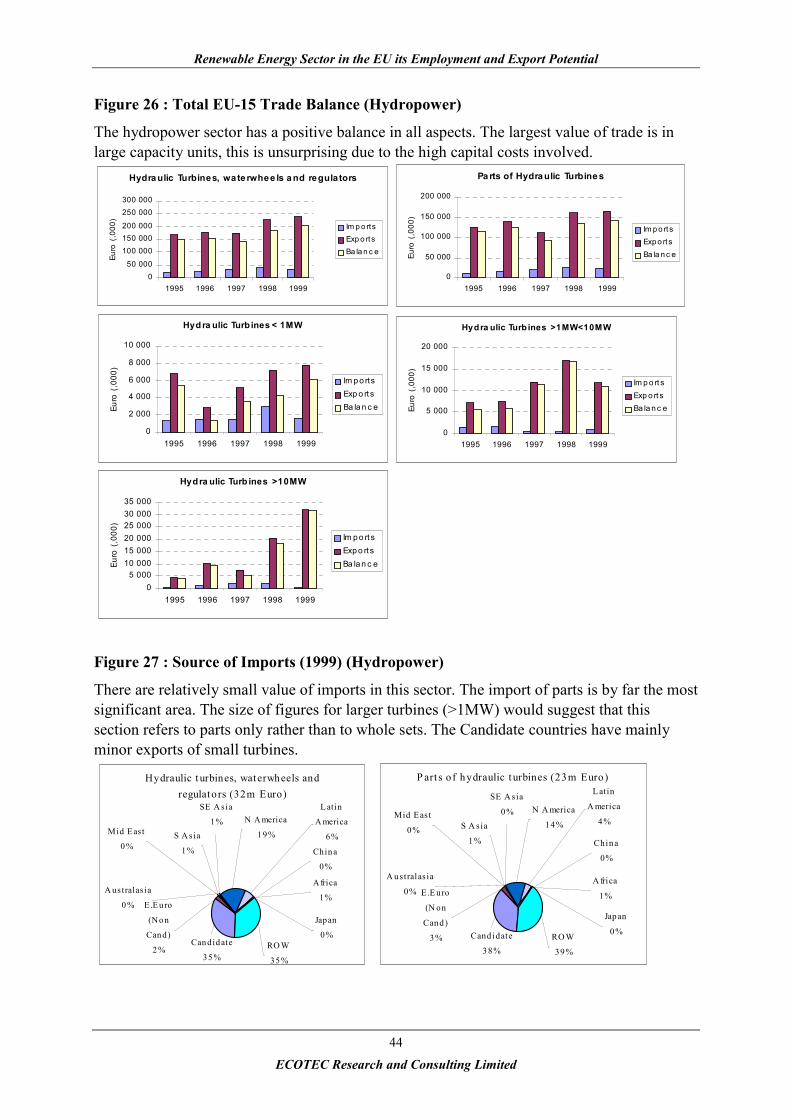
Renewable Energy Sector in the EU its Employment and Export Potential
ECOTEC Research and Consulting Limited
44
Figure 26 : Total EU-15 Trade Balance (Hydropower)
The hydropower sector has a positive balance in all aspects. The largest value of trade is inlarge capacity units, this is unsurprising due to the high capital costs involved.
Hydra ulic Turbines, waterwhee ls a nd regula tors
050 000
100 000150 000200 000
250 000300 000
1995 1996 1997 1998 1999
Euro
(,0
00)
Im p o rtsExp o rt sBa la n c e
Parts of Hydraulic Turbines
0
50 000
100 000
150 000
200 000
1995 1996 1997 1998 1999
Euro
(,0
00)
Im p o rt sExp o rt sBa la n c e
Hyd ra ulic Turb ines < 1MW
0
2 000
4 000
6 000
8 000
10 000
1995 1996 1997 1998 1999
Euro
(,0
00)
Im p o rtsExp o rt sBa la n c e
Hydra ulic Turb ines >1MW<10MW
0
5 000
10 000
15 000
20 000
1995 1996 1997 1998 1999
Euro
(,0
00)
Im p o rt sExp o rt sBa la n c e
Hydra ulic Turb ines >10MW
05 000
10 00015 00020 00025 00030 00035 000
1995 1996 1997 1998 1999
Euro
(,0
00)
Im p o rt sExp o rt sBa la n c e
Figure 27 : Source of Imports (1999) (Hydropower)
There are relatively small value of imports in this sector. The import of parts is by far the mostsignificant area. The size of figures for larger turbines (>1MW) would suggest that thissection refers to parts only rather than to whole sets. The Candidate countries have mainlyminor exports of small turbines.
Hydraulic t urbines, waterwheels and regulato rs (32m Euro)
A ustralas ia
0 %
Can did ate
35 %
Africa
1%
N A merica
1 9%
RO W
35 %
Chin a
0%
Japan
0 %
L atin
A merica
6%
E.Euro
(No n
Can d)
2 %
S A sia
1 %
Mid East
0 %
SE A sia
1%
P art s o f hydraulic t urbines (23m Euro)
A ustralas ia
0%
Cand idate
38%
A frica
1%
N A merica
14%
RO W
39%
China
0%
Japan
0%
L atin
A merica
4%
E.E uro
(N on
Cand)
3%
S A sia
1%
Mid East
0%
SE A sia
0%
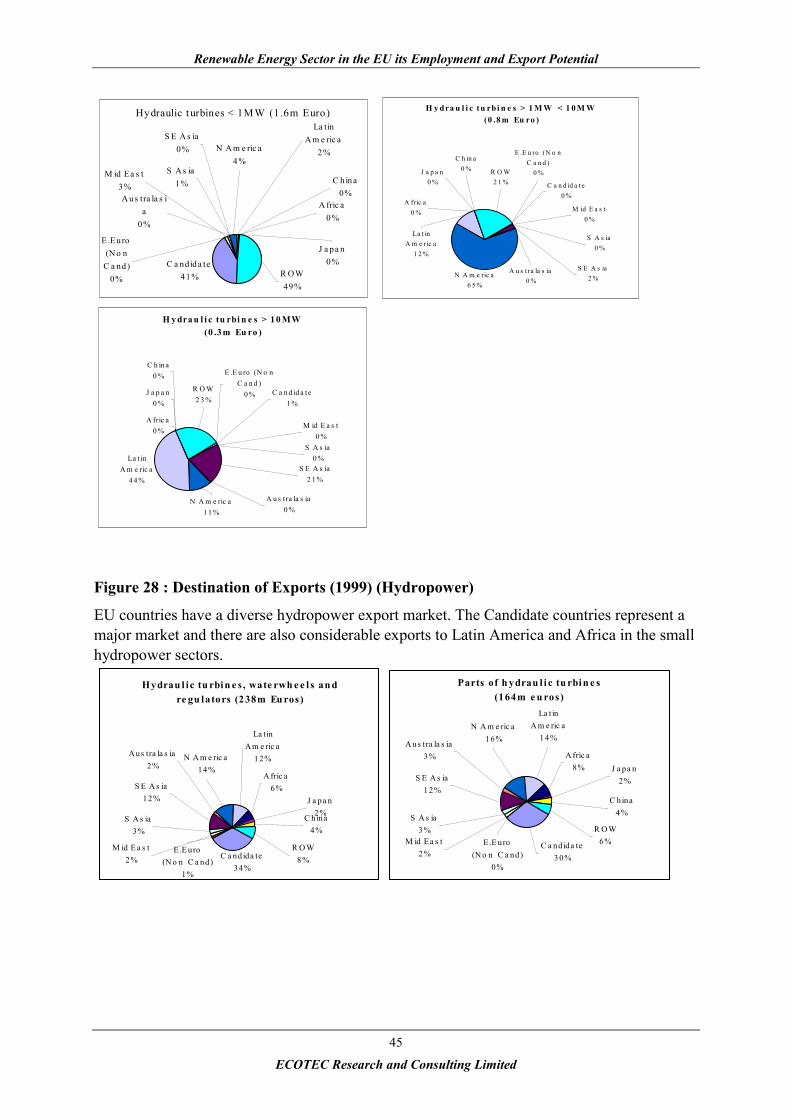
Renewable Energy Sector in the EU its Employment and Export Potential
ECOTEC Research and Consulting Limited
45
Hydraulic t urbines < 1M W (1 .6m Euro)
S E A s ia0%
M id Ea s t3%
S A s ia1%
E.Euro (N o n
C a nd)0%
La tin A m e ric a
2%
J a pa n0%
C hina0%
R OW49%
N A m e ric a4%
A fric a0%
C a nd ida te41%
A us tra la s ia
0%
H y dra u l i c tu rbi n e s > 1 M W < 1 0 M W (0 .8 m Eu ro )
N A m e ric a6 5 %
J a p a n0 %
C h in a0 %
A fric a0 %
La t in A m e ric a
1 2 %
M id E a s t0 %
R O W2 1 % C a n d id a t e
0 %
S A s ia0 %
S E A s ia2 %
E .E u ro (N o n C a n d )
0 %
A u s t ra la s ia0 %
H y dra u l i c tu rbi n e s > 1 0 MW (0 .3 m Eu ro )
La t in A m e ric a
4 4 %
A fric a0 %
J a p a n0 %
C h in a0 %
N A m e ric a1 1 %
A u s t ra la s ia0 %
E .E u ro (N o n C a n d )
0 %
S E A s ia2 1 %
S A s ia0 %
C a n d id a te1 %
R O W2 3 %
M id E a s t0 %
Figure 28 : Destination of Exports (1999) (Hydropower)
EU countries have a diverse hydropower export market. The Candidate countries represent amajor market and there are also considerable exports to Latin America and Africa in the smallhydropower sectors.
Hydrau l ic tu rbi n e s , wate rwh e e l s an d re gu lators (238m Eu ros)
E.E uro (N o n C a nd)
1%
M id E a s t2%
S A s ia3%
N A m e ric a14%
S E A s ia12%
Aus tra la s ia2%
A fric a6%
La tin Am e ric a
12%
J a pa n2%C hina
4%
R O W8%C a ndida te
34%
Parts of h ydrau l i c tu rbi n e s (164m e u ros)
C a ndida te3 0%
R O W6%
C hina4 %
J a pa n2%
La t in A m e ric a
1 4%
A fric a8%
A us tra la s ia3 %
S E A s ia1 2%
N A m e ric a1 6%
S A s ia3 %
M id Ea s t2 %
E.E uro (N o n C a nd)
0%
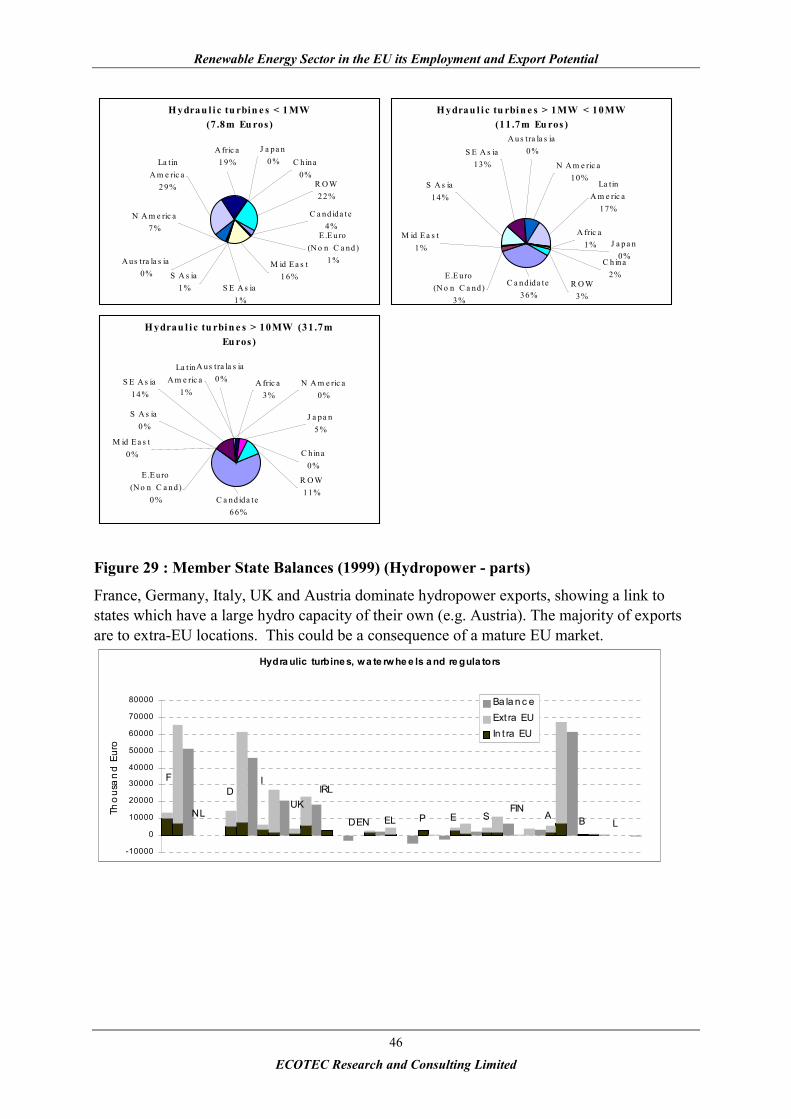
Renewable Energy Sector in the EU its Employment and Export Potential
ECOTEC Research and Consulting Limited
46
H ydrau l i c tu rbin e s < 1MW (7 .8m Eu ros)
E .E u ro (N o n C a nd )
1 %M id E a s t1 6%S A s ia
1 %
N A m e ric a7%
S E A s ia1 %
A us tra la s ia0%
A fric a1 9%La tin
A m e ric a2 9%
J a pa n0 % C h ina
0%R O W2 2%
C a nd ida te4%
H ydrau l i c tu rbi n e s > 1MW < 10MW (11.7m Eu ros )
C a n dida te36%
R O W3%
C h in a2%
J a p a n0%
La tin A m e ric a
17%
A fric a1%
A u s tra la s ia0 %S E A s ia
13% N A m e ric a10%
S A s ia14%
M id E a s t1%
E.E uro (N o n C a nd)
3 %
Hydrau l i c tu rbi n e s > 10MW (31.7m Eu ros )
C a nd ida te6 6%
R O W11 %
C h ina0%
J a pa n5 %
La tin A m e ric a
1%A fric a
3%
A us tra la s ia0 %S E A s ia
14 %N A m e ric a
0%
S A s ia0 %
M id E a s t0 %
E.E u ro (N o n C a n d)
0 %
Figure 29 : Member State Balances (1999) (Hydropower - parts)
France, Germany, Italy, UK and Austria dominate hydropower exports, showing a link tostates which have a large hydro capacity of their own (e.g. Austria). The majority of exportsare to extra-EU locations. This could be a consequence of a mature EU market.
Hydra ulic turbine s, wa te rwhe e ls a nd re gula tors
L
IRL
EP SFIN
BAUK
ELDEN
F
NL
DI
-10000
0
10000
20000
30000
40000
50000
60000
70000
80000
Tho
usa
nd
Eur
o
Ba la n c eExt ra EUIn t ra EU
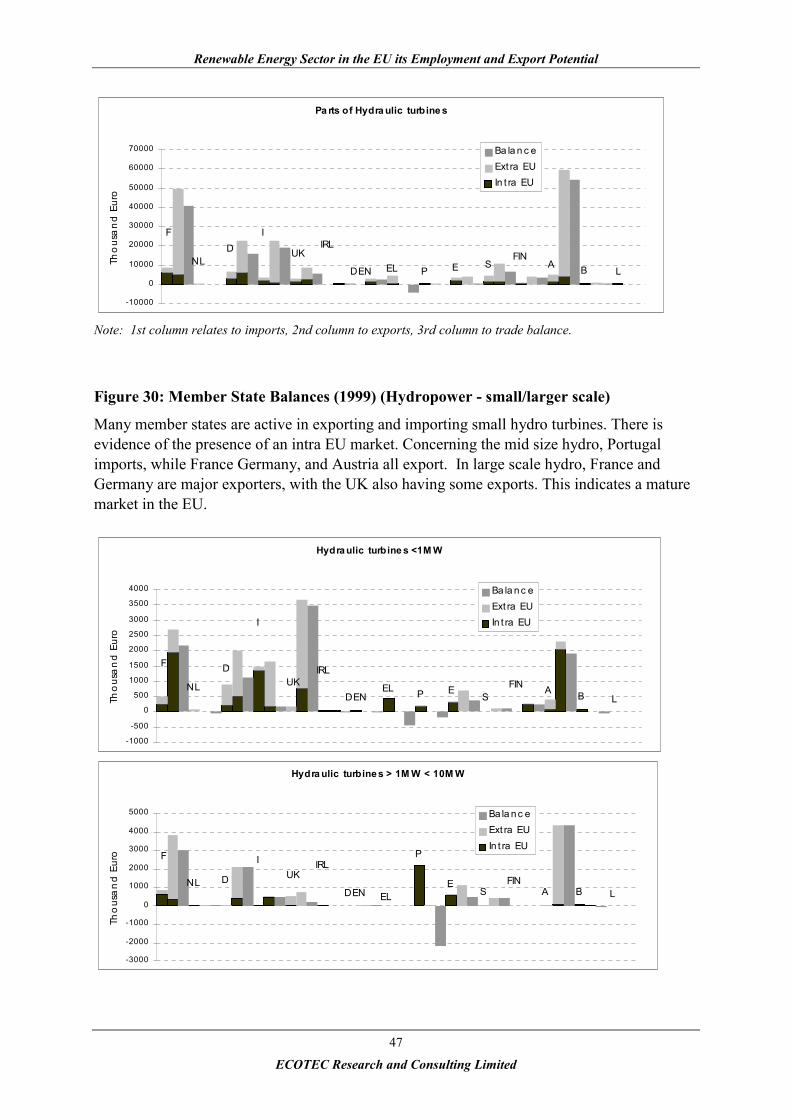
Renewable Energy Sector in the EU its Employment and Export Potential
ECOTEC Research and Consulting Limited
47
Pa rts of Hydra ulic turbine s
L
IRL
EPS
FINBA
UKELDEN
F
NLD
I
-10000
0
10000
20000
30000
40000
50000
60000
70000
Tho
usa
nd
Eur
o
Ba la n c eExt ra EUIn t ra EU
Note: 1st column relates to imports, 2nd column to exports, 3rd column to trade balance.
Figure 30: Member State Balances (1999) (Hydropower - small/larger scale)
Many member states are active in exporting and importing small hydro turbines. There isevidence of the presence of an intra EU market. Concerning the mid size hydro, Portugalimports, while France Germany, and Austria all export. In large scale hydro, France andGermany are major exporters, with the UK also having some exports. This indicates a maturemarket in the EU.
Hydra ulic turbine s <1M W
L
I
D
NL
F
DENELUK
A BFIN
SP E
IRL
-1000
-500
0
500
1000
1500
2000
2500
3000
3500
4000
Tho
usa
nd
Eur
o
Ba la n c eExt ra EUIn t ra EU
Hydra ulic turbine s > 1M W < 10M W
L
IRL
E
P
SFIN
BA
UK
ELDEN
F
NL D
I
-3000
-2000
-1000
0
1000
2000
3000
4000
5000
Tho
usa
nd
Eur
o
Ba la n c eExt ra EUIn t ra EU

Renewable Energy Sector in the EU its Employment and Export Potential
ECOTEC Research and Consulting Limited
48
Hydra ulic turbine s >10M W
L
IRL
EP SFIN
BAUK
ELDEN
FNL D
I
-5000
0
5000
10000
15000
20000
25000
Tho
usa
nd
Eur
o
Ba la n c eExt ra EUIn t ra EU
Note: 1st column relates to imports, 2nd column to exports, 3rd column to trade balance.
6.4 Conclusions
This is the first time that trade codes for renewable energy products have been included in anEco-industries assessment. The use of trade code analysis gives an indication of the size oftrade in renewable energy products, both intra- and extra- EU15 member states.
The analysis has identified the following:
• The EU15 has a positive trade balance in waterheaters, with exports of 60 M Euroexceeding imports of about 20 M Euro. Although not all of the products included in thistrade code will be solar water heaters, nevertheless it indicates that the EU has a healthydomestic water heating industry, and this has the potential to diversify into renewableproducts.
• The EU15 has a negative trade balance in photovoltaic products, including semiconductordevices and related products of relevance to the renewable photovoltaic industry. In 1999,this trade deficit was approximately 200 M Euro.
• The EU15 has a strong but generally steady positive trade balance in hydropoweractivities, including large and small scale turbines and parts. Exports are achievedworldwide, particularly to candidate countries and Latin America.
Limitations of the analysis include the following:
• There is at present no trade codes for two major renewable energy areas, namely wind andbiomass. Other emerging technologies with good export potential are wave, tidal, fuelcells, none of which can be identified through trade codes as yet either.
• Under the present trade codes, these renewable energy products are mixed with non-renewable products as well. This is particularly significant for water heaters and forphotovoltaic semiconductor devices.

Renewable Energy Sector in the EU its Employment and Export Potential
ECOTEC Research and Consulting Limited
49
• Data reporting is not always consistent, particularly with relating total EU trade withindividual member states trade flows. Thus in some instances the reported trade deficit forthe EU15 is greater than the sum of individual member states trade balances (e.g. forphotovoltaics).
• Country destinations are not always stated, which results in a large proportion of thedestinations reported as ROW “rest of the world”.
Despite these limitations, the use of trade codes could be a useful tool in monitoring theexpansion of trade in renewable energy in the future. A fuller set of trade codes would needto be established (particularly for wind etc.), with detailed descriptions of the content of each,to ensure that only renewable energy products were included in the code. Member stateswould also need to be encouraged to provide complete reporting of trade quantities andcountry destinations.
The renewable energy industry is one of the fastest growing sectors in the EU. The resultspresented here demonstrate that it is a strong and expanding industry that has now reached asufficient state of maturity for it to warrant comprehensive monitoring and reporting of itstrade flows. Use of trade code analysis, combined with qualitative trade surveys andevaluations, can help to identify and target the most appropriate measures and activities toensure that the industry continues to expand into a world-class sector.
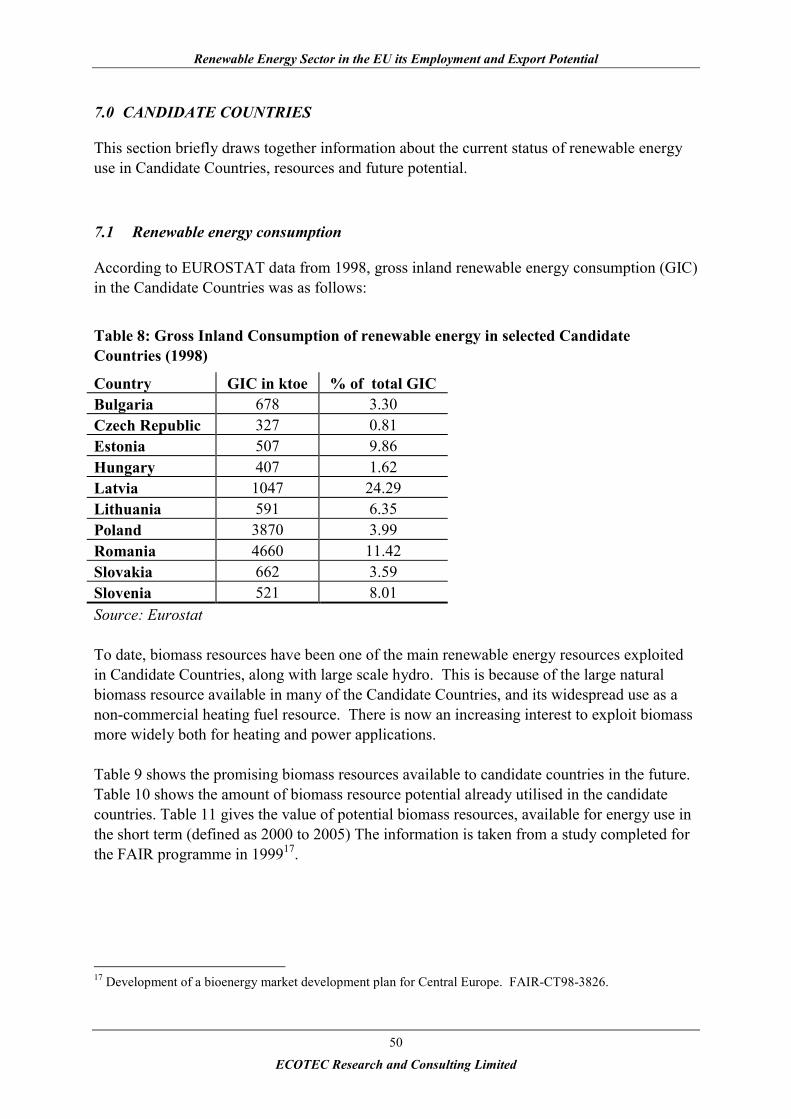
Renewable Energy Sector in the EU its Employment and Export Potential
ECOTEC Research and Consulting Limited
50
7.0 CANDIDATE COUNTRIES
This section briefly draws together information about the current status of renewable energyuse in Candidate Countries, resources and future potential.
7.1 Renewable energy consumption
According to EUROSTAT data from 1998, gross inland renewable energy consumption (GIC)in the Candidate Countries was as follows:
Table 8: Gross Inland Consumption of renewable energy in selected CandidateCountries (1998)
Country GIC in ktoe % of total GICBulgaria 678 3.30Czech Republic 327 0.81Estonia 507 9.86Hungary 407 1.62Latvia 1047 24.29Lithuania 591 6.35Poland 3870 3.99Romania 4660 11.42Slovakia 662 3.59Slovenia 521 8.01Source: Eurostat
To date, biomass resources have been one of the main renewable energy resources exploitedin Candidate Countries, along with large scale hydro. This is because of the large naturalbiomass resource available in many of the Candidate Countries, and its widespread use as anon-commercial heating fuel resource. There is now an increasing interest to exploit biomassmore widely both for heating and power applications.
Table 9 shows the promising biomass resources available to candidate countries in the future.Table 10 shows the amount of biomass resource potential already utilised in the candidatecountries. Table 11 gives the value of potential biomass resources, available for energy use inthe short term (defined as 2000 to 2005) The information is taken from a study completed forthe FAIR programme in 199917.
17 Development of a bioenergy market development plan for Central Europe. FAIR-CT98-3826.
Renewable Energy Sector in the EU its Employment and Export Potential
ECOTEC Research and Consulting Limited
51
Table 9 : Promising biomass resources in the candidate countries

Renewable Energy Sector in the EU its Employment and Export Potential
ECOTEC Research and Consulting Limited
53
Table 10 : Biomass potential already utilised in the candidate countries (PJ).
Table 11 Biomass potential (currently not utilised), available for energy use, short term (2000-2005) (PJ)
Renewable Energy Sector in the EU its Employment and Export Potential
ECOTEC Research and Consulting Limited
54
Key trends
• Forest residues and wood waste from wood processing units are the main sources ofbiomass already used in many of the Candidate Countries, particularly in Hungary, Latviaand Poland. Both of these resources are almost entirely used in heat production,particularly as firewood.
• Straw and other field crops are also used to a lesser extent, in Hungary, the CzechRepublic, Latvia and Poland.
• The greatest potential use of biomass resources in the short term (to 2005) lies in a greateruse of wood wastes from processing units, from forest and other biomass resources, andfrom agricultural residues. These are seen mainly as heat production resources, althoughthere is some potential for power applications in the Czech Republic from straw resources.
• The study indicates that biomass use from forestry resources has the potential to morethan double in many countries by 2005, particularly countries with high levels of existinguse such as Poland and Hungary. Straw use is predicted to expand considerably in manycountries, compared with its current very low levels of use. The Czech Republic, Polandand Hungary indicate that this resource may be exploited rapidly in the short term.
• Major CHP opportunities in the short term lie in the use of sewage sludge (biogas) andlandfill gas, with some possibilities for power production alone.
• Energy crops (either as solid or liquid fuels) are not predicted to be exploited to any greatextent in the short term. The only exception is the possibility of biodiesel development inthe Czech Republic, and a small amount of short rotation forestry (SRF) in Hungary.
• In the longer term (to 2020 and beyond), energy crops as solid fuels (SRF) are predictedto provide an increasing resource for both heat and power production in a selection ofcountries, including in Poland, Romania and Slovakia. The study indicated that liquidfuels (bioethanol and biodiesel) may also be developed in some countries, although to alesser extent.
• Wood wastes from wood processing units, fire wood, and felling residues from forestryhave promising potential to shift from short term emphasis on heat production to a longerterm emphasis on CHP in many countries.
• Farm animal wastes (biogas) in the mid to long term can become more widely utilised inboth heating and CHP sectors. This also applies to biogas derived from agro-industrialliquid wastes.

Renewable Energy Sector in the EU its Employment and Export Potential
ECOTEC Research and Consulting Limited
55
7.2 Candidate Country Summaries
7.2.1 Czech Republic
In 1994, the share of renewable energy sources (comprising solar, wind, water, and biomass)represented 1-2% of the total power generated.i Installed capacity in renewable sources is stillvery small and the 1998 figures did not exceeded 20 MWii. A renewable sources energymarket share of 6% is expected by 2010.iii CEZ (the main Czech generator) has beenoperating a wind generator (0.315 MW) since 1993 and operation of another (1.165 MW) wasexpected to commence soon. Independent producers operate wind generators with installedcapacity of approximately 14 MWiv. Operation of a 0.010 MW photovoltaic source by CEZbegan in 1997. Installed capacity in hydro plants is covered mainly by three large pumpedstorage hydro plants (of total capacity of 1,145 MW), and a number of smaller hydro plantswith total capacity of 727 MW, operated by CEZ. Independent producers operate hydro plantswith total installed capacity of about 60 MW.v
7.2.2 Estonia
Around 8 percent of the energy production is based on using biomass. This figure is expectedto grow to 11% by 2005 due to Estonia's abundant peat and forestry reserves, and the lesserimpact of biomass use on the environment in comparison with the use of either oil shale or oilfuel.
7.2.3 Hungary
Hungary has large biomass resources that are not used commercially. Wind energy inHungary is well studied, but as yet there is little commercial experience with this technology.Small scale hydro is restricted to a small number of projects in the north and east. Geothermalenergy has little current application but some existing opportunities. Waste to energy haslimited opportunities for future development in the district heating systems.The 1999 energy plan points to increased use of renewable resources,vi and the government islooking into alternative, renewable sources of energy (solar, wind, water) for the future.A significant part of the Hungarian electricity sector was privatised in 1995 and 1996German, French, Italian, Belgian and Finnish strategic investors acquired majority stakes inkey power utilities.vii The World Bank has had a number of environmental projects inHungary recently including a project on the use of renewable energy. Projects in this schemeinclude one applicable to straw (Szekesfehervar) and another applicable to wood(Szombathely) to increase the use of available biomass resources.
7.2.4 Latvia
To become more independent from imported electricity to meet local needs, the Latviangovernment supports private initiatives for construction and commercial activity of small-scale hydropower, wind generators and co-generation equipment. Electrical power producedby small generators benefits from higher tariffs compared with the larger scale generation. viii
The Public Investment Program for the development of energy sector (1999) includes 25projects with a total cost of LVL 21.2 million (36 million Euro). The Energy Efficiency Fund,
Renewable Energy Sector in the EU its Employment and Export Potential
ECOTEC Research and Consulting Limited
56
which began in 1998, provides loans to smaller plants, basically for replacement of presentequipment with more efficient equipment.ix
7.2.5 Romania
In 1999, hydro and nuclear together comprised 15% of the Romanian energy use (8% in1990). The share of renewable energy sources (RES) in the primary energy consumption is5.3 %; excluding large hydro, RES account for only 2.9%..x
Major emphasis is put on the regeneration of the hydro sector which currently stands at 6000MW in installed hydro electric power stations, yet only 40% of the hydro potential iscurrently used. The restructuring and promotion of hydroelectric power in Romania willinvolve rehabilitation of the large power plants (providing 85% of the national energysystem), Investment for providing new technologies for 42 hydro aggregates is estimated at350 M USD (318 M Euro) and for completing the unfinished HPPs, for an estimated 110 MUSD (100 M Euro) xi Plus there is an additional investment in building new capacities (900MW) of an estimated 1.6 billion USD (1.5 billion Euro).Much of the equipment and technologies now in place in the Romanian factories is Europeanorigin, purchased in sixties and seventies. The Romanian import market for equipment relatedto the energy sector is dominated by German, French and Italian companies. xii
7.2.6 Slovakia
Electricity production in Slovakia remains a state-controlled industry. There are up to 100companies dealing directly with renewable energy sources (RES) in Slovakia. RES representabout 3% of annual primary energy sources consumption. Almost no subsidies andtransforming legislation exist to support this market. Planned privatisation of the energyutilities, where foreign strategic partners and investors are expected to enter energy market ona large scale, will lead to larger utilisation of the potential of RES in the country. It isexpected the number of companies will increase (double) after action plans for energyefficiency and RES will be approved in Parliament (2003). Commitments from the IPCC(Kyoto protocol), hold biomass resources as the most important sources of CO2 reduction inthe Slovak conditions.
The most active and represented countries within the Slovak energy sector are Austria,Denmark, The Netherlands, Germany, Czech Republic and USA.
Renewable Energy Sector in the EU its Employment and Export Potential
ECOTEC Research and Consulting Limited
57
Box 6 : The job creation potential of new energy technology investments in Slovakia,(study conducted by Energy Centre Bratislava, May 2001)
In the sector of renewable energy sources and efficient energy use the following figures areapplicable for Slovakia:xiii
• Thermal insulation of all residential buildings that do not comply with present technicalrequirements by the year 2015 would create around 24,200 jobs per year. Presentemployment rate for thermal insulation is of 3,600 jobs per year.
• Complete utilisation of economic potential of small and medium sized combined heat andpower (CHP) by the year 2010 would create some 1,100 jobs per year.
• Complete utilisation of potential of energy production from biomass (30 PJ) by the year2010 would bring approximately 3,800 new jobs.
7.2.7 Slovenia
The government document “Strategy of Efficient Use and Supply of Slovenia” (1995)discusses renovation of hydro power plants and phasing out and substitution of thermal powerplants.xiv Estimated investments into renewable energy sources are US$1, 505 M (1,370 MEuro) (1993-2010). Hydropower accounted for 25% of the 2,514 MW of installed electriccapacity in 1994. A counselling network had been implemented by the Slovenian BuildingCentre (Gradbeni centre Sloveinje), stimulating the take up of solar thermal energy, mostlyused for heating household water. To replace old capacity and cover growing demand, up to1,500 MW of new capacity will have to be constructed to the year 2020, includinginvestments in automatisation of hydropower stations. xv xvi
7.2.8 Turkey
Turkey’s production of solar energy is only about 377 TJ (compared with Spain whichproduces about 1,663 TJ per year). The greatest potential is in the South Eastern Anatoliaregion. Of the geothermal resources, only 200 MW of a potential 4,500 MW capacity forenergy generation and only 1,000 MW of a 31,100 MW heating capacity is currently beingexploited. At present there is only one (7 MW) unit that produces wind energy.The production of solar energy has increased in the period 1991-1996; the annual increase isabout 18%. Geothermal energy production increased by 1700% from 1989 to 1996. For theyears 1996-2000, geothermal energy production increased at an annual average rate of 45%.There are many new projects for the construction of wind energy plants in Turkey that arelikely to increase the demand for wind energy equipment.

Renewable Energy Sector in the EU its Employment and Export Potential
ECOTEC Research and Consulting Limited
58
7.3 Case Study: Polandxvii
It is extremely difficult to evaluate the volume of renewable energy utilised in Poland, asinformation may only become available through special fact-finding research techniques. Theshare of renewable energy in the fuel and energy balance has been estimated by variousnational institutions, such as the Main Statistical Office, Ministry of the Economy, EC BalticRenewable Energy Centre. The figures given by the institutions vary, a fact which is a sourceof difficulties in the correct estimation of the actual utilisation of renewable energy in Poland.At the moment, the basic sources of renewable energy in Poland are biomass and hydro.Geothermal energy, wind power and solar energy are of lower significance. The potentialrenewable energy resources in Poland are presented in Error! Reference source not found..
Table 12 : Annual technical potential of RE in Poland
Source of energy
EC BREC's expertappraisal ‘Economic &Legal Aspects ofUtilisation. . .'(EC BREC, 2000)
[PJ]
‘Reduction Strategiesof Greenhouse GasEmissions'
[PJ]
Report prepared forthe World Bank(Hauff,1996)
[PJ]
Biomass 895 128 810Water 43 50 30Geothermal resources 200 100 ca. 200Wind 36 4 4 - 5Solar radiation 1340 55 370Total 2514 337 ca. 1414Total primary energyconsumption in Poland in1998
4069.6
Estimated figures for the current levels of utilisation of renewable energy in Poland are givenin Table 13.
Table 13 : Renewable energy use in Poland, 1999
Energy production from renewable sources in 1999PJ %
Biomass 101.8 98.05Water energy 1.9 1.83Geothermal energy 0.1 0.1Wind energy 0.01 0.01Solar energy 0.01 0.01Total 103.82 100
Renewable Energy Sector in the EU its Employment and Export Potential
ECOTEC Research and Consulting Limited
59
There is therefore a considerable opportunity to exploit Poland’s renewable energy resources,particularly from biomass.
The current status of renewable energy exploitation in Poland is summarised briefly below.
Wind power only began to develop in Poland at the beginning of the 1990's, and that wasmainly on the Baltic seaside. The most privileged areas in terms of availability of wind powerresource are the Baltic coast, Suwaki area and Mazovian lowland plain. By the end of 1999,14 wind farms with the total power over 3.5 MW had been connected to the grid and placed inservice. Added to this, there are around 50 small independent wind turbines in operation inPoland now. Investors take keen interest in wind power installations, especially in north-western Poland, where over 10 projects with total power exceeding 600 kW each are currentlyprepared.
Biomass is the most promising renewable source of energy. The share of biomass in thebalance of renewable energy in Poland is growing. Biomass may be utilised in directcombustion processes in a solid (wood, straw) and gaseous form (biogas) as well as processedinto liquid fuels (oil, alcohol).
In Polish conditions, one may expect considerable growth of interest in the utilisation of solidbiofuels - wood and straw - in the coming years. Polish farms produce around 25 milliontonnes of straw (mainly cereal and rape) and hay every year.
The Polish biomass market offers quite a large number of wood-fired boilers as there aresome 20 manufacturers and importers of such boilers at the market. There are around 10manufacturers of low-temperature wood-fired boilers, and around 10 manufacturers andsuppliers of straw-fired boilers currently active on the Polish market.
Hydropower: Among the various methods of energy generation, hydropower has the longesttradition in Poland. Polish hydropower resource is small due to the limited and unfavourablydistributed precipitation, high soil permeability and relative flatness of the country. The totalinstalled capacity of large hydro-electric power stations (excluding pumped-storage plants) isaround 630 MW, and of the small ones 160 MW. It must be mentioned that the power outputof existing hydroelectric power stations may be increased by 20-30% through themodernisation of their generators. There are around 800-1,000 sites around the country thatare estimated to be economically viable for micro hydropower. xviii xixIn view of the small-scale utilisation of the existing technical potential, hydropower engineering in Poland has achance of further development.
Solar energy has had only limited application to date. The total number of solar collectors isestimated at 50-60 units, and their surface area at 6,000 m2. They are operated for 300-600hours per year on average. Photovoltaics are virtually not used in Poland.
Renewable Energy Sector in the EU its Employment and Export Potential
ECOTEC Research and Consulting Limited
60
Geothermal energy: WHO is interested in developing the geothermal power. This interest isbased on the local need to reduce atmospheric emissions from domestic and industrial coalburning. .xx xxi
Foreign companies in the Polish renewable energy sector. xxii
Companies from Denmark, Finland and Sweden that are present in Poland include:• Ansaldo Volund (waste-to-energy)• NEG-Micron (wind energy),• Babcock Entreprise,• Energieconsulting Heidelberg and• Polytechnik
Renewable energy market driversThe European Union strongly supports Poland's efforts to attain European levels ofalternative energy production sources. The EU has already opened the following aidprograms: Joule-Therme, Altener, Synergy and Phare for Poland's renewable energydevelopment. EcoFund, a foundation managing funds from the conversion of part of thePolish foreign debt into a benefit fund to support environmental protection-relatedendeavours (so-called debt- for-environment swaps), has listed "renewable energysources" as its top priority beside "water management".xxiii
The Polish Ministry of Economy recently passed an ordinance that makes it mandatoryfor the Polish Power Grid companies to purchase a certain percentage of energy producedfrom renewable sources. This and other legal acts pave the way for the creation ofrenewable power industries.xxiv
References:Czech RepubliciChapter 3, ‘The Environment Industry and Market in the Czech Republic’, Within OECD 1995 Report, ‘TheEnvironment Industry and Markets in Selected Central and Eastern European Countries’, Kenneth Macek, BMTS.R.O., Prague, Czech Republicii New Czech Energy Policy announced (1/2000)iii New Czech energy policy announced (1/2000)iv Update on the Czech Energy Sector (July 1998)v Update on the Czech Energy Sector (July 1998)
Hungaryvi JEMU. June 1999. Market Opportunity Brief: Hungary. p20vii Markets of Opportunity – Hungary, December 2000: 1 www.mac.doc.gov/eebic/countryr/)
Latviaviii CEECBICnet. October 2000. Energy- Latvia. URL: www.mac.doc.gov/eebic/countryr/latvia/market.htmix CEECBICnet. October 2000. Energy- Latvia. URL: www.mac.doc.gov/eebic/countryr/latvia/market.htm
Renewable Energy Sector in the EU its Employment and Export Potential
ECOTEC Research and Consulting Limited
61
Romaniax CEEBICnet. February 2001. Industry Sector Analysis –Energy. URL:www.mac.doc.gov/eebic/countryr/romania/research/roenergy.htmxi Strategy of Hydroelectrica 2001 Ministry of Industry and Resourcesxii CEEBICnet. February 2001. Industry Sector Analysis –Energy. URL:www.mac.doc.gov/eebic/countryr/romania/research/roenergy.htm
Slovakiaxiii Potential benefits of selected alternatives for Slovak energy sector - Socio-economic and environmentalscenarios for Slovak energy sector development, Energy Centre Bratislava, Slovakia May 2001.
Sloveniaxiv Chapter 6, ‘The Environment Industry and Market in Slovenia’, Within ‘The Environment Industry andMarkets in Selected Central and Eastern European Countries’, OECD 1995, Written by Polona Blagus Smonig,Rudolf Rome and Marjan Smonig, Drevo, Ljubljana, Sloveniaxv Market research from EEBIC, US Dept of Commerce – ‘Slovenia - Energy Market Overview’, 1996xvi Chapter 6, ‘The Environment Industry and Market in Slovenia’, Within ‘The Environment Industry andMarkets in Selected Central and Eastern European Countries’, OECD 1995, Written by Polona Blagus Smonig,Rudolf Rome and Marjan Smonig, Drevo, Ljubljana, Slovenia
Polandxvii Source: Development strategy of renewable energy sector in Poland. The Council of Ministries, 2000xviii JEMU. June 1999. Market opportunity Brief. Poland p19xix CEEBICnet. December 1999. Less Coal in Poland’s Future Energy Balance. URL:www.mac.doc.gov/eebic/countryr/poland/market.htmxx JEMU. June 1999. Market opportunity Brief. Poland p19xxi CEEBICnet. December 1999. Less Coal in Poland’s Future Energy Balance. URL:www.mac.doc.gov/eebic/countryr/poland/market.htmxxii JEMU. June 1999. Market Opportunity Brief. Polandxxiii CEEBICnet. December 1999. Less Coal in Poland’s Future Energy Balance. URL:www.mac.doc.gov/eebic/countryr/poland/market.htmxxiv CEEBICnet. April 2001. The First Conference on Wind Energy Development. URL:www.mac.doc.gov/eebic/countryr/poland/market.htm


![Renewable electricity expansion and its effects on employment … · 2019. 6. 18. · DRAFT – NOT TO BE CITED [all sections still in progress] Renewable electricity expansion and](https://img.pdfslide.net/doc/110x75/60ec0a2ff63f4b5ddb1a7d4d/renewable-electricity-expansion-and-its-effects-on-employment-2019-6-18-draft.jpg)