Embed Size (px)
Citation preview

RENEWABLE ENERGY
AUCTIONSANALYSING 2016EXECUTIVE SUMMARY
•2 •
RENEWABLE ENERGY AUCTIONS
© IRENA 2017
Unless otherwise stated, material in this publication may be freely used, shared, copied, reproduced, printed and/or stored, provided that appropriate acknowledgement is given of IRENA as the source and copyright holder. Material in this publication that is attributed to third parties may be subject to separate terms of use and restrictions, and appropriate permissions from these third parties may need to be secured before any use of such material.
This publication should be cited as:IRENA (2017), ‘Renewable Energy Auctions: Analysing 2016’. IRENA, Abu Dhabi. ISBN 978-92-95111-08-0 (Print) ISBN 978-92-95111-09-7 (PDF)
ACKNOWLEDGEMENTS
The report has been developed under the guidance of Rabia Ferroukhi and Diala Hawila (IRENA) and has been authored by Gabriel Cunha, Arina Anisie and João Pedro Bastos (PSR) and Diala Hawila (IRENA).
The report benefited from valuable comments and feedback provided by Henning Wuester (IRENA) and Luiz Augusto Barroso (IRENA consultant).
DISCLAIMER
This publication and the material herein are provided “as is”. All reasonable precautions have been taken by IRENA to verify the reliability of the material in this publication. However, neither IRENA nor any of its officials, agents, data or other third-party content providers provides a warranty of any kind, either expressed or im-plied, and they accept no responsibility or liability for any consequence of use of the publication or material herein.
The information contained herein does not necessarily represent the views of the Members of IRENA. The mention of specific companies or certain projects or products does not imply that they are endorsed or rec-ommended by IRENA in preference to others of a similar nature that are not mentioned. The designations em-ployed and the presentation of material herein do not imply the expression of any opinion on the part of IRENA concerning the legal status of any region, country, territory, city or area or of its authorities, or concerning the delimitation of frontiers or boundaries.
ABOUT IRENA
The International Renewable Energy Agency (IRENA) is an intergovernmental organisation that supports countries in their transition to a sustainable energy future, and serves as the principal platform for in-ternational co-operation, a centre of excellence, and a repository of policy, technology, resource and fi-nancial knowledge on renewable energy. IRENA promotes the widespread adoption and sustainable use of all forms of renewable energy, including bioenergy, geothermal, hydropower, ocean, solar and wind energy, in the pursuit of sustainable development, energy access, energy security and low-carbon eco-nomic growth and prosperity.
www.irena.org
•3 •
Over the past decade, auctions have spread quick-ly as a means of eliciting supplies of energy from renewable sources, growing faster than feed-in tariffs (or premiums) and quotas (or renewable portfolio standards) in the past few years. The spread of auctions can be ascribed to the increas-ing maturity of the technology and other develop-ments in the sector.
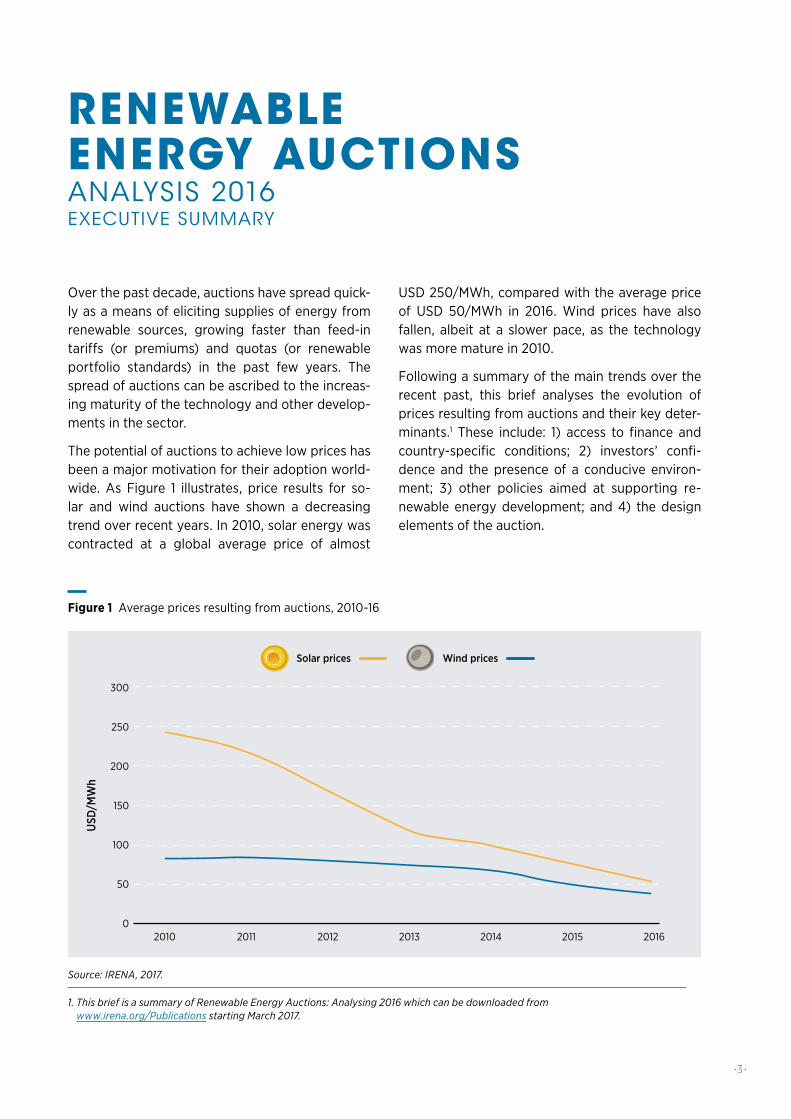
The potential of auctions to achieve low prices has been a major motivation for their adoption world-wide. As Figure 1 illustrates, price results for so-lar and wind auctions have shown a decreasing trend over recent years. In 2010, solar energy was contracted at a global average price of almost
USD 250/MWh, compared with the average price of USD 50/MWh in 2016. Wind prices have also fallen, albeit at a slower pace, as the technology was more mature in 2010.
Following a summary of the main trends over the recent past, this brief analyses the evolution of prices resulting from auctions and their key deter-minants.1 These include: 1) access to finance and country-specific conditions; 2) investors’ confi-dence and the presence of a conducive environ-ment; 3) other policies aimed at supporting re-newable energy development; and 4) the design elements of the auction.
2010 2016201520142013201220110
50
100
150
200
250
300
USD
/MW
h
Solar prices Wind prices
Figure 1 Average prices resulting from auctions, 2010-16
RENEWABLE ENERGY AUCTIONSANALYSIS 2016EXECUTIVE SUMMARY
Source: IRENA, 2017.
1. This brief is a summary of Renewable Energy Auctions: Analysing 2016 which can be downloaded from www.irena.org/Publications starting March 2017.
• 4 •
RENEWABLE ENERGY AUCTIONS
Chile~4400 GWh/year Wind at ~USD 45.2/MWh
~ 580 GWh/year Solar at USD 29.1 /MWh
Peru162 MW Wind at ~USD 37/MWh
184.5 MW Solar at ~USD 48/MWh
80 MW Hydro at ~USD 46/MWh
MexicoFIRST AUCTION620 MW Wind at ~USD 54.3/MWh
1 100 MW Solar at ~USD 44/MWh
SECOND AUCTION1038 MW Wind at ~USD 36.2/MWh
1 853 MW Solar at ~USD 32.8/MWh
Germany128 MW Solar at ~USD 84/MWh (4th tender)
130 MW Solar at ~USD 81/MWh (5th tender)
Canada (Ontario)1299.5 MW Wind at ~USD 66/MWha
140 MW Solar at ~USD 120/MWh
15.5 MW Hydro at ~USD 135/MWh
Denmark600 MW O�shore Wind at USD 53.9/MWh
Netherlands700 MW O�shore wind at ~USD 80.4/MWh
Russia610 MW Wind
China1000 MW Solar at USD 78/MWh
Morocco850 MW Wind at ~USD 30/MWh
Zambia73 MW Solar at ~USD 67/MWh
India6500 MW Solar at ~USD 73/MWhBrazil
500 MW Hydro at ~USD 57.5/MWh
198 MW Biomass at USD 60.2/MWh
ArgentinaFIRST AUCTION707 MW Wind at ~USD 59.5/MWh
400 MW Solar at ~USD 60/MWh
1.2 MW Biomass at USD 118/MWh
SECOND AUCTION1038 MW Wind at ~USD 53/MWh
1853 MW Solar at ~USD 55/MWh
UAE (Dubai)800 MW Solar at USD 29.9/MWh (Dubai Auction)
350 MW Solar at USD 24.2/MWh (Abu Dhabi Auction)
USA26 MW Solar at USD 26.7/MWh
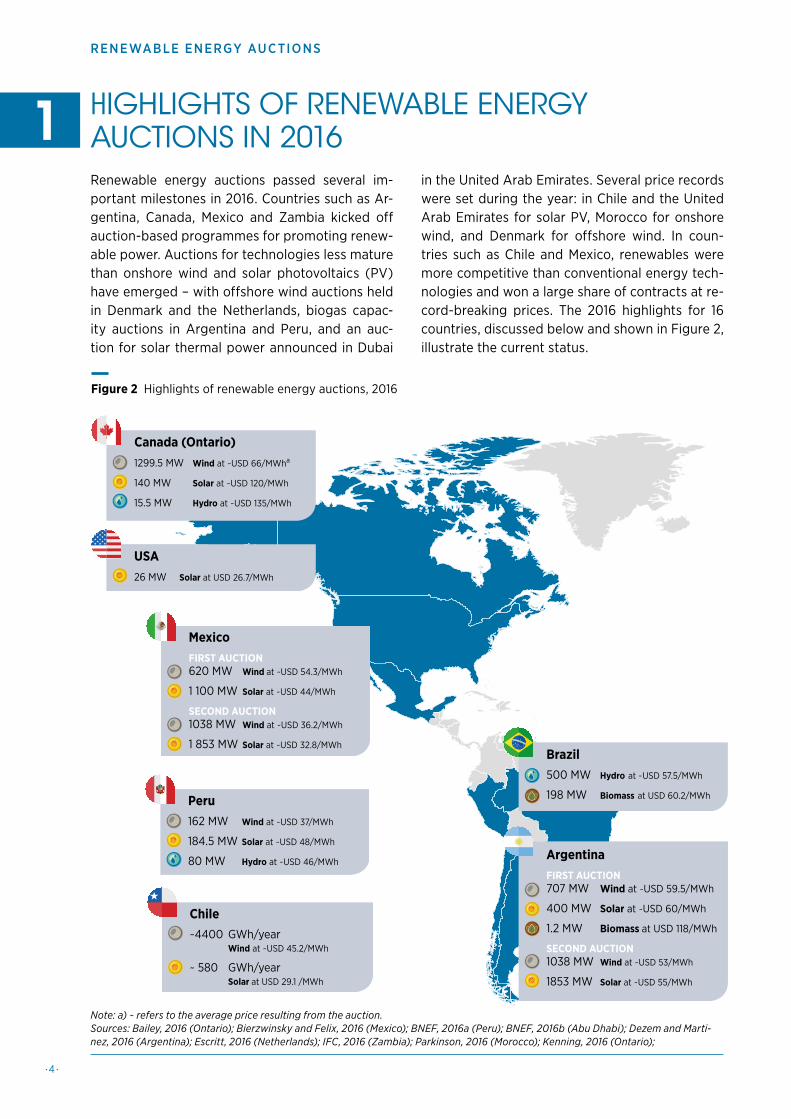
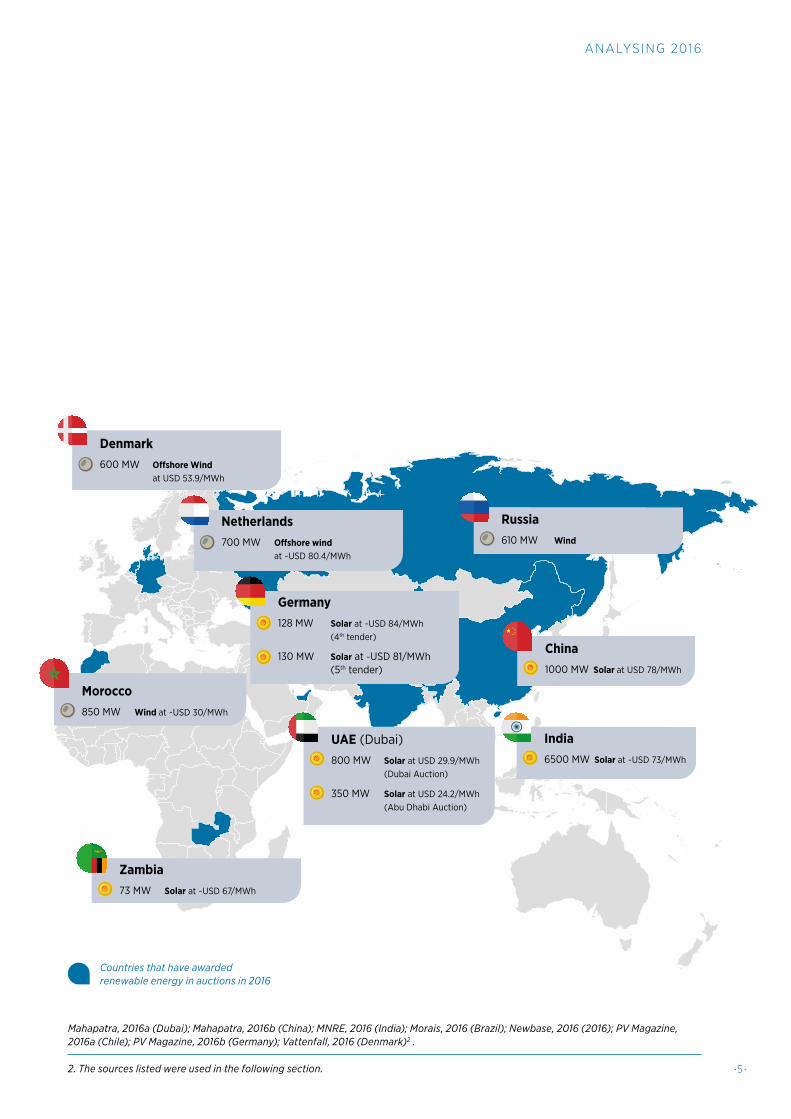
HIGHLIGHTS OF RENEWABLE ENERGY AUCTIONS IN 2016Renewable energy auctions passed several im-portant milestones in 2016. Countries such as Ar-gentina, Canada, Mexico and Zambia kicked off auction-based programmes for promoting renew-able power. Auctions for technologies less mature than onshore wind and solar photovoltaics (PV) have emerged – with offshore wind auctions held in Denmark and the Netherlands, biogas capac-ity auctions in Argentina and Peru, and an auc-tion for solar thermal power announced in Dubai
in the United Arab Emirates. Several price records were set during the year: in Chile and the United Arab Emirates for solar PV, Morocco for onshore wind, and Denmark for offshore wind. In coun-tries such as Chile and Mexico, renewables were more competitive than conventional energy tech-nologies and won a large share of contracts at re-cord-breaking prices. The 2016 highlights for 16 countries, discussed below and shown in Figure 2, illustrate the current status.
Figure 2 Highlights of renewable energy auctions, 2016
1
Note: a) ~ refers to the average price resulting from the auction. Sources: Bailey, 2016 (Ontario); Bierzwinsky and Felix, 2016 (Mexico); BNEF, 2016a (Peru); BNEF, 2016b (Abu Dhabi); Dezem and Marti-nez, 2016 (Argentina); Escritt, 2016 (Netherlands); IFC, 2016 (Zambia); Parkinson, 2016 (Morocco); Kenning, 2016 (Ontario);
•5 •
ANALYSING 2016
Chile~4400 GWh/year Wind at ~USD 45.2/MWh
~ 580 GWh/year Solar at USD 29.1 /MWh
Peru162 MW Wind at ~USD 37/MWh
184.5 MW Solar at ~USD 48/MWh
80 MW Hydro at ~USD 46/MWh
MexicoFIRST AUCTION620 MW Wind at ~USD 54.3/MWh
1 100 MW Solar at ~USD 44/MWh
SECOND AUCTION1038 MW Wind at ~USD 36.2/MWh
1 853 MW Solar at ~USD 32.8/MWh
Germany128 MW Solar at ~USD 84/MWh (4th tender)
130 MW Solar at ~USD 81/MWh (5th tender)
Canada (Ontario)1299.5 MW Wind at ~USD 66/MWha
140 MW Solar at ~USD 120/MWh
15.5 MW Hydro at ~USD 135/MWh
Denmark600 MW O�shore Wind at USD 53.9/MWh
Netherlands700 MW O�shore wind at ~USD 80.4/MWh
Russia610 MW Wind
China1000 MW Solar at USD 78/MWh
Morocco850 MW Wind at ~USD 30/MWh
Zambia73 MW Solar at ~USD 67/MWh
India6500 MW Solar at ~USD 73/MWhBrazil
500 MW Hydro at ~USD 57.5/MWh
198 MW Biomass at USD 60.2/MWh
ArgentinaFIRST AUCTION707 MW Wind at ~USD 59.5/MWh
400 MW Solar at ~USD 60/MWh
1.2 MW Biomass at USD 118/MWh
SECOND AUCTION1038 MW Wind at ~USD 53/MWh
1853 MW Solar at ~USD 55/MWh
UAE (Dubai)800 MW Solar at USD 29.9/MWh (Dubai Auction)
350 MW Solar at USD 24.2/MWh (Abu Dhabi Auction)
USA26 MW Solar at USD 26.7/MWh
Mahapatra, 2016a (Dubai); Mahapatra, 2016b (China); MNRE, 2016 (India); Morais, 2016 (Brazil); Newbase, 2016 (2016); PV Magazine, 2016a (Chile); PV Magazine, 2016b (Germany); Vattenfall, 2016 (Denmark)2 .
2. The sources listed were used in the following section.
Countries that have awarded renewable energy in auctions in 2016

•6 •
RENEWABLE ENERGY AUCTIONS
Throughout the year, India, one of the coun-tries with the vastest experience in solar
auctions, awarded solar power in at least 13 dif-ferent auctions organised by both state-level and national entities, for a total capacity of more than 6 500 MW. The high number of auctions is part of the Indian Solar Mission and reflects the country’s pledge to deploy 100 GW of solar energy by 2022.
In January, Morocco contracted 850 MW of wind power at the record-breaking average
price of USD 30/MWh (with the lowest price at USD 28 USD/MWh). The winning bid was submit-ted by a consortium composed of ENEL Green Power (Italy), Nareva Holding (Morocco) and Sie-mens Wind Power (Germany). The country also or-ganised its first solar PV auction this year, which will result in the addition of 170 MW to the Noor-Ouarzazate solar power complex. At this same site, 510 MW of solar thermal capacity has already been awarded from past auctions.
In February, Peru held its fourth renewable energy auction since 2010, setting re-
cord-low wind and solar energy prices for Latin America at the time. Grenergy (Spain) offered a bid of USD 36.8/MWh3 for wind, and Enel Green Power (Italy) a bid for USD 47.9/MWh for solar PV.
Mexico’s two energy auctions, carried out in March and September this year, are tied to
the country’s newly reformed electricity market, operational since January 2016. Although the auc-tions allow the participation of different technolo-gies, several products auctioned (electricity, firm capacity, and clean energy certificates) are exclu-sive to renewable energy projects, and wind and solar power proved to be extremely competitive. USD 42.8/MWh was offered for wind by Acciona (Spain) in March; just seven months later, the wind record for the Latin American region was broken in the second auction with the submission of a USD 32/MWh bid by ENEL Green Power (Italy). Meanwhile, for solar PV, USD 34.8/MWh4 was reg-
istered in the first round in March, only weeks after the auction in Peru, confirming that those were in-deed viable renewable prices in Latin America. So-lar prices fell even further in the country’s second round, establishing a Latin American record for so-lar energy of USD 27.0/MWh, offered by FRV (Spain/Saudi Arabia).
In April, Canada’s province of Ontario or-ganised its first renewable energy auction
to replace its feed-in tariff scheme for large-scale projects (above 500 kW). The auction resulted in the lowest cost of solar power contracted in On-tario to date (USD 120/MWh).
In April and September, Germany continued its auctioning programme initiated in 2015,
with the fourth and fifth solar rounds. These auc-tions represent the country’s pilot scheme for re-placing solar feed-in tariffs, and they have consis-tently attracted a high number of participants. In just one year, Germany’s auction has led to a price drop of more than 20% from the first round. Despite the country’s low irradiation levels and land-use constraints, average prices of EUR 74.1/MWh and EUR 72.3/MWh (USD 84/MWh and USD 81/MWh5) were obtained in April and September, respectively.
In two auctions in April and September, Brazil contracted more than 200 MW of small hy-
dro and almost 200 MW of biomass at an average price of BRL 198.59/MWh (USD 57.4/MWh6). A third auction exclusive to wind and solar projects had been scheduled for December but was can-celled, mainly in expectation of a continued eco-nomic slowdown and power oversupply. The country has a lengthy experience with both tech-nology-neutral and technology-exclusive renew-able energy auctions.
In May, Zambia became the first country to organise solar auctions under the Scaling
Solar program in Sub-Saharan Africa, designed and implemented by the International Finance
3. The auction also comprised another project of 18 MW which elicited a bid of USD 37.7/MWh, resulting in an average of USD 37.25/MWh.4. Prices are approximated, as the Mexican auctions do not reveal the bidder’s price per form of energy, but per package of products
(lump-sum yearly amount to be received for the offered quantity of capacity, energy and green certificates).5. Exchange rates of USD 1.13/EUR and USD 1.12/EUR for April and September, respectively.6. Exchange rate of USD 0.289/BRL at the time of the auction.

•7•
ANALYSING 2016
Corporation (IFC) and the World Bank. The auc-tion’s results set a new price record for utility-scale solar in Africa, with a minimum contracted price of USD 60.2/MWh by First Solar (Unites States) and Neoen (France). The second-lowest bid received was USD 78.4/MWh by Enel Green Power. Senegal and Madagascar have also subscribed to the Scal-ing Solar program.
In June, the United Arab Emirates an-nounced the results of its second solar PV
auction in Dubai. The winning price of USD 29.9/MWh, offered by Masdar (UAE) and FRV (Spain/Saudi Arabia), was the lowest solar price world-wide at that time. This bid was 19% lower than the second-lowest bid and 50% lower than the result of the first phase of the Dubai auction in 2015. In September, in Abu Dhabi, a bid of USD 24.2/MWh was submitted by Jinko Solar (China) and Marubeni (Japan), although a final contracting decision will not be made until the first quarter of 2017.
Also announced in June 2016 was Russia’s fourth renewables auction, which, despite
ambitious targets for wind, hydropower, and solar capacity, attracted only one bidder for a 610 MW wind power facility. Rosatom, the Russian state-con-trolled nuclear energy company, won the bid to in-stall the three projects (150 MW by 2018, 200 MW in 2019, and 260 MW in 2020) with a total invest-ment of RUB 83 billion (USD 1.3 billion7). The coun-try’s sharp economic downturn, stringent domes-tic content requirements, and a reduction in the project’s subsidy payment all contributed to the poor response from potential investors.
In July, the Netherlands organised its first offshore wind auction for a large-scale
700 MW project, which yielded an average price of USD 72.6/MWh. The Dutch auctions draw signifi-cantly on Denmark’s similar auctioning pro-gramme, and have benefitted from the extensive Danish experience.
In August, Chile organised one of its largest energy auctions to date, contracting 23% of
the country’s projected energy demand for the next decade. USD 29.1/MWh was the lowest bid registered, submitted by Solarpack (Spain) for a 120 MW solar project; a bid of USD 39.7/MWh was received for a 270 MW onshore wind project. The average price of the renewable energy auction was USD 47.6/MWh, proving the competitiveness of re-newable energy technologies.
In September, China organised its largest solar auction, contracting 1 GW of new ca-
pacity at an average price of USD 78/MWh.
Also in September, Argentina organised its first renewable energy auction under the
RenovAr program, leading to the contracting of wind, solar PV and biomass capacity at average prices of USD 59.4, 59.7 and 118/MWh, respective-ly8. The success of the experience led to the sched-uling of a second round for November, that award-ed 765.4 MW of wind at an average of USD 53/MWh and 516 MW of solar at USD 55/MWh.
In September and November, Denmark car-ried out two offshore wind auctions as part
of its long-running programme, which had result-ed in the contracting of four large-scale projects. The contracts were awarded for the Vesterhav (350 MW at 47.5 øre/kWh or USD 71.5/MWh9) and Kriegers Flak projects (600 MW at 37.2 øre/kWh or USD 53.9/MWh10). These prices represent re-ductions of 39% and 53%, respectively, from the prices attained in the 2015 auction.
7. Exchange rate of USD 0.016/RUB.8. With the minimum prices received for wind, solar PV and biomass being USD 49.1, 59 and 118/MWh, respectively.9. Exchange rate of USD 0.150/DKK in September 2016.10. Exchange rate of USD 0.145/DKK in November 2016.

• 8 •
RENEWABLE ENERGY AUCTIONS
TRENDS IN RENEWABLE ENERGY AUCTIONSFactors that influence policy-making have shifted dramatically in the past decade, creating a need for tailored policies that build on past experiences and lessons learnt to address prevalent barriers to re-newable energy deployment. These factors include the rapid decline in the costs of renewable energy technologies and the growing share of variable re-newable energy in the energy mix. To account for these dynamics, support policies are continuously being adapted to maintain a stable and attractive environment for investments in the sector while ensuring the long-term reliability of the energy system in a cost-effective manner (IRENA, 2014). In this context, auctions for renewable energy de-velopment have become increasingly popular in developing and developed countries and are often implemented in combination with other measures. The number of countries that have adopted renew-able energy auctions increased from six in 2005 to at least 67 by mid-2016.
2.1. THE STRENGTHS OF AUCTIONS
Auctions have gained popularity in different con-texts as they are not tied to any specific market ar-rangement or regulatory and institutional frame-work. They are equally compatible with vertically integrated electricity markets, single-buyer mod-els and completely liberalised markets. The grow-ing interest in auctions is due largely to their abili-ty to achieve deployment of renewable electricity in a well-planned, cost-efficient and transparent manner while also achieving a number of oth-er development objectives such as job creation, social growth, and domestic value creation and ownership. The strength of auctions lies in some of their key characteristics (see IRENA and CEM, 2015, volume 2).
• Flexibility of design, making it possible to com-bine and tailor different elements to meet de-ployment and development objectives and cater to a jurisdiction’s economic situation, the struc-ture of its energy sector, the maturity of its pow-er market and its level of renewable energy de-ployment.
• Certainty regarding prices and quantities, al-lowing policymakers to control both the price and quantity of renewable energy produced by pro-viding stable revenue guarantees for project de-velopers (in the manner of feed-in tariffs) while at the same time ensuring that the renewable-gen-eration target is met more precisely (in the man-ner of quotas and tradable green certificates).
• Degree of commitment and transparency, as auctions yield contracts that clearly state the commitments and liabilities of each party. There-fore, they offer regulatory certainty to investors and minimise the likelihood that their remunera-tion is challenged in the future even as the market and policy landscape change. Stating clear penal-ties for underbuilding and delays can also ensure that auctioned projects deliver as per the bid.
• Potential for real price discovery, reducing in-formation asymmetry between project develop-ers and the entity responsible for determining purchase prices and support levels. Auctions’ power to discover real prices is of particular rel-evance given recent market developments, no-tably the rapid downward evolution of technolo-gy costs. The effect of price discovery is clearly shown in the global trends of auction prices for both solar and wind projects, and it is especial-ly important for the development of local supply chains and the maturity of the market.
The potential to achieve low prices has been ac-claimed as one of the most important strengths of auctions and has been a major motivation for their rapid dissemination worldwide. This strength can largely be attributed to their ability to pro-mote competition among potential developers and lead to accurate price discovery in a robust and transparent manner. In 2010, solar energy was contracted at a global average price of almost USD 250/MWh, compared with the average price of USD 50/MWh in 2016. Wind prices have fallen at a slower pace, as the technology was already fairly mature in 2010, making investment costs more stable – but a decreasing trend can still be seen, especially after 2014.
2

•9 •
ANALYSING 2016
2.2. PRICE TRENDS: SOLAR PV
Solar PV modules have been deployed at a fast rate with a steep learning curve. The total glob-al installed capacity grew from 2 GW in 2012 to 222 GW by the end of 2015 (IRENA, 2016a). Driv-en by technological improvements and manufac-turing advances, and with the overcapacities in the market peaking in 2011, PV module prices de-creased by around 80% between 2009 and 2015. Moreover, owing to economies of scale and reduc-tions in soft costs, the levelised cost of electricity (LCOE) from solar PV fell 58% between 2010 and 2015 (IRENA, 2016b). The decreasing costs of in-stalling solar PV projects were reflected in the fall-ing prices of auctions.
Figure 3 illustrates the downward trend in auc-tioned solar prices in selected countries, many of which have been organising solar power auctions on a regular basis for years. As shown in the fig-ure, average prices fell in all countries between
2010 and 2016 (with prices in the period between 2010 and 2014 decreasing at a faster rate than be-tween 2014 and 2016). Prices in Peru, for example, fell from USD 220/MWh in 2010 (IRENA, 2013) to USD 48.5/MWh in the last auction in 2016 (BNEF, 2016a). In South Africa, the drop was even sharp-er, from USD 345/MWh in 2011 (IRENA, 2013) to USD 64/MWh in 2015 (Eberhard and Kåberger, 2016).
Although the figure shows a convergence in av-erage prices, reflecting the increased maturity of the sector, it also shows large disparities be-tween countries in earlier years. Such disparities are shown, for example, in the price difference be-tween Peru and South Africa, the country with the clearest downward trend. The figure also shows sinuous patterns in India, remarkably lower prices in the United States and a persistence of prices in the upper range in Germany. These elements are discussed in more detail below.
Figure 3 Evolution of average solar prices in auctions, January 2010-September 2016
350
300
250
200
150
100
50
0
2010 2011Q1 Q2 Q3 Q4 Q1 Q2 Q3 Q4 Q1 Q2 Q3 Q4 Q1 Q2 Q3 Q4 Q1 Q2 Q3 Q4 Q1 Q2 Q3 Q4 Q1 Q2 Q3 Q4
2012 2013 2014 2015 2016
South Africa
France
USA
Morocco
Peru
Jordan
Germany
Chile
India
Mexico
ArgentinaChina
Zambia
Saudi ArabiaUAE (Dubai)
Brazil
USD
/MW
h
IRENA, 2017 (forthcoming).
•10 •
RENEWABLE ENERGY AUCTIONS
Downward trends in South Africa.
The steep price decrease observed in South African solar auctions, especially between the first and sec-ond rounds, can be attributed to learning-curve ef-fects, increased investor confidence, development of a local industry and adaptations in the South Af-rican auction design (particularly regarding volume auctioned and the disclosure of ceiling prices).
First, a learning curve achieved by the bidders and the auctioneer reduced the gap in prices consider-ably. This phenomenon is quite common, as project developers typically require higher risk premiums in countries that do not yet have a track record in renewable energy deployment. The success of ear-ly auctioning experiences leads to more successful subsequent bidding rounds, increasing investors’
confidence over time (see IRENA and CEM, 2015, volume 3). Moreover, it is possible that some po-tential bidders who had already qualified for the first round did not need to reinvest in obtaining the necessary documentation in the second round, de-creasing their transaction costs and thus resulting in lower prices.
Second, the presence of a domestic solar industry made itself felt in the cost of projects. As South African policymakers sought to prioritise social development goals beyond minimising prices, the local content requirements imposed in the first round led to higher prices, with subsequent reduc-tions as the local industry developed (see Box 1).
Third, the design of South Africa’s auctions con-tributed to the high prices resulting from the first
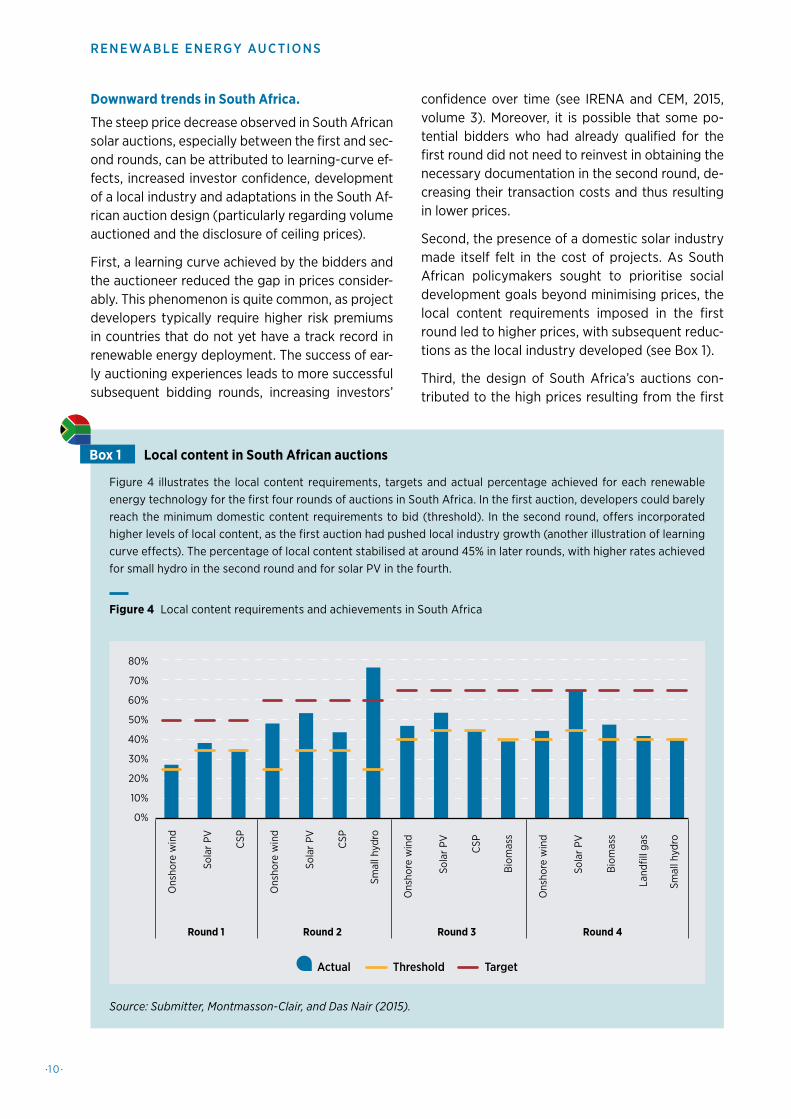
Figure 4 illustrates the local content requirements, targets and actual percentage achieved for each renewable energy technology for the first four rounds of auctions in South Africa. In the first auction, developers could barely reach the minimum domestic content requirements to bid (threshold). In the second round, offers incorporated higher levels of local content, as the first auction had pushed local industry growth (another illustration of learning curve effects). The percentage of local content stabilised at around 45% in later rounds, with higher rates achieved for small hydro in the second round and for solar PV in the fourth.
80%
70%
60%
50%
40%
30%
20%
10%
0%
Round 1 Round 2 Round 3 Round 4
Ons
hore
win
d
Sola
r PV CSP
Smal
l hyd
ro
Ons
hore
win
d
Sola
r PV CSP
Bio
mas
s
Ons
hore
win
d
Sola
r PV CSP
Land
fill g
as
Smal
l hyd
ro
Ons
hore
win
d
Sola
r PV
Bio
mas
s
Actual Threshold Target
Source: Submitter, Montmasson-Clair, and Das Nair (2015).
Figure 4 Local content requirements and achievements in South Africa
Local content in South African auctionsBox 1

•1 1 •
ANALYSING 2016
round, where a large volume of 3 750 MW was auc-tioned at once. This and the lower level of develop-ment of the domestic industry at the time meant that opportunities for competition among suppli-ers was limited (see IRENA and CEM, 2015, volume 3). Moreover, ceiling prices were fully disclosed pri-or to the first round, which led to bids close to the ceiling price, with little incentive to bid lower (see IRENA and CEM, 2015, volume 5).
Ups and downs in India.
India has held at least 47 solar auctions since 2010, more than any other country. The prices result-ing from these auctions are characterised by their sinuous pattern, with their average slightly on the higher side.
The sinuous pattern is explained by the fact that auctions are decentralised: while some are organ-ised at the national level, most are state auctions, with each state adopting its own auction design
which have an impact on the final bid. The diver-sity in the underlying conditions of these indepen-dent auctions results in oscillating prices. Among other reasons, some auctions yielded higher pric-es owing to strict local content requirements (see IRENA and CEM, 2015, volume 4).
The relatively higher prices in India compared with Peru, the United States and South Africa can often be traced to the remuneration profile and the type of contract offered. Unlike other auction contracts that are indexed to inflation or denominated in US dollars, as is the case in all Latin American coun-tries (except Brazil), the Indian auctions offer con-tracts in the local currency and are not corrected for inflation or foreign exchange rates (see IRENA and CEM, 2015, volume 6). Taking into account the high inflation rates in India, the contract’s value in real terms may be expected to decrease substan-tially over time (see Box 2).
11. Unadjusted price without considering elements such as inflation, seasonality, loan fees and interest compounding.
Figure 5 illustrates the effect of inflation on remuneration profiles in contracts indexed for inflation versus those not indexed. Looking at the nominal contract price11 , the unindexed contract appears to yield constant remuneration, whereas the energy price in the indexed contract appears to rise. In fact, taking into account factors such as infla-tion, and looking at the contract price in real terms (second panel of figure), the indexed contract will maintain the same value over time, whereas an unindexed one will lose value. The perception that inflation adjustments make contracts more expensive is incorrect, as nominal prices have no economic meaning. Therefore, to shield devel-opers from inflation risk, contracts are often indexed to inflation; when they are not, as in India, developers factor inflation into their bid price. The resulting bids are higher so that developers can recover their investment despite the contract’s loss of value over time.
Note: the figure aims to show the remuneration of indexed/non-indexed contracts under nominal and real terms. A contract price of USD 100/MWh and 4% inflation were used in this example, for illustrative purposes.
Figure 5 The effect of inflation indexing on contract price
Remuneration profile in Indian auctions
1 2 3 4 5 6 7 8 9 10 11 12 13 14 15 16 17 18 19 20 1 2 3 4 5 6 7 8 9 10 11 12 13 14 15 16 17 18 19 20
Ener
gy p
rice
(USD
/MW
h)
Nominal contract price Real contract price
Ener
gy p
rice
(USD
/MW
h)
Year Year
0
50
100
150
200
250
0
30
60
90
120
150
Non-indexed contractIndexed contractNon-indexed contractIndexed contract
Box 2
•12 •
RENEWABLE ENERGY AUCTIONS
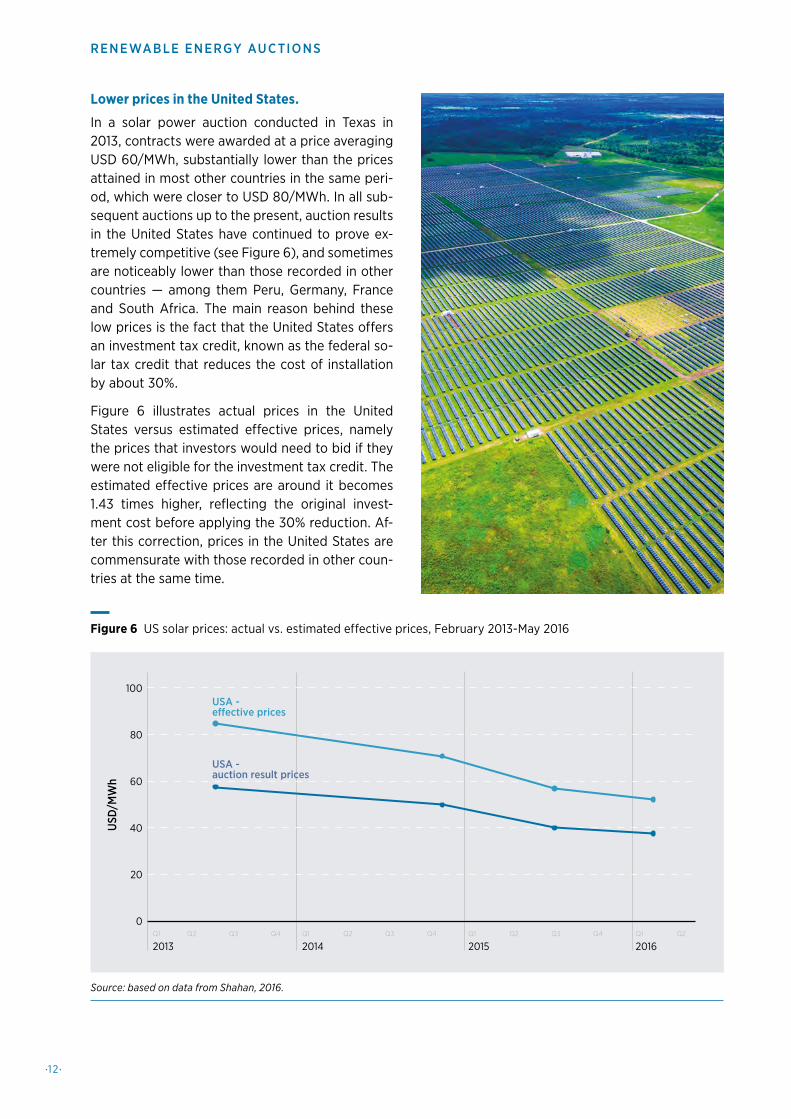
Lower prices in the United States.
In a solar power auction conducted in Texas in 2013, contracts were awarded at a price averaging USD 60/MWh, substantially lower than the prices attained in most other countries in the same peri-od, which were closer to USD 80/MWh. In all sub-sequent auctions up to the present, auction results in the United States have continued to prove ex-tremely competitive (see Figure 6), and sometimes are noticeably lower than those recorded in other countries — among them Peru, Germany, France and South Africa. The main reason behind these low prices is the fact that the United States offers an investment tax credit, known as the federal so-lar tax credit that reduces the cost of installation by about 30%.
Figure 6 illustrates actual prices in the United States versus estimated effective prices, namely the prices that investors would need to bid if they were not eligible for the investment tax credit. The estimated effective prices are around it becomes 1.43 times higher, reflecting the original invest-ment cost before applying the 30% reduction. Af-ter this correction, prices in the United States are commensurate with those recorded in other coun-tries at the same time.
20
0
40
60
80
100
USD
/MW
h
USA -auction result prices
USA -eective prices
Q1 Q2 Q3 Q4Q1 Q2 Q3 Q4Q1 Q2 Q3 Q4 Q1 Q2
2013 2014 2015 2016
Figure 6 US solar prices: actual vs. estimated effective prices, February 2013-May 2016
Source: based on data from Shahan, 2016.
•13 •
ANALYSING 2016
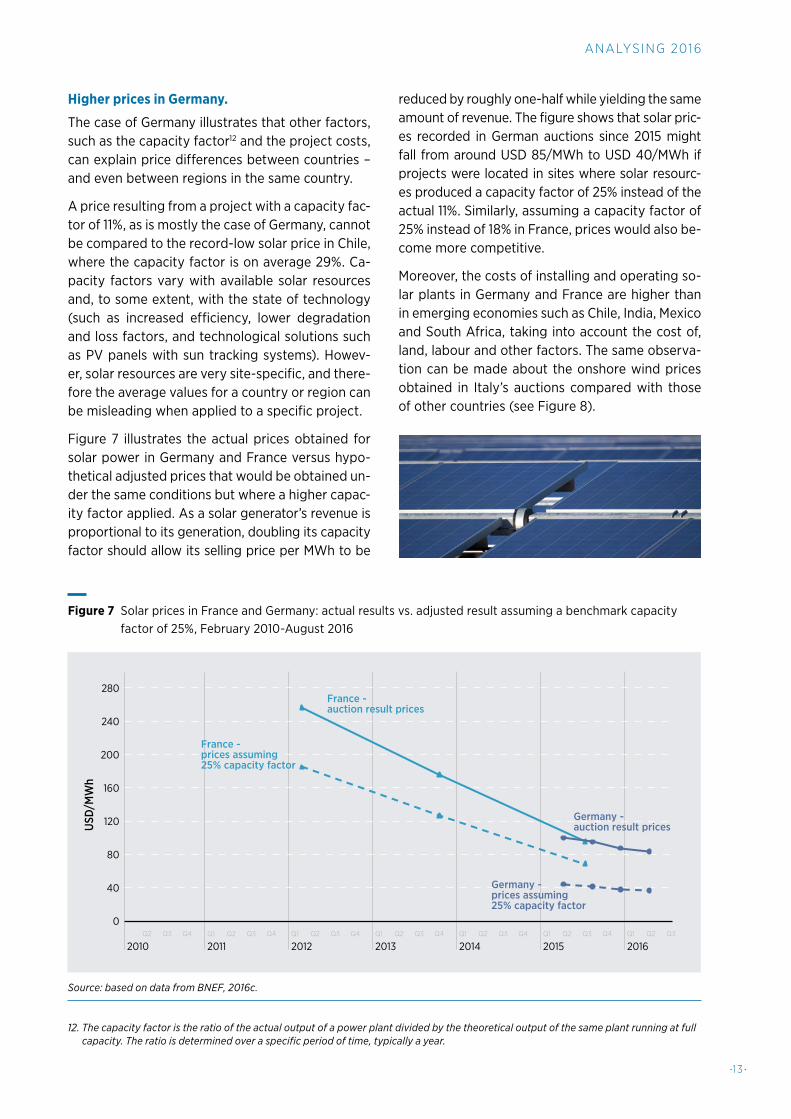
Figure 7 Solar prices in France and Germany: actual results vs. adjusted result assuming a benchmark capacity factor of 25%, February 2010-August 2016
Q1 Q2 Q3 Q4 Q1 Q2 Q3 Q4 Q1 Q2 Q3 Q4 Q1 Q2 Q3 Q4 Q1 Q2 Q3 Q4 Q1 Q2 Q3Q2 Q3 Q4
2010 2011 2012 2013 2014 2015 2016
0
40
80
120
160
200
280
240
USD
/MW
h
France -auction result prices
Germany -auction result prices
France -prices assuming25% capacity factor
Germany -prices assuming25% capacity factor
Source: based on data from BNEF, 2016c.
12. The capacity factor is the ratio of the actual output of a power plant divided by the theoretical output of the same plant running at full capacity. The ratio is determined over a specific period of time, typically a year.
Higher prices in Germany.
The case of Germany illustrates that other factors, such as the capacity factor12 and the project costs, can explain price differences between countries – and even between regions in the same country.
A price resulting from a project with a capacity fac-tor of 11%, as is mostly the case of Germany, cannot be compared to the record-low solar price in Chile, where the capacity factor is on average 29%. Ca-pacity factors vary with available solar resources and, to some extent, with the state of technology (such as increased efficiency, lower degradation and loss factors, and technological solutions such as PV panels with sun tracking systems). Howev-er, solar resources are very site-specific, and there-fore the average values for a country or region can be misleading when applied to a specific project.
Figure 7 illustrates the actual prices obtained for solar power in Germany and France versus hypo-thetical adjusted prices that would be obtained un-der the same conditions but where a higher capac-ity factor applied. As a solar generator’s revenue is proportional to its generation, doubling its capacity factor should allow its selling price per MWh to be
reduced by roughly one-half while yielding the same amount of revenue. The figure shows that solar pric-es recorded in German auctions since 2015 might fall from around USD 85/MWh to USD 40/MWh if projects were located in sites where solar resourc-es produced a capacity factor of 25% instead of the actual 11%. Similarly, assuming a capacity factor of 25% instead of 18% in France, prices would also be-come more competitive.
Moreover, the costs of installing and operating so-lar plants in Germany and France are higher than in emerging economies such as Chile, India, Mexico and South Africa, taking into account the cost of, land, labour and other factors. The same observa-tion can be made about the onshore wind prices obtained in Italy’s auctions compared with those of other countries (see Figure 8).

•14 •
RENEWABLE ENERGY AUCTIONS
2.3. PRICE TRENDS: ONSHORE WIND
Prices for onshore wind have fallen recently in sev-eral countries. Figure 8 shows prices converging to around USD 40/MWh in 2016, with record- breaking results below that level in Morocco, Peru and Mex-ico. Spurred by high competition, growing inves-tor confidence and developed local industries, re-cent auction outcomes show an average price drop of 45% between the last two auctions in Chile (10 months apart), 33% in Mexico (6 months apart) and 10% in Argentina (2 months apart).
The figure also shows large disparities between countries before the recent convergence, with a steep drop in prices between rounds. In South Af-rica, Italy and Chile, prices started out much higher than in most other countries and dropped sharp-ly from the first auction to the second, reducing the gap between these three countries and oth-er cases. The price drops may be due to a learn-ing curve, as discussed in Section 2.1. Another fac-tor is that some costs incurred in the first round are not repeated in further rounds, as bidders can use the same feasibility studies, resource as-sessments, and so on. Changes in auction design, such as those related to project location in Mexico, have also had an impact. Apparent in the figure are some fluctuations in results, notably in Brazil, for reasons explained below. The figure also shows that prices in Italy remain in the upper range.
A sharp decrease in Mexico.
Following the liberalisation of the Mexican pow-er market, many investors found the first energy auction in March 2016 an opportunity to enter the market. The second auction, which took place only seven months after the first, had as its main ob-jective to contract the portion of demand that had remained unmet. The price decrease in Mexico can be largely attributed to the learning curve and to changes in auction design related to project loca-tion (see IRENA and CEM, 2015, volume 3).
The learning curve effects (as discussed in the South African example in Section 2.1) exerted some effect on price. More bidders were attracted to the second auction, partly owing to its higher demand in terms of volumes auctioned. While the first auction focused only on electricity quantity (in MWh) and clean certificates from wind and so-lar projects, the second one focused on also con-tracting capacity products. Therefore, the quantity demanded by the auction increased three-fold.
Another significant change was in the economic signals for project location provided. Strong sig-nals in the first auction were meant to incentiv-ise the location of new projects where they would most benefit the power system, as indicated by expected congestion prices obtained from a long-term system simulation. Every package bid was adjusted: the ”good” locations (where the nodal
Figure 8 Evolution of average auction prices for onshore wind energy, January 2010-July 2016
2010 2011Q1 Q2 Q3 Q4 Q1 Q2 Q3 Q4 Q1 Q2 Q3 Q4 Q1 Q2 Q3 Q4 Q1 Q2 Q3 Q4 Q1 Q2 Q3 Q4 Q1 Q2 Q3 Q4
2012 2013 2014 2015 2016
20
0
40
60
80
100
120
140
160
200
180
USD
/MW
h
Peru
Brazil
Mexico
Italy
South Africa
United Kingdom
ArgentinaCanada
Morocco ChileAustralia
Egypt
IRENA, 2017 (forthcoming).

•15 •
ANALYSING 2016
prices are high) were rewarded and the “bad” ones (those with lower nodal prices) were for bid com-parisons in the auction. However, in the second auction, the locational signals were significant-ly reduced, as the auction focused instead on the quality of the resources. The figures in Box 3 illus-trate the change in the locational signals by region and the amount of electricity (in GWh) offered in each of the regions.
Fluctuating prices in Brazil.
Brazil is among the first countries to contract wind energy through auction; the country now has ac-cumulated experience from 13 auctions. The price
trend in Brazil seems largely flat from 2010 to 2016, with some volatility represented by fluctu-ations and changes of direction in the price curve shown in Figure 8. Most of these fluctuations can be traced to project lead times, intensified com-petition, availability of concessional financing and depreciation of the local currency, and auction de-sign.
Brazil typically conducts two auctions each year: one for project delivery in three years (A-3) and another one for delivery in five (A-5) (IRENA, 2013). The five-year lead time allows more flexi-bility for planning construction and commissioning the project, while also minimising the risk of pen-
Figure 9 illustrate the change in locational signals, by region, between the first and second rounds of the auctions held in Mexico in 2016 and the amount of power (in GWh) offered in each region. For example, projects located in the Northeast of the country (Hermosillo, Moctuzema) were not contracted due to the high “penalty” applied to the bids in those regions, which are, however, rich in renewable energy sources. Therefore, in the second auction, when the locational penalty decreased by 95%, significant quantities of power were contracted in these regions. The reverse effect took place in Merida region, where 1 819 GWh of wind and solar were contracted in the first auction owing to the advantageous location signal (USD 22/MWh), even though the resource potential was not favourable. Therefore, in the second auction the renewable energy plants have slightly higher capacity factors than in the first auction, which can also explain the average price decrease from one auction to the other.
Source: Strategy &, 2016.
Figure 9 Locational signals and offered capacity in each location: first vs. second auction
Locational signals in Mexican auctions
20
10
0
-10
-20
-30
-40
Her
mos
illo
Obr
egon
Juár
ez
Moc
tezu
ma
Lagu
na
Rey
nosa
Mon
terr
ey
Salt
illo
Gue
mez
Agu
asC
alie
ntes
Car
pan
Que
réta
ro
Pue
bla
Itte
pec
Mér
ida
Mex
ical
i
Con
stit
ució
n
8.4 8.86
0.4 0.67.6
0.66.7
USD
/MW
h
0.66.44.5
0.4 0.45.6
0.4 0.3 0.64.3
0.32.7 0.1 0.1 0.1 0.3 0.3
8.4
-34.3
00.8
-0.5-3.7
-22
-2.9
Agu
asC
alie
ntes
2500
2000
1500
1000
500
0
Her
mos
illo
Obr
egon
Juár
ez
Moc
tezu
ma
Lagu
na
Rey
nosa
Mon
terr
ey
Salt
illo
Gue
mez
Car
pan
Que
réta
ro
Pue
bla
Itte
pec
Mér
ida
Mex
ical
i
Con
stit
ució
n
832
290 194394 466
17112013
821
1419
808
169
818
1819
114 61220119418
779
223586M
W
2nd Auction1st AuctionLocational signals
2nd Auction1st AuctionO�ered Capacity
Box 3

•1 6 •
RENEWABLE ENERGY AUCTIONS
alties for delays. The A-5 auctions should, there-fore, be expected to yield lower prices than the A-3 auctions, as shown in Figure 8 at the end of 2013 and 2014, where two auctions only months apart resulted in prices for the A-5 auctions that were 6% and 10% lower than those for A-3 auctions.
The dip in Brazil’s curve at the end of 2012 marks the point when it had the world’s lowest price for wind power, a distinction it earned (and retained for several years) owing to intense competition in the market. Only one auction was carried out in 2012 (as opposed to at least three in most years), with very low demand from distributors; whereas the previous auction contracted almost 1 GW of wind capacity, and the subsequent one 1.5 GW, the 2012 auction closed contracts for just 289 MW. A large number of suppliers qualified to bid, which led to a major supply glut and depressed prices; only 2% of the subscribed capacity was ultimate-ly contracted. After this point, prices slowly recov-ered and stabilised at a higher level.
The price increase in 2015 (opposing the interna-tional trend) reflects a reduction in the availability of loans from the Banco Nacional de Desenvolvi-mento Econômico e Social (BNDES), a Brazilian state-owned bank institution that had been one of the main suppliers of financing for the energy sector. The BNDES National Climate Change Fund offered low-cost, long-term loans for up to 70% of total capital requirements of renewable ener-gy projects, and private banks could not profitably compete with the interest rates it offered, which were as low as 2% per year in real terms. This led to many energy projects being developed at a low cost of capital. However, when the fiscal situation of the Brazilian Treasury worsened in 2015, BNDES reduced its participation in loans for several seg-ments of the energy sector and even temporari-ly stopped making new loans through the Nation-al Climate Change Fund. Without BNDES’s cheap loans, the cost of capital of the projects almost doubled, which drove prices up.
Contributing to the price peaks were shifts in un-derlying economic conditions and in auction de-sign. In 2013, for example, the domestic content re-quirements associated with BNDES loans became
more stringent, reflecting the country’ develop-ment priorities (Brazilian auctions do not require domestic content directly.) The rules for calculat-ing the maximum capacity factor that wind power plants could offer in the auction, the revision of the ceiling price in light of the depreciation of the local currency, and the rule for determining generators’ responsibility in cases of transmission delay were also revised that same year, which contributed to an increase in bid prices (Bloomberg, 2015).
Higher prices in Italy.
Despite significant price decreases in each round, prices remained substantially higher in Italy than in many other countries; they were comparable to the prices observed in the United Kingdom in 2015. The fact that European countries seem to show a systematically higher price can be explained partly by higher costs of finance, labour and land com-pared with other regions.
The expected capacity factor of wind power gen-eration also exerts an influence. Wind power de-velopers in Brazil and Peru, for example, have of-ten declared high capacity factors, close to 45% on average and in several cases exceeding 50%. The operating results of existing wind farms in those two countries seem to indicate that generators are indeed capable of reaching this level of perfor-mance within a few percentage points (although subject to yearly fluctuations). This is in stark con-trast with European countries, where values closer to 30-35% seem to be the norm.
As shown in this section, many factors contribute to the low prices that result from solar and wind auctions. Analysing and comparing results of var-ious auctions globally can be challenging, as pric-es are heavily influenced by factors related to the country context and to auction design. Analysing the prices emerging from biomass auctions is even more complicated, as these depend largely on the feedstock used (see Box 4). Nevertheless, it is im-portant to analyse those factors in order to pro-vide policy makers with a good understanding of the dynamics of auctions and enable them to make informed decisions about the choice of policy in-struments and the design of auctions.

•17•
ANALYSING 2016
Bioenergy production is very diverse, encompassing a wide range of technologies and feedstock materials. In general, the most competitive bioelectricity solutions involve the use of solid biomass residues from forestry and agricultural activities such as wood chips, rice husks, and sugarcane bagasse. The capacity of the plant, as well as its competitiveness, depends greatly on the volume of residues generated. Urban biomass and biogas solutions have recently gained attractiveness, as they present an opportunity to reduce sanitation costs for the government while also producing electricity. Their competitiveness has increased over the years, but they typically involve smaller capacities and therefore lower economies of scale.
Figure 10 illustrates the price outcomes from selected auctions globally. Because the range of feedstock choices is wide, it can be difficult to make reasonable country comparisons or draw meaningful trends and conclusions. For example, whereas Peruvian auctions typically award contracts for municipal solid waste or biogas, its 2010 auction was dominated by sugarcane agricultural residue – which explains the noticeable shift in prices. Similarly, even though sugarcane bagasse has been the most prominent technological route in Brazil, the country’s 2014 and 2015 auctions had significant contributions from generation based on wood chips, which along with the country’s delicate economic situation (see Section 2.2), contributed to the increase in the price.
The results are influenced by the design of auctions, chiefly the price ceiling. Policymakers generally favour some biomass technologies over others owing to resource availability and targeted socio-economic benefits. As a result, their priorities are translated into different price ceilings. In Peru’s 2016 auction, the highest price ceiling was at-tributed to solid waste (USD 106/MWh), followed by forestry residues (USD 90/MWh), biogas solutions for munic-ipal waste management (USD 77/MWh), and the lowest price ceiling was attributed to agricultural waste solutions (USD 68 /MWh) (Osinergmin, 2015).
The varied ranking of favoured technologies across countries illustrates the degree to which a country’s character-istics affect not only pricing but also the choice of the most strategic technologies in line with the socio-economic objectives. It is therefore important to consider the positive externalities of biomass, which include 1) its positive contributions to the electricity grid for baseload generation; 2) synergies with the agricultural sector and rural eco-nomic development; and 3) synergies with municipal needs for urban sanitation and waste management.
IRENA, 2017 (forthcoming)
Figure 10 Evolution of average biomass prices in auctions, January 2010-July 2016
Price trends of bioelectricity
2010 2011Q1 Q2 Q3 Q4 Q1 Q2 Q3 Q4 Q1 Q2 Q3 Q4 Q1 Q2 Q3 Q4 Q1 Q2 Q3 Q4 Q1 Q2 Q3 Q4 Q1 Q2 Q3 Q4
2012 2013 2014 2015 2016
20
0
40
60
80
100
120
140
160
180
USD
/MW
h
Peru
Brazil
Italy
South Africa
United Kingdom
Argentina
Box 4

•1 8 •
RENEWABLE ENERGY AUCTIONS
ANALYSIS OF FACTORS INFLUENCING PRICESAs shown in Section 2, auctions have been driv-ing renewable energy prices down as they spur competition in the market and allow for real price discovery. However, falling technology prices and increased competition are not the only factors bringing prices down. Country-specific factors play a major role in individual auction results and must be evaluated with care. Such factors include 1) access to finance and country-specific econom-ic conditions; 2) investors’ confidence (related to the presence of a conducive environment); 3) oth-er policies aimed at supporting renewable energy development; and 4) auction design elements.
3.1. ACCESS TO FINANCE AND COUNTRY-SPECIFIC CONDITIONS
The prices resulting from renewable energy auc-tions depend largely on the costs incurred by project developers, including the cost of finance. Renewable energy auctions award long-term con-tracts that guarantee a sustainable revenue to project developers, lowering risk perceptions and instilling confidence in banks and other financial institutions in the presence of a credible off-taker. Attractive loan terms and other means of reduc-ing the cost of debt lower projects’ capital costs, permitting lower prices. Attractive financing can
be offered by national banks, such as BNDES in Brazil (see Box 5), or by international development banks, as in Morocco, Peru and Zambia and the high level of debt versus equity such as the case of Dubai in the United Arab Emirates, can bring down the cost of financing (see Box 6).
In addition, the macroeconomic conditions of each country affect the availability and cost of financ-ing. These conditions include the country’s ease of doing business, its credit rating, its country risk premium, and the general international percep-tion of its economic, political, legal and regulato-ry stability. These elements affect international in-stitutions’ willingness to offer attractive financing, which, of course, affects prices.
Moreover, there can be a significant variation in the capital and operational expenditures (CAPEX and OPEX) of renewable energy projects be-tween countries. This variation is determined by: 1) the differences in installation and building costs, which depend on the cost of land, labour, and so on; 2) the asymmetries in ease of access to equip-ment; 3) the fluctuations in foreign exchange rates, affecting equipment costs; and 4) the fiscal and labour legislation that can also vary substan-tially among different jurisdictions and affect both investment and operation costs.
3
The Brazilian experience illustrates the impact of financing conditions on the outcomes of auctions. Up to 2015, the country had relied heavily on the Banco Nacional de Desenvolvimento Econômico e Social (BNDES), a state-owned social development bank, to finance winning projects that had a specified level of local content. BNDES loans typ-ically covered more than 70% of the invested capital, and the cost of debt was significantly lower than the interest rate on Brazilian Treasury bonds.
In 2015, as part of a package of fiscal austerity measures, the bank announced a stark reduction in the availability of capital for new loans of this type. With Brazil in a difficult economic and political crisis, few international banks were interested in filling the gap left by the state-owned bank. Contracts denominated in domestic currency were also seen as an obstacle for international players, especially in the face of the devaluation of the Brazilian real over the course of 2015. These developments combined to reduce the amount of financing available and to increase the cost of debt, as reflected in the auction results shown in Figures 3 and 6.
Source: Costa, 2016.
Access to finance and economic situation in BrazilBox 5

•19 •
ANALYSING 2016
Finally, the availability of renewable energy re-sources in sites that can be exploited also affects the resulting price. As shown in the cases of Ger-many (see Section 2.2) and Italy (see Section 2.3), the solar radiation and the wind speed greatly im-pact the capacity factors of solar and wind proj-ects, thereby creating the difference in prices ob-tained in various countries.
3.2. INVESTOR CONFIDENCE AND A CONDUCIVE ENVIRONMENT
Investors’ confidence in the renewable energy sec-tor and the risks faced by project developers sig-nificantly affect auction results. In cases where these risks are mitigated, investment costs can decrease substantially, resulting in lower bids. An important way to reduce investors’ risk percep-tion is to ensure that demand-side responsibili-ties will be met – usually through the presence of a reliable contract off-taker and through certainty and regularity in the scheduling of auction rounds (see Box 6). A systematic auctioning scheme also implies a learning curve effect for the auctioneer, the project developers, as well as financiers that also contributes to lower prices, as seen in India, Peru and South Africa (see IRENA and CEM, 2015, volume 3).
Investors’ confidence can be further strengthened through the mitigation of financial risks, as when public finance institutions make available to pri-vate developers risk mitigation instruments such
as guarantees, currency-hedging instruments and liquidity reserves. In Chile, for example, auction contracts are denominated in USD and adjusted periodically in line with the United States’ Consum-er Price Index, thus shielding developers from both interest-rate risks and inflation risks (see IRENA and CEM, 2015, volume 6). Auction price differenc-es among countries are notably shaped by varia-tions in the weighted average cost of capital, either in the cost of equity related to the perception of risk of the investor, or in the cost of debt related to financing conditions.
3.3. POLICY SUPPORT TO THE RENEWABLE ENERGY SECTOR
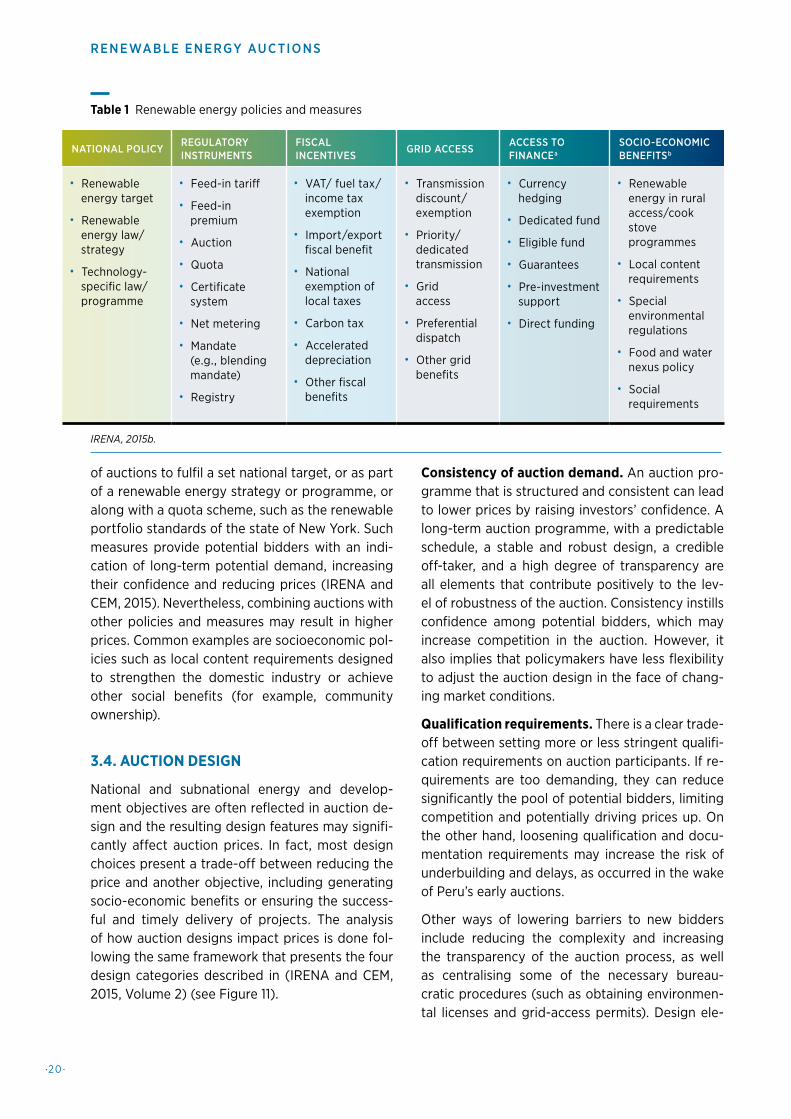
At the end of 2015, 173 countries had established renewable energy targets at the national or subna-tional level (REN21, 2016). Renewable energy tar-gets can gain credibility only if they are accom-panied by a clear strategy and backed by specific policies and measures (IRENA, 2015a). Table 1 pro-vides an overview of policies and measures that have been implemented to translate targets into projects. Many of these support schemes can be used in conjunction with auctions and can affect the resulting prices.
Auctions can, for example, be implemented to-gether with fiscal incentives. Tax breaks or import duties that reduce project costs (and thus prices), as in the United States (see Section 2.1), can pro-mote deployment. Other examples include the use
In Dubai, the results of the third phase of the Al Maktoum Solar Park (USD 29.9/MWh) were made possible largely by investors’ confidence: Saudi and Emirati institutions were very interested in submitting competitive bids to meet the Emirates’ long-term vision for solar deployment of a total capacity of 5 GW. The strategic goal of entering a promising market not only intensified the competition and encouraged low bids but also provided investors with confidence in a long-term market for renewables. Furthermore, the unique financing structure and design of the Dubai auction likely played an important role.
The project’s equity will be held jointly by the developer (40%) and the government-owned Dubai Electricity and Water Authority (DEWA, 60%). In this way, the project more closely resembles a public-private partnership pro-gram than a classical independent power producer model. DEWA’s creditworthiness and the possibility of securing favourable loan terms (including low interest rates and long tenors) played a major role in reducing auction prices, as did the United Arab Emirates’ low soft costs (land, energy, labour) and generally very low taxes.
IRENA, 2016c.
Investor confidence in Dubai in the United Arab EmiratesBox 6
•20 •
RENEWABLE ENERGY AUCTIONS
of auctions to fulfil a set national target, or as part of a renewable energy strategy or programme, or along with a quota scheme, such as the renewable portfolio standards of the state of New York. Such measures provide potential bidders with an indi-cation of long-term potential demand, increasing their confidence and reducing prices (IRENA and CEM, 2015). Nevertheless, combining auctions with other policies and measures may result in higher prices. Common examples are socioeconomic pol-icies such as local content requirements designed to strengthen the domestic industry or achieve other social benefits (for example, community ownership).
3.4. AUCTION DESIGN
National and subnational energy and develop-ment objectives are often reflected in auction de-sign and the resulting design features may signifi-cantly affect auction prices. In fact, most design choices present a trade-off between reducing the price and another objective, including generating socio-economic benefits or ensuring the success-ful and timely delivery of projects. The analysis of how auction designs impact prices is done fol-lowing the same framework that presents the four design categories described in (IRENA and CEM, 2015, Volume 2) (see Figure 11).
Consistency of auction demand. An auction pro-gramme that is structured and consistent can lead to lower prices by raising investors’ confidence. A long-term auction programme, with a predictable schedule, a stable and robust design, a credible off-taker, and a high degree of transparency are all elements that contribute positively to the lev-el of robustness of the auction. Consistency instills confidence among potential bidders, which may increase competition in the auction. However, it also implies that policymakers have less flexibility to adjust the auction design in the face of chang-ing market conditions.
Qualification requirements. There is a clear trade-off between setting more or less stringent qualifi-cation requirements on auction participants. If re-quirements are too demanding, they can reduce significantly the pool of potential bidders, limiting competition and potentially driving prices up. On the other hand, loosening qualification and docu-mentation requirements may increase the risk of underbuilding and delays, as occurred in the wake of Peru’s early auctions.
Other ways of lowering barriers to new bidders include reducing the complexity and increasing the transparency of the auction process, as well as centralising some of the necessary bureau-cratic procedures (such as obtaining environmen-tal licenses and grid-access permits). Design ele-
Table 1 Renewable energy policies and measures
IRENA, 2015b.
NATIONAL POLICYREGULATORY INSTRUMENTS
FISCAL INCENTIVES
GRID ACCESSACCESS TO FINANCEa
SOCIO-ECONOMIC BENEFITSb
• Renewable energy target
• Renewable energy law/ strategy
• Technology-specific law/ programme
• Feed-in tariff
• Feed-in premium
• Auction
• Quota
• Certificate system
• Net metering
• Mandate (e.g., blending mandate)
• Registry
• VAT/ fuel tax/ income tax exemption
• Import/export fiscal benefit
• National exemption of local taxes
• Carbon tax
• Accelerated depreciation
• Other fiscal benefits
• Transmission discount/exemption
• Priority/ dedicated transmission
• Grid access
• Preferential dispatch
• Other grid benefits
• Currency hedging
• Dedicated fund
• Eligible fund
• Guarantees
• Pre-investment support
• Direct funding
• Renewable energy in rural access/cook stove programmes
• Local content requirements
• Special environmental regulations
• Food and water nexus policy
• Social requirements

•2 1 •
ANALYSING 2016
Choice of the auctioned volume and the way it is Shared betweendierent technologiesand project sizes
Minimunrequierementsfor participantsin the auction
Specific rulesto ensure high
implementation rateof awarded projects in
a timely manner
How the informationis collected and the
winner is selected
QUALIFICATIONREQUIREMENTS
SELLERS
‘
LIABILITIES
WINNERSELECTION
AUCTIONDEMAND
Figure 11 Categories of auction design elements
ments that can contribute to lower prices include the government assuming responsibility for some tasks, such as resource assessments, site selection and grid connection. This is the example offered by auctions in Dubai and Zambia, where project developers are shielded from certain risks because the auctioneer is responsible for choosing the proj-ect site and securing all necessary documentation.
In the implementation of local content require-ments, there is a trade-off between developing a local industry (along with benefits such as job cre-ation and improved trade balance) and achieving lower prices. For example, as explained in Sec-tion 2.1, South Africa’s high prices can be explained by the fact that the country’s auction design em-phasised domestic content requirements and so-cial development. This made it more costly to pro-vide the energy services being auctioned and more difficult for international companies to participate, but also reflected the importance of South Africa’s priorities in terms of development goals.
Winner selection for minimum price. It is quite common to find auction designs that give impor-
tance to non-price objectives such as project loca-tion, domestic industry development, and the de-veloper’s experience and reputation. Nevertheless, there are just as many ways to use the design to minimise prices, such as by imposing a lower price ceiling. Other elements that can affect the result-ing price are whether the auction adopts a pay-as-bid or pay-as-cleared rule and whether it imposes potentially costly constraints on winning projects (such as an upper limit on the project size to en-courage small/new players into the market that could deter economies of scale).
Liabilities on investors. When investors are ex-empt from risks such as production uncertainty, delays in delivering the project, and fluctuations in spot price, currency, or inflation, they can incorpo-rate a lower risk premium into their bid. If risks are deemed too high, they may refuse to participate at all. However, reducing risks to investors typically implies that consumers will bear them instead, and if penalties are too lenient, investors may not be incentivised to do all they can to avoid delays and underbuilding.
•22 •
RENEWABLE ENERGY AUCTIONS
13. Based on the Levelised Cost Of Electricity (LCOE), which is a measure of the total cost to produce electricity, including capital costs, operating and maintenance costs, and the fuel costs. It can be calculated as the ratio of lifetime costs to lifetime electricity generation, both discounted back to a common year using a discount rate.
Another important aspect that influences the price results of the auction lies in the auctioned contract and the resulting revenue streams. In some cases, the auctioned contract price may give a mislead-ing indication of the total remuneration of the in-vestor over the project’s lifetime. One way to com-pare the remuneration level of different auctioned contracts is by calculating an average levelised cost13 of the contract’s remuneration over its life-time, recognising that revenue typically varies in real terms over the duration of the contract. De-pending on the contract’s rules for determining effective remuneration over the project’s lifetime, this levelised contract revenue can be significant-ly different from the price awarded at the auction. This is the case with Indian contracts not indexed for inflation, which result in decreasing remuner-ation over time, as explained in Section 2.1. Also, the ongoing auctions in Abu Dhabi are an inter-esting case of innovative design elements that di-verge the remuneration profile of the project from the actual bid submitted (see Box 7).
Finally, the lead times of projects can affect the prices offered. It is possible in auctions with long lead times for investors to speculate on a further decrease in investment costs between the time they submit their bids and when they effectively execute the project, as in the case of Brazilian A-5 auctions. However, this type of strategy can be a double-edged sword: On one hand, the expecta-tion of lower costs enables more competitive bids and contributes to cheaper renewable energy, but, on the other, it may force the project developers to make an offer that is not economically viable if their projections do not materialise. Such down-side scenarios could lead to delays and cancella-tion of projects and, in more generally, harm the industry’s sustainability.

•2 3 •
ANALYSING 2016
In September 2016, the Abu Dhabi Water and Electricity Company (ADWEA) received proposals for its solar auc-tion, the official results of which are to be announced in first quarter of 2017. On the auction closing date, the lowest bid of USD 24.2/MWh was received, followed by bids of USD 25.3/MWh and USD 26/MWh. These prices represent an almost 20% decrease from the previous record of USD 29.9/MWh attained in Dubai’s most recent solar auction.
One relevant design innovation is that energy delivered from June to September, when Abu Dhabi’s generation capacity is currently barely able to cover air conditioning demand, counts for 1.6 times as much as energy delivered from October to May. Therefore, the bids do not reflect the actual remuneration of the project.
Incorporating the extra remuneration for the summer period and making additional assumptions, an estimate of the agents’ true remuneration compared to the amount bid in the auction is illustrated in Figure 12. The exact payment details are in the individual bid and are not available. But it is still possible to observe that the seemingly unprecedented bid of USD 24.2/MWh is comparable to the bids received in recent solar power tenders in Dubai, as the agent would be remunerated according to a flat contract price of approximately USD 29.4/MWh without the summer months’ premium.
Source: BNEF, 2016b.
Figure 12 Abu Dhabi’s solar auction: bid submitted vs. actual remuneration
Remuneration profile in Abu Dhabi in the United Arab Emirates
0
5
10
15
20
25
30
35
40
45
50
Actual remunerationBid submited
43.5
36.437.7
30.9
35.5
29.231.4
26
30.8
25.3
29.4
24.2
USD
/MW
hBox 7

•24 •
RENEWABLE ENERGY AUCTIONS
THE WAY FORWARD IN PLANNING AND DESIGNING AUCTIONSThe steep downward trend in renewable ener-gy prices resulting from recent auctions suggests that a transition towards renewable and sustain-able power systems is already economically justi-fiable and feasible. This brief shows the impressive reduction in auction prices for solar PV and wind and analyses the factors that explain these trends. While increased price competitiveness is a major driver of deployment, understanding the reasons behind the recent low prices is important to better inform policy makers.
The low prices attained do not always reflect the true remuneration profile of the auction. Several elements – such as additional financial support, indexed contracts, and additional remuneration during periods of peak demand – can result in in-vestors receiving a higher remuneration than the nominal auctioned price. Nevertheless, even after correcting for these factors, there is a major con-cern among both policy makers and industry play-ers that auctions may be underestimating the true costs of renewable energy. This is because auc-tion prices do not factor for the balancing costs of renewable energy and also due to a potential “winner’s curse”, whereby the winner of the auc-tion faces negative profits. The winner’s curse can result from overly aggressive bidding in the com-petitive environment of the auction, which could pose a significant risk of underbuilding and delays, with serious repercussions on the sector on the long run.
Delays and underbuilding can be avoided if the auctioning mechanism and awarded contract are solid, penalties are credible and enforceable, and the country has a reasonable degree of legal and regulatory stability. The same best practices would also minimise the adoption of overly aggressive bidding strategies by suppliers. However, stringent compliance rules may deter the participation of small and/or new players, which is another well-known weakness of auctions, given their relative-ly high associated transaction costs for both the bidders and the auctioneer. The extent to which this may affect the results of an auction depends on choices regarding its design elements and how well adapted they are to the country’s specific con-text in terms of economic situation, structure of the energy sector, maturity of the power market and level of renewable energy deployment.
The complex and dynamic environment of renew-able energy auctions motivates constant innova-tion in the mechanisms’ design. In this context, the assessment of previous implementations and the most recent experiences is crucial. It is also essen-tial that the industry take solid steps towards ma-turity, relying on sustainable economic practices, so as to maintain the attractiveness of investments and to encourage the participation of new players in the sector.
4

•2 5 •
A GUIDE TO DESIGN
REFERENCES
Bailey,D. (2016), “Ontario wind auction push-es down prices”, Wind Power Monthly, 10 March 2016, www.windpowermonthly.com/article/1386944/ontario-wind-auction-push-es-down-prices
BloomBerg (2015), Brazil Approves Higher Auc-tion Rate for Solar and Wind Energy, 13 Oc-tober 2016, www.bloomberg.com/news/articles/2015-10-13/brazil-approves-higher-auc-tion-rate-for-solar-and-wind-energy
BNeF (Bloomberg New Energy Finance) (2016a), “Peru Clean-Power Developers Offered Record Low Prices in Auction”, retrieved from BNEF (subscription required).
BNeF (2016b), “Abu Dhabi sets new solar record of USD 24.2/MWh – or does it?” retrieved from BNEF (subscription required).
BNeF (2016c), Global Auction Results Q2 2016, retrieved from BNEF (subscription required).
BierzwiNsky, r. aND Felix, J. (2016), “Mexico: Sec-ond Power Auction Results”, Project Finance News, 29 September 2016, www.pfnewswire.com/2016/09/mexico-second-power-auc-tion-results.html
Costa, l. (2016), “Cut in subsidies to make Bra-zil power costlier but more efficient”, Reuters, 20 July 2016, www.cnbc.com/2016/07/20/re-uters-america-cut-in-subsidies-to-make-bra-zil-power-costlier-but-more-efficient.html
Dezem, V. aND martiNez, s. (2016), “Wind Is the Cheapest Power Source in Argentina Re-newable Auction”, Bloomberg, 1 October 2016, www.bloomberg.com/news/arti-cles/2016-09-30/wind-is-the-cheapest-power-source-in-argentina-renewable-auction
eBerharD, a. aND kåBerger, t. (2016), Renewable energy auctions in South Africa outshine feed-in tariffs, Energy Science & Engineering, www.gsb.uct.ac.za/files/REAuctionsInSA.pdf
esCritt, t. (2016), “Shell-led consortium wins 700 MW Dutch offshore wind contract”, Reuters, 12 December 2016, www.reuters.com/article/us-dutch-wind-idUSKBN14125N
iFC (iNterNatioNal FiNaNCe CorporatioN) (2016), “Scaling Solar Delivers Low-Cost Clean Energy for Zambia”, June 2016, www.ifc.org/wps/wcm/connect/news_ext_content/ifc_ex-ternal_corporate_site/news+and+events/news/scaling+solar+delivers+low+cost+clean+ener-gy+for+zambia
ireNa (2017), forthcoming, Renewable Energy Auctions: Analysing 2016, IRENA, Abu Dhabi.
ireNa (2016a), Renewable Capacity Statistics 2016, IRENA, Abu Dhabi. www.irena.org/Docu-mentDownloads/Publications/IRENA_RE_Ca-pacity_Statistics_2016.pdf.
ireNa (2016b), The Power to Change: Solar and Wind Cost Reduction Potential to 2025, IRE-NA, Abu Dhabi. www.irena.org/Document-Downloads/Publications/IRENA_Power_to_Change_2016.pdf
ireNa (2016c), Renewable Energy Market Analysis: The GCC Region, IRENA, Abu Dhabi, www.irena.org/DocumentDownloads/Publica-tions/IRENA_Market_GCC_2016.pdf.
ireNa (2015a), Renewable Energy Target Setting, IRENA, Abu Dhabi. www.irena.org/Document-Downloads/Publications/IRENA_RE_Target_Setting_2015.pdf
ireNa (2015b), Renewable Energy in Latin America 2015: An Overview of Policies, IRENA, Abu Dhabi. www.irena.org/DocumentDown-loads/Publications/IRENA_RE_Latin_Ameri-ca_Policies_2015.pdf
ireNa (2014), Adapting Renewable Energy Policies to Dynamic Market Conditions, IRENA, Abu Dhabi. www.irena.org/DocumentDown-loads/Publications/policy_adaptation.pdf

•26 •
RENEWABLE ENERGY AUCTIONS
ireNa (2013), Renewable Energy Auctions in Developing Countries, IRENA, Abu Dhabi. www.irena.org/DocumentDownloads/Publica-tions/IRENA_Renewable_energy_auctions_in_developing_countries.pdf
ireNa aND Cem (CleaN eNergy miNisterial) (2015) Renewable Energy Auctions: A Guide to Design, IRENA, Abu Dhabi, www.irena.org/Document-Downloads/Publications/Renewable_Energy_Auctions_A_Guide_to_Design.pdf
keNNiNg, t. (2016), “Ontario’s 140MW solar auction sees average price of US$0.12/kWh”, PV Tech, 11 March 2016, www.pv-tech.org/news/grid-par-ity-in-ontarios-140mw-solar-auction
mahapatra, s. (2016a), “Dubai Gets Record-Low Bid Of 2.99¢/kWh For 800 MW Solar PV Project”, Clean Technica, 2 May 2016, https://cleantechnica.com/2016/05/02/lowest-solar-price-dubai-800-mw-solar-project/
mahapatra, s. (2016b), “China Gets its Lowest Solar Bid Yet, in 1 Gigawatt Solar Auction in Inner Mongolia”, Clean Technica, 3 October 2016, https://cleantechnica.com/2016/10/03/china-gets-lowest-solar-bid-yet-1-gigawatt-so-lar-auction-inner-mongolia/
mNre (miNistry oF New aND reNewaBle eNergy) (2016), “Status of implementation of vari-ous schemes to achieve 1,00,000 MW Solar Plan”, Government of India, http://mnre.gov.in/file-manager/UserFiles/GW-Solar-Plan.pdf
morais, l. (2016), “Biomass projects of 198 MW win contracts in Brazil’s latest auction”, SeeNews Renewables, 1 March 2016, http://renewables.seenews.com/news/bio-mass-projects-of-198-mw-win-contracts-in-bra-zils-latest-auction-523251
NewBase (2016), “Rosatom submits 600-MW wind plans”, 9 June 2016, http://newsbase.com/top-stories/rosatom-submits-600-mw-wind-plans
osiNergmiN (2015), Official Auction Document, www.osinergmin.gob.pe/
parkiNsoN, g. (2016), “New Low For Wind Energy Costs: Morocco Tender Averag-es $US30/MWh”, Clean Technica, 18 January 2016, https://cleantechnica.com/2016/01/18/new-low-for-wind-energy-costs-morocco-ten-der-averages-us30mwh/
pV magaziNe (2016a), “Renewables sweep Chile’s electricity market and set historic low prices”, 17 August 2016, www.pv-magazine.com/2016/08/17/renewables-sweep-chil-es-electricity-market-and-set-historic-low-pric-es_100025801/
pV magaziNe (2016b), “Germany’s fifth solar auc-tion allocates 130 MW to 25 projects”, 5 August 2016, www.pv-magazine.com/2016/08/05/ger-manys-fifth-solar-auction-allocates-130-mw-to-25-projects_100025687/
reN21 (reNewaBle eNergy Network For the 21st CeNtury) (2016), Renewables 2016 Global Status Report, Paris, www.ren21.net/gsr
shahaN, z. (2016), “Low Solar Prices Scaring Companies Away From Solar Auctions”, Clean Technica, 27 July 2016, https://cleantech-nica.com/2016/07/27/low-solar-prices-scar-ing-companies-away-solar-auctions/
strategy & (2016), 2a Subasta de Largo Plazo, Reflexión sobre el proceso y los resultados.
suBmitter, moNtmassoN-Clair, aND Das Nair (2015), The Importance of Effective Economic Regulation for Inclusive Growth: Lessons from South Africa’s Renewable Energy Programmes, https://ssrn.com/abstract=2716051 or http://dx.doi.org/10.2139/ssrn.2716051
VatteNFall (2016), “Vattenfall wins tender to build the largest wind farm in the Nordics”, 9 September 2016, https://corporate.vattenfall.com/press-and-media/press-releases/2016/vattenfall-wins-tender-to-build-the-largest-wind-farm-in-the-nordics/

•27•
ANALYSING 2016

RENEWABLE ENERGY AUCTIONS ANALYSING 2016EXECUTIVE SUMMARY
© IRENA 2017
IRENA HEADQUARTERS
P.O. Box 236, Abu Dhabi
United Arab Emirates
www.irena.org