Embed Size (px)
Citation preview

Renewable Natural Gas Clean-upp Challenges and Applications
Renewable Resource Workshop January 13, 2011 Washington, D.C. Brian Weeks, Gas Technology Institutegy 281 235 7993, [email protected]

2
Today’s Talk Today s Talk
>Who is GTIWho is GTI >What is Renewable Natural Gas (RNG)
Ch ll f R bl N t l G >Challenges for Renewable Natural Gas >How do we clean up RNG? >Recommendations and Summary
2

- -
3
GTI at a Glance…
> Not-for-profit research > Not for profit research, with 65+ year history
> Facilities 18 Chi─ 18 acre campus near Chicago
─ 200,000 ft2, 28 specialized labs
$60 illi> $60 + million iin revenue > Staff of 250 Flex-Fuel
Test Offices> A ggrowingg business FacilityFacility && Labs > Commercial partners take
our technologies to market
3
Energy & Environmental Technology Center

as or a
Gas Quality and RNG Clean-up A Sustainable Gas Network Will Include Renewable Sources
Gas Distributors increasingly asked to accept renewable gasto accept renewable gas.
Pipeline tariffs generally don’t address “trace” constituents.
Existing clean-up methods are generally intended for on-site use.
Little data on impact of constituents on pipelines or end use equipment
Gas quality research also important for unconventional shale gas supplies. National Grid Rene able G “Vision f National Grid, Renewable Gas, “Vision for a sustainable gas network”, 2010
4

5
Renewable Natural Gas is…Renewable Natural Gas is…
> Methane pproduced from diggesters
─ Animal manure (dairy cows, swine)
─ Waste water treatment facilitiesWaste water treatment facilities
> Methane from Landfills
>> RNG produced from thermal chemical processes likeRNG produced from thermal chemical processes like gasification utilizing renewable feed-stocks including forest residues and agricultural wastes.
RENEWABLE NATURAL GAS CAN BE CLEANED-UP AND PLACED IN THE NATURAL GAS PIPELINE SYSTEM
5

6
GTI RNG Projject Exampples
>Example GTI Projects: ─Gills Onions—Anaerobic digestion of agricultural waste
for on-site electricity generation
─Altamont Landfill—Landfill gas (LFG) cleanup for production of liquefied natural gas (LNG) for vehicle fuel
─Ft. Lewis —Anaerobic digestion of waste water for production of hydrogen as a fuel cell vehicle fuel
─SCRA * – Landfill gas (LFG) cleanup and on-site reformation to generate hydrogen for MHE in S.C.
6
*Project pending final authorization
7
Difference between “Conventional GGas and “R d “Renewable NNatural G l Gas”” bl t
>Conventional gas is 95% - 98% methane (CH4)*Conventional gas is 95% 98% methane (CH4) ─ Constituents are well understood ─ Utilityy and Interstate pippeline tariffs account for typicalp yp
components ─ Methods for treating “raw” gas are proven and in-place
>RNG is also 95% - 98% methane* ─ Constituents are not as well understood ─ Utility and Interstate pipeline tariffs don’t typically
address all components ─ Methods for treating “raw” biogas can be costly Methods for treating raw biogas can be costly
7
*Post clean-up. Methane percentage could be lower in some cases

8
Existing Technologies Can and Do remove ttrace constit tituents ffrom RNGt RNG
> CO2 & O2 found at % to ppm level concentrations. Tariff li it t i l 1 2% (CO & 0 2% O limits typical 1-2% (CO2 & 0.2% O2
> Sulfur Compounds (H2S). Typical tariff is 0.25 grain/100SCF for H2S and 1 grain/100scf total sulfur for H2S and 1 grain/100scf total sulfur
> Inerts (N2, He ) and H2
> Halocarbon comppounds > Volatile Organics (BTEX, aldehydes, ketones) > Ammonia / Amines > Siloxanes > Mercury and Other Elementals > Bacteria and MIC
8

9
Focus Areas for Improvement RRenewabl ble NNattural Gas Utili Utilizationl G ti
>Supply Stabilityy: Variability in compposition & supp y pplypp y y >Impact on Infrastructure / Pipeline integrity: CO2,
water, H2 sulfur compounds, NH3 bacteria, etc. 2 3
>Impact on end use applications: ─ CO2, CO, H2 > flame stability, engine knock,
>Safety – Odorization & leak detection >Contaminant Dispposal – Cleanupp media ggenerallyy
not recyclable >Little Analysis has been performed on biogas for
fuel cell applications 9

10
Supply StabilitySupply Stability
>Volume variabilityyintroduces processconfiguration challenges
>Constituents can varyseasonally – or even more frequentlymore frequently
>Most stable supplies aredairy and swine yardsdairy and swine yards
Daily WWDG Variability on a GTI ongoing project Daily WWDG Variability on a GTI ongoing project
10

t
11
Why Treat RNG? Impact on Pipeline InfrastructureImpact on Pipeline Infrastructure
>Acid formation from sulfur compounds, carbonic acids,halocarbons or certain bacteria, promoting corrosionpromoting corrosion
>Deposits from contaminants E i i f VOC’ i d d>Emissions from VOC’s introduced into pipeline
>Water collection >Water collection
11

12
Why Treat RNG? IImpactt on EEnd U d Use AAppli licati tions
>Gas heating value / Wobbe number diminished by inerts in gas stream
>Deposits from contaminants >Emissions from VOC’s introduced into pipeline Emissions from VOC s introduced into pipeline >NOx formation from ammonia compounds
12
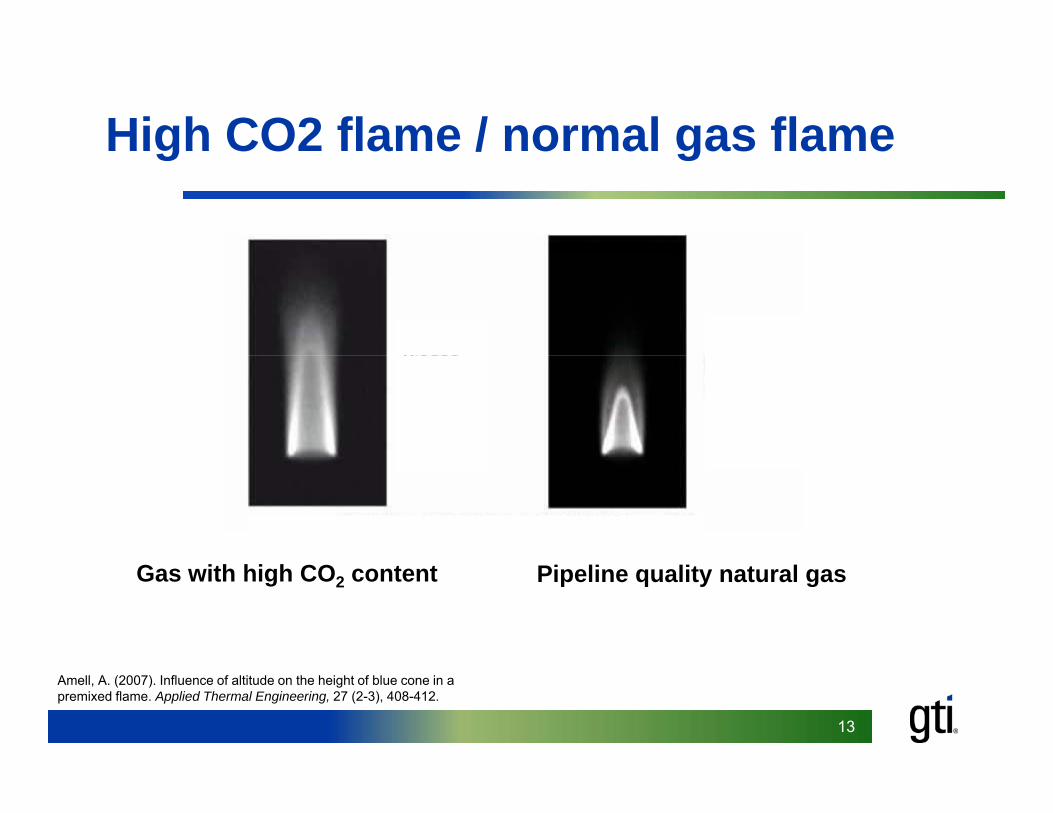
High CO2 flame / normal gas flameHigh CO2 flame / normal gas flame
Gas with high CO2 content Pipeline quality natural gas
13
Amell, A. (2007). Influence of altitude on the height of blue cone in a premixed flame. Applied Thermal Engineering, 27 (2-3), 408-412.

Normal gas flame / High H2/CO flameNormal gas flame / High H2/CO flame
14
H. Levinsky, KEMA, University of Groningen, The Netherlands
15
Why Treat RNG? IImpactt on FFuel C l Cell A ll Appli licati tions
>Imppact on Reformer
>Impact on Fuel Cell ─ VOC’s – Coking ─ Sulfur compounds – catalyst contamination ─ Siloxanes – silica compounds can coat fuel cell component
surfacessurfaces ─ Halogens (Chlorine, flourine, etc) – poison catalyst ─ Mercury and other elementals - catalyst poison and stack
contaminant
15

16
Now that we understand the problem,Wh t’ th l ti ?What’s the solution?
>Hydrogen generation system from RNG willHydrogen generation system from RNG will consist of three key components ─ Renewable natural gas cleanup system (H2S, CO2,
H2O removal) 2 2
─ Biomethane reformation system (Steam-methane reformation 75 80% efficient) reformation—75-80% efficient) ─ Hydrogen Purification (remaining impurities
removed including CO, CO2,CH44))removed including CO, CO2,CH
16

Illustrative Process Flow Diagram for On-site H2 Supply System
& SOFC Power Generation (Hydrogen Fuel Production at 50kg/day) Electricity
Compression CO2 NOx, 12.5 kW to move ADG products of Hydrogen Gas thru clean-up combustion
(5,800,000 Btu)
50 kg H2/day
21.5 kW
(14.4 scfm)
Tailgas Recovery Tailgas Recovery CH4: ~13% CO2: ~35% CO: ~1% H2: ~51% Flow: 17.3 scfm
ADG
Recycled waste gas from
PSA used to heat reformer Hydrogen gas
PSA
Water-Gas Shift
Reactor
Steam Reformer Compressor Gas Clean-up
System Fuel cell
ADG Plant
Reformate
Feed Water
application
RNG Supply: CH4: ~55% Conditioned
Reformate CH4: ~7% CO : ~19%
Solid waste 4
consists of gas N2:~3.5% clean-up filters CO2: ~2%
& absorbents (mostly sulfur
30 ppm H2S compounds). N2:~5% No liquid No liquid
Air
3 gph
Reformer’s Usable Heat
CO2: ~38% O2: ~0.5%
Other: ~3%
Fl t
Gas CH4: ~89%
O2: ~0.8%
Other:~3 2% effluents will be 0.01ppm H2S created. Some
(17.5 to H2, vented CO2
Usable Heat 5,000 Btu/hr
Flow rate: ~19.0 Mcf/day
1.5 to SOFC) 13.2 scfm
Other:~3.2%
8.0 scfm Flow rate:
~ 2.9 scfm (
PSA: ~ 31.7scfm)
Usable Heat
Electricity
CO2: ~19% CO: ~0.5% H2: ~73.5 Total Flow: ~34.6 scfm (SOFC:
17

t
18
EExamplle GGas Cl Cleanup System ffor WWDGS WWDG > Configured a gas cleanup system utilizing a membrane
module for CO separation after H S removal module for CO2 separation after H2S removal ─ Passive system – no moving parts, for increased reliability ─ Ease of operation – virtually no maintenance requirements ─ Ease of Installation – modular and lightweight and can be operated at wide
turndown ratio
FlFlare Gas
18
To Reformer

19
GTI’s current project initiatives GTI s current project initiatives
>Developp baseline for ex ppected levels of various constituents in landfills
>Analyze clean-up techniques (membrane, reactants, and PSA).
>Future work: ─ Develop understanding of impact each constituent has
on pipeline operations and end use applications ─ Provide data to gas utilitiesProvide data to gas utilities
>Utilities and Pipelines to take data and establish sppecification for their syystems
19
20
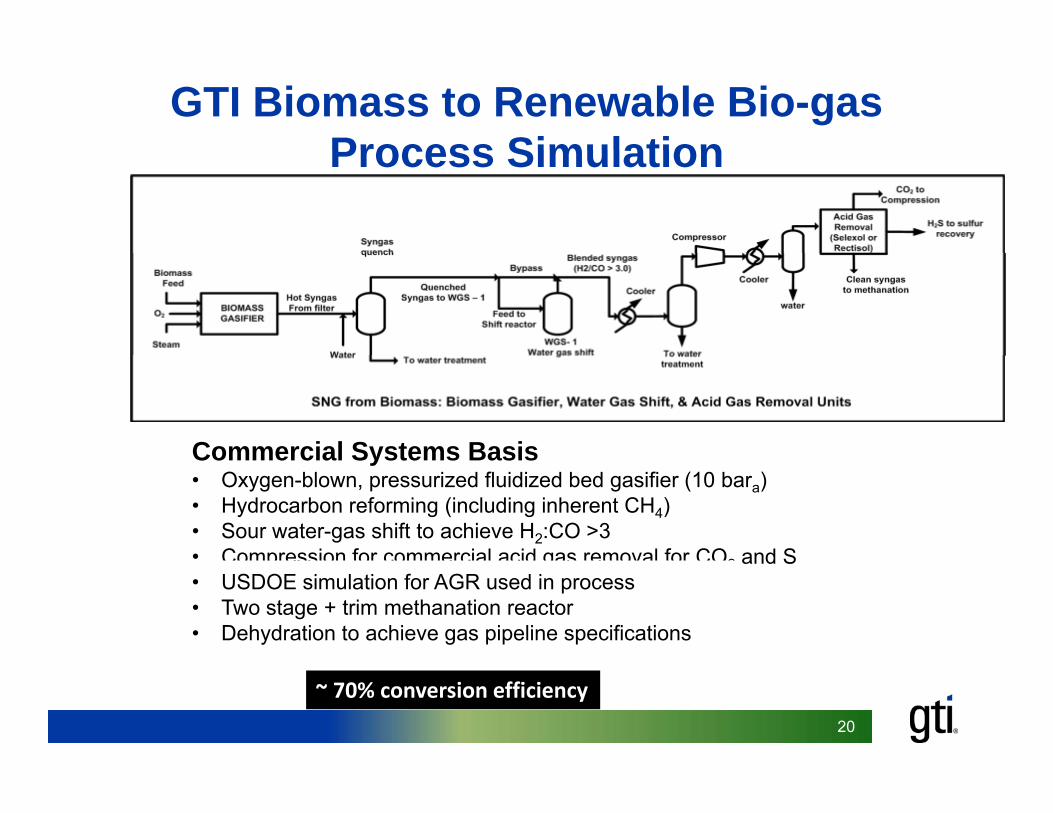
GTI Biomass to Renewable Bio-gas Process SimulationProcess Simulation
Commercial Systems BasisCommercial Systems Basis • Oxygen-blown, pressurized fluidized bed gasifier (10 bara) • Hydrocarbon reforming (including inherent CH4) • Sour water-gas shift to achieve H2:CO >3 • Compression for commercial acid gas removal for COCompression for commercial acid gas removal for CO22 and S and S • USDOE simulation for AGR used in process • Two stage + trim methanation reactor • Dehydration to achieve gas pipeline specifications
~ 70% conversion efficiency
20

21
Removal of Trace Constituents Th T h l i h d t d ti The Technology is here –need cost reduction
>Volatile Orgganics ─ Zeolites ─ Silica gel / adsorbents
>Sulfur compounds ─ Activated carbon
Zi id─ Zinc oxide ─ Other – biofiltering, hydro desulfurization
>>SiloxanesSiloxanes ─ Adsorption on activated carbon bed ─ Absorpption in solvents
21
─ Adsorption on polymorphous graphite

22
R&D RecommendationsR&D Recommendations
> Developp resource baseline data to better understand diggester ggas and landfill gas production (volumetric and constituent variability and availability)
> Initiate data analysis for operation of end use equipment (including fuel cell) with
various levels of contaminants found in biogas to establish operating
parameters.
> Develop recycling technologies for gas clean-up techniques that can reduce
O&M costs.
P f i l i i l d li i f bl l> Perform economic analysis on optimal end-use application for renewable natural
gas; vehicle fuel, pipeline injection, electricity generation, etc.
> Build pilot gasification plant utilizing bio feedstock> Build pilot gasification plant utilizing bio-feedstock
22
23
Summary Energy Summary
> Renewable Natural Gas Environment Economy
─ Other than wind and solar, may be the lowest carbon renewable fuel available today
── RNG is being successfully injected into pipeline supply at RNG is being successfully injected into pipeline supply at over two dozen sites in the U.S.
─ Additional analysis can help to reduce clean-up costs by better understanding constituent components and theirbetter understanding constituent components and their potential impact on pipeline operations and consumers.
─ Need to reduce costs of clean-up methods.
─ Can play a major national role in reducing carbon emissions and meeting renewable goals if incentives comparable to those for other renewable energy sources are enacted
23

Thank yyou for beingg interested in clean, reliable energy!
For more information:
Brian Weeks Phone: 281 235-7993 [email protected]
24