Embed Size (px)
Citation preview
RENEWABLERESOURCES
JOURNAL
VOLUME 32 NUMBER 4
CONTENTS
Perspective:Iowa Fails Sustainable Agriculture Test.......................................................2Dennis Keeney
Environmental Impact of the Deep-Water Oil and Gas Industry................8Erik E. Cordes et al.
Western States Conservation Scorecard: An Analysis of Landsand Energy Policy Across the West...........................................................20Center for Western Priorities
Announcements........................................................................................29

Volume 32 Number 4 Renewable Resources Journal 2
Perspective:
Iowa Fails Sustainable Agriculture Test
Dennis Keeney
On April 17, 2017, Terry Branstad, the governor ofIowa (now ambassador to China), signed intolegislation, language that eliminated the LeopoldCenter for Sustainable Agriculture. Only the namesurvived to protect a large endowment. Coinci-dentally, Gov. Branstad signed the legislationestablishing the Center almost 30 years earlier.Elimination of the Center, loss of its space and firingof the staff except for two tenured administrators,shut down an institution we had built, with the helpof farmers, faculty, professionals, and students; aninstitution that was the pride of Iowa. I feel this lossdeeply.
Why Did This Happen?
The closing of the Leopold Center was political.Conventional wisdom is that the legislation that led toits demise was advanced by agribusiness and chemical
interests in Iowa. These same interests stronglyopposed establishment of the Center in 1987. Thisarticle tells the story about how the Leopold Centerwas able to advance the cause of sustainableagriculture during its 30 years.
Beginnings of Sustainability Discussions
The concept of sustainability was first introduced intocommon thought by the 1972 United NationsConference on the Human Environment. Delegatesrecognized the conflict between economicdevelopment based upon sustained growth and theenvironmental threats that accompany it, includingglobal climate change. In 1984, the U.N. establishedthe Brundtland Commission which sought creation ofan organization independent of the U.N. to foster aunited international community with sharedsustainability goals. Their findings appeared in thepublication “Our Common Future.” The first volumewas published in 1987. It was widely cited andcriticized.
The commission defined sustainable development as“development that meets the needs of the presentwithout compromising the ability of futuregenerations to meet their own needs.” This is themost widely accepted definition of sustainability. Thisdefinition has been widely debated and remainscontroversial today.
There are three pillars of sustainable development:• Economic growth• Environmental protection• Social equity
These pillars overlap, are global in scope, and must beconsidered together. The commission reports formedthe basis of the 1992 and 2002 Earth Summits. Muchof the early discussion leading to the commission’s
Dennis Keeney was the first director of the LeopoldCenter for Sustainable Agriculture in Ames, Iowa(1988-2000). He also served as the president of theSoil Science Society of America (1988) and theAmerican Society of Agronomy (1993).
Keeney received a B.S. in agronomy at Iowa StateUniversity, a M.S. at the University of Wisconsin-Madison in soil science and a Ph.D. at Iowa State,specializing in soil and water chemistry andbiochemistry. In 1966 he accepted a tenure trackposition at the Department of Soil Science at theUniversity of Wisconsin-Madison. He retired from theLeopold Center in 2000 and is professor emeritus ofagronomy and agricultural and biosystemsengineering at Iowa State University. He remainsactive in writing about environmental issues andsustainable agriculture. He is a board member of Food& Water Watch in Washington, D.C.

Volume 32 Number 4 Renewable Resources Journal 3
findings was based upon the foodneeds of poor countries. Thus,agriculture was central to thedebates.
The sustainability concept, whilegenerally accepted in the 1980’s,was found difficult to implement.The economics did not fit in withthe Reagan-Thatcher neo-liberaleconomic concepts adopted bymany Western nations. Manyindustries, including agriculture,saw sustainable agriculture asundermining their bottom line.Environmental concerns such aswater quality and global warmingdid not concern agriculturalistswho did not believe the concernsof environmentalists. Rich andpoor countries had differentdevelopmental goals. It was fareasier to delay the food debate by“feed the world” slogans thatwere applied to rich countries asthey continued their extractiveways of farming. An examplewere the bitter argumentsbetween Norman Borlaug andAfrican agricultural NGO leadersover organic versus conventionalWestern agriculture in Africanfood production.
The Battle Lines were Drawn
Many Iowa political and farming leaders were following the international debates with increasing interest andsome were convinced that Iowa was following a growth pattern that was not sustainable. Soil loss wasincreasing, farmers were leaving the land, animal waste pollution was increasing, and widespread tillage andfertilizer overuse (using recommendations provided by Iowa State University) were adding to the nitrogen andphosphorus content of drainage waters. About 13 million of Iowa’s 30 million farming acres were tiled. Over halfof Iowa’s land is in corn, a highly erosive crop with high fertilizer and energy demands. The other half is insoybeans, another highly erosive crop. Today, close to half of this corn goes into ethanol production. Much ofthe remainder is fed to swine and chickens. So much for feeding the world. Estimates of soil loss exceeded 20tons per acre per year on many soils, greatly exceeding the “sustainable” loss rate of 5 tons per acre. Soil qualitycontinued to degrade because the two-crop rotation gave little opportunity for the soil to recover.
Drainage tiles along with diesel power and fertilizers (particularly nitrogen, produced by former WWII explosivefactories) and pesticides (derived from the nerve gas poisons of WWII), set Iowa up to be one of the world’spowerhouses in grain and meat production. Over the years, rules and regulations were established to encourageindustrial approaches to animal and grain agriculture. Each “advance” led to increased farm size with
Renewable Natural Resources Foundation
The Renewable Natural Resources Foundation (RNRF) is a nonprofit, public policy researchorganization. Its mission is to advance the application of science, engineering and design indecision-making, promote interdisciplinary collaboration, and educate policymakers and thepublic on managing and conserving renewable natural resources. Member organizations are:
American Geophysical Union ⬩ American Meteorological SocietyAmerican Society of Civil Engineers ⬩ American Society of Landscape Architects Fund
American Water Resources Association ⬩ Geological Society of AmericaSociety of Environmental Toxicology and Chemistry
RNRF Board of Directors
Renewable Resources JournalRenewable Resources Journal (ISSN 2578-3998) is published quarterly by the RenewableNatural Resources Foundation, 6010 Executive Blvd, 5th Floor, North Bethesda, MD20852-3827, USA. Tel: +1 301 770 9101. Email: [email protected]: https://www.rnrf.org© RNRF 2018.Annual digital subscription rate is $20. RNRF assumes no responsibility for statements andopinions expressed by contributors. Permission is granted to quote from the journal with thecustomary acknowledgement of source.Editorial Staff: Robert D. Day, editor; Attiya Sayyed, assistant editor; Amber Lee Todoroff,assistant editor.
Chairman:Richard A. EngbergAmerican Water Resources Association
Vice Chairman:John E. DurrantAmerican Society of Civil Engineers
Executive Director:Robert D. Day
Directors:
Sarah GerouldSociety of Environmental Toxicologyand Chemistry
Paul HigginsAmerican Meteorological Society
Lu Gay LanierAmerican Society of Landscape ArchitectsFund
Raj PandyaAmerican Geophysical Union
Howard N. RosenPublic Interest Member
Barry W. StarkePublic Interest Member
Kasey WhiteGeological Society of America

Volume 32 Number 4 Renewable Resources Journal 4
subsequent decline of farmer numbers, biodiversity, communities, and farmer control over their operations. Italso increased the pollution of Iowa’s lakes and streams to the point where most are now classed as degraded.
Clearly this was not a sustainable path for Iowa but state leaders were unable to see beyond the horizon and thestate continued its trend to industrial agriculture. When I opened the doors on the Leopold Center in 1988, Iknew what lay ahead — I had enough experience nationally pushing uphill on sustainable agriculture to knowthat industry was vehemently opposed. It was mostly on philosophical grounds; reason played little role in thisopposition.
The elephant in the room was “organic,” and fears were stoked by industry that organics would take away theirlucrative chemical markets. Common sense said otherwise. Another elephant in the room was fear ofgovernment meddling in farming. This has been a constant fear, first stoked by Barry Commoner’s findings in theearly 1970’s that fertilizers provided up to half of the nitrate in the rivers of central Illinois. As reported in therespected journal Science, Commoner had proposed limiting fertilizer applications.
The findings were unambiguous. Nitrate in drinking water was a health threat to infants and the 10 mg per literhealth limit was supported by science. Scientists now recognize that nitrate also is a key causative contributor tohypoxia – the overproduction of algae in shallow Gulf of Mexico waters that asphyxiate fish and shellfish.
The major source of nitrate in most ecosystems is agriculture (a fact still widely disbelieved in traditionalagriculture circles). The ensuing debate on government intervention resulted in agricultural scientists andadministrators avoiding the issue, a common approach. Agricultural industry denounced these findings,threatened agricultural colleges with defunding and influenced the research agendas of researchers.
The issue arose recently right in the Leopold Center’s front yard when the Des Moines Water Works sued theWater Drainage Districts of three counties claiming the districts did not provide drainage water conforming tothe health limits for nitrate and that they should either pay damages or work to improve management of farmsto provide such water. Rather than sitting down with the city, the agriculturalists mounted major public relationscampaigns claiming they were not at fault, while preparing for a lengthy court battle. Industry money poured inand overwhelmed the financial resources of the City of Des Moines.
In the end, the Federal District Court judge ruled that the Water Works could not sue the Drainage Districts. Theruling was technical, and widely accepted. Still, a typical headline announcing the case decision stated, “FarmersWon.” No one won, and today hog lots are rapidly expanding, taking advantage of a political decision of severalyears ago that hog lots of less than 7,500 head in size need less environmental assessment and may be builtwithout consideration of who may be living downwind or downstream.
In the meantime, Iowa has adopted what is vaguely described as a “nutrient management plan.” It calls forvoluntary adoption of management practices that will lessen the rate of nitrate and phosphorus runoff anddrainage from farmland. This plan, written largely by industry in cooperation with University Extension, has littlehope of achieving true success (e.g., permanent nutrient reduction) because it is voluntary, site-based and notsubsidized. Recent discharge measurements have indicated that the plan has had no effect to date. In fact, bysome estimates nitrate discharge has increased nearly 50% since its adoption
Leopold’s Work is Completed?
Why would the most predominantly agricultural state in the nation want to throw away an institution such asthe Leopold Center? The Center had been meeting its legislative mandate for nearly 30 years, had developedclose ties with Extension and the farming community, and had sponsored hundreds of small and large projectsthat pertained to social and technical aspects of sustainable agriculture. Many technologies were developed that
Volume 32 Number 4 Renewable Resources Journal 5
pertained to reducing chemical use and controlling soil and water erosion, many being adapted to the needs offarmers on smaller acreages.
In defending the bill eliminating the Leopold Center, legislators argued that the Center had completed its work.They also said the Center was supposed to be self-funded by now (not true) and that it can now operate withfunds from the industry. Obviously this is not possible – industry funding has always led to research in theinterest of the industry. Why would it ever be otherwise?
While we rightly worry about water quality and quantity, I continue to be very concerned about the lessglamorous soil erosion and degradation. Soil is our foundation, the source of the world’s food and protector ofthe environment. But maybe my objectivity is being affected by my appreciation and understanding of soils.
Iowa does have a problem – well many problems actually, most of its own making. I am referring to a hugeenvironmental problem of muddy streams and lakes, polluted not only with fragile topsoil but also withnutrients and pesticides. And Iowa is beginning to recognize it. This mess was many years in the making and itwill take a long time and a lot of changes in lifestyle and farm practice to correct the course. Will correction bepossible? More than 85% of Iowa’s land is farmed, more than any other equivalent political area in the world.This cropland is mostly highly productive, especially of the grain crops – primarily corn and soybeans.
Commonly called “Big Ag,” we are referring to the industrial complex that controls the stuff it takes to farm: thechemicals, machinery, land, money, legislation for subsidies and rules – in other words everything agriculture.Big Ag is the corporate phase of agriculture that ends up treating farmers as willing workers, or “serfs.” It onlygives lip service to environmental protection of the resources upon which it depends.
Big Ag fights any attempt to control its agenda, particularly keeping legislation setting rules and standards awayfrom its doorstep. I believe that it surmised that closing the Leopold Center would be to its benefit. I predict theyare dead wrong.
Agriculture is the largest unregulated industry in the U.S. Yet, if any industry needs regulating, it is agriculture.Soil destruction, massive animal-confinement operations that foul the air and the streams, as well as diminishedsources of employment, and large-scale crop growing techniques that add nitrate, sediment and pesticides tosurface and ground waters mark the way most of Iowa farms.
Farming is using up its resources faster than they are being replaced; it is not sustainable.
Scientists first recognized that natural resource sustainability was important with the advanced thinking andwriting of Aldo Leopold and his Sand County Almanac and Rachael Carlson’s Silent Spring. Leopold especiallyrealized the loss of soil through erosion and over-farming was impacting ecosystems throughout the world whileCarlson worried about the impact of pesticides.
Even back then, Big Ag fought back with words and deeds. And it decided that its potentially greatest ally wasthe university, especially America’s prestigious Land Grant centers of learning.
It was important for Big Ag not only to stifle innovation and imaginative thought and discussion but also tochannel this energy into creating products and students that are needed by industries. Over time this becamethe modus operandi; cut the state and federal government’s portion of the university’s budget and rely onindustrial grants and contracts for more and more of the day-to-day support and research.
Volume 32 Number 4 Renewable Resources Journal 6
While “publish or perish” used to be the battle cry for embattled professors, it is now replaced with “get grants,then publish or perish.” The new reality is that without outside money, research careers are stalled, universitymega-research complexes are under-funded, and administrators go shopping for new jobs.
This situation sets the stage for control of agriculture by the industry and the development of Big Ag. It can besubtle or direct but to be sure, industry will not put out the type of funding needed to do long-term, big-pictureresearch that Leopold- or Carson-type programs would call for. Thus, the “Big Science” that has developedparallel with Big Ag also spends much of its energy on narrow focused projects.
An enlightened group of Iowa legislators in the mid-1980’s realized the troubles Iowa was having in itsagricultural sector. Both nitrate and pesticides were finding their way into Iowa waters with increasingfrequency. Farmers were having difficulty making ends meet and many were going broke, farms had gotten toolarge to control and land prices were plummeting, wiping out the equity farmers needed to pay their priceyloans. Suicides were common.
Iowa always seems short of money because of the current “farm crisis.” In 1985 the legislators began debatingthe need for a new approach to agricultural research, education and outreach. It was to be called the LeopoldCenter for Sustainable Agriculture. It was to be placed at Iowa State University but have responsibilities at thestate’s other universities, work directly with University Extension and fund projects that look at problems andsolutions to Iowa agriculture sustainability.
It was to be funded by monies from the state general fund and from a unique “polluter pays” tax on fertilizersand pesticides. This source of funds created a furor. Big Ag had major concerns that they were paying for theirown demise, organic agriculture would be promoted, fertilizer use would plummet, and regulations wouldabound. But the bill passed and was signed. The wounds, however, never healed.
In 2017 the political winds shifted. The legislature and governor’s office shared a political ideology, andenvironmental and sustainable agriculture was no longer a favored program. As a legislator said, “the missionhas been accomplished.” Iowa was facing major budget deficits. The budget was “balanced” by shutting down ortrimming state programs. The Leopold Center was a casualty of this process.
This is where the Center stands today. Some environmental and sustainable farm groups have been holdingmeetings to redefine the Center and raise money. But funding is a major problem. The original funding wasabout $1.5 million a year from the tax on nitrogen fertilizer and pesticides. That money was repurposed. Anequal amount was obtained annually through grants and contracts but the stable funding will be almostimpossible to replace in the foreseeable future in a state as solidly conservative as Iowa has become.
This sad outcome has cost Iowa much credibility in the agricultural and environmental circles around thecountry. Add to this the knowledge that Iowa now has some of the poorest quality water and highest rates ofsoil erosion in the country. This reality will be a major negative for its future, especially in attracting the dynamicyoung leaders needed to make it thrive.
Continuing the Work
Our experience in Iowa provides lessons for the future. Sustainable agricultural practice should be developed,implemented and embraced. Perhaps Iowa does not have the institutions in place to support research forsustainable practices?
Where should sustainable agricultural practices be developed and implemented? Today, conservation scienceand sustainable practice seem to be the province of public interest groups and progressive researchorganizations. Although many universities have become research vendors for commercial interests, and thus not

Volume 32 Number 4 Renewable Resources Journal 7
attracting candidates for research supporting sustainable practices, it may be the case that some universities inthe upper Midwest or on the East and West coasts could be fertile fields.
How can development of sustainable agricultural practices be funded? A difficult challenge. Looking toagribusiness is problematic. State support in the Midwest also presents challenges. The federal government hasbeen a source of research leadership in times past. Recently, nearly every role of government is beingquestioned. The federal government may not be a reliable partner. So, public interest groups and foundations,and possibly progressive states might be able to contribute.
I see the need for a major philanthropic person or foundation to step in and fill the gap. The Leopold Center, tocontinue to succeed, needs independence from Iowa State University, which it had with the funds from thefertilizer and pesticide tax. Yet, it needs ISU as a cooperative partner in research projects and in fiscalmanagement.
The Center proudly proved the concepts it espoused. To shut it down now is a loss to society.
Additional Reading about the Leopold Center Controversy:
State Legislators Say Iowa Has Achieved Sustainable Farming (It Hasn’t) and Doesn’t Need More Research(It Does)https://www.nrdc.org/stories/some-iowa-legislators-say-state-has-already-achieved-sustainable-farming-it-hasnt-and-doesnt
Obradovich: GOP wants businesses to control environmental researchhttps://www.desmoinesregister.com/story/opinion/columnists/kathie-obradovich/2017/04/17/obradovich-gop-wants-businesses-control-environmental-research/100576768/
Rethink This Iowa: Do Not Gut the Leopold Center for Sustainable Agriculturehttp://inthesetimes.com/rural-america/entry/20270/iowa-leopold-center-for-sustainable-agriculture-water-soil-cafos-nitrates
Taking Action for Public Science: Re-Imagining Iowa’s Leopold Center for Sustainable Agriculturehttps://blog.ucsusa.org/science-blogger/taking-action-for-public-science-re-imagining-iowas-leopold-center-for-sustainable-agriculture

Volume 32 Number 4 Renewable Resources Journal 8
The industrialization of the deep sea is expandingworldwide. Increasing oil and gas explorationactivities in the absence of sufficient baseline data indeep-sea ecosystems has made environmentalmanagement challenging. The following reportexcerpt reviews the types of activities that areassociated with global offshore oil and gasdevelopment in water depths over 200 m, the typicalimpacts of these activities, and some of the moreextreme impacts of accidental oil and gas releases.
Effects of Routine Activities
Routine oil and gas activities can have detrimentalenvironmental effects during each of the main phasesof exploration, production, and decommissioning(Figure 1). During the exploration phase, impacts canresult from indirect (sound and traffic) and directphysical (anchor chains, drill cuttings, and drillingfluids) disturbance. Additional direct physical impactsoccur in the production phase as pipelines are laidand the volume of discharged produced waterincreases. Lastly, decommissioning can result in aseries of direct impacts on the sea floor and can re-introduce contaminants to the environment. It iscritical that all of the potential impacts of routineoperations are accounted for when designingmanagement strategies, whether local or regional, foroffshore oil and gas activities.
Impacts from deep-water oil and gas developmentactivities begin during seismic surveys that are usedto reveal the subsurface geology and locate potentialreservoirs. These impacts include underwater soundand light emissions and increased vessel activity.Sound levels produced during seismic surveys vary inintensity, but in some cases, soundwaves from thesesurveys have been detected almost 4000 km away
from the survey vessel (Nieukirk et al., 2012). Impactassessments of acoustic disturbance have primarilyfocused on marine mammals. Reported effectsinclude disruption of behavior (e.g., feeding, breeding,resting, migration), masking of sounds used forcommunication and navigation, localizeddisplacement, physiological stress, as well as physicalinjury including temporary or permanent hearingdamage (Gordon et al., 2004; Southall et al.,2008; Moore et al., 2012). Marine mammal exposureexperiments and noise propagation modeling suggestthat hearing damage may occur within a few 100 m tokm from the sound source, with avoidance behaviorsmore variable but generally detected over greaterdistances (Southall et al., 2008). In contrast, thepotential effects of sound on fish and invertebrates
Environmental Impacts of the Deep-Water Oil and Gas Industry
Erik E. Cordes et al.
Figure 1. Diagram of impacts from typical deep-seadrilling activity

Volume 32 Number 4 Renewable Resources Journal 9
remain poorly understood, but may be significant (Hawkins et al., 2014). For example, significant developmentaldelays and body malformations have been recorded in scallop larvae exposed to seismic pulses (de Soto et al.,2013). Exposure to underwater broadband sound fields that resemble offshore shipping and constructionactivity can also influence the activity and behavior of key bioturbating species in sediments (Solan et al., 2016).
Operations at oil fields introduce considerable amounts of artificial light (e.g., electric lighting, gas flares) thatcan potentially affect ecological processes in the upper ocean, such as diel vertical migration of plankton (Mooreet al., 2000). Artificial night light also attracts numerous species, including squid, large predatory fishes, andbirds (Longcore and Rich, 2004). Underwater lighting, such as used on remotely operated vehicles, is likely to beof comparatively modest impact, though it may be significant in the case of species with extremely sensitivevisual systems (Herring et al., 1999).
Once the installation of infrastructure commences, direct impacts on habitats and associated fauna increase.Placement of infrastructure on the seafloor, such as anchors and pipelines, will directly disturb the seabed andcause a transient increase in local sedimentation. Typically, 8–12 anchors are used to moor a semi-submersibledrilling rig. The spatial extent of anchor impacts on the seabed varies depending on operating depth, but istypically between 1.5 and 2.5 times the water depth of the operation (Vryhof Anchors BV, 2010). As anchors areset, they are dragged along the seabed, damaging benthic organisms and leaving an anchor scar on the seafloor.The impact of anchors in the deep sea is of greatest concern in biogenic habitats, such as those formed by coralsand sponges, which are fragile and have low resilience to physical forces (Hall-Spencer et al., 2002; Watling,2014). Anchor operations have been shown to impact coral communities directly through physical disturbanceand increased local sedimentation, with an estimated 100 m wide corridor of influence (Ulfsnes et al., 2013). Thelaying of pipelines also alters local seabed habitat conditions by adding hard substratum, which in turn maysupport sessile epifauna and/or attract motile benthic organisms (Lebrato and Jones, 2009). Ulfsnes et al.(2013) estimated a 50 m wide corridor of impact for pipeline installations, including dislocation of existing hardsubstrata. Corrosion and leakage of pipelines also poses the risk of exposing deep-sea fauna to potentiallydamaging pollution.
The drilling process involves the disposal of waste, including drill cuttings and excess cement, fluids (drillingmud), produced water, and other chemicals that may cause detrimental ecological effects (Gray et al., 1990).Drill cuttings are the fragments of rock that are created during the drilling process. The chemical composition ofdrilling muds is diverse, and has changed from the more toxic oil-based muds (currently restricted in manyjurisdictions) to more modern synthetic and water-based fluids. The types of fluids most commonly usedcurrently are generally regarded to be less toxic than oil-based fluids, but they are not without adverse biologicaleffects (Daan and Mulder, 1996; Breuer et al., 2004; Bakhtyar and Gagnon, 2012; Gagnon and Bakhtyar,2013; Edge et al., 2016). Produced water is contaminated water associated with oil and gas extraction process,with an estimated global production ratio of 3:1 water:oil over the lifetime of a well (Khatib and Verbeek,2002; Neff, 2002; Fakhru'l-Razi et al., 2009). However, it should be noted that this is a global average, and theseestimates vary greatly between hydrocarbon fields with the ratio of water to oil increasing over the lifetime of asingle well. Produced water is primarily composed of formation water extracted during oil and gas recovery, butmay also contain seawater that has previously been injected into the reservoir along with dissolved inorganicsalts, dissolved and dispersed hydrocarbons, dissolved minerals, trace metals, naturally occurring radioactivesubstances, production chemicals, and dissolved gases (Hansen and Davies, 1994; Neff, 2002; Fakhru'l-Razi et al.,2009; Bakke et al., 2013). As a major source of contaminants from oil and gas extraction activity, produced wateris typically treated in accordance with strict regulations before being discharged (e.g., OSPAR, 2001).
The spatial footprint of discharge varies with the volume of discharge, depth of discharge, local hydrography,particle size distribution, rates of settlement and floc formation, and time since discharge (Neff, 2005; Niu et al.,2009). Although volumes are likely to vary greatly depending on the local conditions during the active stage ofdrilling, discharges from one deep-water well at 900 m depth off the coast of Brazil were ~270 m3 of cuttings,320 m3 of water-based fluids, and 70 m3 of non-aqueous fluids (Pivel et al., 2009). These types of discharges mayproduce cuttings accumulations up to 20 m in thickness within 100–500 m of the well site (Breuer et al.,2004; Jones et al., 2006; Pivel et al., 2009). Visual assessment at 10 recent deep-water well sites between 370
Volume 32 Number 4 Renewable Resources Journal 10
and 1750 m depth, drilled using current best practice in the NE Atlantic, recorded visual cuttings accumulationspresent over a radius of 50–150 m from the well head (Jones and Gates, 2010).
Potential impacts on seabed communities can result from both the chemical toxicants and the physicaldisturbance. Reduction in oxygen concentration, organic enrichment, increased hydrocarbon concentrations,and increased metal abundance can alter biogeochemical processes and generate hydrogen sulfide andammonia (Neff, 2002). At present, little information is available on the effects of these processes at themicrobial level. At the metazoan level, community-level changes in the density, biomass, and diversity ofprotistan, meio-, macro-, and megafaunal assemblages have been recorded in several studies (Gray et al.,1990; Currie and Isaacs, 2005; Jones et al., 2007; Netto et al., 2009; Santos et al., 2009; Lanzen et al., 2016).These changes have been linked with smothering by drilling cuttings and increased concentrations of harmfulmetals (e.g., barium) and hydrocarbons (Holdway, 2002; Breuer et al., 2004; Santos et al., 2009; Trannum et al.,2010).
Detected ecological changes attributed to current practices have typically been found within 200–300 m of thewell-head (Currie and Isaacs, 2005; Gates and Jones, 2012), but can occasionally extend to 1–2 km for sensitivespecies (Paine et al., 2014). Previous drilling practices, where oil-based drilling muds were used for the entiredrilling process (use of such methods are currently heavily regulated in most jurisdictions), appeared to generatebenthic impacts to >5 km from the discharge point (Olsgard and Gray, 1995). More recent evidence based oncurrent drilling techniques suggests that the effects of produced water on benthic organisms will be limited to1–2 km from the source (Bakke et al., 2013). Seafloor coverage of drill cuttings as low as 3 mm thickness cangenerate detectable impacts to the infauna (Schaaning et al., 2008). However, even beyond the area ofobservable cuttings piles, quantitative changes in meiofaunal abundance and community composition havebeen observed (Montagna and Harper, 1996; Netto et al., 2009). Changes in assemblage structure have alsobeen observed beyond the areas of visually apparent seafloor disturbance as a result of increased scavengingand opportunistic feeding on dead animals (Jones et al., 2007; Hughes et al., 2010). Despite occasionalobservations of increased scavenger abundance in impacted areas, it has been suggested that the fauna ofcuttings-contaminated sediments represent a reduced food resource for fish populations (e.g., smaller bodysize, loss of epifaunal species, shift from ophiuroids to polychaetes; Olsgard and Gray, 1995).
Cold-water corals (Figure 2) have been the focus of numerous impact studies. Discharges from typical operationshave the potential to impact cold-water coral communities in deep waters through smothering and toxic effects(Lepland and Mortensen, 2008; Purser and Thomsen, 2012; Larsson et al., 2013). In laboratory studies, the reef-framework-forming stony coral Lophelia pertusa had significant polyp mortality following burial by 6.5 mm ofdrill cuttings, the maximum permissible under environmental risk assessment in Norway (Larsson and Purser,2011). As a result, at the Morvin field in Norway, where drilling took place near a Lophelia reef, a novel cuttings-transport system was developed to discharge cuttings some 500 m from the well and down-current from themost significant coral reefs (Purser, 2015). The discharge location was determined to minimize impacts based oncuttings dispersion simulation modeling (Reed and Hetland, 2002). Subsequent monitoring at nine reefsbetween 100 m and 2 km from the discharge site suggested this mitigation measure appeared to have beengenerally successful. Although concentrations of drill cuttings >25 ppm were observed at several of themonitored reefs, no obvious visual impacts to the coral communities were reported (Purser, 2015). However,this concentration of drill cuttings had been shown to have a significant negative effect on L. pertusa growth inlaboratory experiments (Larsson et al., 2013).
Impacts from oil and gas operations may be compounded in some settings by other anthropogenic disturbances,particularly as human impacts on the deep-sea environment continue to increase (e.g., Glover and Smith,2003; Ramirez-Llodra et al., 2011; Kark et al., 2015). Climate and ocean change, including higher temperatures,expansion of oxygen minimum zones, and ocean acidification, will exacerbate the more direct impacts of the oiland gas industry through increased metabolic demand. Multiple stressors can operate as additive effects,synergistic effects, or antagonistic effects (Crain et al., 2008). While studies of the interactions between climatevariables (temperature, oxygen, pH, CO2) and drilling impacts are rare or non-existent, multiple stressorstypically have antagonistic effects at the community level, but synergistic effects at the population level (Crain et

Volume 32 Number 4 Renewable Resources Journal 11
al., 2008). At the most basic level, experimental workhas shown that increased temperature generallyincreases the toxicity of petroleum hydrocarbons andother compounds (Cairns et al., 1975; Tatem et al.,1978), which suggests that the ecological impactsthat have been recorded to date may expand inmagnitude and distance as climate change proceeds.
Deep-water fisheries have a significant impact ondeep-sea species, with detrimental effects extendingto habitats and ecosystems beyond the targetpopulations (Benn et al., 2010; Clark et al., 2016).Some authors note that the physical presence of oiland gas infrastructure may protect fished species orhabitats by de facto creating fisheries exclusionzones (Hall, 2001; Love et al., 2006), by establishingnew reef habitat (sensu Montagna et al., 2002), andby functioning as fish aggregating devices (Hinck etal., 2004). Although the value of oil and gasinfrastructure in secondary production and fisheries,particularly in deep waters, is controversial(Bohnsack, 1989; Baine, 2002; Ponti, 2002; Powers etal., 2003; Fabi et al., 2004; Kaiser and Pulsipher,2006), there is some evidence to suggest that thiscan occur (Claisse et al., 2015). Oil industryinfrastructure may therefore have some positiveeffects, even in deep water (Macreadie et al., 2011),principally in terms of creating refugia from fishingimpacts (e.g., Wilson et al., 2002).
Oil-field infrastructure can also provide hardsubstratum for colonization by benthic invertebrates,including scleractinian corals and octocorals (Hall,2001; Sammarco et al., 2004; Gass and Roberts,2006; Larcom et al., 2014). The widely-distributedcoral L. pertusa (Figure 2) has been recorded onnumerous oil field structures in the northern NorthSea (Bell and Smith, 1999; Gass and Roberts, 2006),as well as on infrastructure in the Faroe-ShetlandChannel (Hughes, 2011), and the northern Gulf ofMexico (Larcom et al., 2014). These man-madestructures may enhance population connectivity(Atchison et al., 2008) and provide stepping stonesfor both native and potentially invasive species,which has been demonstrated for shallow-waterspecies that may not normally be able to disperseacross large expanses of open water (Page et al.,2006; Coutts and Dodgshun, 2007; Sheehy and Vik,2010). Therefore, the increased connectivity provided by these artificial structures may be viewed bothpositively and negatively, and it is difficult to make predictions about the potential benefits or harm of theincreased availability of deep-sea hard substrata.
Figure 2. Deep-sea communities near drillingactivities. (A) Benthic communities shortly aftersmothering by (light colored) cuttings at the TornadoField (1050 m depth), Faroe-Shetland Channel,U.K. (B) Edge of cuttings pile at the Laggan field,Faroe-Shetland Channel, U.K. (Figure 4D from Jones etal., 2012a). (C) Atlantic roughy, Hoplostethusoccidentalis, among L. pertusa around the abandonedtest-pile near Zinc at 450 m depth in the Gulf ofMexico. Image courtesy of the Lophelia II program,U.S. Bureau of Ocean Energy and Management andNOAA Office of Ocean Exploraiton andResearch. (D) Appearance in 2013 of a Paramuriceabiscaya colony damaged during the DeepwaterHorizon oil spill in 2010. Image courtesy of ECOGIG, aGoMRI-funded research consortium and the OceanExploration Trust. (E,F): Methane-seep communitiesfrom an area within the exclusive economic zone ofTrinidad and Tobago that is targeted for future oil andgas development. The Ocean Exploration Trust isacknowledged for use of these photos from the E/V Nautilus 2014 Expedition.

Volume 32 Number 4 Renewable Resources Journal 12
Effects of Accidental Discharges
Oil and gas operations have the potential to result in accidental releases of hydrocarbons, with the likelihood ofan accidental spill or blowout increasing with the depth of the operations (Muehlenbachs et al., 2013). The U.S.NOAA Office of Response and Restoration records, on average, 1–3 spills per week within the U.S. EEZ, but mostof these are relatively small and occur near the shore. On the U.S. outer continental shelf between 1971 and2010, there were 23 large spills of more than 1000 barrels (160,000 L) of oil, or an average of one every 21months (Anderson et al., 2012). In addition, on a global scale there were 166 spills over 1000 barrels thatoccurred during offshore transport of oil in the period between 1974 and 2008, or one every 2.5 months(Anderson et al., 2012). The greatest risk to the marine environment comes from an uncontrolled release ofhydrocarbons from the reservoir, known as a blowout (Johansen et al., 2003). Risk modeling suggests that anevent the size of the Deepwater Horizon incident can be broadly predicted to occur on an interval between 8and 91 years, or a rough average of once every 17 years (Eckle et al., 2012). Several major offshore oil blowoutshave occurred, including the IXTOC-1 well in the Bahia de Campeche, Mexico where 3.5 million barrels of oilwere released at a water depth of 50 m over 9 months (Jernelov and Linden, 1981; Sun et al., 2015) and theEkofisk blowout where 200,000 barrels (32 million liters) of oil were released at a water depth of 70 m (Law,1978). While all of these examples represent accidental discharges, the frequency at which they occur inoffshore waters suggests that they can be expected during “typical” operations.
The best-studied example of a major deep-sea blowout was at the Macondo well in the Gulf of Mexico in 2010(Joye et al., 2016). This blowout discharged ~5 million barrels (800 million liters) of oil at a water depth of ~1500m (McNutt et al., 2012). About half of the oil traveled up to the surface, while the rest of the gaseoushydrocarbons and oil suspended as microdroplets remained in a subsurface plume centered around 1100 mdepth, that traveled ~50 km from the well-head (Camilli et al., 2010). The surface oil slicks interacted withplanktonic communities and mineral particles to form an emulsion of oiled marine snow (Passow et al., 2012).This material was subsequently observed as a deposited layer on the deep-sea floor that was detected in an areaof ~3200 km2 (Chanton et al., 2014; Valentine et al., 2014). Impacts at the seabed, as revealed by elevatedhydrocarbon concentrations and changes to the nematode-copepod ratio, were detected in an area of over 300km2, with patchy impacts observed to a radius of 45 km from the well site (Montagna et al., 2013; Baguley et al.,2015). This oiled marine snow was also implicated in impacts on mesophotic and deep-sea coral communities(White et al., 2012; Silva et al., 2015; Figure 2).
Deep-sea coral communities were contaminated by a layer of flocculent material that included oil fingerprintedto the Macondo well, and constituents of the chemical dispersant used in the response effort (White et al.,2012, 2014). Impacts on corals were detected at a number of sites, extending to 22 km from the well, and towater depths (1950 m) exceeding that of the well-head (Hsing et al., 2013; Fisher et al., 2014a).
Dispersants or chemical emulsifiers are applied to oil spills in an effort to disperse surface slicks. Globally, therehave been over 200 documented instances of dispersant use between 1968 and 2007 (Steen, 2008). Dispersantuse can cause increases in environmental hydrocarbon concentrations (Pace et al., 1995) and direct toxic effects(Epstein et al., 2000). Dispersants increase the surface area for oil-water interactions (Pace et al., 1995),ostensibly increasing the biological availability of oil compounds (Couillard et al., 2005; Schein et al., 2009),potentially enhancing toxic effects (Chandrasekar et al., 2006; Goodbody-Gringley et al., 2013; DeLeo et al.,2016). However, in the case of the Deepwater Horizon accident, dispersant use was shown to impedehydrocarbon degradation by microorganisms (Kleindienst et al., 2015). Chemically-dispersed oil is known toreduce larval settlement, cause abnormal development, and produce tissue degeneration in sessileinvertebrates (Epstein et al., 2000; Goodbody-Gringley et al., 2013; DeLeo et al., 2016). Dispersant exposurealone has proved toxic to shallow-water coral larvae (Goodbody-Gringley et al., 2013) and deep-sea octocorals(DeLeo et al., 2016). Some of the potentially toxic components of dispersants may persist in the marineenvironment for years (White et al., 2014), but there are few in situ or even ex situ studies of effects ofdispersants on deep-sea organisms.

Volume 32 Number 4 Renewable Resources Journal 13
Recovery from Impacts
Typical impacts from drilling may persist over long time scales (years to decades) in the deep sea. In deepwaters, the generally low-energy hydrodynamic regime may lead to long-term persistence of dischargedmaterial, whether it be intentional or accidental (Neff, 2002; Chanton et al., 2014). Sediment contamination byhydrocarbons, particularly PAHs, is of particular concern, as these compounds can persist for decades, posingsignificant risk of prolonged ecotoxicological effects. Hydrocarbons from the Prestige spill, off the Galician coast,were still present in intertidal sediments 10 years post-spill (Bernabeu et al., 2013), and petroleum residuesfrom the oil barge Florida were still detectable in salt marsh sediments in West Falmouth, MA, after 30 years(Reddy et al., 2002). In the Norwegian Sea (380 m depth), there was a reduction in the visible footprint of drillcuttings from a radius of over 50 m to ~20 m over 3 years, but chemical contamination persisted over the largerarea (Gates and Jones, 2012). In the Faroe-Shetland Channel (500–600 m), visible drill cuttings reduced from aradius of over 85–35 m over a 3-year period, while an adjacent 10 year-old well-site exhibited visually distinctcuttings piles at a radius of only 15–20 m (Jones et al., 2012a). Recovery of benthic habitats may take longer atsites where bottom water movements limit dispersal of cuttings (Breuer et al., 2004).
Much of the deep-sea floor is characterized by comparatively low temperatures and low food supply rates.Consequently, deep-sea communities and individuals generally exhibit a slower pace of life than their shallow-water counterparts (reviewed in Gage and Tyler, 1991; McClain and Schlacher, 2015). Deep-water corals andcold-seep communities (Figure 2) represent anomalous high-biomass ecosystems in the deep sea and frequentlyoccur in areas of economic interest because of their direct (energy and carbon source) or indirect (substratum inthe form of authigenic carbonate) association with oil and/or gas-rich fluids (Masson et al., 2003; Coleman et al.,2005; Schroeder et al., 2005; Cordes et al., 2008; Bernardino et al., 2012; Jones et al., 2014). Cold-seeptubeworms and deep-water corals exhibit slow growth and some of the greatest longevities among marinemetazoans, typically decades to hundreds of years, but occasionally to thousands of years (Fisher et al.,1997; Bergquist et al., 2000; Andrews et al., 2002; Roark et al., 2006; Cordes et al., 2007; Watling et al., 2011).Recruitment and colonization dynamics are not well-understood for these assemblages, but recruitmentappears to be slow and episodic in cold-seep tubeworms (Cordes et al., 2003), mussels (Arellano and Young,2009), and deep-sea corals (Thresher et al., 2011; Lacharité and Metaxas, 2013; Doughty et al., 2014).
Because of the combination of slow growth, long life spans and variable recruitment, recovery from impacts canbe prolonged. Based on presumed slow recolonization rates of uncontaminated deep-sea sediments (Grassle,1977), low environmental temperatures, and consequently reduced metabolic rates (Baguley et al., 2008; Roweand Kennicutt, 2008), Montagna et al. (2013) suggested recovery of the soft-sediment benthos fromthe Deepwater Horizon well blowout might take decades. For deep-sea corals, recovery time estimates are onthe order of centuries to millennia (Fisher et al., 2014b). However, in some cases re-colonization may berelatively rapid, for example, significant macrofaunal recruitment on cuttings piles after 6 months (Trannum etal., 2011). Altered benthic species composition may, nevertheless, persist for years to decades (Netto et al.,2009). Direct studies of recovery from drilling in deep water are lacking and the cumulative effects of multipledrilling wells are not well-studied.
Assessment of Environmental Impacts
Environmental impacts of oil and gas operations may influence species, populations, assemblages, orecosystems by modifying a variety of ecological parameters (e.g., biodiversity, biomass, productivity, etc.).At the project level, potential impacts are generally assessed through some type of formal process, termedan environmental impact assessment (EIA). These typically involve the identification, prediction,evaluation, and mitigation of impacts prior to the start of a project. Key standard components of an EIAinclude: (i) description of the proposed development, including information about the size, location, andduration of the project, (ii) baseline description of the environment, (iii) description of potential impacts on

Volume 32 Number 4 Renewable Resources Journal 14
Authors: Erik E. Cores (Temple University), Daniel O. B. Jones (University of Southampton), Thomas A. Schlacher(University of the Sunshine Coast), Diva J. Amon (University of Hawaii), Angelo F. Bernardino (UniversidadeFederal do Espírito Santo), Sandra Brooke (Florida State University), Robert Carney (Louisiana State University),Danielle M. DeLeo (Temple University), Katherine M. Dunlop (Heriot-Watt University), Elva G. Escobar-Briones(Instituto de Ciencias del Mar y Limnología), Andrew R. Gates (University of Southampton), Luciana Génio(Universidade de Aveiro, University of Oregon), Judith Gobin (University of the West Indies), Lea-Anne Henry(Heriot-Watt University), Santiago Herrera (University of Toronto), Sarah Hoyt (Duke University), Mandy Joye(University of Georgia), Salit Kark (University of Queensland), Nélia C. Mestre (University of Algarve), AnnaMetaxas (Dalhousie University), Simone Pfeifer (University of Southampton), Kerry Sink (South African NationalBiodiversity Institute), Andrew K. Sweetman (Heriot-Watt University), and Ursula Witte (University of Aberdeen)
This report is adapted from Environmental Impacts of the Deep-Water Oil and Gas Industry: A Review to GuideManagement Strategies. The full report, along with citation links, can be accessed here: https://www.frontiersin.org/articles/10.3389/fenvs.2016.00058/full
the environment, (iv) proposed mitigation of impacts, and (v) identification of knowledge gaps. Mitigationin current oil and gas projects is recommended to follow the mitigation hierarchy: avoid, minimize, restore,and offset (World Bank, 2012). Environmental management strategies, particularly those to avoid andminimize the environmental impacts of projects, are set during the EIA process and may becomeconditions of operation. As a result, this element of the EIA process is particularly important inpreemptively avoiding serious impacts to the marine environment (Beanlands and Duinker, 1984).Establishing appropriate baseline data and control reference sites are critical to both an effective EIAdevelopment and subsequent assessment and monitoring of EIA predictions.
EIAs include predictions of how an ecological “baseline” condition may change in response to developmentand activities. The reliability of EIA predictions depends largely on the quality of existing ecological data(e.g., spatial and temporal coverage, measures of natural variation, taxonomic resolution, types of faunaobserved, and collected, etc.) and empirical data or model predictions of how ecological features react tohuman stressors. Even in the best-known deep-sea environments, the need for planned, coherent, andconsistent ecological data to inform EIAs may necessitate substantial new survey operations. For example,in the Gulf of Mexico, region-wide assessments of deep-sea community structure are available for differentgroups of fauna (e.g., Rowe and Menzel, 1971; Cordes et al., 2006, 2008; Rowe and Kennicutt,2008; Demopoulos et al., 2014; Quattrini et al., 2014). However, following the Deepwater Horizon incident,baseline data were still found to be lacking in the immediate vicinity of the impacts, and for many keycomponents of the ecosystem, including microbial communities and processes (Joye et al., 2016).
Testing EIA predictions and the effectiveness of implemented mitigation measures with well-designed andconsistent environmental monitoring is a critical next step. Generally, some form of “before-after/control-impact” (BACI) monitoring approach is appropriate (Underwood, 1994), as this will enable the detection ofaccidental impacts in addition to impacts anticipated from typical operations (Wiens and Parker,1995; Iversen et al., 2011). However, this often receives less attention and resources than the EIA itself,and most jurisdictions have minimal requirements for monitoring programs. Long-term monitoring in thedeep sea is generally rare (e.g., Hartman et al., 2012), and long-term environmental monitoring of deep-water oil and gas developments is extremely limited. A significant exception is found in the twoobservatory systems that were installed in deep waters off Angola to record long-term natural andanthropogenic changes in the physical, chemical, and biological environment and to allow anunderstanding of the pace of recovery from unforeseen impacts (Vardaro et al., 2013). Monitoring shouldalso be carried out after production has ceased and throughout de-commissioning.
Volume 32 Number 4 Renewable Resources Journal 15
Literature Cited
Anderson, C. M., Mayes, M., and LaBelle, R. P. (2012). Oil Spill OccurrenceRates for Offshore Spills. Herndon, DC: Bureau of Ocean EnergyManagement.
Andrews, A. H., Cordes, E. E., Mahoney, M. M., Munk, K., Coale, K. H.,Cailliet, G. M., et al. (2002). Age, growth and radiometric agevalidation of a deep-sea, habitat-forming gorgonian (Primnoaresedaeformis) from the Gulf of Alaska. Hydrobiologia 471, 101–110.doi: 10.1023/A:1016501320206
Arellano, S. M., and Young, C. M. (2009). Spawning, development, and theduration of larval life in a deep-sea cold-seep mussel. Biol. Bull. 216,149–162. doi: 10.2307/25470737
Atchison, A. D., Sammarco, P. W., and Brazeau, D. A. (2008). geneticconnectivity in corals on the flower garden banks and surroundingoil/gas platforms, Gulf of Mexico. J. Exp. Mar. Biol. Ecol. 365, 1–12.doi: 10.1016/j.jembe.2008.07.002
Baguley, J. G., Montagna, P. A., Cooksey, C., Hyland, J. L., Bang, H. W.,Morrison, C., et al. (2015). Community response of deep-sea soft-sediment metazoan meiofauna to the Deepwater Horizon blowoutand oil spill. Mar. Ecol. Prog. Ser.528, 127–140. doi: 10.3354/meps11290
Baguley, J. G., Montagna, P. A., Hyde, L. J., and Rowe, G. T. (2008).Metazoan meiofauna biomass, grazing, and weight-dependentrespiration in the Northern Gulf of Mexico deep sea. Deep Sea Res.II 55, 2607–2616. doi: 10.1016/j.dsr2.2008.07.010
Baine, M. (2002). The North Sea rigs-to-reefs debate. ICES J. Mar. Sci. 59(Suppl.), S277–S280. doi: 10.1006/jmsc.2002.1216
Bakhtyar, S., and Gagnon, M. M. (2012). Toxicity assessment of individualingredients of synthetic-based drilling muds (SBMs). Environ. Monit.Assess. 184, 5311–5325. doi: 10.1007/s10661-011-2342-x
Bakke, T., Klungsøyr, J., and Sanni, S. (2013). Environmental impacts ofproduced water and drilling waste discharges from the Norwegianoffshore petroleum industry. Mar. Environ. Res. 92, 154–169. doi:10.1016/j.marenvres.2013.09.012
Beanlands, G. E., and Duinker, P. N. (1984). Lessons from a decade ofoffshore environmental impact assessment. Ocean Manag. 9, 157–175. doi: 10.1016/0302-184X(84)90001-5
Bell, N., and Smith, J. (1999). Coral growing on North Sea oilrigs. Nature 402, 601. doi: 10.1038/45127
Benn, A. R., Weaver, P. P., Billett, D. S. M., van den Hove, S., Murdock, A.P., Doneghan, G. B., et al. (2010). Human activities on the deepseafloor in the North East Atlantic: an assessment of spatialextent. PLoS ONE 5:e12730. doi: 10.1371/journal.pone.0012730
Bergquist, D. C., Williams, F. M., and Fisher, C. R. (2000). Longevity recordfor deep-sea invertebrate. Nature 403, 499–500. doi:10.1038/35000647
Bernabeu, A. M., Fernández-Fernández, S., Bouchette, F., Rey, D., Arcos,A., Bayona, J. M., et al. (2013). Recurrent arrival of oil to Galiciancoast: the final step of the Prestige deep oil spill. J. Hazard.Mater. 250, 82–90. doi: 10.1016/j.jhazmat.2013.01.057
Bernardino, A. F., Levin, L. A., Thurber, A. R., and Smith, C. R. (2012).Comparative composition, diversity and trophic ecology of sedimentmacrofauna at vents, seeps and organic falls. PLoS ONE 7:e33515.doi: 10.1371/journal.pone.0033515
Bohnsack, J. A. (1989). Are high densities of fishes at artificial reefs theresult of habitat limitation or behavioral preference? Bull. Mar.Sci. 44, 631–645.
Breuer, E., Stevenson, A. G., Howe, J. A., Carroll, J., and Shimmield, G. B.(2004). Drill cutting accumulations in the Northern and Central NorthSea: a review of environmental interactions and chemical fate. Mar.Pollut. Bull. 48, 12–25. doi: 10.1016/j.marpolbul.2003.08.009
Cairns, J. Jr., Heath, A. G., and Parker, B. C. (1975). The effects oftemperature upon the toxicity of chemicals to aquaticorganisms. Hydrobiologia 47, 135–171. doi: 10.1007/BF00036747
Camilli, R., Reddy, C. M., Yoerger, D. R., Van Mooy, B. A. S., Jakuba, M. V.,Kinsey, J. C., et al. (2010). Tracking hydrocarbon plume transport andbiodegradation at deepwater horizon. Science 330, 201–204. doi:10.1126/science.1195223
Chandrasekar, S., Sorial, G. A., and Weaver, J. W. (2006). Dispersanteffectiveness on oil spills – impact of salinity. ICES J. Mar. Sci. 63,1418–1430. doi: 10.1016/j.icesjms.2006.04.019
Chanton, J., Zhao, T., Rosenheim, B. E., Joye, S., Bosman, S., Brunner, C., etal. (2014). Using natural abundance radiocarbon to trace the flux ofpetrocarbon to the seafloor following the deepwater horizon oilspill. Environ. Sci. Technol. 49, 847–854. doi: 10.1021/es5046524
Claisse, J. T., Pondella, D. J. II Love, M., Zahn, L. A., Williams, C. M., andBull, A. S. (2015). Impacts from partial removal of decommissioned oiland gas platforms on fish biomass and production on the remainingplatform structure and surrounding shell mounds. PLoSONE 10:e0135812. doi: 10.1371/journal.pone.0135812
Clark, M. R., Althaus, F., Schlacher, T. A., Williams, A., Bowden, D. A., andRowden, A. A. (2016). The impacts of deep-sea fisheries on benthiccommunities: a review. ICES J. Mar. Sci. 73 (Suppl. 1), i51–i69. doi:10.1093/icesjms/fsv123
Coleman, F. C., Figueira, W. F., Ueland, J. S., and Crowder, L. B. (2005).Global impact of recreational fisheries-Response. Science 307, 1562–1563.
Cordes, E. E., Bergquist, D. C., Shea, K., and Fisher, C. R. (2003). Hydrogensulphide demand of long-lived vestimentiferan tube wormaggregations modifies the chemical environment at deep-seahydrocarbon seeps. Ecol. Lett. 6, 212–219. doi: 10.1046/j.1461-0248.2003.00415.x
Cordes, E. E., Bergquist, D. C., Predmore, B. L., Dienes, P., Jones, C., Fisher,G., et al. (2006). Alternate unstable states: convergent paths ofsuccession in hydrocarbon-seep tubeworm-associatedcommunities. J. Exp. Mar. Biol. Ecol. 339, 159–176, doi: 10.1016/j.jembe.2006.07.017
Cordes, E. E., Carney, S. L., Hourdez, S., Carney, R. S., Brooks, J. M., andFisher, C. R. (2007). Cold seeps of the deep Gulf of Mexico:community structure and biogeographic comparisons to Atlanticequatorial belt seep communities. Deep Sea Res. I 54, 637–653. doi:10.1016/j.dsr.2007.01.001
Cordes, E. E., McGinley, M. P., Podowski, E. L., Becker, E. L., Lessard-Pilon,S., Viada, S. T., et al. (2008). Coral communities of the deep Gulf ofMexico. Deep Sea Res. I 55, 777–787. doi: 10.1016/j.dsr.2008.03.005
Couillard, C. M., Lee, K., Légaré, B., and King, T. L. (2005). Effect ofdispersant on the composition of water-accommodated fraction ofcrude oil and its toxicity to larval marine fish. Environ. Toxicol.Chem. 24, 1496–1504. doi: 10.1897/04-267R.1
Coutts, A. D., and Dodgshun, T. J. (2007). The nature and extent oforganisms in vessel sea-chests: a protected mechanism for marine

Volume 32 Number 4 Renewable Resources Journal 16
bioinvasions. Mar. Pollut. Bull. 54, 875–886. doi: 10.1016/j.marpolbul.2007.03.011
Crain, C. M., Kroeker, K., and Halpern, B. S. (2008). Interactive andcumulative effects of multiple human stressors in marinesystems. Ecol. Lett. 11, 1304–1315. doi: 10.1111/j.1461-0248.2008.01253.x
Currie, D. R., and Isaacs, L. R. (2005). Impact of exploratory offshoredrilling on benthic communities in the Minerva gas field, PortCampbell, Australia. Mar. Environ. Res. 59, 217–233 doi: 10.1016/j.marenvres.2004.05.001
Daan, R., and Mulder, M. (1996). On the short-term and long-term impactof drilling activities in the Dutch sector of the North Sea. ICES J. Mar.Sci. 53, 1036–1044. doi: 10.1006/jmsc.1996.0129
de Soto, N. A., Delorme, N., Atkins, J., Howard, S., Williams, J., andJohnson, M. (2013). Anthropogenic noise causes body malformationsand delays development in marine larvae. Sci. Rep. 3:2831. doi:10.1038/srep02831
DeLeo, D. M., Ruiz-Ramos, D. V., Baums, I. B., and Cordes, E. E. (2016).Response of deep-water corals to oil and chemical dispersantexposure. Deep Sea Res. II 129, 137–147. doi: 10.1016/j.dsr2.2015.02.028
Demopoulos, A. W., Bourque, J. R., and Frometa, J. (2014). Biodiversityand community composition of sediment macrofauna associated withdeep-sea Lophelia pertusa habitats in the Gulf of Mexico. Deep SeaRes. I 93, 91–103. doi: 10.1016/j.dsr.2014.07.014
Doughty, C. L., Quattrini, A. M., and Cordes, E. E. (2014). Insights into thepopulation dynamics of the deep-sea coral genus Paramuricea in theGulf of Mexico. Deep Sea Res. II 99, 71–82. doi: 10.1016/j.dsr2.2013.05.023
Eckle, P., Burgherr, P., and Michaux, E. (2012). Risk of large oil spills: astatistical analysis in the aftermath of Deepwater Horizon. Environ.Sci. Techonol. 46, 13002–13008. doi: 10.1016/j.marpol.2013.12.002
Edge, K. J., Johnston, E. L., Dafforn, K. A., Simpson, S. L., Kutti, T., andBannister, R. J. (2016). Sub-lethal effects of water-based drilling mudson the deep-water sponge Geodia barretti. Environ. Pollut. 212, 525–534. doi: 10.1016/j.envpol.2016.02.047
Epstein, N., Bak, R. P. M., and Rinkevich, B. (2000). Toxicity of 3rdgeneration dispersants and dispersed Egyptian crude oil on Red Seacoral larvae. Mar. Pollut. Bull.40, 497–503. doi: 10.1016/S0025-326X(99)00232-5
Fabi, G., Grati, F., Puletti, M., and Scarcella, G. (2004). Effects on fishcommunity induced by installation of two gas platforms in theAdriatic Sea. Mar. Ecol. Prog. Ser. 273, 187–197. doi: 10.3354/meps273187
Fakhru'l-Razi, A., Pendashteh, A., Abdullah, L. C., Biak, D. R. A., Madaeni, S.S., and Abidin, Z. Z. (2009). Review of technologies for oil and gasproduced water treatment. J. Hazard. Mater. 170, 530–551. doi:10.1016/j.jhazmat.2009.05.044
Fisher, C. R., Urcuyo, I. A., Simpkins, M. A., and Nix, E. (1997). Life in theslow lane: growth and longevity of cold-seep vestimentiferans. Mar.Ecol. 18, 83–94. doi: 10.1111/j.1439-0485.1997.tb00428.x
Fisher, C. R., Hsing, P.-Y., Kaiser, C. L., Yoerger, D. R., Roberts, H. H., Shedd,W. W., et al. (2014a). Footprint of deepwater horizon blowout impactto deep-water coral communities. Proc. Natl. Acad. Sci. U.S.A. 111,11744–11749. doi: 10.1073/pnas.1403492111
Fisher, C. R., Demopoulos, A. W. J., Cordes, E. E., Baums, I. B., White, H. K.,and Bourque, J. R. (2014b). Coral communities as indicators ofecosystem-level impacts of the deepwater horizonspill. Bioscience 64, 796–807. doi: 10.1093/biosci/biu129
Gage, J. D., and Tyler, P. A. (1991). Deep-Sea Biology: A Natural History ofOrganisms at the Deep-Sea Floor, 1st Edn. Cambridge: CambridgeUniversity Press.
Gass, S. E., and Roberts, J. M. (2006). The occurrence of the cold-watercoral Lophelia pertusa (Scleractinia) on oil and gas platforms in theNorth Sea: colony growth, recruitment and environmental controlson distribution. Mar. Pollut. Bull. 52, 549–559. doi: 10.1016/j.marpolbul.2005.10.002
Gates, A. R., and Jones, D. O. B. (2012). Recovery of benthic megafaunafrom anthropogenic disturbance at a hydrocarbon drilling well (380 mDepth in the Norwegian Sea). PLoS ONE 7:e44114. doi: 10.1371/journal.pone.0044114
Glover, A. G., and Smith, C. R. (2003). The deep-sea floor ecosystem:current status and prospects of anthropogenic change by the year2025. Environ. Conserv. 30, 219–241. doi: 10.1017/S0376892903000225
Goodbody-Gringley, G., Wetzel, D. L., Gillon, D., Pulster, E., Miller, A., andRitchie, K. B. (2013). Toxicity of deepwater horizon source oil and thechemical dispersant, Corexit® 9500, to coral larvae. PLoSONE 8:e45574. doi: 10.1371/journal.pone.0045574
Gordon, J. G., Gillespie, D., Potter, J., Frantzis, A., Simmonds, M., Swift, R.J., et al. (2004). A review of the effects of seismic survey on marinemammals. Mar. Technol. Soc. J. 37, 14–34. doi:10.4031/002533203787536998
Grassle, J. F. (1977). Slow recolonisation of deep-seasediment. Nature 265, 618–619. doi: 10.1038/265618a0
Hall-Spencer, J., Allain, V., and Fosså, J. H. (2002). Trawling damage toNortheast Atlantic ancient coral reefs. Proc. Biol. Sci. 269, 507–511.doi: 10.1098/rspb.2001.1910
Hall, C. M. (2001). Trends in ocean and coastal tourism: the end of the lastfrontier? Ocean Coast. Manag. 44, 601–618. doi: 10.1016/S0964-5691(01)00071-0
Hansen, B. R., and Davies, S. H. (1994). Review of potential technologiesfor the removal of dissolved components from producedwater. Chem. Eng. Res. Des. 72, 176–188.
Hartman, S. E., Lampitt, R. S., Larkin, K. E., Pagnani, M., Campbell, J.,Lankester, T., et al. (2012). The Porcupine Abyssal Plain fixed-pointsustained observatory (PAP-SO): variations and trends from theNortheast Atlantic fixed-point time series. ICES J. Mar. Sci. 69, 776–783. doi: 10.1093/icesjms/fss077
Hawkins, A. D., Pembroke, A. E., and Popper, A. N. (2014). Informationgaps in understanding the effects of noise on fishes andinvertebrates. Rev. Fish Biol. Fish. 25, 39–64. doi: 10.1007/s11160-014-9369-3
Herring, P. J., Gaten, E., and Shelton, P. M. J. (1999). Are vent shrimpsblinded by science? Nature 398, 116–116.
Hinck, J. E., Bartish, T. M., Blazer, B. S., Denslow, N. D., Gross, T. S., Myers,M. S., et al. (2004). Biomonitoring of Environmental Status andTrends (BEST) Program: Environmental Contaminants and TheirEffects on Fish in the Rio Grande Basin. MO Scientific InvestigationsReport 2004–5285. U.S. Geological Survey, Columbia EnvironmentalResearch Center, Columbia.

Volume 32 Number 4 Renewable Resources Journal 17
Hsing, P. Y., Fu, B., Larcom, E. A., Berlet, S. P., Shank, T. M., Govindarajan,A. F., et al. (2013). Evidence of lasting impact of the deepwaterhorizon oil spill on a deep Gulf of Mexico coralcommunity. Elementa 1:000012. doi: 10.12952/journal.elementa.000012
Hughes, S. J. M., Jones, D. O. B., Hauton, C., Gates, A. R., and Hawkins, L. E.(2010). An assessment of drilling disturbance on Echinusacutus var. norvegicus based on in-situ observations and experimentsusing a remotely operated vehicle (ROV). J. Exp. Mar. Biol. Ecol. 395,37–47. doi: 10.1016/j.jembe.2010.08.012
Hughes, D. J. (2011). “Cold Water Corals on Oil Platforms,” in ScottishAssociation for Marine Science, Annual Report 2010–11, eds R.Turnewitsch and A. Miller (Oban: Scottish Marine Institute), 12.
Iversen, P. E., Green, A. M. V., Lind, M. J., Petersen, M. R. H., Bakke, T.,Lichtenhaler, R., et al. (2011). Guidelines for Offshore EnvironmentalMonitoring on the Norwegian Continental Shelf. Oslo: NorwegianClimate and Pollution Agency.
Jernelov, A., and Linden, O. (1981). Ixtoc I: a case study of the world'slargest oil spill. Ambio 10, 299–306.
Johansen, Ø., Rye, H., and Cooper, C. (2003). DeepSpill–field study of asimulated oil and gas blowout in deep water. Spill Sci. Technol.Bull. 8, 433–443. doi: 10.1016/S1353-2561(02)00123-8
Jones, D. O. B., and Gates, A. R. (2010). “Assessing the effects ofhydrocarbon drilling activity on deep-water Megafauna in TheNorthern North Atlantic. A rapid universal assessment method?,”in SPE International Conference on Health, Safety and Environment inOil and Gas Exploration and Production, Society of PetroleumEngineers, Rio de Janeiro.
Jones, D. O. B., Hudson, I. R., and Bett, B. J. (2006). Effects of physicaldisturbance on the cold-water megafaunal communities of the Faroe-Shetland Channel. Mar. Ecol. Prog. Ser. 319, 43–54. doi: 10.3354/meps319043
Jones, D. O. B., Wigham, B. D., Hudson, I. R., and Bett, B. J. (2007).Anthropogenic disturbance of deep-sea megabenthic assemblages: astudy with Remotely-operated vehicles in the Faroe-Shetland Chanel,NE Atlantic. Mar. Biol. 151, 1731–1741. doi: 10.1007/s00227-007-0606-3
Jones, D. O. B., Gates, A. R., and Lausen, B. (2012a). Recovery of deep-water megafaunal assemblages from hydrocarbon drillingdisturbance in the Faroe-Shetland Channel. Mar. Ecol. Prog. Ser. 461,71–82. doi: 10.3354/meps09827
Jones, D. O. B., Walls, A., Clare, M., Fiske, M. S., Weiland, R. J., O'Brien, R.,et al. (2014). Asphalt mounds and associated biota on the Angolanmargin. Deep Sea Res. I 94, 124–136. doi: 10.1016/j.dsr.2014.08.010
Joye, S. B., Bracco, A., Ozgokmen, T., Chanton, J. P., Grosell, M.,MacDonald, I. R., et al. (2016). The Gulf of Mexico ecosystem, sixyears after the Macondo Oil Well Blowout. Deep Sea Res. II 129, 4–19. doi: 10.1016/j.dsr2.2016.04.018
Kaiser, M. J., and Pulsipher, A. G. (2006). Capital Investment DecisionMaking and Trends: Implications on Petroleum ResourceDevelopment in the U.S. Gulf of Mexico. Fairbanks: University OfAlaska.
Kark, S., Brokovich, E., Mazor, T., and Levin, N. (2015). Emergingconservation challenges and prospects in an era of offshorehydrocarbon exploration and exploitation. Conserv. Biol. 29, 1573–1585. doi: 10.1111/cobi.12562
Khatib, Z., and Verbeek, P. (2002). “Water to value – produced watermanagement for sustainable field development of mature and greenfields,” in Proceedings of the SPE International Conference on Health,Safety and Environment in Oil and Gas exploration andProduction (Kuala Lumpur).
Lacharité, M., and Metaxas, A. (2013). Early life history of deep-watergorgonian corals may limit their abundance. PLoS ONE 8:e65394. doi:10.1371/journal.pone.0065394
Larcom, E. A., McKean, D. L., Brooks, J. M., and Fisher, C. R. (2014). Growthrates, densities, and distribution of Lophelia pertusa on artificialstructures in the Gulf of Mexico. Deep Sea Res. I 85, 101–109. doi:10.1016/j.dsr.2013.12.005
Larsson, A. I., van Oevelen, D., Purser, A., and Thomsen, L. (2013).Tolerance to long-term exposure of suspended benthic sedimentsand drill cuttings in the cold-water coral Lophelia pertusa. Mar.Pollut. Bull. 70, 176–188. doi: 10.1016/j.marpolbul.2013.02.033
Law, R. J. (1978). Determination of petroleum hydrocarbons in water, fishand sediments following the Ekofisk blow-out. Mar. Pollut. Bull. 9,321–324. doi: 10.1016/0025-326X(78)90241-2
Lebrato, M., and Jones, D. O. B. (2009). Mass deposition eventof Pyrosoma atlanticum carcasses off Ivory Coast (WestAfrica). Limnol. Oceanogr. 54, 1197–1209. doi: 10.4319/lo.2009.54.4.1197
Lepland, A., and Mortensen, P. B. (2008). Barite and barium in sedimentsand coral skeletons around the hydrocarbon exploration drilling sitein the Traena Deep, Norwegian Sea. Environ. Geol. 56, 119–129. doi:10.1007/s00254-007-1145-4
Longcore, T., and Rich, C. (2004). Ecological light pollution. Front. Ecol.Environ. 2, 191–198. doi: 10.1890/1540-9295(2004)002[0191:ELP]2.0.CO;2
Love, M. S., Schroeder, D. M., Lenarz, W., MacCall, A., Bull, A. S., andThorsteinson, L. (2006). Potential use of offshore marine structures inrebuilding an overfished rockfish species, bocaccio (Sebastespaucispinis). Fish. Bull. 104, 383–390.
Macreadie, P. I., Fowler, A. M., and Booth, D. J. (2011). Rigs-to-reefs: willthe deep sea benefit from artificial habitat? Front. Ecol. Environ. 9,455–461. doi: 10.1890/100112
Masson, D. G., Bett, B. J., Billett, D. S. M., Jacobs, C. L., Wheeler, A. J., andWynn, R. B. (2003). The origin of deep-water, coral-topped mounds inthe northern Rockall Trough, Northeast Atlantic. Mar. Geol. 194, 159–180. doi: 10.1016/S0025-3227(02)00704-1
McClain, C. R., and Schlacher, T. A. (2015). On some hypotheses ofdiversity of animal life at great depths on the sea floor. Mar. Ecol. 36,849–872. doi: 10.1111/maec.12288
McNutt, M. K., Camilli, R., Crone, T. J., Guthrie, G. D., Hsieh, P. A., Ryerson,T. B., et al. (2012). Review of flow rate estimates of the DeepwaterHorizon oil spill. Proc. Natl. Acad. Sci.U.S.A. 109, 20260–20267. doi:10.1073/pnas.1112139108
Montagna, P. A., and Harper, D. E. Jr. (1996). Benthic infaunal long-termresponse to offshore production platforms in the Gulf of Mexico. Can.J. Fish. Aquat. Sci. 53, 2567–2588. doi: 10.1139/f96-215
Montagna, P. A., Baguley, J. G., Cooksey, C., Hartwell, I., Hyde, L. J.,Hyland, J. L., et al. (2013). Deep-sea benthic footprint of thedeepwater horizon blowout. PLoS ONE 8:e70540. doi: 10.1371/journal.pone.0070540
Volume 32 Number 4 Renewable Resources Journal 18
Montagna, P. A., Kalke, R. D., and Ritter, C. (2002). Effect of restoredfreshwater inflow on macrofauna and meiofauna in upper RinconBayou, Texas, U. S. A. Estuaries 25, 1436–1447. doi: 10.1007/BF02692237
Moore, M. V., Pierce, S. M., Walsh, H. M., Kvalvik, S. K., and Lim, J. D.(2000). Urban light pollution alters the diel vertical migrationof Daphnia. Verhandlungen Int. Verein Limnol. 24, 1–4.
Moore, S. E., Reeves, R. R., Southall, B. L., Ragen, T. J., Suydam, R. S., andClark, C. W. (2012). A new framework for assessing the effects ofanthropogenic sound on marine mammals in a rapidly changingarctic. Bioscience 62, 289–295. doi: 10.1525/bio.2012.62.3.10
Muehlenbachs, L., Cohen, M. A., and Gerarden, T. (2013). The impact ofwater depth on safety and environmental performance in offshore oiland gas production. Energy Policy 55, 699–705. doi: 10.1016/j.enpol.2012.12.074
Neff, J. M. (2002). Bioaccumulation in Marine Organisms: Effect ofContaminants from Oil Well Produced Water. Amsterdam: Elsevier.
Neff, J. M. (2005). Composition, Environmental Fates, and Biological Effectof Water-Based Drilling Muds and Cuttings Discharged into theMarine Environment: Asynthesis and Annotated Bibliography.Duxbury, MA: Petroleum Environmental Research. Forum and API.
Netto, S. A., Gallucci, F., and Fonseca, G. (2009). Deep-sea meiofaunaresponse to synthetic-based drilling mud discharge off SE Brazil. DeepSea Res. II 56, 41–49. doi: 10.1016/j.dsr2.2008.08.018
Nieukirk, S. L., Mellinger, D. K., Moore, S. E., Klinck, K., Dziak, R. P., andGoslin, J. (2012). Sounds from airguns and fin whales recorded in themid-Atlantic Ocean, 1999–2009. J. Acoust. Soc. Am. 131, 1102–1112.doi: 10.1121/1.3672648
Niu, H., Li, Z., Lee, K., Kepkay, P., and Mullin, J. V. (2009). “Lagrangiansimulation of the transport of oil-mineral-aggregates (OMAs) andassessment of their potential risks,” in Proceedings of the 32 AMOPTechnical Seminar on Environmental Contamination and Response,Vol. 2. (Ottawa, ON: Environment Canada), 940.
Olsgard, F., and Gray, J. S. (1995). A comprehensive analysis of the effectsof offshore oil and gas exploration and production on the benthiccommunities of the Norwegian continental shelf. Mar. Ecol. Prog.Ser. 122, 277–306. doi: 10.3354/meps122277
OSPAR (2001). OSPAR Recommendation 2001/1 for the Management ofProduced Water from Offshore Installations (ConsolidatedText). OSPAR Recommendation 2001/1 adopted by OSPAR2001(OSPAR01/18/1, Annex 5). Amended by OSPAR Recommendation2006/4 (OSPAR 06/23/1, Annex 15) and OSPAR Recommendation2011/8 (OSPAR 11/20/1, Annex 19). Available online at: http://www.ospar.org/work-areas/oic
Pace, C. B., Clark, J. R., and Bragin, G. E. (1995). “Comparing crude oiltoxicity under standard and environmentally realistic exposures,”in Proceedings of the 1995 International Oil SpillConference (Washington, DC: American Petroleum Institute), 1003–1004.
Page, H. M., Dugan, J. E., Culver, C. S., and Hoesterey, J. C. (2006). Exoticinvertebrate species on offshore oil platforms. Mar. Ecol. Prog.Ser. 325, 101–107. doi: 10.3354/meps325101
Paine, M. D., DeBlois, E. M., Kilgour, B. W., Tracy, E., Pocklington, P.,Crowley, R. D., et al. (2014). Effects of the Terra Nova offshore oildevelopment on benthic macro-invertebrates over 10 years ofdevelopment drilling on the Grand Banks of Newfoundland,Canada. Deep Sea Res. II 110, 38–64. doi: 10.1016/j.dsr2.2014.10.015
Passow, U., Ziervogel, K., Asper, V., and Diercks, A. (2012). Marine snowformation in the aftermath of the Deepwater Horizon oil spill in theGulf of Mexico. Environ. Res. Lett. 7:035301. doi:10.1088/1748-9326/7/3/035301
Pivel, M. A. G., Freitas, C. M. D. S., and Comba, J. L. D. (2009). Modelingthe discharge of cuttings and drilling fluids in a deep-waterenvironment. Deep Sea Res. II 56, 12–21. doi: 10.1016/j.dsr2.2008.08.015
Ponti, M. (2002). Drilling platforms as artificial reefs: distribution ofmacrobenthic assemblages of the “Paguro” wreck (Northern AdriaticSea). ICES J. Mar. Sci. 59, S316–S323. doi: 10.1006/jmsc.2002.1225
Powers, S. P., Grabowski, J. H., Peterson, C. H., and Lindberg, W. J. (2003).Estimating enhancement of fish production by offshore artificialreefs: uncertainty exhibited by divergent scenarios. Mar. Ecol. Prog.Ser. 264, 265–277. doi: 10.3354/meps264265
Purser, A., and Thomsen, L. (2012). Monitoring strategies for drill cuttingdischarge in the vicinity of cold-water coral ecosystems. Mar. Pollut.Bull. 64, 2309–2316. doi: 10.1016/j.marpolbul.2012.08.003
Quattrini, A. M., Etnoyer, P. J., Doughty, C., English, L., Falco, R., Remon,N., et al. (2014). A phylogenetic approach to octocoral communitystructure in the deep Gulf of Mexico. Deep Sea Res. II 99, 92–102.doi: 10.1016/j.dsr2.2013.05.027
Ramirez-Llodra, E., Tyler, P. A., Baker, M. C., Bergstad, O. A., Clark, M. R.,Escobar, E., et al. (2011). Man and the last great wilderness: humanimpact on the deep sea. PLoS ONE 6:e22588. doi: 10.1371/journal.pone.0022588
Reddy, C. M., Eglinton, T. I., Hounshell, A., White, H. K., Xu, L., Gaines, R.B., et al. (2002). The West Falmouth oil spill after thirty years: thepersistence of petroleum hydrocarbons in marsh sediments. Environ.Sci. Technol. 36, 4754–4760. doi: 10.1021/es020656n
Roark, E., Guilderson, T. P., Dunbar, R. B., and Ingram, B. (2006).Radiocarbon-based ages and growth rates of Hawaiian deep-seacorals. Mar. Ecol. Prog. Ser. 327, 1–14. doi: 10.3354/meps327001
Rowe, G. T., and Kennicutt, M. C. (2008). Introduction to the deep Gulf ofMexico Benthos program. Deep Sea Res. II 55, 2536–2540. doi:10.1016/j.dsr2.2008.09.002
Rowe, G. T., and Menzel, D. W. (1971). Quantitative benthic samples fromthe deep Gulf of Mexico with some comments on the measurementof deep-sea biomass. Bull. Mar. Sci. 21, 556–566.
Sammarco, P. W., Atchison, A. D., and Boland, G. S. (2004). Expansion ofcoral communities within the Northern Gulf of Mexico via offshore oiland gas platforms. Mar. Ecol. Prog. Ser. 280, 129–143. doi: 10.3354/meps280129
Santos, M. F. L., Lana, P. C., Silva, J., Fachel, J. G., and Pulgati, F. H. (2009).Effects of non-aqueous fluids cuttings discharge from exploratorydrilling activities on the deep-sea macrobenthic communities. DeepSea Res. II 56, 32–40. doi: 10.1016/j.dsr2.2008.08.017
Schaaning, M. T., Trannum, H. C., Øxnevad, S., Carroll, J., and Blake, T.(2008). Effects of drill cuttings on biogeochemical fluxes andmacrobenthos of marine sediments. J. Exp. Mar. Biol. Ecol. 361, 49–57. doi: 10.1016/j.jembe.2008.04.014
Schein, A., Scott, J. A., Mos, L., and Hodson, P. V. (2009). Oil dispersionincreases the apparent bioavailability and toxicity of diesel torainbow trout (Oncorhynchus mykiss). Environ. Toxicol. Chem. 28,595–602. doi: 10.1897/08-315.1
Schroeder, W. W., Brooke, S. D., Olson, J. B., Phaneuf, B., McDonough, J. J.III, and Etnoyer, P. (2005). “Occurrence of deep-water Lophelia

Volume 32 Number 4 Renewable Resources Journal 19
pertusa and Madrepora oculata in the Gulf of Mexico,” in Cold-WaterCorals and Ecosystems (Berlin; Heidelberg: Springer), 297–307.
Sheehy, D., and Vik, S. F. (2010). The role of constructed reefs in non-indigenous species introductions and range expansions. Ecol. Eng. 36,1–11. doi: 10.1016/j.ecoleng.2009.09.012
Silva, M., Etnoyer, P. J., and MacDonald, I. R. (2015). Coral injuriesobserved at mesophotic reefs after the Deepwater Horizon oildischarge. Deep Sea Res. II 129, 96–107. doi: 10.1016/j.dsr2.2015.05.013
Southall, B. L., Bowles, A. E., Ellison, W. T., Finneran, J. J., Gentry, R. L.,Greene, C. R. Jr., et al. (2008). Marine mammal noise exposurecriteria: initial scientific recommendations. Bioacoustics 17, 273–275.doi: 10.1080/09524622.2008.9753846
Steen, A. (2008). Frequency of dispersant use worldwide. Int. Oil Spill Conf.Proc. 2008, 645–650. doi: 10.7901/2169-3358-2008-1-645
Sun, S., Hu, C., and Tunnell, J. W. Jr. (2015). Surface oil footprint andtrajectory of the Ixtoc-I oil spill determined from Landsat/MSS andCZCS observations. Mar. Pollut. Bull. 101, 632–641. doi: 10.1016/j.marpolbul.2015.10.036
Tatem, H. E., Cox, B. A., and Anderson, J. W. (1978). The toxicity of oils andpetroleum hydrocarbons to estuarine crustaceans. Estuarine Coast.Mar. Sci. 6, 365–373. doi: 10.1016/0302-3524(78)90128-7
Thresher, R. E., Tilbrook, B., Fallon, S., Wilson, N. C., and Adkins, J. (2011).Effects of chronic low carbonate saturation levels on the distribution,growth and skeletal chemistry of deep-sea corals and other seamountmegabenthos. Mar. Ecol. Prog. Ser. 442, 87–99. doi: 10.3354/meps09400
Trannum, H. C., Nilsson, H. C., Schaanning, M. T., and Øxnevad, S. (2010).Effects of sedimentation from water-based drill cuttings and naturalsediment on benthic macrofaunal community structure andecosystem processes. J. Exp. Mar. Biol. Ecol. 383, 111–121. doi:10.1016/j.jembe.2009.12.004
Trannum, H. C., Nilsson, H. C., Schaanning, M. T., and Norling, K. (2011).Biological and biogeochemical effects of organic matter and drillingdischarges in two sediment communities. Mar. Ecol. Prog. Ser. 442,23–36. doi: 10.3354/meps09340
Ulfsnes, A., Haugland, J. K., and Weltzien, R. (2013). Monitoring of DrillActivities in Areas with Presence of Cold Water Corals. Det NorskeVeritas (DNV) Report: 2012–1691. Det Norsk Veritas, Stavanger.
Underwood, A. J. (1994). On beyond BACI: sampling designs that mightreliably detect environmental disturbances. Ecol. Appl. 4, 3–15.
Valentine, D. L., Fisher, G. B., Bagby, S. C., Nelson, R. K., Reddy, C. M.,Sylva, S. P., et al. (2014). Fallout plume of submerged oil fromDeepwater Horizon. Proc. Natl. Acad. Sci. U.S.A. 111, 15906–15911.doi: 10.1073/pnas.1414873111
Vardaro, M., Bagley, P., Bailey, D., Bett, B., Jones, D., Clarke, R., et al.(2013). A Southeast Atlantic deep-ocean observatory: firstexperiences and results. Limnol. Oceanogr. 11, 304–315. doi:10.4319/lom.2013.11.304
Vryhof Anchors BV (2010). Anchor Manual 2010: The Guide to Anchoring.AC Capelle a/d Yssel.
Watling, L., France, S. C., Pante, E., and Simpson, A. (2011). Biology ofdeep-water octocorals. Adv. Mar. Biol. 60, 41–122. doi: 10.1016/B978-0-12-385529-9.00002-0
Watling, L. (2014). Trawling exerts big impacts on small beasts. Proc. Natl.Acad. Sci. U.S.A. 111, 8704–8705. doi: 10.1073/pnas.1407305111
White, H. K., Hsing, P.-Y., Cho, W., Shank, T. M., Cordes, E. E., Quattrini, A.M., et al. (2012). Impact of the Deepwater Horizon oil spill on a deep-water coral community in the Gulf of Mexico. Proc. Natl. Acad. Sci.U.S.A. 109, 20303–20308. doi: 10.1073/pnas.1118029109
White, H. K., Lyons, S. L., Harrison, S. J., Findley, D. M., Liu, Y., andKujawinski, E. B. (2014). Long-Term Persistence of Dispersantsfollowing the Deepwater Horizon Oil Spill. Environ. Sci. Technol.Lett. 1, 295–299. doi: 10.1021/ez500168r
Wiens, J. A., and Parker, K. R. (1995). Analyzing the effects of accidentalenvironmental impacts: approaches and assumptions. Ecol. Appl. 5,1069–1083.
Wilson, K. D. P., Leung, A. W. Y., and Kennish, R. (2002). Restoration ofHong Kong fisheries through deployment of artificial reefs in marineprotected areas. ICES J. Mar. Sci. 59, S157–S163. doi: 10.1006/jmsc.2002.1186
World Bank (2012). IFC Performance Standards on Environmental andSocial Sustainability. Washington, DC: World Bank. Available onlineat: http://documents.worldbank.org/curated/en/101091468153885418/IFC-performance-standards-on-environmental-and-social-sustainability

Volume 32 Number 4 Renewable Resources Journal 20
Introduction
Public lands are what make the American West theAmerican West. They are the backbones of our localeconomies, living artifacts of our history, and theplaces that ground us. Public lands are managed bystate, local, and the federal governments on behalf ofthe American public. While the U.S. governmentmanages the vast majority of public lands—includingnational parks, monuments, forests, and wildliferefuges—state policies directly impact the health andaccessibility of public lands and the local communitiesthat rely on them.
The Center for Western Priorities developed aWestern States Conservation Scorecard to evaluatestate policies in eight Western states—Arizona,Colorado, Idaho, Montana, Nevada, New Mexico,Utah, and Wyoming—placing a score on each state’scommitment to protecting and enhancing public landsin three key areas: lands and access, outdoorrecreation, and responsible energy development. Thegoal of the scorecard is to illuminate best practicesand gaps in state-level public lands-related policy inthe West. This excerpt from the original reportfeatures responsible energy development issues.
States are in the unique position to help build aculture and economy that protects and enhancesAmerica’s public lands: state energy regulationssafeguard air and water, state-level offices of outdoorrecreation encourage the growth of outdoor business,and state wildlife conservation efforts protect wildlifefrom development. Effective state policies andregulations are replicated by other states and thefederal government. Two years after Colorado passeda rule limiting methane waste from oil and gasoperations, the Bureau of Land Managementauthored its own set of rules based on Colorado’smodel. After Utah and Colorado opened offices ofoutdoor recreation, Montana followed suit.
No one state does everything perfectly, and not everysolution works for every state, but what is clear is thatWestern states have a lot to offer and learn from oneanother.
Responsible Energy Development
Oil and gas extraction has long impacted theAmerican West with economic booms and busts,spills, water contamination, air pollution, and habitatfragmentation. Energy production continues to be amajor presence in the region, with Wyoming, NewMexico, and Colorado all listed among the top tenproducing states of crude oil in the nation.1 Eventhough the types and quantity of energy productionvary from state-to-state, Western states should enactresponsible and commonsense measures that reducethe impacts of energy development on our Westerncommunities, public lands, water, and wildlife.2,3
Standards that protect public health and theenvironment can be established through statutes,
Western States Conservation Scorecard:An Analysis of Lands and Energy PolicyAcross the West
Center for Western Priorities
The Center for Western Priorities is a nonpartisanconservation and advocacy organization based inDenver, Colorado. The Center advances responsibleconservation and energy practices in the West byencouraging open, public debate, conducting originalresearch, and promoting responsible policies. A projectof the Resource Legacy Fund, the Center works toensure accountability at all levels to protect land,water, and communities in the American West.

Volume 32 Number 4 Renewable Resources Journal 21
stipulations of permit conditions, and voluntary action. As technology and practices change and improve overtime, rules and regulations can too. Every state has room for improvement and every state has its own set ofenergy challenges. This scorecard examines a sampling of state-level policies related to energy development.
Benchmark: Setbacks from Oil and Gas
Possible Points
2 points total: Half-mile setback or greater1 point total: Less than half-mile setback0 points: No setback
Why is This Important?
Setbacks, or required distances between drilling sites and private residences, schools, and other development,keep disturbances associated with energy development—such as air and noise pollution—at a distance.Setbacks from local water wells are preventative measures to avoid water contamination. Across the West, staterules on setbacks vary significantly, including in distance and jurisdiction.
What are States Doing?
Colorado’s required setbacks vary from 1,000 feet from multi-occupancy buildings to 500 feet fromresidences.4,5 Wyomingmaintains a setback of 500 feet.6 In 2016, Idaho decided to keep their setbackrequirement at 300 feet instead of raising it to 500 feet.7 NewMexico and Utah let counties determine setbacks,which range dramatically.8,9 Arizona’s setbacks vary from 150-1,000 feet.10 Nevada has a 300 foot setback rulefor fracking wells, but none for conventional wells.11 Montana has no setback rules.
Scores
2 of 2 points: none1 of 2 points: Arizona, Colorado, Idaho, New Mexico, Nevada, Utah, Wyoming0 points:Montana
Benchmark: Public Disclosure of Fracking Chemicals
Possible Points
1 point: Required, transparent reporting1 point: Limit on trade secret claims
Why is This Important?
Many chemicals are injected into the earth during oil and gas extraction. Though these mixes are often covetedand secret tools of the trade, requiring public disclosure of fracking chemicals encourages the use of less toxicfluids, and ensures accountability for their potentially harmful effects.

Volume 32 Number 4 Renewable Resources Journal 22
What are States Doing?
In 2010,Wyoming became the first state to require disclosure of fracking chemicals.12 Industry soon beganvoluntarily reporting chemicals on FracFocus, a registry established by the Ground Water Protection Council andthe Interstate Oil and Gas Compact Commission.13 In 2015, the federal government recommended all companiesdrilling on federal public lands use this tool.14
Today, Colorado, Idaho, Nevada, and Utah, require public reporting using FracFocus.15,16 In the case ofColorado, reporting is required 48 hours prior to hydraulically fracturing a well. Other states—likeMontana andNewMexico— have their own systems of disclosing chemicals through their state agencies.17,18 Arizona has nofracking chemical disclosure rules and reporting through FracFocus is voluntary.19 Wyoming and Colorado havealso taken measures to make it more difficult for trade secret claims to trump disclosure.20
Scores
2 of 2 points: Colorado, Wyoming1 of 2 points: Idaho, Montana, New Mexico, Nevada, Utah0 points: Arizona
Benchmark: Spill Reporting & Transparency
Possible Points
1 point: Spill reporting requirements1 point: Publicly-available online spill database
Why is This Important?
Spills are an ongoing reality of energy development. When spills do happen, it’s essential that states requireproducers to report them and for the state to transparently convey that information to the public. This datashould be easily available online and easily accessible for the public to understand the impact of spills.
What are States Doing?
All Western states require oil and gas operators to report spills when they occur. Montana requires immediatereporting of spills by telephone and a written report in five days.21 Colorado’s Rule 906 requires spill reportingwithin the first 24 hours of discovery.22 Arizona, NewMexico, Utah, andWyoming also require industryreporting within 24 hours.23,24,25,26 Nevada and Idaho have spill reporting hotlines.
Colorado, NewMexico, and Utah share spills data publicly in online databases.27,28,29
ThoughWyoming collects spills data, the Wyoming Oil and Gas Conservation Commission does not publish thedata online. Both the Wyoming and Nevada Departments of Environmental Quality post some data on certainspills online; however, their lists are not comprehensive.30,31 In 2015, theMontana Board of Oil and GasConservation began posting state spills data online in monthly increments, but the data is difficult to find.32
Arizona and Idaho do not have publicly-available spills databases online.Scores
2 of 2 points: Colorado, New Mexico, Utah1 of 2 points: Arizona, Idaho, Montana, Nevada, Wyoming0 points: None

Volume 32 Number 4 Renewable Resources Journal 23
Benchmark: Baseline Water Testing
Possible Points
1 point: Testing before and after drilling1 point: Testing within a half-mile radius of wells
Why is This Important?
Baseline water testing at oil and gas sites is important for protecting groundwater from contamination, forprotecting nearby communities, and for determining the source of contamination. Requiring water testingbefore and after drilling across a broad area can provide key data and ensure contamination is detected andaddressed.
What are States Doing?
States vary in how large a radius they require companies to take water samples in, as well as how many waterwells they require companies to sample within that radius. Colorado,Wyoming, and Nevada require pre-drilltesting and two rounds of post-drill testing at four locations within a half-mile of the oil and gas well.33,34,35 TheUtah Geological Survey conducted comprehensive baseline water quality in Utah’s productive Uinta Basin, butno where else in the state.36 In NewMexico, some industry groups have urged companies to voluntarily conductbaseline testing, without success.37
Scores
2 of 2 points: Colorado, Nevada, Wyoming1 of 2 points: Utah0 points: Arizona, Idaho, Montana, New Mexico
Benchmark: Methane Emission Reduction
Possible Points
2 points: Statewide methane capture rules
Why is This Important?
In 2012, it was estimated that nearly a quarter of U.S. greenhouse gas emissions come from oil, gas, and coaldevelopment on public lands.38 Methane, in particular, is a potent greenhouse gas that also contributes to ozoneformation. Methane capture technology not only keeps harmful methane from entering the atmosphere, butgenerates another source of energy, while saving taxpayer resources.What are States Doing?
Colorado is best known for its statewide methane waste rules, which inspired similar regulations at the federallevel.39 Colorado’s landmark rules require oil and gas operators to to capture methane and prevent leaks. Noother Western states have adopted similar methane capture rules.
However, several states have made strides to limit emissions of ozone precursors from oil and gas operations.For example, with the help of the Upper Green River Valley Ozone Task Force,Wyoming created local LeakDetection and Repair (LDAR) requirements for the region, after ongoing noncompliance with EPA ozone levelsrelated to natural gas development.40 Similarly, in 2014, Utah enacted rules to reduce certain emissions from oiland gas operations.41

Volume 32 Number 4 Renewable Resources Journal 24
Scores
2 of 2 points: Colorado0 points: Arizona, Idaho, Montana, New Mexico. Nevada, Utah, Wyoming
Benchmark: Well & Mine Bonding
Possible Points
1 point: Strong bonding requirements for oil and gas wells1 point: Prohibition against self-bonding for coal operations
Why is This Important?
Wells and mines that aren’t retired properly can be potential sources of methane—a highly explosive gas—andwater contamination. When an operator abandons a well or mine, responsibility for reclamation often falls tothe state and taxpayers. Bonding acts like an insurance policy for the state, a backup for contamination orabandonment. Unfortunately, most state bonding requirements are not sufficient to address the real cost ofadequately closing wells and mines—meaning wells and mines often go unreclaimed for long periods of time,posing a greater risk of contamination.42 Most Western states allow companies to pay “blanket bonds,”essentially one price covering multiple wells. Many blanket bond levels are quite low, providing insufficientfunds for reclamation. Another type of policy, found more frequently in coal operations, is “self-bonding,” inwhich companies promise to pay future cleanup costs based on their own financial strength.43 Self-bondingbecomes essentially meaningless when a company goes bankrupt, leaving cleanup efforts to the state, andultimately the taxpayer.
What are States Doing?
All Western states allow some form of blanket bonding for oil and gas wells.44 While those blanket bondinglevels vary significantly, none are strong enough to adequately cover reclamation needs. Colorado, NewMexico, Utah, andWyoming allow varying levels of self-bonding for coal mines, pursuant to financial viabilityrequirements.45 Montana is the only state that explicitly does not allow self-bonding for coal operations.
Scores
2 of 2 points: None1 of 2 points:Montana0 points: Arizona, Colorado, Idaho, New Mexico, Nevada, Utah, Wyoming
Benchmark: Fair Taxpayer Return
Possible Points
1 point: Royalty rates above federal rate (12.5%)1 point: Have severance tax1 point: Have conservation taxWhy is This Important?
Oil and natural gas production can be important sources of public revenue, and it is critical that taxpayersreceive a fair return for energy produced on public lands. There are three main taxes on energy extraction thatensure taxpayers get a fair share: severance taxes, royalty rates, and conservation levies. Severance taxes, or

Volume 32 Number 4 Renewable Resources Journal 25
taxes charged to producers for extracting nonrenewable resources, get redistributed back to the states to offsetcosts associated with production impacts, like road maintenance and environmental protections.46 States alsoreceive royalty payments based on the market value of the resources extracted from state owned lands.Conservation taxes are intended specifically for redirection into conservation and remediation programs.
What are States Doing?
Many Western states have royalty rates that exceed the federal royalty rate of 12.5 percent. Arizona and Idahohave royalty rates that match the federal rate of 12.5 percent, which the Government Accountability Office hassaid does not optimize revenue to provide a fair return for taxpayers.47 Nevada does not have a state royaltyrate. Colorado, NewMexico, and Utah all require an oil and gas conservation tax or levy and a severance tax,while Arizona, Idaho, andWyoming charge a severance tax, but no conservation tax.Montana and Nevadacharge a conservation tax or levy, but no severance tax.48
3 of 3 points: Colorado, New Mexico, Utah2 of 3 points:Montana, Wyoming0 points: Arizona, Idaho, Nevada
Conclusion
Spectacular landscapes and outdoor lifestyles are the calling card of the American West. Along with federal andlocal governments, Western states have and should continue to improve laws to protect our lands, providerecreation access and funding for stewardship, and mitigate the impacts of energy. As laboratories ofdemocracy, improved and strengthened state policies can spread across the region and throughout the nation,strengthening our conservation legacy. With strong policies in place, Western states can ensure our remarkablelands, water, and wildlife are there for the enjoyment generations to come.
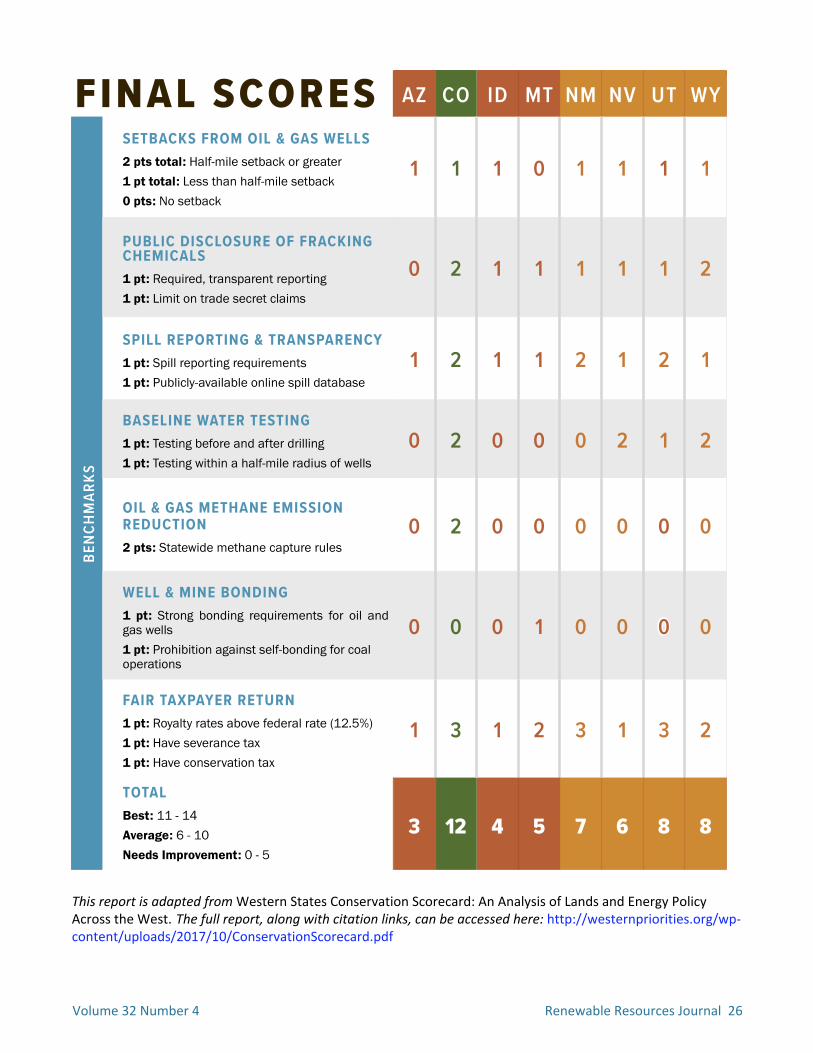
Volume 32 Number 4 Renewable Resources Journal 26Responsible Energy Development | 29
AZ CO ID MT NM NV UT WY
SETBACKS FROM OIL & GAS WELLS2 pts total: Half-mile setback or greater 1 pt total: Less than half-mile setback0 pts: No setback
1 1 1 0 1 1 1 1
PUBLIC DISCLOSURE OF FRACKINGCHEMICALS1 pt: Required, transparent reporting1 pt: Limit on trade secret claims
0 2 1 1 1 1 1 2
SPILL REPORTING & TRANSPARENCY1 pt: Spill reporting requirements1 pt: Publicly-available online spill database
1 2 1 1 2 1 2 1
BASELINE WATER TESTING1 pt: Testing before and after drilling1 pt: Testing within a half-mile radius of wells
0 2 0 0 0 2 1 2
OIL & GAS METHANE EMISSION REDUCTION2 pts: Statewide methane capture rules
0 2 0 0 0 0 0 0
WELL & MINE BONDING1 pt: Strong bonding requirements for oil and gas wells1 pt: Prohibition against self-bonding for coal operations
0 0 0 1 0 0 0 0
FAIR TAXPAYER RETURN1 pt: Royalty rates above federal rate (12.5%) 1 pt: Have severance tax1 pt: Have conservation tax
1 3 1 2 3 1 3 2
TOTALBest: 11 - 14Average: 6 - 10 Needs Improvement: 0 - 5
3 12 4 5 7 6 8 8
F INAL SCORESBE
NCHM
ARKS
Please note, in order to weight the Responsible Energy Development section comparably to other sections, point totals were halved before adding them to the state’s final score on page 3. This report is adapted fromWestern States Conservation Scorecard: An Analysis of Lands and Energy PolicyAcross the West. The full report, along with citation links, can be accessed here: http://westernpriorities.org/wp-content/uploads/2017/10/ConservationScorecard.pdf
Volume 32 Number 4 Renewable Resources Journal 27
Literature Cited
1. U.S. Energy Information Administration. (June 2007). “Rankings: CrudeOil Production (thousand barrels).” Last accessed October 13, 2017:https://www.eia.gov/state/rankings/?sid=US#/series/46
2. U.S. Energy Information Administration. “U.S. States: State Profiles andEnergy Estimates.” Last accessed October 13, 2017: https://www.eia.gov/state/
3. Richardson, N., Gottlieb, M., Krupnick, A. & Wiseman, H. (June 21,2013). “The State of State Shale Gas Regulation: State-by-StateTables.” Center for Energy Information and Policy. Last accessedOctober 13, 2017: http://www.rff.org/files/document/file/RFF-Rpt-StateofStateRegs_StateTables_0.pdf
4. Colorado Oil and Gas Commission. (August 2, 2013). “2013 SetbackRules: Definitions, Zones, Exceptions.” Operator Training Manual.State of Colorado. Last accessed October 13, 2017: http://cogcc.state.co.us/announcements/hot_topics/setbacks/definitions_zones_exceptions.pdf
5. Fortier, J. (April 20, 2017). “How Is Colorado’s Oil And Gas IndustryRegulated?” Community Radio for Northern Colorado (KUNC). Lastaccessed October 13, 2017: http://www.kunc.org/post/how-colorado-s-oil-and-gas-industry-regulated
6. Watson, M. (July 19, 2016). “Wyoming Oil and Gas Conservation NewRules.” Presentation. Wyoming Oil and Gas ConservationCommission. Last accessed October 13, 2017: https://www.wyomingbar.org/wp-content/uploads/Intro-to-Wyomings-Air-Quality-Division.pdf
7. Western Organization of Resource Councils. (July 15, 2016). “IdahoKeeps Oil & Gas Well Setback at 300 Feet.” Last accessed October 13,2017: http://www.worc.org/idaho-well-setback/
8. Intermountain Oil and Gas BMP Project. “New Mexico County andMunicipal Law.” University of Colorado Boulder. Last accessedOctober 13, 2017: http://www.oilandgasbmps.org/laws/new_mexico_localgovt_law.php
9. Intermountain Oil and Gas BMP Project. “Utah County and MunicipalLaw.” University of Colorado Boulder. Last accessed October 13,2017: http://www.oilandgasbmps.org/laws/utah_localgovt_law.html
10. Oil and Gas Conservation Commission. “Arizona Administrative Code.”Last accessed October 13, 2017: http://apps.azsos.gov/public_services/Title_12/12-07.pdf#page=3
11. Interstate Oil and Gas Compact Commission. “Nevada.” State StatutesSummary. Last accessed October 13, 2017: http://iogcc.ok.gov/Websites/iogcc/images/State_Statute_Summaries_2015/Nevada_2015.pdf
12. Zuckerman, L. (March 26, 2012). “Groups seek fuller disclosure offracking Wyoming.”Reuters. Last accessed October 13, 2017: http://www.reuters.com/article/usa-fracking-wyoming/groups-seek-fuller-disclosureof-fracking-in-wyoming-idUSL2E8ER2LV20120327
13. Harvard Environmental Law Program Policy Initiative. “InformationDisclosure.” Harvard Law School. Last accessed October 13, 2017:http://environment.law.harvard.edu/information-disclosure/
14. Office of the Federal Register. (April 26, 2015). “Oil and Gas; HydraulicFracturing on Federal and Indian Lands.” Rule. Bureau of LandManagement. Last accessed October 13, 2017: https://www.federalregister.gov/documents/2015/03/26/2015-06658/oil-andgas-hydraulic-fracturing-on-federal-and-indian-lands
15. Rogers, J. (October 30, 2012). “Notice to Oil and Gas Operators Re:New Hydraulic Fracturing Rule R649-3-30.” Division of Oil, Gas andMining, Utah Department of Natural Resources. Last accessedOctober 13, 2017: https://oilgas.ogm.utah.gov/pub/Notices/Notice_Operators_Hydraulic_Fracturing_Rule_10302012.pdf
16. Colorado Oil and Gas Association. “Colorado’s Oil and Gas RegulatoryTimeline 2010-2016.” Last accessed October 13, 2017: http://www.coga.org/wp-content/uploads/2016/04/Whitepaper-Regulatory-Timeline-.pdf
17. Administrative Rules of Montana. (August 26, 2011). Rule: 36.22.1015.“Disclosure of Well Stimulation Fluids.” Oil and Gas Conservation.Montana Department of Natural Resources and Conservation. Lastaccessed October 13, 2017: http://www.mtrules.org/gateway/RuleNo.asp?RN=36%2E22%2E1015
18. Oil Conservation Division. “Oil and Gas Education.”Energy, Minerals,and Natural Resources Department. State of New Mexico. Lastaccessed October 13, 2017: http://www.emnrd.state.nm.us/OCD/education.html
19. Interstate Oil and Gas Compact Commission. “Arizona.” State StatutesSummary. Last accessed October 13, 2017: http://iogcc.ok.gov/Websites/iogcc/images/State_Statute_Summaries_2015/2015%20SOS/Arizona%202015%20(updated).pdf
20. Hall, K.B. (2013). “Hydraulic Fracturing: Trade Secrets and theMandatory Disclosure of Fracturing Water Composition.” JournalArticle. LSU Law Digital Commons. Louisiana State University LawCenter. Last accessed October 13, 2017: http://digitalcommons.law.lsu.edu/cgi/viewcontent.cgiarticle=1189&context=faculty_40scholarship
21. Administrative Rules of Montana. (April 1, 1992). Rule: 36.22.1103.“Notification and Report of Emergencies and Undesirable Incidents.”Oil and Gas Conservation. Montana Department of Natural Resourcesand Conservation. Last accessed October 13, 2017: http://www.mtrules.org/gateway/RuleNo.asp?RN=36%2E22%2E1103
22. Colorado Oil and Gas Conservation Commission. Rule 906. “Spills andReleases.” State of Colorado. Last accessed October 13, 2017:https://cogcc.state.co.us/Announcements/Hot_Topics/Hydraulic_Fracturing/Rule906.pdf
23. Arizona Administrative Code. R12-7-120. “Notification of Fire, Leaks,Spills, and Blowouts.” Oil and Gas Conservation Commission. State ofArizona. Last accessed October 13, 2017: http://apps.azsos.gov/public_services/Title_12/12-07.pdf
24. Patterson, L., Konschnik, K. E., Wiseman, H., Fargione, J., Maloney, K.O,Kiesecker, J., Nicot, J., Baruch-Mordo, S., Entrekin, S., Trainor, A., &Saiers, J.E. (February 21, 2017). “Unconventional Oil and Gas Spills:Risks, Mitigation Priorities, and State Reporting Requirements.”Environmental Science and Technology. 2017, 51 (5), pp 2563–2573.Last accessed October 13, 2017: http://pubs.acs.org/doi/pdfplus/10.1021/acs.est.6b05749
25. Utah Administrative Code. R649-3-32. “Incident Reporting.” Lastaccessed October 13, 2017: https://rules.utah.gov/publicat/code/r649/r649-003.htm
26. Nevada Division of Environmental Protection. “Spill Hotline: Report aRelease.” Last accessed October 13, 2017: https://ndep.nv.gov/environmental-cleanup/spill-hotline
27. Colorado Oil and Gas Conservation Commission. “Colorado Oil and GasInformation System.” Colorado Department of Natural Resources.State of Colorado. Last accessed October 13, 2017: http://cogcc.state.co.us/data.html#/cogis
28. Oil Conservation Division. “Spill Search.” Energy, Minerals, and NaturalResources Department. State of New Mexico. Last accessed October13, 2017: https://wwwapps.emnrd.state.nm.us/ocd/ocdpermitting/Data/Incidents/Spills.aspx
29. Utah Department of Environmental Quality. “Environmental IncidentsDatabase: Utah State Spills.” State of Utah. Last accessed October 13,2017: http://eqspillsps.deq.utah.gov/Search_Public.aspx
Volume 32 Number 4 Renewable Resources Journal 28
30. Wyoming Department of Environmental Quality. “Spills and EmergencyResponse.” State of Wyoming. Last accessed October 13, 2017:http://deq.wyoming.gov/admin/spills-and-emergency-response/
31. Nevada Division of Environmental Protection. Personalcommunication. October 12, 2017.
32. Montana Board of Oil and Gas. “Hearings.” Department of NaturalResources and Conservation. State of Montana. Last accessedOctober 13, 2017: http://www.bogc.dnrc.mt.gov/Hearings/
33. Nevada State Legislature. NAC 522.722. “Baseline sampling andmonitoring; exceptions.” Nevada Administrative Code, Oil and GasGeneral Provisions. Last accessed October 13, 2017: https://www.leg.state.nv.us/NAC/NAC-522.html#NAC522Sec722
34. Seeley, R. (April 16, 2014). “Baseline water testing rule to removeambiguity in Wyoming.” Unconventional Oil and Gas Report. Lastaccessed October 13, 2017: http://www.ogj.com/articles/uogr/print/volume-2/issue-2/baseline-water-testing-rule-to-remove-ambiguity-in-wyoming.html
35. Koepsell, A. W. Rule 609. “Statewide Groundwater Baseline Samplingand Monitoring.” Colorado Oil and Gas Conservation Commission.State of Colorado. Last accessed October 13, 2017: https://cogcc.state.co.us/COGIS_Help/SampleData.pdf
36. Wallace, J. (January 2013). “Establishing Baseline Water Quality in theSoutheastern Uinta Basin.” Utah Geological Survey. Utah Departmentof Natural Resources. Last accessed October 13, 2017: https://geology.utah.gov/map-pub/survey-notes/establishing-baseline-water-quality-in-the-southeastern-uinta-basin/
37. Matlock, S. (June 22, 2014). “Drilling industry, watchdogs: Testingwater quality is good.” Santa Fe New Mexican. Last accessed October13, 2017: http://www.santafenewmexican.com/news/local_news/drilling-industry-watchdogs-testing-water-quality-is-good/article_26842b75-1936-574b-9720-bfff8d9990d8.html
38. Moser, C., Mantell, J., Thakar, N., Huntley, C., & Lee-Ashley, M. (March19, 2015). “Cutting Greenhouse Gas from Fossil-Fuel Extraction onFederal Lands and Waters.” Center for American Progress. Lastaccessed October 13, 2017: https://www.americanprogress.org/issues/green/reports/2015/03/19/108713/cutting-greenhouse-gas-from-fossil-fuel-extraction-onfederal-lands-and-waters/
39. Ogburn, S. P. (February 25, 2014). “Colorado First State to LimitMethane Pollution from Oil and Gas Wells.” E&E News. Last accessed
October 13, 2017: https://www.scientificamerican.com/article/colorado-firststate-to-limit-methane-pollution-from-oil-and-gaswells/
40. Upper Green River Basin Air Quality Citizens Advisory Task Force.(September 21, 2012). “Recommendations to the WyomingDepartment of Environmental Quality.” Last accessed October 13,2017: https://www.uwyo.edu/haub/_files/_docs/ruckelshaus/collaboration/2012-ozone/ugrb-task-force-recommendations-final-09-21-2012.pdf
41. Utah Department of Environmental Quality. “Ozone in the UintaBasin.” State of Utah. Last accessed October 13, 2017: https://deq.utah.gov/locations/U/uintahbasin/ozone/overview.htm
42. Western Organization of Resource Councils. (August 15, 2016).“Reclamation Bonding Requirements for Oil and Gas Wells.” Lastaccessed October 13, 2017: http://www.worc.org/publication/reclamation-bonding/
43. Paterson, L. (June 17, 2016). “U.S. Lawmakers Want to Ban Self-Bonding.” Inside Energy. Last accessed October 13, 2017: http://wyomingpublicmedia.org/post/us-lawmakers-want-ban-self-bonding
44. Western Organization of Resource Councils. (August 15, 2016).“Reclamation Bonding Requirements for Oil and Gas Wells.” Lastaccessed October 13, 2017: http://www.worc.org/publication/reclamation-bonding/
45. Office of Surface Mining Reclamation and Enforcement. “Self-BondingFacts.” U.S. Department of the Interior. Last accessed October 13,2017: https://www.osmre.gov/resources/selfBonding.shtm
46. Pless, J. (February 2012). “Oil and Gas Severance Taxes: States Work toAlleviate Fiscal Pressures Amid the Natural Gas Boom.” Nationalconference of State Legislatures. Last accessed October 13, 2017:http://www.ncsl.org/research/energy/oil-and-gas-severance-taxes.aspx
47. United States Government Accountability Office. (June 2017). “Oil, Gasand Coal Royalties: Raising Federal Rates Could Decrease Productionon Federal Lands but Increase Federal Revenue.” Report toCongressional Committees. Last accessed October 13, 2017: http://www.gao.gov/assets/690/685335.pdf
48. Appendix, Table B

Volume 32 Number 4 Renewable Resources Journal 29
AnnouncementsAmerican Water Resources Association
2018 Annual ConferenceNovember 4 - 8, 2018. Baltimore, MDhttp://www.awra.org/meetings/Baltimore2018/index.html
This conference will convene water resource professionals and students from throughout the nation and willprovide attendees the opportunity to learn about and engage in multi-disciplinary water resource discussions.The program will stimulate conversations on water resource management, research and education. The 2018conference will also include locally relevant topics such as the Chesapeake Bay, the Delaware River watershed,and eastern water law as well as globally significant issues such as coastal resilience, fire effects on watersheds,communication and outreach strategies and integrated water resources.
American Meteorological Society
AMS 29th Conference on Severe Local StormsOctober 22 - 16, 2018. Stowe, VThttps://www.ametsoc.org/ams/index.cfm/meetings-events/ams-meetings/29th-conference-on-severe-local-storms/
This conference will feature experts on topics related to severe local storms and associated hazards oftornadoes, large hail, damaging winds, lightning, and flash floods.
AMS 99th AMS Annual MeetingJanuary 6 - 10, 2019. Phoenix, AZhttps://annual.ametsoc.org/2019
Join fellow scientists, educators, students, and other professionals from across the weather, water, and climatecommunity in Phoenix, Arizona from 6–10 January, 2019 to share, learn, and collaborate. This year’s theme is“Understanding and Building Resilience to Extreme Events by Being Interdisciplinary, International, and Inclusive(III).”
Geological Society of America
Annual Meeting & ExpositionNovember 4 - 7, 2018. Indianapolis, INhttp://community.geosociety.org/gsa2018/home
This annual meeting will highlight Indiana area geology as well as the wider world of geoscience research.
Volume 32 Number 4 Renewable Resources Journal 30
American Society of Civil Engineers
2018 ConventionOctober 12 - 15, 2018. Denver, COhttp://2018.asceconvention.org/
The ASCE Convention is the Society flagship membership event. The program for the Convention will be of anintegrated, cross-cultural, technical, and educational nature. The following issues will be discussed: state of theindustry and profession; professional development; multi-disciplinary technical, natural and man-madedisasters; strategic issues/public policy; significant projects; and history and heritage.
Society of Environmnetal Toxicology and Chemistry
2018 Asia-Pacific ConferenceSeptember 16 - 19, 2018. Daegu, South Koreahttp://setac-ap2018.org/
This conference is dedicated to provide highly scientific programs as well as stimulating discussion under themain theme “Data, Science, and Management Promoting Environmental Welfare.” In Daegu, experts fromdifferent fields of academia, business, and regulatory communities and large student community will take a partof the conference to provide a multidisciplinary and comprehensive overview of the latest researches withadvanced solutions to environmental challenges.
North America Annual ConferenceNovember 4 - 8, 2018. Sacramento, CAhttps://sacramento.setac.org/
This meeting will explore the link between sustainable economic development and environmental stewardship,with particular focus on ecological and societal considerations. In this context, stewardship represents thepractice of transforming sustainable thinking into action. However, we are challenged to decouple the historicalconnection between economic growth and ecological integrity, and the resultant societal effects. This meetingoffers opportunities to feature the connections between desired ecosystem goods and services, stableflourishing societies and sustainable economies.
American Society for Landscape Architects
2018 Annual MeetingOctober 19 - 22, 2018. Philadelphia, PAhttps://www.asla.org/annualmeetingandexpo.aspx
The ASLA annual meeting will feature a diverse spectrum of industry experts providing perspectives on a widerange of subjects, from sustainable design to active living to best practices and new technologies. More than 130education sessions, field sessions and workshops will be presented during the meeting.

Volume 32 Number 4 Renewable Resources Journal 31
American Geophysical Union
Fall MeetingDecember 10 - 14, 2018 Washington, DChttps://fallmeeting.agu.org/2018/
The AGU 2018 Fall Meeting provides an opportunity to share science with world leaders in Washington, D.C. Asthe largest Earth and space science gathering in the world, the Fall Meeting places participants in the center of aglobal community of scientists drawn from myriad fields of study whose work protects the health and welfare ofpeople worldwide, spurs innovation, and informs decisions that are critical to the sustainability of the Earth.
Geoscience and Society SummitMarch 18 - 21, 2019. Stockholm, Swedenhttps://connect.agu.org/gss/home
The Summit aims to create a highly interactive forum for effective cooperation between scientists and users ofscientific information to tackle global and local challenges around sustainability of natural resources andsystems, global health, and resilience.

Renewable Natural Resources Foundation6010 Executive Blvd, 5th Floor
North Bethesda, Maryland 20852-3827 USA