Embed Size (px)
Citation preview
Denise Cook | Allison MacDonald| Tara McKay | Brian Ramos | Betty SeedMarketing Management – Final Presentation
MARKETING PLAN
Our Company
Mission StatementRenovation Nation is a complete tool rental company providing products and services to meet the needs of homeowners and construction professionals. Our goal is to provide the highest level of service and expertise in the home improvement business. Through our Renovation Nation Foundation, we fund many local activities that support social and economic growth.social and economic growth.
Value Proposition Convenience
Value
Expertise
Objective Serve as a resource to new homeowners, do-it-yourselfers, and contractors in the
community
Market Trends & Growth
U.S. general tool rental market generated $8.4b in 2008.
Growing Do-it-Yourself Market Due to popularity of home improvement shows.
South-Atlantic Region South-Atlantic Region Rapid relocation to area.
North Carolina Real Estate Market Today: Homeowners aren’t moving, they’re improving.
Tomorrow: Projected growth in 2012.
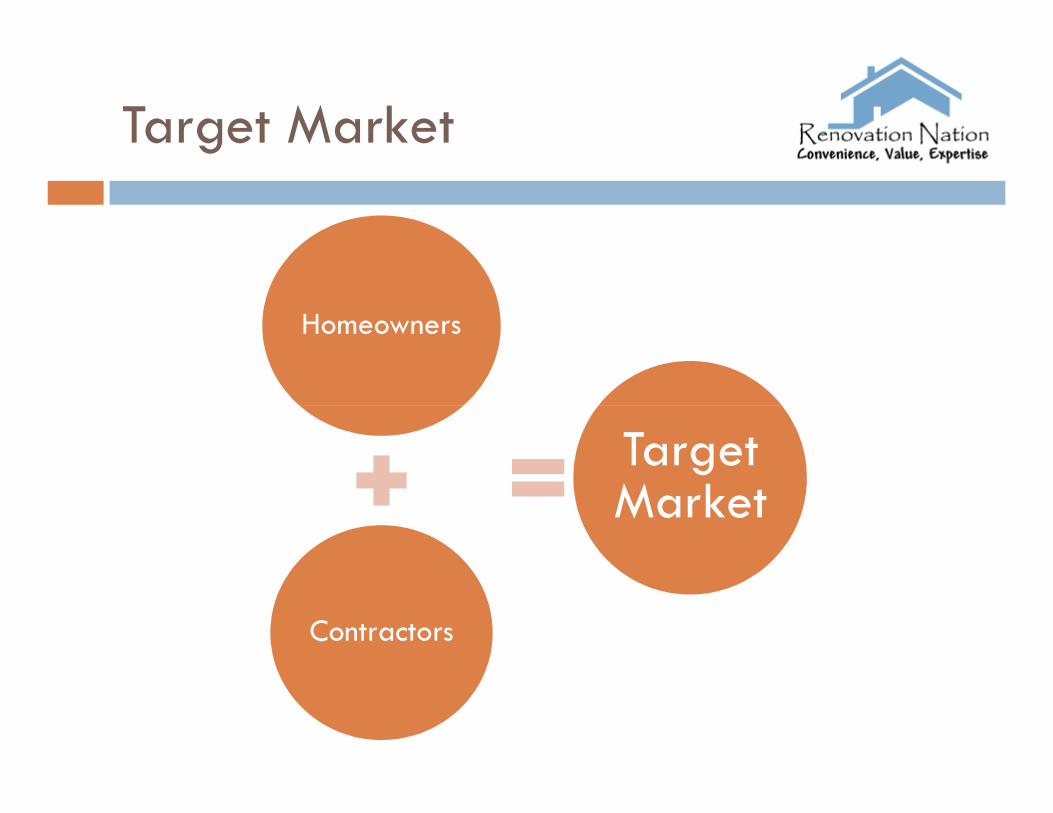
Target Market
Homeowners
Contractors
Target Market
Primary Market Research
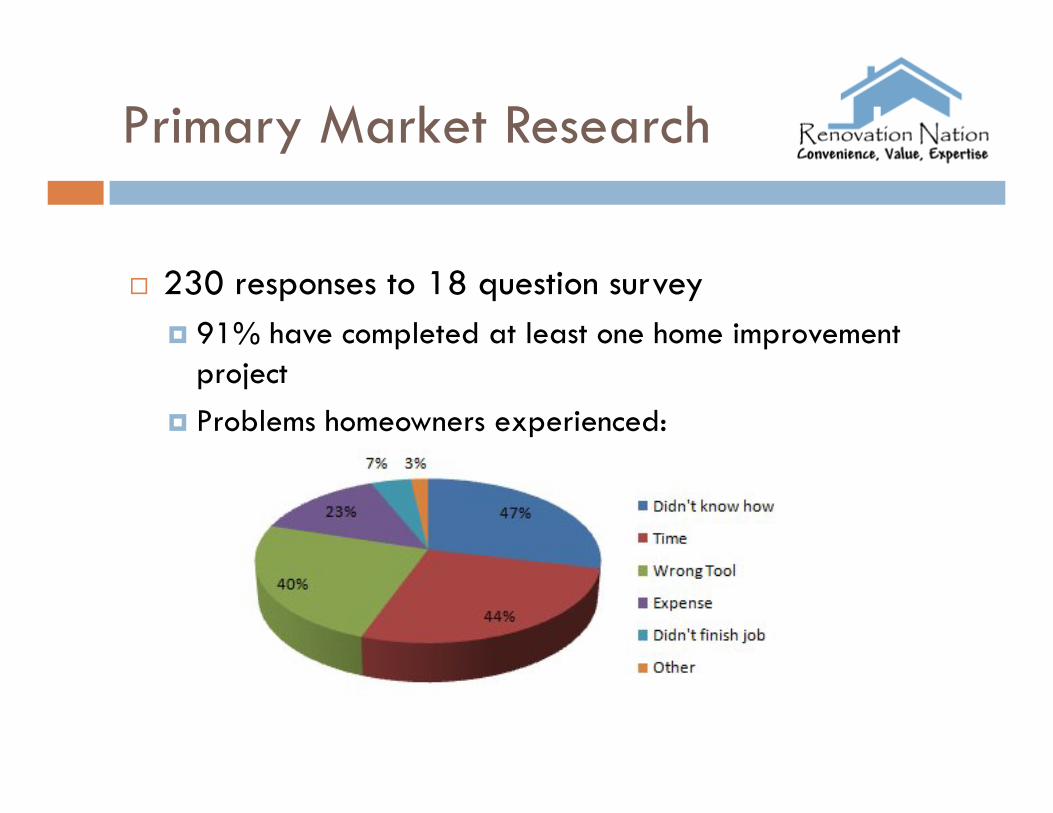
230 responses to 18 question survey 91% have completed at least one home improvement
project
Problems homeowners experienced: Problems homeowners experienced:
Competition
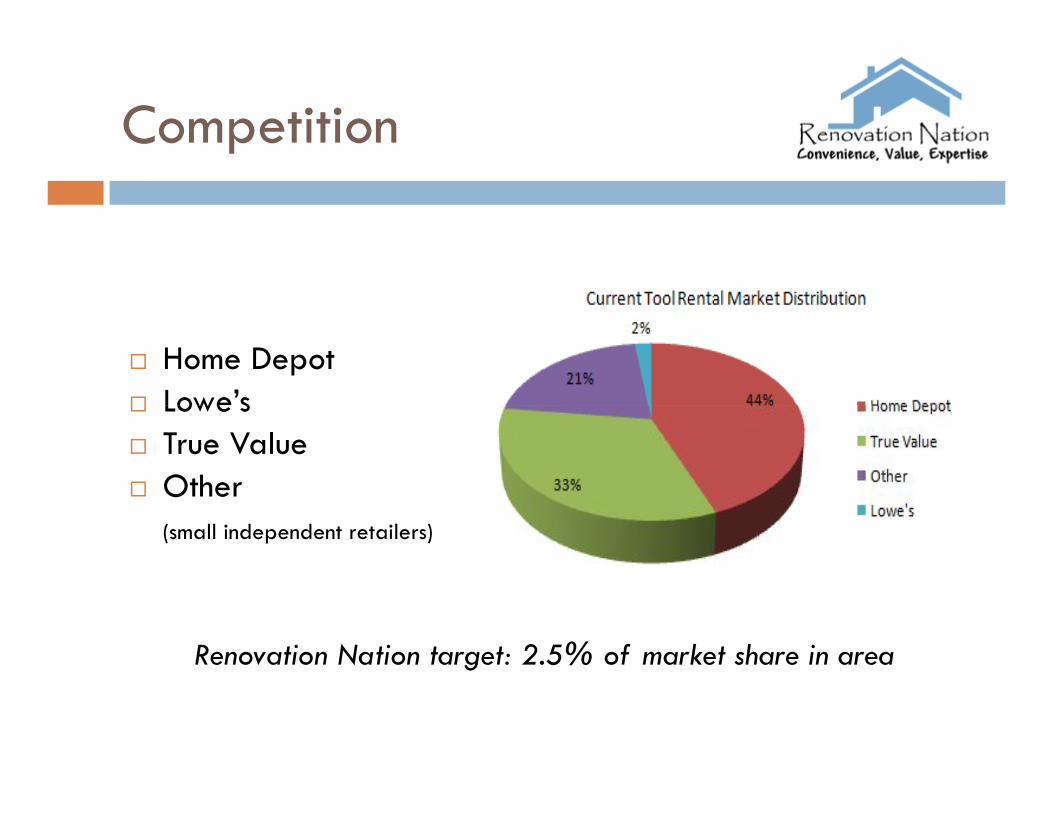
Home Depot Lowe’s Lowe’s True Value Other
(small independent retailers)
Renovation Nation target: 2.5% of market share in area
SWOT Analysis
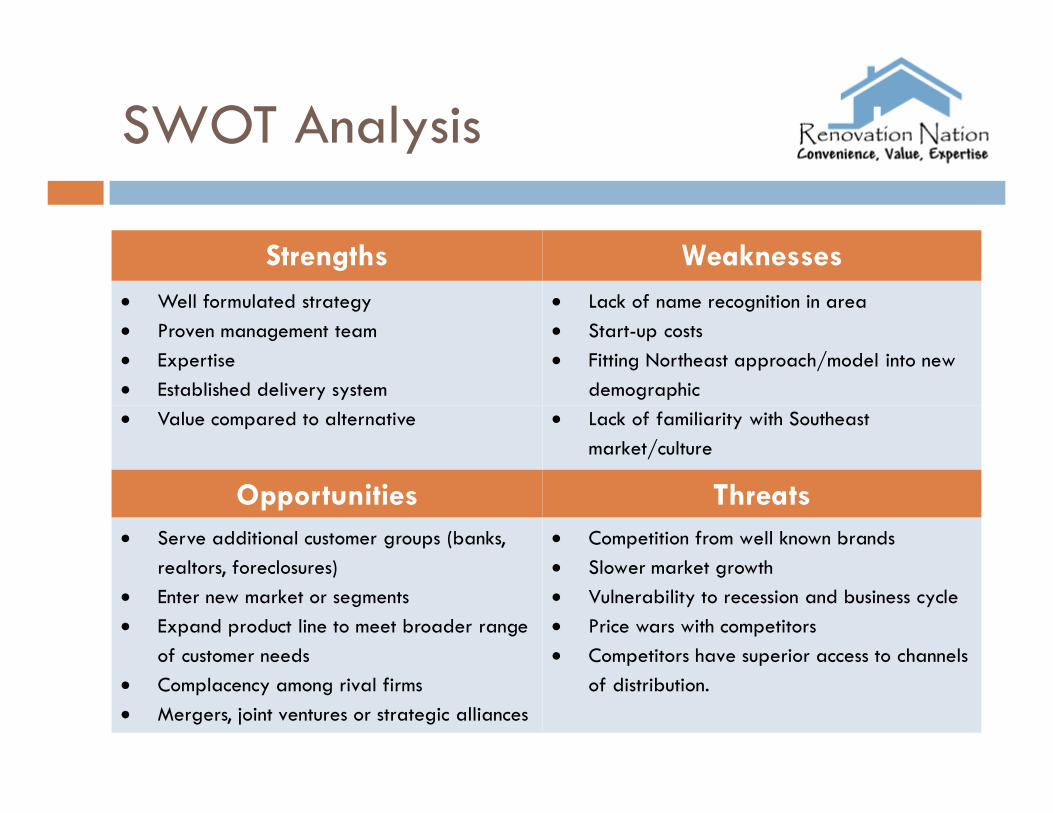
Strengths Weaknesses Well formulated strategy
Proven management team
Expertise
Established delivery system
Value compared to alternative
Lack of name recognition in area
Start-up costs
Fitting Northeast approach/model into new
demographic
Lack of familiarity with Southeast Value compared to alternative Lack of familiarity with Southeast
market/culture
Opportunities Threats Serve additional customer groups (banks,
realtors, foreclosures)
Enter new market or segments
Expand product line to meet broader range
of customer needs
Complacency among rival firms
Mergers, joint ventures or strategic alliances
Competition from well known brands
Slower market growth
Vulnerability to recession and business cycle
Price wars with competitors
Competitors have superior access to channels
of distribution.
Critical Issues
Hiring knowledgeable and enthusiastic staff.
Offering top of the line tools that are meticulously maintained.
Offering innovative communication technology to Offering innovative communication technology to customers.
Provide competitive rates relative to big-box retailers.
Sub-contract only with Handymen who are licensed, reliable and reputable.
Create an aggressive marketing and advertising campaign to gain visibility.
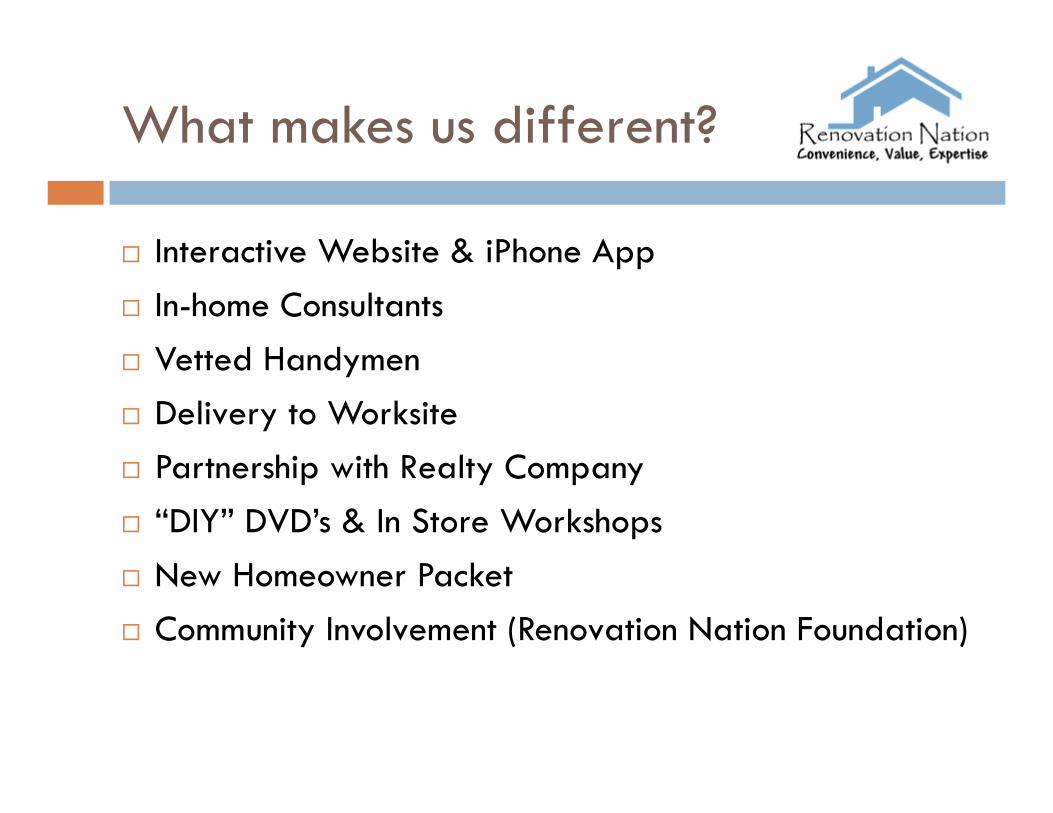
What makes us different?
Interactive Website & iPhone App
In-home Consultants
Vetted Handymen
Delivery to Worksite Delivery to Worksite
Partnership with Realty Company
“DIY” DVD’s & In Store Workshops
New Homeowner Packet
Community Involvement (Renovation Nation Foundation)
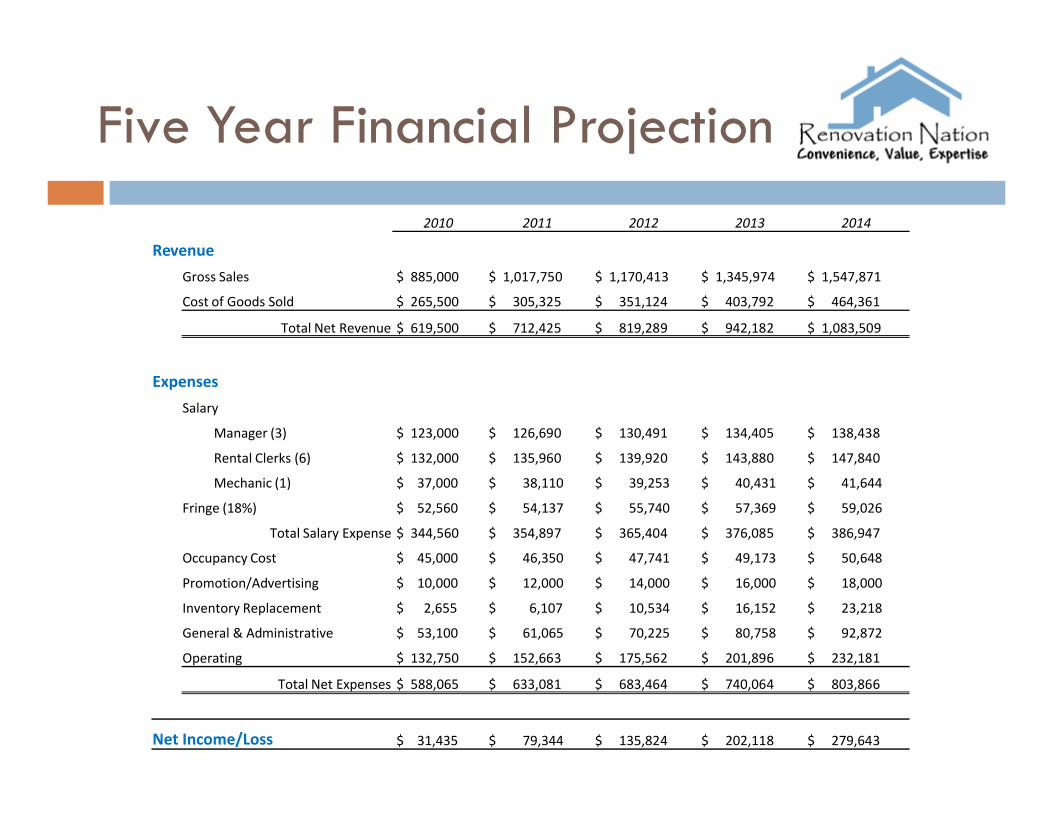
Five Year Financial Projection
2010 2011 2012 2013 2014
RevenueGross Sales $ 885,000 $ 1,017,750 $ 1,170,413 $ 1,345,974 $ 1,547,871
Cost of Goods Sold $ 265,500 $ 305,325 $ 351,124 $ 403,792 $ 464,361
Total Net Revenue $ 619,500 $ 712,425 $ 819,289 $ 942,182 $ 1,083,509
ExpensesSalarySalary
Manager (3) $ 123,000 $ 126,690 $ 130,491 $ 134,405 $ 138,438
Rental Clerks (6) $ 132,000 $ 135,960 $ 139,920 $ 143,880 $ 147,840
Mechanic (1) $ 37,000 $ 38,110 $ 39,253 $ 40,431 $ 41,644
Fringe (18%) $ 52,560 $ 54,137 $ 55,740 $ 57,369 $ 59,026
Total Salary Expense $ 344,560 $ 354,897 $ 365,404 $ 376,085 $ 386,947
Occupancy Cost $ 45,000 $ 46,350 $ 47,741 $ 49,173 $ 50,648
Promotion/Advertising $ 10,000 $ 12,000 $ 14,000 $ 16,000 $ 18,000
Inventory Replacement $ 2,655 $ 6,107 $ 10,534 $ 16,152 $ 23,218
General & Administrative $ 53,100 $ 61,065 $ 70,225 $ 80,758 $ 92,872
Operating $ 132,750 $ 152,663 $ 175,562 $ 201,896 $ 232,181
Total Net Expenses $ 588,065 $ 633,081 $ 683,464 $ 740,064 $ 803,866
Net Income/Loss $ 31,435 $ 79,344 $ 135,824 $ 202,118 $ 279,643
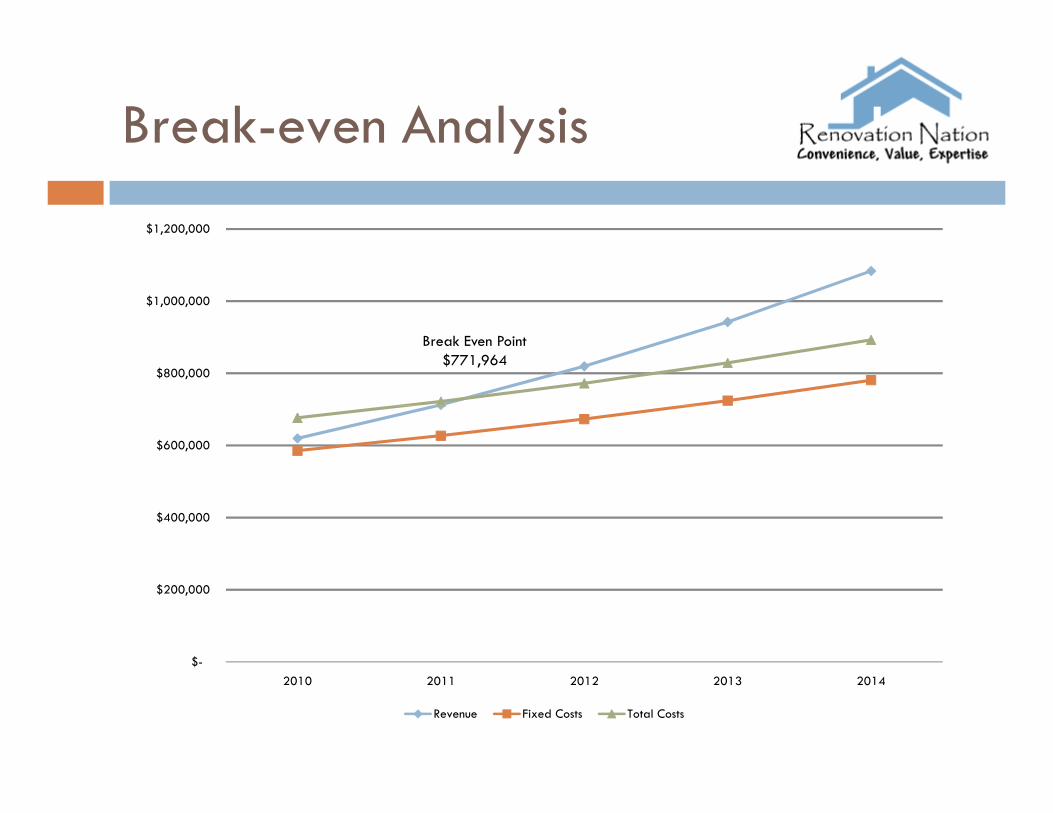
Break-even Analysis
$800,000
$1,000,000
$1,200,000
Break Even Point$771,964
$-
$200,000
$400,000
$600,000
2010 2011 2012 2013 2014
Revenue Fixed Costs Total Costs

Questions & Answers