Embed Size (px)
Citation preview
Urban Development Area – Take Up Rate
Analysis
January 2011
Copyright © Urbis Pty Ltd ABN 50 105 256 228 All Rights Reserved. No material may be reproduced without prior permission. While we have tried to ensure the accuracy of the information in this publication, the Publisher accepts no responsibility or liability for any errors, omissions or resultant consequences including any loss or damage arising from reliance in information in this publication. URBIS Australia Asia Middle East www.urbis.com.au
DISCLAIMER
This report is prepared on the instructions of the party to whom or which it is addressed and is thus not suitable for use other than by that party. As the report involves future forecasts, it can be affected by a number of unforeseen variables. It represents for the party to whom or which it is addressed the best estimates of Urbis Pty Ltd, but no assurance is able to be given by Urbis Pty Ltd that the forecasts will be achieved.
URBIS STAFF RESPONSIBLE FOR THIS REPORT WERE:
Director Malcolm Aikman
Senior Consultant Sam Wood
Consultant David Cramb
Job Code BPE0332 xdisclai mer x
TABLE OF CONTENTS
Rep-BPE0332-250111-UDA Take Up Rate Analysis
1 Urban Development Areas ............................ ..................................................................................1
2 Case Studies ....................................... ..............................................................................................2 2.1 North Lakes .............................................................................................................................2 2.1.1 Development Scale and Project Background..........................................................................2 2.1.2 Take Up Rates.........................................................................................................................2 2.2 Springfield................................................................................................................................4 2.2.1 Development Scale and Project Background..........................................................................4 2.2.2 Take Up Rates.........................................................................................................................4 2.3 Coomera..................................................................................................................................5 2.3.1 Development Scale and Project Background..........................................................................6 2.3.2 Take Up Rates and Development Cycle .................................................................................6 2.4 Case Study Findings ...............................................................................................................7
3 Regional Comparison ................................ ......................................................................................9 3.1 Greater Flagstone....................................................................................................................9 3.2 Yarrabilba ..............................................................................................................................10 3.3 Ripley Valley..........................................................................................................................10 3.3.1 Springfield Comparability Analysis ........................................................................................11 3.4 Caloundra South....................................................................................................................12
4 Recommendations .................................... .....................................................................................14 4.1 Ripley Valley..........................................................................................................................14 4.2 Greater Flagstone..................................................................................................................17 4.3 Yarrabilba ..............................................................................................................................20 4.4 Caloundra South....................................................................................................................23
URBAN DEVELOPMENT AREAS
Rep-BPE0332-250111-UDA Take Up Rate Analysis Page 1
1 Urban Development Areas The Urban Land Development Authority (ULDA) is undertaking strategic planning work for a number of new Urban Development Areas (UDAs) in South East Queensland. These are major master plan communities or areas of substantial scale including:
� Yarrabilba – Logan City Council
� Flagstone – Logan City Council
� Ripley Valley – Ipswich City Council
� Caloundra South – Sunshine Coast Regional Council
To inform the strategic planning work the ULDA has asked Urbis to assess the likely take up rates for the four separate UDAs and provide estimated development timeframes for each area.
In order to inform our view we have analysed comparable Case Study areas to identify take up rate trends and maximum annual take up. These areas are reviewed in the following section.
CASE STUDIES
Rep-BPE0332-250111-UDA Take Up Rate Analysis Page 2
2 Case Studies In reviewing the take up rate forecasts for the four SEQ UDAs under study, we have identified three existing relatively comparable SEQ master planned communities which provide insights to achievable take up rates, development cycle trends and project timing.
The three master planned areas include;
� North Lakes – Moreton Bay Regional Council
� Springfield – Ipswich City Council
� Coomera – Gold Coast City Council
2.1 North Lakes North Lakes is comparable to the UDAs under study particularly Caloundra South. Relevant comparable factors include:
� Located on the outskirts of Brisbane but accessible to the Sunshine Coast
� Major road proximity
� Major Regional Activity Centre proximity
� Potential future rail line
� Major employment provision
The major difference between North Lakes and the study UDAs is its scale. Yielding around 8,500 lots it is 20-40% of the scale of these UDAs.
2.1.1 Development Scale and Project Background
North Lakes is a master planned community located approximately 25 kilometres north of the Brisbane CBD in Moreton Bay Shire. Whilst principally incorporating the Stockland residential and town centre development, it also includes some surrounding estates in the wider Mango Hill area. The Stockland development has an expected final population of around 25,000 people or around 8,500 lots.
2.1.2 Take Up Rates
This section analyses vacant lot sales data for the North Lakes area by individual developer. It is important to note that “Queensland Subdivision” initially developed in the area and helped establish the area as a residential community. Whilst not part of the North Lakes master planned community the lot sales have been included in this analysis as they were essential in establishing the region as a viable residential option.
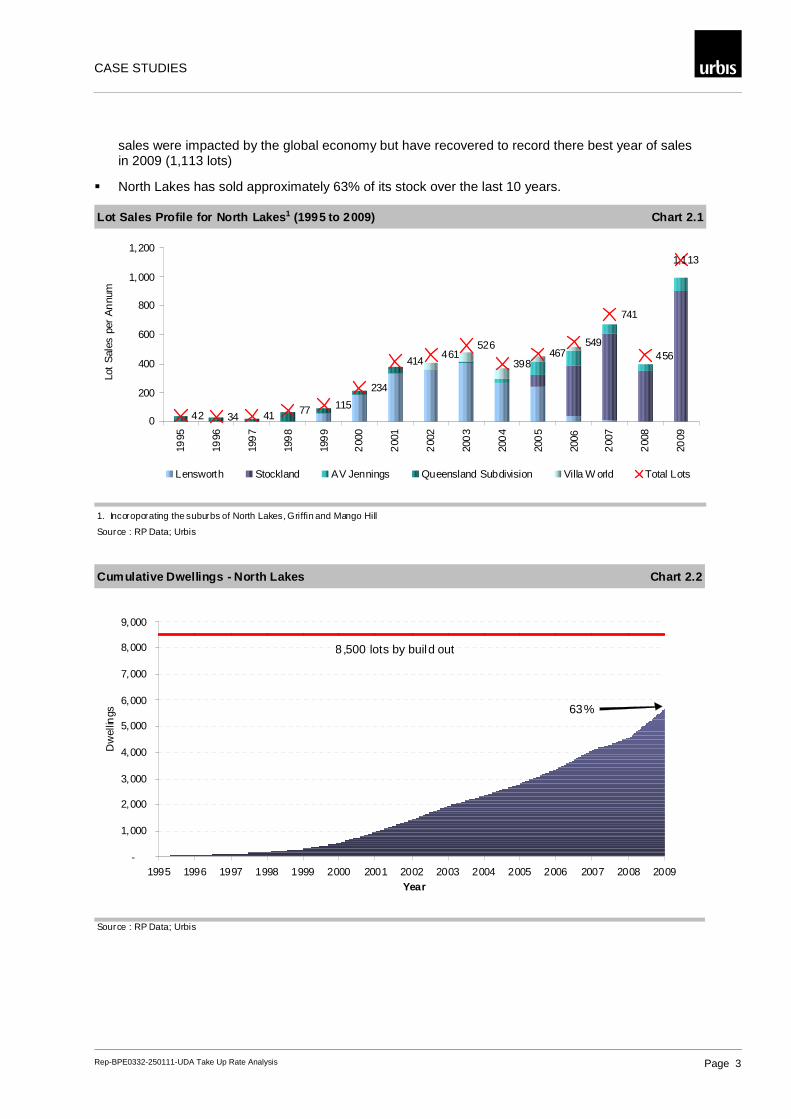
Chart 2.1 and Chart 2.2 shows annual sales and cumulative lot sales for North Lakes, relevant insights include;
� Between 1995 and 2009 North Lakes sold a total of 5,668 residential lots, averaging 405 lots per annum
� The initial 5 years of development achieved 309 vacant lot sales, typical of the initial stages of a development as an area establishes itself and develops essential community facilities. As previously mentioned the majority of initial sales relate to an adjacent development, however this played an important role in establishing the area
� Once North Lakes was established, annual lot sales increased year on year for the first 5 years before retracting slightly in year 6 (398 sales) before continuing annual growth to 2007. By 2008,
CASE STUDIES
Rep-BPE0332-250111-UDA Take Up Rate Analysis Page 3
sales were impacted by the global economy but have recovered to record there best year of sales in 2009 (1,113 lots)
� North Lakes has sold approximately 63% of its stock over the last 10 years.
Lot Sales Profile for North Lakes 1 (1995 to 2009) Chart 2.1
1. Incoroporating the suburbs of North Lakes, Griffin and Mango Hill
Source : RP Data; Urbis
42 34 41 77 115
234
414461
526
398467
549
741
456
1,113
0
200
400
600
800
1,000
1,200
1995
1996
199
7
199
8
199
9
200
0
200
1
200
2
200
3
200
4
200
5
2006
200
7
200
8
2009
Lot
Sal
es p
er A
nnu
m
Lensworth Stockland AV Jennings Queensland Subdivision Villa W orld Total Lots
Cumulative Dwellings - North Lakes Chart 2.2
Source : RP Data; Urbis
-
1,000
2,000
3,000
4,000
5,000
6,000
7,000
8,000
9,000
1995 1996 1997 1998 1999 2000 2001 2002 2003 2004 2005 2006 2007 2008 2009Year
Dw
ellin
gs 63%
8,500 lots by build out
CASE STUDIES
Rep-BPE0332-250111-UDA Take Up Rate Analysis Page 4
2.2 Springfield Greater Springfield has many comparable factors to the study UDAs including:
� Scale – lots and population
� Pioneering new development area which required time and investment to build brand and provide product differentiation
� Facilitated by major infrastructure investment
� Initially single developer that has since introduced additional developers
� A range of development fonts and products with quality and price differentiation
Notable differences which should be considered in the development strategies of these study UDAs are:
� Covered by own development legislation – the ULDA may be able to replicate the benefits of this
� Designation of Principal Regional Activity Centre Status
2.2.1 Development Scale and Project Background
Greater Springfield is a master planned community located approximately 28 kilometres south west of the Brisbane CBD in Ipswich City Council. The development has an expected population of around 86,000 persons by 2030. This is equivalent to approximately 24,400 lots assuming an average of 3.0 people per household (Springfield average, 2006 Census of Population and Housing) and 85% of the population living in detached housing.
2.2.2 Take Up Rates
This section analyses vacant lot sales data for the Springfield area by individual developer. Chart 2.3 illustrates annual sales for the master planned community.
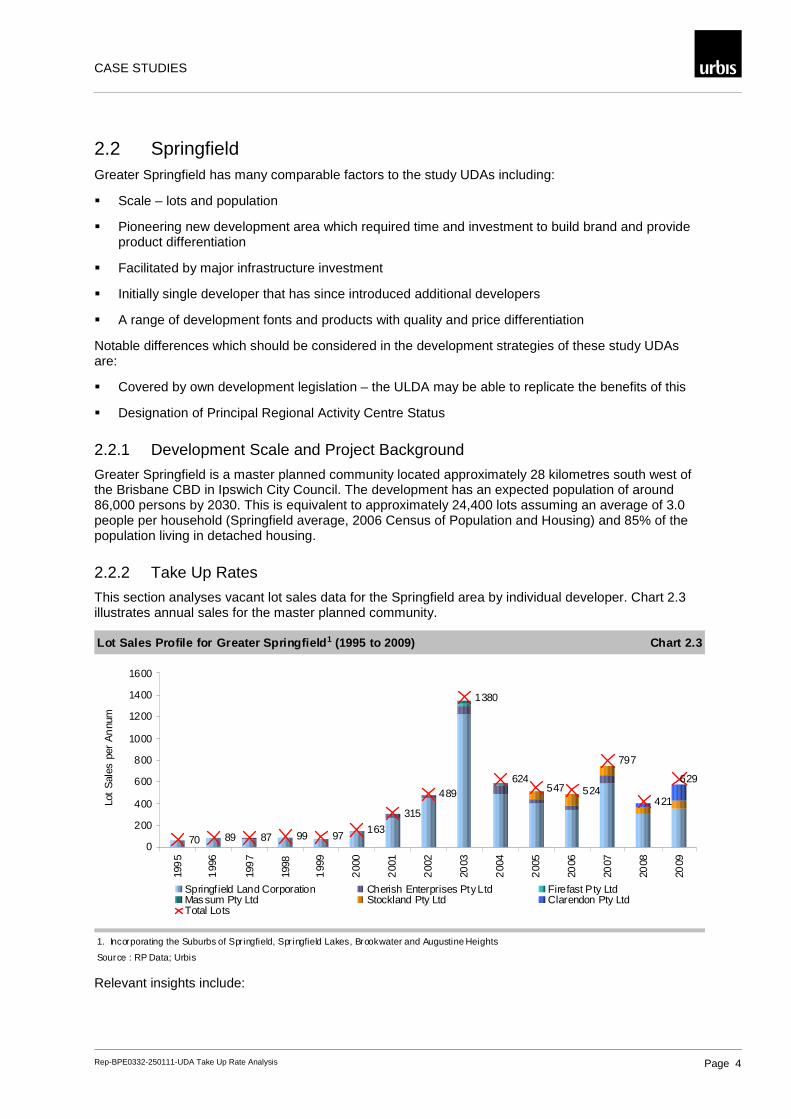
Lot Sales Profile for Greater Springfield 1 (1995 to 2009) Chart 2.3
1. Incorporating the Suburbs of Springfield, Springfield Lakes, Brookwater and Augustine Heights
Source : RP Data; Urbis
70 89 87 99 97163
315
489
1380
624547 524
797
421
629
0
200
400
600
800
1000
1200
1400
1600
199
5
199
6
199
7
1998
199
9
200
0
200
1
200
2
2003
200
4
200
5
2006
2007
2008
2009
Lot
Sal
es p
er A
nnu
m
Springf ield Land Corporation Cherish Enterprises Pty Ltd Firefast Pty LtdMassum Pty Ltd Stockland Pty Ltd Clarendon Pty LtdTotal Lots
Relevant insights include:
CASE STUDIES
Rep-BPE0332-250111-UDA Take Up Rate Analysis Page 5
� Between 1995 and 2009 Greater Springfield sold a total of 6,331 residential lots, averaging 422 lots per annum
� Initially Springfield had a period of 5 consecutive sales periods of achieving under 100 lots, typical of the initial stages of a development as an area establishes itself and develops essential community facilities and infrastructure
� Lot sales started to increase in 2001 and 2002 before peaking in 2003 at 1,380 sales. Since 2003, lot sales have been steady, averaging approximately 590 sales per annum
� Over the 15 years, the major developer within Greater Springfield region has been the Springfield Land Corporation with Delfin Lend Lease taking over the major residential development role through arrangement with Springfield Land Corporation. Stockland also has a significant residential development at Augustine Heights
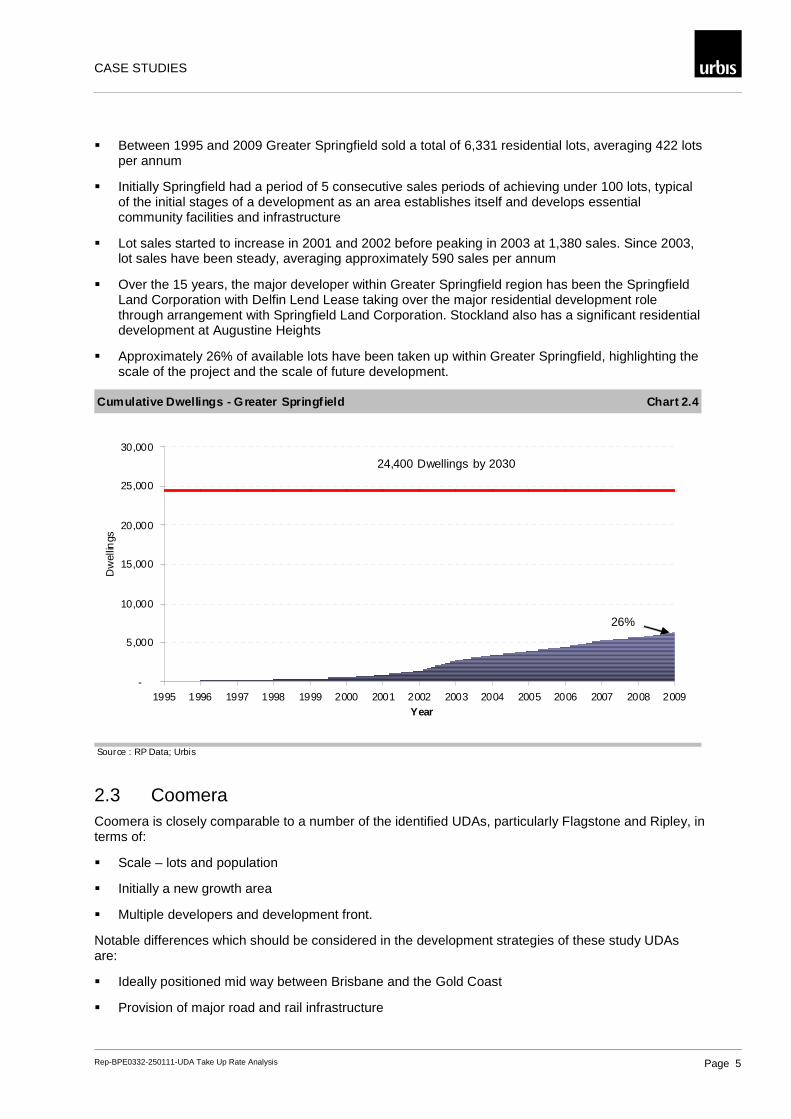
� Approximately 26% of available lots have been taken up within Greater Springfield, highlighting the scale of the project and the scale of future development.
Cumulative Dwellings - Greater Springf ield Chart 2.4
Source : RP Data; Urbis
-
5,000
10,000
15,000
20,000
25,000
30,000
1995 1996 1997 1998 1999 2000 2001 2002 2003 2004 2005 2006 2007 2008 2009Year
Dw
ellin
gs
26%
24,400 Dwellings by 2030
2.3 Coomera Coomera is closely comparable to a number of the identified UDAs, particularly Flagstone and Ripley, in terms of:
� Scale – lots and population
� Initially a new growth area
� Multiple developers and development front.
Notable differences which should be considered in the development strategies of these study UDAs are:
� Ideally positioned mid way between Brisbane and the Gold Coast
� Provision of major road and rail infrastructure
CASE STUDIES
Rep-BPE0332-250111-UDA Take Up Rate Analysis Page 6
2.3.1 Development Scale and Project Background
Led by Austcorp but incorporating a number of large, medium and small developers spanning the M1 Motorway, Coomera is located approximately 50 kilometres south east of the Brisbane CBD. The population of Coomera grew by 24% in 2005 to over 18,500 residents, with forecast population to reach around 80,000 people by 2036. By applying an average household size of 3.0 persons per dwelling and assuming 85% of the future population will live in a detached dwelling there would be an estimated 22,600 lots in Coomera by 2036.
2.3.2 Take Up Rates and Development Cycle
This section analyses vacant lot sales data for the Coomera area by individual developer. Chart 2.5 and Chart 2.6 illustrates annual sales and cumulative lot sales for Coomera.
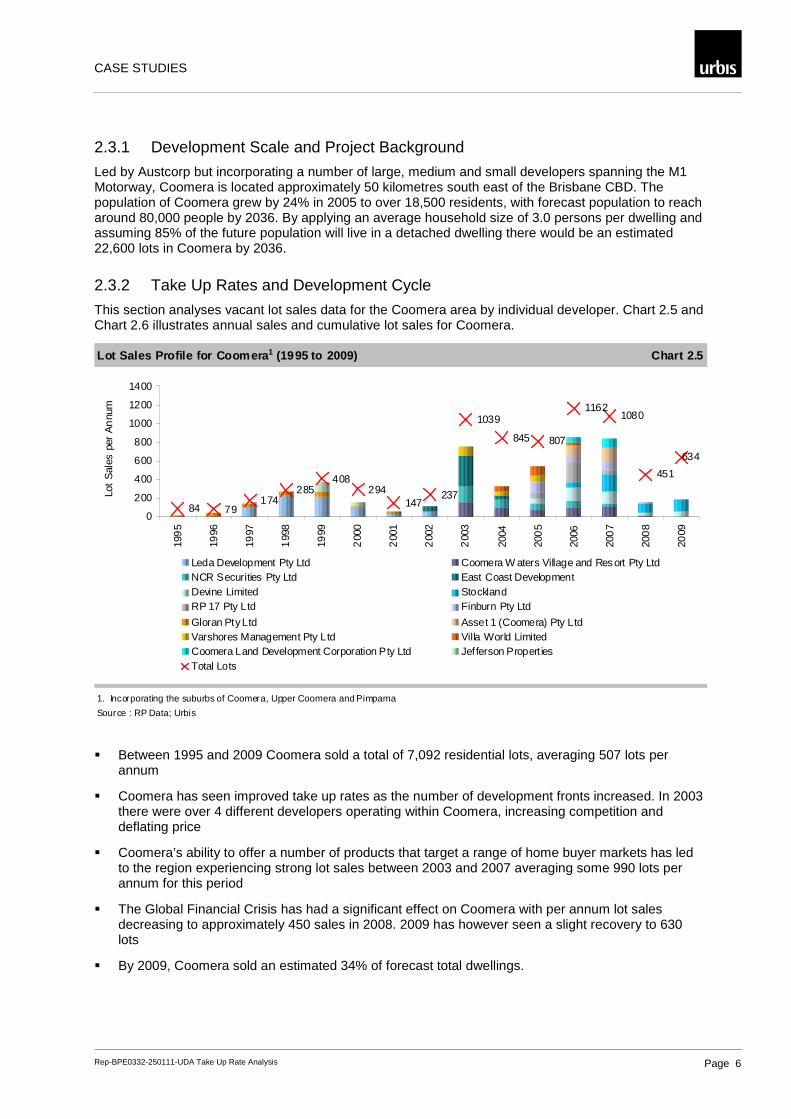
Lot Sales Profile for Coomera 1 (1995 to 2009) Chart 2.5
1. Incorporating the suburbs of Coomera, Upper Coomera and Pimpama
Source : RP Data; Urbis
84 79174
285408
294147
237
1039
845 807
11621080
451
634
0
200
400
600
800
1000
1200
1400
199
5
1996
1997
199
8
1999
200
0
200
1
200
2
200
3
2004
200
5
2006
200
7
200
8
2009
Lot
Sal
es p
er A
nnu
m
Leda Development Pty Ltd Coomera W aters Village and Resort Pty LtdNCR Securities Pty Ltd East Coast DevelopmentDevine Limited StocklandRP 17 Pty Ltd Finburn Pty Ltd
Gloran Pty Ltd Asset 1 (Coomera) Pty LtdVarshores Management Pty Ltd Villa World LimitedCoomera Land Development Corporation Pty Ltd Jefferson Propert iesTotal Lots
� Between 1995 and 2009 Coomera sold a total of 7,092 residential lots, averaging 507 lots per annum
� Coomera has seen improved take up rates as the number of development fronts increased. In 2003 there were over 4 different developers operating within Coomera, increasing competition and deflating price
� Coomera’s ability to offer a number of products that target a range of home buyer markets has led to the region experiencing strong lot sales between 2003 and 2007 averaging some 990 lots per annum for this period
� The Global Financial Crisis has had a significant effect on Coomera with per annum lot sales decreasing to approximately 450 sales in 2008. 2009 has however seen a slight recovery to 630 lots
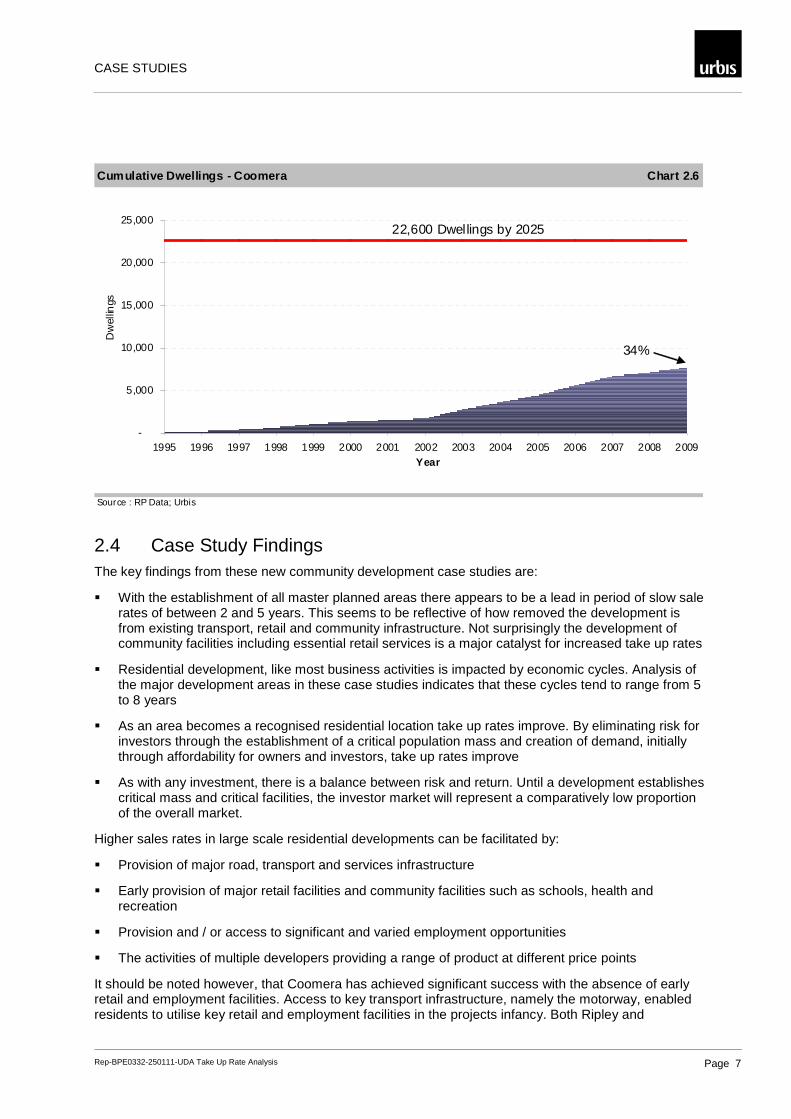
� By 2009, Coomera sold an estimated 34% of forecast total dwellings.
CASE STUDIES
Rep-BPE0332-250111-UDA Take Up Rate Analysis Page 7
Cumulative Dwellings - Coomera Chart 2.6
Source : RP Data; Urbis
-
5,000
10,000
15,000
20,000
25,000
1995 1996 1997 1998 1999 2000 2001 2002 2003 2004 2005 2006 2007 2008 2009Year
Dw
ellin
gs
22,600 Dwellings by 2025
34%
2.4 Case Study Findings The key findings from these new community development case studies are:
� With the establishment of all master planned areas there appears to be a lead in period of slow sale rates of between 2 and 5 years. This seems to be reflective of how removed the development is from existing transport, retail and community infrastructure. Not surprisingly the development of community facilities including essential retail services is a major catalyst for increased take up rates
� Residential development, like most business activities is impacted by economic cycles. Analysis of the major development areas in these case studies indicates that these cycles tend to range from 5 to 8 years
� As an area becomes a recognised residential location take up rates improve. By eliminating risk for investors through the establishment of a critical population mass and creation of demand, initially through affordability for owners and investors, take up rates improve
� As with any investment, there is a balance between risk and return. Until a development establishes critical mass and critical facilities, the investor market will represent a comparatively low proportion of the overall market.
Higher sales rates in large scale residential developments can be facilitated by:
� Provision of major road, transport and services infrastructure
� Early provision of major retail facilities and community facilities such as schools, health and recreation
� Provision and / or access to significant and varied employment opportunities
� The activities of multiple developers providing a range of product at different price points
It should be noted however, that Coomera has achieved significant success with the absence of early retail and employment facilities. Access to key transport infrastructure, namely the motorway, enabled residents to utilise key retail and employment facilities in the projects infancy. Both Ripley and

CASE STUDIES
Rep-BPE0332-250111-UDA Take Up Rate Analysis Page 8
Caloundra South UDAs have similar access to existing facilities and may be able to leverage from these during project start up.
REGIONAL COMPARISON
Rep-BPE0332-250111-UDA Take Up Rate Analysis Page 9
3 Regional Comparison The following section analyses the forecast regional dwelling demand estimates sourced from the Planning Information and Forecasting Unit (Office of Economic and Statistical Research) local government area (LGA) dwelling projections and compares to the forecast supply the UDAs will provide, assuming a linear development time frame and typical take up rate pattern. Furthermore, it will identify market shares for the UDA developments and compare these to case study market shares (in particular Ripley Valley and Greater Springfield).
The following list identifies the UDA development and the local government area/s that each was compared to.
� Greater Flagstone – Logan and Ipswich LGAs
� Yarrabilba – Ipswich and Gold Coast LGAs
� Ripley Valley – Ipswich LGA
� Caloundra South – Sunshine Coast LGA
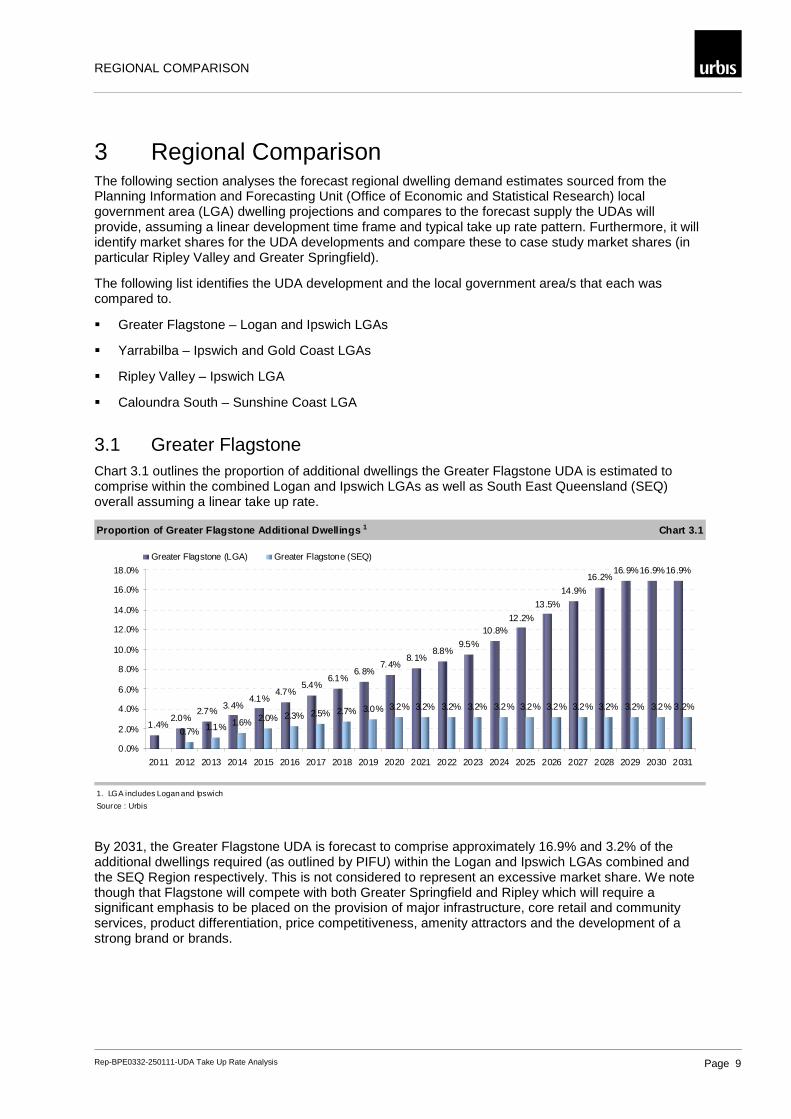
3.1 Greater Flagstone Chart 3.1 outlines the proportion of additional dwellings the Greater Flagstone UDA is estimated to comprise within the combined Logan and Ipswich LGAs as well as South East Queensland (SEQ) overall assuming a linear take up rate.
Proportion of Greater Flagstone Additional Dwelling s 1 Chart 3.1
1. LGA includes Logan and Ipswich
Source : Urbis
2.0%2.7%
3.4%4.1%
4.7%5.4%
6.1%6.8%
7.4%8.1%
8.8%9.5%
10.8%12.2%
13.5%
14.9%
16.2%16.9%16.9%16.9%
0.7% 1.1% 1.6% 2.0% 2.3% 2.5% 2.7% 3.0% 3.2% 3.2% 3.2% 3.2% 3.2% 3.2% 3.2% 3.2% 3.2% 3.2% 3.2% 3.2%
1.4%
0.0%
2.0%
4.0%
6.0%
8.0%
10.0%
12.0%
14.0%
16.0%
18.0%
2011 2012 2013 2014 2015 2016 2017 2018 2019 2020 2021 2022 2023 2024 2025 2026 2027 2028 2029 2030 2031
Greater Flagstone (LGA) Greater Flagstone (SEQ)
By 2031, the Greater Flagstone UDA is forecast to comprise approximately 16.9% and 3.2% of the additional dwellings required (as outlined by PIFU) within the Logan and Ipswich LGAs combined and the SEQ Region respectively. This is not considered to represent an excessive market share. We note though that Flagstone will compete with both Greater Springfield and Ripley which will require a significant emphasis to be placed on the provision of major infrastructure, core retail and community services, product differentiation, price competitiveness, amenity attractors and the development of a strong brand or brands.
REGIONAL COMPARISON
Rep-BPE0332-250111-UDA Take Up Rate Analysis Page 10
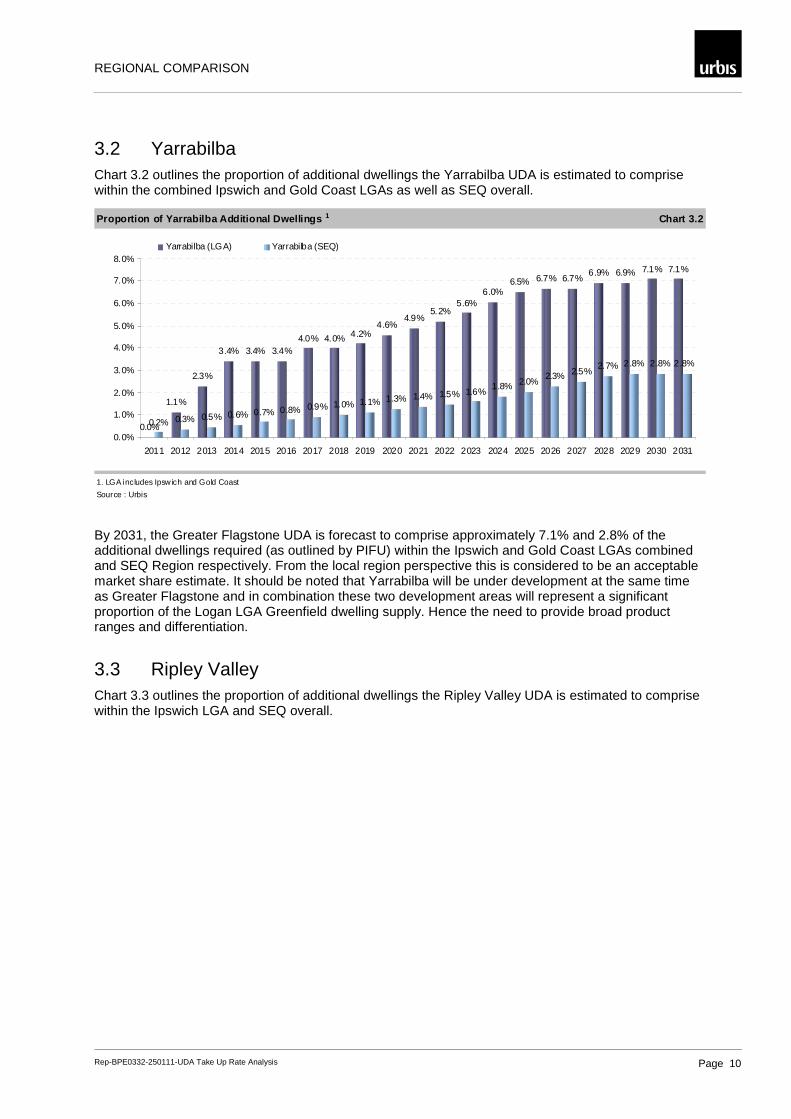
3.2 Yarrabilba Chart 3.2 outlines the proportion of additional dwellings the Yarrabilba UDA is estimated to comprise within the combined Ipswich and Gold Coast LGAs as well as SEQ overall.
Proportion of Yarrabilba Additional Dwellings 1 Chart 3.2
1. LGA includes Ipsw ich and Gold Coast
Source : Urbis
0.0%
1.1%
2.3%
3.4% 3.4% 3.4%4.0% 4.0% 4.2%
4.6%4.9%
5.2%5.6%
6.0%6.5% 6.7% 6.7%
6.9% 6.9% 7.1% 7.1%
0.2% 0.3% 0.5% 0.6% 0.7% 0.8% 0.9% 1.0% 1.1% 1.3% 1.4% 1.5% 1.6%1.8% 2.0%
2.3% 2.5%2.7% 2.8% 2.8% 2.8%
0.0%
1.0%
2.0%
3.0%
4.0%
5.0%
6.0%
7.0%
8.0%
2011 2012 2013 2014 2015 2016 2017 2018 2019 2020 2021 2022 2023 2024 2025 2026 2027 2028 2029 2030 2031
Yarrabilba (LGA) Yarrabilba (SEQ)
By 2031, the Greater Flagstone UDA is forecast to comprise approximately 7.1% and 2.8% of the additional dwellings required (as outlined by PIFU) within the Ipswich and Gold Coast LGAs combined and SEQ Region respectively. From the local region perspective this is considered to be an acceptable market share estimate. It should be noted that Yarrabilba will be under development at the same time as Greater Flagstone and in combination these two development areas will represent a significant proportion of the Logan LGA Greenfield dwelling supply. Hence the need to provide broad product ranges and differentiation.
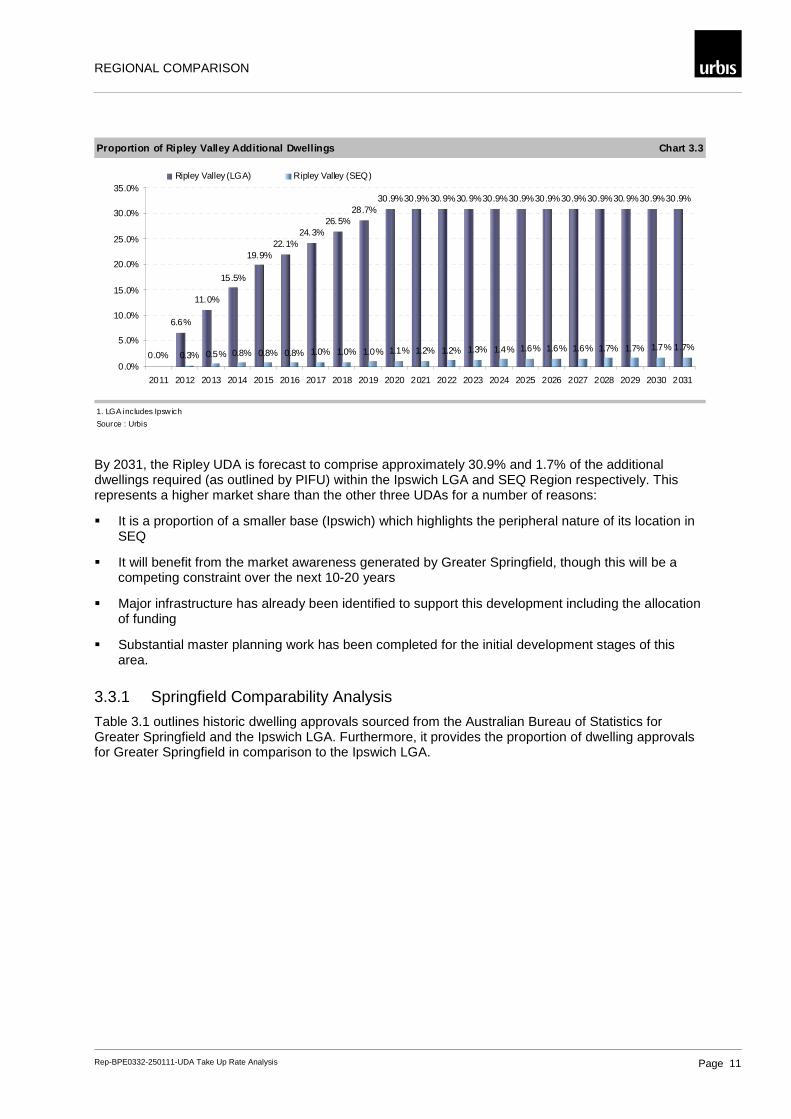
3.3 Ripley Valley Chart 3.3 outlines the proportion of additional dwellings the Ripley Valley UDA is estimated to comprise within the Ipswich LGA and SEQ overall.
REGIONAL COMPARISON
Rep-BPE0332-250111-UDA Take Up Rate Analysis Page 11
Proportion of Ripley Valley Additional Dwellings Chart 3.3
1. LGA includes Ipsw ich
Source : Urbis
6.6%
11.0%
15.5%
19.9%22.1%
24.3%26.5%
28.7%30.9%30.9%30.9%30.9%30.9%30.9%30.9%30.9%30.9%30.9%30.9%30.9%
0.3% 0.5% 0.8% 0.8% 0.8% 1.0% 1.0% 1.0% 1.1% 1.2% 1.2% 1.3% 1.4% 1.6% 1.6% 1.6% 1.7% 1.7% 1.7% 1.7%0.0%
0.0%
5.0%
10.0%
15.0%
20.0%
25.0%
30.0%
35.0%
2011 2012 2013 2014 2015 2016 2017 2018 2019 2020 2021 2022 2023 2024 2025 2026 2027 2028 2029 2030 2031
Ripley Valley (LGA) Ripley Valley (SEQ)
By 2031, the Ripley UDA is forecast to comprise approximately 30.9% and 1.7% of the additional dwellings required (as outlined by PIFU) within the Ipswich LGA and SEQ Region respectively. This represents a higher market share than the other three UDAs for a number of reasons:
� It is a proportion of a smaller base (Ipswich) which highlights the peripheral nature of its location in SEQ
� It will benefit from the market awareness generated by Greater Springfield, though this will be a competing constraint over the next 10-20 years
� Major infrastructure has already been identified to support this development including the allocation of funding
� Substantial master planning work has been completed for the initial development stages of this area.
3.3.1 Springfield Comparability Analysis
Table 3.1 outlines historic dwelling approvals sourced from the Australian Bureau of Statistics for Greater Springfield and the Ipswich LGA. Furthermore, it provides the proportion of dwelling approvals for Greater Springfield in comparison to the Ipswich LGA.
REGIONAL COMPARISON
Rep-BPE0332-250111-UDA Take Up Rate Analysis Page 12
New Dwelling Approvals Table 3.1
YearIpswich
LGAGreater
SpringfieldGreater Springfield as a
proportion of Ipswich LGA
1999/00 503 76 15.1%2000/01 578 122 21.1%
2001/02 917 292 31.8%2002/03 1,083 391 36.1%
2003/04 2,065 951 46.1%2004/05 1,695 795 46.9%
2005/06 1,782 545 30.6%2006/07 2,059 552 26.8%
2007/08 2,765 695 25.1%2008/09 1,775 477 26.9%
Total 15,222 4,896 32.2%
Source: ABS; Urbis 2010
Overall, the Greater Springfield region comprised almost one third of the total dwelling approvals for the Ipswich LGA over the 10 years leading up to the 2008/09 period (the most up to date full year data available).
With approximately 20 years of residential supply still remaining at Springfield, the combination of Springfield and Ripley will account for the majority of Ipswich dwelling demand and is likely to impact on achievable rates at Ripley rather than at Springfield.
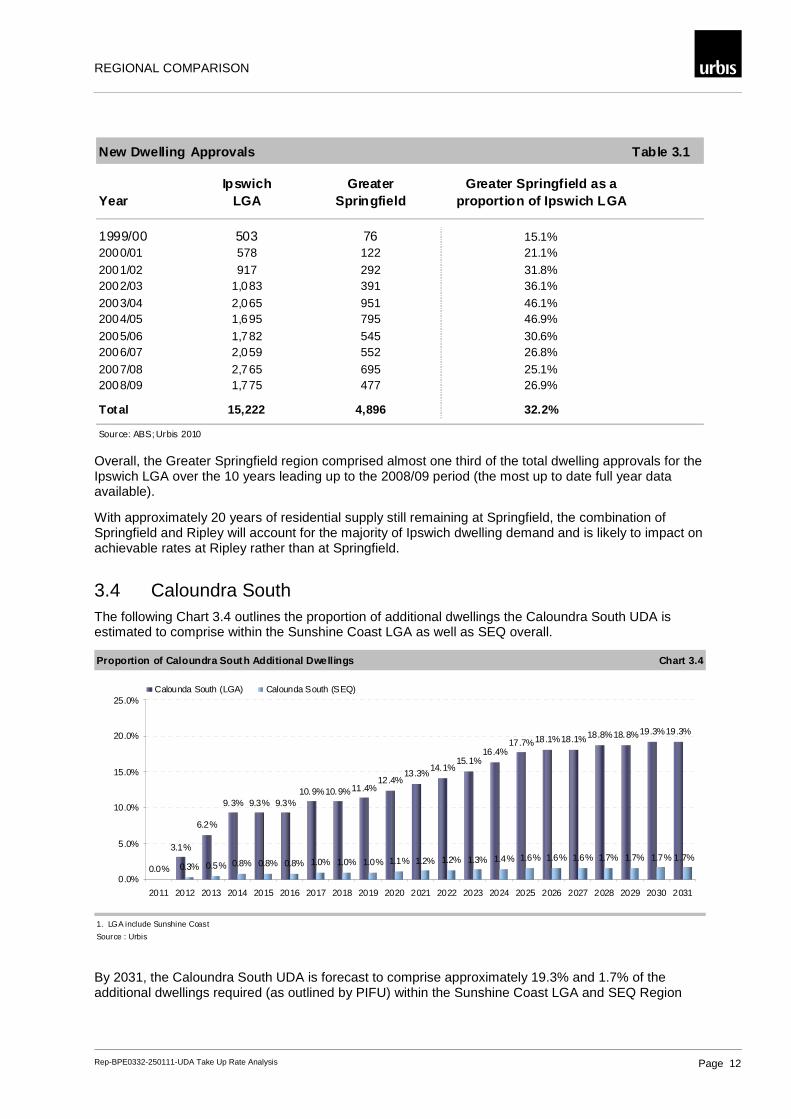
3.4 Caloundra South The following Chart 3.4 outlines the proportion of additional dwellings the Caloundra South UDA is estimated to comprise within the Sunshine Coast LGA as well as SEQ overall.
Proportion of Caloundra South Additional Dwellings Chart 3.4
1. LGA include Sunshine Coast
Source : Urbis
3.1%
6.2%
9.3% 9.3% 9.3%10.9%10.9%11.4%
12.4%13.3%
14.1%15.1%
16.4%17.7%18.1%18.1%18.8%18.8%19.3%19.3%
0.3% 0.5% 0.8% 0.8% 0.8% 1.0% 1.0% 1.0% 1.1% 1.2% 1.2% 1.3% 1.4% 1.6% 1.6% 1.6% 1.7% 1.7% 1.7% 1.7%0.0%
0.0%
5.0%
10.0%
15.0%
20.0%
25.0%
2011 2012 2013 2014 2015 2016 2017 2018 2019 2020 2021 2022 2023 2024 2025 2026 2027 2028 2029 2030 2031
Calounda South (LGA) Calounda South (SEQ)
By 2031, the Caloundra South UDA is forecast to comprise approximately 19.3% and 1.7% of the additional dwellings required (as outlined by PIFU) within the Sunshine Coast LGA and SEQ Region
REGIONAL COMPARISON
Rep-BPE0332-250111-UDA Take Up Rate Analysis Page 13
respectively. Given that there is only one other major long term residential area identified on the Sunshine Coast (Palmview) this is considered an acceptable market share for this development area.
RECOMMENDATIONS
Rep-BPE0332-250111-UDA Take Up Rate Analysis Page 14
4 Recommendations Following analysis of comparable master plan communities, regional dwelling forecasts and economic cycles the following section outlines our recommendations and forecasts for each UDA.
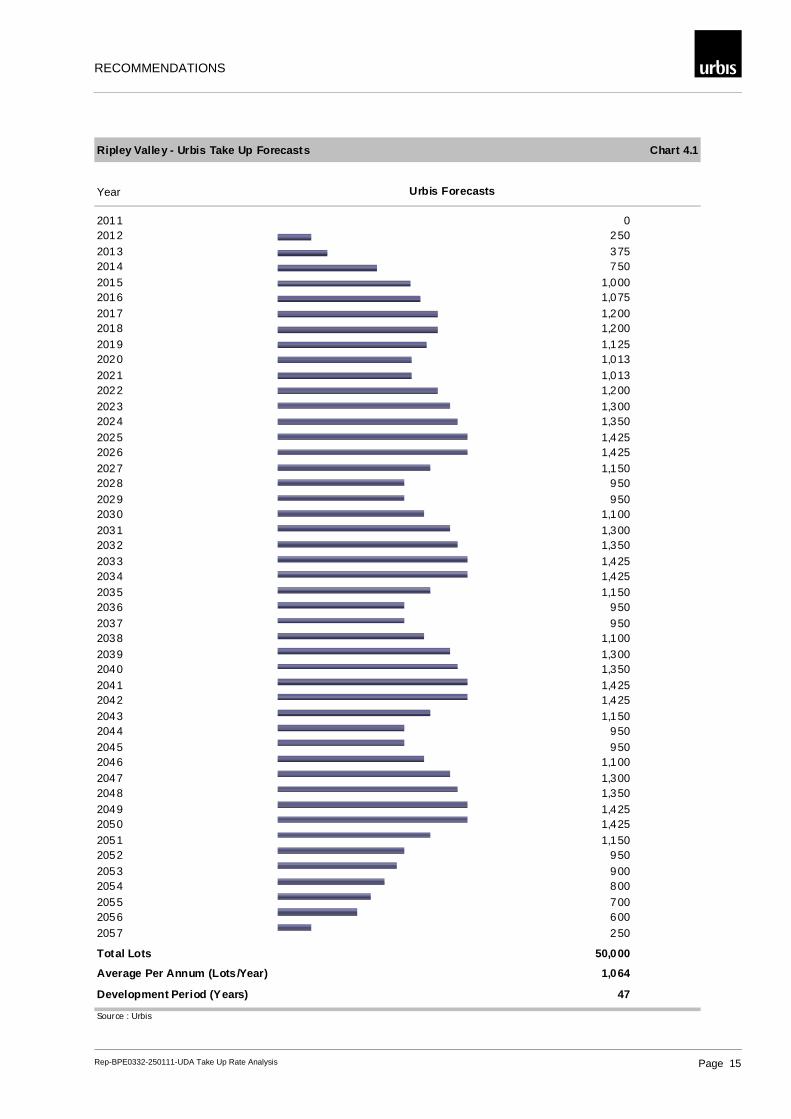
4.1 Ripley Valley The major considerations when forecasting take up rates for the Ripley Valley UDA include:
� The normally subdued initial take up period for an establishing area is forecast to be limited due to Ripley’s proximity to the established areas of Springfield and Redbank
� Once the area is established and essential facilities developed, take up rates will increase
� Lot sales will be exposed to normal economic trends and for this analysis we have assumed a period of 6 years of growth followed by 2 years of decline
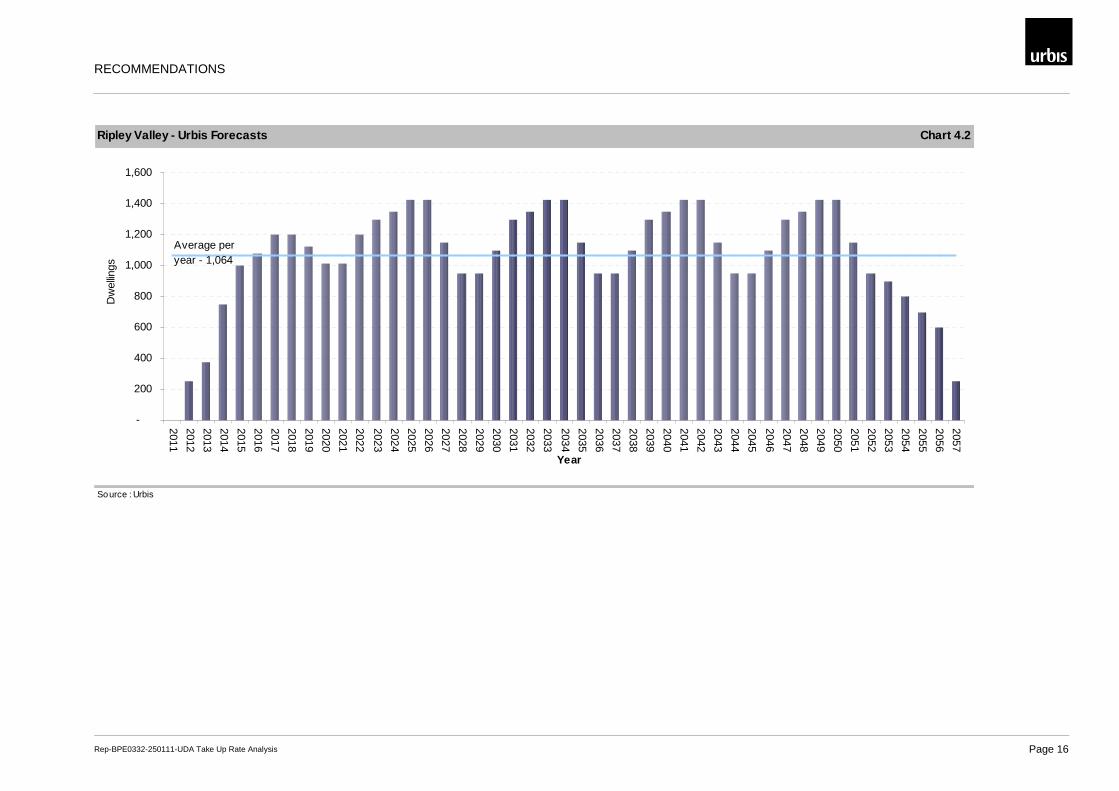
� Excluding the start up and finishing periods of the development, Ripley Valley is forecast to achieve between 950 lots per annum and 1,425 lots per annum
� Urbis forecasts the Ripley Valley UDA will have a development timeframe of around 47 years
� Lot sales under the Urbis forecasts average 1,064 per annum
RECOMMENDATIONS
Rep-BPE0332-250111-UDA Take Up Rate Analysis Page 15
Ripley Valley - Urbis Take Up Forecasts Chart 4.1
Year Urbis Forecasts
2011 02012 2502013 3752014 7502015 1,0002016 1,0752017 1,2002018 1,2002019 1,1252020 1,0132021 1,0132022 1,2002023 1,3002024 1,3502025 1,4252026 1,4252027 1,1502028 9502029 9502030 1,1002031 1,3002032 1,3502033 1,4252034 1,4252035 1,1502036 9502037 9502038 1,1002039 1,3002040 1,3502041 1,4252042 1,4252043 1,1502044 9502045 9502046 1,1002047 1,3002048 1,3502049 1,4252050 1,4252051 1,1502052 9502053 9002054 8002055 7002056 6002057 250
Total Lots 50,000
Average Per Annum (Lots /Year) 1,064
Development Period (Years) 47
Source : Urbis
RECOMMENDATIONS
Rep-BPE0332-250111-UDA Take Up Rate Analysis Page 16
Ripley Valley - Urbis Forecasts Chart 4.2
Source : Urbis
-
200
400
600
800
1,000
1,200
1,400
1,600
2011
2012
2013
2014
2015
2016
2017
2018
2019
2020
2021
2022
2023
2024
2025
2026
2027
2028
2029
2030
2031
2032
2033
2034
2035
2036
2037
2038
2039
2040
2041
2042
2043
2044
2045
2046
2047
2048
2049
2050
2051
2052
2053
2054
2055
2056
2057
Year
Dw
ellin
gs
Average per year - 1,064
RECOMMENDATIONS
Rep-BPE0332-250111-UDA Take Up Rate Analysis Page 17
4.2 Greater Flagstone The major considerations when forecasting take up rates for the Greater Flagstone UDA include:
� Greater Flagstone will benefit from the existing Flagstone Rise residential development which is currently achieving around 100 lots per annum. This existing development has already identified Flagstone as a viable residential destination
� The UDA can benefit from the current and planned development of the Flagstone Major Regional Activity Centre and potentially the existing rail infrastructure, and Brommelton State Development Area as a major employment precinct
� As essential community facilities are developed, take up rates will increase
� Lot sales will be exposed to normal economic trends and for this analysis we have assumed a period of 6 years of growth followed by 2 years of decline
� Excluding the start up and finishing periods of the development, Greater Flagstone is forecast to achieve between 720 lots per annum and 1,250 lots per annum
� Urbis forecasts the Greater Flagstone UDA will take around 52 years to complete
� Lot sales under the Urbis forecasts average 962 per annum.
RECOMMENDATIONS
Rep-BPE0332-250111-UDA Take Up Rate Analysis Page 18
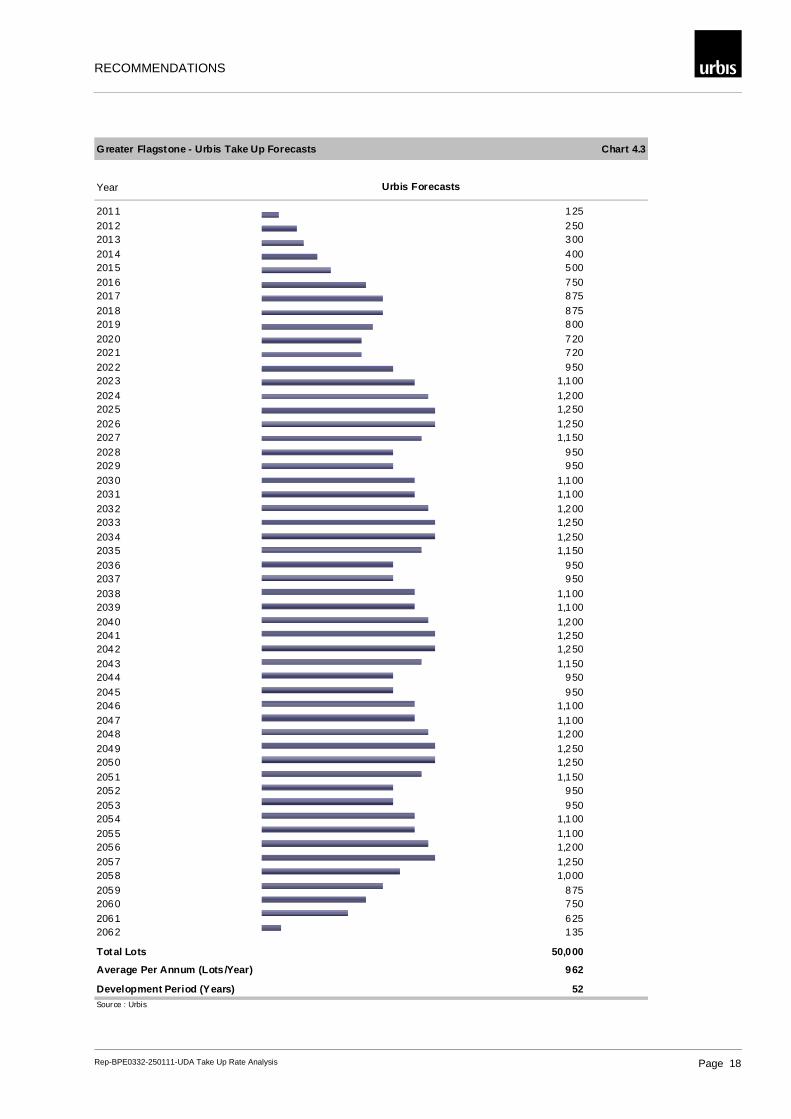
Greater Flagstone - Urbis Take Up Forecasts Chart 4.3
Year Urbis Forecasts
2011 1252012 2502013 3002014 4002015 5002016 7502017 875
2018 8752019 8002020 7202021 7202022 9502023 1,100
2024 1,2002025 1,2502026 1,2502027 1,1502028 9502029 9502030 1,1002031 1,1002032 1,2002033 1,2502034 1,2502035 1,1502036 9502037 950
2038 1,1002039 1,1002040 1,2002041 1,2502042 1,2502043 1,1502044 950
2045 9502046 1,1002047 1,1002048 1,2002049 1,2502050 1,250
2051 1,1502052 9502053 9502054 1,1002055 1,1002056 1,2002057 1,2502058 1,0002059 8752060 7502061 6252062 135
Total Lots 50,000
Average Per Annum (Lots /Year) 962
Development Period (Years) 52Source : Urbis
RECOMMENDATIONS
Rep-BPE0332-250111-UDA Take Up Rate Analysis Page 19
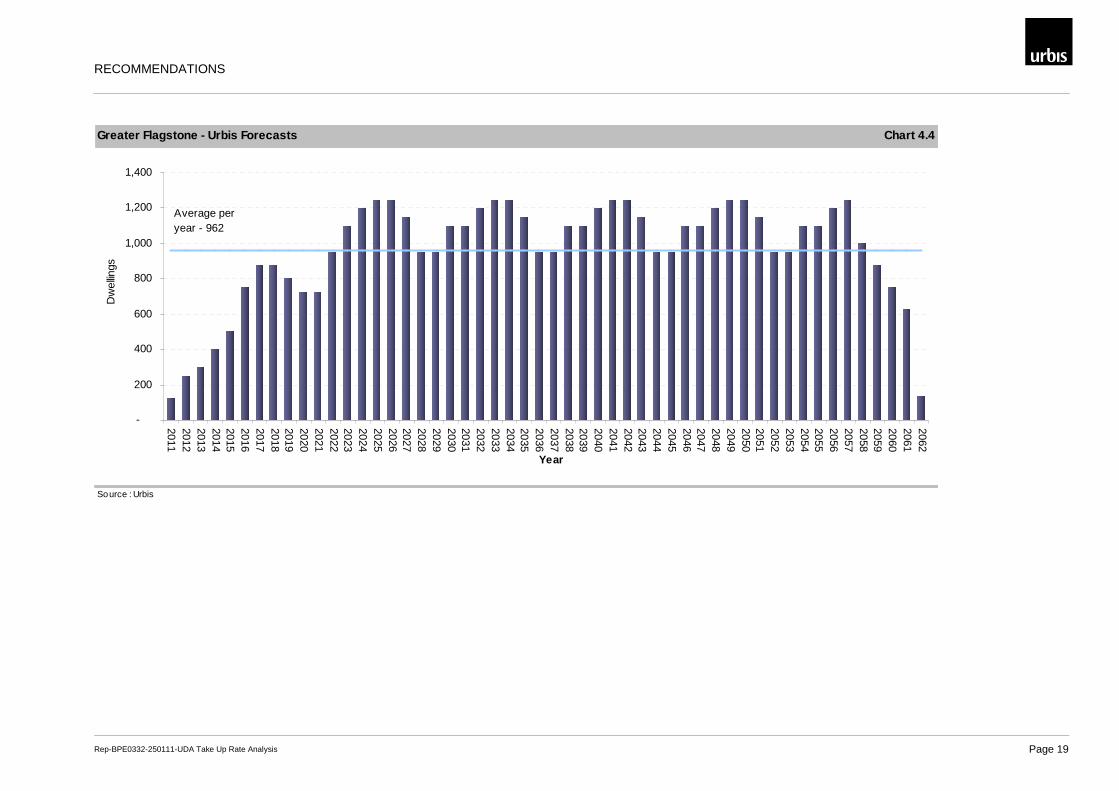
Greater Flagstone - Urbis Forecasts Chart 4.4
Source : Urbis
-
200
400
600
800
1,000
1,200
1,400
2011201220132014201520162017201820192020202120222023202420252026202720282029203020312032203320342035203620372038203920402041204220432044204520462047204820492050205120522053205420552056205720582059206020612062
Year
Dw
ellin
gs
Average per year - 962
RECOMMENDATIONS
Rep-BPE0332-250111-UDA Take Up Rate Analysis Page 20
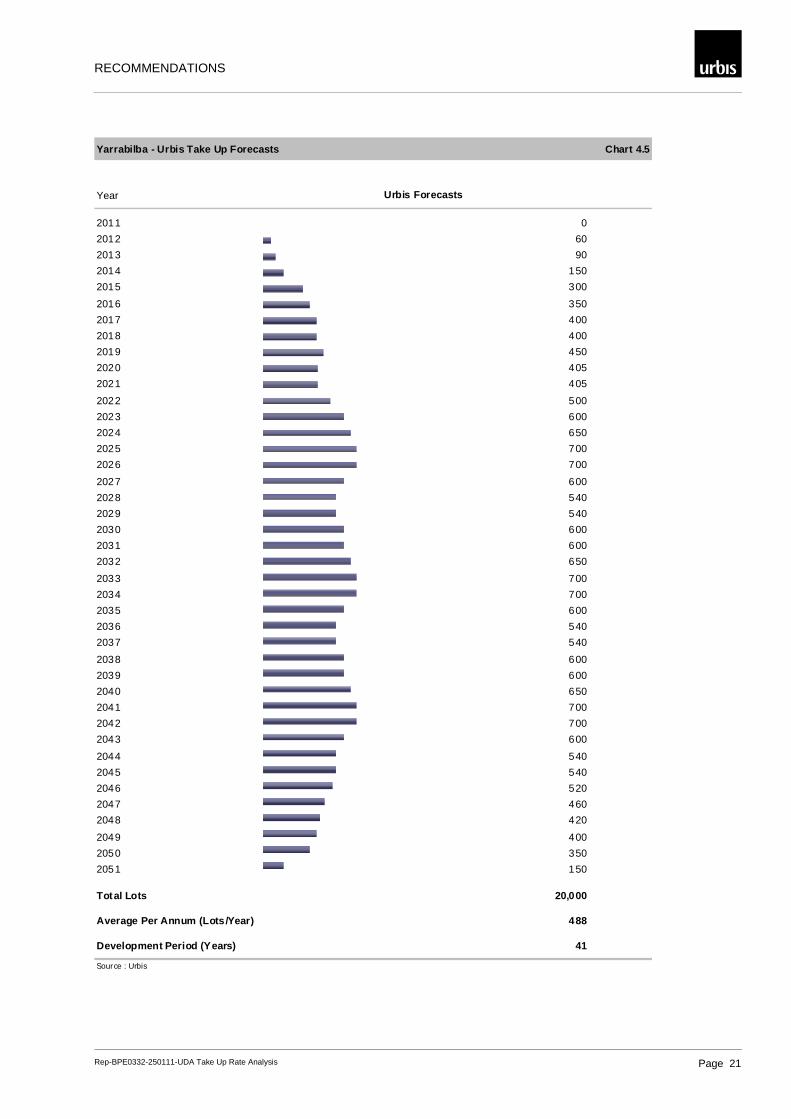
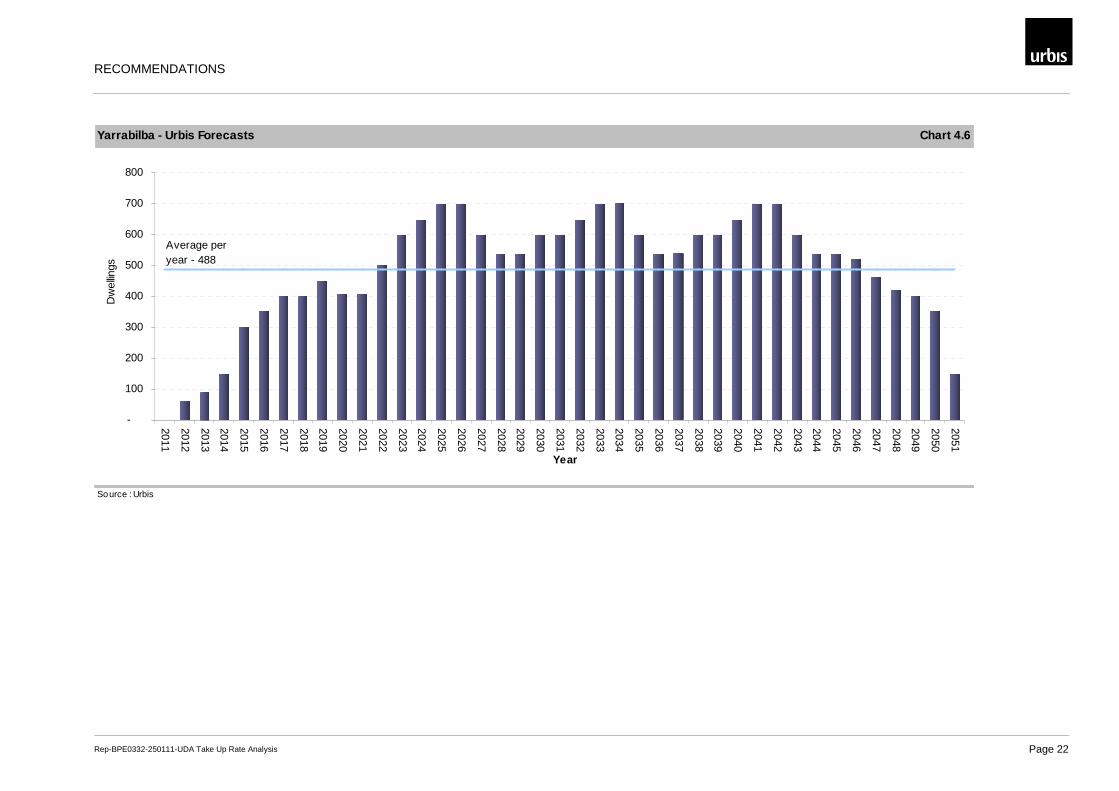
4.3 Yarrabilba The major considerations when forecasting take up rates for the Yarrabilba UDA include:
� Due to the relative isolation of Yarrabilba to existing community and transport infrastructure, take up rates will be slow initially
� Once the area is established and essential facilities developed, take up rates will increase
� Lot sales will be exposed to normal economic trends and for this analysis we have assumed a period of 6 years of growth followed by 2 years of decline
� Excluding the start up and finishing periods of the development, Yarrabilba is forecast to achieve between 400 lots per annum and 700 lots per annum
� Urbis forecasts the Yarrabilba UDA will take around 41 years to complete
� Lot sales for Yarrabilba under the Urbis forecasts average 488 per annum
RECOMMENDATIONS
Rep-BPE0332-250111-UDA Take Up Rate Analysis Page 21
Yarrabilba - Urbis Take Up Forecasts Chart 4.5
Year Urbis Forecasts
2011 0
2012 60
2013 90
2014 150
2015 300
2016 350
2017 400
2018 400
2019 450
2020 405
2021 405
2022 500
2023 600
2024 650
2025 700
2026 700
2027 600
2028 540
2029 540
2030 600
2031 600
2032 650
2033 700
2034 700
2035 600
2036 540
2037 540
2038 600
2039 600
2040 650
2041 700
2042 700
2043 600
2044 540
2045 540
2046 520
2047 460
2048 420
2049 400
2050 350
2051 150
Total Lots 20,000
Average Per Annum (Lots /Year) 488
Development Period (Years) 41
Source : Urbis
RECOMMENDATIONS
Rep-BPE0332-250111-UDA Take Up Rate Analysis Page 22
Yarrabilba - Urbis Forecasts Chart 4.6
Source : Urbis
-
100
200
300
400
500
600
700
800
2011
2012
2013
2014
2015
2016
2017
2018
2019
2020
2021
2022
2023
2024
2025
2026
2027
2028
2029
2030
2031
2032
2033
2034
2035
2036
2037
2038
2039
2040
2041
2042
2043
2044
2045
2046
2047
2048
2049
2050
2051
Year
Dw
ellin
gs
Average per year - 488

RECOMMENDATIONS
Rep-BPE0332-250111-UDA Take Up Rate Analysis Page 23
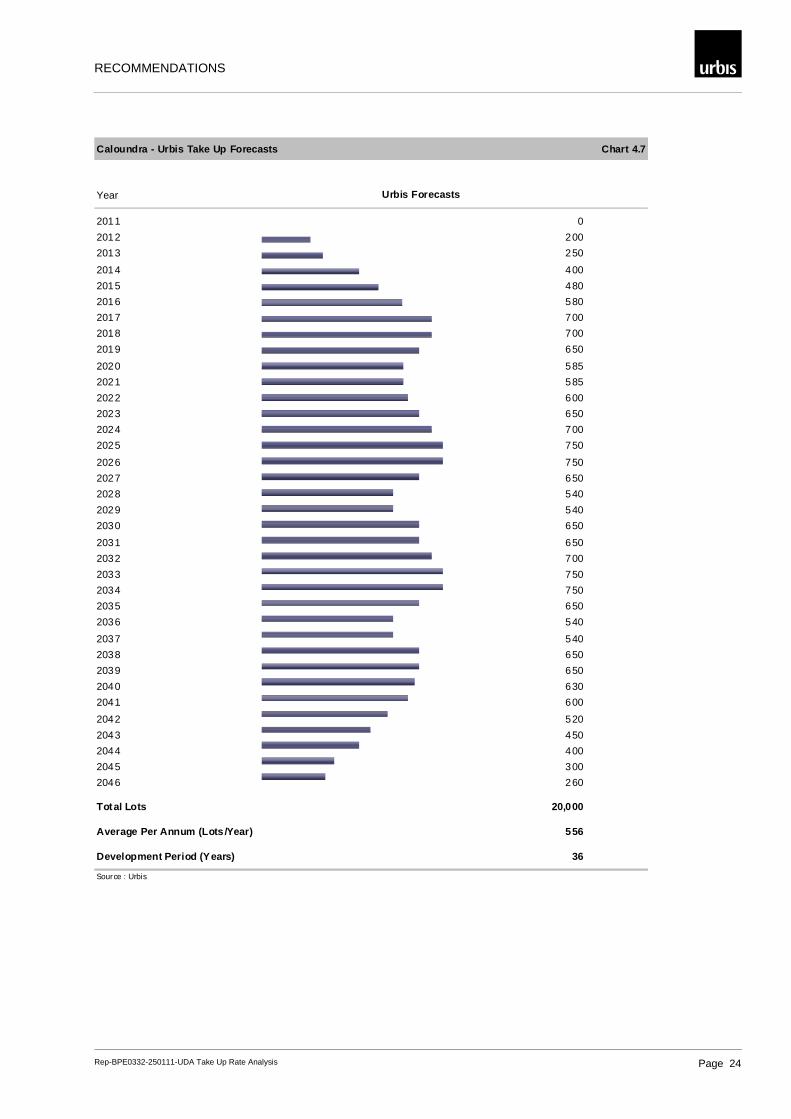
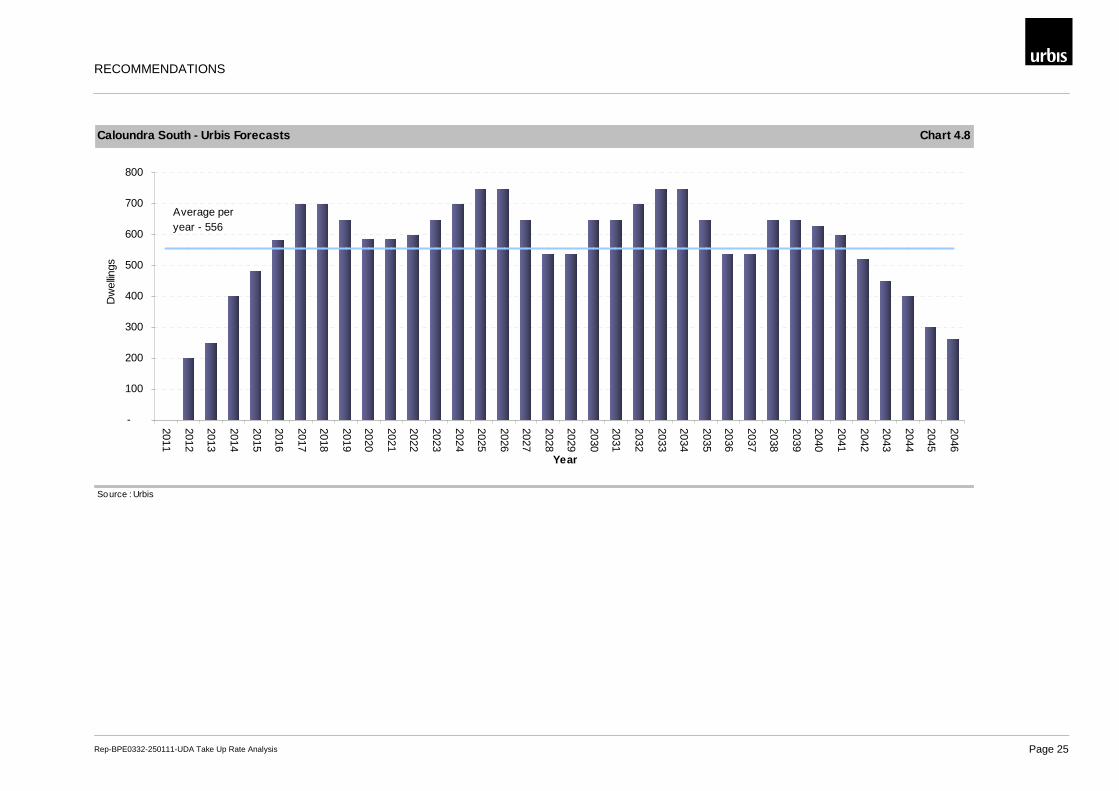
4.4 Caloundra South The major considerations when forecasting take up rates for the Caloundra South UDA include:
� Caloundra South adjoins the existing and well established Bellvista Estate. Considering Stockland is the major land owner in both estates, Caloundra South will benefit from existing infrastructure and facilities. Stockland will enable continuation of development and benefit from knowledge of an existing market. These factors will facilitate faster take up periods at the initial stages of development
� Lot sales will be exposed to normal economic trends and for this analysis we have assumed a period of 6 years of growth followed by 2 years of decline
� Excluding the start up and finishing periods of the development, Caloundra South is forecast to achieve between 540 lots per annum and 750 lots per annum
� Urbis forecasts the Caloundra South UDA will take around 36 years to complete
� Lot sales under the Urbis forecasts average 556 per annum
RECOMMENDATIONS
Rep-BPE0332-250111-UDA Take Up Rate Analysis Page 24
Caloundra - Urbis Take Up Forecasts Chart 4.7
Year Urbis Forecasts
2011 0
2012 200
2013 250
2014 400
2015 480
2016 580
2017 700
2018 700
2019 650
2020 585
2021 585
2022 600
2023 650
2024 700
2025 750
2026 750
2027 650
2028 540
2029 540
2030 650
2031 650
2032 700
2033 750
2034 750
2035 650
2036 540
2037 540
2038 650
2039 650
2040 630
2041 600
2042 520
2043 450
2044 400
2045 300
2046 260
Total Lots 20,000
Average Per Annum (Lots /Year) 556
Development Period (Years) 36
Source : Urbis
RECOMMENDATIONS
Rep-BPE0332-250111-UDA Take Up Rate Analysis Page 25
Caloundra South - Urbis Forecasts Chart 4.8
Source : Urbis
-
100
200
300
400
500
600
700
800
2011
2012
2013
2014
2015
2016
2017
2018
2019
2020
2021
2022
2023
2024
2025
2026
2027
2028
2029
2030
2031
2032
2033
2034
2035
2036
2037
2038
2039
2040
2041
2042
2043
2044
2045
2046
Year
Dw
ellin
gs
Average per year - 556

RECOMMENDATIONS
Rep-BPE0332-250111-UDA Take Up Rate Analysis Page 1
xoffice locationsx
Sydney Level 21, 321 Kent Street Sydney, NSW 2000 Tel: +612 8233 9900 Fax: +612 8233 9966
Brisbane Level 12, 120 Edward Street Brisbane, QLD 4000 Tel: +617 3007 3800 Fax: +617 3007 3811
Dubai Level 4, Attareen Building, Saaha Offices, Old Town Island Downtown Burj Dubai, UAE Tel: +971 4 4200212 Fax: +971 4 4200209
Melbourne Level 12, 120 Collins Street Melbourne, VIC 3000 Tel: +613 8663 4888 Fax: +613 8663 4999
Perth Ground Floor, 53 Ord Street West Perth, WA 6005 Tel: +618 9346 0500 Fax: +618 9321 7790
Australia • Asia • Middle East www.urbis.com.au [email protected]