Embed Size (px)
Citation preview

10/20/19
1
Facility Health Inc. Confidential, Copyright 2019
Repair and Replacement Capital Planning
”An Ounce of Prevention is Worth a Pound of Cure.”
Mark Mochel, MBA, PMP, CSM, FCTVice-President
Wednesday November 13, 2019
1
Facility Health Inc. Confidential, Copyright 2019
As a systemic perspective, most organizations underestimate the investment and effort required to maintain a facility over the full life
cycle of the structure.
It is important that we document the true status of our aging infrastructure with objective data, expertise and technology so we can have confidence in the prioritization of capital and operational
spend.
2
Facility Health Inc. Confidential, Copyright 2019
Key References
3
10/20/19
2
Facility Health Inc. Confidential, Copyright 2019
Part One: Macro Economics and the C-Suite
4
Facility Health Inc. Confidential, Copyright 2019
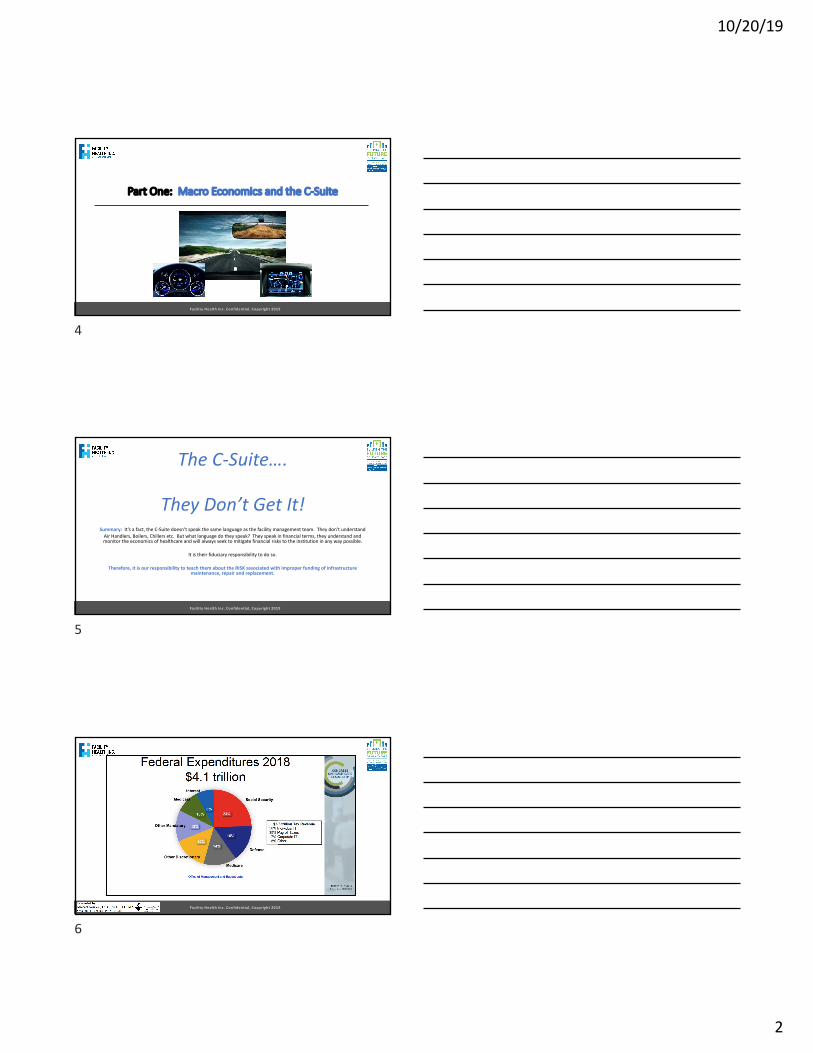
The C-Suite….
They Don’t Get It!Summary: It’s a fact, the C-Suite doesn’t speak the same language as the facility management team. They don’t understand
Air Handlers, Boilers, Chillers etc. But what language do they speak? They speak in financial terms, they understand and monitor the economics of healthcare and will always seek to mitigate financial risks to the institution in any way possible.
It is their fiduciary responsibility to do so.
Therefore, it is our responsibility to teach them about the RISK associated with improper funding of infrastructure maintenance, repair and replacement.
5
Facility Health Inc. Confidential, Copyright 2019
6

10/20/19
3
Facility Health Inc. Confidential, Copyright 2019
7
Facility Health Inc. Confidential, Copyright 2019
8
Facility Health Inc. Confidential, Copyright 2019
What does the C-Suite conclude from this message?
”We need to Cut Costs!”
9

10/20/19
4
Facility Health Inc. Confidential, Copyright 2019
10
Facility Health Inc. Confidential, Copyright 2019
RISK
11
Facility Health Inc. Confidential, Copyright 2019
Conclusions – Part One• Without Strategic Planning, there will be less money available for repair &
replacement of infrastructure, not more.
• There will be more need for project requests to be quantified, objective and defensible not less.
• In most cases, the C-Suite will not “get it” in the traditional terms and language of facility management.
• We all have a fiduciary responsibility to communicate these needs in terms the C-Suite can understand. Because aging infrastructure = RISK.
What can you do? Follow the Data. Look out 5-10 Years, Not Just 1
12

10/20/19
5
Facility Health Inc. Confidential, Copyright 2019
Part Two: ASHE Recommendations
13
Facility Health Inc. Confidential, Copyright 2019
14
Facility Health Inc. Confidential, Copyright 2019
FCI Statistics
“Given that there are many factors that influence FCI (e.g.,
geographical and demand-based differences in market costs for repairs, subjective
assessments of when repairs should be made), this metric…is
not compared across facilities from different regions.”
Critical Building Target: FCI <0.05Other Building Target: FCI < 0.15
15

10/20/19
6
Facility Health Inc. Confidential, Copyright 2019
Two Key Metrics
• Age of Plant, AOP = Accumulated DepreciationDepreciation Expense
• Facility Condition Index (FCI) = Cost of Repairing a FacilityCost of Facility Replacement
Challenges:
• Top down perspective• Works well in aggregate, but little or no connection to the actual asset portfolio• Subjective analysis. How do you truly estimate cost of facility replacement?
16
Facility Health Inc. Confidential, Copyright 2019
Additional Metrics
Projected Requirement Index (PRI) – Four Year FCI ProjectionFacility Maintenance Renewal Index (FMRI) = FCI + PRISustainment Percentage = Avg. % of Current Replacement Value necessary to sustain current condition each year within a 10 year window.
Challenges:
• Same as before. Top Down. Aggregate. “Big Number Estimates”• Not directly linked to the asset portfolio.
17
Facility Health Inc. Confidential, Copyright 2019
Conclusion – Part Two
• The metrics you really need are…1. What assets do you have?2. How old are they?3. How are they performing?4. What is the RISK if they fail?5. What is the financial or other impact of a failure?6. How much will it cost to replace them PROACTIVELY vs.
REACTIVELY?
ObjectiveData
Inputs
18

10/20/19
7
Facility Health Inc. Confidential, Copyright 2019
ObjectiveData
Inputs
Build Trust &CulturalImpact
19
Facility Health Inc. Confidential, Copyright 2019
Part Three: Dollars and Cents
20
Facility Health Inc. Confidential, Copyright 2019
Repair and Replacement – By The NumbersFor Hospital Sites Older Than 20 years
500,000 K SQFTAverage size of accredited sites surveyed by FHI
to date.
45%Assets aged beyond industry recommended
expected useful life
$59 MillionReplacement value of the infrastructure assets
for the average accredited site
$27 MillionImmediate investment need to offset
ACCUMULATED RISK
Baseline
ProblemImpact of Historical
Deferred Maintenance
$1.6 Million per Year10-year investment model to MAINTAIN aged
assets at 45% through year 10
$3.3 Million per Year10-year investment model to REDUCE aged
assets to ~10% in year 10
SolutionSustained and PrioritizedInvestment over time will
Reduce Risk
Conclusion: The typical 500K SQFT facility requires a $16-33 Million, 10-Year plan to offset and improve historical lack of replacement capital investment.
21

10/20/19
8
Facility Health Inc. Confidential, Copyright 2019
High2019
NeedsRepresentDeferred
Investm entBacklog
=Accum ulated
Risk
Com plete FHI Origin Data Sum m ary – “Average” of All Custom er Sites Surveyed
22
Facility Health Inc. Confidential, Copyright 2019
StraightLine
Investm entStrategy
Over 10 YearsPrioritized
By Asset
Risk RankingCan
ReduceOverall Age
Of Assets
SUSTAINIs 40% of Total
10 Year NeedsDivided
By 10 Years
IM PROVE
Is 75% of Total10 YearNeeds
DividedBy 10 Years
Forecast Spending M odels Created Based on FHI Portfolio
23
Facility Health Inc. Confidential, Copyright 2019
Projection for ABC Health – 29 Accredited Sites*Assumes Hospital Sites on Average are Older than 20 Years for Purposes of Demonstration
18.04 M SQFTProjected total size of the ABC
hospital portfolio (not including other buildings)
45%Projected assets aged beyond industry
recommended expected useful life
$1.7 BillionProjected total replacement value of the ABC
infrastructure assets
$769 MillionImmediate investment need to offset
ACCUMULATED RISK
Baseline
ProblemImpact of Historical
Deferred Maintenance
SolutionSustained and PrioritizedInvestment over time will
Reduce Risk
Conclusion: At a macro level, ABC Health should be investing between $46-84 Million per year in replacement of infrastructure assets throughout the portfolio.
*As reported by American Hospital Directory: www. ahd.com
$46 Million per Year10-year investment model to MAINTAIN aged
assets at 45% through year 10
$84 Million per Year10-year investment model to REDUCE aged
assets to ~10% in year 10
~ $1.6 Million per Year, per Site ~ $2.9 Million per Year, per Site
24

10/20/19
9
Facility Health Inc. Confidential, Copyright 2019
Part Four: How to Get a Seat at the Big Table
25
Facility Health Inc. Confidential, Copyright 2019
Enterprise Asset ManagementFollow the Data
SSOT – Enterprise Single Source of Truth – CMMS
1. Validate Inventory, Facility Condition Assessm ent, M ock Surveys, Docum ent Reviews.2. Correct Im m ediate Deficiencies – Com pliance or Infrastructure Assets.3. Leverage Capability of Standardized CM M S Platform . Build Foundation.
Triage & Diagnosis
Enterprise FM Process and Performance Management
1. Validate and Deploy FM Strategy, FM Policies and Procedures, Risk Ranking.2. Maintain Inventory and Standards: Conduct Staff Training.3. Introduce Culture of Compliance: Peer Reviews and Documentation Standardization.
Stabilization &Prescription
Lifestyle & Wellness
Capital Planning, M aster Planning and Accreditation, AEM Program
1. Leverage inventory, data standards and performance data to drive forecasts.2. Prioritize investments based on risk. Objective vs. subjective planning.3. Reduce accreditation risk with ONE Enterprise approach to compliance.
DataFlow
StartHere
EndHere
26
Facility Health Inc. Confidential, Copyright 2019
Utility Risk Classification Examples
• Utility Classification (UC)1. Non Clinical Other
2. Clinical Other
3. Transport
4. Diagnostic
5. Equipm ent Support
6. Environm ental Support
7. Infection Control
8. Life Safety
• Risk Application (RA)1. No Risk (NFPA 99 4.1.4)
2. Loss of Redundancy
3. Disruption of Com fort (NFPA 99 4.1.3)
4. Disruption of Service
5. Loss of Revenue
6. M isdiagnosis
7. Injury (NFPA 99 4.1.2)
8. Death (NFPA 99 4.1.1)
• Maintenance Requirement (MR)1. None
2. M inim al
3. Average
4. Extensive
Total Risk Value EqualsUC + RA + M R + EI
• Asset Redundancy1. Redundancy Available < 1 Hour
2. Redundancy Available < 24 Hours
3. Redundancy Available < 1 Week
4. Redundancy Unavailable W ithout Significant Effort/Capital > 1 Week
Consistency in Risk Classifications Across Multiple Facilities is Key!
Documented. Defensible.
27

10/20/19
10
Facility Health Inc. Confidential, Copyright 2019
A change in NFPA 99 (2012) is the requirement to risk rank assets based upon impact of failure. The requirements are as follows:
NFPA 99 4.1 Building System Categories. Building systems in health care facilities shall be designed to meet system Categories 1 through 4 requirements as detailed in this code.4.1.1 Category 1 Facility systems in which failure of such equipment or system is likely to cause major injury or death of patients or caregivers…4.1.2 Category 2 Facility systems in which failure of such equipment is likely to cause minor injury to patients or caregivers…4.1.3 Category 3 Facility systems in which failure of such equipment is not likely to cause injury to patients or caregivers, but can cause patient discomfort…4.1.4 Category 4 Facility systems in which failure of such equipment would have no impact on patient care…
NFPA 99 4.2 Risk Assessment. Categories shall be determined by following and documenting a defined risk assessment procedure.
Risk Ranking Mapping of NFPA Requirements
28
Facility Health Inc. Confidential, Copyright 2019
Focus on linking asset risk rankings to critical space
risk rankings!
29
Facility Health Inc. Confidential, Copyright 2019
Low/No Risk Assets
Life Safety, Radiology, Lasers & Most Critical Assets
Moderate Risk Assets
PortfolioOf BuildingsAnd Assets
Clinical and/or UtilityAsset Inventory
Stan
dard
ized
Ris
k Ra
nkin
g Sc
ores
Life Safety, Radiology, Lasers & Most Critical Assets
Prioritized Capital Investment
Predicted Useful Life
COMPLIANCE and CAPITAL INVESTMENT – Linked by RISK
Budgeting and Forecasting Policy Docum
entation
PRIORITIZED
CAPITA
L INV
ESTMEN
T
AEM
and
PM
Pol
icy
Doc
umen
tatio
n
CULT
URE
OF
COM
PLIA
NCE
M fr. Req. PM & AHJ ITMPer Code
0
5
10
20
15
24
High Risk Assets
Moderate Risk Assets
Low/No Risk Assets
M fr. Req. PMBy Choice/Risk
M odified PMBy Choice/Risk
M odified orDeferred PM
By Choice/Risk
AEM
Eligible Assets
30

10/20/19
11
Facility Health Inc. Confidential, Copyright 2019
What Assets do I have?
Baseline - Sample Asset
Onsite Assessment Results:
Validation of Asset Inventory,
Collection of Baseline Information,
Synchronization with CMMS Database
31
Facility Health Inc. Confidential, Copyright 2019
How Old, How Performing? What is the RISK?
Budget Level Replacement Cost
• Expected Useful Life Information
• Risk Ranking Based on Criticality
Assessment Information
• Engineering Assessment• Preventative Maintenance
Performance• Work Order History
High Risk Score Indicates Life Safety Asset
32
Facility Health Inc. Confidential, Copyright 2019
How Much to Replace? 5 Year Strategic Plan
Long-Term Planning, All In, or By Campus, Zone, Building, or even by
Asset Types
Year over Year Capital Forecast, 2019 Shows Current Load of Past Deferred
Investments
Ability to Smooth Capital Investments over Multiple Years,
With Objective Projection of Health Index Improvement
Modeling of a Controlled Investment Strategy, $6 M / Year
33

10/20/19
12
Facility Health Inc. Confidential, Copyright 2019
Risk Based Allocation of FundsItemized Reporting Output
Example: Subset of Overall Plan, AHU Assets Only in 2019
• 4 Factors of Capital Planning – Follow the Data• Asset Age - (vs. Industry Standards)• Asset Performance - (Facility Heath Index including assessment
scores and CMMS PM and WO data.)• Asset Risk Ranking - (based on function and area served)• Impact of Unplanned Failure – (patient impact and financial)
• Common data standards and risk criteria allow for objective comparison of all assets and sites in the portfolio.
• Model different investment plans to deal with deferred maintenance backlog.
• Prioritize investments at the individual asset and project level for maximum benefit.
• Invest based on objective needs, prioritized by RISK to the organization.
34
Facility Health Inc. Confidential, Copyright 2019
Conclusions – Part One• Without Strategic Planning, there will be less money available for repair &
replacement of infrastructure, not more.
• There will be more need for project requests to be quantified, objective and defensible not less.
• In most cases, the C-Suite will not “get it” in the traditional terms and language of facility management.
• We all have a fiduciary responsibility to communicate these needs in terms the C-Suite can understand. Because aging infrastructure = RISK.
What can you do? Follow the Data. Look out 5-10 Years, Not Just 1
35
Facility Health Inc. Confidential, Copyright 2019
Conclusion – Part Two
• The metrics you really need are…1. What assets do you have?2. How old are they?3. How are they performing?4. What is the RISK if they fail?5. What is the financial or other impact of a failure?6. How much will it cost to replace them PROACTIVELY vs.
REACTIVELY?
ObjectiveData
Inputs
36

10/20/19
13
Facility Health Inc. Confidential, Copyright 2019
Mark Mochel, MBA, PMP, CSM, FCTVice President
Phone: 616-914-2246Email: [email protected]
37
Facility Health Inc. Confidential, Copyright 2019
Thank You!
38