Embed Size (px)
Citation preview

2013 ARS, North America, MinneapolisRed Room, Session 9
Repairable Systems: Data Analysis and Modeling
Athanasios Gerokostopoulos
Begins at 10:30 AM, Thursday, June 6th

PRESENTATION SLIDESThe following presentation was delivered at the:
International Applied Reliability Symposium, North AmericaJune 5 - 7, 2013: Minneapolis, Minnesota
http://www.ARSymposium.org/2013/
The International Applied Reliability Symposium (ARS) is intended to be a forum for reliability and maintainability practitioners within industry and government to discuss their success stories and lessons learned regarding the application of reliability techniques to meet real world challenges. Each year, the ARS issues an open
"Call for Presentations" at http://www.arsymposium.org/present.htm and the presentations delivered at the Symposium are selected on the basis of the presentation proposals received.
Although the ARS may edit the presentation materials as needed to make them ready to print, the content of the presentation is solely the responsibility of the author. Publication of these presentation materials in the
ARS Proceedings does not imply that the information and methods described in the presentation have been verified or endorsed by the ARS and/or its organizers.
The publication of these materials in the ARS presentation format is Copyright © 2013 by the ARS, All Rights Reserved.
Gerokostopoulos, ReliaSoft Corporation Slide Number: 2Session 9Red Room App
lied
Rel
iabi
lity
Sym
posi
um, N
orth
Am
eric
a 20
13
Introduction
The Purpose of this Presentation is to Explore the Different Methods Available for Analyzing Repairable Systems.
Repairable System Analysis Differs from the Analysis of Non-Repairable Systems/Items.
Mistakes are very Common in the Analysis of Repairable Systems.
In this Presentation the Most Common Mistakes will be Identified, and two Correct Approaches will be Presented.
Gerokostopoulos, ReliaSoft Corporation Slide Number: 3Session 9Red Room App
lied
Rel
iabi
lity
Sym
posi
um, N
orth
Am
eric
a 20
13
Agenda Background.
Common Mistake in the Analysis of Repairable Systems.
Using the Non-Homogeneous Poisson Process for the Analysis of Repairable Systems.
Using Reliability Block Diagrams and Simulation for the Analysis of Repairable Systems.
Summary/Conclusions.
Background.
Common Mistake in the Analysis of Repairable Systems.
Using the Non-Homogeneous Poisson Process for the Analysis of Repairable Systems.
Using Reliability Block Diagrams and Simulation for the Analysis of Repairable Systems.
Summary/Conclusions.
Gerokostopoulos, ReliaSoft Corporation Slide Number: 4Session 9Red Room App
lied
Rel
iabi
lity
Sym
posi
um, N
orth
Am
eric
a 20
13
Definitions LRU – Lowest Replaceable Unit
It is a unit (i.e., component), that when it fails it is replaced with a new and identical unit.
RBD – Reliability Block Diagram
NHPP – Non-Homogeneous Poisson Process
Repair – An Action that brings the System to an Operating Condition
Item – Can be a System, a Subsystem, an Assembly a Subassembly, or a Component
Overhaul – A Maintenance activity that brings the System to its New Condition
LRU – Lowest Replaceable Unit It is a unit (i.e., component), that when it fails it is replaced with a
new and identical unit.
RBD – Reliability Block Diagram
NHPP – Non-Homogeneous Poisson Process
Repair – An Action that brings the System to an Operating Condition
Item – Can be a System, a Subsystem, an Assembly a Subassembly, or a Component
Overhaul – A Maintenance activity that brings the System to its New Condition
Gerokostopoulos, ReliaSoft Corporation Slide Number: 5Session 9Red Room App
lied
Rel
iabi
lity
Sym
posi
um, N
orth
Am
eric
a 20
13
Background
In Reliability Engineering analysis we divide Items into two categories: Repairable and Non-Repairable.
The analysis differs based on the type of Item under consideration.
In Reliability Engineering analysis we divide Items into two categories: Repairable and Non-Repairable.
The analysis differs based on the type of Item under consideration.

Gerokostopoulos, ReliaSoft Corporation Slide Number: 6Session 9Red Room App
lied
Rel
iabi
lity
Sym
posi
um, N
orth
Am
eric
a 20
13
Background
Repairable system is a system that can be restored to an operating condition following a failure.
This definition allows us to make a distinction between models for life lengths prior to failure (i.e., failure distributions), and the models/methods that will be used in this presentation to represent periods of operation that might extend across several failures over the life length of the system.
Gerokostopoulos, ReliaSoft Corporation Slide Number: 7Session 9Red Room App
lied
Rel
iabi
lity
Sym
posi
um, N
orth
Am
eric
a 20
13
Questions of Interest in Repairable Systems Analysis How many failures over a fixed time interval?
What is the probability of a failure in the next time interval?
What is the availability of the system?
How many spare parts should be purchased?
What is the cost of maintaining the system?
What is the optimum overhaul time?
How many failures over a fixed time interval?
What is the probability of a failure in the next time interval?
What is the availability of the system?
How many spare parts should be purchased?
What is the cost of maintaining the system?
What is the optimum overhaul time?
Gerokostopoulos, ReliaSoft Corporation Slide Number: 8Session 9Red Room App
lied
Rel
iabi
lity
Sym
posi
um, N
orth
Am
eric
a 20
13
Repairable Systems Analysis
There are two methods available for analyzing Repairable Systems By collecting and analyzing the data at the
system level, and using a Stochastic Process model such as the NHPP. By collecting and analyzing the data at the
component level (Lowest Replaceable Unit).
There are advantages and disadvantages in each method.
Gerokostopoulos, ReliaSoft Corporation Slide Number: 9Session 9Red Room App
lied
Rel
iabi
lity
Sym
posi
um, N
orth
Am
eric
a 20
13
Common Mistake in the Analysis of Repairable Systems One of the most Common Mistakes in
analyzing repairable systems is fitting a distribution to the system’s Interarrival data.
Interarrival data is the Time Between Failures of a Repairable System.
Ti is the Cumulative Time To Failure
ti is the Interarrival time = Ti – Ti-1
One of the most Common Mistakes in analyzing repairable systems is fitting a distribution to the system’s Interarrival data.
Interarrival data is the Time Between Failures of a Repairable System.
Ti is the Cumulative Time To Failure
ti is the Interarrival time = Ti – Ti-1
SystemT1 T2 T3 T4T5T6 T7 T8
t1 t2 t3 t4 t5 t6 t7 t8
Ts=0 TE
Gerokostopoulos, ReliaSoft Corporation Slide Number: 10Session 9Red Room App
lied
Rel
iabi
lity
Sym
posi
um, N
orth
Am
eric
a 20
13
Why is this a Mistake?
When fitting a distribution we assume that the events are Statistically Independent and Identically Distributed (s.i.i.d.).
In a repairable system the events (failures) are Not Independent and in most cases Not Identically Distributed.
When fitting a distribution we assume that the events are Statistically Independent and Identically Distributed (s.i.i.d.).
In a repairable system the events (failures) are Not Independent and in most cases Not Identically Distributed.
Gerokostopoulos, ReliaSoft Corporation Slide Number: 11Session 9Red Room App
lied
Rel
iabi
lity
Sym
posi
um, N
orth
Am
eric
a 20
13
Why is this a Mistake?
When a Failure occurs in a repairable system the Remaining components have a current age.
The Next Failure Event depends on this current age.
Thus the Failure Events at the System Level are DEPENDENT.
When a Failure occurs in a repairable system the Remaining components have a current age.
The Next Failure Event depends on this current age.
Thus the Failure Events at the System Level are DEPENDENT.
Gerokostopoulos, ReliaSoft Corporation Slide Number: 12Session 9Red Room App
lied
Rel
iabi
lity
Sym
posi
um, N
orth
Am
eric
a 20
13
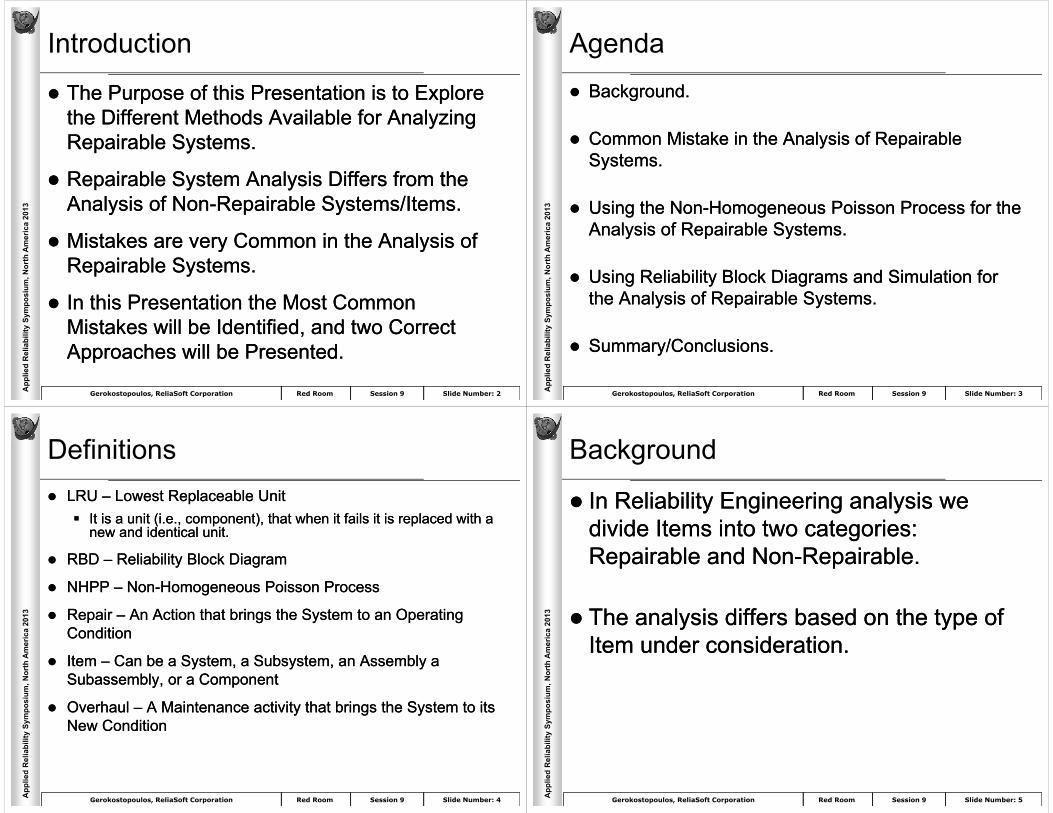
Why is this a Mistake? What we need to model is the Rate of Occurrence of
Failures and the Number of Failures within a given time.
For example, we need a model that will tells us that we expect 8 Failures by TE and that the Rate of Occurrence of Failures is Increasing with Time.
What we need to model is the Rate of Occurrence of Failures and the Number of Failures within a given time.
For example, we need a model that will tells us that we expect 8 Failures by TE and that the Rate of Occurrence of Failures is Increasing with Time.
SystemT1 T2 T3 T4T5T6 T7 T8
t1 t2 t3 t4 t5 t6 t7 t8
Ts=0 TE
Gerokostopoulos, ReliaSoft Corporation Slide Number: 13Session 9Red Room App
lied
Rel
iabi
lity
Sym
posi
um, N
orth
Am
eric
a 20
13
Why is this a Mistake?
If we perform a Distribution Analysis on the Time-Between-Failures, then this is equivalent to saying that we have 9 different systems, and System 1 failed after t1 hours of operation, System 2 after t2,…, etc.
If we perform a Distribution Analysis on the Time-Between-Failures, then this is equivalent to saying that we have 9 different systems, and System 1 failed after t1 hours of operation, System 2 after t2,…, etc.
System 1t1
Ts=0
System 2t2
System 3t3
.
.
.System 9
t9 (suspension)
Gerokostopoulos, ReliaSoft Corporation Slide Number: 14Session 9Red Room App
lied
Rel
iabi
lity
Sym
posi
um, N
orth
Am
eric
a 20
13
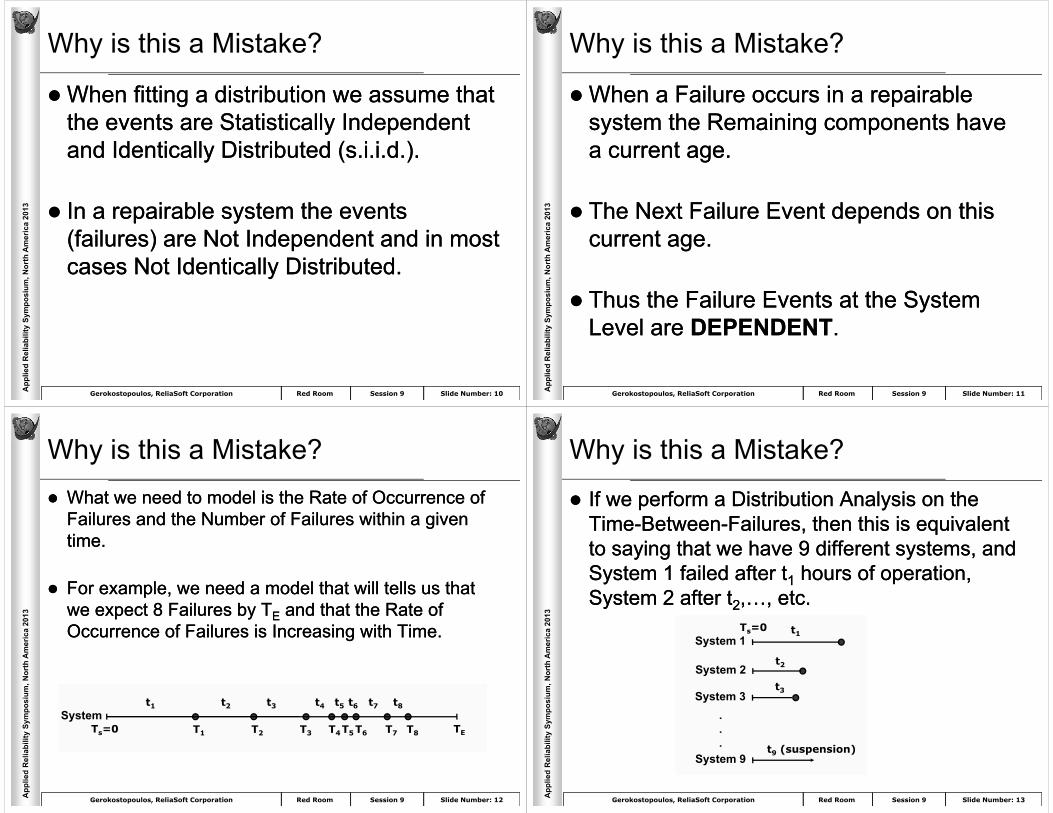
Why is this a Mistake? This is the same as assuming that the System is AS-
GOOD-AS-NEW after the repair, which is NOT true in Repairable Systems in general.
In most cases the System is AS-BAD-AS-OLD after the repair.
This is particularly true for Large Systems, where replacing a component does not have a great impact on the Reliability of the system.
Example: Changing the Starter of a Car.
This is the same as assuming that the System is AS-GOOD-AS-NEW after the repair, which is NOT true in Repairable Systems in general.
In most cases the System is AS-BAD-AS-OLD after the repair.
This is particularly true for Large Systems, where replacing a component does not have a great impact on the Reliability of the system.
Example: Changing the Starter of a Car.
Gerokostopoulos, ReliaSoft Corporation Slide Number: 15Session 9Red Room App
lied
Rel
iabi
lity
Sym
posi
um, N
orth
Am
eric
a 20
13
Example:Will the Driver Finish the Race?
Gerokostopoulos, ReliaSoft Corporation Slide Number: 16Session 9Red Room App
lied
Rel
iabi
lity
Sym
posi
um, N
orth
Am
eric
a 20
13
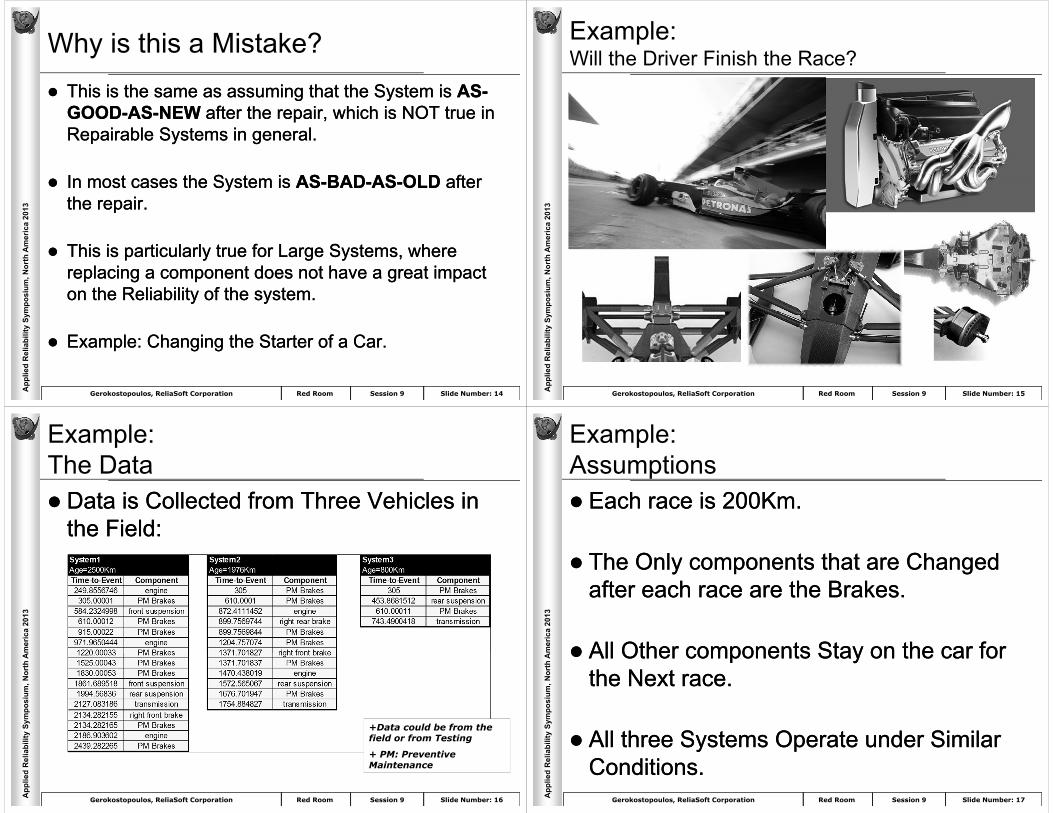
Example:The Data Data is Collected from Three Vehicles in
the Field: Data is Collected from Three Vehicles in
the Field:
+Data could be from the field or from Testing
+ PM: Preventive Maintenance
Gerokostopoulos, ReliaSoft Corporation Slide Number: 17Session 9Red Room App
lied
Rel
iabi
lity
Sym
posi
um, N
orth
Am
eric
a 20
13
Example:Assumptions Each race is 200Km.
The Only components that are Changed after each race are the Brakes.
All Other components Stay on the car for the Next race.
All three Systems Operate under Similar Conditions.
Each race is 200Km.
The Only components that are Changed after each race are the Brakes.
All Other components Stay on the car for the Next race.
All three Systems Operate under Similar Conditions.
Gerokostopoulos, ReliaSoft Corporation Slide Number: 18Session 9Red Room App
lied
Rel
iabi
lity
Sym
posi
um, N
orth
Am
eric
a 20
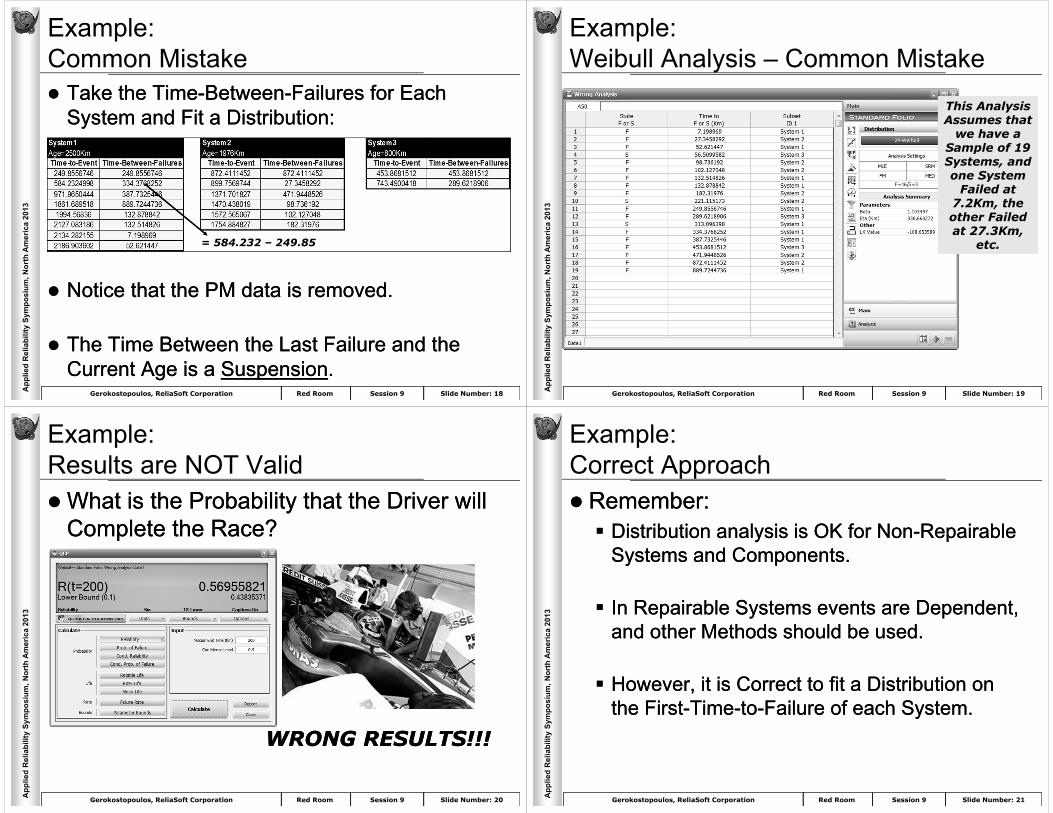
13Example:Common Mistake Take the Time-Between-Failures for Each
System and Fit a Distribution:
Notice that the PM data is removed.
The Time Between the Last Failure and the Current Age is a Suspension.
Take the Time-Between-Failures for Each System and Fit a Distribution:
Notice that the PM data is removed.
The Time Between the Last Failure and the Current Age is a Suspension.
= 584.232 – 249.85
Gerokostopoulos, ReliaSoft Corporation Slide Number: 19Session 9Red Room App
lied
Rel
iabi
lity
Sym
posi
um, N
orth
Am
eric
a 20
13
Example:Weibull Analysis – Common Mistake
This Analysis Assumes that
we have a Sample of 19 Systems, and one System
Failed at 7.2Km, the other Failed at 27.3Km,
etc.
This Analysis Assumes that
we have a Sample of 19 Systems, and one System
Failed at 7.2Km, the other Failed at 27.3Km,
etc.
Gerokostopoulos, ReliaSoft Corporation Slide Number: 20Session 9Red Room App
lied
Rel
iabi
lity
Sym
posi
um, N
orth
Am
eric
a 20
13
Example:Results are NOT ValidWhat is the Probability that the Driver will
Complete the Race?What is the Probability that the Driver will
Complete the Race?
WRONG RESULTS!!!WRONG RESULTS!!!
Gerokostopoulos, ReliaSoft Corporation Slide Number: 21Session 9Red Room App
lied
Rel
iabi
lity
Sym
posi
um, N
orth
Am
eric
a 20
13
Example:Correct Approach Remember: Distribution analysis is OK for Non-Repairable
Systems and Components.
In Repairable Systems events are Dependent, and other Methods should be used.
However, it is Correct to fit a Distribution on the First-Time-to-Failure of each System.
Remember: Distribution analysis is OK for Non-Repairable
Systems and Components.
In Repairable Systems events are Dependent, and other Methods should be used.
However, it is Correct to fit a Distribution on the First-Time-to-Failure of each System.
Gerokostopoulos, ReliaSoft Corporation Slide Number: 22Session 9Red Room App
lied
Rel
iabi
lity
Sym
posi
um, N
orth
Am
eric
a 20
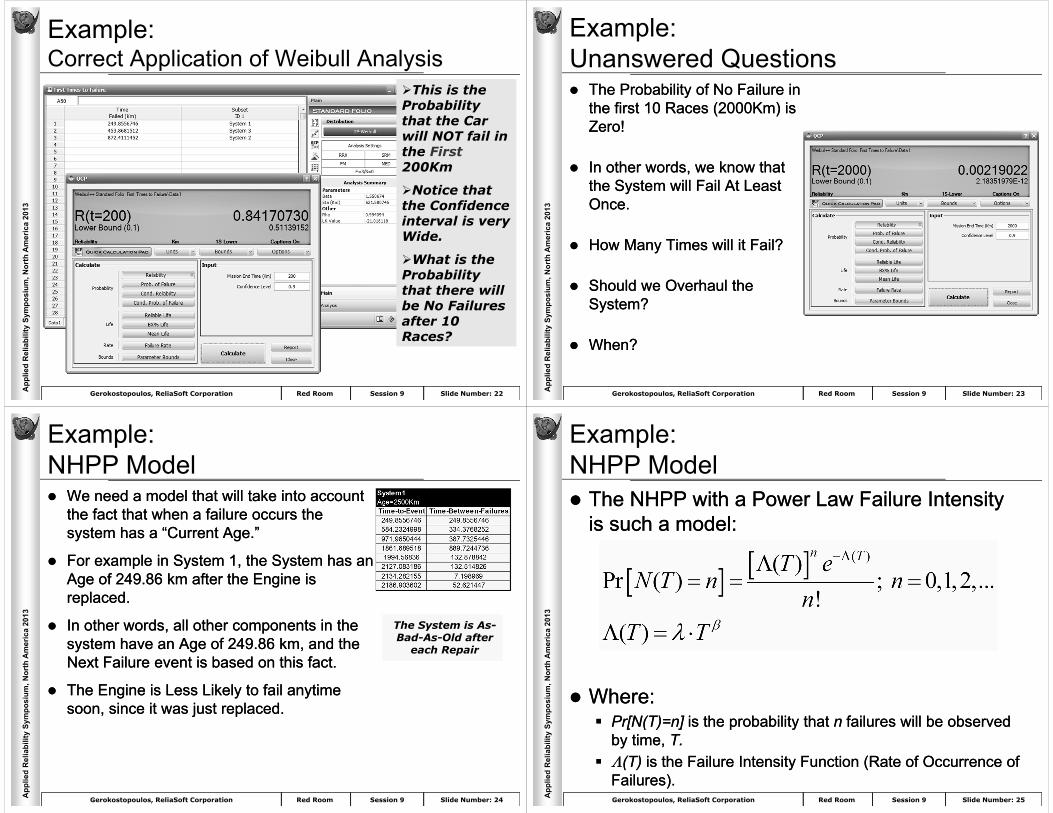
13Example:Correct Application of Weibull Analysis
This is the Probability that the Car will NOT fail in the First200Km
Notice that the Confidence interval is very Wide.
What is the Probability that there will be No Failures after 10 Races?
This is the Probability that the Car will NOT fail in the First200Km
Notice that the Confidence interval is very Wide.
What is the Probability that there will be No Failures after 10 Races?
Gerokostopoulos, ReliaSoft Corporation Slide Number: 23Session 9Red Room App
lied
Rel
iabi
lity
Sym
posi
um, N
orth
Am
eric
a 20
13
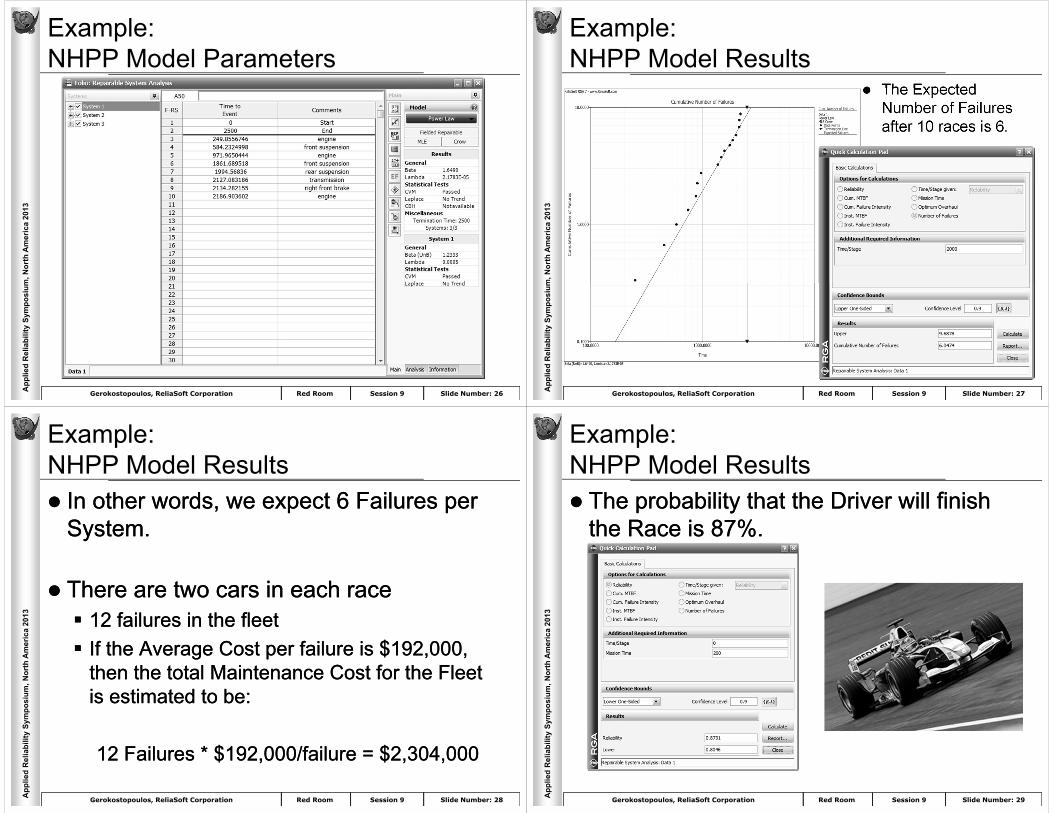
Example:Unanswered Questions The Probability of No Failure in
the first 10 Races (2000Km) is Zero!
In other words, we know that the System will Fail At Least Once.
How Many Times will it Fail?
Should we Overhaul the System?
When?
The Probability of No Failure in the first 10 Races (2000Km) is Zero!
In other words, we know that the System will Fail At Least Once.
How Many Times will it Fail?
Should we Overhaul the System?
When?
Gerokostopoulos, ReliaSoft Corporation Slide Number: 24Session 9Red Room App
lied
Rel
iabi
lity
Sym
posi
um, N
orth
Am
eric
a 20
13
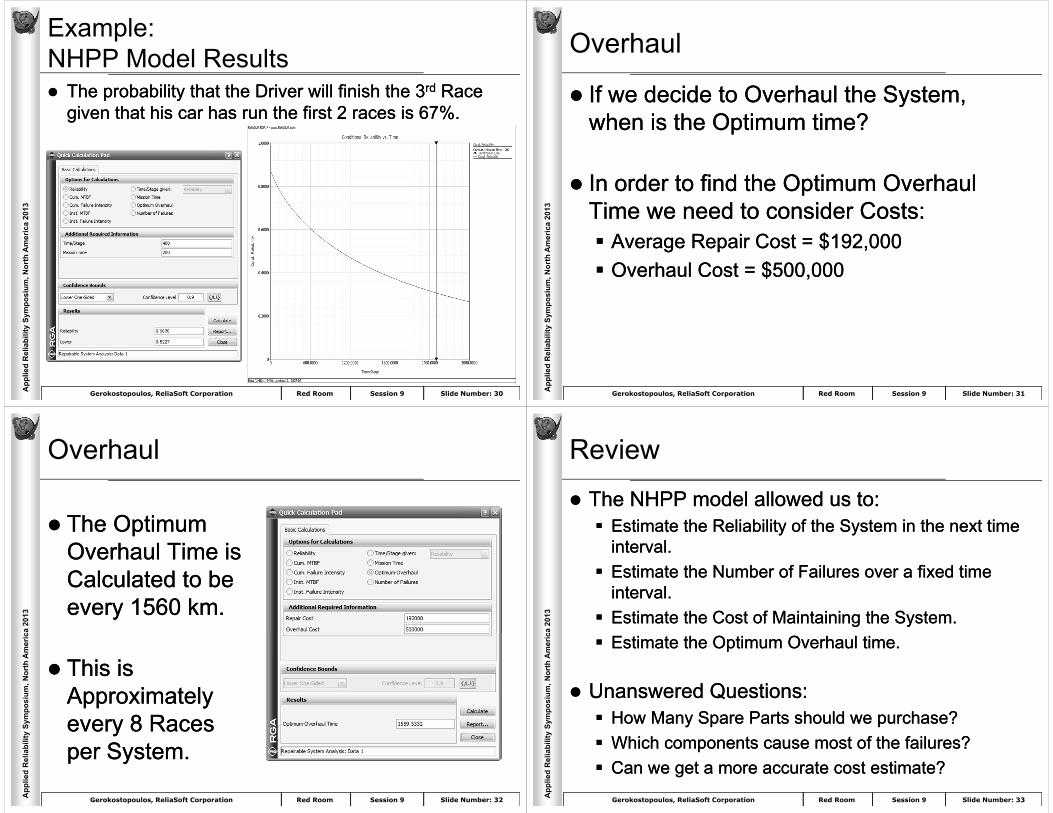
Example:NHPP Model We need a model that will take into account
the fact that when a failure occurs the system has a “Current Age.”
For example in System 1, the System has an Age of 249.86 km after the Engine is replaced.
In other words, all other components in the system have an Age of 249.86 km, and the Next Failure event is based on this fact.
The Engine is Less Likely to fail anytime soon, since it was just replaced.
We need a model that will take into account the fact that when a failure occurs the system has a “Current Age.”
For example in System 1, the System has an Age of 249.86 km after the Engine is replaced.
In other words, all other components in the system have an Age of 249.86 km, and the Next Failure event is based on this fact.
The Engine is Less Likely to fail anytime soon, since it was just replaced.
The System is As-Bad-As-Old after
each Repair
Gerokostopoulos, ReliaSoft Corporation Slide Number: 25Session 9Red Room App
lied
Rel
iabi
lity
Sym
posi
um, N
orth
Am
eric
a 20
13
Example:NHPP Model The NHPP with a Power Law Failure Intensity
is such a model:
Where: Pr[N(T)=n] is the probability that n failures will be observed
by time, T. (T) is the Failure Intensity Function (Rate of Occurrence of
Failures).
The NHPP with a Power Law Failure Intensity is such a model:
Where: Pr[N(T)=n] is the probability that n failures will be observed
by time, T. (T) is the Failure Intensity Function (Rate of Occurrence of
Failures).
Gerokostopoulos, ReliaSoft Corporation Slide Number: 26Session 9Red Room App
lied
Rel
iabi
lity
Sym
posi
um, N
orth
Am
eric
a 20
13Example:NHPP Model Parameters
Gerokostopoulos, ReliaSoft Corporation Slide Number: 27Session 9Red Room App
lied
Rel
iabi
lity
Sym
posi
um, N
orth
Am
eric
a 20
13
Example:NHPP Model Results
The Expected Number of Failures after 10 races is 6.
The Expected Number of Failures after 10 races is 6.
Gerokostopoulos, ReliaSoft Corporation Slide Number: 28Session 9Red Room App
lied
Rel
iabi
lity
Sym
posi
um, N
orth
Am
eric
a 20
13
Example:NHPP Model Results In other words, we expect 6 Failures per
System.
There are two cars in each race 12 failures in the fleet If the Average Cost per failure is $192,000,
then the total Maintenance Cost for the Fleet is estimated to be:
12 Failures * $192,000/failure = $2,304,000
In other words, we expect 6 Failures per System.
There are two cars in each race 12 failures in the fleet If the Average Cost per failure is $192,000,
then the total Maintenance Cost for the Fleet is estimated to be:
12 Failures * $192,000/failure = $2,304,000
Gerokostopoulos, ReliaSoft Corporation Slide Number: 29Session 9Red Room App
lied
Rel
iabi
lity
Sym
posi
um, N
orth
Am
eric
a 20
13
Example:NHPP Model Results The probability that the Driver will finish
the Race is 87%. The probability that the Driver will finish
the Race is 87%.
Gerokostopoulos, ReliaSoft Corporation Slide Number: 30Session 9Red Room App
lied
Rel
iabi
lity
Sym
posi
um, N
orth
Am
eric
a 20
13Example:NHPP Model Results The probability that the Driver will finish the 3rd Race
given that his car has run the first 2 races is 67%. The probability that the Driver will finish the 3rd Race
given that his car has run the first 2 races is 67%.
Gerokostopoulos, ReliaSoft Corporation Slide Number: 31Session 9Red Room App
lied
Rel
iabi
lity
Sym
posi
um, N
orth
Am
eric
a 20
13
Overhaul
If we decide to Overhaul the System, when is the Optimum time?
In order to find the Optimum Overhaul Time we need to consider Costs: Average Repair Cost = $192,000 Overhaul Cost = $500,000
If we decide to Overhaul the System, when is the Optimum time?
In order to find the Optimum Overhaul Time we need to consider Costs: Average Repair Cost = $192,000 Overhaul Cost = $500,000
Gerokostopoulos, ReliaSoft Corporation Slide Number: 32Session 9Red Room App
lied
Rel
iabi
lity
Sym
posi
um, N
orth
Am
eric
a 20
13
Overhaul
The Optimum Overhaul Time is Calculated to be every 1560 km.
This is Approximately every 8 Races per System.
The Optimum Overhaul Time is Calculated to be every 1560 km.
This is Approximately every 8 Races per System.
Gerokostopoulos, ReliaSoft Corporation Slide Number: 33Session 9Red Room App
lied
Rel
iabi
lity
Sym
posi
um, N
orth
Am
eric
a 20
13
Review
The NHPP model allowed us to: Estimate the Reliability of the System in the next time
interval. Estimate the Number of Failures over a fixed time
interval. Estimate the Cost of Maintaining the System. Estimate the Optimum Overhaul time.
Unanswered Questions: How Many Spare Parts should we purchase? Which components cause most of the failures? Can we get a more accurate cost estimate?
Gerokostopoulos, ReliaSoft Corporation Slide Number: 34Session 9Red Room App
lied
Rel
iabi
lity
Sym
posi
um, N
orth
Am
eric
a 20
13
RBD Approach
This approach is based on creating a Reliability Block Diagram of the System Components.
The Failure Distribution of each Component in the System needs to be estimated first.
In this example we have data on 6 Items, which we assume are Replaceable: Engine Transmission Front & Rear Brakes Front & Rear Suspension
Gerokostopoulos, ReliaSoft Corporation Slide Number: 35Session 9Red Room App
lied
Rel
iabi
lity
Sym
posi
um, N
orth
Am
eric
a 20
13
The SystemRear AssemblyRear Assembly Front AssemblyFront Assembly
Gerokostopoulos, ReliaSoft Corporation Slide Number: 36Session 9Red Room App
lied
Rel
iabi
lity
Sym
posi
um, N
orth
Am
eric
a 20
13
Reliability Block Diagrams
Gerokostopoulos, ReliaSoft Corporation Slide Number: 37Session 9Red Room App
lied
Rel
iabi
lity
Sym
posi
um, N
orth
Am
eric
a 20
13
Failure Distributions
For each Component find the Times-To-Failure from each System and then Combine the Data.
Engine Data:
For each Component find the Times-To-Failure from each System and then Combine the Data.
Engine Data:
Suspension = 2500 - 2186.9
Failure = 1470 - 872

Gerokostopoulos, ReliaSoft Corporation Slide Number: 38Session 9Red Room App
lied
Rel
iabi
lity
Sym
posi
um, N
orth
Am
eric
a 20
13
Engine Analysis
Gerokostopoulos, ReliaSoft Corporation Slide Number: 39Session 9Red Room App
lied
Rel
iabi
lity
Sym
posi
um, N
orth
Am
eric
a 20
13
Component Analysis
Gerokostopoulos, ReliaSoft Corporation Slide Number: 40Session 9Red Room App
lied
Rel
iabi
lity
Sym
posi
um, N
orth
Am
eric
a 20
13
Component Properties
Enter Failure and Repair Information for each Block.
Enter Failure and Repair Information for each Block.
Gerokostopoulos, ReliaSoft Corporation Slide Number: 41Session 9Red Room App
lied
Rel
iabi
lity
Sym
posi
um, N
orth
Am
eric
a 20
13
Additional Properties
For the Brakes, enter the Preventive Maintenance Policies: Every 200Km all
4 brakes are replaced. When one brake fails,
the other brakes are replaced.
For the Brakes, enter the Preventive Maintenance Policies: Every 200Km all
4 brakes are replaced. When one brake fails,
the other brakes are replaced.
Gerokostopoulos, ReliaSoft Corporation Slide Number: 42Session 9Red Room App
lied
Rel
iabi
lity
Sym
posi
um, N
orth
Am
eric
a 20
13
Simulating the RBD
Gerokostopoulos, ReliaSoft Corporation Slide Number: 43Session 9Red Room App
lied
Rel
iabi
lity
Sym
posi
um, N
orth
Am
eric
a 20
13
System Results
Gerokostopoulos, ReliaSoft Corporation Slide Number: 44Session 9Red Room App
lied
Rel
iabi
lity
Sym
posi
um, N
orth
Am
eric
a 20
13
Component Results RS FCI: Percentage of System Failures Caused by a Component.
Number of SparesNumber of Spares
Gerokostopoulos, ReliaSoft Corporation Slide Number: 45Session 9Red Room App
lied
Rel
iabi
lity
Sym
posi
um, N
orth
Am
eric
a 20
13
RBD AnalysisConclusions Advantages Criticality and Sensitivity analysis can be
performed. Identify weak components in the system Perform optimization and reliability allocation Obtain Availability, Downtime, Expected
Failures, etc., at the component level as well as the system level.

Gerokostopoulos, ReliaSoft Corporation Slide Number: 46Session 9Red Room App
lied
Rel
iabi
lity
Sym
posi
um, N
orth
Am
eric
a 20
13RBD AnalysisConclusions Disadvantages Detailed information is required, such as:
o Failure Data at the LRU levelo Repair Data at the LRU level
Disadvantages Detailed information is required, such as:
o Failure Data at the LRU levelo Repair Data at the LRU level
Gerokostopoulos, ReliaSoft Corporation Slide Number: 47Session 9Red Room App
lied
Rel
iabi
lity
Sym
posi
um, N
orth
Am
eric
a 20
13
NHPP ModelConclusions Advantages Quickly obtain system results No detailed information required
Disadvantages Limited results No availability, downtime, etc., estimations No sensitivity/criticality results
Advantages Quickly obtain system results No detailed information required
Disadvantages Limited results No availability, downtime, etc., estimations No sensitivity/criticality results
Gerokostopoulos, ReliaSoft Corporation Slide Number: 48Session 9Red Room App
lied
Rel
iabi
lity
Sym
posi
um, N
orth
Am
eric
a 20
13
Summary
Two Different Methods of Analyzing Repairable System Data were presented: NHPP RBD
The analysis method chosen will depend on the available data: For a small amount of data with little detail, NHPP
can easily be applied. For detailed data with enough information at the
component level both methods can be used, but the RBD approach is preferred (more detailed analysis).
Gerokostopoulos, ReliaSoft Corporation Slide Number: 49Session 9Red Room App
lied
Rel
iabi
lity
Sym
posi
um, N
orth
Am
eric
a 20
13
Questions and Discussion
Gerokostopoulos, ReliaSoft Corporation Slide Number: 50Session 9Red Room App
lied
Rel
iabi
lity
Sym
posi
um, N
orth
Am
eric
a 20
13
ReliaSoft’s Reliability Growth and Repairable System Analysis Reference.
ReliaSoft’s Life Data Analysis Reference. ReliaSoft’s System Reliability Reference. www.reliawiki.org www.weibull.com Software:Weibull++ 8 BlockSim 8 RGA 7
Additional Information
Gerokostopoulos, ReliaSoft Corporation Slide Number: 51Session 9Red Room App
lied
Rel
iabi
lity
Sym
posi
um, N
orth
Am
eric
a 20
13
Athanasios Gerokostopoulos Reliability Engineer ReliaSoft Corporation [email protected]
Presenter Information