Embed Size (px)
Citation preview
REPAIRS IN AMERICAN SIGN LANGUAGE INTERPRETING 1
Repairs in American Sign Language Interpreting:
Repair Strategies and Frequencies in Interpretations from
English to American Sign Language
Victoria Miller and Christopher Matthews
Northeastern University
Correspondence regarding this article should be sent to Victoria Miller at
[email protected] or Christopher Matthews at [email protected]
REPAIRS IN AMERICAN SIGN LANGUAGE INTERPRETING 2
Abstract
This study examined the use and frequency of different types of repairs in interpretations from
English to American Sign Language in order to address the following questions: (a) Does the
number of repairs vary based on how many years of work-related interpreting experience an
interpreter has? (b) Which type of repair (Error, Appropriacy, Rectifying, Intrusion) is used most
frequently in English-ASL interpretations? (c) What is the distribution of repairs within an
interpreted text? Does the frequency increase in the final minutes of an interpretation due to
cognitive fatigue?
Keywords: American Sign Language, interpreting, repairs, miscue, repair strategies

REPAIRS IN AMERICAN SIGN LANGUAGE INTERPRETING 3
Repairs
In the interpreting process, there are numerous stages and levels at which miscues can
occur that require repair. In order to fully understand the process of repairing miscues, we must
first look at how miscues are detected and repaired in an individual’s first language (L1) and
second language (L2). We must also look at the role of the monitor in repairing miscues as the
monitoring process is what allows individuals to identify errors in need of repair. Monitor is also
important to discuss in regard to this study as the monitoring process differs between spoken and
signed languages. Indeed, Kormos (1999) defines repairs or self-corrections as:
overt manifestations of the monitoring process. A self-initiated, self-completed correction
comes about when the speaker detects that the output has been erroneous or
inappropriate, halts the speech flow, and finally executes a correction. (p. 315)
In order to understand the need for repairs and the use of monitor in interpretations, we
must first investigate the use of repairs in an individual’s L1 and L2. There is a great deal of
research regarding L1 and L2 repairs, but minimal investigation on repairs in English to
American Sign Language (ASL) interpretations.
Repairs in L1
The correction of miscues in L1 speech is essential in all languages (both spoken and
visual/gestural). Clark (1982) studied the type of repairs used by young children and found that
at different stages of language acquisition, different repairs became more prevalent. In young
children, phonological and morphological repairs are quite frequent. As a child ages, however,
syntactic repairs become more prevalent as syntactic repairs reflect a greater command of
language.

REPAIRS IN AMERICAN SIGN LANGUAGE INTERPRETING 4
Evans (1985) described the frequency of repairs in L1 as a “u-function;” beginning users
of a language may make many errors which they do not repair, intermediate learners make errors
but their frequency of repairs begins to “increase in frequency with increasing monitoring skill,”
and the use of repairs by advanced language users tends to “decrease as language skill becomes
relatively sophisticated and the ability to plan and organize one’s thoughts in advance becomes
well developed” (p. 369). When plotted on a graph, this finding forms an inverse u shape and
makes it appear as though beginner and advanced language learners have the same frequency of
repairs. Evans also found that younger children (kindergarten age) are more likely to abandon
their original message than older children (second grade). These same phenomena may be
applicable to an individual’s L2 development over time.
Repairs in L2
Studies regarding second language acquisition (SLA) have researched the initiation and
frequency of repairs in an individual’s L2. There are limited studies on the use of repair
strategies in ASL interpreting, but the studies that investigate L2 repairs are relevant to this
study.
Repairs in a spoken L2 can be categorized into four main groups, each containing
subgroups. These four main types of repairs are all self-initiated (i.e., repairs that are not initiated
or prompted by another individual). The following taxonomy of errors is based on the work of
Kormos (2000) and will be used to categorize repairs in ASL interpreting. However, because
Kormos’ work focused on L2 production rather than interpreting, some categories were added or
expanded upon to more appropriately reflect the repairs that appear in the interpreting process:
1. Appropriacy repairs. A speaker decides to encode the originally intended information but in
a modified way in order to make the message more clear or precise.

REPAIRS IN AMERICAN SIGN LANGUAGE INTERPRETING 5
• Lexical. A speaker replaces one term with another, more precise term.
• Insertion. The repetition of a previous phrase or sentence with one or more
words is inserted to clarify the original message or to make the message more
precise.
2. Error repairs. The speaker repairs an accidental lapse. Such lapses can occur at every phase
of language processing, that is, during accessing lexical items, grammatical and phonological
encoding, and articulation.
• Morphological. The speaker makes a correction of a morphological error such
as the incorrect suffix for a verb or noun (in ASL this would include
pluralization, reduplication to form noun/verb pairs, temporal aspect,
compounding, and directionality).
• Lexical. A speaker repairs the selection of an incorrect word or number.
• Syntactic. A speaker produces a grammatical construction that would violate
the grammar of the target language unless repaired.
• Phonological. The speaker makes a repair of a slip of the tongue that occurs
during articulation phase (in ASL, a phonological error/repair would refer to the
four parameters which create s sign: movement, location, palm orientation, and
handshape).
3. Rectifying repairs. A speaker decides to encode different information than he/she is
currently formulating.
• Message abandonment. An incomplete message is dropped as the speaker
abandons the original message in order to formulate a new, different message.
Some people call this a ‘false start.’

REPAIRS IN AMERICAN SIGN LANGUAGE INTERPRETING 6
• Inappropriate information. The speaker decides to recode the information in his
or her message due to inaccurate or inappropriate information in the original
message.
4. Intrusions. The grammar or phrasing of the source language is incorporated into the
target language interpretation. Due to differences in the source and target language, this
may result in errors in the target language.
• English intrusions. English phrasing appears in an ASL interpretation. For
example, when a speaker says, “meet the deadline,” and an interpreter uses the
sign MEET (“to meet a person”) in their interpretation, this would be an intrusion
of English word usage.
• ASL intrusion. ASL phrasing and word order appear in the spoken English
interpretation1.
Of the repairs listed above, it has been found that morphological and phonological errors
are the most frequently used error repairs made by individuals in their L2 (Kormos, 2000; Van
Hest, 2001; Lennon, 1990; O’Connor, 1988).
Role of Monitor in Repairs
The monitoring process is pertinent to the study of repairs because an individual’s
monitor allows them to recognize errors and to repair them; however, the act of monitoring a
spoken language differs from monitoring ASL production. When speaking, individuals rely on
their external, auditory monitor to listen to what they are saying and to edit any perceived errors.
In ASL, however, individuals rely on their kinesthetic monitor to repair errors. As all individuals 1 This category is not relevant to the current study as no videos containing ASL to English Interpretations were analyzed. However, this category may be pertinent to future studies that wish to study ASL to English interpretations.

REPAIRS IN AMERICAN SIGN LANGUAGE INTERPRETING 7
in this study are L2 ASL learners, the use of their kinesthetic monitor is not as natural or
automatic as the use of their auditory monitor. Nevertheless, as an individual increasingly learns
and works with ASL, their kinesthetic monitor becomes more sensitive. Therefore, it can be
assumed that interpreters with greater experience would have a more sensitive kinesthetic
monitor than less experienced interpreters. Indeed, Kormos (1999) found that:
[d]ue to limited metalinguistic awareness at the beginning of the acquisition process,
learners make more errors and correct a smaller proportion of these mistakes than more
advanced speakers. One the other hand, with the general development of language skills,
metalinguistic awareness also increases and speakers make fewer mistakes, and are
assumed to have a higher correction rate of their erroneous output. (p. 330)
Familiarity with a language alters the number of repairs as does the familiarity with the
task/ subject being discussed. As a task becomes more familiar due to repetition, rehearsal, pre-
existing knowledge or practice in an L2, the speaker has more time to process and focus on
monitoring rather than on conceptual planning (Foster & Skehan, 1996).
Questions for Analysis
This project addresses the following questions:
1. Does the number of repairs vary based on interpreter experience? Given that interpreting
from one language to another is a cognitively demanding process, all interpreters will utilize
repair strategies. Additionally, the interpreters in this study are interpreting from their L1 to
their L2; due to the process of second language acquisition (SLA), it can be determined that
the more experienced interpreters will have a greater command of the language and will have
fewer errors and repairs than less experienced interpreters.

REPAIRS IN AMERICAN SIGN LANGUAGE INTERPRETING 8
2. Which type of repair (.e.g., miscue, appropriacy, rectifying, intrusion) is used most frequently
in English-ASL interpretations? Does the frequency of different types of repairs vary with
experience? Based on findings by Kormos (2000), Lennon (1990), O’Connor (1988), and
Van Hest (2001), it is hypothesized that error repairs will be most frequent. Because previous
studies have found that, of the sub-categories of error repairs, phonological and
morphological repairs are the most frequently used in L2 speech, one can speculate that these
types of error repairs will likewise be used more frequently as one interprets into his or her
L2. Also, Clark (1982) found that as children learn and develop their L1, the frequency of
syntactic repairs increases, reflecting a greater command of language use and grammar
development. Therefore, it is hypothesized that there will be a positive correlation between
the number of syntactic repairs used and the experience level of the interpreter.
3. What is the distribution of repairs within an interpretation? It is hypothesized that the
frequency of repairs in an interpretation will increase in the final five minutes of an
interpretation as cognitive load and processing may become more difficult and hinder an
individual’s ability to process the source message while simultaneously producing and
interpretation. The ideal interpreting conditions would call for a team of interpreters to
‘switch-off’ every 20 or 30 minutes to prevent cognitive fatigue (Moser-Mercer, Kunzli, &
Korac, 1998; Seleskovitch, 1978). As both of the texts in this study are approximately 20
minutes in length, we will analyze whether the frequency of repairs increases in the final five
minutes of the interpretation
REPAIRS IN AMERICAN SIGN LANGUAGE INTERPRETING 9
Method
Participants
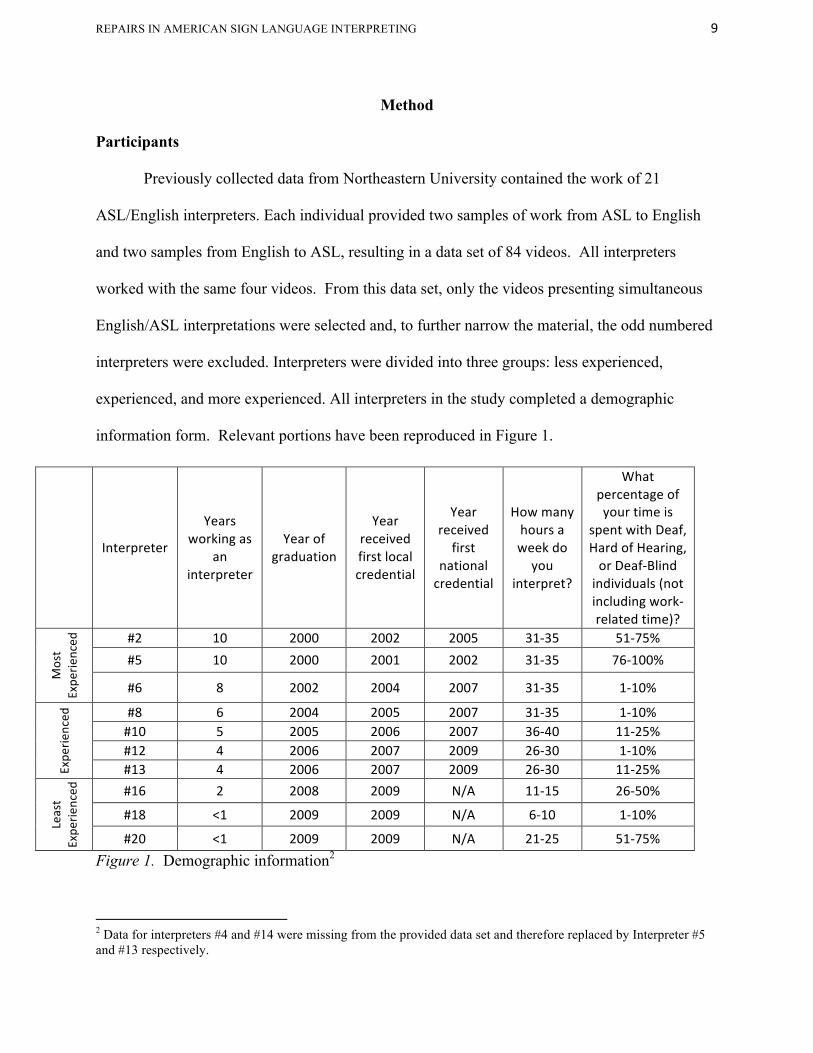
Previously collected data from Northeastern University contained the work of 21
ASL/English interpreters. Each individual provided two samples of work from ASL to English
and two samples from English to ASL, resulting in a data set of 84 videos. All interpreters
worked with the same four videos. From this data set, only the videos presenting simultaneous
English/ASL interpretations were selected and, to further narrow the material, the odd numbered
interpreters were excluded. Interpreters were divided into three groups: less experienced,
experienced, and more experienced. All interpreters in the study completed a demographic
information form. Relevant portions have been reproduced in Figure 1.
Figure 1. Demographic information2
2 Data for interpreters #4 and #14 were missing from the provided data set and therefore replaced by Interpreter #5 and #13 respectively.
Interpreter
Years working as
an interpreter
Year of graduation
Year received first local credential
Year received first
national credential
How many hours a week do you
interpret?
What percentage of your time is
spent with Deaf, Hard of Hearing, or Deaf-‐Blind individuals (not including work-‐related time)?
Most
Expe
rienced
#2 10 2000 2002 2005 31-‐35 51-‐75% #5 10 2000 2001 2002 31-‐35 76-‐100%
#6 8 2002 2004 2007 31-‐35 1-‐10%
Expe
rienced
#8 6 2004 2005 2007 31-‐35 1-‐10% #10 5 2005 2006 2007 36-‐40 11-‐25% #12 4 2006 2007 2009 26-‐30 1-‐10% #13 4 2006 2007 2009 26-‐30 11-‐25%
Least
Expe
rienced
#16 2 2008 2009 N/A 11-‐15 26-‐50%
#18 <1 2009 2009 N/A 6-‐10 1-‐10%
#20 <1 2009 2009 N/A 21-‐25 51-‐75%

REPAIRS IN AMERICAN SIGN LANGUAGE INTERPRETING 10
Analysis of Data
All interpreters in the data set provided a sample of their English/ASL simultaneous
interpreting. Two different texts were interpreted and analyzed for this study. Each text was
delivered by a professor at Northeastern University:
• Video 1. Mike Dukakis speaks about the need for a national high-speed rail passenger system
in the United States. The video was categorized as a persuasive/expository text and the
presenter spoke at a rate of approximately 165 words-per-minute.
• Video 2: Bill Fowler discusses the history of the American Revolution and the United States
Constitution. This video was considered as a historical narrative text and the presenter spoke at
a rate of approximately 117 words-per-minute.
One member of the team watched 10 interpreters interpreting Video 1 while the other
member of the team studied the same interpreters interpreting Video 2. Thus, each member of
the team became accustomed to the speaking style of the presenter and to the information that
was being discussed.
Instances of repaired miscues were collected and coded by the time in the interpretation
at which they occurred. Repairs were labeled and categorized according to the outline
established in the previously described Repairs in L2 subsection. Any unclear or uncertain label
was investigated and all disputed repairs were eliminated from the findings.
REPAIRS IN AMERICAN SIGN LANGUAGE INTERPRETING 11
Findings
Does the frequency of repairs vary based on experience?
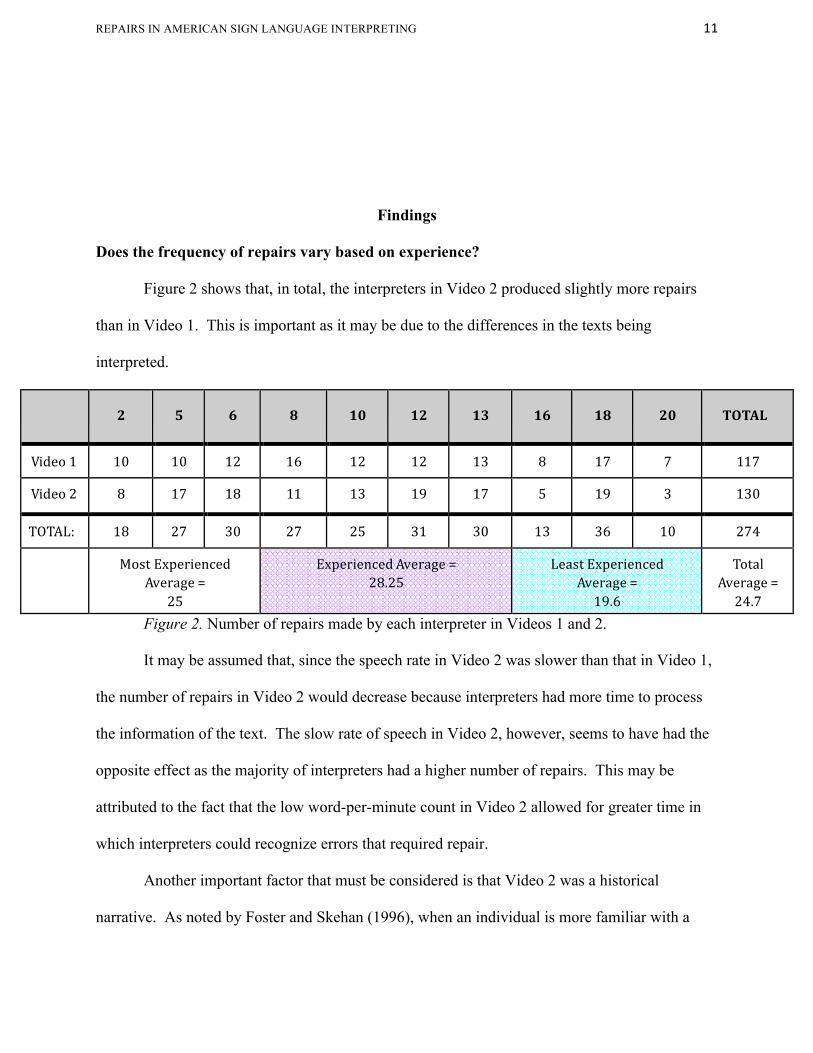
Figure 2 shows that, in total, the interpreters in Video 2 produced slightly more repairs
than in Video 1. This is important as it may be due to the differences in the texts being
interpreted.
2 5 6 8 10 12 13 16 18 20 TOTAL
Video 1 10 10 12 16 12 12 13 8 17 7 117
Video 2 8 17 18 11 13 19 17 5 19 3 130
TOTAL: 18 27 30 27 25 31 30 13 36 10 274
Most Experienced Average =
25
Experienced Average = 28.25
Least Experienced Average = 19.6
Total Average = 24.7
Figure 2. Number of repairs made by each interpreter in Videos 1 and 2.
It may be assumed that, since the speech rate in Video 2 was slower than that in Video 1,
the number of repairs in Video 2 would decrease because interpreters had more time to process
the information of the text. The slow rate of speech in Video 2, however, seems to have had the
opposite effect as the majority of interpreters had a higher number of repairs. This may be
attributed to the fact that the low word-per-minute count in Video 2 allowed for greater time in
which interpreters could recognize errors that required repair.
Another important factor that must be considered is that Video 2 was a historical
narrative. As noted by Foster and Skehan (1996), when an individual is more familiar with a

REPAIRS IN AMERICAN SIGN LANGUAGE INTERPRETING 12
text, they can expend a greater amount of cognitive energy on monitoring than on production.
Perhaps the narrative structure is more predictable since it often follows a pattern of rising and
falling action. Also, as this narrative was about a historical event some individuals may possess
some previous knowledge of the topic being discussed.
Elements such as rate of speech and content of Video 2 differ greatly from the fast-paced,
expository/persuasive text in Video 1. In Video 1, the speaker makes numerous asides, tells short
personal narratives and discusses the need for Universal Health Care before arriving at his main
topic, a national rail passenger system. Because of the fast pace and unpredictable structure,
interpreters may have had less opportunity to monitor their work than when interpreting Video 1.
The average number of repairs in Video 1 was 11.7; in Video 2, 13. As seen in Figure 2,
six interpreters in Video 1 and six interpreters in Video 2 fell above the average. It was
hypothesized that less experienced interpreters would exhibit the most repairs. The data do not
verify that hypothesis. Indeed, in Video 1, of the four interpreters whose scores fell below the
average number of repairs, two were in the most experienced group and two were in the least
experienced group. Of the four whose scores fell below the average in Video 2, one was in the
most experienced group, one in the experienced group, and two were in the least experienced
grouping.
This distribution of repairs could be an example of the u-function described in the
Repairs in L1 subsection of this study. The u-function suggests that the number of repairs may
increase in the intermediate stages of learning as monitoring skills become more advanced and,
subsequently, that the number of repairs decreases as an individual’s language skills become
more advanced and their ability to plan and arrange their thoughts becomes more sophisticated.
Also, less experienced interpreters may have a high number of errors that are not repaired.

REPAIRS IN AMERICAN SIGN LANGUAGE INTERPRETING 13
Although the most experienced interpreters produced fewer errors than others, they were more
aware of mistakes and more readily repaired them. 3 This can be explained more clearly by
calculating how many errors each interpreter made and the percent of errors repaired.
Figure 3. Percent of errors repaired in videos 1 and 2. 4
As seen in Figure 3, the percentage of errors repaired in Videos 1 and 2 drop drastically in
work produced by the least experienced interpreters with the exception of the work of Interpreter #8
in Video 2. Indeed, it can be noted that the five least experienced interpreters in both videos repair
less than 50% of their errors. The data in Figure 3 suggest a distinguishing reason why the least
experienced interpreters had such a low frequency of total repairs in both videos. As Kormos (2000)
found, less experienced L2 learners make more errors than more experienced L2 users but correct
fewer errors. Low error correction percentage may be due to a less developed kinesthetic monitor in
3 This makes it appear as though the most and least experienced interpreters have similar frequencies of repairs. 4 To calculate the percent of repaired errors, five 2-minute samples of each text were viewed (total of 10 minutes which ranged from the start of the text until the end). Only the number of repaired and unrepaired errors which fell within the sections selected were counted and used to find the percent of repaired errors. Omissions of important information (i.e. not asides or filler information) were counted as unrepaired errors.
0%
10%
20%
30%
40%
50%
60%
70%
80%
90%
100%
#2 #5 #6 #8 #10 #12 #13 #16 #18 #20
Interpreter

REPAIRS IN AMERICAN SIGN LANGUAGE INTERPRETING 14
the less experienced interpreter. In addition to a low percentage of repaired errors, there are
numerous other factors that may explain why two of the least experienced interpreters have so few
repairs. First, least experienced interpreters dropped a great deal of information from the original
text when producing interpretations. For example, the work produced by Interpreter #20 had a low
number of repairs but also dropped a great deal of information in Video 1. To illustrate dropped
information in Video 1, two segments of the spoken text were transcribed and the interpretations of
Interpreter #2 and #20 were compared to the source text.
Figure 4. Omitted information by Interpreter #20 in Video 1. Boldface text indicates information that Interpreter #20 omitted from the interpretation of Video 15.
One can see in Figure 4 that when a less experienced interpreter drops information, the
frequency of repairs is reduced as well. This may be attributed to the fact that when information 5 The transcripts for the work of Interpreter #2 are not included as it was found that Interpreter #2 omitted no information from these two segments of text.
Interpreter #20 - Segment 1 Interpreter #20 - Segment 2
This is the only advanced, industrialized nation in the world - with the exception of South Africa - that does not guarantee it's people comprehensive health insurance. In my opinion, that's a national embarrassment and disgrace. Not only that but we're spending twice per-capita on health care - 10% more, 20% more, 30% more, 100% more - than other advance, industrialized nations. They cover everybody. We've got 50-million people who don't have a dime of health insurance, by the way, overwhelmingly, working people and members of working families - people are not looking - they're working. And, we're spending twice as much as these other countries with worse health outcomes. They have longer life expectancy than we do, they have much lower infant mortality than we do, and they do it for half the cost. So one of the things I hope we're gonna see in Washing- ton this year, and we've been debating this, by the way, for 100-years.
California, interestingly enough - re- member, car-loving California - the [indecipherable] of California - by a substantial majority just voted in the 2008 election for a major new bond issue to build a European-type (if I can use that term) 200 mph train system. Passenger train system in California which will connect Sacramento, San Francisco, San Jose, to Central Valley, Los Angles, Riverside, San Diego with 200 mph trains. Two hours and forty minutes from downtown LA to downtown SF. Fifty-five minutes from downtown LA to downtown SD. Think about it! That's a state that now has 37-million people - will have 50-million in the next 30-years - has a highway system that is great but to- tally dysfunctional as anyone knows who spends any time there. And the voters of that state approve this. So, in California and here in the North- East Corridor we'll probably be getting or have to improve on trains that look a lot more like what you ride in Europe or Japan.

REPAIRS IN AMERICAN SIGN LANGUAGE INTERPRETING 15
is omitted, the interpreter has more time to process the text and produce a more accurate
interpretation.
It could be assumed that, because Interpreter #18 has such a high frequency of repairs in
both videos (see Figure 2), that Interpreter #18 did not omit as much information as Interpreter
#20. However, when the same segments of text used in Figure 4 were analyzed for omissions in
the interpretations by Interpreter #18, it was found that Interpreter #18 and Interpreter #20
omitted similar amounts of information in their work.
Because the amount of omitted information in the work of Interpreter #18 and # 20 was
similar, the high number of repairs by Interpreter #18 in Video 1 may be attributed to the amount
of time Interpreter #18 works and socialized with Deaf individuals. As seen in Figure 1,
Interpreters #16 and #20 spend greater amounts of time interpreting and socializing with Deaf
individuals than Interpreter #18. Therefore, it would appear that work and socialization in the
Deaf Community seems to be a valuable component in enhancing the language skills and
kinesthetic monitor of less experienced interpreters.
The amount of omitted information did not differ significantly between the least and most
experienced interpreters in Video 2. Because of this, the lag time between the original text and
the interpretation produced was investigated to see if the lag time between the two messages
influenced the low frequency of repairs in less experienced interpreters. It was found that, in
Video 2, the lag time of Interpreter #2 was approximately 2-3 seconds while that of Interpreter
#20 was 5-7 seconds. A 1992 study by Cokely found that there is, indeed, “an inverse
relationship between the amount of lag time and the number of interpreter errors” (p. 39). The
additional processing time, which was a result of increased lag time in the interpretation by

REPAIRS IN AMERICAN SIGN LANGUAGE INTERPRETING 16
Interpreter #20, may be one factor, in addition to Deaf Community interaction, which accounts
for the low frequency of repairs in the less experienced interpreters.
Which type of repair (error, appropriacy, rectifying, insertion) occurs most frequently in
English-ASL interpretations? Does the frequency of different repairs change with
experience level? 6
It was hypothesized that the greatest number of repairs in interpretations would be
morphological and phonological repairs. Figure 5 shows that error repairs are, indeed, the most
frequent but lexical and phonological repairs were the most frequently used error repairs. The
notably high frequency of lexical error repairs in Video 2 may be attributed to numerous names
and dates pertaining the American Revolution that appeared in the source text which provided a
greater opportunity for lexical fingerspelling or number errors needing repair.
6 A chart showing the full breakdown of the repair strategies used by each, individual interpreter within the different source texts can be found in Appendix 1.

REPAIRS IN AMERICAN SIGN LANGUAGE INTERPRETING 17
Figure 5. Combined number of repairs for all interpreters in Video 1 and Video 2 categorized by
taxonomy of repair.
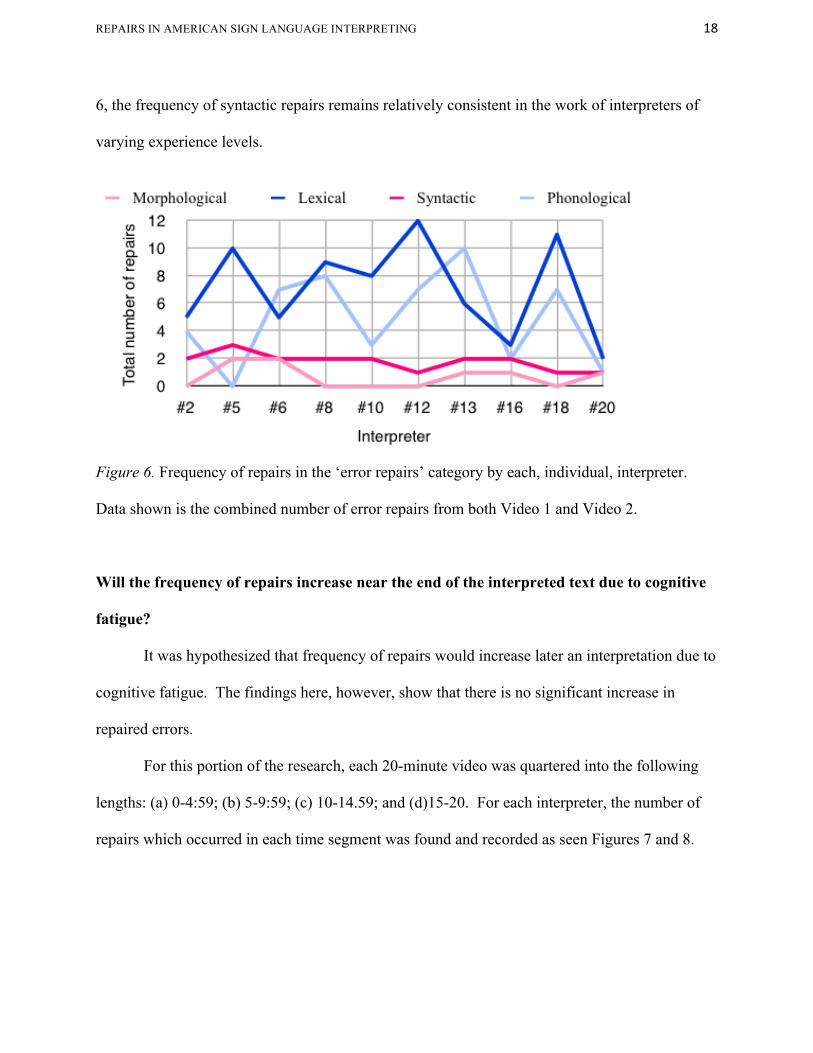
The high frequency of lexical and phonological error repairs can be seen in Figure 6.
Although frequency of repairs fluctuates greatly, the rate of occurrence for lexical and
phonological repairs is almost always greater than the frequencies of morphological or syntactic
repairs.
Although it was originally hypothesized that frequency of syntactic repairs would be
greater in more experienced interpreters, this was not found to be true. Indeed, as seen in Figure
REPAIRS IN AMERICAN SIGN LANGUAGE INTERPRETING 18
6, the frequency of syntactic repairs remains relatively consistent in the work of interpreters of
varying experience levels.
Figure 6. Frequency of repairs in the ‘error repairs’ category by each, individual, interpreter.
Data shown is the combined number of error repairs from both Video 1 and Video 2.
Will the frequency of repairs increase near the end of the interpreted text due to cognitive
fatigue?
It was hypothesized that frequency of repairs would increase later an interpretation due to
cognitive fatigue. The findings here, however, show that there is no significant increase in
repaired errors.
For this portion of the research, each 20-minute video was quartered into the following
lengths: (a) 0-4:59; (b) 5-9:59; (c) 10-14.59; and (d)15-20. For each interpreter, the number of
repairs which occurred in each time segment was found and recorded as seen Figures 7 and 8.

REPAIRS IN AMERICAN SIGN LANGUAGE INTERPRETING 19
Figure 7. Repairs made in Video 1 reported by time segment.
Figure 8. Repairs made in Video 2 reported by time segment.
VIDEO 1 Interpreter Minutes 0 -‐ 4:59
Minutes 5 -‐ 9:59
Minutes 10 – 14:59
Minutes 15 – 20
Most
Experien
ced
#2 -‐ -‐ 3 5 #5 4 2 2 2 #6 4 2 3 3
Experience
d
#8 7 3 4 2 #10 6 4 2 1 #12 8 3 3 -‐ #13 6 -‐ 3 4
Least
Experien
ced
#16 2 2 2 1 #18 4 3 3 7 #20 4 1 2 -‐
TOTAL: 45 20 27 25
Most
Experienced #2 4 2 1 1
#5 4 4 5 4
#6 2 5 6 5
Experienced #8 4 2 3 2
#10 7 1 2 4
#12 4 4 4 7
#13 5 2 10 -‐
Least
Experienced #16 -‐ 1 3 2
#18 4 7 5 3
#20 1 -‐ -‐ 2
TOTAL: 35 28 39 30

REPAIRS IN AMERICAN SIGN LANGUAGE INTERPRETING 20
In the first five minutes of Video 1, the speaker discusses his political background, family
life, and opinions of Northeastern University. This segment sounds somewhat extemporaneous
and the presenter speaks approximately 160-words-per-minute. Approximately six minutes into
the text, the speaker changes from discussing his background and states that his two passions are
“transportation and health care.” This foreshadowing may have enabled interpreters to more
accurately plan what would be discussed later. This shift in discourse style to a more highly
structured expository/persuasive text may account for the drop in repair frequency in Video 1
after the first segment.
The findings from Video 2 are opposite those in Video 1. The sharp increase in repair
frequency in segment three of Video 2 may be attributed to the fact that in the first two segments
the presenter is providing an historical narrative and in the third segment he changes to an
expository explanation of the different branches of government and the election process. Shifts in
discourse style may have caused a decrease of repairs in Video 1 and an increase in Video 2.
Perhaps this is due to interpreters’ expectations. Indeed, it was expected that Video 1 would be
an explanation of the national rail system with persuasive elements. The fact that the speaker
added a personal narrative may have been unexpected, just as the expository description of the
branches of government was unexpected in the historical narrative of Video 2.
After videos were analyzed and the repairs in each time segment were identified, the
average number of repairs in each segment was calculated to see if there were any differences
between less experienced and more experienced interpreters. The average number of repairs in
each experience group is presented in Figure 9 and 10.
As Figures 9 and 10 indicate, interpreters in the “experienced group” had the greatest
fluctuations in errors throughout both videos while the other two groups seemed to maintain a

REPAIRS IN AMERICAN SIGN LANGUAGE INTERPRETING 21
more consistent frequency of repairs. Perhaps this can be attributed to the fact that interpreters in
the “experienced group” are developing, but do not yet have a fully formed, fully developed
kinesthetic monitor. Also, “experienced interpreters” may have a less stable or less consistent
monitor than the most experienced group. This parallels the previously discussed u-function
which causes the rate of repairs to increase in the intermediary stages of learning due to
improving monitor and then decrease when a greater command of the language is achieved.
Figure 9. Average number of repairs made by three experience levels of interpreters in Video 1.

REPAIRS IN AMERICAN SIGN LANGUAGE INTERPRETING 22
Figure 10. Average number of repairs made by three experience levels of interpreters in Video 2

REPAIRS IN AMERICAN SIGN LANGUAGE INTERPRETING 23
Implications
In analyzing these data, we note that the least experienced interpreters have a high rate of
errors and a low rate of repairs and the most experienced interpreters have a low rate of errors
and a high rate of repairs. When quantifying the repair data, we likewise note the fact that many
miscues went unrepaired by the least experienced interpreters made it seem as if the most
experienced and least experienced interpreter had equal frequencies of repairs. This
phenomenon may be explained by an interpreter’s development of their kinesthetic monitor -
more experienced interpreters likely have a more developed kinesthetic monitor allowing them to
more readily identify errors. The finding regarding a low rate errors by the least experienced
interpreters supports the use of team interpreting for less experienced interpreters.
Interpreters with the higher frequencies of repairs spent the least amount of time
socializing in the Deaf Community and less hours-per-week interpreting than interpreters who
produced lower frequencies of repairs. The implications of this study are relevant to interpreters
at all levels of experience as well as to Interpreter Education Programs (IEPs). Previous data
shows that hours-per-week spent working as an interpreter and time spent using ASL in the Deaf
Community has a positive relationship with development of L2 skills and development of a
kinesthetic monitor. Therefore, working interpreters as well as students in an IEP should be
encouraged to socialize with native users of ASL. Because time spent in the Deaf Community is
such an important factor in L2 development, the number of years of interpreting experience
alone is not a valid indicator of overall L2 skill.
This study also shows that the interpreting environment and discourse style of the
presentation have a great impact on the interpretation. When interpreters are familiar with a
topic, they can spend more cognitive energy repairing errors. Therefore, receiving preparation

REPAIRS IN AMERICAN SIGN LANGUAGE INTERPRETING 24
material or doing research prior to an assignment may be useful to interpreters of all experience
levels. Also, this study found that interpreters were sensitive to discourse shifts within a text that
seem to have a greater impact on frequency of repairs than cognitive fatigue. This should
promote the study of various discourse styles by working interpreters and individuals in IEPs.
Future Directions for Research
Due to limitations of this study, there are areas of study regarding repairs that merit
further investigation. The dataset was provided by Northeastern University. The data pool used
here consisted of two male interpreters and eight females, a rather homogenous pool. In
addition, the data only provided examples of interpreted monologues. Future studies should
investigate repairs based on gender repairs in dialogues and group discussions.
The data set contained no examples of team interpreting. But, as discussed previously,
the effect of teams upon repairs merits further research
Also, the corpus provided no examples of interpreters’ conversational or spontaneous L2
use. Data showing natural L2 use would allow for comparison of errors and repairs in natural L2
use and repairs produced when interpreting into an individual’s L2.
Finally, this study only analyzed repairs in English/ASL interpreting. The study of
repairs in ASL/English interpretations merits study.
This study can only provide limited insight into the frequency and types of repairs in
English/ASL interpreting. Hopefully these data and results serve as a catalyst for future research
of repairs in ASL interpreting.

REPAIRS IN AMERICAN SIGN LANGUAGE INTERPRETING 25
Appendix A
Frequency of Different Types of Repairs Used by Interpreter in Videos 1 and 2.
Numbers in black represent Video 1 Numbers in orange represent Video 2
Interpreter 2 5 6 8 10 12 13 16 18 20
Appropriacy
Lexical
-‐ 1 2 1 2 2 3 1 2 1
-‐ 3 1 1 2 1 1 -‐ 3 1
Insertion
1 2 4 1 2 4 3 2 3
1 1 2 -‐ 1 -‐ 2 -‐ 4 -‐
Error
Morphological
-‐ 1 1 -‐ -‐ -‐ -‐ -‐ -‐ -‐
-‐ 1 1 -‐ -‐ -‐ 1 1 -‐ 1
Lexical
3 3 -‐ 4 2 3 3 1 3 1
2 7 5 5 6 9 3 2 8 1
Syntactic
-‐ 2 1 1 2 1 -‐ 1 1 1
2 1 1 1 -‐ -‐ 2 1 -‐ -‐
Phonological
2 -‐ 3 5 3 1 3 1 3 1
2 -‐ 4 3 -‐ 6 7 1 4 -‐
Rectifying
Message
Abandonment
-‐ -‐ 1 2 1 1 -‐ 1 4 2
-‐ -‐ 2 1 -‐ 3 -‐ -‐ -‐ -‐
Inappropriate Information
2 -‐ -‐ 2 -‐ -‐ 1 1 -‐ -‐
-‐ 3 1 -‐ 3 -‐ 1 -‐ -‐ -‐
Intrusion
English Intrusion
2 1 -‐ -‐ -‐ -‐ -‐ -‐ 1 1
1 1 1 -‐ 1 -‐ -‐ -‐ -‐ -‐

REPAIRS IN AMERICAN SIGN LANGUAGE INTERPRETING 26
Appendix B
Average Frequency of Different Types of Repairs Categorized by Interpreter Experience Level 7
7 To calculate the average number of repairs by each experience category of interpreters, the total number of repairs by all of the interpreters in one group were summed according to repair sub-category and then divided by three for the most experienced and least experienced groups and four for the experienced group.
2.66
3
0.66
5.33
1.33
3.33
2.33
0.33
0.66
3.25
3.25
0.25
8.75
1.75
7
2
1.75
0.25
2.33
3.66
1.33
6.66
2.33
3.66
1
2
2
0 1 2 3 4 5 6 7 8 9 10
Lexical (A)
Insertion (A)
Morphological (E)
Lexical (E)
Syntactic (E)
Phonological (E)
Message Abandonment (R)
Inappropriate Information (R)
English Intrustion (I)
Average Frequency of Repair
Most Experienced Experienced Least Experienced
(A) – Appropriacy (E) - Error (R) – Rectifying (I) Insertion
REPAIRS IN AMERICAN SIGN LANGUAGE INTERPRETING 27
References
Clark, E. (1982). Language Change During Language Acquisition. In Ann L. Brown and Michael E. Lamb (Eds.) Advances in Developmental Psychology (171-195). Hillsdale, NJ: Lawrence Erlbaum Associates. Cokely, D. (1992). The Effects of Lag Time on Interpreter Errors. Sign Language Interpreters and Interpreting (pp. 39-69). Burtonsville, MD: Linstok. Evans, M. (1985). Self-Initiated Speech Repairs: A Reflection Of Communicative Monitoring In Young Children. Developmental Psychology, 21.2 , 365-371. Retrieved from: http://www.apa.org/pubs/databases/psycarticles/index.aspx. Hellermann, J. (2009). Looking For Evidence Of Language Learning In Practices For Repair: A Case Study Of Self-Initiated Self-Repair By An Adult Learner Of English. Scandinavian Journal Of Educational Research, 53.2, 113-132. Retrieved from: http://www.apa.org/pubs/databases/psycinfo/index.aspx. Kormos, J. (1999). Monitoring And Self-Repair In L2. Language Learning 49.2 ,303-342. Retrieved from:http://www.ebscohost.com/academic/education-research-complete. Kormos, J. (2000). The Role Of Attention In Monitoring Second Language Speech Production. Language Learning 50.2, 343-384. Retrieved from: http://www.apa.org/pubs/databases/psycinfo/index.aspx. Kormos, J. (2000). The Timing Of Self-Repairs In Second Language Speech Production. Studies In Second Language Acquisition 22.2, 145-67. Retrieved from: http://www.eric.ed.gov/. Lennon, P. (1990). Investigating Fluency In EFL: A Quantitative Approach. Language Learning: A Journal Of Applied Linguistics 40.3, 387-417. Retrieved from: http://www.ebscohost.com/academic/mla-international-bibliography. Moser-Mercer, B., Künzli, A, & Korac, M. (1998). Prolonged Turns In Interpreting: Effects On Quality, Physiological And Psychological Stress. Interpreting 3.1, 47-64. Retrieved from: http://www.apa.org/pubs/databases/psycinfo/index.aspx. O'Connor, N. (1988). Repairs as Indicative of Interlanguage Variation and Change. In Thomas J. Walsh (Ed.) Synchronic and Diachronic Approaches to Linguistic Variation and Change

REPAIRS IN AMERICAN SIGN LANGUAGE INTERPRETING 28
(251-259). Washington, D.C.: Georgetown UP. Seleskovitch, D. (1978) Interpreting for International Conferences. Washington, D.C.: Pen and Booth. Skehan, P., & Foster, P. (1997). Task Type And Task Processing Conditions As Influences On Foreign Language Performance. Language Teaching Research 1.3, 185-211. Retrieved from: http://www.eric.ed.gov/. Van Hest, E. (2001). Analyzing Self-Repair: An Alternative Way of Language Assessment. TESL-EJ 5.1, 75-88. Retrieved from: http://www.tesl-ej.org.
This work is published under a Creative commons Attribution-‐Non-‐Commercial-‐Non-‐Derivative License. For details go to:
http://creativecommons.org/licenses/by-‐nc-‐nd/3.0/us/