Embed Size (px)
Citation preview

United States Senate
PERMANENT SUBCOMMITTEE ON INVESTIGATIONSCommittee on Homeland Security and Governmental Affairs
Carl Levin, ChairmanTom Coburn, Ranking Minority Member
REPATRIATING OFFSHORE FUNDS:2004 TAX WINDFALL FOR SELECT MULTINATIONALS
MAJORITY STAFF REPORT
PERMANENT SUBCOMMITTEEON INVESTIGATIONS
UNITED STATES SENATE
October 11, 2011

PERMANENT SUBCOMMITTEE ON INVESTIGATIONS
SENATOR CARL LEVINChairman
ELISE J. BEANStaff Director and Chief Counsel
ROBERT L. ROACHCounsel & Chief Investigator
ALLISON F. MURPHYCounsel
MARCELLE D. JOHNSDetailee
MICHAEL J. MARTINEAUDetailee
MARY D. ROBERTSONChief Clerk
10/20/11
Permanent Subcommittee on Investigations199 Russell Senate Office Building – Washington, D.C. 20510
Main Number: 202/224-9505
Web Address: www.hsgac.senate.gov [Follow Link to “Subcommittees,” to “Investigations”]
REPATRIATING OFFSHORE FUNDS:2004 TAX WINDFALL FOR SELECT MULTINATIONALS
Table of Contents
I. EXECUTIVE SUMMARY . . . . . . . . . . . . . . . . . . . . . . . . . . . . . . . . . . . . . . . . . . . . . . . . . 3A. Subcommittee Review . . . . . . . . . . . . . . . . . . . . . . . . . . . . . . . . . . . . . . . . . . . . . . . . . . . 3B. Report Findings . . . . . . . . . . . . . . . . . . . . . . . . . . . . . . . . . . . . . . . . . . . . . . . . . . . . . . . . 4
1. U.S. Jobs Lost Rather Than Gained . . . . . . . . . . . . . . . . . . . . . . . . . . . . . . . . . . . . . 42. Research and Development Expenditures Did Not Accelerate . . . . . . . . . . . . . . . . . 43. Stock Repurchases Increased After Repatriation . . . . . . . . . . . . . . . . . . . . . . . . . . . 44. Executive Compensation Increased After Repatriation . . . . . . . . . . . . . . . . . . . . . . . 45. Only A Narrow Sector of Multinationals Benefited . . . . . . . . . . . . . . . . . . . . . . . . . 46. Most Repatriated Funds Flowed from Tax Havens . . . . . . . . . . . . . . . . . . . . . . . . . . 47. Offshore Funds Increased After 2004 Repatriation . . . . . . . . . . . . . . . . . . . . . . . . . . 48. More than $2 Trillion in Cash Assets Now Held by U.S. Corporations . . . . . . . . . . 59. Repatriation is a Failed Tax Policy . . . . . . . . . . . . . . . . . . . . . . . . . . . . . . . . . . . . . . 5
C. Report Recommendation . . . . . . . . . . . . . . . . . . . . . . . . . . . . . . . . . . . . . . . . . . . . . . . . 5
II. BACKGROUND . . . . . . . . . . . . . . . . . . . . . . . . . . . . . . . . . . . . . . . . . . . . . . . . . . . . . . . . . 5A. U.S. International Tax System . . . . . . . . . . . . . . . . . . . . . . . . . . . . . . . . . . . . . . . . . . . . 5B. American Jobs Creation Act of 2004 . . . . . . . . . . . . . . . . . . . . . . . . . . . . . . . . . . . . . . . 6C. 2004 AJCA Repatriation Profile . . . . . . . . . . . . . . . . . . . . . . . . . . . . . . . . . . . . . . . . . . 8
III. SUBCOMMITTEE REVIEW . . . . . . . . . . . . . . . . . . . . . . . . . . . . . . . . . . . . . . . . . . . . . . . 9A. Results of the Subcommittee Survey . . . . . . . . . . . . . . . . . . . . . . . . . . . . . . . . . . . . . . . 9
1. U.S. Jobs . . . . . . . . . . . . . . . . . . . . . . . . . . . . . . . . . . . . . . . . . . . . . . . . . . . . . . . . . . 102. Research and Development Expenditures . . . . . . . . . . . . . . . . . . . . . . . . . . . . . . . . . 163. Stock Repurchases . . . . . . . . . . . . . . . . . . . . . . . . . . . . . . . . . . . . . . . . . . . . . . . . . . . 194. Executive Compensation . . . . . . . . . . . . . . . . . . . . . . . . . . . . . . . . . . . . . . . . . . . . . . 235. Industry Sectors Benefiting from Repatriation . . . . . . . . . . . . . . . . . . . . . . . . . . . . . 286. Source of Repatriated Funds . . . . . . . . . . . . . . . . . . . . . . . . . . . . . . . . . . . . . . . . . . . 307. Corporate Funds Held Offshore Post-Repatriation . . . . . . . . . . . . . . . . . . . . . . . . . . 338. Current Domestic Cash Assets . . . . . . . . . . . . . . . . . . . . . . . . . . . . . . . . . . . . . . . . . 379. 2004 Repatriation Did Not Achieve Intended Stimulus Effect . . . . . . . . . . . . . . . . . 39
B. Conclusion . . . . . . . . . . . . . . . . . . . . . . . . . . . . . . . . . . . . . . . . . . . . . . . . . . . . . . . . . . . . 41
IV. APPENDIX . . . . . . . . . . . . . . . . . . . . . . . . . . . . . . . . . . . . . . . . . . . . . . . . . . . . . . . . . . . . . . 42Table 1 - U.S. Employment . . . . . . . . . . . . . . . . . . . . . . . . . . . . . . . . . . . . . . . . . . . . . . . . . . 42Table 2 - Stock Repurchases . . . . . . . . . . . . . . . . . . . . . . . . . . . . . . . . . . . . . . . . . . . . . . . . . . 43Table 3 - Executive Compensation . . . . . . . . . . . . . . . . . . . . . . . . . . . . . . . . . . . . . . . . . . . . . 44Table 4 - Dollar Value of Restricted Stock Awards for Five Most Highly Compensated
Executives at Surveyed Corporations . . . . . . . . . . . . . . . . . . . . . . . . . . . . . . . . . . . . 45Table 5 - Dividends from Tax Haven CFCs . . . . . . . . . . . . . . . . . . . . . . . . . . . . . . . . . . . . . . 50

Table 6 - Post-AJCA Accumulated Offshore Funds, 2006-2010 . . . . . . . . . . . . . . . . . . . . . . 51Table 7 - Pre-AJCA Accumulated Offshore Funds, 2000-2004 . . . . . . . . . . . . . . . . . . . . . . . 52
Exhibits
1. Excerpt from "Estimated Budget Effects of the Conference Agreement for H.R. 4520, The American Jobs Creation Act of 2004," revenue chart prepared by the Joint Committee on Taxation, October 7, 2004; and letter from the Joint Committee on Taxation to TheHonorable Lloyd Doggett, U.S. House of Representatives, providing revenue estimates for two proposals to modify section 965 of the Internal Revenue Code, April 15, 2011. . . . 53
2. Excerpt from Cisco System, Inc. Response To Permanent Subcommittee on Investigations Survey, 2/18/09.. . . . . . . . . . . . . . . . . . . . . . . . . . . . . . . . . . . . . . . . . . . . . . . . 68
3. Excerpt from Altria Group, Inc. Response To Permanent Subcommittee on InvestigationsSurvey, 2/18/10.. . . . . . . . . . . . . . . . . . . . . . . . . . . . . . . . . . . . . . . . . . . . . . . . . . . . . . . . . . . . 69
4. Excerpt from Microsoft Corporation Response To Permanent Subcommittee on Investigations Survey, 2/18/09; and Microsoft Corporation FY06 Domestic Reinvestment Plan, May 25, 2006.. . . . . . . . . . . . . . . . . . . . . . . . . . . . . . . . . . . . . . . . . . . . . . . . . . . . . . . . . 70
5. Excerpt from Oracle Corporation Response To Permanent Subcommittee on InvestigationsSurvey, 2/17/09; and Oracle Corporation Section 965 Domestic Reinvestment Plan, May 27, 2005.. . . . . . . . . . . . . . . . . . . . . . . . . . . . . . . . . . . . . . . . . . . . . . . . . . . . . . . . . . . . . 77
6. Excerpt from The Coca Cola Co. Response To Permanent Subcommittee on InvestigationsSurvey, 2/13/09 . . . . . . . . . . . . . . . . . . . . . . . . . . . . . . . . . . . . . . . . . . . . . . . . . . . . . . . . . . . . 82
7. Excerpt from The Procter & Gamble Company Response To Permanent Subcommittee onInvestigations Survey, 2/26/09.. . . . . . . . . . . . . . . . . . . . . . . . . . . . . . . . . . . . . . . . . . . . . . . . 83
8. Excerpt from Schering-Plough Corporation Response To Permanent Subcommittee onInvestigations Survey, 2/18/09.. . . . . . . . . . . . . . . . . . . . . . . . . . . . . . . . . . . . . . . . . . . . . . . . 84
9. Excerpt from Johnson & Johnson Response To Permanent Subcommittee on InvestigationsSurvey, 2/24/09.. . . . . . . . . . . . . . . . . . . . . . . . . . . . . . . . . . . . . . . . . . . . . . . . . . . . . . . . . . . . 85
10. Offshore tax dodging hurts U.S. business, Michigan Midland Daily News, by Paul Egerman, small business entrepreneur, June 7, 2011.. . . . . . . . . . . . . . . . . . . . . . . . . . . . . . . 86
11. A Charlie Brown Congress?, The Hill, by Frank Knapp Jr., president and CEO of The South Carolina Small Business Chamber of Commerce, June 29, 2011.. . . . . . . . . . . . . 88
12. Letter to Congress: No Tax Holiday for U.S. Multinationals, sent by 12 small business groups, June 14, 2011.. . . . . . . . . . . . . . . . . . . . . . . . . . . . . . . . . . . . . . . . . . . . . . . . . . . . . . . 90
# # #
REPATRIATING OFFSHORE FUNDS: 2004 TAX WINDFALL FOR SELECT MULTINATIONALS
October 11, 2011
In 2004, the America Jobs Creation Act (AJCA) permitted U.S. corporations to repatriate
income held outside of the United States at an effective tax rate of 5.25% instead of the top 35% corporate income tax rate. The purpose of this tax provision was to encourage companies to return cash assets to the United States, which proponents of the provision argued would spur increased domestic investment and U.S. jobs.1 In response, corporations returned $312 billion in qualified repatriation dollars to the United States and avoided an estimated $3.3 billion in tax payments,2 but the growth in American jobs and investment that was supposed to follow did not occur.3
1 See U.S. Congress, Conference Committee, “American Jobs Creation Act of 2004,” Conference Report accompanying H.R. 4520, H.Rep. No. 108-755, 108th Cong., 2nd sess., at 316 (Washington: GPO, 2004) (hereinafter “Conference Report”) (“[I]n order to qualify for the deduction, dividends must be described in a domestic reinvestment plan [which] . . . must provide for the reinvestment of the repatriated dividends in the United States, including as a source for the funding of worker hiring and training, infrastructure, research and development, capital investments, and the financial stabilization of the corporation for the purposes of job retention or creation.”). See also, e.g., 150 CONG. REC. S11038 (2004) (statement of Sen. Grassley) (“This bill contains some of the most important international tax reforms in decades, bringing foreign earnings home for investment in the United States instead of investing overseas, hence creating jobs in the United States.”); 150 CONG. REC. S4875 (2004) (statement of Sen. Graham) (“The rationale for this proposal is that reducing the tax rate will encourage U.S. multinational companies to expatriate income held offshore in order to make investments in the United States that will create jobs”); 150 CONG. REC. H8704 (2004) (Statement of Rep. Phil English-PA) (“Mr. Speaker, I particularly want to draw attention to one particular job-creating provision in this bill, which mirrors legislation I introduced and will lead to in-sourcing. This provision, known as the Homeland Investment Act, is one of the strongest stimulus proposals brought before Congress in recent years, and I think it is going to have a huge impact. It temporarily reduces the tax rate on foreign earnings of U.S. companies, when that money is brought back to the United States for investment here at home. The billions of dollars that will be brought back will be used by American employers to hire new workers, invest in top-of-the-line equipment, and build new plants right here at home, instead of in the countries where their earnings are currently stranded.”); 150 CONG. REC. H8724 (2004) (statement of Rep. Udall-CO) (“I will vote for it because it includes provisions to encourage American corporations doing business abroad to repatriate their overseas earnings for investment here at home. This has great potential to stimulate investment in new plant and equipment as well as in the research and development that support innovation, job creation, and prosperity.”); 150 CONG. REC. H4408 (2004) (statement of Rep. Eshoo-CA) (“I also strongly support the inclusion of incentives for corporations to repatriate their overseas profits which would stimulate the investment of hundreds of millions of dollars in our domestic economy”).
2 See “stimated Budget Effects of the Conference Agreement for H.R. 4520, The ‘American Jobs Creation Act,’” Joint Committee on Taxation, JCX-69-04, Item IV.22 (10/7/2004) (estimating a tax revenue loss of $3.3 billion over ten years, 2005-2014), Report Exhibit 1. See also Edward D. Kleinbard and Patrick Driessen, “A Revenue Estimate Case Study: The Repatriation Holiday Revisited,” 120 Tax Notes 1191 (9/22/2008) (noting that the Joint Committee on Taxation (JCT) had underestimated the total amount of dividends that would be claimed by corporations under the 2004 repatriation provision, projecting a total of $235 billion instead of the actual $312 billion, but concluding that the data available in 2008 did not demonstrate that the estimated tax revenue loss of $3.3 billion over ten years was inaccurate). While some dispute the JCT estimate and assert that the 2004 tax repatriation provision produced tax revenue of $16.4 billion [$312 billion in qualified dividends x 5.25%], that analysis fails to acknowledge that a portion of the dividends, $100 billion according to JCT’s estimate, would have been repatriated even without the 2004 law and under normal corporate tax rates would have produced revenues considerably in excess of $16.4 billion [for example, $100 billion x 35% = $35 billion]. It is that foregone revenue which forms the basis for the overall tax loss estimated by the JCT. 3 See Jane G. Gravelle and Donald J. Maples, “Tax Cuts on Repatriation Earnings as Economic Stimulus: An

2
The U.S. Senate Permanent Subcommittee on Investigations has long had an investigative interest in issues involving the movement of corporate funds to offshore jurisdictions and the treatment of those funds under the U.S. tax system. Certain provisions of the U.S. tax code now encourage corporations to move jobs and money overseas. For example, corporations may qualify for deductions and otherwise reduce their U.S. taxes for expenses that they incur to shut down U.S. plants and move their operations to other countries, and are even allowed to deduct interest on facilities they build offshore.4 Corporations can also defer taxes on the income of their foreign subsidiaries, generating tax savings, and use foreign tax credits to reduce their U.S. taxes. These and other tax provisions can encourage the outsourcing of American jobs. In addition, over the past ten years, some U.S. corporations with multinational operations have been reporting “staggering increases” in profits offshore, while reducing the taxes they pay to the United States.5
To increase its understanding of these matters, the Subcommittee undertook a review of the 2004 tax repatriation provision. This Report describes the Subcommittee=s review and provides findings and recommendations.
Economic Analysis,” Congressional Research Service (CRS), R40178, at 1-3 (12/17/2010) (hereinafter “CRS Study”). The original January 2009 CRS study was updated on December 17, 2010 and then again on May 27, 2011, with minor changes. This Report references the May 27 edition. The statistics cited in the CRS Study are based on information reported by corporations on Form 8895 and related corporate returns selected for Statistics of Income=s corporate sample for Tax Years 2004 through 2006. 4 For general rules governing deductions by corporations for business expenses and interest expenses, see Internal Revenue Code (IRC) section 162 (business expenses) and section 163 (interest expenses). See also Department of Treasury, “Fact Sheet, Administration's Fiscal Year 2012 Budget,” http://www.treasury.gov/press-center/press-releases/Pages/tg1061.aspx (“U.S. businesses that borrow money and invest it overseas can claim the interest they pay as a business expense and take an immediate deduction to reduce their U.S. taxes under current law, even if they pay little or no U.S. taxes on their overseas investment.”); Joint Committee on Taxation, “Description of Revenue Provisions Contained in the President's Fiscal Year 2012 Budget Proposal,” JCS-3-11, at 162, June 2011 (“[A] U.S. taxpayer may claim a current deduction for interest expense that it incurs to produce tax-deferred income through a foreign subsidiary.”); Mark P. Keightley, “An Overview of Major Tax Proposals in the President's 2012 Budget,” CRS Report (R41699), at 11, March 17, 2011 (“U.S. parent firms can deduct expenses of foreign subsidiaries, such as interest, while not recognizing income from those foreign subsidiaries that is not repatriated .... U.S. parents thus benefit from deductions, while not including earnings in income.”); Joint Committee on Taxation, JCS-3-11, at 166, citing Department of the Treasury,” General Explanations of the Administration's Fiscal Year 2012 Revenue Proposals,” February 2011, at 40 (According to the Administration, “the ability to deduct interest expense attributable to foreign investments while deferring U.S. tax on the income from the investments may cause U.S. businesses to shift their investments and jobs overseas, harming the domestic economy.”). 5 Kimberly A. Clausing, “The Revenue Effects of Multinational Firm Income Shifting” at 2, (Mar. 2011) (estimating corporate offshore income shifting resulted in $90 billion in lost U.S. tax revenues in 2008, or roughly 30% of federal corporate tax revenues). See also, e.g., Rosanne Altshuler and Harry Grubert, “Governments and Multinational Corporations in the Race to the Bottom,” 110 Tax Notes 979 (2/27/2006); Martin A. Sullivan, “Latest IRS Data Show Jump in Tax Haven Profits,” 105 Tax Notes 151 (10/11/2004); Martin A. Sullivan, “U.S. Drug Firms Park Increasing Profits in Low Tax Countries,” 35 Tax Notes Int’l 1143 (9/20/2004); Martin A. Sullivan, “Data Show Dramatic Shift of Profits to Tax Havens,” 104 Tax Notes 1189 (9/13/2004); John Zdanowics, “Who’s Watching Our Back Door?” Business Accents, Volume 1, No.1, Florida International University, at 27 (Fall 2004) (estimating offshore corporate transfer pricing abuses resulted in $53 billion in lost U.S. tax revenues in 2001).

3
I. EXECUTIVE SUMMARY
A. Subcommittee Review Beginning in 2009, the Subcommittee initiated a bipartisan review of the consequences of the 2004 repatriation provision which provided an exceptionally low tax rate to U.S. corporations with offshore funds. As part of that review, the Subcommittee surveyed 20 major multinational corporations, including the 15 corporations that repatriated the highest amounts of funds back to the United States. The survey sought information about the amounts of offshore funds repatriated to the United States, as well as data on domestic employment figures and corporate expenditures for executive compensation, stock buybacks, and other items over the six year period, 2002 to 2008.6
The Subcommittee also collected information and documents and conducted interviews with corporate representatives, tax professionals, and others. In addition, the Subcommittee researched the 2004 legislation, reviewed academic and corporate studies of the impact of the 2004 repatriation provision, and consulted with academic, tax, and other experts.
The American Jobs Creation Act essentially provided guidelines on four uses of repatriated funds: two – using funds for jobs and research and development – were encouraged, while two others – using funds for executive compensation and stock buybacks – were prohibited. Proponents of the 2004 repatriation claimed that it would encourage businesses to bring foreign income back into the United States to spur jobs growth, research and development expenditures, and other domestic investments; indeed, Congress made those objectives explicit requirements for spending repatriated funds.7
The evidence presented in this Majority Staff Report, however, shows that, rather than producing new jobs or increasing research and development expenditures, the 2004 repatriation tax provision was followed by an increase in dollars spent on stock repurchases and executive compensation. In addition, the repatriation tax break created a competitive disadvantage for domestic businesses that chose not to engage in offshore operations or investments, and provided a windfall for multinationals in a few industries without benefitting the U.S. economy as a whole.
6 This Report does not include the data from 2008, because the effect of the national recession overwhelmed other economic factors in that year. The recession started in December 2007. See National Bureau of Economic Research, “U.S. Business Cycle Expansions and Contractions,” http://www.nber.org/cycles.html. 7 See 26 U.S.C. § 965(b)(4) (This section, entitled “Requirement to invest in the United States,” permits a deduction only if the qualified dividend is invested “in the United States . . . for the funding of worker hiring and training, infrastructure, research and development, capital investments, or the financial stabilization of the corporation for the purposes of job retention or creation.”). See also supra note 1.
4
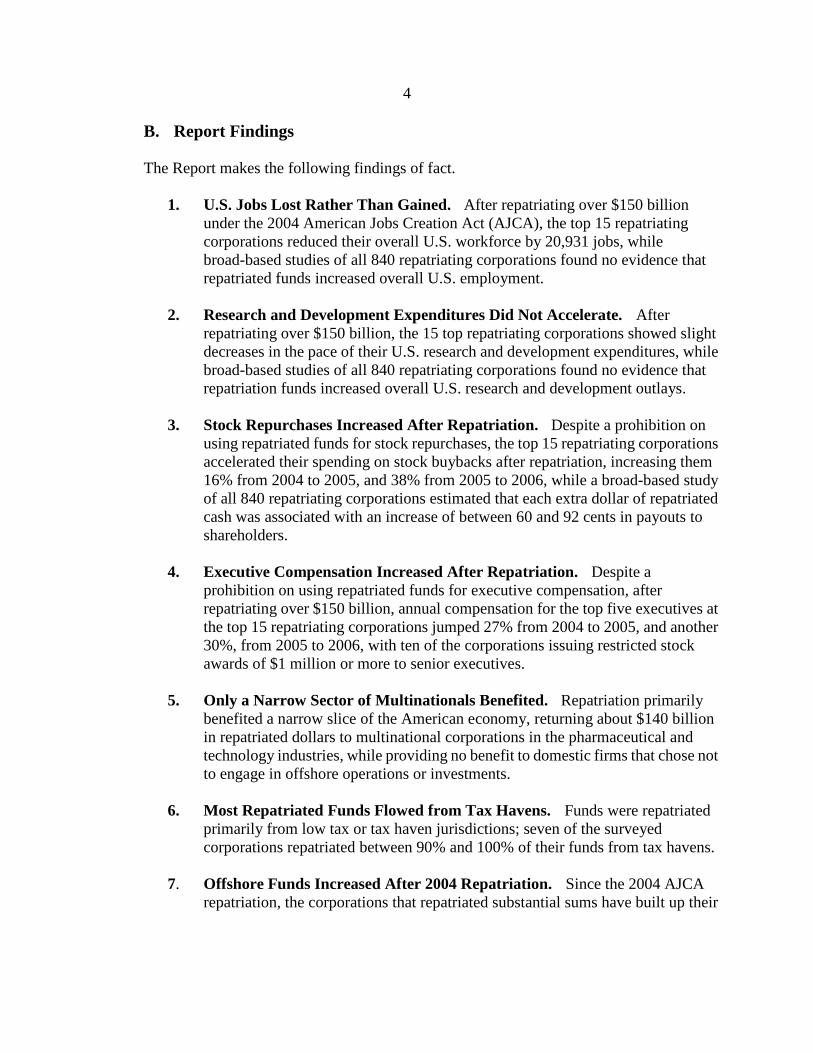
B. Report Findings The Report makes the following findings of fact.
1. U.S. Jobs Lost Rather Than Gained. After repatriating over $150 billion
under the 2004 American Jobs Creation Act (AJCA), the top 15 repatriating corporations reduced their overall U.S. workforce by 20,931 jobs, while broad-based studies of all 840 repatriating corporations found no evidence that repatriated funds increased overall U.S. employment.
2. Research and Development Expenditures Did Not Accelerate. After
repatriating over $150 billion, the 15 top repatriating corporations showed slight decreases in the pace of their U.S. research and development expenditures, while broad-based studies of all 840 repatriating corporations found no evidence that repatriation funds increased overall U.S. research and development outlays.
3. Stock Repurchases Increased After Repatriation. Despite a prohibition on
using repatriated funds for stock repurchases, the top 15 repatriating corporations accelerated their spending on stock buybacks after repatriation, increasing them 16% from 2004 to 2005, and 38% from 2005 to 2006, while a broad-based study of all 840 repatriating corporations estimated that each extra dollar of repatriated cash was associated with an increase of between 60 and 92 cents in payouts to shareholders.
4. Executive Compensation Increased After Repatriation. Despite a
prohibition on using repatriated funds for executive compensation, after repatriating over $150 billion, annual compensation for the top five executives at the top 15 repatriating corporations jumped 27% from 2004 to 2005, and another 30%, from 2005 to 2006, with ten of the corporations issuing restricted stock awards of $1 million or more to senior executives.
5. Only a Narrow Sector of Multinationals Benefited. Repatriation primarily
benefited a narrow slice of the American economy, returning about $140 billion in repatriated dollars to multinational corporations in the pharmaceutical and technology industries, while providing no benefit to domestic firms that chose not to engage in offshore operations or investments.
6. Most Repatriated Funds Flowed from Tax Havens. Funds were repatriated
primarily from low tax or tax haven jurisdictions; seven of the surveyed corporations repatriated between 90% and 100% of their funds from tax havens.
7. Offshore Funds Increased After 2004 Repatriation. Since the 2004 AJCA
repatriation, the corporations that repatriated substantial sums have built up their

5
offshore funds at a greater rate than before the AJCA, evidence that repatriation has encouraged the shifting of more corporate dollars and investments offshore.
8. More than $2 Trillion in Cash Assets Now Held by U.S. Corporations. In
2011, U.S. corporations have record domestic cash assets of around $2 trillion, indicating that that the availability of cash is not constraining hiring or domestic investment decisions and that allowing corporations to repatriate more cash would be an ineffective way to spur new jobs.
9. Repatriation is a Failed Tax Policy. The 2004 repatriation cost the U.S.
Treasury an estimated net revenue loss of $3.3 billion over ten years, produced no appreciable increase in U.S. jobs or research investments, and led to U.S. corporations directing more funds offshore.
C. Report Recommendation
The Report recommends against enacting a second corporate repatriation tax break due to the harms associated with a substantial revenue loss, failed jobs stimulus, and added incentive for U.S. corporations to move jobs and investment offshore.
II. BACKGROUND
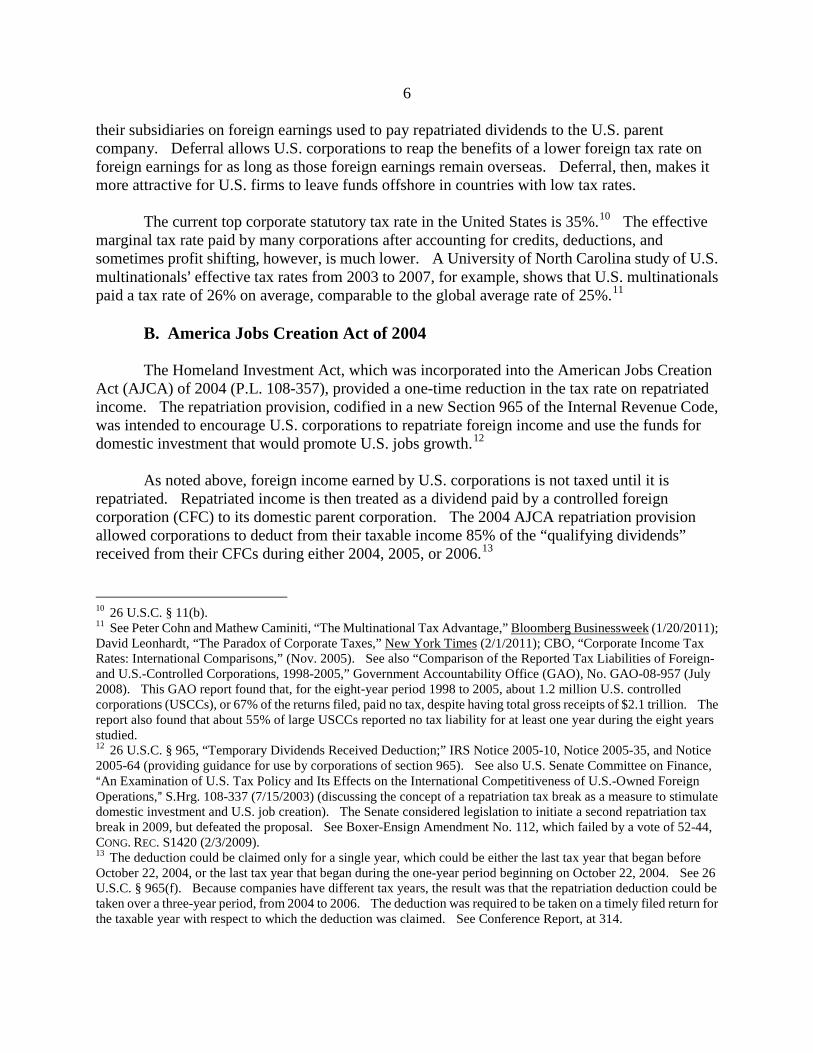
A. The U.S. International Tax System
The United States operates on a worldwide tax system under which U.S. corporations generally are taxed on their income, no matter where it is earned. This approach applies to the earnings of a domestic corporation=s subsidiaries, including controlled foreign corporations (CFCs). One key feature of this approach is deferral. Under current law, income earned by a domestic parent corporation from foreign operations conducted by its foreign subsidiaries is subject to U.S. tax. Foreign income is actually taxed, however, only at the point when the income is repatriated, that is, brought back to the United States. Until foreign income is returned as income to the U.S. parent corporation, the U.S. tax on such income is deferred. Deferral is restricted by rules located in Subpart F of the Internal Revenue Code that require U.S. shareholders with a 10% or more stake in a CFC to pay tax on passive income or income from certain types of sales transactions, such as between related firms.8
The U.S. tax code also provides foreign tax credits, which are intended to avoid double taxation of corporate income where U.S. and foreign governments’ tax jurisdictions overlap. The foreign tax credit is available to U.S. corporations to offset U.S. tax liability by the amount of tax paid to other countries.9
8 See Conference Report, at 312.
Domestic firms can claim foreign tax credits for foreign taxes paid by
9 See 26 U.S.C. § 901.
6
their subsidiaries on foreign earnings used to pay repatriated dividends to the U.S. parent company. Deferral allows U.S. corporations to reap the benefits of a lower foreign tax rate on foreign earnings for as long as those foreign earnings remain overseas. Deferral, then, makes it more attractive for U.S. firms to leave funds offshore in countries with low tax rates.
The current top corporate statutory tax rate in the United States is 35%.10 The effective
marginal tax rate paid by many corporations after accounting for credits, deductions, and sometimes profit shifting, however, is much lower. A University of North Carolina study of U.S. multinationals= effective tax rates from 2003 to 2007, for example, shows that U.S. multinationals paid a tax rate of 26% on average, comparable to the global average rate of 25%.11
B. America Jobs Creation Act of 2004
The Homeland Investment Act, which was incorporated into the American Jobs Creation Act (AJCA) of 2004 (P.L. 108-357), provided a one-time reduction in the tax rate on repatriated income. The repatriation provision, codified in a new Section 965 of the Internal Revenue Code, was intended to encourage U.S. corporations to repatriate foreign income and use the funds for domestic investment that would promote U.S. jobs growth.12
As noted above, foreign income earned by U.S. corporations is not taxed until it is repatriated. Repatriated income is then treated as a dividend paid by a controlled foreign corporation (CFC) to its domestic parent corporation. The 2004 AJCA repatriation provision allowed corporations to deduct from their taxable income 85% of the “qualifying dividends” received from their CFCs during either 2004, 2005, or 2006.13
10 26 U.S.C. § 11(b).
11 See Peter Cohn and Mathew Caminiti, “The Multinational Tax Advantage,” Bloomberg Businessweek (1/20/2011); David Leonhardt, “The Paradox of Corporate Taxes,” New York Times (2/1/2011); CBO, “Corporate Income Tax Rates: International Comparisons,” (Nov. 2005). See also “Comparison of the Reported Tax Liabilities of Foreign- and U.S.-Controlled Corporations, 1998-2005,” Government Accountability Office (GAO), No. GAO-08-957 (July 2008). This GAO report found that, for the eight-year period 1998 to 2005, about 1.2 million U.S. controlled corporations (USCCs), or 67% of the returns filed, paid no tax, despite having total gross receipts of $2.1 trillion. The report also found that about 55% of large USCCs reported no tax liability for at least one year during the eight years studied. 12 26 U.S.C. § 965, “Temporary Dividends Received Deduction;” IRS Notice 2005-10, Notice 2005-35, and Notice 2005-64 (providing guidance for use by corporations of section 965). See also U.S. Senate Committee on Finance, AAn Examination of U.S. Tax Policy and Its Effects on the International Competitiveness of U.S.-Owned Foreign Operations,@ S.Hrg. 108-337 (7/15/2003) (discussing the concept of a repatriation tax break as a measure to stimulate domestic investment and U.S. job creation). The Senate considered legislation to initiate a second repatriation tax break in 2009, but defeated the proposal. See Boxer-Ensign Amendment No. 112, which failed by a vote of 52-44, CONG. REC. S1420 (2/3/2009). 13 The deduction could be claimed only for a single year, which could be either the last tax year that began before October 22, 2004, or the last tax year that began during the one-year period beginning on October 22, 2004. See 26 U.S.C. § 965(f). Because companies have different tax years, the result was that the repatriation deduction could be taken over a three-year period, from 2004 to 2006. The deduction was required to be taken on a timely filed return for the taxable year with respect to which the deduction was claimed. See Conference Report, at 314.

7
For corporations that were taxed at the statutory corporate rate of 35%, allowing 85% of the qualifying dividends to be deducted from their taxable income reduced the effective tax rate on the qualifying dividends to 5.25%.14 The repatriation provision also placed limits on the type and amounts of dividends that could “qualify” for the deduction and required the dividends to be used to fund allowable domestic investments. To qualify for the deductions, dividends had to be “extraordinary,” that is, the dividends received by the U.S. parent had to exceed the average dividends received from its CFCs over a five-year base period.15 Additionally, the amount of qualifying dividends was limited to the greater of $500 million or either the amount of earnings permanently reinvested outside the United States according to the corporation=s balance sheet of its most recently audited financial statements as of June 30, 2003, or 35% of the specific tax liability attributable to earnings permanently reinvested outside the United States.16
Congress intended that the deduction be limited to funds that would be used for job creation, capital investment, and other growth-producing expenditures described in a domestic reinvestment plan prepared by the corporation taking the deduction.17 However, in a major statutory failing, the law did not provide any requirement to track repatriated funds to ensure they were spent on permitted uses. The Conference Report simply stated that “in order to qualify for the deduction, dividends must be described in a domestic reinvestment plan approved by the taxpayer=s senior management and board of directors.”18 The Conference Report then set forth a non-exclusive list of permitted uses of repatriated dividends: “funding of worker hiring and training, infrastructure, research and development, capital investments, and the financial stabilization of the corporation for the purposes of job retention or creation.”19 Use of repatriated funds for executive compensation was expressly prohibited;20 as was their use for share repurchases.21
In the absence of any tracking requirement, however, the statute failed to provide any means for auditing repatriated funds to gauge compliance. Because corporations had no legal obligation to substantiate how they used repatriated funds, no documentary evidence was obtained establishing that corporations explicitly misapplied repatriated funds to prohibited uses in violation of the law.
The deduction was designed and intended to be available for a single year. The Conference Report stated: “The conferees emphasize that this is a temporary economic stimulus measure, and that there is no intent to make this measure permanent, or to >extend= or enact it again
14 The 5.25% rate is determined by multiplying 15% of taxable dividends by the top corporate tax rate of 35% [15% of taxable dividends x 35% = 5.25%]. 15 26 U.S.C. § 965(b)(2). 16 26 U.S.C. § 965(b)(1). 17 26 U.S.C. § 965(b)(4). 18 Conference Report, at 316. 19 Id. 20 Id. The non-exclusive list of allowed uses of repatriated funds, and the bar on the use of such funds for executive compensation, is also set forth in the statute. See 26 U.S.C. § 965(b)(4)(B). 21 Department of the Treasury, Notice 2005-10, “Domestic Reinvestment Plans and Other Guidance Under Section 965,” at 26-27 (2005).

8
in the future.”22
Doing otherwise was seen as encouraging corporations to stockpile earnings outside the United States in anticipation of future repatriation provisions, expand their offshore operations, and move more jobs overseas, and as making offshore operations more profitable than domestic operations.
C. 2004 AJCA Repatriation Profile After enactment of the AJCA, 843 corporations repatriated $312 billion that qualified for the lower tax rate.23
Generally, corporations claiming the deduction were large multinational firms repatriating substantial offshore funds.
Five firms – Pfizer, Merck, Hewlett-Packard, Johnson & Johnson, and IBM – accounted for $88 billion, representing more than 28% of total repatriations.24 The top 10 firms – adding Schering-Plough, DuPont, Bristol-Myers Squibb, Eli Lilly, and PepsiCo – accounted for 42% of total repatriated funds.25 The top 15 – adding Procter & Gamble, Intel, Coca-Cola, Altria, and Oracle – accounted for over half or 52% of total repatriations.26 According to the Internal Revenue Service (IRS), for the 843 repatriating corporations as a whole, the average amount repatriated was roughly $429 million, while the average qualifying dividend was $370 million.27
Most corporations, 86%, reported the deduction for tax year 2005, while 7.7% reported it for tax year 2004, and the remaining 6.8% reported it for tax year 2006.28
Of the corporations surveyed by the Subcommittee, 17 corporations or 89% reported the deduction for tax year 2005, and two corporations or 11% reported it for tax year 2006.
22 Conference Report, at 314. 23 See CRS Study, at 3. 24 See results of a survey conducted by the Subcommittee (“Subcommittee Survey Results”), described further below and depicted in Tables 1-7 in the Appendix to this Report. See also CRS Study, at 4, citing Rodney P. Mock and Andreas Simon, APermanently Reinvested Earnings: Priceless,@ 121 Tax Notes 835, at 835-848 (11/17/2008). 25 Subcommittee Survey Results; CRS Study, at 4. 26 Subcommittee Survey Results. The Subcommittee identified 15 U.S. corporations with the highest amounts of cash dividends that actually qualified for the deduction under Section 965. Those qualified cash dividend amounts, which were disclosed by the surveyed corporations to the Subcommittee and were not publicly available, provide an exact measure of the funds those corporations repatriated under the AJCA. Other articles have used a slightly different approach, focusing on the total cash dividends that each corporation returned to the United States from its CFCs, as reported in the corporations’ publicly available financial statements. This approach identified the same 15 corporations as the Subcommittee survey, with one exception. By the latter measure, total cash dividends from the CFCs, the 15th highest repatriating company was Motorola, and the 19th was Oracle, while by the Subcommittee’s measure, total qualifying cash dividends, the 15th highest repatriating company was Oracle, and the 16th was Motorola. 27 Melissa Redmiles, “The One-Time Received Dividend Deduction,” IRS, Statistics of Income Bulletin, at 103-104 (Spring 2008) (hereinafter “IRS Data”). 28 Id., at 103-104.

9
III. SUBCOMMITTEE REVIEW In 2009, the Subcommittee initiated its review into the effectiveness of the 2004
repatriation provision. The 2004 provision required that corporations develop a domestic reinvestment plan describing the intended use of repatriated funds as a source for the funding of worker hiring and training, infrastructure, research and development, capital investments, or financial stabilization for purposes of job retention or creation. The 2004 provision did not, however, require corporations to identify or track repatriated funds to make sure that they were actually used for the purposes enumerated in the statute. The Subcommittee=s review sought to determine the size of repatriated funds, where the funds came from, and how these funds were employed. In particular, the review focused on the relationship between repatriated funds and the two major permitted uses for the funds, jobs and research and development expenditures, and the two prohibited uses, share repurchases and executive compensation.
The evidence showed that the one-time repatriation provision did not achieve the objectives identified in the legislation and, in fact, encouraged additional corporate funds to leave the United States to be kept offshore. The data showed, for example, no evidence that the repatriation provision increased U.S. jobs. For research and development budgets, surveyed corporations increased their expenditures after repatriating funds but at roughly the same rates as before repatriation. The Subcommittee review also found that, because money is fungible and corporations were not required to track expenditures of repatriated funds, it was impossible to determine if the surveyed corporations used their repatriated funds to increase planned expenditures for worker training and hiring in the United States or for research and development (R&D), or instead used the repatriated funds to pay for expenses that had already been planned and would have been made in any event, and then used freed up funds to pay for prohibited purposes such as increased stock repurchases or executive compensation. The data is clear, however, at the surveyed corporations that repatriated substantial offshore funds, U.S. jobs decreased overall and the pace of R&D outlays did not increase after repatriation, while expenditures on stock repurchases and executive compensation increased substantially.
By allowing over $300 billion in offshore funds to be brought back subject to a 5.25% tax rate instead of the top 35% rate, the U.S. Treasury lost out on billions of dollars in tax revenues with no evidence of the benefits that it expected to receive in exchange for the loss. Section 965 also served as an additional incentive for U.S. multinationals to send more jobs, funds, and facilities offshore in anticipation of future opportunities to utilize extraordinarily low corporate income tax rates. Finally, repatriation disadvantaged U.S. small and mid-sized businesses by giving multinational corporations an unfair competitive edge through a lower tax burden.
A. Results of the Subcommittee Survey
To gain a better understanding of the impact and implementation of the 2004 repatriation
provision, the Subcommittee sent questionnaires to 20 U.S.-based multinational corporations that

10
took advantage of the 2004 repatriation.29
The questionnaire sought to discover how the repatriated funds were used by the corporations in the four key areas, American jobs, research and development, stock repurchases, and executive compensation. The review inquired into the amount of funds that had been repatriated; the amount that was planned to be spent; and how the funds had actually been used, including how much the corporation spent on hiring, research and development, stock repurchases, and executive compensation.
All 20 corporations that the Subcommittee contacted responded to the questionnaire. All 20 provided the Subcommittee with a copy of their domestic reinvestment plans indicating how repatriated funds would be spent. The corporations also described how they actually spent the repatriated funds. This Report utilizes data from 19 of the 20 corporations that provided information to the Subcommittee.30 Because the 2004 provision did not require specific tracking of the repatriated funds, the corporations did not have contemporaneous documentation identifying specific expenditures of repatriated dollars. Instead, the Subcommittee relied on the information each corporation provided, as well as filings with the Securities and Exchange Commission (SEC), IRS published data, and other research and survey results to develop data on the amounts repatriated and amounts spent on hiring, research and development, stock repurchases, and executive compensation.31
1. U.S. Jobs The Homeland Investment Act’s repatriation provision was included in the American Jobs
Creation Act primarily to increase U.S. jobs. The survey accordingly compared the level of repatriation at the corporations surveyed and the changes in the size of their U.S. workforce, considering both job gains and losses.
With respect to the top 15 repatriating corporations, 10 or 66% recorded U.S. job losses from 2004 to 2007, while five or 33% recorded job gains. Among all 19 of the Subcommittee’s survey participants, 12 or 63% of the 19 corporations recorded U.S. job losses from 2004 to 2007,
29 The Subcommittee surveyed the 15 companies with the highest amounts of qualifying repatriated dividends. See supra note 26. In addition, the Subcommittee surveyed five companies that were significant repatriators of total dividends: Motorola, the 16th highest repatriating company; Wyeth, the 20th highest repatriating company (which was acquired by Pfizer in 2009); Honeywell International Inc., the 25th highest repatriating company; Cisco Systems Inc., the 40th highest repatriating company; and Microsoft, the 54th highest repatriating company. See Rodney P. Mock and Andreas Simon, APermanently Reinvested Earnings: Priceless,@ 121 Tax Notes 835, at 835-848 (11/17/2008) (listing top 81 repatriating companies under the American Jobs Creation Act). These companies were also major players in the technology industry, one of the main beneficiaries of the AJCA. 30 The Report does not make use of the data provided by Cisco Systems, because Cisco informed the Subcommittee that, after claiming a $1.2 billion dividend received deduction under the AJCA in 2006, it later amended its 2006 tax return and no longer took the $1.2 billion deduction. See Report Exhibit 2. Cisco told the Subcommittee that this action was the result of a larger settlement with the IRS of issues related to a 2002-2004 audit, which resulted in Cisco recharacterizing the $1.2 billion as previously taxed and therefore not subject to any additional tax. According to Cisco, since the funds were considered previously taxed, they were no longer considered a dividend. 31 The survey results for the 20 corporations are set forth in Tables 1 through 5, in the Appendix at the end of this Report.

11
while seven or 37% recorded job gains. The following chart depicts the job losses and gains at each corporation. Overall, the U.S. job losses outweighed the job gains. The aggregate net job change figure among the top 15 repatriating corporations was a loss of 20,931 jobs in the United States from 2004 to 2007.32 Using all 19 surveyed corporations, the net job change was the loss of 13,585 U.S. jobs over the same period. For both groups of corporations, the top 15 and all surveyed corporations, U.S. jobs decreased in 2005, the year in which the most funds were repatriated, rose less than a percentage point in 2006, and then decreased again in 2007.33
32 These figures are conservative, in that they do not reflect any reduction in Altria job totals after Altria spun off Kraft Foods Inc. in March 2007. See 2/18/09 Altria Response to Subcommittee Survey, Report Exhibit 3. Despite Altria disclosures indicating that its workforce dropped by nearly 40,000 due to Kraft’s departure from the company, the domestic job count figures and charts in this section include Kraft’s 2007 domestic job count in Altria’s 2007 job total in an attempt to fairly present the number of jobs that stayed in the United States as opposed to jobs that were eliminated entirely. 33 For the top 15 repatriating corporations, U.S. jobs increased 5.9% from 2002 to 2003, decreased 3.3% from 2003 to 2004, decreased 1.5% from 2004 to 2005, increased 0.1% from 2005 to 2006, and decreased 1.9% from 2006 to 2007. For all 19 surveyed corporations, U.S. jobs increased 3.9% from 2002 to 2003, decreased 4.0% from 2003 to 2004, decreased 1.0% from 2004 to 2005, increased 0.2% from 2005 to 2006, and decreased 0.9% from 2006 to 2007.

12
Source: U.S. Senate Permanent Subcommittee on Investigations survey data. The corporation that repatriated the most foreign earnings, totaling $35.5 billion, for example, cut 11,748 jobs in the United States from 2004 through 2007.34 Another corporation brought back $9.5 billion, yet cut 12,830 jobs.35
Overall, the top 15 repatriating corporations reduced their U.S. workforce despite repatriating large amounts that qualified for the lower tax rate. The chart below shows that these two developments, the increased repatriation of funds versus decreased U.S. employment, moved in opposite directions, contradicting the prediction that the lines would move in approximately the same direction in response to Congress’ guidance that repatriated dollars be used to stimulate the creation of new U.S. jobs. The survey data shows that, overall, the biggest repatriation
34 2/17/09 Pfizer Response to Subcommittee Survey. 35 2/17/09 IBM Response to Subcommittee Survey.
(15,000)
(10,000)
(5,000)
0
5,000
10,000
15,000
U.S
. Job
s Inc
reas
e (D
ecre
ase)
U.S. Employment at Repatriating Corporations 2004-2007

13
beneficiaries not only failed to increase U.S. jobs after repatriating billions of dollars subject to the lower tax rate, but actually reduced the collective size of their U.S. workforce.
Source: U.S. Senate Permanent Subcommittee on Investigations survey data.
36,000
37,000
38,000
39,000
40,000
41,000
42,000
43,000
44,000
45,000
46,000
0
20
40
60
80
100
120
140
160
180
2002 2003 2004 2005 2006 2007
$B
Repatriations and U.S. Jobs at Top 15 Repatriating Corporations
2002-2007
Cumulative Repatriations at Top 15 Corps. Average U.S. Jobs at Top 15 Corps.
14
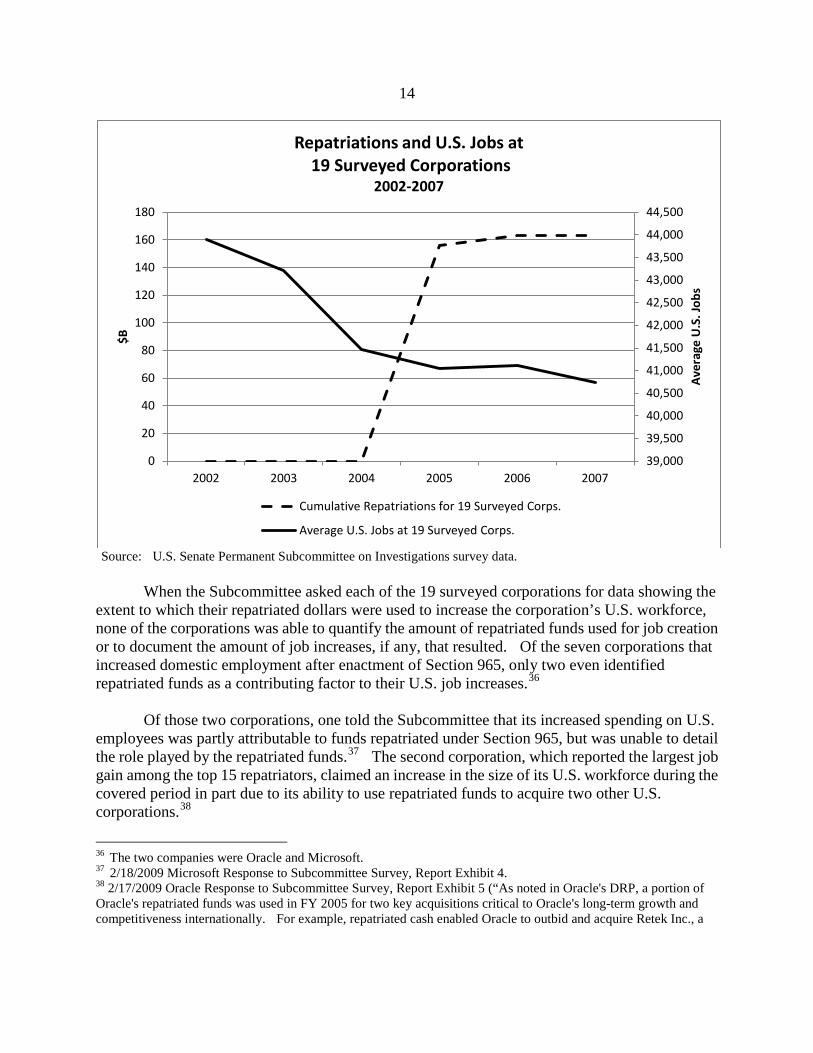
Source: U.S. Senate Permanent Subcommittee on Investigations survey data. When the Subcommittee asked each of the 19 surveyed corporations for data showing the extent to which their repatriated dollars were used to increase the corporation’s U.S. workforce, none of the corporations was able to quantify the amount of repatriated funds used for job creation or to document the amount of job increases, if any, that resulted. Of the seven corporations that increased domestic employment after enactment of Section 965, only two even identified repatriated funds as a contributing factor to their U.S. job increases.36
Of those two corporations, one told the Subcommittee that its increased spending on U.S. employees was partly attributable to funds repatriated under Section 965, but was unable to detail the role played by the repatriated funds.37 The second corporation, which reported the largest job gain among the top 15 repatriators, claimed an increase in the size of its U.S. workforce during the covered period in part due to its ability to use repatriated funds to acquire two other U.S. corporations.38
36 The two companies were Oracle and Microsoft.
37 2/18/2009 Microsoft Response to Subcommittee Survey, Report Exhibit 4. 38 2/17/2009 Oracle Response to Subcommittee Survey, Report Exhibit 5 (“As noted in Oracle's DRP, a portion of Oracle's repatriated funds was used in FY 2005 for two key acquisitions critical to Oracle's long-term growth and competitiveness internationally. For example, repatriated cash enabled Oracle to outbid and acquire Retek Inc., a
39,000
39,500
40,000
40,500
41,000
41,500
42,000
42,500
43,000
43,500
44,000
44,500
0
20
40
60
80
100
120
140
160
180
2002 2003 2004 2005 2006 2007
Aver
age
U.S
. Job
s
$B
Repatriations and U.S. Jobs at 19 Surveyed Corporations
2002-2007
Cumulative Repatriations for 19 Surveyed Corps.
Average U.S. Jobs at 19 Surveyed Corps.

15
The remaining corporations told the Subcommittee that they had no data or records to indicate whether repatriated funds contributed to job increases or were ever used for that purpose. As one corporation put it: “We do not maintain data, and we have not made estimates, of how our U.S. jobs and U.S. research and development expenditures would have been different if amounts had not been repatriated under section 965.”39
Other corporations noted that, due to the fungibility of money, they were unable to identify whether repatriated dollars or other funds were used to increase jobs. One corporation made the broad statement that offshore funds repatriated at a lower tax rate would allow it to pursue unnamed “business opportunities” to “increase sales”:
“While it is difficult to point to a direct connection between repatriation and jobs and research and development, when a company can access cash at a lower rate, it is placed in a much better position to capitalize on new business opportunities and investments in research and development to increase sales volumes.”40
Despite that positive statement and repatriating $10 billion in 2005, that particular corporation reduced rather than increased its U.S. workforce over the following two years.41
The Report’s finding that the repatriating corporations examined by the Subcommittee did not increase their American workforce overall is not unique to the corporations featured in the Subcommittee survey. Research has shown that, across all 840 repatriating corporations, the 2004 repatriation did not stimulate U.S. job growth. Analyses by the Congressional Research Service (CRS) in 2011, for example, concluded that the 2004 repatriation did not produce increased domestic employment.42
Minnesota-based provider of retail software and services. SAP AG had made an offer to acquire Retek, and stated publicly that it intended to move Retek's development jobs and intellectual property to Germany. Oracle's successful acquisition of Retek had the immediate effect of retaining all of Retek's jobs in Minnesota and Georgia. Since the Retek acquisition, Oracle has increased by 50% its Retek related employment in Minnesota and Georgia.”). The two acquisitions referenced by Oracle involved its purchase of Retek Inc. and PeopleSoft Inc. Prior to being acquired by Oracle in 2005, Retek reported in its SEC filings that it had 531 worldwide jobs, while PeopleSoft reported that it had 8,748 employees in the United States. Oracle informed the Subcommittee that, in 2005, it increased its U.S. workforce by 4,440 jobs over the prior year. That 4,440 total, which reflects less than half the number of jobs brought to Oracle by Retek and PeopleSoft, indicates that, after acquiring the two companies, Oracle actually eliminated thousands of jobs previously held by U.S. workers. See, e.g., “Jobs Go at Oracle After Takeover,” BBC News (1/15/2005) (“The cuts will affect about 9% of the 55,000 staff of the combined companies.”); Todd Wallack, “Reality Soothes Layoff Fears / PeopleSoft, Oracle Share Firings Evenly at Bay Area Sites,” San Francisco Chronicle (3/25/2005) (“But after the takeover, Oracle announced plans in January to eliminate 5,000 jobs worldwide, mostly from the PeopleSoft side of the company.”).
The CRS study stated: “While empirical evidence is clear
39 2/13/2009 Coca-Cola Response to Subcommittee Survey, Report Exhibit 6. See also 2/26/2009 Proctor & Gamble Response to Subcommittee Survey, Report Exhibit 7 (“We have no way to determine what the levels of employment or R&D spending may have been in the absence of 965”); 2/18/2009 Schering-Plough Response to Subcommittee Survey, Report Exhibit 8 (“The Company does not have data that estimates the amount of U.S. jobs or U.S. R&D expenditures that would have increased absent the enactment of section 965”). 40 2/24/2009 Johnson & Johnson Response to Subcommittee Survey, Report Exhibit 9. 41 Johnson & Johnson reported having 47,386 U.S. employees in 2005, 47,765 U.S. employees in 2006, and 45,424 U.S. employees in 2007. Id. 42 CRS Study, at 1. The CRS Study references empirical econometric studies by Dhammika Dharmapala, C. Fritz

16
that this provision resulted in a significant increase in repatriated earnings, empirical evidence is unable to show a corresponding increase in domestic investment or employment by firms that utilized the repatriation provisions.”43 A 2009 study using data from the National Bureau of Economic Research concluded: “The ability to access an internal source of capital at a lower cost did not boost domestic investment, employment, or R&D.”44
2. Research and Development Expenditures Under the AJCA, research and development (R&D) was another permitted, and
encouraged, use of repatriated funds. The Subcommittee’s survey data showed that, at the top 15 repatriating corporations, R&D expenditures increased from 2004 through 2007, but at slightly lower rates than occurred before repatriation. For the top 15 repatriating corporations, the average annual percentage increase in R&D spending ranged between 4% and 7% from 2002 to 2007.45 Similarly, for the 19 surveyed corporations, the average annual percentage increase in R&D spending ranged from 3% to 7% from 2002 to 2007.46
In the graphs below, the line indicating R&D expenditures shows a smooth, consistent rise from the time period before repatriation (2002 to 2003) through the period in which funds were repatriated (2005 to 2006), and in the year after (2007). That is, even though the top 15 corporations collectively experienced an influx of $149 billion in repatriated funds in 2005, and another $6 billion in 2006, the rise in their collective R&D spending during those years is consistent with the gradual increase in R&D spending before repatriation. For the 19 surveyed corporations, there is a slight increase in the line showing increased R&D spending from 2003 to
Foley, and Kristin J. Forbes, “The Unintended Consequences of the Homeland Investment Act: Implications for Financial Constraints, Governance, and International Tax Policy,” an unpublished working paper (Sept. 2008) that has since been published at 66 Journal of Finance 753; and Roy Clemons and Michael R. Kinney, “An Analysis of the Tax Holiday for Repatriation Under the Jobs Act,” 120 Tax Notes 759, at 759-768 (8/25/2008). The CRS reports that “these studies both found the repatriation provisions to be an ineffective means of increasing economic growth.” CRS Study, at 7. 43 CRS Study, at 1. The CRS study also pointed out that flexible exchange rates would likely have depressed any stimulative impact of any sizeable repatriation due to currency conversions and the resulting international trade flows. The CRS Study stated: “The stimulative effect of the reduced tax rate on repatriated earnings is expected to be muted by the international system of flexible exchange rates and, subsequently, by trade. This effect will occur, because as foreign denominated earnings of foreign subsidiaries are repatriated they are also converted to dollars. This result increases demand for dollars which leads to an appreciation, or increase, in the price of the dollar in foreign exchange markets. This stronger dollar makes U.S.-made exports more expensive and foreign imports less expensive. As a result, U.S. exports would temporarily decline, further straining the economy and at least partially offsetting any stimulative effect of the repatriated earnings.” CRS Study, at 8. 44 Dhammika Dharmapala, C. Fritz Foley, and Kristin J. Forbes, National Bureau of Economic Research, “Watch What I Do, Not What I Say: The Unintended Consequences of the Homeland Investment Act,” 66 Journal of Finance 753, 772 (June 2011). 45 The annual percentage increase in R&D expenditures for the top 15 repatriating corporations was 7.3% from 2002 to 2003, 5.7% from 2003 to 2004, 4.3% from 2004 to 2005, 4.9% from 2005 to 2006, and 3.7% from 2006 to 2007. 46 The annual percentage increase in R&D expenditures for the 19 surveyed repatriating corporations was 6.5% from 2002 to 2003, 6.0% from 2003 to 2004, 5.1% from 2004 to 2005, 5.9% from 2005 to 2006, and 3.5% from 2006 to 2007.

17
2004, prior to the repatriation, but that increase is attributable to a single corporation which spent a relatively large amount during that period.47
The line then levels out for a year before renewing its rise.
These graphs show that R&D expenditures did not appreciably increase beyond planned levels, and actually experienced a slight decrease in the rate of spending, after repatriation. They stand in contrast to the graphs below tracking expenditures for stock repurchases and executive compensation, which demonstrate marked increases during the repatriation period.
Source: U.S. Senate Permanent Subcommittee on Investigations survey data.
47 When the graph is recreated without that corporation’s R&D expenditures to eliminate the skewed effect from its relatively large R&D outlay, the trend line of R&D expenditures shows a smooth increase, like the trend line for the Top 15 Repatriating Corporations graph.
0
20
40
60
80
100
120
140
160
180
0
5
10
15
20
25
30
35
40
45
2002 2003 2004 2005 2006 2007
Cum
ulat
ive
Repa
tria
tions
- $B
Annu
al su
m o
f R&
D Ex
pend
iture
s - $
B
Repatriations and R&D at Top 15 Repatriating Corporations 2002-2007
Total Annual R&D Expenditures at Top 15 Repatriating Corps.
Cumulative Jobs Act Repatriations at Top 15 Repatriating Corps.

18
Source: U.S. Senate Permanent Subcommittee on Investigations survey data.
Since the 2004 statute did not require corporations to document their use of repatriated
funds, combined with the fungibility of dollars, it is not possible to determine the extent to which repatriated funds contributed to the corporations’ R&D spending during the period 2005 to 2007. When asked, the surveyed corporations did not provide the Subcommittee with any evidence demonstrating the extent to which repatriated funds were actually used to finance R&D expenditures or spur increased R&D spending. The corporation that increased R&D expenditures the most among survey participants (77% from 2004-2007) reported to the Subcommittee that it “does not have data that estimates the amount of U.S. jobs or U.S. R&D expenditures that would have increased absent the enactment of section 965.”48
48 2/18/2009 Schering-Plough Corporation Response to Subcommittee Survey, Report Exhibit 8.
Another corporation which also made significant increases in its R&D expenditures during the covered period explained: “We do not maintain data, and we have not made estimates, of how our U.S. jobs and U.S. research and development expenditures would have been different if amounts had not been repatriated under
0
20
40
60
80
100
120
140
160
180
0
10
20
30
40
50
60
2002 2003 2004 2005 2006 2007
Cum
ulat
ive
Repa
tria
tions
- $B
Annu
al su
m o
f R&
D Ex
pend
iture
s - $
B Repatriations and R&D at
19 Surveyed Repatriating Corporations 2002-2007
Total Annual R&D Expenditures at 19 Surveyed Corps.
Cumulative Jobs Act Repatriations at 19 Surveyed Corps.

19
section 965.”49 One corporation attributed its increased R&D spending in part to repatriated funds, though it was unable to explain how the repatriated funds boosted its spending.50
The Subcommittee’s survey data is consistent with academic research studies examining the 840 repatriating corporations as a whole. Those studies generally concluded that there was no evidence that the 2004 AJCA repatriation led to increased R&D spending overall. While in one survey tax executives from repatriating firms told researchers that their firms spent nearly 15% of their repatriated funds on R&D,51 other studies that did not rely on self-reporting by repatriating corporations, found no increase in R&D expenditures. A 2009 study using National Bureau of Economic Research data, for example, concluded: “[H]igher levels of repatriations were not associated with ... increased R&D expenditures.”52 Likewise, a 2009 study found no difference between the change in R&D between repatriating and non-repatriating corporations.53
3. Stock Repurchases
Federal regulations implementing the 2004 repatriation provisions explicitly prohibited using repatriated funds to pay for stock repurchases or dividends, determining that shareholder distributions were not a permitted use under the statute.54
Yet subsequent research has shown a disturbing parallel between an increase in repatriated funds and an increase in share buybacks at the repatriating corporations.
Stock repurchase programs enable a corporation to reacquire its own stock. U.S. corporations may repurchase their own stock by distributing cash to existing shareholders in
49 2/13/2009 Coca Cola Company Response to Subcommittee Survey, Report Exhibit 6. See also 2/26/2009 Proctor & Gamble Response to Subcommittee Survey, Report Exhibit 7 (“We have no way to determine what the levels of employment or R&D spending may have been in the absence of 965.”). 50 2/18/2009 Microsoft Response to Subcommittee Survey, Report Exhibit 4. 51 John R. Graham, Michelle Hanlon, and Terry Shevlin, “Barriers to Mobility: The Lockout Effect of U.S. Taxation of Worldwide Corporate Profits,” National Tax Journal, at 38, Fig. 2 (Dec. 2010). 52 Dhammika Dharmapala, C. Fritz Foley, and Kristin J. Forbes, National Bureau of Economic Research, “Watch What I Do, Not What I Say: The Unintended Consequences of the Homeland Investment Act,” 66 Journal of Finance 753, 756 (June 2011). As reported above, the study also states: “The ability to access an internal source of capital at a lower cost did not boost domestic investment, employment, or R&D.” Id., at 782. 53 See Jennifer Blouin and Linda Krull, “Bringing It Home: A Study of the Incentives Surrounding the Repatriations of Foreign Earnings under the Jobs Creation Act of 2004,” 47 Journal of Accounting Research 1027, Tables 2 and 3 (Dec. 2009). 54 See Department of the Treasury, Notice 2005-10, “Domestic Reinvestment Plans and Other Guidance Under Section 965,” at 26-27 (2005) (“Dividends and Other Distributions With Respect to Stock - Dividends and other distributions made by the taxpayer to its shareholders with respect to its stock, without regard to how such distributions are treated under section 301, are not permitted investments because they do not constitute investments by the taxpayer for purposes of section 965”) (“The redemption of outstanding stock of a taxpayer or, through one or more steps as part of a plan, of a corporation related to the taxpayer (within the meaning of section 267(b)) without regard to whether such redemption is treated as an exchange in part or full payment for the stock under section 302(b), is not a permitted investment. As is the case with dividends, such expenditures do not constitute investments by the taxpayer for purposes of section 965”), http://www.treasury.gov/press-center/press-releases/Documents/repatriationnoticen200510.pdf.

20
exchange for outstanding shares. Corporations then typically either retire the shares or keep them as treasury stock available for re-issuance. Corporations sometimes use repurchasing programs as a means to share corporate profits with shareholders. In addition, by repurchasing its own stock and reducing the supply of shares available in the marketplace, a corporation can increase its earnings per share (EPS) and may be able to boost its stock price. Higher EPS values and stock prices provide greater value to shareholders.55
They may also boost executive compensation by increasing the value of stock and stock options held by executives or by justifying larger executive bonuses.
While stock repurchases benefit shareholders and executives, they reduce corporate cash holdings available for job growth, increased research and development expenditures, and capital investment. The American Jobs Creation Act, as its name suggests, intended repatriated dollars to be used to increase U.S. employment; its legislative history contains no reference to using repatriated funds for share buybacks. In addition, regulations under the law explicitly prohibit the use of repatriated funds to engage in share repurchases. The concern that corporations would use repatriated funds on stock repurchases to boost their EPS and stock price rather than increase jobs, research and development, or capital expenditures that would stimulate the economy, appears to have been well justified.
Of the top 15 repatriating corporations, 12 or 80% of the corporations had increased their
stock repurchases from 2004 through 2007, two had no stock repurchases, and one had decreased its repurchases. The results indicate that the rate of stock repurchases accelerated after repatriation, decreasing 10% from 2002 to 2003, then increasing 13% from 2003 to 2004, 16% from 2004 to 2005, rising the most, 38%, from 2005 to 2006, and 9% from 2006 to 2007. Likewise, of the 19 corporations surveyed by the Subcommittee, 16 or 84% of the corporations had increased their stock repurchases; two had no stock repurchases; and one had decreased its stock repurchases from 2004 through 2007.56
The survey data shows that stock repurchases went up at an increasing rate after repatriation compared to the years before repatriation, with the steepest increase occurring between 2005 and 2006. Overall, as the chart below shows, in the years following the repatriation of offshore funds, the 19 surveyed corporations more than doubled the amount of their average stock repurchases, from about $2.2 billion in 2004 to $5.3 billion in 2007.
55 CRS notes that “[i]n addition to stock repurchases, increasing dividends are a way of returning money to shareholders. Given the temporary nature of repatriation provisions, however, stock repurchases would be the expected vehicle to return money to shareholders, since they represent less of a commitment to ongoing distributions.@ CRS Study, at 7, n. 15. 56 On average, for all 19 surveyed corporations, stock repurchases decreased 5% from 2002 to 2003, increased 6% from 2003 to 2004, 28% from 2004 to 2005, an additional 61% from 2005 to 2006, and an additional 17% from 2006 to 2007.

21
Source: U.S. Senate Permanent Subcommittee on Investigations survey data
0
500
1000
1500
2000
2500
3000
3500
4000
4500
5000
0
20
40
60
80
100
120
140
160
180
2002 2003 2004 2005 2006 2007
Aver
age
Stoc
k Re
purc
hase
s $
M
Repa
tria
tions
$
B
Repatriations and Stock Repurchases at Top 15 Repatriating Corporations
2002 - 2007
Cumulative AJCA Repatriations at Top 15 Corps.
Average Stock Repurchases at Top 15 Corps.
22
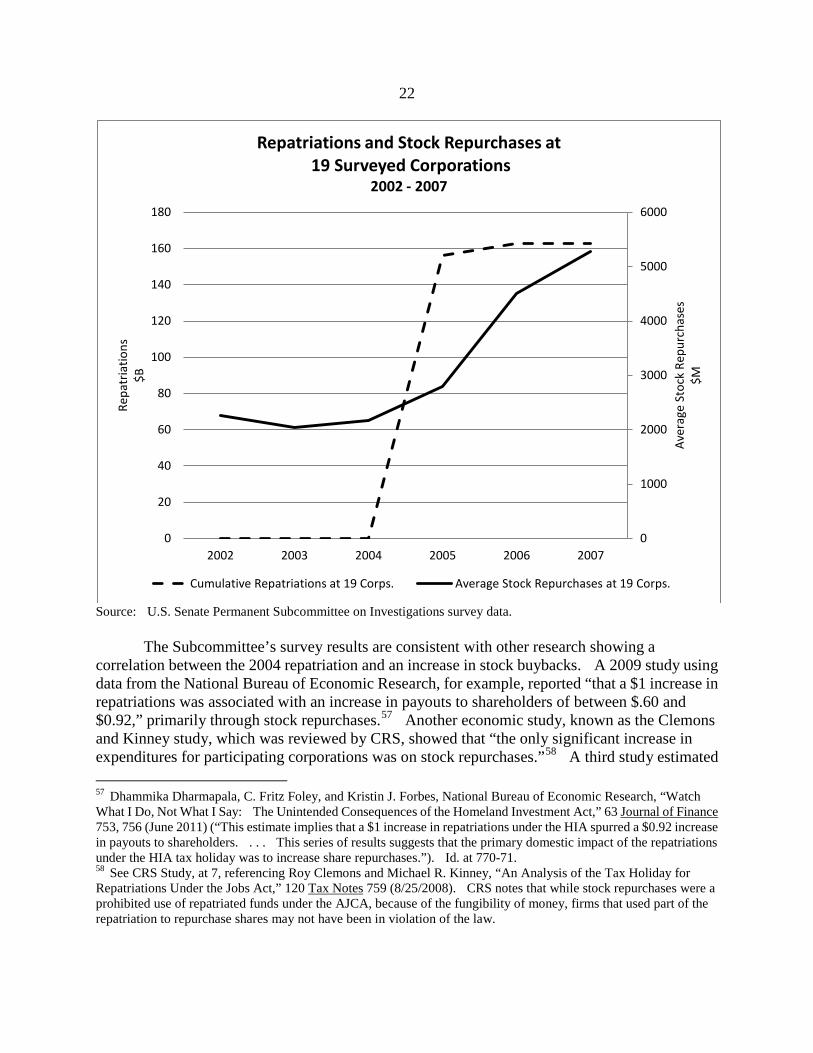
Source: U.S. Senate Permanent Subcommittee on Investigations survey data. The Subcommittee’s survey results are consistent with other research showing a correlation between the 2004 repatriation and an increase in stock buybacks. A 2009 study using data from the National Bureau of Economic Research, for example, reported “that a $1 increase in repatriations was associated with an increase in payouts to shareholders of between $.60 and $0.92,” primarily through stock repurchases.57 Another economic study, known as the Clemons and Kinney study, which was reviewed by CRS, showed that “the only significant increase in expenditures for participating corporations was on stock repurchases.”58
57 Dhammika Dharmapala, C. Fritz Foley, and Kristin J. Forbes, National Bureau of Economic Research, “Watch What I Do, Not What I Say: The Unintended Consequences of the Homeland Investment Act,” 63 Journal of Finance 753, 756 (June 2011) (“This estimate implies that a $1 increase in repatriations under the HIA spurred a $0.92 increase in payouts to shareholders. . . . This series of results suggests that the primary domestic impact of the repatriations under the HIA tax holiday was to increase share repurchases.”). Id. at 770-71.
A third study estimated
58 See CRS Study, at 7, referencing Roy Clemons and Michael R. Kinney, “An Analysis of the Tax Holiday for Repatriations Under the Jobs Act,” 120 Tax Notes 759 (8/25/2008). CRS notes that while stock repurchases were a prohibited use of repatriated funds under the AJCA, because of the fungibility of money, firms that used part of the repatriation to repurchase shares may not have been in violation of the law.
0
1000
2000
3000
4000
5000
6000
0
20
40
60
80
100
120
140
160
180
2002 2003 2004 2005 2006 2007
Aver
age
Stoc
k Re
purc
hase
s $M
Repa
tria
tions
$B
Repatriations and Stock Repurchases at
19 Surveyed Corporations 2002 - 2007
Cumulative Repatriations at 19 Corps. Average Stock Repurchases at 19 Corps.

23
that, in 2005 alone, repatriating corporations increased stock repurchases by approximately $61 billion.59 A fourth study, conducted by surveying tax executives at the repatriating corporations, found that 40% of the repatriating corporations reported having used cash that was freed up by repatriated dollars to repurchase shares.60
Although Section 965’s implementing regulations prohibited the use of repatriated funds on stock repurchases, corporations could have technically adhered to the law by spending repatriated dollars in budgeted areas allowed under the AJCA, and then using money that the repatriated sums freed up to repurchase shares.61
In that case, corporations essentially distributed a portion of the repatriated offshore funds to their shareholders, without technically violating the law, but also making the repatriated cash unavailable for use in domestic job growth, R&D efforts, or other investments. Increased spending on stock repurchases violated the spirit of the law by directing the stream of repatriated funds to augment shareholder wealth, and likely executive wealth, instead of putting the funds toward Congressional priorities, such as hiring workers or increasing R&D spending. The research indicates that executives and shareholders got the benefit of the bargain in the AJCA at the expense of the overall economy.
4. Executive Compensation Under the AJCA, use of repatriated funds to increase executive compensation was
explicitly prohibited, however, all but one of the corporations that the Subcommittee surveyed62
increased executive compensation from 2004 to 2007, in particular by increasing stock awards to senior executives. The fungibility of dollars and the law’s failure to require corporate records tracing the use of repatriated funds make it difficult to determine the extent to which repatriated dividends, or funds freed up by repatriated dividends, contributed to the increase in executive pay. However, the empirical trends in repatriated funds and executive compensation show troubling parallels.
Overall, from 2002 to 2007, according to data supplied by the corporations, compensation for the top five corporate executives at the top 15 repatriating corporations increased the most after corporations repatriated offshore funds.63
59 Blouin, Jennifer, and Linda Krull, “Bringing it Home: A Study of the Incentives Surrounding the Repatriation of Foreign Earnings Under the American Jobs Creation Act of 2004,” 47 Journal of Accounting Research 1027, at 1029 (Dec. 2009) (“We estimate that, after controlling for other predictors of repurchases, repatriating firms increase share repurchases during 2005 by $60.85 billion more than nonrepatriating firms.”)
From 2002 to 2003, executive compensation at those
60 John R. Graham, Michelle Hanlon, and Terry Shevlin, “Barriers to Mobility: The Lockout Effect of U.S. Taxation of Worldwide Corporate Profits,” National Tax Journal, at 39 (Dec. 2010). 61 For example, Starwood Hotels & Resorts Worldwide Inc. has publicly admitted that it engaged in this type of conduct. On the same day that Starwood approved a $1 billion stock repurchase plan, it announced it was repatriating $550 million. Its spokeswoman, Alisa Rosenberg, stated: “But what (the act) does is it brings money over to be used for those types of things, which frees up money that would have been used for hiring and training.” See Roy Clemons and Michael R. Kinney, “An Analysis of the Tax Holiday for Repatriation Under the Jobs Act,” 120 Tax Notes 759 (8/25/2008). 62 Motorola was the only surveyed company to have decreased executive compensation from 2004 to 2007. 63 The compensation reported here includes salary, stock awards, stock options, and other forms of compensation as

24
firms decreased 9%, then increased 14% from 2003 to 2004, increased 27% from 2004 to 2005, increased the most, 30%, from 2005 to 2006, and increased 2% from 2006 to 2007. The trends for the 19 corporations surveyed by the Subcommittee were similar: executive compensation decreased 15% from 2002 to 2003, increased 14% from 2003 to 2004, increased 15% from 2004 to 2005, increased 35% from 2005 to 2006, and decreased 0.6% from 2006 to 2007. The 35% increase for the 19 surveyed corporations meant that, from 2005 to 2006, compensation for the top five executives collectively jumped from $36 million to $49 million in a single year.64 In contrast, according to the U.S. Bureau of Labor Statistics, from 2002 to 2007, average worker pay in the United States increased only 5% each year on average.65
Source: U.S. Senate Permanent Subcommittee on Investigations survey data
identified in the companies’ responses to the Subcommittee and their SEC filings. 64 The executive compensation figures were provided by the surveyed corporations and are summarized in Table 2 in the Appendix. 65 Average worker salary increased 4% from 2003 to 2004, increased 2% from 2003 to 2004, increased 3% from 2004 to 2005, increased 11% from 2005 to 2006, and increased 4% from 2006 to 2007. See Bureau of Labor Statistics, Occupational Earnings in the United States, http://www.bls.gov/ncs/ncspubs.htm#Wages. Average worker pay was calculated using mean compensation per hour data for private sector employees assuming full time (40 hours/week) work.
($40,000,000)
($30,000,000)
($20,000,000)
($10,000,000)
$0
$10,000,000
$20,000,000
$30,000,000
$40,000,000
$50,000,000
$60,000,000
Pfize
r
Mer
ck
Hew
lett
Pac
kard
John
son
& Jo
hnso
n
IBM
Sche
ring-
Plou
gh
Brist
ol M
yers
Eli L
illy
Dupo
nt
Peps
iCo,
Inc.
Inte
l
Coca
-Col
a
Altr
ia
Proc
ter &
Gam
ble
Ora
cle
Mot
orol
a
Wye
th
Hone
ywel
l
Mic
roso
ft
Increase in Executive Compensation at 19 Surveyed Corporations
2007 compared to 2004

25
The charts below show that, as a whole, as the surveyed corporations increased their receipt of repatriated offshore funds under Section 965, average executive compensation likewise increased.66
At the same time they were increasing executive pay, the surveyed corporations were reducing the size of their U.S. workforce.
Source: U.S. Senate Permanent Subcommittee on Investigations survey data and SEC filings by the surveyed corporations
66 Information on executive pay was taken from the Subcommittee survey results, which reflect both cash and non-cash amounts of compensation and the relevant corporation’s annual report and proxy statements filed with the Securities and Exchange Commission (SEC).
0
10
20
30
40
50
60
0
20
40
60
80
100
120
140
160
180
2002 2003 2004 2005 2006 2007
Aver
age
Exec
utiv
e
Com
pens
atio
n $
Mill
ion
Repa
tria
tions
$
Billl
ion
Repatriations and Executive Compensation at Top 15 Repatriating Corporations
2002-2007
Cumulative AJCA Repatriations at Top 15 Repatriating Corps.
Average Executive Compensation at Top 15 Repatriating Corps.

26
Source: U.S. Senate Permanent Subcommittee on Investigations survey data and SEC filings by the surveyed corporations.
As part of the increased compensation, the most senior executives at the repatriating corporations benefitted from an increase in restricted stock awards in the year following the AJCA. Some of those awards represented significant increases.
In the two years following the AJCA, the top 15 repatriating companies made substantial
restricted stock awards to senior executives, as shown in the table below. Senior executives at nine companies (Merck, Hewlett Packard, Johnson & Johnson, Schering-Plough, Bristol-Myers, Eli Lilly, PepsiCo, Altria, and Procter & Gamble) received restricted stock awards of more than $1 million in 2005, while senior executives at ten companies (Pfizer, Merck, Hewlett Packard, Johnson & Johnson, Schering-Plough, Eli Lilly, DuPont, Pepsico, Altria, and Procter & Gamble) received restricted stock awards of more than $1 million in 2006. The CEO and President of Hewlett Packard received restricted stock awards valued at more than $8.6 million in 2005 and $4.7 million in 2006; the Chairman and CEO of Schering-Plough received restricted stock awards valued at more than $4.1 million in 2005 and $10.2 million in 2006; the Chairman and CEO of PepsiCo received restricted stock awards valued at more than $4.9 million in 2005 and $6.2 million in 2006; and the Chairman and CEO of Altria received restricted stock awards valued at
0
10,000,000
20,000,000
30,000,000
40,000,000
50,000,000
60,000,000
0
20
40
60
80
100
120
140
160
180
2002 2003 2004 2005 2006 2007
Aver
age
Exec
utiv
e Co
mpe
nsat
ion
- $
Repa
tria
tions
- $B
Repatriations and Executive Compensation at 19 Surveyed Corporations
2002-2007
Cumulative AJCA Repatriations at 19 Surveyed Corps.
Average Executive Compensation at 19 Surveyed Corps.

27
more than $7.7 million in 2005 and $9.2 million in 2006. Altogether, of the 19 surveyed corporations, 18 increased restricted stock awards to their senior executives over 2004 levels in either 2005 or 2006, the two years following the 2004 repatriation.67
Restricted Stock Awards of Senior Executives Top 15 Repatriating Companies, 2005-2006
Company Name Title 2005 (in $) 2006 (in $) Pfizer Henry McKinnell CEO 0 8,315,642 Pfizer Jeffrey Kindler CEO 0 2,736,265 Merck Richard T. Clark CEO, President 1,932,923 2,359,616 Hewlett Packard Mark V. Hurd Chairman, CEO
President 8,684,000 4,725,000
Johnson & Johnson
William C. Weldon Chairman, CEO 2,200,001 2,041,054
IBM Sal Palmisano Chairman, CEO President
990,674 495,283
Schering-Plough Fred Hassan Chairman, CEO 4,140,000 10,208,157 Bristol-Myers P.R. Dolan CEO 2,529,000 -815,462 Eli Lilly Sidney Taurel Chairman, CEO 3,689,918 5,400,000 Dupont C.O. Holiday, Jr. Chairman, CEO 0 2,494,199 PepsiCo Steven Reinemund Chairman, CEO 4,928,553 6,220,781 Intel Paul S. Otellini President, CEO 0 352,000 Coca-Cola E. Neville Isdell Chairman, CEO 0 12,128,912 Altria Louis C. Camilleri Chairman, CEO 7,730,000 9,291,095 Procter & Gamble A.G. Laffey Chairman, CEO
President 5,000,000 9,320,000
Oracle Larry J. Ellison CEO 0 0 Source: Corporate SEC filings. For more information on restricted stock awards at the surveyed corporations, see Table 4 in the Appendix. The value of the restricted stock awards, as well as any stock option awards, given to the repatriating corporations’ senior executives was likely further increased by the corporations’ substantial stock repurchases, as explained above. Together, this data indicates that, as funds were repatriated to the United States, stock repurchases and executive compensation climbed at the largest repatriating corporations, while hiring stagnated or declined. This finding was not replicated, however, in research that examined 67 The two corporations that did not increase executive stock awards in 2005 or 2006 were Bristol-Myers and Cola-Cola. Coca-Cola’s totals in 2006 include portions of prior year awards, so the new awards in 2006 did not exceed 2004 levels.

28
all 843 repatriating corporations; that research did not find a significant association overall between repatriation and increased executive compensation when considering data from the larger group.68
The Subcommittee’s survey results apply only to the 19 surveyed corporations which, together, brought back more than half of all the repatriated foreign earnings.
5. Industry Sectors Benefiting from Repatriation
Analysis shows that the 2004 repatriation turned out to benefit only a narrow sector of U.S. multinational corporations. Altogether, 843 corporations, or 11.5% of the roughly 9,700 U.S. corporations with controlled foreign corporations (CFCs) in 2004, took advantage of the deduction.69 Those 843 corporations represented only 0.015% of the 5,557,965 corporations that filed U.S. tax returns in 2004, many of which had no international operations.70 Of the $312 billion in qualifying funds that were repatriated, IRS data indicates that $157 billion, or half, went to multinational corporations in just two industry sectors, the pharmaceutical and technology industries.71
IRS data indicates that, of the 843 filers that took advantage of the deduction, pharmaceutical and medicine manufacturing corporations comprised about 3% of the total, yet claimed almost one-third of the qualifying dividends. Altogether, the pharmaceutical industry repatriated nearly $106 billion and deducted $98.8 billion.72 The computer and electronic equipment manufacturing industry represented about 10% of the 843 filers, yet repatriated about $57.5 billion, or 18% of the total qualifying dividends.73
The predominance of the pharmaceutical and technology industries among all repatriating corporations was reflected in the Subcommittee’s survey, as shown in the chart below, broken out by the top 15 repatriating corporations. Of those top 15 repatriating corporations, all of which were surveyed by the Subcommittee, six were pharmaceutical74 and four were technology corporations.75
68 See Dhammika Dharmapala, C. Fritz Foley, and Kristin J. Forbes, “Watch What I Do, Not What I Say: The Unintended Consequences of the Homeland Investment Act,” 66 Journal of Finance 753, 756 (June 2011) (finding no correlation overall between the 843 repatriating firms and increased executive compensation). 69 CRS Study, at 3. 70 Internal Revenue Service, Statistics of Income Bulletin, “2004 Corporation Returns – Basic Tables,” http://www.irs.gov/taxstats/article/0,,id=170544,00.html, in Tax Year 2004. 71 See CRS Study, at 4 (reporting that $99 billion in repatriations was brought back by the pharmaceutical and medicine industry and $58 billion was repatriated by the computer and electronic equipment industry). 72 IRS Data, at 103-105. 73 Id. 74 Bristol Myers, Eli Lilly, Johnson & Johnson, Merck, Pfizer, and Schering-Plough. 75 Hewlett Packard, IBM, Intel, and Oracle. The Subcommittee also surveyed five additional corporations from the pharmaceutical and technology industries, Cisco, Honeywell, Microsoft, Motorola, and Wyeth.
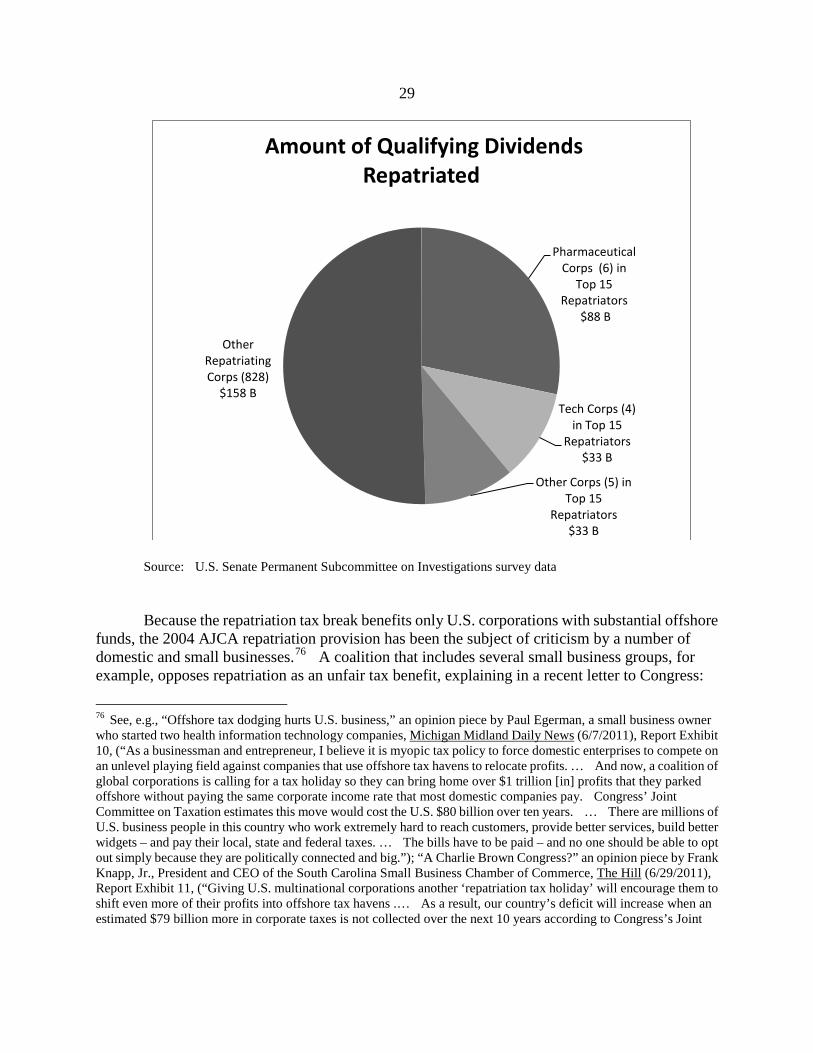
29
Source: U.S. Senate Permanent Subcommittee on Investigations survey data Because the repatriation tax break benefits only U.S. corporations with substantial offshore
funds, the 2004 AJCA repatriation provision has been the subject of criticism by a number of domestic and small businesses.76
76 See, e.g., “Offshore tax dodging hurts U.S. business,” an opinion piece by Paul Egerman, a small business owner who started two health information technology companies, Michigan Midland Daily News (6/7/2011), Report Exhibit 10, (“As a businessman and entrepreneur, I believe it is myopic tax policy to force domestic enterprises to compete on an unlevel playing field against companies that use offshore tax havens to relocate profits. … And now, a coalition of global corporations is calling for a tax holiday so they can bring home over $1 trillion [in] profits that they parked offshore without paying the same corporate income rate that most domestic companies pay. Congress’ Joint Committee on Taxation estimates this move would cost the U.S. $80 billion over ten years. … There are millions of U.S. business people in this country who work extremely hard to reach customers, provide better services, build better widgets – and pay their local, state and federal taxes. … The bills have to be paid – and no one should be able to opt out simply because they are politically connected and big.”); “A Charlie Brown Congress?” an opinion piece by Frank Knapp, Jr., President and CEO of the South Carolina Small Business Chamber of Commerce, The Hill (6/29/2011), Report Exhibit 11, (“Giving U.S. multinational corporations another ‘repatriation tax holiday’ will encourage them to shift even more of their profits into offshore tax havens .… As a result, our country’s deficit will increase when an estimated $79 billion more in corporate taxes is not collected over the next 10 years according to Congress’s Joint
A coalition that includes several small business groups, for example, opposes repatriation as an unfair tax benefit, explaining in a recent letter to Congress:
Pharmaceutical Corps (6) in
Top 15 Repatriators
$88 B
Tech Corps (4) in Top 15
Repatriators $33 B
Other Corps (5) in Top 15
Repatriators $33 B
Other Repatriating Corps (828)
$158 B
Amount of Qualifying Dividends Repatriated
30
“When powerful large U.S. corporations avoid their fair share of taxes, they undermine U.S. competitiveness, contribute to the national debt and shift more of the tax burden to domestic businesses, especially small businesses that create most of the new jobs. A transparent corporate tax system that assures all companies – large and small – pay for the services upon which our businesses, our customers, our workforce and our communities depend, would help restore the economic vitality and domestic job creation we all seek.”77
Even some multinational corporations, such as IBM,78 Caterpillar Inc., Kimberly-Clark Corp., United Technologies Corp. and Zimmer Holdings Inc., have expressed a lack of support for a new repatriation effort.79
According to the Secretary of the U.S. Treasury, Timothy Geithner, 96% of U.S. corporations would not benefit from a new repatriation tax break.80
6. Source of Repatriated Funds The data collected by the Subcommittee survey shows that a significant amount of the repatriated funds under Section 965 flowed from tax haven jurisdictions, including the Bahamas, Bermuda, British Virgin Islands, Cayman Islands, Costa Rica, Hong Kong, Ireland, Luxembourg, Netherlands Antilles, Panama, Singapore, and Switzerland.81
Of the 19 corporations surveyed, seven or 37% repatriated between 90 and 100% of funds from tax haven jurisdictions, as indicated in the following chart.
Committee on Taxation. That means the rest of us will continue to pay more than our fair share for the essential services of government. These big corporations benefit immensely from all the advantages of being headquartered in our country. They need to start paying their taxes just as every citizen and small business does.”). 77 “Letter to Congress: No Tax Holiday for U.S. Multinationals,” Business for Shared Prosperity (6/14/2011) (letter to Members of Congress from a coalition of business groups, including Business for Shared Prosperity, American Sustainable Business Council, and American Made Alliance), http://businessforsharedprosperity.org/content/letter- congress-no-tax-holiday-us-multinationals, Report Exhibit 12. 78 Tony Romm, “IBM Breaks with Peers on Repatriation,” Politico (3/28/2011), http://dyn.politico.com/members/forums/thread.cfm?catid=24&subcatid=78&threadid=5258233; Bernie Becker, “IBM says tax holiday would be a distraction,” The Hill, March 29, 2011 (IBM has asserted that such effort is a “distraction” from the more pressing need for comprehensive corporate tax reform.).
79 See “Hearing on the Need for Comprehensive Tax Reform to Help American Companies Compete in the Global Market and Create Jobs for American Workers,” House Committee on Ways and Means, Serial 112-11 (5/12/2011) (Witnesses testifying for Caterpillar, Kimberly-Clark and Zimmer Holdings all stated that a one-time corporate tax holiday is “a bad idea,” preferring instead that it be part of comprehensive corporate tax reform.). The CFO of United Technologies stated: “I fear we'll have a repeat of 2004.” See Andrew S. Ross, “Repatriation - a really bad idea makes a comeback,” San Francisco Chronicle (7/7/2011). 80 See Janie Lorber, “Tech Sector Fights for Repatriation,” Roll Call (9/20/2011) (quoting Secretary Geithner: “It [a new repatriation tax break] costs between $20 [billion] and $80 billion to do that over 10 years, and if you’re going to do that, you have to be able to pay for it, and how are you going to raise taxes on the 96 percent of companies across the country that don’t benefit from repatriation?”). 81 See Appendix, Table 5, “Dividends from Tax Haven CFCs.” Tax haven countries are identified by GAO.
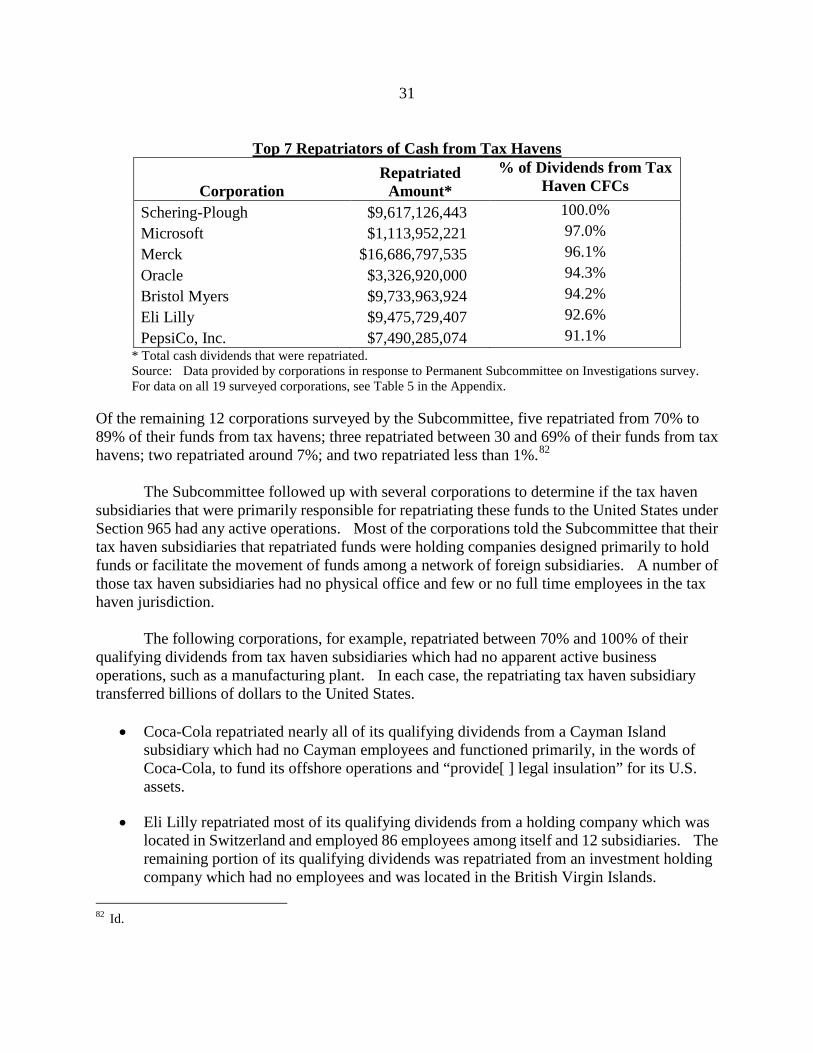
31
Corporation
Top 7 Repatriators of Cash from Tax Havens Repatriated
Amount* % of Dividends from Tax
Haven CFCs
Schering-Plough $9,617,126,443 100.0% Microsoft $1,113,952,221 97.0% Merck $16,686,797,535 96.1% Oracle $3,326,920,000 94.3% Bristol Myers $9,733,963,924 94.2% Eli Lilly $9,475,729,407 92.6% PepsiCo, Inc. $7,490,285,074 91.1%
* Total cash dividends that were repatriated. Source: Data provided by corporations in response to Permanent Subcommittee on Investigations survey. For data on all 19 surveyed corporations, see Table 5 in the Appendix.
Of the remaining 12 corporations surveyed by the Subcommittee, five repatriated from 70% to 89% of their funds from tax havens; three repatriated between 30 and 69% of their funds from tax havens; two repatriated around 7%; and two repatriated less than 1%.82
The Subcommittee followed up with several corporations to determine if the tax haven subsidiaries that were primarily responsible for repatriating these funds to the United States under Section 965 had any active operations. Most of the corporations told the Subcommittee that their tax haven subsidiaries that repatriated funds were holding companies designed primarily to hold funds or facilitate the movement of funds among a network of foreign subsidiaries. A number of those tax haven subsidiaries had no physical office and few or no full time employees in the tax haven jurisdiction. The following corporations, for example, repatriated between 70% and 100% of their qualifying dividends from tax haven subsidiaries which had no apparent active business operations, such as a manufacturing plant. In each case, the repatriating tax haven subsidiary transferred billions of dollars to the United States.
• Coca-Cola repatriated nearly all of its qualifying dividends from a Cayman Island subsidiary which had no Cayman employees and functioned primarily, in the words of Coca-Cola, to fund its offshore operations and “provide[ ] legal insulation” for its U.S. assets.
• Eli Lilly repatriated most of its qualifying dividends from a holding company which was located in Switzerland and employed 86 employees among itself and 12 subsidiaries. The remaining portion of its qualifying dividends was repatriated from an investment holding company which had no employees and was located in the British Virgin Islands.
82 Id.
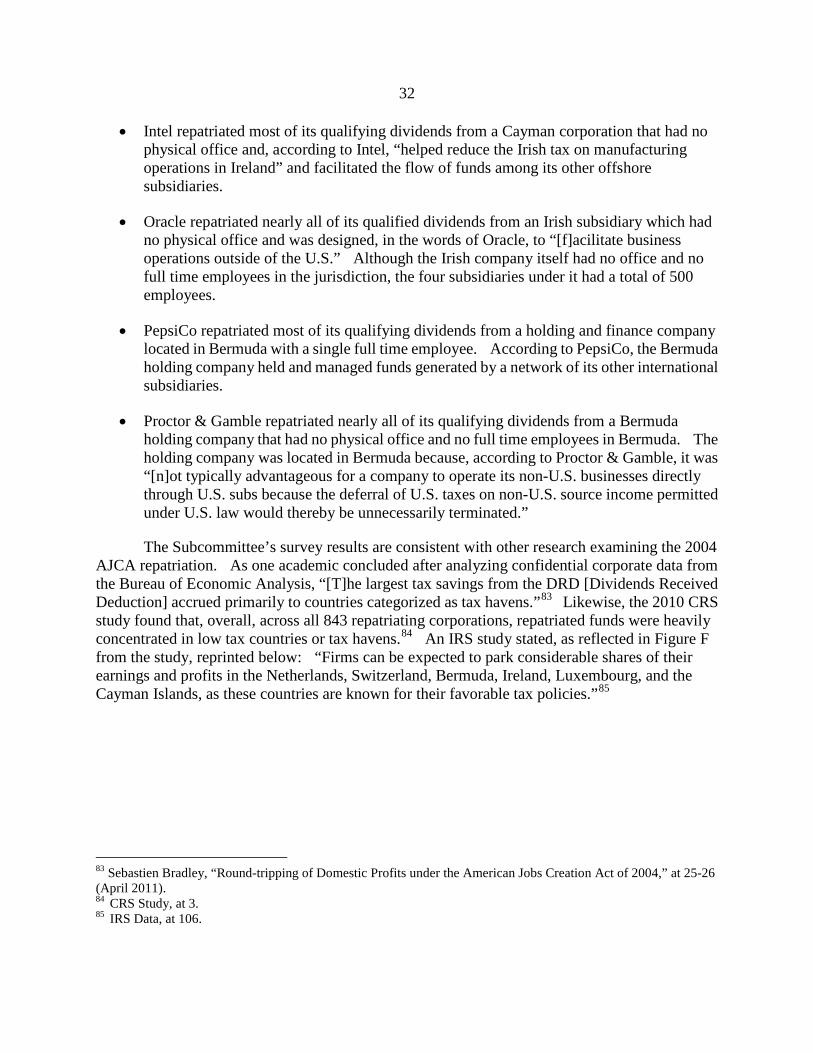
32
• Intel repatriated most of its qualifying dividends from a Cayman corporation that had no physical office and, according to Intel, “helped reduce the Irish tax on manufacturing operations in Ireland” and facilitated the flow of funds among its other offshore subsidiaries.
• Oracle repatriated nearly all of its qualified dividends from an Irish subsidiary which had no physical office and was designed, in the words of Oracle, to “[f]acilitate business operations outside of the U.S.” Although the Irish company itself had no office and no full time employees in the jurisdiction, the four subsidiaries under it had a total of 500 employees.
• PepsiCo repatriated most of its qualifying dividends from a holding and finance company located in Bermuda with a single full time employee. According to PepsiCo, the Bermuda holding company held and managed funds generated by a network of its other international subsidiaries.
• Proctor & Gamble repatriated nearly all of its qualifying dividends from a Bermuda holding company that had no physical office and no full time employees in Bermuda. The holding company was located in Bermuda because, according to Proctor & Gamble, it was “[n]ot typically advantageous for a company to operate its non-U.S. businesses directly through U.S. subs because the deferral of U.S. taxes on non-U.S. source income permitted under U.S. law would thereby be unnecessarily terminated.”
The Subcommittee’s survey results are consistent with other research examining the 2004 AJCA repatriation. As one academic concluded after analyzing confidential corporate data from the Bureau of Economic Analysis, “[T]he largest tax savings from the DRD [Dividends Received Deduction] accrued primarily to countries categorized as tax havens.”83 Likewise, the 2010 CRS study found that, overall, across all 843 repatriating corporations, repatriated funds were heavily concentrated in low tax countries or tax havens.84 An IRS study stated, as reflected in Figure F from the study, reprinted below: “Firms can be expected to park considerable shares of their earnings and profits in the Netherlands, Switzerland, Bermuda, Ireland, Luxembourg, and the Cayman Islands, as these countries are known for their favorable tax policies.”85
83 Sebastien Bradley, “Round-tripping of Domestic Profits under the American Jobs Creation Act of 2004,” at 25-26 (April 2011). 84 CRS Study, at 3. 85 IRS Data, at 106.
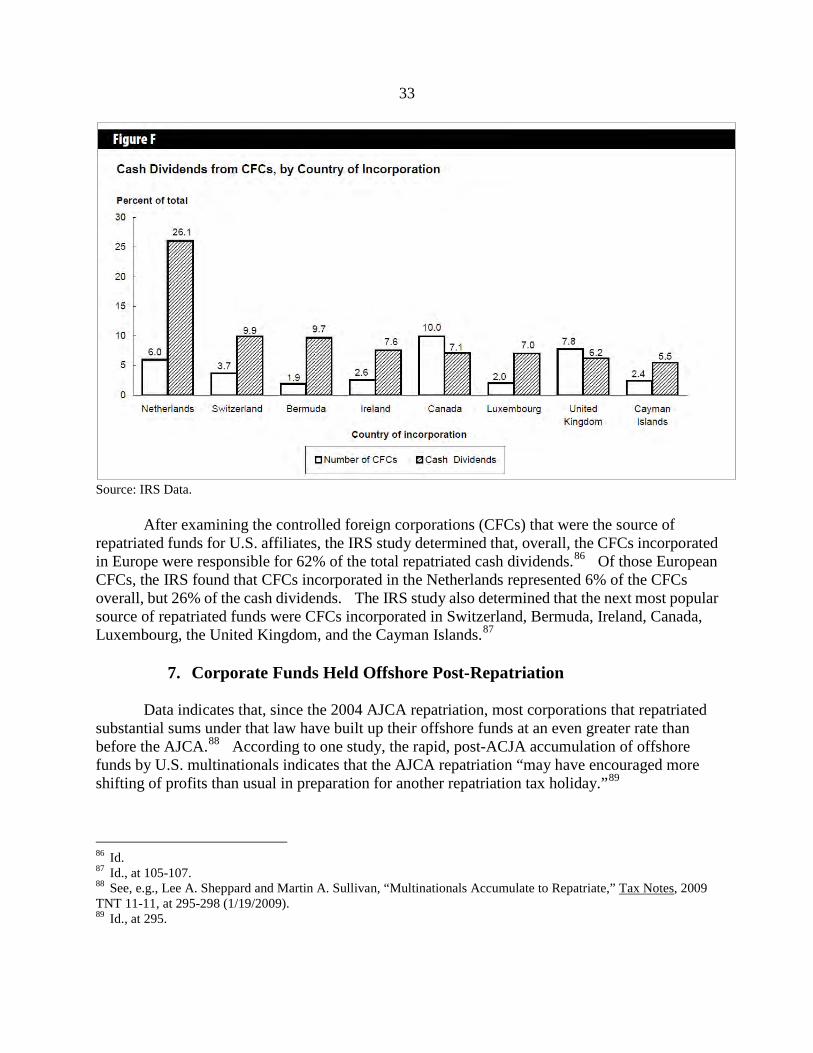
33
Source: IRS Data.
After examining the controlled foreign corporations (CFCs) that were the source of
repatriated funds for U.S. affiliates, the IRS study determined that, overall, the CFCs incorporated in Europe were responsible for 62% of the total repatriated cash dividends.86 Of those European CFCs, the IRS found that CFCs incorporated in the Netherlands represented 6% of the CFCs overall, but 26% of the cash dividends. The IRS study also determined that the next most popular source of repatriated funds were CFCs incorporated in Switzerland, Bermuda, Ireland, Canada, Luxembourg, the United Kingdom, and the Cayman Islands.87
7. Corporate Funds Held Offshore Post-Repatriation
Data indicates that, since the 2004 AJCA repatriation, most corporations that repatriated substantial sums under that law have built up their offshore funds at an even greater rate than before the AJCA.88 According to one study, the rapid, post-ACJA accumulation of offshore funds by U.S. multinationals indicates that the AJCA repatriation “may have encouraged more shifting of profits than usual in preparation for another repatriation tax holiday.”89
86 Id. 87 Id., at 105-107. 88 See, e.g., Lee A. Sheppard and Martin A. Sullivan, “Multinationals Accumulate to Repatriate,” Tax Notes, 2009 TNT 11-11, at 295-298 (1/19/2009). 89 Id., at 295.

34
The following chart displays the post-AJCA accumulated offshore funds of the top ten corporations that took advantage of the 2004 repatriation.
Top 10 Repatriating Corporations Post-AJCA Accumulation of Offshore Funds
Company Repatriated
Amount ($000)
Accumulated Undistributed International Earnings ($000)
2006 2007 2008 2009 2010 Pfizer 35,491,822 41,000 60,000 63,100 42,500 48,200 Merck 15,875,762 12,500 17,200 22,000 31,200 40,400 Hewlett Packard 14,500,000 3,100 7,700 12,900 16,500 21,900 Johnson & Johnson 10,668,701 12,000 24,200 27,700 32,200 37,000 IBM 9,500,000 14,200 18,800 21,900 26,000 31,100 Schering-Plough* 9,399,626 4,200 5,800 7,500 na na Bristol Myers 9,000,000 11,300 14,100 15,400 16,500 16,400 Eli Lilly 8,000,000 5,700 8,790 13,310 15,460 19,900 DuPont 7,730,209 7,866 9,644 10,101 11,279 12,631 PepsiCo, Inc. 7,383,801 10,800 14,700 17,100 21,900 26,600
* In 2009, Schering-Plough merged with Merck.
Top 10 Repatriating Corporations Pre-AJCA Accumulation of Offshore Funds
Company Repatriated
Amount ($000)
Accumulated Undistributed International Earnings ($000)
2000 2001 2002 2003 2004 Pfizer 35,491,822 14,000 18,000 29,000 38,000 51,600 Merck 15,875,762 9,700 12,400 15,000 18,000 20,100 Hewlett Packard 14,500,000 11,500 13,200 14,500 14,400 15,000 Johnson & Johnson 10,668,701 9,500 12,100 12,300 14,800 18,600 IBM 9,500,000 15,472 16,851 16,631 18,120 19,644 Schering-Plough* 9,399,626 6,400 7,600 9,400 11,100 2,200 Bristol Myers 9,000,000 6,000 8,800 9,000 12,600 16,900 Eli Lilly 8,000,000 5,200 6,400 8,000 9,500 2,800 DuPont 7,730,209 8,865 9,106 10,320 13,464 13,865 PepsiCo, Inc. 7,383,801
7,500 8,800 1,900
Source: Figures for 2000 through 2008 from Sheppard and Sullivan (note 91); Figures for 2009 and 2010 from corporate annual reports filed with the Securities and Exchange Commission. For all 19 corporations, see Appendix Tables 6 and 7. *In 2009, Schering-Plough merged with Merck.

35
The possibility of a repeat repatriation tax break provides U.S. multinational corporations with an incentive to move more jobs, operations, and investments abroad, and keep substantial funds offshore, in order to take advantage of the next opportunity to bring corporate profits back to the United States at an extremely low tax rate. The empirical evidence indicates that corporations will benefit even more than before if another repatriation tax break occurs.
Data collected by the Subcommittee, as reflected in the following chart, shows that the ten
corporations that repatriated the most money under the AJCA have, with one exception (Pfizer), stockpiled increasing amounts of offshore funds every year since taking advantage of the 2004 provision. The same pattern is evident among the remaining ten of the 19 corporations surveyed by the Subcommittee, again with one exception (Motorola).90
Merck, for example, has reported accumulated undistributed foreign earnings in the years following the AJCA (2006 to 2010) totaling $40.4 billion. In a comparable time period prior to enactment of the AJCA (2000 to 2004), by comparison, Merck reported half that amount, with accumulated undistributed foreign earnings of $20.1 billion.
Source: Figures for 2006, 2007, and 2008 from Sheppard and Sullivan (note 91, gathered from corporate annual reports); Figures for 2009 and 2010 from corporate annual reports. Figures for all 19 surveyed corporations are available in the Appendix, Table 6. 90 See Appendix Tables 6 and 7. Motorola, as the one exception, reduced its undistributed accumulated foreign earnings both before and after repatriation.
0
10
20
30
40
50
60
70
2006 2007 2008 2009 2010
$B
Top Ten Repatriating Companies Stockpiled Offshore Funds
Pfizer
Merck
Hewlett Packard
Johnson & Johnson
IBM
Schering-Plough
Bristol Myers
Eli Lilly
Dupont
PepsiCo, Inc.

36
The Subcommittee’s survey results are consistent with other research. The 2011 CRS study, for example, found that, across all U.S. corporations, unrepatriated offshore funds have grown rapidly since 2005,91 increasing since the 2004 repatriation by 72% for all corporations and by 81% for firms that repatriated under the AJCA.92
A 2010 study by Professor Thomas J. Brennan reached a similar conclusion.93
It found that since the AJCA provision:
“there has been a dramatic increase in the rate at which firms add to their stockpile of foreign earnings kept overseas. The long-term result has been an aggregate increase in new foreign earnings added to the overseas stockpile that is greater than the amount of funds repatriated [under the 2004 AJCA].@94
Because the stockpiles of offshore funds have continued to increase and currently outweigh the amount of funds repatriated under the AJCA, the Brennan study stated that “[t]he AJCA may have been a net failure in achieving the policy goal of returning foreign earnings to the United States.”95 It also stated that a Acollateral consequence@ of the AJCA provision was Athe conditioning of firms to expect future such holidays and to arrange their affairs accordingly.@96
While noting that its findings demonstrated only a statistical correlation and not causation, the Brennan study concluded:
“[T]he changes in patterns demonstrated [by the study] are sufficiently substantial in terms of dollar magnitude and statistical significance that they provide strong evidence of a conditioned behavioral change in firms created by the AJCA tax holiday.”97
The Joint Committee on Taxation (JCT), whose tax expertise guides Congress, has also determined that the 2004 AJCA repatriation tax break has encouraged corporations to move funds offshore. In an April 2011 letter, JCT wrote that “it is also necessary to recognize that ... section 965 ... prospectively [ ] encourages investments and/or earnings to be located overseas.”98
91 CRS Study, at 4, citing Allen Sinai, “Macro Economic Effects of Reducing the Effective Tax Rate on Repatriated Earnings in a Credit-and Liquidity-Constrained Environment,” Decisions Economics, Inc., Economic Studies Series, (12/11/2008); Lee A. Sheppard and Martin A. Sullivan, “Multinationals Accumulate to Repatriate,” Tax Notes, 2009 TNT 11-11, at 295-298 (1/19/2009); and Thomas J. Brennan, “What Happens After a Holiday? Long-Term Effects of the Repatriation Provision of the AJCA,” Northwestern Journal of Law and Social Policy, vol. 5 (Spring 2010).
JCT predicted that another repatriation tax break would make offshore locales even more attractive to U.S. corporations seeking to take advantage of extremely low corporate income tax rates. Due to
92 CRS Study, at 5. 93 Thomas J. Brennan, “What Happens After a Holiday? Long-Term Effects of the Repatriation Provision of the AJCA,” Northwestern Journal of Law and Social Policy, vol. 5 (Spring 2010) (“Brennan Study”). 94 Brennan Study, at 2-3. 95 Id. 96 Id., at 17. 97 Id. 98 Letter from Thomas A. Barthold, Chief of Staff, U.S. Congress Joint Committee on Taxation, to U.S. Representative Lloyd Doggett (4/15/2011), http://doggett.house.gov/images/pdf/jct_repatriation_score.pdf.

37
its analysis that the effect of a repeat repatriation tax break would be to encourage corporations to move still more investments and funds offshore, when asked to estimate the cost of a repeat repatriation tax break, JCT calculated the total cost to the U.S. treasury in lost tax revenues over ten years would be $78.7 billion, assuming an 85% decrease in the tax rate.99 For an alternative plan, assuming a 70% rate decrease were enacted, JCT calculated that the cost would be $41.7 billion over ten years.100
8. Current Domestic Cash Assets Proponents of the 2004 repatriation tax break touted increased investment capital as one of the economic benefits of repatriation. The rationale was that money brought back to this country through repatriation and deposited in U.S. banks would provide increased funds to corporations for use in U.S. jobs and domestic investments. Research has since demonstrated, however, that many corporations did not use their repatriated funds for domestic investment, and some even returned the repatriated funds – after taking advantage of the extraordinarily low tax rate of 5.25% – to their offshore operations, which indicates they did not need the offshore funds for domestic use. Today, with U.S. corporations collectively holding even more abundant domestic cash assets in 2011 than in 2004, returning offshore cash to spur U.S. job growth and domestic investment offers an even less persuasive rationale to justify an expensive tax expenditure. One recent study used Bureau of Economic Analysis data to review the relationship between AJCA repatriations and U.S. parent company infusions of cash into their offshore affiliates.101 The study found a “significantly different” pattern in 2005 compared to other years studied, determining that U.S. corporations that repatriated $259 billion in 2005 also sent $104 billion to their offshore affiliates during the same period.102 Since 2005 was the year that most corporations (86%) reported a repatriation tax deduction,103 the study concluded that some U.S. parent corporations repatriated funds to take advantage of the lower tax rate, but then immediately returned the funds offshore, an action which it termed “round tripping.”104
99 Id., at 2. JCT indicated that increased offshoring of funds was one of three major components underlying the cost of another repatriation tax break, which JCT calculated would be $78.7 billion over ten years if an 85% decrease in the tax rate were enacted as occurred in 2004, or $41.7 billion over ten years if a 70% rate decrease were enacted instead. See also id. at 4 (“The final component of the estimates takes account of how each proposal would affect the prospective decisions of taxpayers about where to locate investment and/or income. . . . [E]ase of repatriation is one consideration in such decisions, and enactment of section 965 would be regarded by some taxpayers as altering the existing geographic location incentives.”).
Another study presented data suggesting that some U.S. parent corporations may have sent domestic funds to
100 Id., at 2. 101 Dhammika Dharmapala, C. Fritz Foley, and Kristin J. Forbes, “Watch What I Do, Not What I Say: The Unintended Consequences of the Homeland Investment Act,” 66 Journal of Finance 753, 778-780 (June 2011). 102 Id., at 778. 103 IRS Data, at 103-04. 104 Dhammika Dharmapala, C. Fritz Foley, and Kristin J. Forbes, “Watch What I Do, Not What I Say: The Unintended Consequences of the Homeland Investment Act,” 66 Journal of Finance 753, 782 (June 2011) (“Moreover, around the time of the HIA, repatriations were positively associated with parents sending capital to their foreign affiliates, suggesting that parent companies were round tripping capital in order to repatriate it at the lower tax rate.”).
38
their offshore affiliates in advance of repatriation simply to take advantage of the 5.25% tax rate when the funds were subsequently returned.105
In this form of round tripping, the U.S. parent corporation apparently repatriated funds that were already intended for domestic use. In both studies, the repatriating corporations apparently did not need offshore funds for domestic investments. Just as the 2004 repatriation led to corporations shifting foreign earnings offshore, the prospect of a repeat repatriation tax break raises the concern that corporations would again employ round tripping tactics to lower their tax bills without providing commensurate benefits through increased U.S. jobs or investment.
U.S. parent corporations have even less need for offshore cash today. The Federal Reserve Board has estimated that through the second quarter of 2011, the most recent period for which such data is available, U.S. corporations have domestic cash holdings of over $2 trillion.106
The corporations that have the greatest domestic cash holdings are in the pharmaceutical and technology industries, the same industries advocating for another offshore tax break. In a recent survey of corporate cash holdings by different industries, for example, researchers analyzed the amount of cash in excess of what corporations needed to satisfy their contractual obligations: “Of the 138 companies with cash cushions of more than two years, 58 of them or 42% are in the Technology sector and 27 or 20% are from the Health Care sector.”107 By one estimate, ten of these corporations – Adobe Systems, Apple, CA Technologies, Cisco, Duke Energy, Google, Microsoft, Oracle, Pfizer, and Qualcomm – collectively have at least $47 billion in cash and liquid assets available for domestic investments, without incurring additional tax liability.108
Given these large cash holdings, the claim that a rate reduction on repatriated earnings will generate increased domestic investment Aholds no water at all,@ according to Joel B. Slemrod, an economics professor at the University of Michigan and former senior tax counsel for President Reagan=s Council of Economic Advisors. Professor Slemrod stated: “The fact that they have these cash hoards suggests that investment is not being constrained by lack of cash.”109
105 Sebastien Bradley, “Round-tripping of Domestic Profits Under the American Jobs Creation Act of 2004,” at 42-43 (April 2011). Prof. Bradley estimated that, at most, corporations engaged in approximately $32 billion of this type of round-tripping, an amount equal to roughly 10% of all qualifying dividends repatriated.
106 Federal Reserve Board, “Flows of Funds Accounts of the United States,” Second Quarter 2011, Table L.102, Line 41 (9/16/2011), http://www.federalreserve.gov/releases/z1/current/z1.pdf. The exact figure is $2.047 trillion. 107 David Zion, Amit Varshney, and Nichole Burnap, Credit Suisse, “How Big is the Cash Cushion?” at 10 (5/31/2011) (emphasis in original). 108 Chuck Marr and Brian Highsmith, “Tax Holiday For Overseas Corporate Profits Would Increase Deficits, Fail to Boost The Economy, And Ultimately Shift More Investment And Jobs Overseas,” Center on Budget and Policy Priorities, at 9-10 (4/8/2011). 109 Jesse Drucker, ADodging Repatriation Tax Lets U.S. Companies Bring Home Cash,@ Bloomberg (12/29/2010) (quoting Professor Slemrod).

39
9. 2004 Repatriation Did Not Achieve Intended Stimulus Effect
Some supporters of the 2004 AJCA repatriation tax break contend that the repatriated funds had a stimulus effect on the U.S. economy, resulting in more jobs and domestic investment, but are unable to cite persuasive research to support those claims.
One study cited by some repatriation supporters to support a new round of repatriation tax
breaks is a November 2008 study by economist Allen Sinai.110 This study did not, however, examine actual economic data resulting from the 2004 repatriation; instead it used computer-generated economic simulations of repatriation provisions similar to those in AJCA to project the economic impact if a new repatriation tax break were to be enacted in 2009. Based on such simulations, the Sinai study concluded that a 2009 repatriation tax break would have improved the net cash flow of participating corporations by approximately $535 billion.111 It also projected that a temporary reduction in the tax on repatriated funds would have increased domestic economic activity in the 2009 - 2013 time period, estimating that gross domestic product (GDP) would have increased by an average of $62 billion per year, and business capital spending and research and development by an average of $7 billion per year. The Sinai study also projected an increase in employment, peaking at 614,000 additional jobs in 2011.112
Critics of the Sinai study have noted several problems with its projections.113
First, they have noted that the study relied on computer simulations rather than actual economic data to conduct its analysis. Second, they have observed that the assumptions underlying the 2008 Sinai simulation model did not incorporate detailed economic data from the 2004 repatriation. The absence of actual data on the impact of the 2004 repatriation on U.S. employment and economic activity, as documented by the 2010 CRS report and other independent studies, to calibrate the Sinai simulation model necessarily limits its predictive capabilities. Third, the economic conditions in effect when the simulations were run, which took place at the height of the 2008 financial crisis, differ markedly from current conditions, as recently noted by Mr. Sinai himself.
In fact, when recently asked about his 2008 study, Mr. Sinai noted that the rationale for a second repatriation tax break was less compelling when, instead of facing credit and cash flow problems, U.S. corporations have large cash holdings. According to Mr. Sinai: “The case for it [repatriation] is not as strong because corporations are so cash rich.”114
He was also recently quoted as follows:
110 See Allen Sinai, “Macro Economic Effects of Reducing the Effective Tax Rate on Repatriated Earnings in a Credit- and Liquidity-Constrained Environment,” Decisions Economics, Inc., Economic Studies Series (12/11/2008). 111 CRS Study, at 5. 112 CRS Study, at 8. 113 See, e.g., Robert Greenstein and Chye-Chin Huang, “Proposed Tax Break for Multinationals Would Be Poor Stimulus,” Center on Budget and Policy Priorities, (2/3/2009), http://www.cbpp.org/cms/index.cfm?fa=view&id=2270. 114 See Mike Zapler, “Experts: Tax holiday not a jobs fix,” Politico (3/11/2011).

40
“Many who want this policy try to advocate it as a jobs-creation program, but that is not what I found. … What I found was that it would shore up the corporate balance sheets during the depths of the financial crisis and create some jobs. But the balance sheets are already so good that I don’t think there’s a rationale any longer that simply rebuilding the companies’ finances will lead to hiring.”115
.
The probability of Sinai’s findings are further called into question by more recent research that uses actual economic data on the results of the 2004 repatriation rather than Sinai’s computer simulations to reach its conclusions. For example, after reviewing detailed data from the 2004 repatriation, the 2010 CRS study concluded:
“While the empirical evidence is clear that this provision resulted in a significant increase in repatriated earnings, empirical evidence is unable to show a corresponding increase in domestic investment or employment by firms that utilized the repatriation provisions.”
In reaching this conclusion, CRS cited several empirical studies including, as indicated earlier, the Dharmapala study which concluded that repatriation had a statistically insignificant impact on domestic capital expenditures and jobs;116 and the Clemons and Kinney study which found no evidence that investment increased in corporations that utilized the 2004 repatriation provisions.117
CRS wrote:
“Empirical analyses of the stimulative effects of the repatriation provisions in the American Jobs Creation Act also suggests a limited stimulative impact from these provisions. They conclude that much of the repatriated earnings were used for cash-flow purposes and little evidence exists that new investment was spurred.”118
This Report’s survey results are consistent with that research.
115 See David Kocieniewski, “Companies Push for Tax Break on Foreign Cash,” New York Times (6/19/2011). 116 Dhammika Dharmapala, C. Fritz Foley, and Kristin J. Forbes, “Watch What I Do, Not What I Say: The Unintended Consequences of the Homeland Investment Act,” 66 Journal of Finance 753, 756 (June 2011). 117 Roy Clemons and Michael R. Kinney, “An Analysis of the Tax Holiday for Repatriations Under the Jobs Act,” 120 Tax Notes 759 (8/25/2008). 118 CRS Study, at 6.

41
B. Conclusion The Domestic Reinvestment Plans produced by the corporations that repatriated offshore
funds under the AJCA describe how each planned to expend repatriated funds on hiring and training new employees. But the reality was that, instead of increasing jobs, the top 15 repatriators did not increase their U.S. workforces or their research and development expenditures overall, even after bringing back over $150 billion in offshore dollars subject to an extraordinarily low tax rate. At the same time, at those same corporations, stock repurchases and executive compensation climbed. These trends show that the 2004 repatriation not only failed to achieve its goal of increasing jobs and domestic investment in research and development, it did little more than enrich corporate shareholders and executives while providing an estimated $3.3 billion tax windfall for some of the largest multinational corporations. In addition, because Congress did not require corporations that took advantage of the tax break to track how repatriated funds were used, it left the U.S. Treasury without a mechanism to measure compliance or prevent misuse of the repatriated funds.
Even more disturbing is that the 2004 repatriation rewarded corporations that kept
substantial funds offshore, and has created a new incentive for U.S. corporations to keep shipping jobs and diverting domestic funds offshore. Data shows that the 2004 repatriated funds flowed largely from tax havens, rewarding corporate behavior that moved funds to offshore locales rather than U.S. plants or manufacturing. The long term consequence of that policy is the current corporate stockpiling of offshore funds in anticipation of another repatriation tax break allowing multinational corporations to use a 5.25% tax rate in place of the top 35% rate that applies to domestic corporations. Such disparate tax rates punish small and mid-sized domestic corporations that don’t do business offshore, by placing them at a competitive disadvantage, allowing their competitors to escape paying their fair share of taxes, and discouraging multinational corporations from investing in America. The AJCA’s negative effects, in both the short and long-term, provide strong evidence that repatriation tax breaks create unfair tax advantages for a narrow sector of corporations with damaging economic impacts on the U.S. economy as a whole.

42
APPENDIX
Table 1 - U.S. Employment
Company Repatriated Amount
U.S. Employment 2002 2003 2004 2005 2006 2007 Change**
Pfizer $35,491,821,577 31,942 43,312 42,000 39,588 35,102 30,252 -11,748 Merck $15,875,761,191 33,400 33,200 32,700 31,900 31,800 31,700 -1,000 Hewlett Packard $14,500,000,000 70,513 62,905 60,763 51,951 51,038 52,041 -8,722 Johnson & Johnson $10,668,700,798 49,647 47,984 49,486 47,386 47,765 45,424 -4,062 IBM $9,500,000,000 142,576 140,544 139,336 133,188 133,838 126,506 -12,830 Schering-Plough $9,399,626,443 13,500 13,500 12,000 13,700 14,300 17,400 5,400 Bristol Myers $9,000,000,000 17,735 18,490 17,228 17,289 17,183 16,647 -581 Eli Lilly $8,000,000,000 22,048 23,120 22,751 21,603 21,132 20,924 -1,827 DuPont $7,730,209,120 43,300 42,900 34,300 34,500 33,500 32,800 -1,500 PepsiCo, Inc. $7,383,801,188 61,000 60,000 60,000 62,000 63,000 66,000 6,000 Intel $6,194,933,490 51,245 48,780 49,455 54,872 51,250 46,951 -2,504 Coca-Cola $6,100,000,000 10,900 9,200 9,600 10,400 12,200 13,200 3,600 Altria $6,005,600,000 65,066 62,294 59,205 56,786 53,665 53,135 -6,070 Procter & Gamble $5,782,721,546 n/a 37,860 34,440 34,090 42,150 41,845 7,405 Oracle $3,099,996,596 12,225 18,191 16,888 21,328 23,435 24,396 7,508 Motorola $2,760,060,402 45,438 39,859 30,023 29,657 26,418 27,158 -2,865 Wyeth $2,657,142,857 22,156 21,354 20,573 23,267 23,151 22,925 2,352 Honeywell $2,119,308,476 63,000 61,000 60,000 58,000 56,000 57,000 -3,000 Microsoft $780,000,000 34,600 36,500 37,000 38,304 44,298 47,859 10,859
* Cash dividends that qualified for deduction under Section 965. ** Denotes the gain/loss of U.S. job between 2004 and 2007. Source: Data provided by corporations in response to U.S. Senate Permanent Subcommittee on Investigations survey.

43
Table 2 B Stock Repurchases
Corporation Stock Repurchases By Year ($000s)
2002 2003 2004 2005 2006 2007 Pfizer 4,995,000 13,037,000 6,659,000 3,797,000 6,979,000 9,994,000 Merck 2,091,000 2,034,000 975,000 1,015,000 1,002,000 1,430,000 Hewlett Packard 671,000 751,000 3,309,000 3,514,000 7,779,000 10,887,000 Johnson & Johnson 5,000,000 0 0 0 5,000,000 3,606,000 IBM 4,212,000 4,403,000 7,275,000 7,671,000 8,022,000 18,783,000 Schering-Plough 0 0 0 0 0 0 Bristol Myers 164,000 0 0 0 0 0 Eli Lilly 389,200 276,800 0 377,900 122,100 0 DuPont 470,000 0 457,000 3,504,000 280,000 1,695,000 PepsiCo, Inc. 2,100,000 1,900,000 3,000,000 3,000,000 3,000,000 4,300,000 Intel 4,000,000 4,000,000 7,500,000 10,600,000 4,600,000 2,800,000 Coca-Cola 695,790 1,455,608 1,737,823 1,995,500 2,473,131 1,750,740 Altria 6,390,000 1,149,000 688,000 1,175,000 1,175,000 190,000 Procter & Gamble 1,236,000 4,070,000 5,026,000 16,830,000 5,578,000 Oracle 2,793,200 2,653,033 1,498,500 1,342,981 2,064,476 3,980,956 Motorola 0 0 0 874,000 3,826,000 3,035,000 Wyeth 114 0 0 0 664,579 1,316,761 Honeywell 0 37,000 724,000 1,133,000 1,896,000 3,986,000 Microsoft 6,900,000 59,000,000 3,400,000 800,000 19,749,000 27,113,000
* Cash dividends that qualified for deduction under Section 965. Source: Data provided by corporations in response to U.S. Senate Permanent Subcommittee on Investigations survey.

44
Table 3 B Executive Compensation
Company Executive Compensation
2002 2003 2004 2005 2006 2007 Pfizer $27,100,000 $24,600,000 $41,100,000 $31,200,000 $36,600,000 $53,900,000 Merck $8,525,961 $12,446,830 $12,198,351 $15,854,455 $28,411,451 $32,545,900 Hewlett Packard $34,324,939 $28,405,498 $23,773,204 $60,731,226 $73,073,788 $35,059,892 Johnson & Johnson $26,476,542 $22,995,514 $30,774,359 $34,849,972 $64,790,547 $63,590,025 IBM $51,000,000 $38,000,000 $40,000,000 $35,000,000 $42,000,000 $47,000,000 Schering-Plough $32,828,610 $25,443,085 $30,787,239 $37,450,278 $64,939,277 $60,444,738 Bristol Myers $20,146,019 $22,308,480 $20,541,707 $28,307,565 $22,414,320 $33,915,415 Eli Lilly $3,288,433 $21,870,624 $36,895,760 $29,464,008 $39,345,385 $37,622,381 DuPont $20,946,481 $14,788,625 $13,431,296 $13,015,057 $27,879,455 $25,102,236 PepsiCo, Inc. $44,537,670 $36,011,022 $41,576,070 $34,142,147 $43,934,158 $51,177,719 Intel $5,861,000 $6,889,000 $7,884,000 $23,065,000 $34,236,000 $33,514,000 Coca-Cola $23,727,846 $25,332,803 $36,199,730 $37,205,615 $35,426,852 $50,804,159 Altria $70,816,716 $73,474,436 $52,828,312 $119,884,559 $125,422,416 $105,048,436 Procter & Gamble n/a $22,782,000 $34,899,000 $30,946,000 $31,653,000 $55,144,000 Oracle $36,536,194 $20,424,887 $30,050,275 $44,377,581 $77,621,789 $77,588,930 Motorola $30,136,764 $28,867,434 $76,474,871 $46,125,606 $35,397,342 $42,451,887 Wyeth $59,239,584 $25,709,625 $28,353,474 $28,111,225 $74,949,826 $52,731,463 Honeywell $88,925,356 $32,372,068 $35,325,955 $36,867,023 $52,298,216 $41,249,949 Microsoft $3,795,070 $45,141,521 $7,109,773 $5,132,567 $21,395,635 $27,672,926
* Dollar figures represent the value, as calculated by each corporation, of the cash and non-cash compensation provided to each corporation’s five most highly compensated executives. Source: Data provided by corporations in response to U.S. Senate Permanent Subcommittee on Investigations survey.

45
Company
Table 4 B Dollar Value of Restricted Stock Awards for Five Most Highly Compensated Executives at Surveyed Corporations
Name Title 2003 2004 2005 2006
Pfizer
Henry McKinnell
Chairman and CEO 0 4,292,181 0 8,315,642
Karen Katen Vice Chairman and President, Pfizer Human Health
326,840 2,326,218 0 4,061,804
David Shedlarz
Vice Chairman 260,866 1,873,326 0 3,255,375
Jeffrey Kindler
Vice Chairman and General Counsel 248,989 792,561 0 2,736,265
John LaMattina
Senior VP; President, Pfizer Global Research and Development
199,303 1,024,154 0 2,235,835
Merck
Richard T. Clark
CEO and President 3,365,000 410,699 1,932,923 2,359,616
Raymond Gilmartin
Chairman of Board, CEO 0 0 0 NA
Judy Lewent Executive Vice President, CFO 0 621,049 398,750 735,135 Peter Kim President, Merck Research
Laboratories 0 1,490,299 2,126,677 1,697,749
Per Wold-Olsen
President, Human Health Intercontinental
0 520,850 0 174,195
Kenneth Frazier
Senior VP and General Counsel 0 911,760 1,629,548 NA
Hewlett Packard
Mark Hurd CEO and President 0 0 8,684,000 4,725,000 Robert Wayman
Executive Vice President, CFO 0 330,150 0 0
Vyomesh Joshi
Executive Vice President, Imaging and Printing Group
0 330,150 4,109,500 1,890,000
Ann Livermore
Executive Vice President, Technology Solutions Group
0 330,150 3,057,000 2,110,500
R. Todd Bradley
Executive Vice President, Personal Systems Group
0 0 2,385,000 NA
Randall Mott Executive Vice President, CIO 0 0 7,102,200 NA Carleton Fiorina
Former Chairman and CEO 0 660,300 0 NA
Michael Winkler
Former Executive Vice President 0 330,150 0 NA
Shane Robison
Executive Vice President and Chief Strategy and Technology Officer
330,150 3,688,500 1,575,000
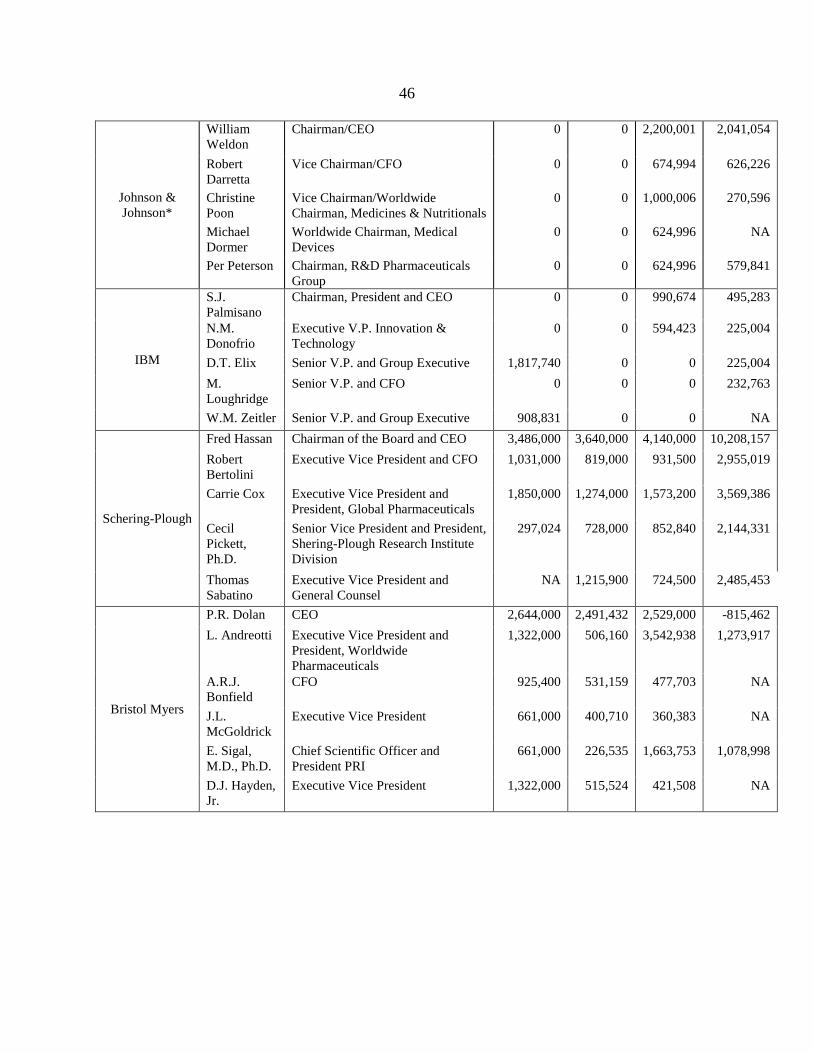
46
Johnson & Johnson*
William Weldon
Chairman/CEO 0 0 2,200,001 2,041,054
Robert Darretta
Vice Chairman/CFO 0 0 674,994 626,226
Christine Poon
Vice Chairman/Worldwide Chairman, Medicines & Nutritionals
0 0 1,000,006 270,596
Michael Dormer
Worldwide Chairman, Medical Devices
0 0 624,996 NA
Per Peterson Chairman, R&D Pharmaceuticals Group
0 0 624,996 579,841
IBM
S.J. Palmisano
Chairman, President and CEO 0 0 990,674 495,283
N.M. Donofrio
Executive V.P. Innovation & Technology
0 0 594,423 225,004
D.T. Elix Senior V.P. and Group Executive 1,817,740 0 0 225,004 M. Loughridge
Senior V.P. and CFO 0 0 0 232,763
W.M. Zeitler Senior V.P. and Group Executive 908,831 0 0 NA
Schering-Plough
Fred Hassan Chairman of the Board and CEO 3,486,000 3,640,000 4,140,000 10,208,157 Robert Bertolini
Executive Vice President and CFO 1,031,000 819,000 931,500 2,955,019
Carrie Cox Executive Vice President and President, Global Pharmaceuticals
1,850,000 1,274,000 1,573,200 3,569,386
Cecil Pickett, Ph.D.
Senior Vice President and President, Shering-Plough Research Institute Division
297,024 728,000 852,840 2,144,331
Thomas Sabatino
Executive Vice President and General Counsel
NA 1,215,900 724,500 2,485,453
Bristol Myers
P.R. Dolan CEO 2,644,000 2,491,432 2,529,000 -815,462 L. Andreotti Executive Vice President and
President, Worldwide Pharmaceuticals
1,322,000 506,160 3,542,938 1,273,917
A.R.J. Bonfield
CFO 925,400 531,159 477,703 NA
J.L. McGoldrick
Executive Vice President 661,000 400,710 360,383 NA
E. Sigal, M.D., Ph.D.
Chief Scientific Officer and President PRI
661,000 226,535 1,663,753 1,078,998
D.J. Hayden, Jr.
Executive Vice President 1,322,000 515,524 421,508 NA
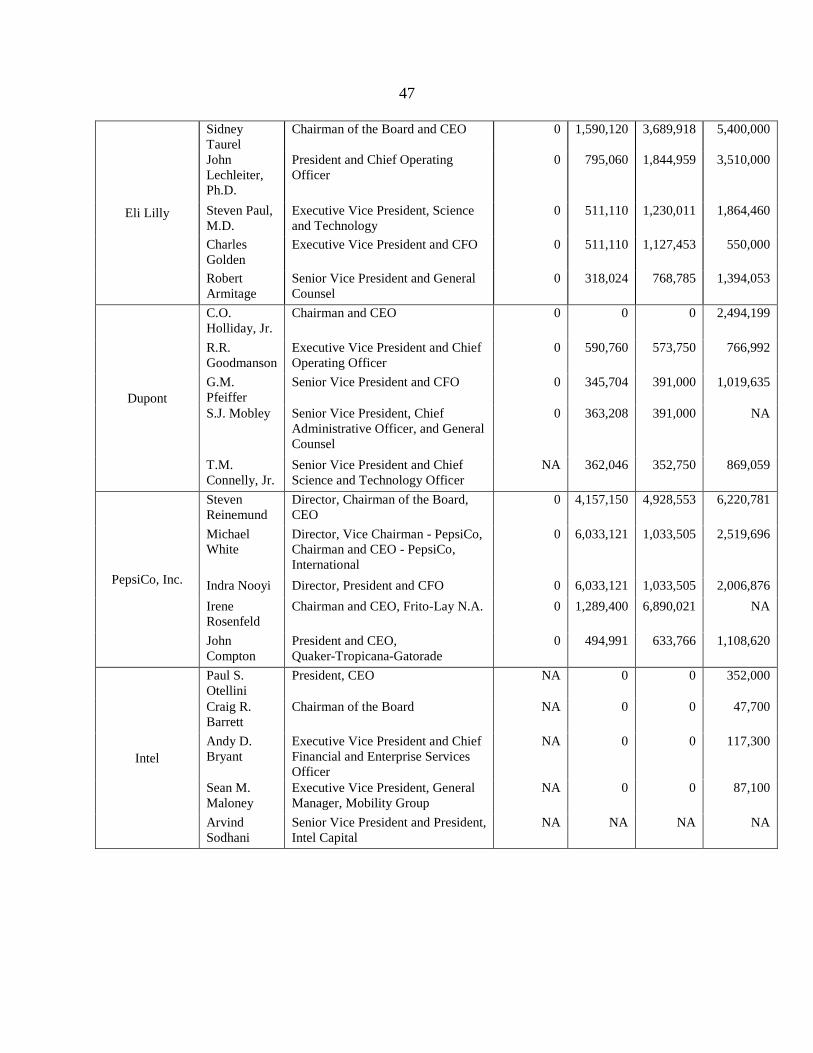
47
Eli Lilly
Sidney Taurel
Chairman of the Board and CEO 0 1,590,120 3,689,918 5,400,000
John Lechleiter, Ph.D.
President and Chief Operating Officer
0 795,060 1,844,959 3,510,000
Steven Paul, M.D.
Executive Vice President, Science and Technology
0 511,110 1,230,011 1,864,460
Charles Golden
Executive Vice President and CFO 0 511,110 1,127,453 550,000
Robert Armitage
Senior Vice President and General Counsel
0 318,024 768,785 1,394,053
Dupont
C.O. Holliday, Jr.
Chairman and CEO 0 0 0 2,494,199
R.R. Goodmanson
Executive Vice President and Chief Operating Officer
0 590,760 573,750 766,992
G.M. Pfeiffer
Senior Vice President and CFO 0 345,704 391,000 1,019,635
S.J. Mobley Senior Vice President, Chief Administrative Officer, and General Counsel
0 363,208 391,000 NA
T.M. Connelly, Jr.
Senior Vice President and Chief Science and Technology Officer
NA 362,046 352,750 869,059
PepsiCo, Inc.
Steven Reinemund
Director, Chairman of the Board, CEO
0 4,157,150 4,928,553 6,220,781
Michael White
Director, Vice Chairman - PepsiCo, Chairman and CEO - PepsiCo, International
0 6,033,121 1,033,505 2,519,696
Indra Nooyi Director, President and CFO 0 6,033,121 1,033,505 2,006,876 Irene Rosenfeld
Chairman and CEO, Frito-Lay N.A. 0 1,289,400 6,890,021 NA
John Compton
President and CEO, Quaker-Tropicana-Gatorade
0 494,991 633,766 1,108,620
Intel
Paul S. Otellini
President, CEO NA 0 0 352,000
Craig R. Barrett
Chairman of the Board NA 0 0 47,700
Andy D. Bryant
Executive Vice President and Chief Financial and Enterprise Services Officer
NA 0 0 117,300
Sean M. Maloney
Executive Vice President, General Manager, Mobility Group
NA 0 0 87,100
Arvind Sodhani
Senior Vice President and President, Intel Capital
NA NA NA NA

48
Coca-Cola**
E. Neville Isdell
Chairman of the Board and CEO NA 6,855,800 0 12,128,912
Gary P. Fayard
Executive Vice President and Chief Financial Officer
0 0 0 2,056,278
Irial Finan Executive Vice President and President, Bottling Investment
NA 0 0 NA
Mary Minnick
Executive Vice President and President, Marketing, Strategy and Innovation
0 0 2,120,000 1,535,033
Jose Octavio Reyes
President, Latin America 0 0 0 1,693,724
Altria
Louis C. Camilleri
Chairman, CEO 12,960,500 6,956,250 7,730,000 9,291,095
Roger K. Deromedi
Chief Executive Officer, Kraft Foods Inc.
2,008,799 6,426,000 4,957,473 NA
Steven C. Parrish
Senior Vice President, Corporate Affairs
1,685,976 2,109,135 1,795,834 2,172,958
Michael E. Szymanczyk
Chairman and Chief Executive Officer, Philip Morris USA Inc.
2,057,017 2,109,135 2,195,320 2,404,649
Charles E. Wall
Senior Vice President and General Counsel, Altria Group, Inc.
1,753,371 2,109,135 2,195,320 2,415,375
Procter & Gamble
A.G. Lafley Chairman, CEO President 0 0 5,000,000 9,320,000 James M. Kilts
Vice Chairman of the Board – Gillette
NA NA 0 2,226,000
Susan E. Arnold
Vice Chairman - P&G Beauty & Health
0 0 0 1,048,000
Bruce L. Byrnes
Vice Chairman of the Board - P&G Household Care
NA NA 0 847,000
Clayton C. Daley, Jr.
Chief Financial Officer 0 0 0 790,000
Robert A. McDonald
Vice Chairman - Global Operations 1,500,000 0 0 1,147,000
Oracle
Lawrence J. Ellison
CEO NA 0 0 0
Safra A. Catz President and Chief Executive Officer
NA 0 0 0
Charles E. Phillips, Jr.
President NA 0 0 0
Keith Block Executive Vice President and North America Sales and Consulting
NA 0 0 0
Sergio Giacoletteo
Executive Vice President Europe, Middle East and Africa Sales and Consulting
NA 0 0 0

49
Honeywell
David M. Cote
Chairman of the Board and Chief Executive
0 0 0 1,440,909
David J. Anderson
Senior Vice President and Chief Executive Officer
4,323,000 0 0 1,207,874
Roger Fradin President and Chief Executive Officer Automation and Control Solutions
0 229,230 1,964,000 687,992
Peter M. Kreindler
Senior Vice President and General Counsel
0 0 0 520,618
Robert J. Gillette
President and Chief Executive Officer Aerospace
0 0 1,710,500 391,000
Microsoft
Steven A. Ballmer
CEO, Director 0 0 0 0
William H. Gates, III
Chairman, Director 0 0 0 0
Kevin R. Johnson
Co-President, Platforms & Services Division; Group Vice President
326,264 0 0 0
Jeffrey S. Raikes
President, Microsoft Business Division; Group Vice President
383,840 0 0 0
Brian Kevin Turner
Chief Operating Officer NA 0 0 8,227,000
* Johnson and Johnson Long Term Compensation Awards reported in Proxy Statements as Restricted Share Units and Options. Figures are Restricted Share Units. ** Coca-Cola reported stock awards in FY2006 to include 2006 awards and portions of awards over several years prior to 2006, so 2006 figures cannot be compared to prior years. Source: SEC Filings.
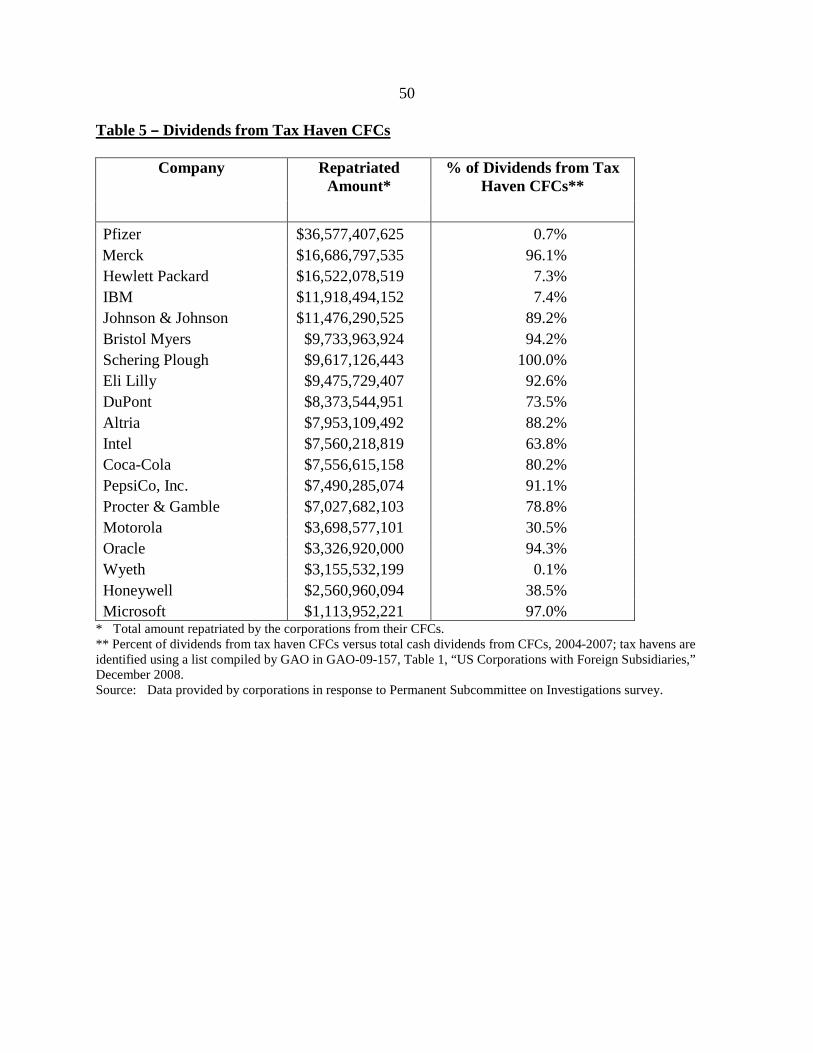
50
Table 5 B Dividends from Tax Haven CFCs
Company Repatriated Amount*
% of Dividends from Tax Haven CFCs**
Pfizer $36,577,407,625 0.7% Merck $16,686,797,535 96.1% Hewlett Packard $16,522,078,519 7.3% IBM $11,918,494,152 7.4% Johnson & Johnson $11,476,290,525 89.2% Bristol Myers $9,733,963,924 94.2% Schering Plough $9,617,126,443 100.0% Eli Lilly $9,475,729,407 92.6% DuPont $8,373,544,951 73.5% Altria $7,953,109,492 88.2% Intel $7,560,218,819 63.8% Coca-Cola $7,556,615,158 80.2% PepsiCo, Inc. $7,490,285,074 91.1% Procter & Gamble $7,027,682,103 78.8% Motorola $3,698,577,101 30.5% Oracle $3,326,920,000 94.3% Wyeth $3,155,532,199 0.1% Honeywell $2,560,960,094 38.5% Microsoft $1,113,952,221 97.0%
* Total amount repatriated by the corporations from their CFCs. ** Percent of dividends from tax haven CFCs versus total cash dividends from CFCs, 2004-2007; tax havens are identified using a list compiled by GAO in GAO-09-157, Table 1, “US Corporations with Foreign Subsidiaries,” December 2008. Source: Data provided by corporations in response to Permanent Subcommittee on Investigations survey.

51
Table 6 B Post-AJCA Accumulated Offshore Funds, 2006-2010
Company Repatriated
Amount* ($000)
Accumulated Undistributed International Earnings** ($000)
2006 2007 2008 2009 2010 Pfizer 35,491,822 41,000 60,000 63,100 42,500 48,200 Merck 15,875,762 12,500 17,200 22,000 31,200 40,400 Hewlett Packard 14,500,000 3,100 7,700 12,900 16,500 21,900 Johnson & Johnson 10,668,701 12,000 24,200 27,700 32,200 37,000 IBM 9,500,000 14,200 18,800 21,900 26,000 31,100 Schering-Plough 9,399,626 4,200 5,800 7,500 na na Bristol Myers 9,000,000 11,300 14,100 15,400 16,500 16,400 Eli Lilly 8,000,000 5,700 8,790 13,310 15,460 19,900 DuPont 7,730,209 7,866 9,644 10,101 11,279 12,631 PepsiCo, Inc. 7,383,801 10,800 14,700 17,100 21,900 26,600 Intel 6,194,933 4,900 6,300 7,500 10,100 11,800 Coca-Cola 6,100,000 7,700 11,900 14,100 19,000 20,800 Altria 6,005,600 11,000 11,000 *** *** *** Procter & Gamble 5,782,722 16,000 17,000 21,000 25,000 30,000 Oracle 3,099,997 *** *** 7,200 8,900 13,000 Motorola 2,760,060 4,000 4,100 2,900 2,400 1,300 Wyeth 2,657,143 9,420 12,060 13,322 na na Honeywell 2,119,308 2,900 4,100 4,700 5,100 6,000 Microsoft 780,000 na 6,100 7,500 18,000 29,500
* Cash dividends that qualified for deduction under Section 965. ** Reported accumulated foreign earnings for years 2006 - 2007 from Lee A. Sheppard and Martin A. Sullivan, AMultinationals Accumulate to Repatriate,@ Tax Notes
*** Data not available.
, January 19, 2009. Reported accumulated foreign earnings for years 2008 - 2010 from public financial filings.
Note: In 2009, Schering-Plough and Wyeth merged with Merck and Pfizer, respectively.

52
Table 7 B Pre-AJCA Accumulated Offshore Funds, 2000-2004
Company Repatriated
Amount* ($000)
Accumulated Undistributed International Earnings** ($000)
2000 2001 2002 2003 2004
Pfizer 35,491,822 14,000 18,000 29,000 38,000 51,600 Merck 15,875,762 9,700 12,400 15,000 18,000 20,100 Hewlett Packard 14,500,000 11,500 13,200 14,500 14,400 15,000 Johnson & Johnson 10,668,701 9,500 12,100 12,300 14,800 18,600 IBM 9,500,000 15,472 16,851 16,631 18,120 19,644 Schering-Plough 9,399,626 6,400 7,600 9,400 11,100 2,200 Bristol Myers 9,000,000 6,000 8,800 9,000 12,600 16,900 Eli Lilly 8,000,000 5,200 6,400 8,000 9,500 2,800 DuPont 7,730,209 8,865 9,106 10,320 13,464 13,865 PepsiCo, Inc. 7,383,801 *** *** 7,500 8,800 1,900 Intel 6,194,933 4,200 5,500 6,300 7,000 7,900 Coca-Cola 6,100,000 3,700 5,900 6,100 8,200 9,800 Altria 6,005,600 4,700 5,600 7,100 8,600 11,800 Procter & Gamble 5,782,722 8,828 9,231 10,698 14,021 16,750 Oracle 3,099,997 851 1,408 2,300 3,100 4,800 Motorola 2,760,060 7,900 7,100 7,600 6,100 5,600 Wyeth 2,657,143 *** *** 6,000 6,435 8,790 Honeywell 2,119,308 2,100 2,000 2,200 3,300 3,900 Microsoft 780,000 *** *** 780 1,640 2,300
* Cash dividends that qualified for deduction under Section 965. ** Source: Lee A. Sheppard and Martin A. Sullivan, AMultinationals Accumulate to Repatriate,@ Tax Notes
*** Data not available.
, January 19, 2009.
Note: In 2009, Schering-Plough and Wyeth merged with Merck and Pfizer, respectively.
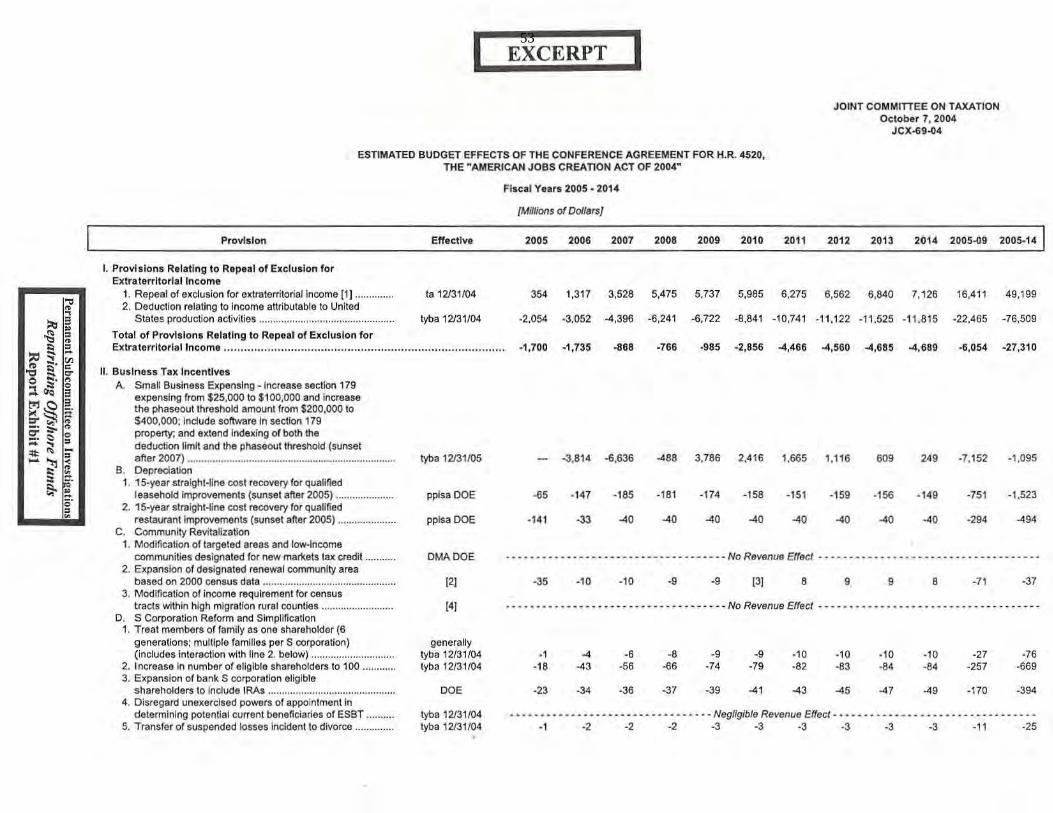
:l' , ·d ~ ;; • • ~ -::0 , '" ~ -. .:
"1:1 e o;r
eo s· g :>.'" 3
~~~ ::r-'S .. -. ,.:. .. .,. -. ::.: ~ ::I ~ (1;0 ;'
- ." < •• ::: =. a-~
§' •
I EXCERPT I JOINT COMMITTEE ON TAXATION
October 1, 2004 JCX-S9.o4
ESTIMATED BUDGET EFFECTS OF THE CONFERENCE AGREEMENT FOR H.R. 4520, THE NAMERtCAN JOBS CREATION ACT OF 2004N
Fiscal V.,", 2005 .2014
Provi llon Effect ive
I. Provi sions Relallng to Repeal of Exclusion for Extraterrlloriallncomo
1. Repeal of exclusion for extraterritorial income [I] .•. la 12131104 2. Deduction relallng to Income attributable to United
States production activities ........................ tybe 12/31104
Total of Provisions Relating to Reptal of Exclusion for Extrllterrltorlal lncoml ........ .. ........... ... ... ........ .... ..... .. ..................... ......... .... .. ..
II. Business TIll. Incenllves A. Small Business Expensing -Increase section 179
expensing from $25.000 to $100,000 and increase the phaseout threshold amount from S200,000 to $400,000; Include software In section 179 property; and extend IndeJtJng of both the deduction limit and the phaseout threshold (sunset after 2007) .................................................................... .
B. Oepreclation 1. 15·year stralght·llne cost recovery for qualifted
leasehold improvement, (sunset after 2005) .................. .. 2. 15-year slralght-~ne cost recovery for qualified
r estaurant improvements (sunset after 2005) ................... . C. Community Revitalixation
1. ModirlCltlon of targeted areas and low-Income communities designated for new marll:ets tax credi t
2. Expansion of designated renewal community area based on 2000 census data .... .. ................ ..
3. Modification of Income requirement for census tracts within high migration ru ral counties ....... .. ... ..
D. S Corporation Reform and Simplification 1. Treat members of family as one shareholder (6
generations; multiple families per S corporation) ( includes Interaction with IIna 2. below)
2. Increase In number of eligible shareholders to 100 .......... .. 3. Expansion of bank S corporation eligible
shareholders to Include IRA ........................ ... .. 4. Disregard unexercised powers of appointment In
determining potential current beneficiaries of ESBT 5. Transfer of suspended tosse, Ir'lcident 10 d ivorce ........
tyba 12131105
ppisa DOE
ppisa DOE
DMADOE
[2]
[4[
generally tyba 12131104 tyba 12131104
DOE
tyba 12131/04 tyba 12131104
{Minions o ( OoIlaf$}
2005 2006 2007 200e 2009 2010 2011 2012 2013 2014 2005-09 2005·14
354 1,317 3,528 5,475 5,737 5,985 6,275 6,562 6,840 7,126 16,411 49,199
-2.054 ·3,052 -4,396 -6,241 -6,722 ·8,841 -10,74 1 -1 1,122 -1 1,525 -11,815 -22.465 -76,509
·1,700 ·1,735 ·868 -766 ·985 ·2,856 -4,466 --4,560 --4,68S --4 ,689 -6,054 ·27,310
·3,814 -6,636 --466 3.766 2.416 1,665 1.116 "" 249 ·7,152 ·1.095
-65 -147 -165 -161 ·174 ·158 -151 -159 -'56 - 149 -751 -1.523
· 141 -33 -40 -40 -40 -40 -40 -40 -40 -40 -294 -494
_. _ ••••••• • ••••••••• _ • •• • • • - - - - - - - - - No Revenue Effect······· _ •• _ •• - _. _. - - - - - - - - - - _ ••• - - --
-35 -10 -10 -, -, [3[ 8 , , 8 -71 -37
- - - - - - _ •• _ ••••• - - _ •••••••••• -. - - - - - - No Revenue Effact • _. - _. - - - - - - - - - - - - - - - - - - - - - - - _. _. - - .
-. -4 -6 -8 -, -, -18 -43 -56 -66 -74 -79
-23 -34 -36 -37 -39 -4.
-10 -10 -10 -82 -83 -84
-43 -45 -47
-10 -27 -84 -257
-4' ·170
-76 ·669
-394
- - _. - - - ••• - _. _. - • - - • _ ••• • • • • • • - - - Negligible Revenue Effect· - - - - - - - - - - - _ ••••• - - - - - - - - - - - - - ---1 ~ ~ ~ ~ ~ ~ -3 ~ ~ -11 ~
53

Provision
IV. Tax Reform and Simplification for United States Businesses
1. Interesl expense allocation I1.lles ..•.•. . 2. Recharacterize overall domestic loss 3. Apply look·through rutes for dividends from
nonoontrolled section 902 oorporations 4. Base diHerences and reduction to 2 fore ign tax
credit baskets ......... . ... ........ .......• 5. Attribution of stock ownership through partnerships
in determining section 902 and 960 credits 6. Foreign. tax credit treatment of deemed payments
under section 367(d) .................... ......................... .. .. 7. United States property not to include certain assets
01 oontrolled foreign oorporations 8. Translation of foreign taxes ....... ......................... ........... . 9. Eliminate seoondary withholding tax with respect to
dividends paid by certain forei9n oorporations 10. Provide equal treatment for interest paid by foreign
partnerships and foreign oorporations doing business in the U.S ............... .
11 . Treatment of cenain dividends of regulated investment oompanies (sunset after 3 years) .... ............... .
12. look·through treatment under subpart F for sales of partnership Interests .... . ....... ...... .. ... .. ...... .
13. Repeal of I1.lles applicable to foreign personal holding oompanies and foreign investment oompanies, personal holding company rules as they apply to foreign oorporations. and include in subpart F personal service oontract income, as defined under the foreign personal holding company rules .....
14. Determination of foreign personal holding company income with respect to transactions in commodities.
15. Modify t reatment of aircraft leasing and shipping income [18] ...................................... ........ .
16. Modification of exceptions under subpart F for active financing income .... . .. .............. .... .. ... ..... ........ .
17. 10-year foreign tax credit canylorward; l·year foreign tax credit carryback
18. Modify F IRPTA I1.lles for REITs . . .. " .. ... ..... . 19. Exclusion of certain horse·racing and dog·racing
gambling winnings from the Income of nonresident alien individuals .... .. ......... . ........... .. . .
20. Reduce withholding tax applicable to dividends paid to Puerto Rico companies to 10% ........... ... .
21 Repeal the 90% limitation on the use of foreign tax credits against the AMT
22_ Incentives to reinvest foreign earnings in the Un~ed States .. ................................... _.
Effective
Iyba 12131108 Iflyba 12131106
Iyba 12131102
[15)
tybaDOE
alaro/a 8/5197
(16) tyba 12131104
pma 12/31104
Iyba 12131/03
(17)
(16)
[16]
teia 12131104
(16)
[16]
(19) tyba DOE
wma DOE
Dpa DOE
Iyba 12131104
[20]
Page 5
2005 2006 2007
-57
-662 -51 -23
-8 -13 ·615
-, -3 -3
-26 -5 -5
-3 -20 -21
2008
·680
-6
·900
-3
-5
-22
2009
·908 ·713
-, -927
-3
-5
-23
2010
-2,487 ·756
[14]
-1.002
-3
-5
-24
2011
-2.586 -793
[14]
-1,039
-3
-5
-25
2012
·2,689 ·829
(14)
·1,078
-3
-5
-27
2013
·2,797 ·862
(14)
-1,119
-3
-5
-29
2014
·2,909 ·895
(14)
·1,161
-3
-5
-31
2005'()9
-908 · 1,450
-743
-2,463
-13
-46
-89
2005·14
·14,376 ·5,585
·743
-7,862
-28
-71
-225 .. _ .. . . _ .. _ .... - _. _ .... _ .. - _. _ .. - Negligible Revenue Effec/ - · · · · _ ••• • ••••• • _ •• _ ••• • • ••• __ • __
-2 -3 -3 -3 -3 -3 -3 -3 -3 -3 -14 -29
-3 -2 -2 -2 -2 -2 -2 -3 -3 -3 -11 -24
-7 -59 -63 -57 ·186 -'86 -39 -91 -96 -101 -'06 ·111 -116 ·122 -129 ·137 -433 -1,048
-25 -65 -73 -81 -91 ·102 -114 ·128 -143 ·162 ·335 -984
-4 -10 -10 -10 -10 -11 -11 -11 -11 -12 -44 -HI.
-33 -172 -98 -75 -76 -88 -98 ·108 -118 ·129 ·454 ·995
.. _ .. _ .... _ .... _ . . _ ... • _. - •• _ . • _. Negligible Revenue Effec/ ··· · _ ........ _ .. _. _ .. _. __ • • - -. _ ••
-349 -2
-, -5
·265
2,788
·271 ·338 ·7 -10
-3 -3
-7 -8
·395 ·376
·2.119 ·1.267
·500 -12
-3
-9
·361
·838
·668 -14
-3
-,. -348
-553
·779 -15
-3
-,. ·338
·379
-857 -17
-3
-11
·329
· 300
-942 -19
-3
-12
·323
·264
·1,036 -21
-3
-13
·319
-192
-1,191 -23
-3
-14
·317
·137
·2,126 -45
-12
-39
·1,745
·1.989
-6,931 -140
-27
-99
-3,371
-3.261
54

(!Congress o( tbe mtniteb ~tates JOINT COMMITIEE ON TAXATION
Wlaooington, lJlQi; 20515-6453
Honorable Lloyd Doggett U.S. House of Representatives 20 I Cannon House Office Building Washington, D.C. 20515
Dear Mr. Doggett:
UPRJS 2011
This is in response to your request of March 23, 2011, for revenue estimates of two proposals to modify section 965 of the Internal Revenue Code ("Code") .
Description of the Proposals and Revenue Estimates
Section 965 provides an elective, temporary, 85-percent dividends-received deduction ("DRD") for certain dividends received by a domestic corporation from controlled foreign corporations, subject to a nwnber of conditions and limitations. Included in these limitations are requirements that eligible dividends are: (1) in excess of a specified level of historical average repatriation; (2) no more than the greater of$500 million or the amount of overseas earnings identified for financial accoWlting purposes as pClTI1anently reinvested earnings ("PRE," which is discussed in detail below); and (3) reinvested in the United States pursuant to a dividend reinvestment plan approved by the management and board of directors of the electing corporation and meeting certain other criteria. An election under section 965 was available only for either the taxpayer's (i) last taxable year beginning before the date of enactment of section 965 (which was October 22, 2004) or (ii) first taxable year beginning during the onc-year period beginning on such date of enactment.
It is assumed that your re~pec-tive proposals would pennit an election under se,ction 965 for the taxpayer's first taxable year beginning after December 31, 2010, with appropriate changes to other dates and provisions necessary to adhere to the intent of section 965. The first proposal retains the 85-percent DRD already in section 965, while the second proposal permits a 70-pereent DRD.!
1 The 85-percent DRD results in a 5.25 percent U.S. tax rate (0.15 multiplied by the top statutory corporate rate of 35 percent) on the entire repatriation before taking account of foreign tax credits and expense disallowance, wbile a 70-percent DRD translates into 10.5 percent U.S. (0.30 muhiplied by the top statutory corporate rate of 35 percent) tax ratc before such items are taken into account.
55
(liongress of tije ~niteb ~tlltes
Honorable Lloyd Doggett U.S. House of Representatives
JOINT COMM ITIEE ON T A XATION
~asf)intJton. ]!ll( 20515-6453
Page 2
We estimate that the respective proposals would change Federal fiscal year budget receipts as follows, assuming that each would be enacted on June 3D, 2011:
FbulVun IBlUlolIt orDoU.n]
!!!!!!. llli 1m 1llll ill! -.!ill -llii '''' lQil .ill! ..mJI ill! llik l§
I. 85 percent 3.4 12.5 9.6 -12.8 -13.S -14.1 -1 4.1 -13 .4 -12.7 -12.2 -1l.7 -14.8 DRD ...
,. 70 percent ORO ... I., 12.9 10.6 -8.S -8.9 ·9.1 -9.0 -8.S -8.0 -7.7 .7.4 -1.1
NOTE: Details do not IIdd totoilis dllC to rounding.
Ex~:Ianation of the R~venue Estimates
Wl.:. 11
-78.7
-41.7
Our revenue estimates of these modifications of section 965 draw from the evidence on usage of section 965 in the 2004·2006 period. as well as evidence from other temporary reductions or holidays in areas such as sales taxation and the taxation of capital gain income.
Each estimate includes three major components. 2 The first and smallest component involves the tax reduction afforded Wlder s~ction 965 for certain dividends that taxpayers are predicted to repatriate in the budget period tmder present law even in the absence of enactment of the proposal.3 For taxpayers that are predicted to be repatriating these dividends in years 2011
2 Details on our estimating approach to the original enactment of section 965 can be fOlllld in Edward D. Kleinbard and Patrick A. Driessen, "A Revenue Estimate Case Study; The Repatriation Holiday Revisited," Tax Notes, September 22, 2008, pp. 1191-1202.
3 Over the last two decades except for the years affected by the enactment of the original section 965, annual dividend repatriations have ranged from $50 to $100 billion, and these repatriations tend to mix with other types of foreign source income, so it is difficult to measure U.S. residual tax on repatriated dividends alone. Because we assume present law for establishing baseline revenues for the purpose of evaluating the revenue effects of each proposal, it is assumed that the provisions in the Code permitting the deferral of earnings from certain financial activities under sections 953 and 954 of the Code, and the "look through" of cenain payments between related panies for the purpose of detcnnining eligibility for deferral under seerion 954(c) (6). are not extended past their expiration dates in 2012.
56
(!Congress of tbe 'miniteil $tates
Honorable Lloyd Doggett U.S. House of Representatives
J OINT COM MITTEE ON TAXATIO N
~ •• ~ innt'n , IDe( 205\5- 6453
Page 3
and 2012 notwithstanding the proposals, the extent to which taxpayers elect section 965 is a U.S. tax "windfall" for them that reduces U.S. tax receipts.
The second major component of each estimate captures the U.S . tax effects associated with taxpayers changing their dividend repatriation amowlts andlor timing in response to each proposal. Taxpayers would accelerate the repatriation of dividends to qUalifY for section 965: some of these dividends would be accelerated from within the budget period," say from 2013 or 2015 into 2011, and other accelerated dividends qualifying for section 965 would not otherwise be repatriated in the budget period (nor perhaps for many years after that). There are several ways that these altered dividend payments affect U.S. tax receipts. First, dividends qualifying for section 965 would be 85-percent (or 70-percent) exempt, with foreign tax credits still permitted for the non-exempt portion. For example, a taxpayer may pay $4 of U.S. tax under the 85-percent DRD proposal or alternatively $8 of U.S. tax under the 70-percent DRD proposal (after accounting in each case for foreign tax credit and any expense disallowance required by section 965) on a $100 dividend in 2011 that, absent qualifying for section 965, would not have been repatriated in the 2011-2021 period.s Second, any dividend that is accelerated to qualify for section 965, but which would have otherwise been repatriated later in the budget period after section 965 expires, would avoid poteI?-tial residual U.S. tax that would have been paid in the
~ Dividend payments from CFCs to related U.S. persons could also be delayed if there is a legislative window Jeading to an announcement effect that pennits taxpayers to delay repatriation to maximize exemption under section 965.
, After the enactment of section 965 in 2004, there was interest in, and some confusion about, the U.S. tax receipts associated with the dividends qualifying for section 965. The 85-percent DRD enacted in 2004 translated into a 5.25 percent nominal U.S. tax rate on qualifying dividends. However, foreign tax credits are permitted against the nonexempt portion of qualifying dividends, and there may be some expense disallowance requiring the denial of certain domestic tax deductions. The data presented by Melissa Redmiles, "The One-Time Received Dividend Deduction," IRS Statistjcs of Income Bulletjn, 27:4 (Spring 2008), pp.1 02-14, suggests that the applicable residual U.S. tax rate, or initial "toll charge," on all qualifying dividends after accounting for these other factors was somewhat below four percent. As suggested above, this toll charge is just one part of the estimate, because the source of the qualifying dividends has to be accounted for along with the change in potential tax receipts associated with the projected present law counterfactual activity as described below, and other taxpayer behavior that is not captured by the acceleration of repatriated dividends to quality for section 965 must be accounted for.
57

i!ongreS'li of tbe mnitell $tateli
Honorable Lloyd Doggett U.S. House of Representatives
JOINT COMMITIEE ON TAXATION
l!!II .. ~ington. l!ll( 20515-6453
Page 4
absence of section 965. 6 For example. a $1 00 dividend that would have been repatriated under present law in 2013, and would have resulted in a $25 U.S. residual tax at that time, would now instead incur $4 in U.s. tax under"the 8S-percent DRD proposal as it qualifies for section 965 in 2011. In addition, the uses by U.S. firms of the dividend payments that were induced or accelerated by section 965 would change the U.s. tax base. For example, a company may increase its dividend as a result of section 965, and as a result shareholders may be liable for additional individual taxes.7
The final component of the estimates takes account of bow each proposal would affect the prospective decisions of taxpayers about where to locate investment and/or income. As discussed below, ease of repatriation is one consideration in such decisions, and enactment of section 965 would be regarded by some taxpayers as altering the existing geographic location incentives. If firms anticipate that future repatriation of foreign earnings to meet such needs could occur with little U.S. residual taxation, finns would be less constrained in their location decisions, and that behavioral effect of section 965 also is accounted for in the revenue estimates of your proposals.8
To swnmarize, the revenue estimates consider the U.S. tax implications of how each proposal: (1) affects repatriations that will occur under present law with no assumed change in amount or timing; (2) causes the acceleration of repatriated dividends from both outside and inside the 2011 -2021 budget period in order to qualify for section 965; (3) affects the recognition
6 As we discuss below, we expect that these rep'atriations will increase under the present law baseline during the fIScal year 2011-2021 period because of the tension between domestic needs and the growing stock of deferred overseas income.
7 These tax base effects owing to the uses of repatriated funds depend upon whether funds would not have been repatriated in the budget period without section 965, as, for example, these tax base effects can be accelerated in thc same ways that repatriated dividends can be accelerated. In addition, shareholders who receive an increased dividend, or have their stock repurchased, have discretion in managing their portfolios to achieve their own cash and investment needs. For example, an investor whose shares are bought back by Company A duc to section 965 activity may respond by not selling his equity shares in Company 8 as he would have before Company A's share repurchase. In addition, it is difficuh to dctcnninc what share repurchases or dividend increases would happen in the absence of section 965, as some companies would proceed with these activities by finding funding elsewhere.
$ The tenn "location preference" is used broadly here to indicate opportunities that a finn has to generate foreignsource income, and as such the term is not restricted to the conventional notion of brick-and-mortar invesnnent.
58
Q[on{Irrss of tue llinitrb $tiltes
Honorable Lloyd Doggett U.S. House of Representatives
JOINT COMM lTIEE ON TAXATION
MIils~iltgton J D« 205l5- 6453
Page 5
for U.S. tax pwposes of certain types of income as a result of projections of how companies will use qualified repatriations; and (4) changes the prospective investment and income location decisions by companies.
In preparing these estimates, we have examined the last two decades' tax, accounting, and other economic data with respect to investment location decisions of U.S.-based multinationals, deferral of foreign somec income, and financial reporting decisions. The trend towards overseas location of highly profitable investment (some of it associated with the transfer or development of intangibles) continues,9 as does the deferral and accwnulation of foreign earnings (with the exception of the short-tenn drawdoml of that accumulation caused by the enactment of section 965 in 2004). Some of this high overseas profitability is related to overseas marketing and production opportunities aimed at sales to third parties located overseas which is part ofa secular movement that has been underway for many decades,lo while some of it can be linked to U.S.-based activities such as research and development or third-party demand in the U.S. market.
It is clear that companies have some latitude with respect to prospective location decisions. Changes over the last two decades in Treasury Departtnent regulations (some favorable to overseas investment, e.g., the check-the-box regulations in the 1990s, and some at least potentially restrictive on overseas investment, such as the recent cost sharing regulations addressing transfer pricing methodologies and the subpart F contract manufacturing regulations)ll and the Code (e.g., the subpart F exception for active financing income which has been available over the last 15 years, and the provision in the Tax Increase Prevention Act of 2005 that allows taxpayers to avoid generating subpart F income from payments between related parties, known as the "CFC look through'') have on balance facilitated the deferral of foreign
9 For details about business structures that may facilitate income shifting or the deficiencies in the application of transfer-pricing rules, sec Joint Committee on Taxation, Present Law and Background Related to Possible Income Shifting and Transfer Pricing (JCX-37-\ 0), July 20, 2010.
10 For example, Mihir A. Desai and James R Hines Jr., "Old Rules and New Realities: Corporate Tax Policy in a Global Setting," National Tax Journal, LVII:4, (December, 2004), show the globalization over time of U.S. corporate profits in Figure I, page 939.
11 While the Treasury Department has modified both its cost sharing and contract manufacturing regulations in recent years, we assume that taxpayers retmUD able to engage in planning to reduce their current income tax. liability.
59
!!Congress of tbe ~niteb $tatcs
Honorable Lloyd Doggett U.S. House of Representatives
JOINT COMMITTEE ON TAXATION
i!mIa51) ington, lJ)1!: 20515- 6453
Page 6
source income and reduction in the foreign taxes paid on such income. Potential U.S. residual taxation, while no doubt inhibiting the repatriation of the stock of deferred overseas earnings, also affects the prospective location decisions affirms to the extent that fums anticipate the need for repatriation of foreign earnings, as the investment location decision is linked to the repatriation decision.
Figure 1 summarizes the recent growth in deferral as context for evaluating the effects of your proposals. While the usc of deferral has grown, companies continue to repatriate some dividends and as a result pay some residual U.S. tax in response to finn- or industry-specific cxigcncies. 12 There is continuing demand fo r repatriation as the enactment of section 965 and subsequent interest in renewing section 965 have demonstrated. We expect repatriations to rise in the 2011 -2021 budget period under present law as a result of the tension between domestic needs and the growth in the stock of deferred income.
12 In recent years not affected by the original enactment of section 965, annual dividend repatriations have ranged from $50 to S100 billion. The Government Accountability Office, U.S. Multinational Corporations: Effective Tax Rates are Co"e/ated with Where Income Is Reported, GA0-08·950. (August 2008), found that the residual U.S. tax rate on all foreign source income, of which dividend repatriation comprises under 25 percent, was about four percent. This aggregate average tax rate (which significantly is affected, for example, by "crosscrediting", which is the netting of foreign taxes against fore ign income across all foreign countries as pennitted by the Code in certain circumstances), likely understates the potential U.S. tax collectible on marginal repatriations (which. for example, are less likely to be shielded from U.S. tax by cross-crediting).
60

I/tOl1~reSli of tue 'QIll1iteb ~tate!O
Honorable Lloyd Doggett U.S. House of Representatives
JOINT COMM ITTEE ON TAXATION
Wla.ij mgtan, Jl)C( 20515-6453
Page 7
Figure 1. Deferral as Share of u.S. Corporate Worldwide Income*
Deferral %
25.00% ,----------------
20.00%
15.00%
5.00% ------------ "
0.00%
1994 1996 1998 2000 2002 2004 2006
.. Source: Statistics of Income Division, IRS. This is a flow concept, showing the relative amount of corpomte income deferred every two years from 1994 to 2006. Worldwide income is defIned as total receipts minus deductions, plus constructive taxable income received from related foreign corporations, plus CFC deferred income. CFC data before 2004 included above was from a restricted sample based on U.S. parent size. CFC data is for CFCs with net earnings and profits, and is before foreign (and U.S.) tax. Corporate income includes all U.S. subchapter C corporations with net income, before tax. There may be some time lag between the CFC and U.S. corporate income data because of fiscal year reporting differences.
61

Qtongress of t1)C mnitelJ $tates
Honorable Lloyd Doggett U.S. House of Representatives
JOINT COMM ITTEE ON TAXATION
m a!lbington. till!: 205\5-<1453
Page 8
Patterns in financial reporting also provide context for the revenue estimates, both technically (as a designation of permanently reinvested earnings, or PRE, is one way to qualify for exemption under section 965) and as a complement to the U.S. tax base changes presented above. A PRE designation is a book accounting assertion by a taxpayer that it will not be repatriating certain earnings back to the United States in the foreseeable future. This assertion often causes earnings for financial reporting to be larger than otherwise would be the case because after a PRE designation the taxpayer is not required to record the estimated U.S. tax charge that would accompany repatriation to the United States. A disadvantage for companies of a PRE designation is that it makes repatriation of the designated funds more difficult. The difficulty arises because a company that reverses a PRE designation reports to its shareholders a tax change reducing current year reported net income. (There is no commensurate reported increase in reported income because the company previously reported such income to its shareholders). Such a reversal may attract regulator and investor scrutiny. I ) While this accounting treatment creates a difficulty for the company's management, it does not make repatriation impossible. A taxpayer can override a designation under certain circumstances.14
Taxpayers also have some flexibility in making PRE designations: for example, previous PRE designations do not restrict taxpayers' prospective choices about whether to repatriate or reinvest earnings generated in the future.
11 Because a company's auditor, in compliance with the U.S. Generally Accepted ACCOWlting Principles ("GAAP"), is required to evaluate evidence compiled by management (as well as any other relevant evidence) regarding management's PRE assertion at each balance sheet date, a history of frequent PRE reversals may be considered negative evidence, thus hindering the auditor's approval of any future PRE assertions made by management with respect to its audited financial statements. Moreover, such frequent reversals of PRE assert ions could invite scrutiny from the Securities and Exchange Commission ("SEC") because such reversals could be perceived as an attempt by management to manipulate its U.S. GAAP earnings through the income tax expense line item in its profit and loss statement. The result of such SEC scrutiny may be the issuance of an SEC comment letter, the required restatement of the company's fmancials, or other possible sanction.
14 For example, in 2009 Pfizer reversed its PRE assertion with respect to $34 billion in earnings that it intended to repatriate as part of its acquisition of Wyeth ($20.6 billion of the funds had been so designated by Pfizer and approximately $13 .3 billion by Wyeth), according to Pfizer's filing ofFonn 8·K on October 21, 2009, and Wyeth's filing of its 2008 Form 100K on February 27, 2009. Although Wyeth disclosed that the residual U.S. tax on Wyeth's historic PRE was $2.7 billion or 20.3 percent ($2.7 billion divided by $13.3 billion), no similar level of detail was available with respect to Pfizer's historic PRE. If one were to make the simplifying assumption that the U.S. residual tax rate was 20.3 percent on all $34 billion of the PRE designation that was reversed in this case, the accounting tax charge reflecting this PRE reversal would have been approximately $6.8 billion.
62
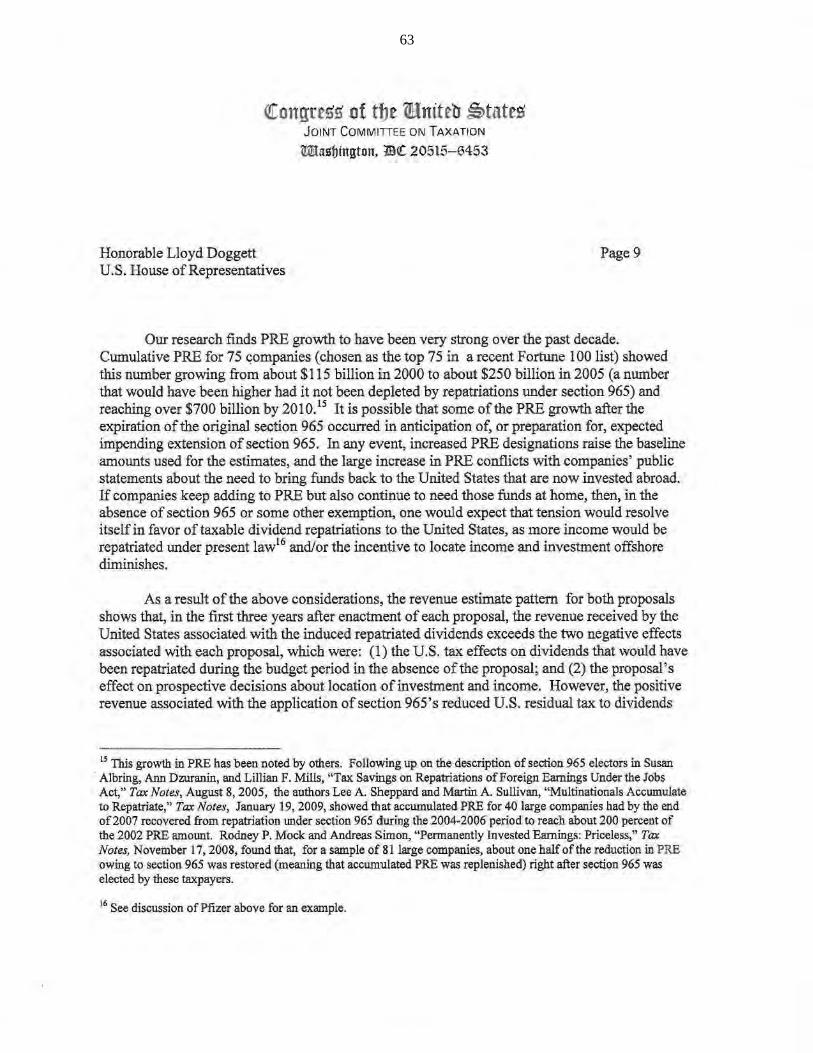
(lCongrc5li of tbe ~nitelJ j)tateli
Honorable Lloyd Doggett U.S. House of Representatives
JOINT COMM ITTEE ON TAXATION
M1"~ington. l!!ll[ 20515-6453
Page 9
Our research finds PRE growth to have been very strong over the past decade. Cumulative PRE for 75 c;ompanies (chosen as the top 75 in a recent Fortune 100 list) showed this number growing from about $115 billion in 2000 to about $250 billion in 2005 (a number that would have been higher had it not been depleted by repatriations under section 965) and reaching over $700 billion by 2010.15 It is possible that some of the PRE growth after the expiration of the original section 965 occurred in anticipation of, or preparation for, expected impending extension of section 965. In any event, increased PRE designations raise the baseline amounts used for the estimates, and the large increase in PRE conflicts with companies' public statements about the need to bring funds back to the United States that are now invested abroad. If companies keep adding to PRE but also continue to need those funds at home, then, in the absence of section 965 or some other exemption, one would expect that tension would resolve itself in favor of taxable dividend repatriations to the United States, as more income would be repatriated under present lawl6 and/or the incentive to locate income and investment offshore diminishes.
As a result of the above considerations, the revenue estimate pattern for both proposals shows that, in the first three years after enactment of each proposal, the revenue received by the United States associated with the induced repatriated dividends exceeds the two negative effects associated with each proposal, which were: (1) the U.S. tax effects on dividends that would have been repatriated during the budget period in the absence ofthc proposal; and (2) the proposal's effect on prospective decisions about location of investment and income. However, the positive revenue associated with the application of section 965's reduced U.S. residual tax to dividends
15 This growth in PRE has been noted by others. Following up on the description of section 965 electors in Susan . Albring, Ann Dzuranin, and Lillian F. Mills, "Tax Savings on Repatriations of Foreign Earnings Under the Jobs
Act," Tax Notes, August 8, 2005, the authors Lee A. Sheppard and Martin A. Sullivan, "Multinationals Accumulate to Repatriate," Tax Notes, January 19,2009, showed that accumulated PRE for 40 large companies had by the end of2007 recovered from repatriation tmder section 965 during the 2004·2006 period to reach about 200 percent of the 2002 PRE amount. Rodney P. Mock and Andreas Simon, "Pennanently Invested Earnings: Priceless," Tax Notes, November 17, 2008, found that, for a sample of 81 large companies, about one halfofthe reduction in PRE owing to section 965 was restored (meaning that accwnulated PRE was replenished) right after section 965 was elected by these taxpayers.
l6 See discussion of Pfizer above for an example.
63

(
ilCongre55 of tue Wniteb ~tllte5
Honorable Lloyd Doggett U.S. House of Representatives
JOINT COM MITT£E ON TAXATION
iroJaSf] ington. me 205 t5- G453
Page 11
pennanent, feature of the Code. The foregoing aspects of your section 965 proposals would create a quasi-dividend-exemption elective system that would reside within the worldwide approach to taxation generally embodied in the present-law Code.
It is also important to consider some of the macroeconomic/stimulus issues related to extension of section 965. One would expect some positive U.S. tax base effects from the potential repatriation of about $700 billion for the 85-percent DRD proposal (of which about $200 billion is asswned by us to be accelerated repatriation that would have occurred in any case during the budget period 1ll1der present law), or $325 billion in the case afthe 70-percent DRD proposal (of which about $125 billion is assumed by us to be accelerated repatriation that would have occurred in any case during the budget period under present law),2o that we anticipate for these reenactments of section 965 (coming after the $300 billion of qualified repatriation for the original enactment of section 965), even if the dividend reinvestment stipulation in section 965 does not restrict taxpayers very much. Indeed, as noted above, we have included some tax base effects reflecting the usage of qualified repatriations under your proposals. However, at least thus far, the research has shown little macroeconomic benefit from the original enactment of section 965; this may be due to the difficulty in measuring these effects, or it may be due to how the repatriated funds were used, or it may be that a $300 billion repatriation barely registered in a U.S. economy with more than $10 trillion in 2005 of Gross National Product ($15 trillion in 2011). Aside from the general issue of measuring the initial impact of section 965 with respect to these effects, it is also necessary to recognize that, while section 965 facilitates the return of the stock of deferred earnings to the United States, prospectively it also encourages investment andlor earnings to be located overseas, and thus enactment of a stand-alone section 965 may curtail one distortion (repatriation) while enhancing another distortion (investment and earnings location). As a result, it would be necessary to look at the long-term macroeconomic aspects of each proposal and not just the early effects associated with the initial repatriation influx.
We note three interconnected factors that cause these estimates to differ from prior estimates of similar proposals (with the most recent estimate, from early 2009, of -$28.6 billion
20 This $200 billion for the 85-perceot DRD proposal and the respective $125 billion for the 70-percent DRD proposal include some dividends that we assume would be repatriated under present law in the 2011·2021 budget period without any direct connection to a PRE reversal, and some dividends that we assume would be associated with PRE reversals we anticipate WIder present law in the 2011 -2021 budget period.
65
!!Congress of tbe lliniteb ~tate!i
Honorable Lioyd Doggett U.S. House of Representatives
JOINT COMMITIEE ON TAXATION
m ,<1)ington. l!l( 20515-6453
Page 12
for the fiscal year 2009-2019 period for an 85-percent DRD proposal)?l First, as noted above, PRE designations are reported to have increased significantly, particularly in the past few years. Second, the macroeconomic assumptions on which we base our estimates have improved as the recent recession has abated, and this added projected corporate profit growth has raised the baseline projections of domestic and foreign earnings and investment that would be affected by a reenacttnent of section 965. Third, evidence of PRE reversal suggests that it is not unrealistic to assume that, under present law, some companies may be compelled to access profits in the United States either by repatriation or by changing prospective location ofincome-genemting activity to the United States.
Finally, it may be helpful if we consider the interaction of proposals like yours with some broader tax reform ideas. As noted above, it is our view that eaeh of your stand-alone proposals creates a system within a system, contributing to the overall negative revenue results presented above. This systemic conflict would be absent from a broader refonn proposal that might be coupled with something conceptually like section 965 (but perhaps mandatory and with more than minimal expense disallowance) as transition in a major overhaul of how the Code treats foreign source income. As a result, the revenue estimate for something like section 965 that is enacted as part of a broader reform likely is different from the revenue results presented above for two proposals for a stand-alone section 965.22
11 Statement by Senator Carl Levin, Congressional Record-Senate, February 3, 2009, page S1413 .
11 1f a broad reform is acc.ompanied by an elective version of section 965, the character of the reform will affect the incentive for taxpayers to repatriate accumulated deferred earnings at the time of transition to the new system. For example, both a dividend exemption reform, and a refonn that retains present law while repealing deferral, likely would, for different reasons, reduce the incentive of taxpayers to elect section 965 as compared to the stand-alone 965 that you proposed above. A territorial regime would reduce this incentive because taxpayers would anticipate the future stream of dividends that could be repatriated without U.S. taxation (and perhaps linle or 00 denial of a tax deduction for dcmestic expenses linked to the prospective dividends) under a territorial regime, so there might be less need by companies to repatriate the accwnulated stock of earnings deferred under the present law worldwide regime which is to be replaced by the territorial regime. 00 the other hand, a reform that amends present law by repealing deferral also would permit taxpayers to repatriate, at no additional U.S. tax cost, prospective earnings that would already have been taxed by the United States as earned, and such repatriation of prospective earnings would, unlike repatriation under something like your proposals for a stand-alone section 965 with an 85-percent or 70-percent DRD as an increment to present law, incur no additional U.S. tax as repatriation of prospective earnings would by defmition be considered by the United States to be previously taxed income.
66

IU ,H COHC','IUI5.,Sl Sl~
"OO~ .... vr c ..... lltOOOfi,O.!I
O ..... w,ij
W""Y'''.''dn ew ... ~ .... ~_JIII_'f~ ~""oCl'·.U ,n"" _.'-'f "I ... WI.~ .. II_ .. t "lw"tJ'.
\/1("' 'lIMlMUI ""'''0 IilDClUfI .... r nN, '"":i, ..... _. .tlll GoNIIIolI _,,, ..... _ ..
_"''''11"'''''_ 0110 ..... ~1I1Y If:NIA
€ongrel!l! of tfJe ijlniteb ~tatel! J OINl CQt.1M1nu ON TAXATION
1625 LONCiV'lOR11I HQUS[ OF'1Ct BUILDING
WMO'IOIGI(.ltl, DC 20515-6453
(202) 225-3621
Honorable Lloyd Doggett Page 13 U.S. '-louse of Representatives
TlIOUAS A IW\TNOtD c>Ut'(II SI ....
IIIJI •• ...,.O .. SCHIoIlH ot:I\IIyo...OIS1Mr
r hope this infonnation is helpful to you. Ifwe can be of further assistance in this matter, please let me know.
Thomas A. Barthold
67

Excerpt from Cisco System, Inc. Response To
Permanent Subcommittee on Investigations Survey (2/18/09)
However, Cisco filed an amended return with the IRS for FY06 that reduces the section 965 dividends received deduction to zero. The reason for the reduction was to reflect agreed IRS audit adjustments from a prior IRS audit c.ycle (concluded subsequent to Cisco's filing of its original FY06 tax return) which had the effect of re·characterizing Cisco's FY06 $1 .2 billion extraordinary CFC dividend as a distribution of previously taxed income under section 959(a)(1).
Redacted By The Permanent Subcommittee
on Investigations
Repatriating Offshore Funds Exbibit #2
68

Excerpt from Altria Group, Inc. Response To
Permanent Subcommittee on Investigations Survey (2118/10)
Redacted By The Permanent Subcommittee _
on Investigations
OUf data does not demonstrate that the repatriation resulted in a net increase in Altria Group's U.S. jobs or U.s. R&D expenditures. See Attachments 6 and 7 for the employment and R&D data. The reduction in the number of employees during this period is largely attributable to the spin~offs of Kraft and PMI.
Permanent Subcommittee on Investigations
Repatriating O/flo/tore Funds Report Exhibit #3
69

Excerpt from Microsoft Corporation Response To
Permanent Subcommittee on Investigations Survey (2/18109)
Redacted By The Permanent Subcommittee
on
17. Please provide any available data demonstrating how your corporation's amounts repatriated
under section 965 have yielded a net increase in your corporation's U.5. jobs or a net increase in
your corporation's U.S. research and development expenditures.
Response:
We repatriated $780,000,000 in the fiscal year ended June 30, 2006. The number of employees
in the U.s. increased by 5,994, 3,561 and 5,507 in the fiscal years ended June 30, 2006, June 30, 2007
2008 on research and development increased by
in the fiscal years ended June 30, 2006, June 30, 2007
and June 30, 2008 respectively. The increases in U.S. employees and research and development
spending during this time period were partly attributable to amounts repatriated under Section 965.
Redacted By The Permanent Subcommittee
on
Repatriating Offshore Funds Exhibi t #4
s
70

MICROSOFT CORPORATION
FY06 DOMESTIC REINVESTMENT PLAN
ARTICLE I ESTABLISHMENT AND PURPOSE
The Microsoft Corporation FY06 Domestic Reinvestment Plan provides for the reinvestment of an amount t:ljual to Cash Dividends (as defined below) received by members of the Microsoft Group during taxable year cnded June 30, 2006 from Controlled Foreign Corporations with respect to which one or more members of the Microsoft Group is a United States Shareholder, and constitutes a domestic reinvestment plan within the meaning of Sect ion 965(b)(4) of the Code.
ARTICLE II DEFINITIONS AND CONSTRUCTION
Section 2.1. Definitions. The following words and phrases used in this Plan shallllave the respective meanings set forth below, unless the context clearly indicates to the contrary:
"Bourd J) means the Board of Directors of Microsoft Corporation, the parent
company of the Microsoft Group.
"Colle" means the Intcl11al Revenue Code of 1986, as amended.
"CoJItrolled Foreign COJporatioll" means a controlled foreign corporation within the meaning of Section 957 of the Code with respect to which one or more members of the Microsoft Group is a United States Shareholder (as defined below).
"Cash Dividellds" means qualifying eash distributions from Controlled Foreign Corporations to United States Shareholders, as defined under Section 965 of the Code and Notices 2005~ I 0, 2005~38, and 2005~64.
"Effective Dale" means the date 011 \vhich this Plan is approved by (hI.: chid C;(CClllivl.: officI.:\' of ~[jcroson Corporation.
"Mic/'(Jso!t"l1lcans ~1icroson C'OIlloration. OJ State of\Vashington corporation.
- I -
71

"lrlicrosojt GI'OIlP" means the affiliated group of includible corporations filing a consolidated federal income tax return of which Microsoft Corporation is the common parent, within the meaning ofSectiolls 1501 and 1504 of the Code.
"Plan 11 means the Microsoft Corporation FY06 Domestic Reinvestment Plan.
"United States Shm'eholder" means a United States shareholder, within the meaning of Section 951(b) afthe Code. that is a member of the Microsoft Group.
Section 2.2 Construction. Unless the context othetwise requires, as used in this Plan i) "or" is not exclusive; ii) "including" means "'including, without limitation"; iii) words in the singular include the plural and words in the plural inch.1de the singular; iv) the descriptive headings contained in this Plan arc included · for convenience of reference only; v) all references to amounts of money arc to United States Dollars; and vi) any provision hereof that refers to or incorporates a provision or concept of Section 965 of thc Code shall be interpreted consistently and in eonfomlity with Section 965 of the Code (including Notices 2005-10. 2005-38, and 2005-64, as wel1 as any subsequent regulations or other guidance issued under Section 965 of the Code).
ARTICLE III APPLICATION OF BENEFITS AND CASH DIVIDEND LIMITATION
Section 3.1 Application of Benefits. Microsoft intends to apply the benefits of Section 965 of the Code with respect to $780.000.000 of Cash Dividends distributed ITom the Controlled Foreign Corporations for the taxable year ended June 30, 2006.
Section 3.2 Cash Dividend Limitation. The amount shown on Microsoft's certified financial statements for the taxable year ended June 30, 2002 as earnings pennancntly reinvested outside the United States is $780,000,000. Microsoft's June 3D, 2002 financial statement is the "applicable financial statement," within the meaning of Section 965(b){I) and (c)(I) of the Code, to which thc Cash Dividend Limitation applies .
Section 3.3 Other Distributions. To ensure that the benefits of Section 965 of the Code apply to the entire $780,000,000 of Cash Dividends paid by the Controlled F.oreign Corporations, such corporations will make additional distributions related to: 0) their respective amounts of previollsly taxed ea11lings as defined in Section 959(a.) of lhe Code; and (ii) the base period amount as defined in Section 965(b)(2)(B) of the Code.
ARTICLE IV RECEIPT OF CASH DIVIDENDS
Section 4.1. Payment. After the Effective Date and during the remainder of ts:-wblc year ended June 30, 2006, Microsoft anticipates that it (or other United States
72

.~-------- - -_. - --
Shareholders that are subsidiaries of Microsoft) will receive $780,000,000 of Cash Dividends from the Controlled Foreign Corporations in one or more installments, and that such Cash Dividends will qualify lmder Section 965 of the Code. As required by Notices 2005-10, 2005-38, and 2005-64, dividends paid by a Controlled Foreign Corporation 10 an entity that is disregarded as separate from its owner for federal income tax purposes will be received in cash in taxable year FY06 by the United States Shareholder from the disregarded entity, Clnd there wi!l be no legal obligation for the United States Shareholder to repay the cnsh to the disregarded entity. Microsoft intends (0 reinvest an amount equal to the Cash Dividends in the United States in a manner consistent with the principles set fOl1h under Section 965 of the Code and Notices 2005· 10, 2005-38 and 2005-64.
ARTICLE V REINVESTMENT OF CASH DIVIDENDS
Section 5.1 Plan Objectives. Microsoft currently opcrates seven primary business groups: Client, Servcl' and Toois, Infonnation Worker, Mobile and Embedded. MSN, Home and Entcl1ainmcnt, and Microsoft Business Solutions. The busincss groups are organized in three operating divisions. The company has historically sought to develop innovative and superior computer software tcclmoiogy for a broad range of sofiware applications, including server technology, personal computer operating systems, document management technology. internet services and applications, and !lome entertainment technology. To sustain Microsoft's growth and maintain its success, Microsoft must continue to invest in the deVelopment of lhe next generation of software applications. Consistent with its plan to grow the business and increase profitability within the United States, Microsoft intends to reinvest an amount equal to $780,000.000 on permissible expenditures within the United States as prescribed by Section 965 of the Code, the legislative guidance thereunder, and Notices 2005-10, 2005-38 and 2005·64. Microsoft will reinvest an amount equal to the Cash Dividends in the Principnl Investments detailed below in Section 5.2, and if necessary. in the Alternative Investments detailed below in Section 5.3, of this Plan. Microsoft will not reinvest the Cash Dividends on any Prohibited Expenditures described in Article VI of this Plan.
Secti on 5.2 Principal U.S. Investments. In accordance with the requi rements of Section 965(b)(4)(B) of the Code and Notices 2005-10, 2005-38, and 2005-64, the Microsoft Group intends to invest $780,000,000, in cash, on various research and development projects. The amounts invested in research and development projects shall include expenditures that qualify as "research and experimental expenditures," ilS defined under Section 174 of the Code, and underlying Treasury Regulation Sl.:Ction 1.174-2. These cxpenditun.:s will include: (i) employees' compensation. in the form of saiClrit.:S, wngcs. llnd bonuses. and (ii) cmployec.'S' bent:fits. in lht: fornl of health and wdfure benefits. and funding of qualified plan within the meaning of Section 401{a) ofthc Code (in nmOllnts in excess of the minimum rundiug obligation), accrued for the taxnble 'y~ars dl!Seribcd under subparagraph (b) of Scction 5.2. The research and development projects
- 3 -
73

covered by this Ptan have been or will be undertakcn within the United States at Microsoftls research and development racilities located in Redmond. Washington.
(a) Description of Research nnd Development Projects. The research and development projects covered by this Plan undertaken by the Microsoft Group within its facilities located in Redmond, Washington, are: Client. Server and Tools, Infonnation Worker, Mobile and Embedded, MSN, Home and Entertainment, and Microsoft Business Solutions.
(b) Timing of Principal U.S. Investments. The Microsoft Group intends to invest the amollnt described in Section 5'.2 within the current taxable year ended June 3D, 2006. To the extent that a totaJ amount equa! to $780,000,000 has not been invested as described in Section 5.2. within tile CUrTent taxable year ended June 30, 2006, any remaining amounts will bc invested in the same fashion in the fol1pwing taxable year ended June 30. 2007.
Section 5.3 Alternative U.S. Investments. If following the approval of this Plan it becomes no longer practical for the Mlcrosofi Group to invest, in whole or in part, an amount equal to $780,000,000 on the Principal U.S. Investment described in Section 5.2, the Microsoft Group will invest any remaining amounts on advertising and marketing expenditures made within the United States related to the Microsoft trademark, trade . name, or brand name.
(a) Description of Advertising and Marketing Cnmpaigns. The Microsoft Group intends to invest on advertising and marketing campaigns within the United States related to Client, Server and Tools. Infonnation Worker. Mobile and Embedded, MSN. Home and Entertainment, and Microsoft Business Solutions.
(b) Timing of Alternative U.S. Investments. The Microsoft Group intcnds to invest any amount described in Section 5.3 on or before taxable year ended June 30, 2007. To the extent tllat a total amount equal to $780,000,000 has not been invested on the Principal lnvestments, described in Section 5.2, within the period described in subparagraph (b) of Section 5.2. any such remaining amounts shall be invested in advertising and marketing expenses as described in Section 5.3.
ARTICLE VI PROHIBITED EXPENDITURES
Section 6.1 Prohibited Expend itures. Under no circumstances will the Microson Group use ony portion of nn amollnt cqllai to $780.000,000 of Cash Dividl.:nds for any of the rollowing purposes:
(a) To pay executive compensation, as defined ill Section 6.02 of Notice 2005·10. for services paid, din:etly or indirectly, to llny employee or fonner employee for
- 4 -
74

services, if the employee either is (i) directly or indirectly the beneficial owner of more than 10 percent of any class of any equity security in Microsoft, or (ii) is a Director or Officcr of Microsoft. as those terms are understood for purposes of applying Section 16a of the Securities Exchange Act of 1934 to an issuer of equity secmities referred to in such Section;
(b) To pay for services perfonned outside of the United States;
(e) To pay for assets to the extent that they are located 'or ltsed outside of the United States;
(d) To make payments to related persons, as defined in Section 5.01(b) of Notice 2005-10;
(e) To acquire a business entity other than as provided in Section 5.06 of Notice 2005-1 0;
(I) To acquire a debt instrument or other evidence of indebtedness within the meaning of Section 6.07 of Notice 2005-10;
(g) To pay U.S. fedcral, state, local or foreign taxes within the meaning of Section 6.08 of Notice 2005-10;
(b) To make payments that arc not borne by Microsoft within the meaning of Sections 4.04 and 4.07 of Notice 2005-10;
(i) To make investments, other than in cash as required by Section 5.01(c) of Notice 2005-10; or
(j) Discretionary contributions to a qualified profit sharing or stock bonus plan as described within Section 10.11 of Notice 2005-64.
ARTICLE VII OTHER PROVISIONS
Section 7.1 Term of Plan. This Plan shall commence on the Effectivc Date ilnd shall continuc lIntil an amount equal to the total Cash Dividends received pursuant to Article III hereof have been reinvested in nccordance with Article V.
Section 7.2. Plan Jmpiementntioll. Microsoft will impienH.:l1t this Plan subject 10 tbe subsc<jucnt approval by the Board.
Section 7.3 No Amendment 0[" Termination. After th~ Effective Date, this Plan may not be amended or tenninated until all Dividends received pursuant to Article
- 5 -
75
III have been reinvested in accordance with Article VI except to the extent permitted by Treasury Department guidance for purposes of compliance with such guidance.
ARTICLE VII
Approval by Chief Executive Officer. By his signature below, the chief executive officer of Microsoft Corporation hereby certifies his approval of thi~ 1; the date set
forth below. t; {j f7tPL ~slte~v-en~A--=B-al~ln-,-er-----------------Chief Executive Officer Microsoft Corporation
Date of Approval: .0/4 ,2006
-6-
76

Q17.
Excerpt from Oracle Corporation Response To
Permanent Subcommittee on Investigations Survey (2117/09)
Redacted By The Permanent Subcommittee
Please provide any available data demonstrating how your corporation's amounts repatriated under section 965 have yielded a net increase in your corporation's U.S. jobs or a net increase in your corporation's U.S. research and development expenditures.
A17.
The answers to questions 11 and 12 show a positive correlation between amounts that Oracle repatriated and increases in Oracle's U.S. employment and research and development:
• In FY2004, the year before employees and spent approximately
rep'atnate,d, Oracle had 16,888 U.S. in U.S. research & development.
• Four (),.."I. had 26,581 US employees, a 57% increase, and spent in U.S. research and development, a 94% increase.
• Oracle's primary competitor in the software applications business is SAP AG (headquartered in Frankfurt, Gennany). In FY2002, Oracle was 1/5th the size (measured by application sales) of SAP AG. By 2008, Oracle had closed the gap substantially and is now half the size of SAP AG.
As noted in Oracle's DRP. a portion of Oracle's repatriated funds was used in FY 2005 for two key acquisitions critical to Oracle's long· term growth and competitiveness internationally. For example, repatriated cash enabled Oracle to outbid and acquire Retek Inc., a Minnesota·based provider of retail software and services. SAP AG had made an offer to acquire Retek, and stated publicly that it intended to move Retek's development jobs and intellectual property to Germany. Oracle's successful acquisition of Retek had the inunediate effect of retaining all of Retek's jobs in Minnesota and Georgia. Since the
Permanent Subcommittee on Investip"ations
Repatriating Offshore Funds Report Exhibit #5
77

Retek acquisition, Oracle has increased by 50 percent its Retek related employment in Minnesota and Georgia.
Oracle's substantial net employment and research and development growth since FY2005 carne at a time of significant growth in Oracle's sales internationally. Today. Oracle operates in 145 countries, and generates approximately 60% of its revenues from overseas license sales and support, contributing positively to the U.S. balance of trade.
9
78

SCHEDULEA7
ORACLE'S DOMESTIC REINVESTMENT PLAN
12
79

\. )
J
Schedule A7
ORACLE CORPORATION
SECTION 965 DOMESTIC REINVESTMENT PLAN
As of May 31 , 2003, Oracle Corporation ("Oracle") had 13.1 billion of cumulative earnings indefm.itely reinvested outside the United States ,("2003 Cumulative Foreign Earnings''). Oracle's 2003 Cumulative Foreign Earnings are reflected in footnote 14 of Oracle' s audited financial statements for the period ending May 31 . 2003, which were certified by Ernst & Young LLP on June 12, 2003 (except for the second and fourth paragraphs or Note 17 and Note 18, which were certified on June 18, 2003), and filed with the SEC on June 24, 2003. In order to fund the objectives set forth in this Domestic Reinvestment Plan (the ·'Plan"). Oracle will cause Oracle Technology Company and Oracle Systems Hong Kong Limited, its wholly owned subsidiaries, to pay cash dividends equal to $3. 1 billion during the fiscal year ending May 31, 2005 (the "Section 965 Dividends''). Oracle intends for the Section 965 Dividends to qualify for the Temporary Dividends Received Deduction under Section 965 of the Internal Revenue Code, enacted pursuant to the American Jobs Creation Act of 2004. ntis Plan is Oracle's plan to invest the Section 965 Dividends in the United States as required by section 965(b)(4).
Plan Oblectives
During the period including Oracle's fiscal years ending May 31, 2005, May 31, 2006, May 31, 2007, and May 31, 2008, Oracle intends to use the cash proceeds from the Section 965 Dividends as a source of funding for the acquisition of U.S. capital invesbnents. If Oracle later determines that it is not prudent to use the cash proceeds as a source of funding for capital invesbnents, it will use tlie proceeds as a source of funding for (j) its U.S. payroll costs and/or (ii) its ongoing U.S. research and development efforts related to the development of software and related products ~d seJVices.
Investments in the United States
Consistent with the Plan Objectives, Oracle intends to use the cash proceeds from the Section 965 Dividends as a source of funding for the following investments:
1. Primary Investment in tbe United States
United States Capital Investments. Oracle's Corporate Development group evaluates business opportunities for acquisitions of, and mergers with. other companies having complementary technology. products, and services. During the period including Oracle's fiscal years ending May.31 , 2005, May 31, 2006, May 31, 2007, and May 31, 2008, Oracle plans to spend $3.1 billion on the acquisition of capital investments, including but not limited to the acquisition of PeopleSoft, Inc., which was completed on January 7, 2005, and the acquisition ofRetek Inc., which was completed on April 12, 2005. The property acquired will include tangible assets located and used in the United States and/or rights to use intangible assets in the United States as supported by an
80

-----------_ .. _- -----
,.'-, \ J independent valuation of United States versus foreign assets. The acquisitions will be
)
effected by direct acquisitions andlor indirect acquisitions through the purchase of 10% or greater interests in business entities that own such assets.
2. Alternate lDvestmcat ill the United States #1 .,.
Uniled Slales PaYroll. During the period including Oracle's fiscal years ending May 31, 2005, May 31,2006, May 31, 2007, and May 31, 2008, Oracle plans 10 spend $3.1 billion to compensate employees. agents. and contractors for services performed in the United States. Such costs include salaries, bonuses, commissions, and benefits, but do not include executive compensation and non-cash compensation. Such costs only mclude costs that are borne by Oracle.
3. Altenate Investment in the United States #2
Uoited States Research & Development Program. DtuiDg the period including Oracle's fiscal ye ... ending May 31, 2005, May 31, 2006, May 31,2007, and May 31, 2~. Oracle plans to spend S3.1 billion for research and development performed iD the United States. Such costs only include costs that are borne by Oracle. .
Implementation oC the Plan
The Plan eontams forward-loolcing statements that bave nol been publicly discussed as financial guidance with the investment community. Actual spendiDg on each Plan Objective may vary from the aoticipaled spending.
The Plao will be implemenl<d upon the receipl of approval from the Oracle Board ofDirectoIs.
• • •
Dale: _",Siff!...!1:;/c.:o:.:r:-__ , . ! ,
81

Question 17:
Excerpt from The Coca Cola Co. Response To
Permanent Subcommittee on Investigations Survey (2/13/09)
Redacted By The Permanent Subcommittee
on
We do not maintain data, and we have not made estimates, of bow our U.S. jobs and U.S. research and development expenditures would have been different if amounts had not been repatriated under section 965. We note that employment increased from 2003 through 2007 and research and development increased in each afthe years 2002 through 2007 except for 2005.
Perman"n' Subcommittee on Investigations
Repatriating Offshore Funds Report Exhibit #6
•
82

Excerpt from The Procter & Gamble Company Response To
Permanent Subcommittee on Investigations Survey (2126/09)
Redacted By The Permanent Subcommittee
on Investigations
17. Please provide any available data demonstrating how your corporation's amounts repatriated under section 965 have yielded a net increase in your corporation's U.S. jobs or a net increase in your corporation's u.s. research and development expenditures.
Please refer to our responses to questions 11 and 12 above. We have DO way to determine wbat the levels of employment or R&D spending may have been in the absence of 965. We did achieve our Domestic Reinvestment Plan significantly ahead of schedule.
We would Dote that P&G is not only a major engine of U.S. employment, but also a company that pays taxes in the United States at a level at least commensurate witb the relative importance oftbe U.s. market to the company's worldwide business. For the fiscal year ended June 30, 2008, P&G's net sales in tbe United States accounted for approximately 40% of total net sales. No other individual country bad net sales exceeding 10% of total net sales. Tbe United States accounted for over 56-/0 of P&G's book earnings before taxes. US taxes accounted for.% of P&G's worldwide income tax expense for tbe same year.
Permanent Subcommittee on Investigations
Repatriatillg Offi"/wre FUllds Report Exhibit #7
83
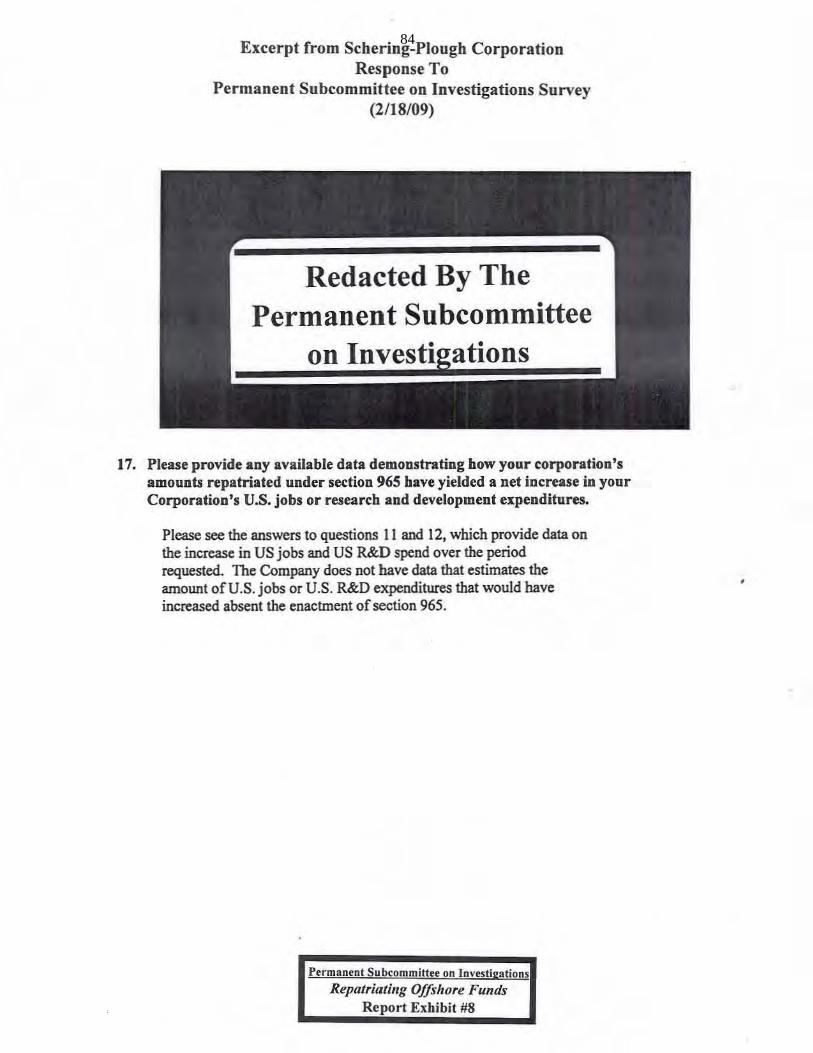
Excerpt from Scbering-Plough Corporation Response To
Permanent Subcommittee on Investigations Survey (2118/09)
Redacted By The Permanent Subcommittee
on Investigations
17. Please provide any available data demonstrating how your corporation's amounts repatriated under section 965 have yielded a Det increase in your Corporation's U.S. jobs or research and development expenditures.
Please see the answers to questions 11 and 12, which provide data on the increase in US jobs and US R&D spend over the period requested. The Company does not have data that estimates the amount oru.s. jobs or U.s. R&D expenditures that would have increased absent the enactment of section 965.
Permanent Su bcommittee on Investigation~
Repatriating 0ffi'/lOre Funds Report Exhibit #8
•
84

Excerpt from Johnson & Johnson RcsponseTo
Permanent Subcommittee on Investigations Survey (2/24/09)
• While it is difficult to point to a direct connection between repatriation and jobs and research and development, when a company can access cash at a lower rate, it is placed in a much better position to capitalize on Dew business opportunities and investments in research and development to increase sales volumes. While we are not immune to changing market conditions, these investments enable our company to preseJVejobs for the 43,000 U.S. people we employ today and to create new jobs for the future.
'Unless otherwise indicated, all subsequent section references are to the Internal Revenue Code of 1986, as amended.
Permanent Su bcommittee on Investigations
Repatriating OffShore Funds , Report Exhibit #9 iii _ ....... ;,;,;;;;;,;oiiiiiiii __ """~
,
85

Offshore tax dodging hurts U.S. business Michigan Midland Daily News By Paul Egerman I Posted: Tuesday, June 7, 2011 7:00 am
When a company like General Electric pays little or no U.S. income taxes, it has troubling implications for domestic business and our entire society.
As a businessman and entrepreneur, I believe it is myopic tax policy to force domestic enterprises to compete on an un level playing field against companies that use offshore tax havens to relocate profits.
Our current upside down corporate tax system means that a U.S. manufacturer, insurance company, retailer, or technology firm must compete against another company based not on product quality and services, but on accounting gymnastics.
Many multinational companies use a gimmick called "transfer pricing," to represent that they've earned their profits at a subsidiary in an offshore tax haven nation like the Cayman Islands or Luxembourg, even though 99 percent of their operations and sales are not there.
This accounting game enables these shell subsidiaries to pay little or no corporate income tax, while the U.S. parent company represents to the IRS that they've lost money on their U.S. operations. A recent estimate of revenue lost due to this tax dodging dance is $90 billion a year, an amount approaching the total budget gaps of all U.S. states combined.
This is only one example of the exotic loopholes that U.S. multinational corporations utilize that put domestic employers at an unfair disadvantage.
It is simply wrong that a U.S-based multinational company is able to report profits to their shareholders and losses to Uncle Sam.
When General Electric or Boeing or Phizer deploy armies of accountants to game their tax bill down, it simply means the rest of us are left responsible for the bill.
And now, a coalition of global corporations is calling for a tax holiday so they can bring home over $1 trillion profits that they parked offshore without paying the same corporate income rate that most domestic companies pay. Congress' Joint Committee on Taxation estimates this move would cost the U.S. $80 billion over ten years.
Permanent Subcommittee on Investi2ations
Repalrillting Offshore Funds Report Exhibit #10
86

Aggressive tax avoidance raises the question of what kind of country we want to have and who is going to pay for it.
To make our views public, hundreds of business owners and CEOs like me have signed a statement calling for the end of tax haven abuse. We welcome other business people and investors to sign at the website, www. businessagainsttaxhavens.org.
There are millions of U.S. business people in this country who work extremely hard to reach customers, provide better services, build better widgets - and pay their local, state and federal taxes. When times are lean, we don't look to our accountant to bring home the bacon.
Paying our fair share of business taxes is the price we pay not only to live in a civilized society, but also a reasonable levy to conduct business in a vibrant, regulated marketplace with property rights protections, public infrastructure, and the rule of law.
If companies like General Electric want to enjoy the fruits of this taxpayer funded business environment, then they should end their aggressive tax avoidance and take responsibility for paying their fair share.
The bills have to be paid - and no one should be able to opt out simply because they are politically connected and big. It undermines the entire system of government and is reprehensible that some corporations pay nothing toward the range of public goods that includes Centers for Disease Control, homeless shelters, and schools for our kids .
As a business owner and as an individual, I never resented paying taxes, as long as we had a relatively level playing field. The price we pay is not excessive.
In the 1970s, I paid a much higher percentage of my income than I do today. Even compared to President Reagan's 1980 tax reform, the effective rate of my personal income taxes is dramatically less today. At the same time, the share of U.S. taxes paid by corporations is at an historical low because of subsidies, loopholes and other tax avoidance strategies.
Congress should not allow a tax holiday for offshore tax dodgers and instead should pass legislation like the Stop Tax Haven Abuse law that would be a huge step toward leveling the corporate tax playing field.
Paul Egerman is a successful entrepreneur, based in Boston, who has started two health information technology companies, including eScription.
87

TH EJJ-I ILL
Co'ngress Blog=== '\\rherc lawmakers (,OInt'lo hlo~
A Charlie Brown Congress? By Frank Knapp Jr. ~ 06/29/ 11 02: 10 PM ET
Lucy is at it again. "I'll hold the ball, and you come running and kick it," Lucy tells Charlie Brown.
We all know what to expect. Charlie Brown will run to kick the football and Lucy will pull it away ... again. Charlie will fall flat on his back.
This gag is playing out right now in Congress. U.S. multinational corporations (aka Lucy) are holding hundreds of billions of dollars in profits overseas to avoid paying U.S. taxes. They want Congress (aka Charlie Brown) to let them bring those dollars back to the U.S. without paying hardly any taxes (Congress committing to kick the ball) in the belief they will invest them in production and hiring here at home (the football flying through the air instead of Charlie).
This process is caned a "repatriation tax holiday" and, just as in the Peanuts cartoon, Congress has seen this before.
In 2004, most ofthe same multinational corporations made the same offer. Even the Bush administration thought it was a bad idea and said it would be unfair to companies who had "already paid their full and fair share of tax" and "would not produce any substantial economic benefits."
Still, Congress agreed to a "one-time-only" repatriation run at the ball. But instead of using their almost tax-free billions for hiring and investing here, companies like Hewlett-Packard, Pfizer, Ford Motor Company, Merck and Honeywell International gave big windfalls to their corporate ovmers and shareholders in stock buybacks and dividends while laying off tens of thousands of American workers.
The National Bureau of Economic Research found that the tax holiday did not increase domestic investment, employment or research and development. Instead, they found, a dollar increase in repatriated earnings was associated with an increase of almost a dollar in payouts to shareholders.
It's not that Congress has amnesia about this failed tax policy, as some have suggested. Charlie Brovm remembers Lucy's trick all too well.
Permanent Subcommittee on Investigations
Repatriating Offshore Funds Report Exhibit #11
88

"You must think I'm stupid," Charlie Brown tells Lucy in the Great Pumpkin episode. But Lucy persists, "This time you can trust me. See, here is a signed document testifying that I promise not to pull it away."
Tax holiday advocates say this time the legislation will really guarantee that the repatriated profits will be used to invest and create jobs in America.
Charlie Brown, in spite of all of us yelling, "Don't do it," gives in. "It's a signed document," he says. "I guess if you have a signed document in your possession, you can't go wrong. This year I am really going to kick that football. "
"AAUGH!"
Lucy pulled the football away with the excuse the document wasn't notarized.
There's no foolproof way of writing legislation to stop corporations from behaving the way they did in 2005. And the reality is that the corporations don't really need the repatriated profits to invest and create jobs here. As conservatively calculated by the Center on Budget and Policy Priorities from company financial statements, the ten corporations doing the heaviest tax holiday lobbying (Adobe Systems, Apple, CA Technologies, Cisco, Duke Energy, Google, Microsoft, Oracle, pfizer and Qualcomm) have at least $47 billion in cash and other liquid assets readily available for domestic investment and job creation right now.
When Lucy suckers Charlie Brown more than once, she knows that she can do it again and again.
Giving U.S. multinational corporations another "repatriation tax holiday" will encourage them to shift even more of their profits into offshore tax havens until the next time they trick Congress to try and kick the ball. As a result, our country's deficit will increase when an estimated $79 billion more in corporate taxes is not collected over the next 10 years according to Congress's Joint Committee on Taxation. That means the rest of us will continue to pay more than our fair share for the essential services of government.
These big corporations benefit immensely from all the advantages of being headquartered in our country. They need to start paying their taxes just as every citizen and sman business does.
That's why Congress should listen to our raised voices: "Don't do it, Charlie Brown!"
Frank Knapp Jr. is the president and CEO of The South Carolina Small Business Chamber of Commerce.
Source: http://thehiII.com/hlogs/congress-hlog/economy-a-budget/l69051-a-charlie-hrowncongress
89

Letter to Congress: No Tax Holiday for U.S. Multinationals June 14, 2011
Dear Senators and Representatives,
As business organizations with small business members throughout the United States, we call upon Congress to reject pleas by U.S. multinational corporations for short and long-term tax holidays on profits held offshore, and to instead close the tax loopholes that reward companies for transferring U.S. profits, jobs and investment abroad.
Too many corporations have turned their tax departments into profit centers, using aggressive accounting manipulation to disguise U.S. profits as foreign profits. This is done for the express purpose of avoiding tax payments. Now we find a coalition of corporate tax avoiders demanding a tax holiday in order to bring home the funds they shifted offshore to avoid paying taxes. This proposed "repatriation" would not be a win for America. It would cost the U.S. Treasury $80 billion according to the Joint Committee on Taxation and increase pressure to cut government spending on services our businesses depend on. We also oppose changing to a territorial tax system, which would accelerate the use of aggressive accounting techniques to shift domestic profits to overseas tax havens, permanently rewarding those who seek to avoid their taxpaying responsibilities.
Bloomberg Business Week recently illustrated examples of this tax avoiding behavior: Forest Laboratories "sells nearly 100 percent of its drugs in the U.S. - and cuts its U.S. taxes dramatically by attributing the bulk of its profits to a law office in Bermuda .... Google reduced its income taxes by $3.1 billion over three years by shifting income to Ireland, then the Netherlands, and ultimately to Bermuda." We need to stop this irresponsible tax avoidance, which undermines the U.S. economy, and assure that all businesses play by the same tax rules.
There is simply no excuse for repeating a policy that's a proven failure. In 2004, a corporate "repatriation tax holiday" was passed with the promise of stimulating domestic investment and creating jobs in the United States. Instead, studies showed that the beneficiaries of the tax holiday used their repatriated earnings to give a huge windfall to corporate owners and shareholders -including many CEOs - in the form of stock buybacks and dividends. For example, the National Bureau of Economic Research found that a dollar increase in repatriated earnings "was associated with an increase of almost $1 in payouts to shareholders." In the wake of the tax holiday, U.S. multinationals eliminated more American jobs and shifted even more income and investment to offshore tax havens.
Corporate taxes, like individual income taxes, support the public services and infrastructure upon which all businesses depend. These include a publicly educated workforce, transportation systems, safe drinking water and sanitation, the judicial system, taxpayer-funded research (which played a crucial role in health advances and the creation of the Internet, for example), federal emergency response and so on. But, the public services and infrastructure underpinning a healthy economy are now being cut dramatically because of inadequate revenues.
When powerful large U.S. corporations avoid their fair share of taxes, they undermine U.S. competitiveness, contribute to the national debt and shift more of the tax burden to domestic businesses, especially small businesses that create most of the new jobs. A transparent corporate tax system that assures all companies - large and small - pay for the services upon which our businesses, our customers, our workforce and our communities depend, would help restore the economic vitality and domestic job creation we all seek.
Permanent Subcommittee on Investigations
Repatriating Offshore Funds Report Exhibit #12
90

Sincerely,
Holly Sklar Executive Director Business for Shared Prosperity
Frank Knapp, Jr. President and CEO The South Carolina Small Business Chamber of Commerce
Sam Blair National Director Main Street Alliance
David Levine Executive Director American Sustainable Business Council
Wendy Rosen Founder American Made Alliance
Alisa Gravitz Executive Director Green America
Rudy Arredondo President National Latino Farmers and Ranchers Trade Association
Mike Lapham Project Director Responsible Wealth
Deborah Nelson Executive Director Social Venture Network
Mark McLeod Executive Director Sustainable Business Alliance
Alison Goldberg Coordinator Wealth for Common Good
Nate Libby Director Maine Small Business Coalition
91


![⃝ß [u s senate] senate hearing on mkultra](https://img.pdfslide.net/doc/110x75/568ca8d61a28ab186d9aff75/ss-u-s-senate-senate-hearing-on-mkultra.jpg)
