Embed Size (px)
Citation preview
Repetitive task training for improving functional ability after
stroke (Review)
French B, Thomas LH, Leathley MJ, Sutton CJ, McAdam J, Forster A, Langhorne P, Price
CIM, Walker A, Watkins CL, Connell L, Coupe J, McMahon N
This is a reprint of a Cochrane review, prepared and maintained by The Cochrane Collaboration and published in The Cochrane Library2007, Issue 4
http://www.thecochranelibrary.com
Repetitive task training for improving functional ability after stroke (Review)
Copyright © 2014 The Cochrane Collaboration. Published by John Wiley & Sons, Ltd.

T A B L E O F C O N T E N T S
1HEADER . . . . . . . . . . . . . . . . . . . . . . . . . . . . . . . . . . . . . . .
1ABSTRACT . . . . . . . . . . . . . . . . . . . . . . . . . . . . . . . . . . . . . .
2PLAIN LANGUAGE SUMMARY . . . . . . . . . . . . . . . . . . . . . . . . . . . . . .
2BACKGROUND . . . . . . . . . . . . . . . . . . . . . . . . . . . . . . . . . . . .
3OBJECTIVES . . . . . . . . . . . . . . . . . . . . . . . . . . . . . . . . . . . . .
3METHODS . . . . . . . . . . . . . . . . . . . . . . . . . . . . . . . . . . . . . .
7RESULTS . . . . . . . . . . . . . . . . . . . . . . . . . . . . . . . . . . . . . . .
15DISCUSSION . . . . . . . . . . . . . . . . . . . . . . . . . . . . . . . . . . . . .
18AUTHORS’ CONCLUSIONS . . . . . . . . . . . . . . . . . . . . . . . . . . . . . . .
19ACKNOWLEDGEMENTS . . . . . . . . . . . . . . . . . . . . . . . . . . . . . . . .
19REFERENCES . . . . . . . . . . . . . . . . . . . . . . . . . . . . . . . . . . . . .
25CHARACTERISTICS OF STUDIES . . . . . . . . . . . . . . . . . . . . . . . . . . . . .
49DATA AND ANALYSES . . . . . . . . . . . . . . . . . . . . . . . . . . . . . . . . . .
Analysis 1.1. Comparison 1 Upper limb function: post treatment, Outcome 1 Arm function. . . . . . . . . 52
Analysis 1.2. Comparison 1 Upper limb function: post treatment, Outcome 2 Hand function. . . . . . . . . 53
Analysis 1.3. Comparison 1 Upper limb function: post treatment, Outcome 3 Sitting balance/reach. . . . . . . 54
Analysis 2.1. Comparison 2 Upper limb function: follow up, Outcome 1 All outcomes. . . . . . . . . . . 55
Analysis 3.1. Comparison 3 Upper limb function: subgroup analyses, Outcome 1 Dosage of task practice. . . . . 56
Analysis 3.2. Comparison 3 Upper limb function: subgroup analyses, Outcome 2 Time since stroke. . . . . . . 57
Analysis 3.3. Comparison 3 Upper limb function: subgroup analyses, Outcome 3 Type of intervention. . . . . . 58
Analysis 4.1. Comparison 4 Lower limb function: post treatment, Outcome 1 Walking distance: change from baseline. 59
Analysis 4.2. Comparison 4 Lower limb function: post treatment, Outcome 2 Walking speed. . . . . . . . . 60
Analysis 4.3. Comparison 4 Lower limb function: post treatment, Outcome 3 Functional ambulation. . . . . . 61
Analysis 4.4. Comparison 4 Lower limb function: post treatment, Outcome 4 Sit to stand: post treatment/change from
baseline. . . . . . . . . . . . . . . . . . . . . . . . . . . . . . . . . . . . . 62
Analysis 4.5. Comparison 4 Lower limb function: post treatment, Outcome 5 Lower limb functional measures. . . 63
Analysis 4.6. Comparison 4 Lower limb function: post treatment, Outcome 6 Standing balance/reach. . . . . . 64
Analysis 5.1. Comparison 5 Lower limb function: follow up, Outcome 1 All outcomes. . . . . . . . . . . 65
Analysis 6.1. Comparison 6 Lower limb function: subgroup analyses, Outcome 1 Dosage of task practice. . . . . 66
Analysis 6.2. Comparison 6 Lower limb function: subgroup analyses, Outcome 2 Time since stroke. . . . . . . 67
Analysis 6.3. Comparison 6 Lower limb function: subgroup analyses, Outcome 3 Type of intervention. . . . . . 68
Analysis 7.1. Comparison 7 Global motor function, Outcome 1 Global motor function scales. . . . . . . . . 69
Analysis 8.1. Comparison 8 Secondary outcomes, Outcome 1 Activities of daily living function. . . . . . . . 70
Analysis 8.2. Comparison 8 Secondary outcomes, Outcome 2 Upper limb impairment. . . . . . . . . . . 71
Analysis 8.3. Comparison 8 Secondary outcomes, Outcome 3 Lower limb impairment. . . . . . . . . . . 71
Analysis 8.4. Comparison 8 Secondary outcomes, Outcome 4 Quality of life/health status. . . . . . . . . . 72
Analysis 9.1. Comparison 9 Sensitivity analyses, Outcome 1 Allocation concealment. . . . . . . . . . . . 73
Analysis 9.2. Comparison 9 Sensitivity analyses, Outcome 2 Comparison groups. . . . . . . . . . . . . . 74
Analysis 9.3. Comparison 9 Sensitivity analyses, Outcome 3 Equivalence of therapy time. . . . . . . . . . . 75
75ADDITIONAL TABLES . . . . . . . . . . . . . . . . . . . . . . . . . . . . . . . . . .
79APPENDICES . . . . . . . . . . . . . . . . . . . . . . . . . . . . . . . . . . . . .
80WHAT’S NEW . . . . . . . . . . . . . . . . . . . . . . . . . . . . . . . . . . . . .
81CONTRIBUTIONS OF AUTHORS . . . . . . . . . . . . . . . . . . . . . . . . . . . . .
81DECLARATIONS OF INTEREST . . . . . . . . . . . . . . . . . . . . . . . . . . . . . .
81SOURCES OF SUPPORT . . . . . . . . . . . . . . . . . . . . . . . . . . . . . . . . .
81INDEX TERMS . . . . . . . . . . . . . . . . . . . . . . . . . . . . . . . . . . . .
iRepetitive task training for improving functional ability after stroke (Review)
Copyright © 2014 The Cochrane Collaboration. Published by John Wiley & Sons, Ltd.
[Intervention Review]
Repetitive task training for improving functional ability afterstroke
Beverley French1, Lois H Thomas2 , Michael J Leathley3, Christopher J Sutton4 , Joanna McAdam5, Anne Forster6, Peter Langhorne7 ,
Christopher IM Price8, Andrew Walker9, Caroline L Watkins3 , Louise Connell10, Jacqueline Coupe10, Naoimh McMahon10
1Department of Nursing and Caring Sciences, University of Central Lancashire, Preston, UK. 2School of Health, University of Central
Lancashire, Preston, UK. 3Clinical Practice Research Unit, School of Nursing and Caring Sciences, University of Central Lancashire,
Preston, UK. 4School of Public Health and Clinical Sciences, University of Central Lancashire, Preston, UK. 5Department of Nursing,
University of Central Lancashire, Preston, UK. 6Academic Unit of Elderly Care and Rehabilitation, Bradford Institute for Health
Research, Bradford Teaching Hospitals NHS Foundation Trust/University of Leeds, Bradford, UK. 7Academic Section of Geriatric
Medicine, University of Glasgow, Glasgow, UK. 8Elderly Services, Northumbria Healthcare NHS Trust, Ashington, UK. 9Robertson
Centre for Biostatistics, University of Glasgow, Glasgow, UK. 10University of Central Lancashire, Preston, UK
Contact address: Lois H Thomas, School of Health, University of Central Lancashire, Room 434, Brook Building, Preston, Lancashire,
PR1 2HE, UK. [email protected].
Editorial group: Cochrane Stroke Group.
Publication status and date: Edited (no change to conclusions), published in Issue 6, 2014.
Review content assessed as up-to-date: 10 April 2007.
Citation: French B, Thomas LH, Leathley MJ, Sutton CJ, McAdam J, Forster A, Langhorne P, Price CIM, Walker A, Watkins CL,
Connell L, Coupe J, McMahon N. Repetitive task training for improving functional ability after stroke. Cochrane Database of SystematicReviews 2007, Issue 4. Art. No.: CD006073. DOI: 10.1002/14651858.CD006073.pub2.
Copyright © 2014 The Cochrane Collaboration. Published by John Wiley & Sons, Ltd.
A B S T R A C T
Background
The active practice of task-specific motor activities is a component of current approaches to stroke rehabilitation.
Objectives
To determine if repetitive task training after stroke improves global, upper or lower limb function, and if treatment effects are dependent
on the amount, type or timing of practice.
Search methods
We searched the Cochrane Stroke Trials Register (October 2006), The Cochrane Library, MEDLINE, EMBASE, eight additional
electronic databases (to September 2006), and OT search (to March 2006). We also searched for unpublished/non-English language
trials, conference proceedings, combed reference lists, requested information on bulletin boards, and contacted trial authors.
Selection criteria
Randomised/quasi-randomised trials in adults after stroke, where the intervention was an active motor sequence performed repetitively
within a single training session, aimed towards a clear functional goal, and where the amount of practice could be quantified.
Data collection and analysis
Two authors independently screened abstracts, extracted data and appraised trials. Assessment of methodological quality was under-
taken for allocation concealment, blinding, loss to follow up and equivalence of treatment. We contacted trial authors for additional
information.
1Repetitive task training for improving functional ability after stroke (Review)
Copyright © 2014 The Cochrane Collaboration. Published by John Wiley & Sons, Ltd.

Main results
Fourteen trials with 17 intervention-control pairs and 659 participants were included. Primary outcomes: results were statistically
significant for walking distance (mean difference (MD) 54.6, 95% CI 17.5 to 91.7); walking speed (standardised mean difference
(SMD) 0.29, 95% CI 0.04 to 0.53); sit-to-stand (standard effect estimate 0.35, 95% CI 0.13 to 0.56); and of borderline statistical
significance for functional ambulation (SMD 0.25, 95% CI 0.00 to 0.51), and global motor function (SMD 0.32, 95% CI -0.01 to
0.66). There were no statistically significant differences for hand/arm function, or sitting balance/reach. Secondary outcomes: results
were statistically significant for activities of daily living (SMD 0.29, 95% CI 0.07 to 0.51), but not for quality of life or impairment
measures. There was no evidence of adverse effects. Follow-up measures were not significant for any outcome at six or 12 months.
Treatment effects were not modified by intervention amount or timing, but were modified by intervention type for lower limbs.
Authors’ conclusions
Repetitive task training resulted in modest improvement in lower limb function, but not upper limb function. Training may be sufficient
to impact on daily living function. However, there is no evidence that improvements are sustained once training has ended. The review
potentially investigates task specificity rather more than repetition. Further research should focus on the type and amount of training,
and how to maintain functional gain.
P L A I N L A N G U A G E S U M M A R Y
Repetitive task training for improving functional ability after stroke
Stroke can cause problems with movement, often down just one side of the body. All limbs can be affected, and while some recovery is
common over time, about one third of people will have continuing problems. This review of 14 studies with 659 participants looked at
whether repeated practice of tasks similar to those commonly performed in daily life could improve functional abilities. In comparison
with usual care or placebo groups, people who practiced functional tasks showed modest improvements in walking speed, walking
distance and the ability to stand from sitting, but improvements in leg function were not maintained six months later. Repetitive task
practice had no effect on arm or hand function. There was a small amount of improvement in ability to manage activities of daily
living. Training effects were no different for people whether early or late after stroke. Further research is needed to determine the best
type of task practice, and whether more sustained practice could show better results.
B A C K G R O U N D
Description of the condition
Although the age-related incidence of stroke may be falling
(Rothwell 2004), stroke is still the major cause of long-term neu-
rological disability in adults (Wolfe 2000). Prevalence rates of dis-
ability and impairment vary according to sampling of cohorts, but
in the acute stage of stroke approximately half of all stroke sur-
vivors are left with severe functional problems (Lawrence 2001).
Only 5% to 20% of people with initial upper limb impairment
after stroke fully regain arm function, with 30% to 66% regaining
no functional use at six months (Heller 1987; Nakayama 1994;
Sunderland 1989; Wade 1983). At three weeks and six months
after stroke, 40% and 15% of people are unable to walk inde-
pendently indoors (Wade 1987), with only 18% regaining unre-
stricted walking ability (Lord 2004).
Description of the intervention
Systematic reviews of treatment interventions for the paretic upper
limb suggest that participants benefit from exercise programmes in
which functional tasks are directly trained, with less benefit if the
intervention is impairment focussed, for example muscle strength-
ening (Van Peppen 2004). A recent meta-analysis (Kwakkel 2004
) also showed that more intensive therapy may at least improve
the rate of activities of daily living (ADL) recovery, particularly if
a direct functional approach is adopted (Kwakkel 1999; Van der
Lee 2001). Repetitive task practice combines elements of both in-
tensity of practice and functional relevance.
2Repetitive task training for improving functional ability after stroke (Review)
Copyright © 2014 The Cochrane Collaboration. Published by John Wiley & Sons, Ltd.

How the intervention might work
Many aspects of rehabilitation involve repetition of movement.
Repeated motor practice has been hypothesised to reduce muscle
weakness and spasticity (Feys 1998; Nuyens 2002), and to form
the physiological basis of motor learning (Butefisch 1995), while
sensorimotor coupling contributes to the adaptation and recovery
of neuronal pathways (Dobkin 2004). Active cognitive involve-
ment, functional relevance and knowledge of performance are hy-
pothesised to enhance learning (Carr 1987).
Why it is important to do this review
There are a number of completed trials comparing functional task
practice against other forms of therapy in stroke rehabilitation,
and a number of ongoing trials. Repetitive task training (RTT)
has the potential to be a resource efficient component of stroke re-
habilitation, including delivery in a group setting, or self-initiated
practice in the home environment. Repetition of movement is also
the basic mechanism of action associated with the mechanical or
robotic devices currently being developed to assist and increase
motor activity. This review considers if RTT can lead to sustain-
able functional gains.
O B J E C T I V E S
The primary objective of the review was to determine if RTT
improves functional ability in adults after stroke in:
(1) upper limb function/reach;
(2) lower limb function/balance;
(3) global motor function.
The secondary objectives were as follows.
(1) To determine the effect of RTT on secondary outcome mea-
sures of:
(a) ADL function;
(b) motor impairment;
(c) quality of life/health status measures;
(d) adverse outcomes.
(2) To determine the factors that could influence primary and
secondary outcome measures, including the effect of:
(a) ’dose’ of task practice;
(b) type of task (whole or pre-task movement);
(c) timing of intervention;
(d) type of intervention.
M E T H O D S
Criteria for considering studies for this review
Types of studies
We included randomised and quasi-randomised trials (such as
those allocating by date or alternation) in the review. One arm of
the trial had to include RTT, compared against usual practice (in-
cluding ’no treatment’), or an attention control group. Examples
of attention-control treatment are comparable time spent receiv-
ing therapy on a different limb, or participating in an activity with
no potential motor benefits. We accepted usual-practice compar-
ison groups when the intervention received by the control group
was considered a normal or usual component of stroke rehabili-
tation practices, including neurophysiological or orthopaedic ap-
proaches. We assumed that, early after stroke, usual practice would
mean that people would receive some therapy.
Types of participants
Adults (presumably 18 years and older) who have suffered a stroke.
Stroke is defined according to the World Health Organization
definition as “a syndrome of rapidly developing symptoms and
signs of focal, and at times global, loss of cerebral function lasting
more than 24 hours or leading to death, with no apparent cause
other than that of vascular origin” (WHO 1989). We included
trials starting any time after an acute stroke and in any setting.
Types of interventions
One arm of the trial had to include an intervention where an active
motor sequence was performed repetitively within a single training
session, and where the practice was aimed towards a clear func-
tional goal. Functional goals could involve complex whole tasks,
or pre-task movements for a whole limb or limb segment such as
grasp, grip, or movement in a trajectory to facilitate an ADL-type
activity. To be included, trials of repetitive activity were required
to involve complex multi-joint movement with functional mea-
surement of outcome, rather than the exercise of a single joint or
muscle group orientated to motor performance outcomes.
We included any intensity and duration of task training schedule
However, we only included trials if the time duration or number of
repetitions within a session of practice and the number of sessions
delivered could be identified. We included trials that clearly used
motor relearning as a whole therapy approach if we could identify
the amount of task-specific training received.
We included trials combining RTT with person-delivered, me-
chanical or robotic movement assistance if the purpose of the assis-
tance was to facilitate a task-related repetition. We excluded stud-
ies if assisted movement was predominant, or could not easily be
related to a functional goal.
3Repetitive task training for improving functional ability after stroke (Review)
Copyright © 2014 The Cochrane Collaboration. Published by John Wiley & Sons, Ltd.
We excluded trials if they combined RTT with another interven-
tion where the influence of task repetition could not be isolated,
for example electrical stimulation, virtual environments, perfor-
mance or biofeedback, forced use, bilateral movement, or mental
rehearsal. We also excluded trials if the intervention used mechan-
ical means simply to increase endurance.
We contacted trial authors for clarification of the nature of the
intervention if it was unclear whether the trial met our definition.
Types of outcome measures
Primary outcomes
The primary outcomes we chose were global and limb-specific
functional measures. Due to the large range of measures used across
trials, selection of outcome measures was done by the review au-
thors to facilitate quantitative pooling. If more than one measure
was available in an outcome category, measures of functional mo-
tor ability used in the primary trials were prioritised as follows in
the different categories.
(1) Upper limb function/reach
(a) Arm function: Motor Assessment Scale (MAS) - upper limb
component, Action Research Arm Test, Frenchay Arm Test, Wolf
Motor Function Test, Functional Test of the Hemiparetic Upper
Extremity, Box and Block Test, Southern Motor Group Assess-
ment
(b) Hand function: MAS hand, Jebsen Test of Hand Function*,
Peg Test*
(c) Sitting balance/reach: Reaching Performance Scale, Functional
Reach
(2) Lower limb function/balance
(a) Lower limb function: walking distance, walking speed, func-
tional ambulation, Timed Up and Go Test/sit to stand*, measures
of lower limb function, such as the Rivermead Motor Assessment
(RMA), Sodring Motor Evaluation Scale.
(b) Standing balance/reach: Berg Balance Scale, Sitting Equilib-
rium Index, Standing Equilibrium Index, Functional Reach
(3) Global motor function
Motor Assessment Scale, Rivermead Motor Assessment Scale, So-
dring Motor Evaluation Scale
Secondary outcomes
(1) Activities of daily living measures
Barthel Index, Functional Independence Measure (FIM), Modi-
fied Rankin Scale, Global Dependency Scale
(2) Measures of task performance or impairment
Motricity Index, Fugl-Meyer Assessment, Sodring Motor Evalua-
tion Scale leg and arm subscales, Trunk Control Test
(3) Measures of quality of life, health status, user satisfaction,
carer burden, motivation or perceived improvement
For example, Nottingham Health Profile*, SF36, Dartmouth Co-
operative Chart*
(4) Adverse outcome
For example, pain, injury, falls
* Items marked with an asterisk are measures where a low score
equals a positive outcome. The data were expressed as negative
values for these studies. In all other measures, a high score indicates
a good outcome, and data were expressed as positive values.
Timing of outcome assessment
Primary outcome timing was at the end of the treatment period. If
the end of the treatment period was not clearly defined, outcome
measures at three months post treatment were chosen as primary,
because this was considered to be the average period of rehabilita-
tion input. Outcome data are presented for follow up less than six
months post treatment, and between six months to one year post
treatment.
Search methods for identification of studies
See: ’Specialized register’ section in Cochrane Stroke Group
Electronic searches
We searched the Cochrane Stroke Group Trials Register, which
was searched by the Review Group Co-ordinator in October 2006,
using the Intervention Types: ’Physiotherapy’ and ’Occupational
Therapy’, without restriction of intervention code. We identified
1366 studies in total.
In addition, we searched the following electronic databases: the
Cochrane Central Register of Controlled Trials (CENTRAL) (TheCochrane Library Issue 3 2006); MEDLINE (1966 to September
Week 4, 2006); EMBASE (1980 to Week 40, 2006); CINAHL
(1982 to October Week 1, 2006); AMED (1985 to Week 40,
2006); SPORTDiscus (1980 to October Week 1, 2006); ISI Sci-
ence Citation Index (1973 to 14 October 2006); Index to The-
ses (1970 to September 2006); ZETOC (to 14 October 2006);
PEDro (to 3 October 2006); OT Seeker (to 21 April 2006); OT
4Repetitive task training for improving functional ability after stroke (Review)
Copyright © 2014 The Cochrane Collaboration. Published by John Wiley & Sons, Ltd.

Search (to March 2006). We developed a search strategy, in col-
laboration with the Cochrane Stroke Group Trials Search Co-or-
dinator, for MEDLINE (Ovid) and we adapted it for the other
databases (Appendix 1).
We sought to identify additional non-English language trials by
searching Chinese, Russian and Indian databases via Eastview, Pan-
teleimon and Indmed, using broad descriptors for stroke, reha-
bilitation and physical therapy. We searched The China National
Knowledge database in both English and Chinese. Personnel from
the Second Military Medical University, Shanghai conducted the
searches and translated Chinese articles.
Additional searches
In an effort to identify further published, unpublished and ongo-
ing trials, we undertook the following searches.
(1) We searched the following national and international databases
to May 2006: MetaRegister of Controlled Trials, BioMed Central,
CRISP, Centerwatch, National Research Register, ReFeR, Stroke
Trials Directory, REHABDATA, and CIRRIE, using simple terms
for stroke and rehabilitation or physical therapy.
(2) We searched the following physiotherapy, occupational therapy
and robotics conference proceedings:
• Australian Physiotherapy Association Conference 2000,
2002, 2004;
• Australian Physiotherapy Association Neurology and
Gerontology Physiotherapy Conference: 2005;
• American Physical Therapy Congress Annual Conference
2005;
• Canadian Physiotherapy Conference 2005;
• Chartered Society of Physiotherapy Annual Congress 2000,
2001, 2002, 2003, 2004, 2005;
• ICORR Rehabilitation Robotics International Conferences
1999, 2001, 2005;
• National Association of Neurological Occupational
Therapists Conference 2005;
• UK College of Occupational Therapists Conference 2002,
2003, 2005;
• World Confederation for Physical Therapy 1st
International Congress 1953, 4th International Congress 1963;
• World Confederation of Physiotherapy Europe: First
Congress, Copenhagen 1994: Physiotherapy in Stroke
Management.
(3) We searched the reference lists of 27 systematic reviews rel-
evant to physical or occupational therapy in stroke rehabilita-
tion (Barreca 2003; Cifu 1999; Drukker 2001; Duncan 1997;
Hakkennes 2005; Hendricks 2002; Hiraoka 2001; Kwakkel 1997;
Kwakkel 2004; Legg 2006; Ma 2002; Meek 2003; Ottenbacher
1993; OST 2003; Pollock 2007; Prange 2006; Saunders 2004;
Smidt 2005; Steultjens 2003; Steultjens 2005; Stewart 2006;
Teasell 2003; Trombly 2002; Van der Lee 2001; Van Dijk 2004;
Van Peppen 2004; Walker 2004). We also searched reference lists
of publications and literature reviews relevant to RTT identified
by the search (Bayona 2005; Carr 1998).
(4) We used the Cited Reference search facility on ISI Web of
Knowledge for all included trials.
(5) We posted a request for information to the bulletin boards of
World Congress of Physical Therapy and PHYSIO JISCmail and
contacted authors to ask for details of any other possibly relevant
trials.
Data collection and analysis
Selection of studies
One review author (BF) performed the searches. From the initial
references, one review author (BF) excluded 4443 obviously irrel-
evant references based on title and abstract; this was checked by a
second review author (JM). All review authors (BF, JM, ML, LT)
undertook screening on the same references until an acceptable
level of inter-rater reliability was achieved (kappa = 0.63). From
that point, two review authors (from BF, JM, ML, LT) indepen-
dently screened references.
For non-English language papers, we made decisions about exclu-
sion based on the English abstract or machine translation of the
abstract via WorldLingo or Translation Booth, if adequate. If ma-
chine translation was inadequate, or inclusion was unclear from
English abstracts, the methods section of full papers were com-
mercially translated by native speakers. Sixteen methods sections
and three full non-English language papers that were screened as
potentially relevant were commercially translated. Two review au-
thors (BF, JM) independently filtered all full papers and methods
section translations for non-English papers.
Data extraction and management
All review authors (BF, JM, ML, LT) undertook data extrac-
tion and critical appraisal on eight studies. Inter-rater reliability
of judgement of seven criteria for quality assessment using un-
weighted multiple kappa was median kappa = 0.67 (range 0.48 to
0.85). Disagreements were reviewed and instructions for critical
appraisal gradings were revised. From that point, two review au-
thors independently conducted data extraction and review of the
methodological quality of the eligible trials. Disagreements were
resolved by discussion, and referral to a third review author as nec-
essary. We recorded data on a standardised checklist, incorporating
details of randomisation method, study population, intervention
methods and delivery, reason for losses to follow up, and post-ther-
apy and follow-up outcome measures. In addition, we extracted
information relating to treatment monitoring, acceptability and
adherence where available.
5Repetitive task training for improving functional ability after stroke (Review)
Copyright © 2014 The Cochrane Collaboration. Published by John Wiley & Sons, Ltd.

Assessment of methodological quality
We evaluated items as adequate, inadequate, or unclear for the
following criteria.
(1) Selection bias
(a) allocation concealment
(b) baseline comparability of groups
(2) Performance bias
(a) groups treated equally during intervention
(b) groups treated equally during usual care
(3) Attrition bias
(a) description of withdrawals, drop outs, and those lost to follow
up
(b) all participants entering trial accounted for
(4) Detection bias
(a) blinding of outcome assessors.
Measures of treatment effect
For continuous outcomes using similar measurement scales, we
used the mean difference (MD) with 95% confidence intervals
(CI). If similar outcomes were measured using different outcome
scales, we combined results using standardised mean difference
(SMD) and 95% CI. For continuous outcomes, we extracted
means and standard deviations of post-therapy scores. We also ex-
tracted means and standard deviations of change from baseline
scores where available across trials.
One outcome (Comparison 04.04: Sit to stand: post treatment/
change from baseline) contained both dichotomous and contin-
uous measurement units, which we analysed using the generic
inverse variance method. Four different outcome measures were
used in seven trials. Three of these were continuous measures:
Timed Up & Go Test (Blennerhassett 2004b; Dean 2000; Salbach
2004a); Motor Assessment Scale sit-to-stand (Van Vliet 2005;
Langhammer 2000); sit-to-stand (time in seconds (Howe 2005),
the exception being ’Number of people able to stand indepen-
dently and safely on two consecutive occasions’ (Barreca 2004).
For the six trials with continuous outcomes, the SMD and corre-
sponding standard error were calculated in the Cochrane Review
Manager software, RevMan 4.2, from the SMD estimate and CI
and re-entered for the GIV-based meta-analysis of sit-to stand. For
Barreca 2004, we converted the log OR and its standard error to
an approximate SMD scale.
Unit of analysis issues
Studies with multiple treatment groups
Two trials (Blennerhassett 2004; Salbach 2004) compared upper
versus lower limb training, so are included as four intervention-
control pairs. Blennerhassett 2004a refers to a upper limb train-
ing group versus lower limb attention control, and Blennerhassett
2004b refers to an lower limb training group versus upper limb
training attention control. Salbach 2004a refers to a lower limb
training group versus upper limb training attention control, and
Salbach 2004b refers to the upper limb training group versus lower
limb training attention control. In the subgroup and sensitivity
analyses, these intervention-control pairs are not included as sepa-
rate trials, as it was considered that the impacts of the interventions
on upper and lower limb function in the same person might not
be completely independent. Results for primary outcome of the
lower limb training groups were selected as representative, as stud-
ies were showing that treatment effects were greater in the lower
limb than in the upper limb. One trial (Kwakkel 1999) compared
upper and lower limb training groups against the same control
group. To avoid the control group being included twice, and to
use a limb-specific rather than a global or ADL measure, the lower
limb training versus splint control comparison was selected for the
sensitivity analyses.
Dealing with missing data
If data were not in a form suitable for quantitative pooling, we
contacted trial authors for additional information .We attempted
to obtain post-therapy scores from trial authors who had reported
median and inter-quartile ranges. Trials reporting change scores
with standard deviations are presented in separate analyses.
Assessment of heterogeneity
The degree of heterogeneity among the trials was assessed by the I-
squared (I2) statistic for each outcome. If less than or equal to 50%,
we used a fixed-effect meta-analysis. If the I2 statistic was greater
than 50%, we explored the individual trial characteristics to iden-
tify potential sources of heterogeneity. We then performed meta-
analysis using both fixed-effect and random-effects modelling to
assess sensitivity to the choice of modelling approach.
We addressed clinical and methodological diversity by incorporat-
ing subgroup or sensitivity analyses for type of participant (time
from stroke), intervention (type and amount of intervention), and
study design (comparison group, equivalence of treatment).
To test for subgroup effects we used the chi-squared test with a
10% significance level.
6Repetitive task training for improving functional ability after stroke (Review)
Copyright © 2014 The Cochrane Collaboration. Published by John Wiley & Sons, Ltd.

Assessment of reporting biases
We checked the assessment of the potential for reporting bias by
funnel plot of number of trial participants and effect size for all
trials.
Subgroup analysis and investigation of heterogeneity
We undertook planned subgroup analyses for all primary out-
comes separately for upper limb and lower limb function, due
to the potential differential impact (Table 1). Planned subgroup
analyses were as follows:
(1) dosage of task practice: dosage of task practice was calculated
by multiplying number of weeks, by number of sessions per week,
by the session duration in hours. Trials were divided into those
providing up to and including 20 hours training, and those pro-
viding more than 20 hours training in total;
(2) time since stroke: mean time since stroke at recruitment was
used to classify trials as within zero to six months post-stroke or
more than six months post-stroke. As a number of trials recruited
very early post-stroke, a post-hoc analysis grouping was included
for trials recruiting within 14 days of stroke;
(3) type of intervention: trials were classified as either (a) whole
therapy approaches, where rehabilitation in total was directed by a
motor relearning or movement science approach, (b) mixed func-
tional task training, where therapy included a mixed combination
of functional tasks, and (c) single task training, where one task was
practiced repeatedly.
We intended to consider if effect sizes were related to whether
training was based on pre-functional versus functional activities,
or pre-intervention level of disability. In the event, most pre-func-
tional trials were excluded because they contained a large propor-
tion of passive or active-assisted movement, and levels of disability
proved too difficult to classify because of mixed groups of partic-
ipants and unsuitable measures and data for this purpose. There-
fore, we have not presented these planned subgroup analyses.
Outcomes for subgroup analyses were prioritised by the authors’
primary outcome choice, or the review authors’ judgement as to
the most suitable measure for the intervention, for example a bal-
ance measure for trials training balance functions. If more than
one measure was available, lower limb outcomes were prioritised
in the following order: (1) walking speed, (2) walking distance, (3)
functional ambulation, and (4) lower limb functional measures;
and upper limb outcomes were prioritised to (1) arm function,
and (2) hand function. One trial (Barreca 2004) is omitted from
the subgroup and sensitivity analyses because it used a dichoto-
mous outcome. We excluded this trial from these analyses rather
than using generic inverse variance for all 14 trials, because SMD
is easier for clinicians to interpret.
Sensitivity analysis
We carried out planned sensitivity analyses for allocation conceal-
ment (adequate or inadequate/unclear). In addition, we included
post hoc sensitivity analyses to consider the impact of different
comparison groups (attention control, usual care), and equiva-
lence of therapy time (equivalent time, additional time). We did
not undertake planned sensitivity analyses for intervention deliv-
ery (therapist versus self-administered, group versus individual)
and intervention setting (home versus community) because of in-
sufficient numbers of trials.
R E S U L T S
Description of studies
Results of the search
Overall, we identified 1366 studies from the Cochrane Stroke
Group trials register and 18,241 bibliographic references from the
main database searches, totalling 19,607. We identified a further
772 items from unpublished trial databases, conference proceed-
ings, and hand and citation searching, totalling 20,379. After re-
moval of duplicates, 14,978 items progressed to filtering.
We identified 447 items considered potentially relevant from fil-
tering and retrieved the full papers, including 71 items in lan-
guages other than English. Out of the 447 full papers retrieved,
we excluded 223 as not relevant, and we categorised the remaining
224 papers as potentially relevant and progressed to more detailed
filtering.
All of the 14 studies finally selected for inclusion in the review
were identified from the Cochrane Stroke Group trials register. Of
the seven ongoing studies, one was identified from the Cochrane
Stroke Group trials register, four from handsearching, one from au-
thor contact and one from secondary referencing. Of the 17 stud-
ies still awaiting assessment (because of insufficient detail to judge
inclusion), six were identified from the Cochrane Stroke Group
trials register, nine from handsearching, and two from database
searching.
Included studies
We identified 14 trials, comprising 17 intervention-control pairs,
which met the inclusion criteria. One paper (Kwakkel 1999) refers
to a trial with two intervention-control pairs which have been ref-
erenced separately in the review: Kwakkel 1999a refers to a lower
limb training group versus splint control, Kwakkel 1999b refers to
an upper limb training group versus splint control. Blennerhassett
2004 also includes two intervention-control pairs: Blennerhassett
2004a refers to an upper limb training group versus lower limb
attention control, and Blennerhassett 2004b refers to a lower
limb training group versus upper limb training attention con-
trol. Salbach 2004 also has two intervention-control pairs: Salbach
7Repetitive task training for improving functional ability after stroke (Review)
Copyright © 2014 The Cochrane Collaboration. Published by John Wiley & Sons, Ltd.
2004a refers to a lower limb training group versus upper limb
training attention control, and Salbach 2004b refers to the upper
limb training group versus lower limb training attention control.
In one trial (Winstein 2004) there were three arms, consisting of
a functional task practice group, a strength training group and a
usual care group. Only the data for the intervention-control pair
of functional task practice versus control are included here, as the
strength training group was considered to be an alternative inter-
vention so the comparison did not meet our inclusion criteria.
Design
Of the 14 included trials, 13 are randomised controlled trials
(Barreca 2004; Blennerhassett 2004; Dean 1997; Dean 2000;
de Sèze 2001; Howe 2005; Kwakkel 1999; Langhammer 2000;
McClellan 2004; Salbach 2004; Van Vliet 2005; Winstein 2004;
Yen 2005), and one is a quasi-randomised trial (Turton 1990).
Four of the trials were identified as pilot randomised controlled
trials (Dean 2000; de Sèze 2001; Howe 2005; Winstein 2004).
Three of the trials were multicentre (Howe 2005; Kwakkel 1999;
Salbach 2004). Three of the trials were stratified before randomi-
sation: one for baseline level of walking deficit (Salbach 2004);
one for gender and side of stroke (Langhammer 2000); and one
for severity of deficit (Winstein 2004).
Sample size
Four trials had 25 participants or less (Dean 1997; Dean 2000;
de Sèze 2001; Turton 1990). Five trials had between 25 and 49
participants (Barreca 2004; Blennerhassett 2004; Howe 2005;
McClellan 2004; Yen 2005). Five trials had 50 participants or
more (Kwakkel 1999; Langhammer 2000; Salbach 2004; Van Vliet
2005; Winstein 2004).
Setting
Of the 14 trials, three were carried out in Canada (Barreca 2004;
Dean 2000; Salbach 2004), three in Australia (Blennerhassett
2004; Dean 1997; McClellan 2004), three in the UK (Howe2005;
Turton 1990; Van Vliet 2005), one in Taiwan (Yen 2005), one
in the USA (Winstein 2004), one in the Netherlands (Kwakkel
1999), one in Norway (Langhammer 2000) and one in France (de
Sèze 2001).
Participants
The 14 trials included 680 participants, of which 659 were in-
cluded in the 17 intervention-control pairs relevant to this re-
view. All of the trials included both genders, with three trials hav-
ing more than 60% male participants (Barreca 2004; Dean 1997;
Salbach 2004). In two trials, the participants had a mean age of
less than 60 (Blennerhassett 2004; Turton 1990), and in five tri-
als the mean age was over 70 (Howe 2005; Langhammer 2000;
McClellan 2004; Salbach 2004; Van Vliet 2005).
Six trials included only participants after a first stroke (Dean 2000;
de Sèze 2001; Kwakkel 1999; Langhammer 2000; Winstein 2004;
Yen 2005). Three trials included participants with either first or
recurrent stroke (Blennerhassett 2004; Salbach 2004; Van Vliet
2005). In the remaining trials, it was unclear whether inclusion
was limited to first stroke only.
Mean time since stroke
Three trials recruited within 14 days of stroke (Kwakkel 1999;
Langhammer 2000; Van Vliet 2005). A further four trials re-
cruited within the first month post stroke (Barreca 2004; de Sèze
2001; Howe 2005; Winstein 2004). One trial recruited within
three months of stroke (Blennerhassett 2004). Two trials recruited
within six months of stroke (McClellan 2004; Turton 1990). Two
trials recruited within 12 months of stroke (Salbach 2004; Yen
2005), and two trials recruited participants in the chronic phase
of stroke (Dean 1997; Dean 2000).
Interventions
Trials were divided into whole therapy approaches such as motor
relearning or movement science approaches, limb-specific mixed
task training or single task training. Two trials described using
whole therapy motor approaches (Langhammer 2000; Van Vliet
2005). Four trials trained single tasks - all related to balance, reach
or sit to stand (Barreca 2004; Dean 1997; de Sèze 2001; Howe
2005). The remaining trials consisted of limb-specific mixed func-
tional task training. Of these, three used a circuit training approach
(Blennerhassett 2004; Dean 2000; Salbach 2004). While all of the
remaining trials included some functional task practice, this was
sometimes mixed with other components, including: strengthen-
ing exercise and treadmill training (Kwakkel 1999a); upper limb
exercise (Turton 1990); lower limb exercise (McClellan 2004); and
shaping training (Yen 2005).
Of the 17 intervention-control pairs relevant to this review, four
were lower limb or mobility training (Blennerhassett 2004b; Dean
2000; Kwakkel 1999a; Salbach 2004a). One trained sit-to-stand
movements (Barreca 2004), two trained balance in sitting and
standing (de Sèze 2001; Howe 2005), one trained functional reach
in sitting (Dean 1997), and one trained standing balance and mo-
bility (McClellan 2004). Six intervention-control pairs were up-
per limb training (Blennerhassett 2004a; Kwakkel 1999b; Salbach
2004b; Turton 1990; Winstein 2004; Yen 2005). Two interven-
tion-control pairs used whole therapy approaches, training global
function (Langhammer 2000; Van Vliet 2005).
Setting
8Repetitive task training for improving functional ability after stroke (Review)
Copyright © 2014 The Cochrane Collaboration. Published by John Wiley & Sons, Ltd.

Four trials were carried out solely in an inpatient setting (Barreca
2004; Blennerhassett 2004; de Sèze 2001; Howe 2005); four tri-
als included both inpatient and outpatient care (Kwakkel 1999;
Langhammer 2000; Van Vliet 2005; Winstein 2004), four trials
were carried out in outpatient or community settings (Dean 1997;
Dean 2000; Salbach 2004; Yen 2005), and two trials were in the
home environment (McClellan 2004; Turton 1990). In three tri-
als, the intervention was additional to usual care, of which two were
during inpatient rehabilitation (Howe 2005; Winstein 2004), and
one was after discharge from inpatient therapy, but additional to
outpatient therapy (Turton 1990).
Amount of task practice
The number of hours training varied considerably across the in-
terventions. Three trials were estimated to have provided less than
10 hours training in total (Dean 1997; Howe 2005; Van Vliet
2005). A further seven trials provided between 10 and 21 hours
training (Barreca 2004; Blennerhassett 2004; Dean 2000; de Sèze
2001; Langhammer 2000; Salbach 2004; Winstein 2004). Two
trials provided more than 40 hours training (Kwakkel 1999; Yen
2005), and two trials prescribed more than 40 hours home exercise
therapy (Turton 1990; McClellan 2004).
Duration of training
The length of time that training was spread over varied from two
to four weeks for seven trials (Blennerhassett 2004; Dean 2000;
Dean 1997; de Sèze 2001; Howe 2005; Winstein 2004; Yen 2005).
For two trials, the duration of training was over the inpatient re-
habilitation period, with therapy for some participants in an out-
patient setting if required (Langhammer 2000; Van Vliet 2005).
The intervention in four trials was over six to eight weeks (Barreca
2004; McClellan 2004; Salbach 2004; Turton 1990). In one trial
the intervention was over 20 weeks (Kwakkel 1999).
Intervention delivery
All of the interventions were delivered by trained physiotherapists
or occupational therapists, except for the self-monitored home ex-
ercise programmes (McClellan 2004; Turton 1990), where trained
staff input was restricted to prescription and programme review;
in the trial by Howe 2005 where trained physiotherapy assistants
provided balance training, and in the trial by Barreca 2004 where
registered practical nurses delivered sit-to-stand training. Three of
the interventions were delivered in a group setting of between four
and seven participants per group (Barreca 2004; Blennerhassett
2004; Dean 2000). Of those programmes delivered in a circuit
class format, authors report between 70% to 80% compliance
(Blennerhassett 2004; Dean 2000; Salbach 2004). For the self-
administered programmes in a home setting, authors reported a
68% to 75% self-monitored adherence to the prescribed exercise
programme (McClellan 2004; Turton 1990).
Comparison interventions
Seven trials compared the intervention against an attention con-
trol: two trials used a recreation or cognitive therapy control group
(Barreca 2004; Dean 1997), one used a splint control (Kwakkel
1999), and four used a comparison training programme for the
upper or lower limb (Blennerhassett 2004; Dean 2000; McClellan
2004; Salbach 2004).
Seven trials compared the intervention against usual care. Of these,
three were during inpatient rehabilitation and provided equivalent
hours of therapy (de Sèze 2001; Langhammer 2000; Van Vliet
2005), and one provided additional hours of therapy (Winstein
2004). The other three intervention-control pairs were after dis-
charge from inpatient rehabilitation, and additional to any out-
patient treatment (McClellan 2004; Turton 1990; Yen 2005). It
is unclear whether the duration of therapy for the intervention-
control pair was equivalent for Yen 2005.
Outcomes
The 14 included trials used a wide range of different outcome
measures, measurement statistics, and time intervals for follow up.
Measures selected by the review team for each outcome category
are detailed below, and in Additional Table 2 (Table 2) for ease of
reference per outcome category. In some studies, more than one
measure was available for a category, and in this case, we prioritised
measures as detailed in the ’Methods of the review’ section.
Primary outcomes
(1) Upper limb functional outcome measures
(a) Arm function: Action Research Arm Test (ARAT) (Kwakkel
1999), Wolf Motor Function Test (WMFT) (Yen 2005), Mo-
tor Assessment Scale (MAS) - arm (Blennerhassett 2004a;
Langhammer 2000; Van Vliet 2005), Box and Block Test (BBT)
(Salbach 2004b), Functional Test of the Hemiparetic Upper Ex-
tremity (FTHUE) (Winstein 2004), and Southern Motor Group
Assessment - upper limb activity (Turton 1990)
(b) Hand function: Nine Hole Peg Test (9HPT) (Salbach 2004b),
Ten Hole Peg Test (10HPT) (Turton 1990), Motor Assessment
Scale (MAS) - hand (Blennerhassett 2004a; Langhammer 2000;
Van Vliet 2005)
(c) Sitting balance and reach: Reaching distance (Dean 1997),
Sitting Equilibrium Index (de Sèze 2001), Motor Assessment Scale
(MAS) - balanced sitting (Langhammer 2000; Van Vliet 2005)
and lateral reach - time to return to quiet sitting (Howe 2005)
(2) Lower limb functional outcome measures
(a) Walking distance: Six Minute Walk Test (6MWT) (
Blennerhassett 2004b; Dean 2000; Salbach 2004a)
9Repetitive task training for improving functional ability after stroke (Review)
Copyright © 2014 The Cochrane Collaboration. Published by John Wiley & Sons, Ltd.
(b) Walking speed: Ten Metre Walk speed (10MWS) with walking
aid (Dean 1997; Dean 2000; Kwakkel 1999a), Five Metre Walk
comfortable speed (5MWS) (Salbach 2004a), and Six Metre walk
speed (6MWS) (Van Vliet 2005)
(c) Functional Ambulation: Functional Ambulation Classification
(FAC) (de Sèze 2001; Kwakkel 1999a), Motor Assessment Scale
(MAS) - walking (Langhammer 2000; McClellan 2004; Van Vliet
2005)
(d) Sit to stand: Timed Up and Go (TUG) (Blennerhassett 2004b;
Dean 2000; Salbach 2004a), Motor Assessment Scale (MAS) - sit
to stand (Langhammer 2000; Van Vliet 2005), sit-to-stand time in
seconds (Howe 2005), and number of people able to stand safely
and independently on two occasions (Barreca 2004)
(e) Lower limb function: Sodring Motor Evaluation Scale (SMES)
trunk, balance and gait subscale (Langhammer 2000), Step Test
(Blennerhassett 2004b; Dean 2000), Rivermead leg and Trunk
(Van Vliet 2005)
(f ) Standing Balance and reach: Upright Equilibrium Index (de
Sèze 2001), Functional Reach (McClellan 2004), and Berg Balance
Scale (Salbach 2004a)
(3) Global motor function
Motor Assessment Scale (Langhammer 2000), and Rivermead
Gross Function subscale (Van Vliet 2005)
Secondary outcomes
(1) ADL measures
The Barthel Index (BI) (Kwakkel 1999; Langhammer 2000;
Salbach 2004a; Van Vliet 2005) and Functional Independence
Measure (FIM) (de Sèze 2001). Two trials used the Barthel Index
scoring out of 20 (de Sèze 2001; Van Vliet 2005), while the other
trials used the scoring out of 100.
(2) Impairment measures
(a) Upper limb impairment: Sodring Motor Evaluation Scale arm
subscale (Langhammer 2000) and the Fugl-Meyer Assessment (
Winstein 2004)
(b) Lower limb or standing balance impairment: Trunk Con-
trol Test (de Sèze 2001), Sodring Motor Evaluation leg subscale
(Langhammer 2000)
(3) Quality of life/health status measures
Dartmouth Primary Care Cooperative Chart (COOP) (Barreca
2004), and Nottingham Health Profile (NHP) (Kwakkel 1999:
Langhammer 2000)
(4) Adverse events
Number of falls was the only adverse event measured (Barreca
2004). Three trials narratively reported adverse events (de Sèze
2001; McClellan 2004; Salbach 2004a).
Excluded studies
There is a large number of excluded studies described in
Characteristics of excluded studies. Because of the difficulties
in determining whether trial interventions included task-specific
functional repetition, we have attempted to be as transparent as
possible about the basis on which trials were excluded. The reasons
for exclusion were:
(1) not repetition, or unable to determine amount of practice: thee
studies;
(2) not functional, or no functional outcome: seven studies;
(3) interpreted as focussing on exercise: four studies;
(4) mixed interventions: seven studies;
(5) comparison group also includes repetitive task practice: three
studies;
(6) passive movement: one study;
(7) trial not completed or information not available: three studies;
(8) methodological reasons: five studies.
The excluded studies included three trials that were translated
from Chinese to English (Li 2005; Liao 2006; Xiao 2002). While
full paper translation was undertaken by native speaking health
service workers, there is the possibility that information was mis-
interpreted or misunderstood.
Ongoing studies
There are seven ongoing studies, where the information available is
sufficient to say that the interventions include an element of RTT.
Three trials (Allison 2005; Askim 2005; Harris 2006), involve
training for standing, balance or sit to stand. Two trials (English
2005; Sherrington 2005) are of lower limb circuit training, and
one trial (Miller 2002) is of upper limb task-specific training. One
trial (Langhammer 2005) uses a motor relearning approach. All
are with participants in the early stages of stroke recovery, except
Langhammer 2005.
Studies awaiting assessment
Of the 17 studies awaiting assessment, 11 are ongoing studies,
where the information available is insufficient to be able to deter-
mine whether they would be eligible for inclusion in the review.
One study (McClain 2004) is unpublished, and we are awaiting
data. For one published study (Wang 2005), we were unable to
contact the authors to determine the exact content of the inter-
vention. Three studies (Muller 2004; Vaidya 2003; Venova 2003)
were published as conference proceedings, and we were unable to
contact the authors. One study (Yang 2006) was identified late in
10Repetitive task training for improving functional ability after stroke (Review)
Copyright © 2014 The Cochrane Collaboration. Published by John Wiley & Sons, Ltd.
the review process, and we are attempting to contact the authors
to determine eligibility.
Risk of bias in included studies
Allocation
Allocation concealment was adequate in eight trials (
Blennerhassett 2004; Dean 2000; Howe 2005; Kwakkel 1999;
McClellan 2004; Salbach 2004; Van Vliet 2005; Winstein 2004).
In five trials, allocation concealment was unclear. Three trials (de
Sèze 2001; Langhammer 2000; Yen 2005) stated random allo-
cation was used, but provided no description of the procedure.
The trial by Dean 1997 attempted concealment with a proce-
dure involving participants drawing cards out of a box contain-
ing 10 control group and 10 experimental group cards, however
the procedure for ensuring that those recruiting participants re-
mained unaware of assignments is not described. One trial (Barreca
2004) used coin flipping to randomise participants with no fur-
ther description of the procedure. In one quasi-experimental trial
(Turton 1990), participants were allocated to intervention or con-
trol groups in alternate runs of five, so allocation was not con-
cealed.
Blinding
Blinding of primary outcome assessment was stated in all trials
except two (Turton 1990; Winstein 2004). Of the studies that
stated observer blinding, three (Langhammer 2000; McClellan
2004; Yen 2005) gave no further details of how this was done. Four
trials (Dean 2000; Kwakkel 1999; Salbach 2004; Van Vliet 2005)
checked whether the outcome assessor had become unblinded,
and out of these, three trials (Dean 2000, Salbach 2004; Kwakkel
1999) reported that some degree of unmasking may have occurred.
Follow up and exclusions
Twelve trials provided information about numbers of with-
drawals and reasons for withdrawal (Barreca 2004; Blennerhassett
2004; Dean 1997; Dean 2000; Howe 2005; Kwakkel 1999;
Langhammer 2000; McClellan 2004; Salbach 2004; Turton 1990;
Van Vliet 2005; Winstein 2004); there were no withdrawals in
two trials (de Sèze 2001; Yen 2005).
All trials, with the exception of one (Winstein 2004), accounted
for all participants at the end of the trial. The trial by Winstein
2004 included participants in the analysis only if they completed
the treatment programme.
Nine trials had less than 10% loss to follow up post treatment
(Barreca 2004; Blennerhassett 2004; Dean 1997; de Sèze 2001;
Howe 2005; Salbach 2004; Turton 1990; Winstein 2004; Yen
2005). Three trials had between 10% and 20% loss to follow up
post treatment (Kwakkel 1999; Langhammer 2000; McClellan
2004). Two trials had more than 20% loss to follow up post treat-
ment (Dean 2000; Van Vliet 2005).
Other potential sources of bias
To detect systematic differences in care provided to participants
in comparison groups other than the intervention under inves-
tigation, trials were assessed to determine whether groups were
treated equally during the intervention and during usual care.
During the intervention, groups were treated equally in 10 trials
(Barreca 2004; Blennerhassett 2004; de Sèze 2001; Dean 1997;
Dean 2000; Kwakkel 1999; Langhammer 2000; McClellan 2004;
Salbach 2004; Turton 1990). In one trial there was no significant
difference in the amount of treatment, however there may have
been differences in elements of treatment such as detailed feed-
back and social conversation (Van Vliet 2001). In one trial it is
not clear whether groups were treated equally (Yen 2005).
In two trials participants in the intervention group received addi-
tional hours of therapy (Howe 2005; Winstein 2004). In Winstein
2004 participants in the functional task practice group received
an additional 20 hours of therapy over a four-week period; par-
ticipants in the balance training arm of the trial by Howe 2005
received an additional 12 therapy sessions over four weeks.
During usual care groups were treated equally in eight trials
(Barreca 2004; Blennerhassett 2004; Dean 1997; Dean 2000;
Howe 2005; Kwakkel 1999; Langhammer 2000; Turton 1990).
In four trials no information is provided (de Sèze 2001; Van
Vliet 2005; Winstein 2004; Yen 2005) and in a further two trials
(McClellan 2004; Salbach 2004) there is no usual care group.
Effects of interventions
Primary outcomes
Results are presented for (1) upper limb and (2) lower limb out-
comes, and (3) global motor function. All results are post therapy,
except for Langhammer 2000, which is three months post stroke,
and Van Vliet 2005, which is three months post baseline.
Upper limb function: post treatment
Results are presented for (1) arm function, (2) hand function, and
(3) sitting balance and reach.
Comparison 01.01: Arm function
Eight trials (Blennerhassett 2004a; Kwakkel 1999b; Langhammer
2000; Salbach 2004b; Turton 1990; Van Vliet 2005; Winstein
2004; Yen 2005) recruiting 467 participants measured arm func-
tion. Data were available for 88% (N = 412) of participants. The
11Repetitive task training for improving functional ability after stroke (Review)
Copyright © 2014 The Cochrane Collaboration. Published by John Wiley & Sons, Ltd.
impact of functional training on upper limb function post ther-
apy overall indicated a small but marginally non-significant effect:
SMD 0.17, 95% CI -0.03 to 0.36.
Comparison 01.02: Hand function
Five trials (Blennerhassett 2004a; Langhammer 2000; Salbach
2004b; Turton 1990; Van Vliet 2005) recruiting 324 participants
measured hand function. Data were available for 87% (N = 281) of
participants. The impact of functional training on hand function
was small and non-significant: SMD 0.16, 95% CI -0.07 to 0.40.
Comparison 01.03: Sitting balance/reach
Five trials (de Sèze 2001; Dean 1997; Howe 2005; Langhammer
2000; Van Vliet 2005), recruiting 256 participants measured sit-
ting balance or functional reach. Data were available for 82% (N
= 210) of participants. There was some heterogeneity of treatment
effects (I2 = 32%), although not sufficient to merit the use of a
random-effects approach. The impact of functional training on
sitting balance and reach was small and not statistically significant:
SMD 0.23, 95% CI -0.05 to 0.50.
Upper limb function: follow up
Comparison 02.01: All outcomes
(1) Under six months post treatment
Two trials (de Sèze 2001; Howe 2005) recruiting 55 participants
measured some aspect of upper limb function for retention effects
of RTT interventions under six months post treatment. Data were
available for 93% (N = 51) of participants. There was a moderate
effect size which was not statistically significant: SMD 0.50, 95%
CI -0.06 to 1.06.
(2) Between six and 12 months post treatment
Four trials (Blennerhassett 2004a; Langhammer 2000; Van Vliet
2005; Winstein 2004) recruiting 254 participants measured arm
function for retention effects of RTT interventions between six
and 12 months post treatment. Data were available for 76% (N =
195) of participants. Results showed no effect of treatment: SMD
-0.02, 95% CI -0.31 to 0.26.
Upper limb function: subgroup analyses
Comparison 03.01: Dosage of task practice
Trials were classified according to whether they provided 0 to 20
hours of therapy (eight trials), or more than 20 hours of ther-
apy (three trials). The greater duration of training for upper limb
function showed a somewhat larger and borderline statistically sig-
nificant effect size: SMD 0.40, 95% CI 0.03 to 0.78, versus the
lower dosage of task practice: SMD 0.18, 95% CI -0.02 to 0.39,
although these effects were not significantly different (chi squared
= 1.03, df = 1, P = 0.31).
Comparison 03.02: Time since stroke
Trials were classified according to whether they recruited within
15 days post stroke (four trials), 16 days to 6 months post stroke
(four trials), or more than six months post stroke (three trials). The
difference between the groups did not reach statistical significance
(chi squared = 0.05, df = 2, P = 0.98).
Comparison 03.03: Type of intervention
Trials were classified according to whether they were whole therapy
approaches (two trials), mixed task training (six trials), or single
task training (three trials). There is little evidence that the type of
RTT training has an impact on effect, with both whole therapy
and mixed functional task training approaches showing a small
but non-significant effect: whole therapy SMD 0.16, 95% CI -
0.18 to 0.49, mixed training SMD 0.20, 95% CI -0.04 to 0.44.
While there was more evidence of effect of single task training:
SMD 0.51, 95% CI 0.03 to 0.99, this was based on a small num-
ber of participants, all single-task training trials were interventions
related to balance training, and the difference between the sub-
groups was non-significant (chi squared = 1.58, df = 2, P = 0.45).
Lower limb function: post treatment
Results are presented for (1) walking distance, (2) walking speed,
(3) functional ambulation, (4) sit-to-stand, (5) lower limb func-
tion and (6) standing balance/reach. All results are post therapy,
except for Langhammer 2000, which is three months post stroke,
and Van Vliet 2005, which is three months post baseline.
Comparison 04.01: Walking distance: change from baseline
Three trials (Blennerhassett 2004b; Dean 2000; Salbach 2004a)
recruiting 133 participants measured walking distance. Data were
available for 98% (N = 130) of participants. Change from baseline
scores are presented. Using a random-effects model because of sig-
nificant heterogeneity in treatment effects, results were statistically
significant: MD 54.6, 95% CI 17.5 to 91.7. Re-analysis using the
12Repetitive task training for improving functional ability after stroke (Review)
Copyright © 2014 The Cochrane Collaboration. Published by John Wiley & Sons, Ltd.
standardised mean difference confirmed that the result remained
statistically significant: SMD 0.98, 95% CI 0.23 to 1.73. In effect,
participants in the experimental groups could walk on average 55
metres further in six minutes than those in the control groups.
Comparison 04.02: Walking speed
Five trials (Dean 1997; Dean 2000; Kwakkel 1999a; Salbach
2004a; Van Vliet 2005) recruiting 311 participants measured
walking speed, with data available for 85% (N = 263) of partic-
ipants. Results showed a small, statistically significant effect size:
SMD 0.29, 95% CI 0.04 to 0.53.
Comparison 04.03: Functional ambulation
Five trials (de Sèze 2001; Kwakkel 1999a; Langhammer 2000;
McClellan 2004; Van Vliet 2005) recruiting 295 participants mea-
sured functional ambulation, with data available for 81% (N =
238). There was some heterogeneity of treatment effects, but not
sufficient to warrant using a random-effects method of analysis.
Results indicated a small, borderline statistically significant effect:
SMD 0.25, 95% CI 0.00 to 0.51.
Comparison 04.04: Sit-to-stand: post treatment/change from
baseline
Seven trials (Barreca 2004; Blennerhassett 2004b; Dean 2000;
Howe 2005; Langhammer 2000; Salbach 2004a; Van Vliet 2005)
recruiting a total of 397 participants, included a measure of sit-
to-stand, with data available for 87% (N = 346). Results were
significant overall: standardised effect size 0.35, 95% CI 0.13 to
0.56.
Comparison 04.05: Lower limb functional measures
Four trials (Blennerhassett 2004b; Dean 2000; Langhammer
2000; Van Vliet 2005) recruiting 223 participants included a mea-
sure of lower limb function, with data available for 79% (N =
176). Results overall showed a small effect size, which was not
statistically significant: SMD 0.20, 95% CI -0.10 to 0.50.
Comparison 04.06: Standing balance/reach
Three trials (de Sèze 2001; McClellan 2004; Salbach 2004a) re-
cruiting 137 participants measured standing balance or functional
reach, with data available for 96% (N = 132). Results showed a
small effect size, which was not statistically significant: SMD 0.29,
95% CI -0.06 to 0.63.
Lower limb function: follow up
Comparison 05.01: all outcomes
(1) Under six months post treatment
Four trials (de Sèze 2001; Dean 2000; Howe 2005; McClellan
2004) recruiting 93 participants measured some aspect of lower
limb function for retention effects of RTT interventions under
six months post treatment. Data were available for 86% (N = 80)
of participants. Effects across trials were homogeneous (I2 = 0%).
Results showed a very small effect size which was not statistically
significant: SMD 0.11, 95% CI -0.33 to 0.56.
(2) Between six to 12 months post treatment
Three trials (Blennerhassett 2004b; Langhammer 2000; Van Vliet
2005) recruiting 211 participants measured some aspect of lower
limb function for retention effects of RTT interventions between
six to 12 months post treatment. Data were available for 80% (N
= 170) of participants. There was some degree of heterogeneity of
treatment effects (I2 = 49.1%), although not sufficient to merit
the use of a random-effects approach (and the small effect size
precludes the need to perform a sensitivity analysis on the choice
of analytic approach). Results showed no treatment effect: SMD
-0.01, 95% CI -0.32 to 0.29.
Lower limb function: subgroup analyses
Comparison 06.01: Dosage of task practice
Two trials providing more than 20 hours of task practice showed a
moderate effect size: SMD 0.56, 95% CI 0.11 to 1.01, There was a
small, borderline non-significant effect from eight trials providing
20 hours training or less: SMD 0.19, 95% CI -0.03 to 0.40.
However, the difference in effects between these subgroups was
not statistically significant (chi squared = 2.11, df = 1, P = 0.15).
Comparison 06.02: Time since stroke
The analysis suggests that size of the effect on lower limb function
is the same whether recruitment to training is within 15 days post
stroke (three trials): SMD 0.24, 95% CI -0.04 to 0.52, from 15
days to six months of stroke (four trials): SMD 0.29, 95% CI -
0.11 to 0.69, or more than six months post stroke (three trials):
SMD 0.26, 95% CI -0.11 to 0.62 (chi squared = 0.04, df = 2, P
= 0.98).
13Repetitive task training for improving functional ability after stroke (Review)
Copyright © 2014 The Cochrane Collaboration. Published by John Wiley & Sons, Ltd.
Comparison 06.03: Type of intervention
Results for single task (three trials): SMD -0.07, 95% CI -0.55 to
0.41, and whole therapy approaches (two trials): SMD 0.10, 95%
CI -0.24 to 0.43 are not statistically significant, although the total
sample size for single task training is very small (N = 63). Mixed
training (five trials) had a moderate and statistically significant
effect: SMD 0.48, 95% CI 0.20 to 0.75. There was a statistically
significant difference between subgroups (chi squared = 5.06, df =
2, P = 0.08), suggesting that mixed training might be better than
other forms of training for lower limb function.
Global motor function
Comparison 07.01: Global motor function scales
Two trials (Langhammer 2000; Van Vliet 2005), recruiting a total
of 181 participants measured global motor function. Results were
available for 76% (N = 138) of participants and indicated a small
to moderate effect size, although this was of borderline statistical
significance: SMD 0.32, 95% CI -0.01 to 0.66. There were too few
trials to undertake planned subgroup analyses for global functional
outcomes.
Secondary outcomes
Results are presented for (1) ADL function, (2) upper limb im-
pairment, (3) lower limb impairment, (4) quality of life/health
status, and (5) adverse events.
Comparison 08.01: ADL function
Seven intervention-control pairs (de Sèze 2001; Kwakkel 1999a;
Kwakkel 1999b; Langhammer 2000; Salbach 2004a; Salbach
2004b; Van Vliet 2005), recruiting a total of 399 participants,
used a measure of activities of daily living with data available for
81% (N = 325). Kwakkel 1999 comprises the combined results
for the upper and lower limb training groups compared against a
splint control group, based on the assumption that effect sizes are
similar for the two intervention-control pairs. The data presented
for Salbach 2004 are the results for the lower limb training group
compared against the upper limb training attention control group
(Salbach 2004a). Overall results indicated a small effect size that
was statistically significant: SMD 0.29, 95% CI 0.07 to 0.51.
Comparison 08.02: Upper limb impairment
Three trials (Langhammer 2000; Salbach 2004b; Winstein 2004),
recruiting 195 participants, measured upper limb impairment,
with data available for 94% (N = 184). The small effect size shown
was not statistically significant: SMD 0.14, 95% CI -0.15 to 0.43.
Comparison 08.03: Lower limb impairment
Two trials (de Sèze 2001; Langhammer 2000), recruiting 81 par-
ticipants, included a measure of lower limb impairment, with data
available for 90% (N = 73). The small effect size shown was not
statistically significant SMD 0.13, 95% CI -0.33 to 0.59.
Comparison 08.04: Quality of life/health status
Three intervention-control pairs (Barreca 2004; Kwakkel 1999;
Langhammer 2000), recruiting 177 participants, used a measure
of quality of life or health status, with data available for 83% (N =
148). All results are post therapy except Kwakkel 1999, which was
measured at 26 weeks. There was a very small effect size, which
was not statistically significant: SMD 0.08, 95% CI -0.24 to 0.41.
Adverse events
One trial of sit-to-stand training (Barreca 2004) presented data
for the number of falls: intervention group 3/25 (12%) versus
control group 4/23 (17.4%), OR 0.65, 95% CI 0.13 to 3.27. No
other trials presented data for adverse events, but two trials narra-
tively reported no adverse effects (de Sèze 2001; McClellan 2004).
In Salbach 2004, intervention-related reasons for withdrawal that
could be interpreted as adverse events included one participant
out of 47 in a mobility training group who experienced the onset
of groin pain. Four participants also fell during the mobility in-
tervention but did not suffer injury and continued to participate
in the group. Two falls also occurred during evaluation. No other
trials reported intervention-related reasons for withdrawal.
Sensitivity analyses
Planned sensitivity analyses were conducted for (1) allocation con-
cealment, (2) type of comparison group, and (3) equivalence of
therapy time.
Comparison 09.01: Allocation concealment
Trials were grouped according to whether allocation concealment
was judged to be adequate (eight trials): SMD 0.37, 95% CI 0.17
to 0.58, or inadequate/unclear (five trials): SMD 0.40, 95% CI
0.07 to 0.74. There was no statistically significant difference be-
tween the subgroups (chi squared = 0.03, df = 1, P = 0.86).
Comparison 09.02: Comparison groups
While six trials with an attention control comparison group
showed a somewhat larger effect size (SMD 0.53, 95% CI 0.26 to
0.80) than seven trials using usual care comparisons (SMD 0.27,
95% CI 0.03 to 0.50) the difference was not quite statistically
significant (chi squared = 2.08, df = 1, P = 0.15).
14Repetitive task training for improving functional ability after stroke (Review)
Copyright © 2014 The Cochrane Collaboration. Published by John Wiley & Sons, Ltd.
Comparison 09.03: Equivalence of therapy time
Two trials gave additional therapy time to the experimental group
(SMD 0.09, 95% CI -0.41 to 0.59) versus trials where therapy
time for experimental and control groups was equivalent (SMD
0.42, 95% CI 0.23 to 0.61). There was no significant difference
between the two subgroups (chi squared = 1.47, df = 1, P = 0.23).
D I S C U S S I O N
Summary of main results
Upper limb function/sitting balance
Eight trials (Blennerhassett 2004; Kwakkel 1999b; Langhammer
2000; Salbach 2004b; Turton 1990; Van Vliet 2005; Winstein
2004; Yen 2005) with 467 participants measured upper limb
function. Of these, two trials (Langhammer 2000; Van Vliet
2005) were whole therapy approaches, two trials (Blennerhassett
2004; Salbach 2004b) were circuit training approaches, three trials
(Kwakkel 1999b; Turton 1990; Winstein 2004), were functional
task practice combined with other forms of upper limb exercise,
and one trial (Yen 2005) was the intensive practice component of
constraint-induced movement therapy without the constraint. All
of these interventions were delivered by a therapist, except Turton
1990, which consisted of self-initiated practice in the home envi-
ronment using a booklet of exercises after instruction by a thera-
pist. Of the arm training trials, all but two (Salbach 2004b; Yen
2005) were carried out 0 to six months post stroke. Five trials
(Blennerhassett 2004; Langhammer 2000; Salbach 2004b; Van
Vliet 2005; Winstein 2004) had a total training time of 20 hours
or less, and three trials (Kwakkel 1999b; Turton 1990; Yen 2005)
provided more than 20 hours total training time. In two of the
trials (Turton 1990; Winstein 2004) training time was additional.
Five trials (de Sèze 2001; Dean 1997; Howe 2005; Langhammer
2000; Van Vliet 2005) with 256 participants measured sitting
balance/reach from sitting. Of these, two trials (Langhammer
2000; Van Vliet 2005) were whole therapy approaches, while the
other three trials specifically trained sitting balance or reach from
sitting. All of the interventions were carried out in the 0- to six
month post-stroke period and delivered by a therapist in a hospital
setting, except one trial (Dean 1997). Here the intervention was
carried out at home, with people more than six months post stroke.
All of the interventions were 20 hours training or less.
In summary, there was no evidence for the effectiveness of RTT on
arm function (SMD 0.17, 95% CI -0.03 to 0.36), hand function
(SMD 0.16, 95% CI -0.07 to 0.40), or sitting balance/functional
reach (SMD 0.23, 95% CI -0.05 to 0.50). Results for later follow
up were also not statistically significant up to six months post
therapy (SMD 0.50, 95% CI -0.06 to 1.06), or between six months
and one year post therapy (SMD -0.02, 95% CI -0.31 to 0.26).
Treatment effects were not modified by dosage of task practice,
time since stroke or type of task training.
Lower limb function/standing balance
Nine trials (Barreca 2004; Blennerhassett 2004b; Dean 2000; de
Sèze 2001; Kwakkel 1999a; Langhammer 2000; McClellan 2004;
Salbach 2004a; Van Vliet 2005), with 476 participants measured
lower limb function or standing balance, or both. Of these, one
trial (Barreca 2004) specifically trained sit-to-stand movements,
one trial (de Sèze 2001) trained sitting and standing balance, two
trials (Langhammer 2000; Van Vliet 2005) were whole therapy ap-
proaches, three trials (Blennerhassett 2004b; Dean 2000; Salbach
2004a) were circuit training approaches, and two trials (Kwakkel
1999a; McClellan 2004) were lower limb task practice combined
with other forms of mobility exercise. All trials were delivered by
a therapist in a hospital or community setting, except for one trial
(McClellan 2004), which was a home mobility programme for
participants following a videotaped exercise programme with ther-
apist telephone contact and follow up. Three of the interventions
were carried out more than six months post stroke (Dean 2000;
McClellan 2004; Salbach 2004a). Two trials included more than
20 hours total practice time (Kwakkel 1999a; McClellan 2004).
In summary, there was evidence for a statistically significant small
to moderate impact of RTT training on some aspects of lower limb
function, including walking distance (MD 54.6, 95% CI 17.5 to
91.7), walking speed (SMD 0.29, 95% CI 0.04 to 0.53), and sit-
to-stand (standard effect estimate 0.35, 95% CI 0.13 to 0.56).
Results for functional ambulation were small, and of borderline
statistical significance: SMD 0.25, 95% CI 0.00 to 0.51. There
was no evidence of effect on lower limb functional measures, or
standing balance/reach. Results at follow up were not statistically
significant at up to six months post therapy (SMD 0.11, 95% CI
-0.33 to 0.56), or up to one year post therapy (SMD -0.01, 95%
CI -0.32 to 0.29). Effects were not found to be dependent on time
since stroke. Effects of larger versus smaller amounts of training
also did not reach statistical significance (P = 0.15). Comparing
mixed task training approaches against whole therapy or single
task training showed a moderate effect (P = 0.08). However, the
sample size (N = 63) for single task training was very small.
Global motor function
For the two trials (Langhammer 2000; Van Vliet 2005) using
global motor function measures, there was a pooled small to mod-
erate, borderline statistically significant effect on global motor
function: SMD 0.32, 95% CI -0.01 to 0.66.
Secondary outcomes
15Repetitive task training for improving functional ability after stroke (Review)
Copyright © 2014 The Cochrane Collaboration. Published by John Wiley & Sons, Ltd.
There was a small, statistically significant effect on activities of daily
living: SMD 0.29, 95% CI 0.07 to 0.51. There was no evidence
of impact on upper limb impairment (SMD 0.14, 95% CI -0.15
to 0.43), lower limb impairment (SMD 0.13, 95% CI -0.33 to
0.59), or perceptions of quality of life/health status (SMD 0.08,
95% CI -0.24 to 0.41). Repetitive task training was not associated
with a greater number of adverse events, although the data on
which this was based were limited.
Overall completeness and applicability ofevidence
The included trials were clinically diverse in focus and there are
gaps in the evidence base, particularly for people who are more
than six months post stroke. Only two trials have evaluated the
impact of RTT on upper limb function in people more than six
months post-stroke: one trial for 20 hours or less (Salbach 2004b),
and one for more than 20 hours (Yen 2005). Only two trials have
evaluated the impact of RTT on upper limb function in people
zero to six months post stroke (Kwakkel 1999b; Turton 1990).
More trials have focused on the impact of RTT on lower limb
function, but here there are also gaps in the evidence, with only
one trial evaluating more than 20 hours lower limb training in
people zero to six months post stroke (Kwakkel 1999a), and one
trial providing more than 20 hours training for people more than
six months post stroke (McClellan 2004).
Although we were unable to classify participants into more dis-
abled or less disabled participant subgroups, the Characteristics of
included studies table illustrates the wide range of disability levels
of the participants within the included trials. However, many of
the trials had inclusion criteria specifying either minimum, or min-
imum and maximum levels of ability, motivation to participate,
and ability to understand instruction. The evidence provided by
the review therefore appears to be widely applicable, perhaps with
the exception of very severely disabled people with little postural
control or voluntary movement, those with very mild deficits, and
those with severe communication difficulties.
Trials were excluded when the repetition described appeared to be
primarily for strength or endurance training, for example cycling
or gait training, and when the type of training appeared divorced
from the functional aim, for example backward walking training,
slot machines, or computer games. This may have consequences
for the applicability of the evidence. By the exclusion of trials
of what could be defined as ’pre-functional’ types of movement,
we will effectively have excluded a group of people who cannot
yet participate in functional movement. The same consequence
applies to the exclusion of trials with a large element of passive
and active-assisted movement.
In terms of generalisability to the UK, only three interventions
have been evaluated in this setting. One trial is a whole therapy
approach (Van Vliet 2005), one trial evaluated balance training
(Howe 2005), and one quasi-experimental trial evaluated self-de-
livered exercise in the home environment (Turton 1990). Repet-
itive task training has not traditionally been a significant part of
therapy after stroke in the UK, which has been dominated by
the Bobath approach. This specifically minimises repetitive active
movement, and relies upon therapist-guided restoration of ’nor-
mal movement’ patterns, rather than the functional but unnatural
ones which could occur as a result of a more pragmatic approach
within RTT. Many of the studies in the review were from outside
the UK, or used therapy approaches which have been less popular,
such as motor learning. Whilst clinical experience suggests that
modern stroke units have a more eclectic therapy approach it may
take longer for the results to change practice within the UK than
countries that already use RTT routinely. Although RTT is likely
to be transferable in principle, its effectiveness against other forms
of care usual in the UK and its acceptability in this healthcare
setting has not been tested, except as part of the overall movement
science approach in the trial by Van Vliet 2005. In particular, the
feasibility and acceptability of circuit-style training approaches in
community settings would need to be evaluated. The delivery of
interventions after the normal rehabilitation period also represents
additional periods of treatment than those currently provided.
The acceptability and safety of RTT to all types of participants is
also unclear. While there were few adverse effects reported overall,
the lack of formal reporting means that this finding is inconclu-
sive. Of the information provided about reasons for drop outs in
the trials, the most frequent cause was physical illness, and only a
very small proportion of those participating dropped out for phys-
ical reasons that might have been related to the intervention. Ex-
cluding illness, 11 participants failed to complete treatment in the
experimental groups, and seven participants in the control groups,
which was not a significant difference. However, there were also a
small number of participants who were lost to follow up for rea-
sons related to compliance or treatment preference.
Information about recruitment was not often provided, but of
those that did provide information, a large trial recruiting inpa-
tients early after stroke had a relatively low number of refusals
to participate (for example, Kwakkel 1999 had four out of 101
participants who did not give consent), while a trial recruiting in
the community after rehabilitation had high numbers of refusal of
the intervention (for example, Salbach 2004a had 73% refusal).
It may be that some forms of intervention are less acceptable, or
that interventions only appeal to a subset of stroke survivors, par-
ticularly if travel is involved.
We were unable to reach any conclusions about the impact of
numbers of repetitions as a measure of the intensity of practice, as
this information was rarely provided. The amount of task practice
is therefore a measure of the intervention duration (that is, time
spent).
We were also unable to comment on the resource implications
of different sites of treatment, therapist-delivered versus self-de-
livered interventions, or group versus individual delivery, as there
were too few trials for comparison. However, the presence of two
16Repetitive task training for improving functional ability after stroke (Review)
Copyright © 2014 The Cochrane Collaboration. Published by John Wiley & Sons, Ltd.
trials involving self-delivery in the home environment (McClellan
2004; Turton 1990), and three trials involving group delivery of
task-specific training (Barreca 2004; Blennerhassett 2004; Dean
2000), suggest that these modes of delivery are feasible. The two
studies that collected information showed generally high levels of
satisfaction with the programme (Barreca 2004; Dean 2000). At-
tendance levels at community programmes were also very good,
suggesting that these training programmes were well received by
those who chose to participate.
Quality of evidence
Eight out of 14 trials had adequate allocation concealment. Five
out of the remaining six trials reported allocation concealment, but
the method was often unclear. However, when trials with an un-
clear method of allocation concealment were grouped with trials
where it was judged inadequate or not used (one trial), there was
no statistically significant difference in treatment effect compared
against trials with adequate allocation concealment. Of the ran-
domised controlled trials that were not pilot studies, only four out
of 10 gave a power calculation for sample size. These were some
of the larger studies (Blennerhassett 2004; Langhammer 2000;
Salbach 2004; Van Vliet 2005). However, half of the 14 trials had
more than 50 participants. Most of the trials stated that blinded
independent assessors were used, but only a minority referred to
checks for assessor unblinding. Therapy time was non-equivalent
in two trials. The overall quality of trials gives a degree of confi-
dence in the results.
Potential biases in the review process
When the review was being designed, an early decision was made
to consider the effect of RTT on upper and lower limb function
outcomes separately, as we thought that there might be a differ-
ential impact. The results of the review support this decision, al-
though there are two disadvantages. Firstly, we are unable to give
an overall effect estimate for RTT, although considering the differ-
ent interventions and objectives of upper and lower limb training
this may not have been a clinically meaningful figure. Secondly,
subgroup analyses are smaller, and therefore less well powered than
they would have been if all 14 trials had been combined. As the
number of studies reported in the subgroup analyses are small, the
results should be treated with caution.
Our major focus in this review was impact on task-specific func-
tion. In practice, we excluded a large number of studies, on the
basis that we did not judge the outcomes to be functional, or
the intervention to be task-specific. We have also included studies
where our interpretation of the intervention was that repetition
of functional movement was a major mechanism of action (for
example, de Sèze 2001). Whether balance training is truly ’func-
tional’ is also a matter of interpretation.
Although interventions were often well described, it was some-
times difficult to estimate the relative intensity of treatment, es-
pecially within mixed interventions. Information on the number
of repetitions was rarely available. This potentially means that the
review is investigating the impact of functional task specificity
rather more than the element of repetition. In addition, many of
the trials referred to motor learning principles as the basis for the
intervention. This approach involves a much more complex set of
principles than just task-specific repetition, including targeting to
individual needs, task variation and particular forms of feedback.
Inclusion of these trials in the review suggests reducing motor
learning or movement science therapies to their lowest common
denominator, but even those trials which did not claim a basis in
such approaches often also included aspects of active learning, task
shaping, feedback, or individualisation of treatment. Our decision
was to include trials if we could clearly identify the amount of
practice.
The included trials used a wide range of outcome measures,
methodologies and time intervals for follow up making summary
statistics difficult. We made strenuous efforts to obtain data suit-
able for pooling for each outcome, but sometimes these were not
available, and the method of pooling less than optimum, such
as the use of standardised mean difference for walking speed. It
would have been better to use outcome changes compared to base-
line, especially for analyses with smaller numbers of participants,
but these were also not available across trials. We also generally
used fixed-effect analyses, which some might criticise due to the
presence of some clinical heterogeneity in the treatments and trials
combined.
The subgroup analysis of trial design (that is, attention control
versus usual care control) did not reach statistical significance, but
was approaching it (P = 0.15). However, maintaining the upper
and lower limb trials separately meant that further subdivision
into type of comparison group was not feasible.
Agreements and disagreements with otherstudies or reviews
As in other reviews (for example, Kwakkel 2004), this review sug-
gests there is a differentiation of effect of training for upper and
lower limbs. Repetitive task training resulted in modest improve-
ments in lower limb function, but in contrast to other reviews
(such as Barreca 2003) we found no evidence of significant benefit
from repetitive training of upper limb function. While treatment
effects of longer versus shorter amounts of training were of a dif-
ferent magnitude for upper limb function, the difference did not
reach statistical significance. Hence, the review did not provide
evidence to support a suggestion that upper limb results are mod-
erated by the amount of practice (Van der Lee 2001). However,
this is very tentative, as only three studies included more than 20
hours training.
17Repetitive task training for improving functional ability after stroke (Review)
Copyright © 2014 The Cochrane Collaboration. Published by John Wiley & Sons, Ltd.

There were small positive effects on global motor function, activ-
ities of daily living, and ambulation classification. Even though
the amount of change is small, the clinical benefit of the change
in activities of daily living is likely to be meaningful in relation to
quality of life (Van Exel 2004).
In those studies that did show a benefit and provided later assess-
ments, improvements at the end of training were not evident at
the later stage. It is unclear from this review whether this is related
to characteristics of the participants, the intensity of training or
the degree of improvement required before detectable change was
noted.
Evidence from this review does not support the suggestion that
earlier provision of treatment results in greater functional improve-
ment as treatment effects were not modified by time since stroke.
Improvement in function was possible even in the later stages of
recovery (Page 2004). We were unable to come to any conclusions
about the previously identified dose-response relationship between
amount of therapy and improved outcome (Kwakkel 2004), but
the results from subgroup analysis suggest this as a priority for
further research.
In a review of physiotherapy treatments after stroke (Pollock 2007)
it is suggested that research should be conducted to determine
the efficacy of clearly described individual techniques and task-
specific treatments. Clear definition of individual techniques still
remains a challenge but this review suggests that focussing on
specific treatments is possible although a taxonomy for grouping
such interventions does not exist. Readers may not agree with some
of our classification of studies, but the review group compared all
interventions in detail to make these difficult decisions.
The mechanisms of action responsible for any lower limb func-
tional gain are still unclear. Many of the interventions were mixed,
and while all contained repetition and functional practice, they
could also include elements of endurance or strength training.
However, the review of treadmill training (Moseley 2005) found
very little evidence of impact. Results of a recent review of robot-
aided therapy on arm function (Prange 2006) also showed no con-
sistent functional gain. Given that repetition is a major mecha-
nism of action in both treadmill and robotics, this would suggest
that reflecting real-world task complexity in training is a signif-
icant factor. However, other potential mechanisms of action are
also implicit in some of the trial interventions, such as self-efficacy,
task-novelty, and motivation to participate in the interventions
delivered in a group setting.
In this review, we did not compare RTT against other interven-
tions. Research comparing 20 hours functional task practice with
strength training (Winstein 2004) in 64 participants with recent
stroke suggested that the immediate benefits of a functional task
approach were similar to those of a resistance strength training ap-
proach, but that the functional task approach was more beneficial
in the longer term. However, this review did not find evidence of
retention effects for RTT at six or 12 months.
A U T H O R S ’ C O N C L U S I O N S
Implications for practice
The results of this review provide sufficient evidence to validate
the general principle that repetitive, task-specific training for lower
limbs can result in functional gain when compared against other
forms of usual care or attention control. While functional gain is
modest, impact does appear to be of a clinically meaningful mag-
nitude. It is, however, unclear as to whether effects are sustained.
There is insufficient evidence to make any recommendations for
upper limb interventions, but repetitive task training showed no
significant advantage. Some caution is needed in interpreting the
lack of evidence for adverse effect, as few trials specifically moni-
tored these as an outcome. If task-specific training is used in clin-
ical practice, adverse effects should be monitored.
Implications for research
Further primary research should be directed towards exploration
of the impact of the type and amount of task training for lower
limb function, and how to maintain functional gain. It is unclear
whether task training accelerates recovery or simply improves per-
formance for an interval. This review did not provide evidence of
a treatment effect for upper limb function. However, only three
trials provided evidence to estimate the effect of more intensive
therapy, two of which were in the acute stage of stroke, and one
in the sub-acute stage. The trials also included people of differing
levels of ability at entry. The conclusion of this review about lack of
evidence for efficacy of task training for arm function is therefore
very tentative, and further research relating to the type, amount
and intensity of task training for arm function among participants
with different clinical characteristics would be useful.
There were insufficient trials included in the review to evaluate
the efficacy and cost-effectiveness of different intervention deliv-
ery methods for repetitive task training, such as group training, or
practice in the home environment. Further research should address
practical ways of delivering repetitive task training interventions.
In particular, the acceptability of circuit type training interven-
tions in community settings would need to be evaluated. Further
research should also address practical ways of maintaining post-
therapy functional gain. Future trials should be powered to detect
cost-effectiveness as well as clinical effect, and should include a
quality of life measure as one of the outcomes.
We were unable to investigate the impact on people of different
levels of pre-intervention disability, because of the wide range of
baseline measures used. Analyses of this type would be facilitated
by the inclusion in trials of baseline data using a common measure
such as the Barthel Index, which can be related to population
norms dependent on time since stroke.
This review did not compare repetitive functional task training
against other interventions not currently viewed as a component
18Repetitive task training for improving functional ability after stroke (Review)
Copyright © 2014 The Cochrane Collaboration. Published by John Wiley & Sons, Ltd.
of usual care. A review of this type would be valuable.
A C K N O W L E D G E M E N T S
We wish to acknowledge the support of Brenda Thomas and Hazel
Fraser from the Cochrane Stroke Group for their help in the re-
view process. We would also like to thank all of the trial authors
who kindly replied to our requests for information, the peer re-
viewers for their helpful direction, and our translators: Jie Shen,
Dr. Qinghai Huang, Hua Zhang, Gediminas Juaga, and Luyan
Fang.
R E F E R E N C E S
References to studies included in this review
Barreca 2004 {published and unpublished data}
Barreca S, Sigouin CS, Lambert C, Ansley B. Effects of
extra training on the ability of stroke survivors to perform
an independent sit-to stand: a randomized controlled trial.
Journal of Geriatric Physical Therapy 2004;27(2):59–64.
[MEDLINE: 200422110]
Blennerhassett 2004 {published and unpublished data}
Blennerhassett J, Dite W. Additional task-related practice
improves mobility and upper limb function early after
stroke: a randomised controlled trial. Australian Journal
of Physiotherapy 2004;50(4):219–24. [MEDLINE:
15574110]
Blennerhassett 2004a {published and unpublished data}
Blennerhassett J, Dite W. Additional task-related practice
improves mobility and upper limb function early after
stroke: a randomised controlled trial. Australian Journal
of Physiotherapy 2004;50(4):219–24. [MEDLINE:
15574110]
Blennerhassett 2004b {published and unpublished data}
Blennerhassett J, Dite W. Additional task-related practice
improves mobility and upper limb function early after
stroke: a randomised controlled trial. Australian Journal
of Physiotherapy 2004;50(4):219–24. [MEDLINE:
15574110]
Dean 1997 {published and unpublished data}
Dean CM, Shepherd RB. Task-related training improves
performance of seated reaching tasks after stroke. Stroke
1997;28:722–8. [MEDLINE: 9099186]
Dean 2000 {published and unpublished data}
Dean CM, Richards CL, Malouin F. Task-related circuit
training improves performance of locomotor tasks in
chronic stroke: a randomized, controlled pilot trial. Archives
of Physical Medicine and Rehabilitation 2000;81:409–17.
[MEDLINE: 10768528]
de Sèze 2001 {published data only}
de Sèze M, Wiart L, Bon-Saint-Côme A, Debelleix X,
de Sèze M, Joseph P, et al.Rehabilitation of postural
disturbances of hemiplegic patients by using trunk control
retraining during exploratory exercises. Archives of Physical
and Medical Rehabilitation 2001;82:793–800. [MEDLINE:
11387585]
Howe 2005 {published data only}
Howe TE, Taylor I, Finn P, Jones H. Lateral weight
transference exercises following acute stroke: a preliminary
study of clinical effectiveness. Clinical Rehabilitation 2005;
19:45–53. [MEDLINE: 15704508]
Kwakkel 1999 {published and unpublished data}
Kwakkel G, Wagenaar RC, Twisk JWR, Langhorst GJ,
Koetsier JC. Intensity of leg and arm training after primary
middle-cerebral-artery stroke: a randomised trial. Lancet
1999;354:191–6. [MEDLINE: 10421300]
Kwakkel 1999a {published and unpublished data}
Kwakkel G, Wagenaar RC, Twisk JWR, Langhorst GJ,
Koetsier JC. Intensity of leg and arm training after primary
middle-cerebral-artery stroke: a randomised trial. Lancet
1999;354:191–6. [MEDLINE: 10421300]
Kwakkel 1999b {published and unpublished data}
Kwakkel G, Wagenaar RC, Twisk JWR, Langhorst GJ,
Koetsier JC. Intensity of leg and arm training after primary
middle-cerebral-artery stroke: a randomised trial. Lancet
1999 1999;354:191–6. [MEDLINE: 10421300]
Langhammer 2000 {published and unpublished data}∗ Langhammer B, Stanghelle JK. Bobath or Motor
Relearning Programme? A comparison of two different
approaches of physiotherapy in stroke rehabilitation: a
randomized controlled study. Clinical Rehabilitation 2000;
14:361–9. [MEDLINE: 10945420]
Langhammer B, Stanghelle JK. Bobath or Motor Relearning
Programme? A follow-up one and four years post stroke.
Clinical Rehabilitation 2003;17:731–4. [MEDLINE:
14606738]
19Repetitive task training for improving functional ability after stroke (Review)
Copyright © 2014 The Cochrane Collaboration. Published by John Wiley & Sons, Ltd.
McClellan 2004 {published data only}
McClellan R, Ada L. A six week, resource-efficient mobility
program after discharge from rehabilitation improves
standing in people affected by stroke: placebo-controlled,
randomised trial. Australian Journal of Physiotherapy 2004;
50:163–7. [MEDLINE: 15482247]
Salbach 2004 {published and unpublished data}
Higgins J, Salbach NM, Wood-Dauphinee S, Richards CL,
Côté R, Mayo NE. The effect of a task oriented intervention
on arm function in people with stroke: a randomized
controlled trial. Clinical Rehabilitation 2006;20:296–310.
Salbach NM, Mayo NE, Robichaud-Ekstrand S, Hanley
JA, Richards CL, Wood-Dauphinee S. The effect of a task-
oriented walking intervention on improving balance self-
efficacy poststroke: a randomized, controlled trial. Journal
of the American Geriatric Society 2005;53:576–82.∗ Salbach NM, Mayo NE, Wood-Dauphinee S, Hanley
JA, Richards CL, Côte R. A task-orientated intervention
enhances walking distance and speed in the first year post
stroke: a randomized controlled trial. Clinical Rehabilitation
2004;18:509–19.
Salbach 2004a {published and unpublished data}
Salbach NM, Mayo NE, Robichaud-Ekstrand S, Hanley
JA, Richards CL, Wood-Dauphinee S. The effect of a
task-oriented walking intervention on improving balance
self-efficacy poststroke: a randomized, controlled trial.
Journal of the American Geriatric Society 2005;53:576–82.
[MEDLINE: 15817001]∗ Salbach NM, Mayo NE, Wood-Dauphinee S, Hanley
JA, Richards CL, Côte R. A task-orientated intervention
enhances walking distance and speed in the first year post
stroke: a randomized controlled trial. Clinical Rehabilitation
2004;18:509–19. [MEDLINE: 15293485]
Salbach 2004b {published and unpublished data}
Higgins J, Salbach NM, Wood-Dauphinee S, Richards CL,
Côté R, Mayo NE. The effect of a task oriented intervention
on arm function in people with stroke: a randomized
controlled trial. Clinical Rehabilitation 2006;20:296–310.
[MEDLINE: 16719028]
Turton 1990 {published data only}
Turton A, Fraser C. The use of home therapy programmes
for improving recovery of the upper limb following stroke.
British Journal of Occupational Therapy 1990;53(11):
457–62. [MEDLINE: 1993165745]
Van Vliet 2005 {published and unpublished data}
Van Vliet P, Lincoln NB, Robinson E. Comparison of
the content of two physiotherapy approaches for stroke.
Clinical Rehabilitation 2001;15:398–414.∗ Van Vliet PM, Lincoln NB, Foxall A. Comparison of
Bobath based and movement science based treatment for
stroke: a randomised controlled trial. Journal of Neurology,
Neurosurgery and Psychiatry 2005;76:503–8. [MEDLINE:
15774435]
Winstein 2004 {published and unpublished data}
Winstein CJ, Rose DK, Tan SM, Lewthwaite R, Chui HC,
Azen SP. A randomized controlled comparison of upper-
extremity rehabilitation strategies in acute stroke: a pilot
study of immediate and long-term outcomes. Archives
of Physical Medicine and Rehabilitation 2004;85:620–8.
[MEDLINE: 15083439]
Yen 2005 {published data only}
Yen JG, Wang RY, Chen HH, Hong CT. Effectiveness of
modified constraint-induced movement therapy on upper
limb function in stroke subjects. Acta Neurologica Taiwanica
2005;14(1):16–20. [MEDLINE: 15835284]
References to studies excluded from this review
Bagley 2005 {published data only}
Bagley P, Hudson M, Forster A, Smith J, Young J. A
randomized trial evaluation of the Oswestry Standing Frame
for patients after stroke. Clinical Rehabilitation 2005;4:
354–64.
Brown 2002 {published data only}
Brown DA, Burgar CG. Graded weight-bearing
exercise for improved ambulation after stroke. http://
guide.stanford.edu/projects/2kprojects/stroke06.html 2002.
Carey 2002 {published data only}
Carey JR, Kimberley TJ, Lewis SM, Auerbach EJ, Dorsey
L, Rundquist P, et al.Analysis of fMRI and finger tracking
training in subjects with chronic stroke. Brain 2002;125
(4):773–88.
Chan 2006 {published data only}
Chan DYL, Chan CCH, Au DKS. Motor relearning
programme for stroke patients: a randomized controlled
trial. Clinical Rehabilitation 2006;20(3):191–200.
Chang 2000 {published data only}
Chang JL, Sun B. Effect of motor relearning training on
upper extremity function in hemiplegia patients (Chinese).
Modern Rehabilitation 2000;4(5):684–5.
Cirstea 2003 {published data only}
Cirstea MC, Ptito A, Levin MF. Arm reaching improvements
with short-term practice depend on the severity of the
motor deficit in stroke. Experimental Brain Research 2003;
152(4):476–88.
Desrosiers 2005 {published data only}
Desrosiers J, Bourbonnais D, Corriveau H, Gosselin S,
Bravo G. Effectiveness of unilateral and symmetrical
bilateral task training for arm during the subacute phase
after stroke: A randomized controlled trial. Clinical
Rehabilitation 2005;19(6):581–93.
Duncan 2003 {published data only}
Duncan P, Studenski S, Richards L, Gollub S, Lai SM,
Reker D, et al.Randomized clinical trial of therapeutic
exercise in subacute stroke. Stroke 2003;34(9):2173–80.
Eng 2003 {published data only}
Eng JJ, Chu KS, Kim CM, Dawson AS, Carswell A,
Hepburn KE. A community-based group exercise program
for persons with chronic stroke. Medicine and Science in
Sports and Exercise 2003;35(8):1271–8.
Feys 1998 {published data only}
Feys H, De Weerdt W, Verbeke G, Cox Steck G, Capiau
C, Kiekens C, et al.Early and repetitive stimulation of the
20Repetitive task training for improving functional ability after stroke (Review)
Copyright © 2014 The Cochrane Collaboration. Published by John Wiley & Sons, Ltd.

arm can substantially improve the long-term outcome after
stroke: a 5-year follow-up study of a randomized trial.
Stroke 2004;35:924–9. [MEDLINE: 15001789]∗ Feys HM, De Weerdt WJ, Selz BE, Cox Steck GA,
Spichiger R, Vereeck LE, et al.Effect of a therapeutic
intervention for the hemiplegic upper limb in the acute
phase after stroke. Stroke 1998;29:785–92. [MEDLINE:
9550512]
Gelber 1995 {published data only}
Gelber DA, Josefczyk PB, Herman D, Good DC,
Verhulst SJ. Comparison of two therapy approaches in the
rehabilitation of the pure motor hemiparetic stroke patient.
Journal of Neurologic Rehabilitation 1995;9(4):191–6.
Hanlon 1996 {published data only}
Hanlon RE. Motor learning following unilateral stroke.
Archives of Physical Medicine and Rehabilitation 1996;77:
811–5. [MEDLINE: 8702377]
Husemann 2004 {published data only}
Husemann B, Muller F, Krewer C, Lab A, Gille C, Heller S.
Effects of locomotion training with assistance of a driven
gait orthosis in hemiparetic patients after stroke. Neurologie
und Rehabilitation 2004;10(4):187-217 (Abst P20).
Inaba 1973 {published data only}
Inaba M, Edberg E, Montgomery J, Gillis MK. Effectiveness
of functional training, active exercise, and resistive exercise
for patients with hemiplegia. Physical Therapy 1973;53(1):
28–35.
Katz-Leurer 2006 {published data only}
Katz-Leurer M, Sender I, Keren O, Dvir Z. The influence
of early cycling training on balance in stroke patients at
the subacute stage: results of a preliminary trial. Clinical
Rehabilitation 2006;20:298–405.
Kayhan 1996 {published data only}
Kayhan O, Guven Z, Erdilli S, Ozaras N, Renklitepe N.
The effect of motor rehabilitation of the hand in stroke
patients. European Journal of Neurology 1996;3 Suppl 2:10.
Khanna 2003 {published data only}
Khanna PB. A randomised control study of the immediate
and long term benefits of conventional stroke rehabilitation
with task related group therapy in chronic stroke patients.
http://www.controlled-trials.com/2003 (electronic database)
2003.
Kilbreath 1997 {published data only}
Kilbreath SL, Heard R. Upper and lower limb function in
stroke patients following task-specific training. Proceedings
of the Australasian Faculty of Rehabilitation Medicine
5th Annual Scientific Conference. Perth, Australia, 1997:
22–23.
Krutulyte 2004 {published data only}
Krutulyte G, Kimtys A, Krisciunas A. The effectiveness of
physical therapy methods (Bobath and motor relearning
program) in rehabilitation of stroke patients (Lithuanian).
Medicina 2003;39(9):889–95.
Li 2005 {published data only}
Li HF, Wang JH, Feng JC, Gao F. Application of motor
relearning therapy in the early rehabilitation of stroke: a
randomised controlled comparison (Chinese). Zhongguo
Linchuang Kangfu 2005;9(29):1–3.
Liao 2006 {published data only}
Liao L, Luo W, Chen S. The effect of trunk control
training on balance and lower limb function in patients
with hemiplegia (Chinese). Chinese Journal of Rehabilitation
Medicine 2006;21(7):608–9.
Mudie 2002 {published data only}
Mudie MH, Winzeler-Mercay U, Radwan S, Lee L.
Training symmetry of weight distribution after stroke: a
randomized controlled pilot study comparing task-related
reaching, Bobath and feedback training approaches. Clinical
Rehabilitation 2002;16:582–92. [MEDLINE: 12392332]
Nelles 2001 {published data only}
Nelles G, Jentzen W, Jueptner M, Müller S, Diener HC.
Arm training induced brain plasticity in stroke studied with
serial positron emission tomography. NeuroImage 2001;13:
1146–54. [MEDLINE: 11352620]
Pang 2006 {published data only}
Pang MY, Harris JE, Eng JJ. A community-based upper-
extremity group exercise program improves motor function
and performance of functional activities in chronic stroke:
A randomized controlled trial. Archives of Physical Medicine
& Rehabilitation 2006;87(1):1–9.
Platz 2001 {published data only}
Platz T, Winter T, Müller N, Pinkowski C, Eickhof C,
Mauritz K. Arm ability training for stroke and traumatic
brain injury patients with mild arm paresis: a single-
blind, randomized, controlled trial. Archives of Physical
Medicine and Rehabilitation 2001;82:961–8. [MEDLINE:
11441386]
Pollock 2002 {published data only}
Pollock AS, Durard BR, Rowe PJ, Paul JP. The effect of
independent practice of motor tasks by stroke patients: a
pilot randomized controlled trial. Clinical Rehabilitation
2002;16(5):473–80.
Richards 1993 {published data only}
Richards CL, Malouin F, Wood-Dauphinee S, Williams
JI, Bourchard JP, Brunet D. Task-specific physical therapy
for optimisation of gait recovery in acute stroke patients.
Archives of Physical Medicine and Rehabilitation 1993;74(6):
612–20.
Richards 2004 {published data only}
Richards CL, Malouin F, Bravo G, Dumas F, Wood-
Dauphinee S. The role of technology in task-oriented
training in persons with subacute stroke: a randomised
controlled trial. Neurorehabilitation and Neural Repair
2004;18(4):199–211.
Sunderland 1992 {published data only}
Sunderland A, Tinson DJ, Bradley EL, Fletcher D, Langton
HR, Wade DT. Enhanced physical therapy improves
recovery of arm function after stroke. Journal of Neurology,
Neurosurgery and Psychiatry 1992;55(7):530–5.
Theilman 2004 {published data only}
Theilman GT, Dean CM, Gentile AM. Rehabilitation
of reaching after stroke: task-related training versus
21Repetitive task training for improving functional ability after stroke (Review)
Copyright © 2014 The Cochrane Collaboration. Published by John Wiley & Sons, Ltd.
progressive resistive exercise. Archives of Physical Medicine
and Rehabilitation 2004;85(10):1613–8.
Wellmon 1997 {published data only}
Wellmon R, Newton RA. An examination of changes in
gait and standing symmetry associated with the practice of a
weight shifting task. Neurology Report 1997;21(2):52–3.
Xiao 2002 {published data only}
Xiao Z, Zhang L, Pang H. Application of motor relearning
programme for the recovery of upper limb function in
hemiplegic patients (Chinese). Chinese Journal of Physical
Medicine and Rehabilitation 2002;24(10):590–61.
Yang 2005 {published data only}
Yang YR, Yen, JG, Wang RY, Yen LL, Lieu FK. Gait
outcomes after additional backward walking training in
patients with stroke: a randomized controlled trial. Clinical
Rehabilitation 2005;19:264–73. [MEDLINE: 15859527]
References to studies awaiting assessment
Baer 2003 {unpublished data only}
Baer G. An investigation into the efficacy of a home-
based physiotherapy rehabilitation programme for late-
stage stroke. A pilot randomised controlled trial. National
Research Register N0417121685 2002.
Bhakta 2003 {unpublished data only}
Bhakta B. Development of an intelligent robotic system to
aid physical therapy in stroke. NHS Trusts Clinical Trials
Register 2003:ISRCTNN23388474.
Bratava 2006 {unpublished data only}
Bratava DM, Richards L, Bever CT, Haselkorn J. Robotic
assisted upper-limb neurorehabilitation in stroke patients.
ClinicalTrials.gov (NCT 00372411) 2006.
DeLaurentis 2004 {unpublished data only}
DeLaurentis KJ. HARI: the hand-arm rehabilitation
interface for training the hand following paralysis. National
Rehabilitation Information Center H133S040140.
Dewald 2003 {unpublished data only}
Dewald J. Selective dynamic strength training to
enhance upper limb coordination following stroke.
National Rehabilitation Information Center 2003, issue
H133G030143.
Hori 2005 {unpublished data only}
Hori M, Selbert K, Scremin AME, McCarty P, Moeder
S, Van derLoos HFM, et al.Assisted movement neuro-
rehabilitation: VA multi-site clinical trial. ClinicalTrials.gov
2005; Vol. NCT 00223808.
Koeneman 2004 {unpublished data only}∗ Koeneman J. Air muscle device for ankle stroke
rehabilitation. CRISP 2004, issue Grant No:
5R43HD047067–02.
Krebs 2004 {unpublished data only}∗ Krebs HI. The effect of proximal and distal training
on stroke recovery. CRISP 2004; Vol. Grant No:
5R01HD045343–02.
McClain 2004 {unpublished data only}∗ McClain J. An investigation into the effect of including
a goal orientated, independently practised, exercise
programme in early stroke rehabilitation. Unpublished
MSc Thesis, Southhampton University, UK 2003.
Muller 2004 {unpublished data only}∗ Muller K, Butefisch CM, Kleiser B, Korber B, Stephan
J, Netz V, et al.Recovery of hand function after stroke by
executed and mental repetitive training. Cerebrovascular
Disorders 2004;15 Suppl 5:115.
Otifinowski 2006 {unpublished data only}∗ Otfinowski J, Jassiak-Tyrkalska B, Starowicz A, Regula K.
Computer-based rehabilitation of cognitive impairments
and motor arm function of patients with hemiparesis after
stroke (Polish). Neurologia i Neurochirurgia Polska 2006;40
(2):112–8.
Pomeroy 2006 {unpublished data only}∗ Pomeroy V. Evaluation of whether functional strength
training can enhance recovery of mobility after stroke.
ClinicalTrials.gov 2006; Vol. NCT00322192.
Tang 2005 {unpublished data only}∗ Tang PF. Balance recovery and training on fall prevention
in stroke. ClinicalTrials.gov 2005; Vol. NCT00166907.
Vaidya 2003 {unpublished data only}∗ Edinger K, Herbold J, Mohr D, Vaidya S. Value of
a fitness programme after completion of rehabilitation
therapy poststroke. Archives of Physical Medicine and
Rehabilitation. 2003; Vol. 84:A10.
Venova 2003 {published data only}∗ Manova N, Venova L. Rivermead (RMA) - test and tool
for motor recovery after stroke. Proceedings of the 14th
International Congress of the World Confederation for
Physical Therapy, Barcelona. 2003.
Wang 2005 {published data only}∗ Wang RY, Chen HI, Chen CY, Yang YR. Efficacy of
Bobath versus orthopaedic approach on impairment and
function at different motor recovery stages after stroke: a
randomised controlled study. Clinical Rehabilitation 2005;
19:155–64.
Yang 2006 {published data only}∗ Yang YR, Wang RY, Lin KH, Chu MY, Chan RC. Task-
oriented progressive resistance strength training improves
muscle strength and functional performance in individuals
with stroke. Clinical Rehabilitation 2006;20:860–70.
References to ongoing studies
Allison 2005 {unpublished data only}∗ Allison R. Pilot randomised control trial to assess the
impact of additional supported standing practice on
functional ability post-stroke. National Research Register
2005; Vol. N0620164288.
Askim 2005 {unpublished data only}∗ Askim T, Indredavik B. Does intensive task specific training
improve balance after acute stroke?. ClinicalTrials.gov
2005; Vol. NCT00184431.
22Repetitive task training for improving functional ability after stroke (Review)
Copyright © 2014 The Cochrane Collaboration. Published by John Wiley & Sons, Ltd.
English 2005 {unpublished data only}∗ English C, Warden-Flood A, Stiller K, Hillier S. Is
task-related training an effective means of providing
rehabilitation to acute stroke patients?. 1st APA
Neurological Physiotherapy Conference. 2005; Vol. 49,
issue 4:S9.
Harris 2006 {unpublished data only}∗ Harris N. Evaluation of a repetitive practice scheme to
improve sit to stand performance following stroke. National
Research Register 2005; Vol. NO234135926.
Langhammer 2005 {published data only}
Langhammer B. Stroke: reduction of physical performance
post-stroke: inactivity or secondary complications?.
(Personal communication) 2005.
Miller 2002 {unpublished data only}
Miller K, Galae M, Kilbreath S, Phillips B. Early intensive
task-specific sensory and motor training of the upper
limb following acute stroke: a pilot study. Neurological
Rehabilitation 5 - Proceedings of the 3rd World Congress,
Venice, Italy. April 3–6 2002.
Sherrington 2005 {unpublished data only}
Sherrington C, Pamphlet P, Jacka J, Olivetti L, Nugent J,
Hall J. A randomised controlled trial to evaluate task-related
exercise classes for older people with impaired mobility. The
e-Australian Journal of Physiotherapy. 2005; Vol. 51, issue
4:S431.
Additional references
Barreca 2003
Barreca S, Wolf SL, Fasoli S, Bohannon R. Treatment
interventions for the paretic limb of stroke survivors: a
critical review. Neurorehabilitation and Neural Repair 2003;
17(4):220–6.
Bayona 2005
Bayona NA, Bitensky J, Salter K, Teasell R. The role of task
specific training in rehabilitation therapies. Topics in Stroke
Rehabilitation 2005;12(3):58–65.
Butefisch 1995
Butefisch C, Hummelsheim H, Denzler P, Mauritz KH.
Repetitive training of isolated movements improves the
outcome of motor rehabilitation of the centrally paretic
hand. Journal of the Neurological Sciences 1995;130(1):
59–68. [MEDLINE: 212]
Carr 1987
Carr J, Shepherd R. A Motor Relearning Programme
For Stroke. Oxford: Butterworth Heinemann, 1987.
[MEDLINE: 251]
Carr 1998
Carr J, Shepherd R. Neurological Rehabilitation: Optimizing
Motor Performance. Edinburgh: Butterworth Heinemann,
1998.
Cifu 1999
Cifu DX, Stewart DG. Factors affecting functional outcome
after stroke: a critical review of rehabilitation interventions.
Archives of Physical Medicine & Rehabilitation 1999;80:
S35–9.
Dobkin 2004
Dobkin BH. Strategies for stroke rehabilitation. Lancet
Neurology 2004;3(9):528–36. [MEDLINE: 122]
Drukker 2001
Drukker M, de Bie RA, van Rossum E. The effects of
exercise training in institutionalised elderly people: a
systematic review. Physical Therapy Reviews 2001;6:273–85.
Duncan 1997
Duncan PW. Synthesis of intervention trials to improve
motor recovery following stroke. Topics in Stroke
Rehabilitation 1997;3(4):1–20.
Hakkennes 2005
Hakkennes S, Keating JL. Constraint-induced movement
therapy following stroke: a systematic review of randomised
controlled trials. Australian Journal of Physiotherapy 2005;
15:221–31.
Heller 1987
Heller A, Wade DT, Wood VA, Sunderland A, Hewer
RL, Ward E. Arm function after stroke: measurement
and recovery over the first three months. Journal of
Neurology, Neurosurgery and Psychiatry 1987;50(6):714–9.
[MEDLINE: 258]
Hendricks 2002
Hendricks HT, van Limbeek J, Geurts AC, Zwarts MJ.
Motor recovery after stroke: a systematic review of the
literature. Archives of Physical Medicine and Rehabilitation
2002;83:1629–37.
Hiraoka 2001
Hiraoka K. Rehabilitation effort to improve upper extremity
function in post-stroke patients: a meta-analysis. Journal of
Physical Therapy Sciences 2001;13:5–9.
Kwakkel 1997
Kwakkel G, Wagenaar RC, Koelman TW, Lankhorst GJ,
Koetsier JC. Effects of intensity of rehabilitation after
stroke. Stroke 1997;28:1550–6.
Kwakkel 2004
Kwakkel G, van Peppen R, Wagenaar RC, Dauphinee SW,
Richards C, Ashburn A, et al.Effects of augmented exercise
therapy time after stroke - a meta-analysis. Stroke 2004;35
(11):2529–36. [MEDLINE: 117]
Lawrence 2001
Lawrence ES, Coshall C, Dundas R, Stewart J, Rudd AG,
Howard R, et al.Estimates of the prevalence of acute stroke
impairments and disability in a multi-ethnic population.
Stroke 2001;32(6):1279–84. [MEDLINE: 254]
Legg 2006
Legg L, Drummond AE, Langhorne P. Occupational
therapy for patients with problems in activities of daily
living after stroke. Cochrane Database of Systematic Reviews
2006, Issue 4. [Art. No.: CD003585. DOI: 10.1002/
14651858. CD003585.pub2]
Lord 2004
Lord S, McPherson K, McNaughton H, Rochester L,
Weatherall M. Community ambulation after stroke: how
important and obtainable is it and what measures appear
23Repetitive task training for improving functional ability after stroke (Review)
Copyright © 2014 The Cochrane Collaboration. Published by John Wiley & Sons, Ltd.

predictive?. Archives of Physical Medicine and Rehabilitation
2004;85:234–9. [MEDLINE: 181]
Ma 2002
Ma H, Trombly CA. A synthesis of the effects of
occupational therapy for persons with stroke, Part II:
remediation of impairments. The American Journal of
Occupational Therapy 2002;56(3):260–74.
Meek 2003
Meek C, Pollock A, Potter J, Langhorne P. A systematic
review of exercise trials post-stroke. Clinical Rehabilitation
2003;17:6–13.
Moseley 2005
Moseley AM, Stark A, Cameron ID, Pollock A. Treadmill
training and body weight support for walking after stroke.
Cochrane Database of Systematic Reviews 2005, Issue 4.
[Art. No.: CD002840. DOI: 10.1002/14651858.
CD002840.pub2]
Nakayama 1994
Nakayama H, Jorgensen HS, Raaschou HO, Olsen TS.
Recovery of upper extremity function in stroke patients:
the Copenhagen study. Archives of Physical Medicine and
Rehabilitation 1994;75:852–7. [MEDLINE: 24]
Nuyens 2002
Nuyens GE, De Weerdt WJ, Spaepen AJ Jr, Kiekens C,
Feys HM. Reduction of spastic hypertonia during repeated
passive knee movements in stroke patients. Archives of
Physical Medicine and Rehabilitation 2002;83(7):930–5.
[MEDLINE: 1]
OST 2003
OST (Outpatient Service Trialists). Therapy based
rehabilitation services for stroke patients at home. Cochrane
Database of Systematic Reviews 2003, Issue 1. [Art. No.:
CD002925. DOI: 10.1002/14651858. CD002925]
Ottenbacher 1993
Ottenbacher KJ, Jannell S. The results of clinical trials in
stroke rehabilitation research. Archives of Neurology 1993;
50(1):37–44.
Page 2004
Page SJ, Gater DR, Bach-Y-Rita P. Reconsidering the
motor recovery plateau in stroke rehabilitation. Archives of
Physical Medicine & Rehabilitation 2004;85(8):1377–81.
[MEDLINE: 15295770]
Pollock 2007
Pollock A, Baer G, Pomeroy V, Langhorne P. Physiotherapy
treatment approaches for the recovery of postural control
and lower limb function following stroke. Cochrane
Database of Systematic Reviews 2007, Issue 1. [Art. No.:
CD001920. DOI: 10.1002/14651858. CD001920.pub2]
Prange 2006
Prange GB, Jannink MJA, Groothuis-Oudshoorn CGM,
Hermens HJ, Ijzerman MJ. Systematic review of the effect
of robot-aided therapy on recovery of the hemiparetic
arm after stroke. Journal of Rehabilitation Research &
Development 2006;43(2):171–84.
Rothwell 2004
Rothwell PM, Coul AJ, Giles MF, Howard SC, Silver LE,
Bull LM, et al.Change in stroke incidence, mortality, case-
fatality, severity, and risk factors in Oxfordshire, UK from
1981 to 2004 (Oxford Vascular Study). Lancet 2004;363:
1925–33. [MEDLINE: 252]
Saunders 2004
Saunders DH, Greig CA, Young A, Mead GE. Physical
fitness training for stroke patients. Cochrane Database of
Systematic Reviews 2004, Issue 1. [Art. No.: CD003316.
DOI: 10.1002/14651858. CD003316.pub2]
Smidt 2005
Smidt N, de Vet HCW, Bouter LM, Dekker J. Effectiveness
of exercise therapy: a best-evidence summary of systematic
reviews. Australian Journal of Physiotherapy 2005;51:71–85.
Steultjens 2003
Steultjens EMJ, Dekker J, Bouter LM, van de Nes JCM,
Cup EHC, van den Ende CHM. Occupational therapy
for stroke patients: a systematic review. Stroke 2003;34:
676–87.
Steultjens 2005
Steultjens EMJ, Dekker J, Bouter LM, Leemrijse CJ, van
den Ende CHM. Evidence of the efficacy of occupational
therapy in different conditions: an overview of systematic
reviews. Clinical Rehabilitation 2005;19:247–54.
Stewart 2006
Stewart KC, Cauraugh JH, Summers JJ. Bilateral movement
training and stroke rehabilitation. Journal of the Neurological
Sciences 2006;244:89–95.
Sunderland 1989
Sunderland A, Tinson D, Bradley L, Hewer RL. Arm
function after stroke. An evaluation of grip strength as a
measure of recovery and a prognostic indicator. Journal
of Neurology, Neurosurgery and Psychiatry 1989;52(11):
1267–72. [MEDLINE: 256]
Teasell 2003
Teasell RW, Bhogal SK, Foley NC, Speechley MR. Gait
retraining post stroke. Topics in Stroke Rehabilitation 2003;
10(2):34–65.
Trombly 2002
Trombly CA, Ma H. A synthesis of the effects of
occupational therapy for persons with stroke, Part 1:
restoration of roles, tasks, and activities. The American
Journal of Occupational Therapy 2002;56(3):250–9.
Van der Lee 2001
Van der Lee JH, Snels IA, Beckerman H, Lankhorst
GJ, Wagenaar RC, Bouter LM. Exercise therapy for
arm function in stroke patients: a systematic review of
randomized controlled trials. Clinical Rehabilitation 2001;
15(1):20–31. [MEDLINE: 162]
Van Dijk 2004
Van Dijk H, Hermens HJ. Distance training for the
restoration of motor function. Journal of Telemedicine and
Telecare 2004;10:63–71.
24Repetitive task training for improving functional ability after stroke (Review)
Copyright © 2014 The Cochrane Collaboration. Published by John Wiley & Sons, Ltd.
Van Exel 2004
Van Exel NJA, Reimer SO, Koopmanschap MA. Assessment
of post-stroke quality of life in cost-effectiveness studies:
the usefulness of the Barthel Index and the EuroQol-5D.
Quality of Life Research 2004;13(2):427–33.
Van Peppen 2004
Van Peppen RPS, Kwakkel G, Wood-Dauphinee S,
Hendriks HJM, van der Wees PJ, Dekker J. The impact of
physical therapy on functional outcomes after stroke: what’s
the evidence?. Clinical Rehabilitation 2004;18(8):833–62.
[MEDLINE: 35]
Van Vliet 2001
Van Vliet PM, Lincoln NB, Robinson E. Comparison of
the content of two physiotherapy approaches for stroke.
Clinical Rehabilitation 2001;15(4):398–414.
Wade 1983
Wade DT, Langton-Hewer R, Wood VA, Skilbeck CE,
Ismail HM. The hemiplegic arm after stroke: measurement
and recovery. Journal of Neurology, Neurosurgery & Psychiatry
1983;46(6):521–4. [MEDLINE: 257]
Wade 1987
Wade DT, Langton-Hewer R. Functional abilities after
stroke: measurement, natural history and prognosis. Journal
of Neurology Neurosurgery and Psychiatry 1987;50:177–82.
[MEDLINE: 298]
Walker 2004
Walker MF, Leonardi-Bee J, Bath P, Langhorne P, Dewey
M, Corr S, et al.Individual patient data meta-analysis of
randomized controlled trials of community occupational
therapy for stroke patients. Stroke 2004;35:2226–32.
WHO 1989
World Health Organization Task Force on Stroke and other
cerebrovascular disorders. Recommendations on stroke
prevention, diagnosis, and therapy: report of the WHO
Task Force on Stroke and other cerebrovascular disorders.
Stroke 1989;20:1407–31. [MEDLINE: 299]
Wolfe 2000
Wolfe CD. The impact of stroke. British Medical Bulletin
2000;56(2):275–86.
References to other published versions of this review
French 2006
French B, Forster A, Langhorne P, Leathley MJ, McAdam
J, Price CIM, et al.Repetitive task training for improving
functional ability after stroke. Cochrane Database of
Systematic Reviews 2006, Issue 3. [Art. No.: CD006073.
DOI: 10.1002/14651858. CD006073]∗ Indicates the major publication for the study
25Repetitive task training for improving functional ability after stroke (Review)
Copyright © 2014 The Cochrane Collaboration. Published by John Wiley & Sons, Ltd.

C H A R A C T E R I S T I C S O F S T U D I E S
Characteristics of included studies [ordered by study ID]
Barreca 2004
Methods Single centre randomised controlled trial
Eligible patients admitted consecutively were assigned by coin flip to the conventional
practice group during the first 4 months of the study; during the second 4 months, eligible
patients were assigned by coin flip to the extra practice group
This sequence of block randomisation was conducted 3 times in total
Participants Canada
48 participants: 25 intervention, 23 control
Participants recruited from admission to a rehabilitation centre within 1 month of stroke
Inclusion criteria: between the ages of 18 to 90 years, medically stable, postural control
Stage 3 or greater on the Chedoke McMaster Stroke Assessment (lying to sitting in bed
using strong side), but not Stage IV (lying to sitting on side of bed, using strong side)
Exclusion criteria: none stated
Mean age 68 years, range 56 to 78 years
65% male
Stroke details: not stated whether first or recurrent stroke, 73% ischaemic, 42% right
hemiparesis
Timing post stroke: 30 days, range 18 to 50 days
Pre-intervention functional ability level: lack of postural control
Interventions Sit-to-stand training: group class practice in attaining standing from sitting from a variety
of different heights and surfaces
Training was additional to usual care, which included daily strengthening exercise, repetitive
training, functional training, electrical stimulation and other exercise
Sessions were 45 minutes, 3 times a week until competence or discharge (approx 6 weeks)
= 13.5 hours + practice on ward
Each session aimed to involve 3 practice sets of 5 sit-to-stand manoeuvres per class
Average total repetitions during training = 450 to 500
Classes had 6 to 7 participants, supervised by 2 registered practical nurses, with extra
practice delivered by nurses trained on the sit to stand protocol in a ward setting using
videotapes, written instruction and practice
Comparison group: usual care + recreation therapy
Outcomes Outcomes recorded at competence or discharge (approx 6 weeks)
Limb-specific functional outcome measures: number of people able to stand independently
and safely on 2 consecutive occasions
Other: number of falls, health status satisfaction (with ability to stand), satisfaction with
quality of life (Dartmouth Primary Care Cooperative Chart)
Notes No significant differences in baseline characteristics
No loss to follow up at end of treatment phase
Outcome assessors blinded to group allocation
No intervention-related withdrawals
26Repetitive task training for improving functional ability after stroke (Review)
Copyright © 2014 The Cochrane Collaboration. Published by John Wiley & Sons, Ltd.
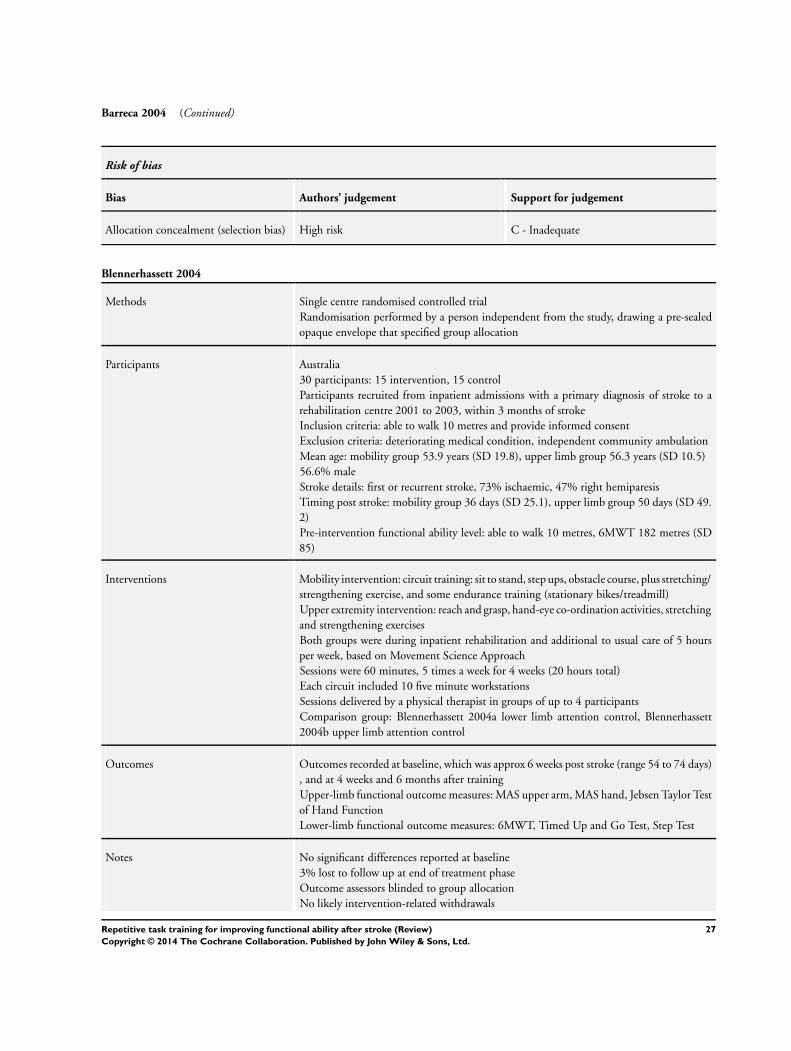
Barreca 2004 (Continued)
Risk of bias
Bias Authors’ judgement Support for judgement
Allocation concealment (selection bias) High risk C - Inadequate
Blennerhassett 2004
Methods Single centre randomised controlled trial
Randomisation performed by a person independent from the study, drawing a pre-sealed
opaque envelope that specified group allocation
Participants Australia
30 participants: 15 intervention, 15 control
Participants recruited from inpatient admissions with a primary diagnosis of stroke to a
rehabilitation centre 2001 to 2003, within 3 months of stroke
Inclusion criteria: able to walk 10 metres and provide informed consent
Exclusion criteria: deteriorating medical condition, independent community ambulation
Mean age: mobility group 53.9 years (SD 19.8), upper limb group 56.3 years (SD 10.5)
56.6% male
Stroke details: first or recurrent stroke, 73% ischaemic, 47% right hemiparesis
Timing post stroke: mobility group 36 days (SD 25.1), upper limb group 50 days (SD 49.
2)
Pre-intervention functional ability level: able to walk 10 metres, 6MWT 182 metres (SD
85)
Interventions Mobility intervention: circuit training: sit to stand, step ups, obstacle course, plus stretching/
strengthening exercise, and some endurance training (stationary bikes/treadmill)
Upper extremity intervention: reach and grasp, hand-eye co-ordination activities, stretching
and strengthening exercises
Both groups were during inpatient rehabilitation and additional to usual care of 5 hours
per week, based on Movement Science Approach
Sessions were 60 minutes, 5 times a week for 4 weeks (20 hours total)
Each circuit included 10 five minute workstations
Sessions delivered by a physical therapist in groups of up to 4 participants
Comparison group: Blennerhassett 2004a lower limb attention control, Blennerhassett
2004b upper limb attention control
Outcomes Outcomes recorded at baseline, which was approx 6 weeks post stroke (range 54 to 74 days)
, and at 4 weeks and 6 months after training
Upper-limb functional outcome measures: MAS upper arm, MAS hand, Jebsen Taylor Test
of Hand Function
Lower-limb functional outcome measures: 6MWT, Timed Up and Go Test, Step Test
Notes No significant differences reported at baseline
3% lost to follow up at end of treatment phase
Outcome assessors blinded to group allocation
No likely intervention-related withdrawals
27Repetitive task training for improving functional ability after stroke (Review)
Copyright © 2014 The Cochrane Collaboration. Published by John Wiley & Sons, Ltd.
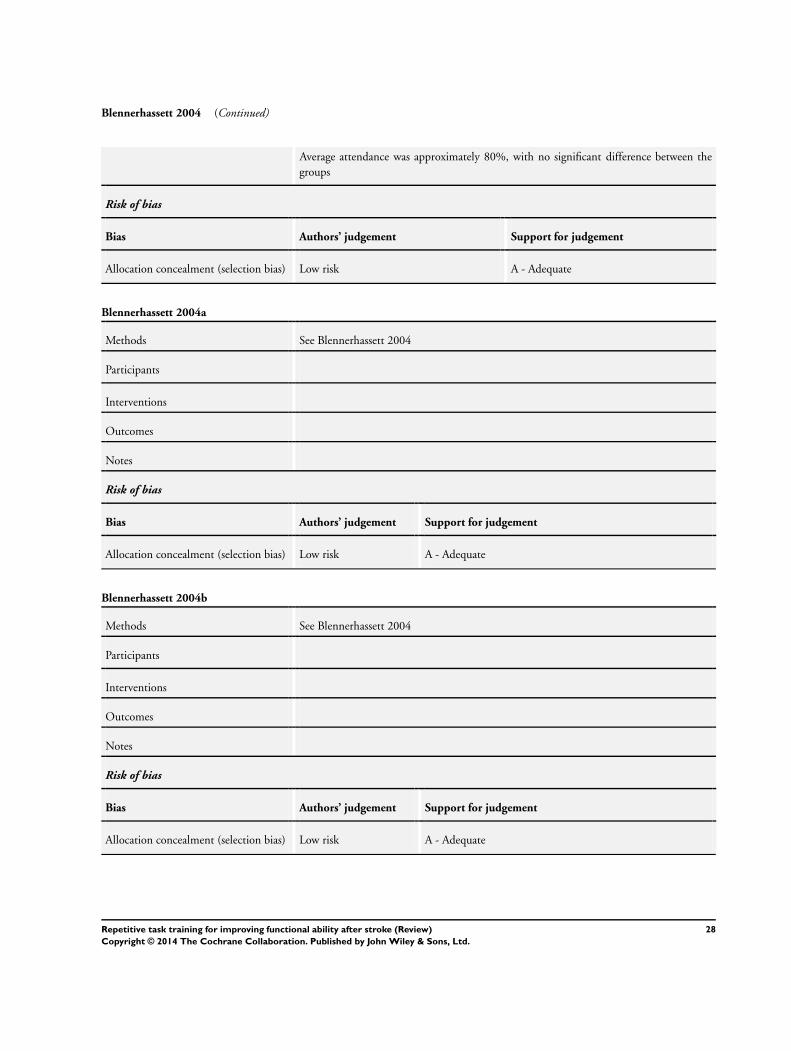
Blennerhassett 2004 (Continued)
Average attendance was approximately 80%, with no significant difference between the
groups
Risk of bias
Bias Authors’ judgement Support for judgement
Allocation concealment (selection bias) Low risk A - Adequate
Blennerhassett 2004a
Methods See Blennerhassett 2004
Participants
Interventions
Outcomes
Notes
Risk of bias
Bias Authors’ judgement Support for judgement
Allocation concealment (selection bias) Low risk A - Adequate
Blennerhassett 2004b
Methods See Blennerhassett 2004
Participants
Interventions
Outcomes
Notes
Risk of bias
Bias Authors’ judgement Support for judgement
Allocation concealment (selection bias) Low risk A - Adequate
28Repetitive task training for improving functional ability after stroke (Review)
Copyright © 2014 The Cochrane Collaboration. Published by John Wiley & Sons, Ltd.
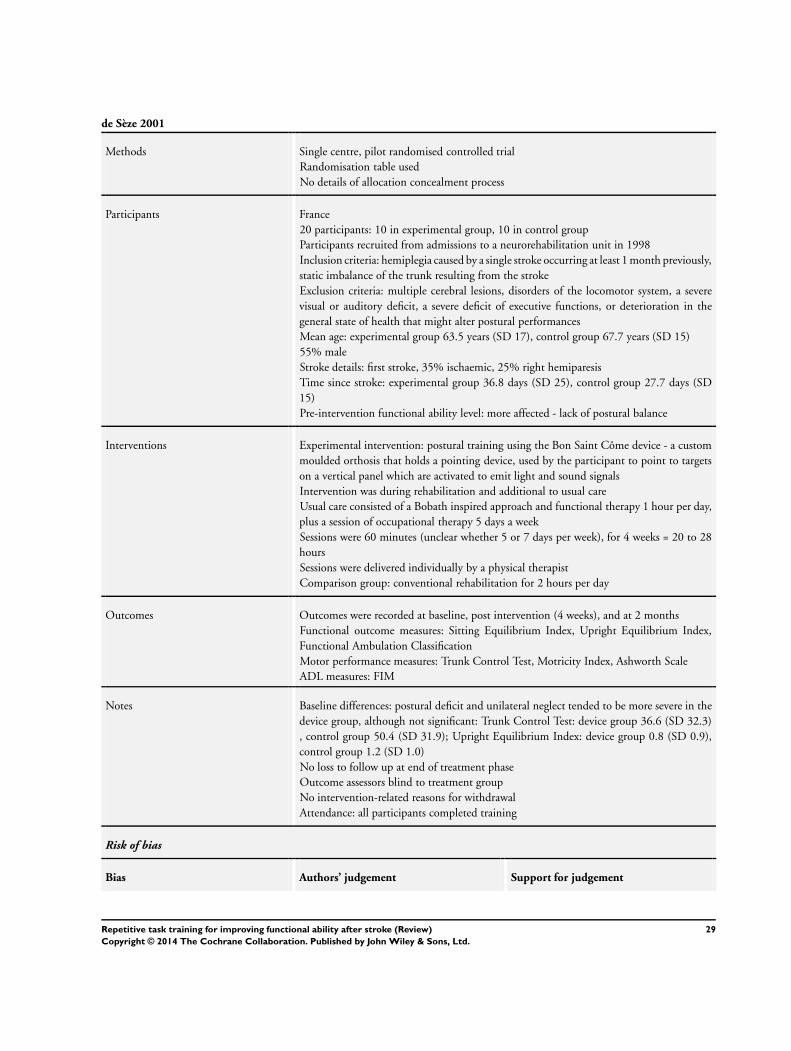
de Sèze 2001
Methods Single centre, pilot randomised controlled trial
Randomisation table used
No details of allocation concealment process
Participants France
20 participants: 10 in experimental group, 10 in control group
Participants recruited from admissions to a neurorehabilitation unit in 1998
Inclusion criteria: hemiplegia caused by a single stroke occurring at least 1 month previously,
static imbalance of the trunk resulting from the stroke
Exclusion criteria: multiple cerebral lesions, disorders of the locomotor system, a severe
visual or auditory deficit, a severe deficit of executive functions, or deterioration in the
general state of health that might alter postural performances
Mean age: experimental group 63.5 years (SD 17), control group 67.7 years (SD 15)
55% male
Stroke details: first stroke, 35% ischaemic, 25% right hemiparesis
Time since stroke: experimental group 36.8 days (SD 25), control group 27.7 days (SD
15)
Pre-intervention functional ability level: more affected - lack of postural balance
Interventions Experimental intervention: postural training using the Bon Saint Côme device - a custom
moulded orthosis that holds a pointing device, used by the participant to point to targets
on a vertical panel which are activated to emit light and sound signals
Intervention was during rehabilitation and additional to usual care
Usual care consisted of a Bobath inspired approach and functional therapy 1 hour per day,
plus a session of occupational therapy 5 days a week
Sessions were 60 minutes (unclear whether 5 or 7 days per week), for 4 weeks = 20 to 28
hours
Sessions were delivered individually by a physical therapist
Comparison group: conventional rehabilitation for 2 hours per day
Outcomes Outcomes were recorded at baseline, post intervention (4 weeks), and at 2 months
Functional outcome measures: Sitting Equilibrium Index, Upright Equilibrium Index,
Functional Ambulation Classification
Motor performance measures: Trunk Control Test, Motricity Index, Ashworth Scale
ADL measures: FIM
Notes Baseline differences: postural deficit and unilateral neglect tended to be more severe in the
device group, although not significant: Trunk Control Test: device group 36.6 (SD 32.3)
, control group 50.4 (SD 31.9); Upright Equilibrium Index: device group 0.8 (SD 0.9),
control group 1.2 (SD 1.0)
No loss to follow up at end of treatment phase
Outcome assessors blind to treatment group
No intervention-related reasons for withdrawal
Attendance: all participants completed training
Risk of bias
Bias Authors’ judgement Support for judgement
29Repetitive task training for improving functional ability after stroke (Review)
Copyright © 2014 The Cochrane Collaboration. Published by John Wiley & Sons, Ltd.
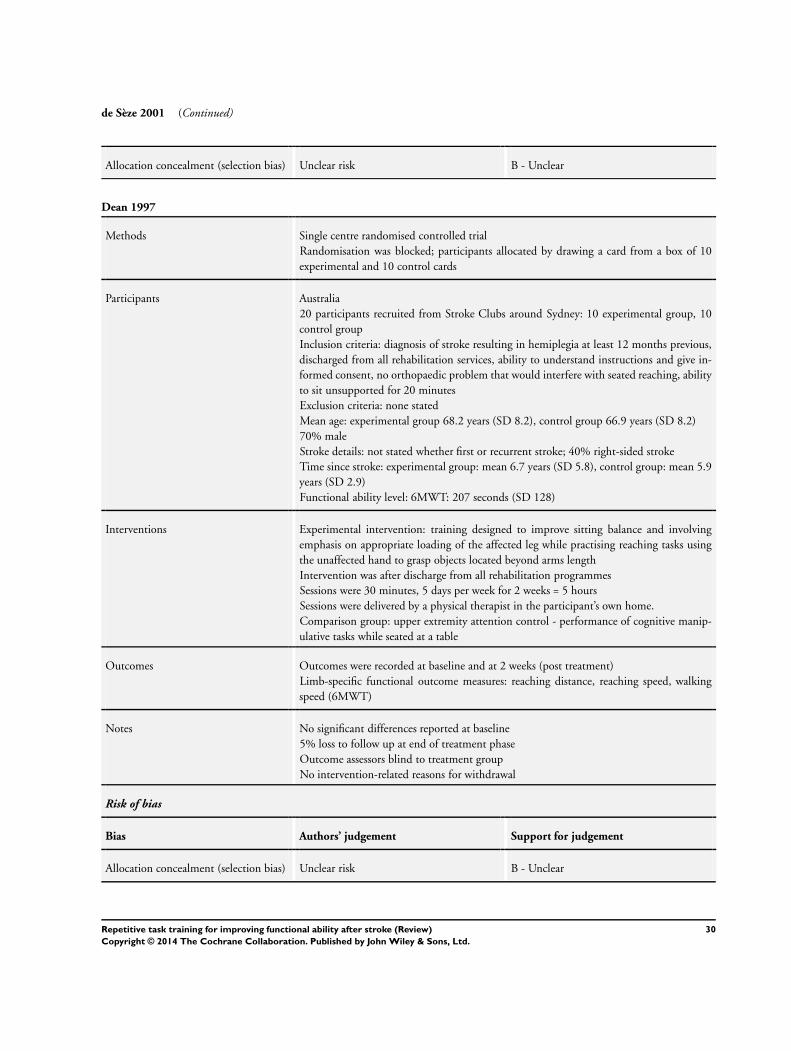
de Sèze 2001 (Continued)
Allocation concealment (selection bias) Unclear risk B - Unclear
Dean 1997
Methods Single centre randomised controlled trial
Randomisation was blocked; participants allocated by drawing a card from a box of 10
experimental and 10 control cards
Participants Australia
20 participants recruited from Stroke Clubs around Sydney: 10 experimental group, 10
control group
Inclusion criteria: diagnosis of stroke resulting in hemiplegia at least 12 months previous,
discharged from all rehabilitation services, ability to understand instructions and give in-
formed consent, no orthopaedic problem that would interfere with seated reaching, ability
to sit unsupported for 20 minutes
Exclusion criteria: none stated
Mean age: experimental group 68.2 years (SD 8.2), control group 66.9 years (SD 8.2)
70% male
Stroke details: not stated whether first or recurrent stroke; 40% right-sided stroke
Time since stroke: experimental group: mean 6.7 years (SD 5.8), control group: mean 5.9
years (SD 2.9)
Functional ability level: 6MWT: 207 seconds (SD 128)
Interventions Experimental intervention: training designed to improve sitting balance and involving
emphasis on appropriate loading of the affected leg while practising reaching tasks using
the unaffected hand to grasp objects located beyond arms length
Intervention was after discharge from all rehabilitation programmes
Sessions were 30 minutes, 5 days per week for 2 weeks = 5 hours
Sessions were delivered by a physical therapist in the participant’s own home.
Comparison group: upper extremity attention control - performance of cognitive manip-
ulative tasks while seated at a table
Outcomes Outcomes were recorded at baseline and at 2 weeks (post treatment)
Limb-specific functional outcome measures: reaching distance, reaching speed, walking
speed (6MWT)
Notes No significant differences reported at baseline
5% loss to follow up at end of treatment phase
Outcome assessors blind to treatment group
No intervention-related reasons for withdrawal
Risk of bias
Bias Authors’ judgement Support for judgement
Allocation concealment (selection bias) Unclear risk B - Unclear
30Repetitive task training for improving functional ability after stroke (Review)
Copyright © 2014 The Cochrane Collaboration. Published by John Wiley & Sons, Ltd.

Dean 2000
Methods Pilot randomised controlled trial
Participants grouped into matched pairs based on walking speed, then randomised by
drawing cards from a box. Cards drawn by a person independent from the study
Participants Canada
12 participants: 6 mobility intervention, 6 upper limb attention control group
Participants recruited from a rehabilitation research group database
Inclusion criteria: first stroke, at least 3 months post stroke, discharged from all rehabilita-
tion services, able to attend a rehabilitation centre 3 times a week for 4 weeks, able to walk
10 metres
Exclusion criteria: any medical condition that would prevent participation
Mean age: experimental group 66.2 years (SD 7.7), control group 62.3 years (SD 6.6)
58% male
Stroke details: not stated whether first or recurrent stroke, 58% right hemiparesis
Timing post stroke: mobility group 2.3 years (SD 0.7), control group 1.3 years (SD 0.9)
Pre-intervention functional ability level: 6MWT mean 235 metres (SD 139)
Interventions Mobility intervention: lower limb circuit training of 10 workstations including sitting reach,
sit to stand, stepping, heel lifts, standing balance, leg strengthening, treadmill walking,
obstacle walking, slope and stair walking, plus participation in walking races and relays
Intervention was after discharge from all rehabilitation programmes
Sessions were 60 minutes, 3 times a week for 4 weeks = 12 hours
Sessions were delivered to a group of 6 participants by two physical therapists, in an
rehabilitation centre setting
Upper extremity intervention: (n = 6) circuit programme designed to improve function of
the affected upper limb
Outcomes Outcomes were recorded at baseline, at 4 weeks (post treatment), and 2 months after
completion of training
Limb-specific functional outcome measures: 6MWT
10 metre walking speed (with and without assistive device), Step Test, Timed Up and Go
Other: satisfaction with programme
Notes No significant difference in walking velocity at baseline for total group, but after with-
drawals, measures of walking speed and distance favoured the control group
6MWT: mobility group 207.9 (SD 119), upper limb group 259.6 (SD 154.6)
Walking speed with assistive device (cm/sec): mobility group 70.7 (SD 41.8), upper limb
group 86.1 (SD 52.6)
25% loss to follow up at end of treatment phase
Outcome assessors blinded to group allocation, but may have been inadvertently unmasked
6MWT undertaken by one of the investigators
Intervention-related reasons for withdrawal: 2 participants withdrew before training (one
due to transport costs)
Attendance: 9 participants attended at least 9 out of 12 sessions
Risk of bias
Bias Authors’ judgement Support for judgement
31Repetitive task training for improving functional ability after stroke (Review)
Copyright © 2014 The Cochrane Collaboration. Published by John Wiley & Sons, Ltd.

Dean 2000 (Continued)
Allocation concealment (selection bias) Low risk A - Adequate
Howe 2005
Methods Two centre, pilot randomised controlled trial
Group allocation via randomised permuted blocks, with the project manager holding details
of assignment until allocation by a therapist
Participants UK
35 participants: 18 in experimental group, 17 in control group
Participants recruited from admissions to an acute stroke unit between 2001 and 2002
Inclusion criteria: aged 18 and over, acute vascular stroke presenting with hemiplegia,
medically stable, able to cooperate, previously independent in mobility + ADL
Exclusion criteria: any history of other neurological pathology, conditions or medication
affecting balance, dementia, impaired consciousness levels, concomitant medical illness or
musculoskeletal condition, serious perceptual problems
Mean age: experimental group: 71.5 years (SD 10.9), control group 70.7 years (SD 7.6)
51% male
Stroke details: unknown if recurrent stroke included, 47% right hemiparesis
Time since stroke: experimental group 26.5 days (SD 15.7), control group 23.1 days (SD
17.5)
Pre-intervention functional ability level: Rivermead Mobility Index 24
Interventions Experimental group: usual care plus exercises aimed at improving lateral weight transference
in sitting and standing; this included repetition of self-initiated goal-oriented activities in
various postures
16 tasks in total, with 10 repetitions of each exercise
Sessions were 30 minutes, 3 times a week, for 4 weeks = 6 hours
Sessions were delivered by trained physiotherapy assistants
Comparison group: usual care, no details given
Outcomes Outcomes were recorded at baseline, post treatment (4 weeks), and at 8 weeks post baseline
Limb-specific functional outcome measures: sit to stand, stand to sit (time in seconds),
lateral reach test (time to return to quiet sitting)
Notes No significant differences reported at baseline
6% lost to follow up at end of treatment phase
Outcome assessors blind to treatment group
No intervention-related reasons for withdrawal
Attendance: participants completed 10.6 sessions on average
Risk of bias
Bias Authors’ judgement Support for judgement
Allocation concealment (selection bias) Low risk A - Adequate
32Repetitive task training for improving functional ability after stroke (Review)
Copyright © 2014 The Cochrane Collaboration. Published by John Wiley & Sons, Ltd.
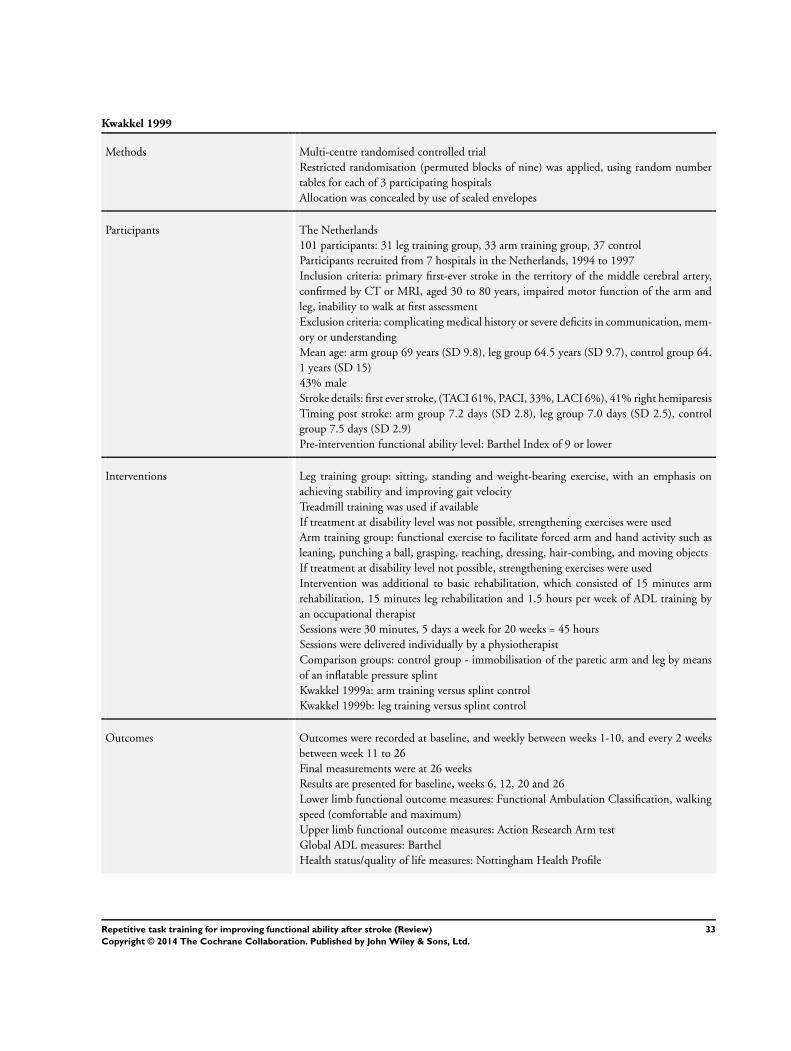
Kwakkel 1999
Methods Multi-centre randomised controlled trial
Restricted randomisation (permuted blocks of nine) was applied, using random number
tables for each of 3 participating hospitals
Allocation was concealed by use of sealed envelopes
Participants The Netherlands
101 participants: 31 leg training group, 33 arm training group, 37 control
Participants recruited from 7 hospitals in the Netherlands, 1994 to 1997
Inclusion criteria: primary first-ever stroke in the territory of the middle cerebral artery,
confirmed by CT or MRI, aged 30 to 80 years, impaired motor function of the arm and
leg, inability to walk at first assessment
Exclusion criteria: complicating medical history or severe deficits in communication, mem-
ory or understanding
Mean age: arm group 69 years (SD 9.8), leg group 64.5 years (SD 9.7), control group 64.
1 years (SD 15)
43% male
Stroke details: first ever stroke, (TACI 61%, PACI, 33%, LACI 6%), 41% right hemiparesis
Timing post stroke: arm group 7.2 days (SD 2.8), leg group 7.0 days (SD 2.5), control
group 7.5 days (SD 2.9)
Pre-intervention functional ability level: Barthel Index of 9 or lower
Interventions Leg training group: sitting, standing and weight-bearing exercise, with an emphasis on
achieving stability and improving gait velocity
Treadmill training was used if available
If treatment at disability level was not possible, strengthening exercises were used
Arm training group: functional exercise to facilitate forced arm and hand activity such as
leaning, punching a ball, grasping, reaching, dressing, hair-combing, and moving objects
If treatment at disability level not possible, strengthening exercises were used
Intervention was additional to basic rehabilitation, which consisted of 15 minutes arm
rehabilitation, 15 minutes leg rehabilitation and 1.5 hours per week of ADL training by
an occupational therapist
Sessions were 30 minutes, 5 days a week for 20 weeks = 45 hours
Sessions were delivered individually by a physiotherapist
Comparison groups: control group - immobilisation of the paretic arm and leg by means
of an inflatable pressure splint
Kwakkel 1999a: arm training versus splint control
Kwakkel 1999b: leg training versus splint control
Outcomes Outcomes were recorded at baseline, and weekly between weeks 1-10, and every 2 weeks
between week 11 to 26
Final measurements were at 26 weeks
Results are presented for baseline, weeks 6, 12, 20 and 26
Lower limb functional outcome measures: Functional Ambulation Classification, walking
speed (comfortable and maximum)
Upper limb functional outcome measures: Action Research Arm test
Global ADL measures: Barthel
Health status/quality of life measures: Nottingham Health Profile
33Repetitive task training for improving functional ability after stroke (Review)
Copyright © 2014 The Cochrane Collaboration. Published by John Wiley & Sons, Ltd.

Kwakkel 1999 (Continued)
Notes No significant differences reported at baseline
12% lost to follow up at end of treatment phase
Assessors were blind to group allocation
Treatment assignment was unintentionally disclosed for 10 participants (1 leg training, 4
arm training, 5 control group)
No likely intervention-related reasons for withdrawal, although 2 participants refused the
splint control treatment
Compliance with delivery of intended amounts of training was monitored, and achieved
Risk of bias
Bias Authors’ judgement Support for judgement
Allocation concealment (selection bias) Low risk A - Adequate
Kwakkel 1999a
Methods See Kwakkel 1999
Participants
Interventions
Outcomes
Notes
Risk of bias
Bias Authors’ judgement Support for judgement
Allocation concealment (selection bias) Low risk A - Adequate
Kwakkel 1999b
Methods See Kwakkel 1999
Participants
Interventions
Outcomes
Notes
Risk of bias
34Repetitive task training for improving functional ability after stroke (Review)
Copyright © 2014 The Cochrane Collaboration. Published by John Wiley & Sons, Ltd.
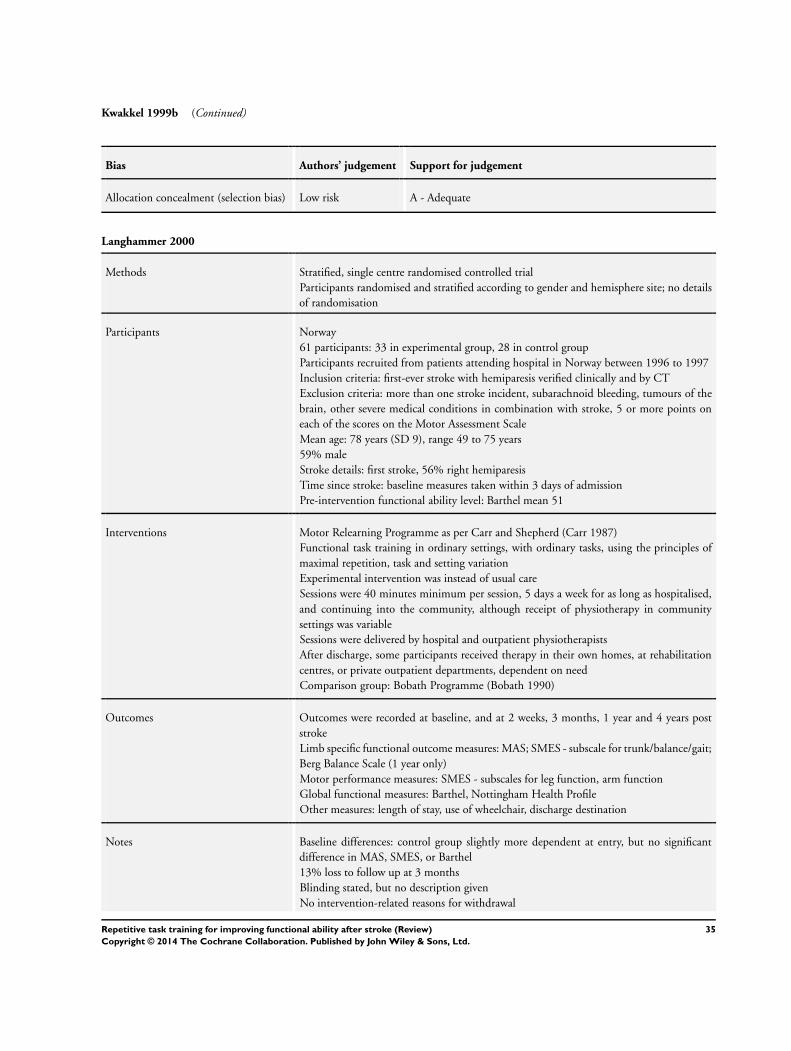
Kwakkel 1999b (Continued)
Bias Authors’ judgement Support for judgement
Allocation concealment (selection bias) Low risk A - Adequate
Langhammer 2000
Methods Stratified, single centre randomised controlled trial
Participants randomised and stratified according to gender and hemisphere site; no details
of randomisation
Participants Norway
61 participants: 33 in experimental group, 28 in control group
Participants recruited from patients attending hospital in Norway between 1996 to 1997
Inclusion criteria: first-ever stroke with hemiparesis verified clinically and by CT
Exclusion criteria: more than one stroke incident, subarachnoid bleeding, tumours of the
brain, other severe medical conditions in combination with stroke, 5 or more points on
each of the scores on the Motor Assessment Scale
Mean age: 78 years (SD 9), range 49 to 75 years
59% male
Stroke details: first stroke, 56% right hemiparesis
Time since stroke: baseline measures taken within 3 days of admission
Pre-intervention functional ability level: Barthel mean 51
Interventions Motor Relearning Programme as per Carr and Shepherd (Carr 1987)
Functional task training in ordinary settings, with ordinary tasks, using the principles of
maximal repetition, task and setting variation
Experimental intervention was instead of usual care
Sessions were 40 minutes minimum per session, 5 days a week for as long as hospitalised,
and continuing into the community, although receipt of physiotherapy in community
settings was variable
Sessions were delivered by hospital and outpatient physiotherapists
After discharge, some participants received therapy in their own homes, at rehabilitation
centres, or private outpatient departments, dependent on need
Comparison group: Bobath Programme (Bobath 1990)
Outcomes Outcomes were recorded at baseline, and at 2 weeks, 3 months, 1 year and 4 years post
stroke
Limb specific functional outcome measures: MAS; SMES - subscale for trunk/balance/gait;
Berg Balance Scale (1 year only)
Motor performance measures: SMES - subscales for leg function, arm function
Global functional measures: Barthel, Nottingham Health Profile
Other measures: length of stay, use of wheelchair, discharge destination
Notes Baseline differences: control group slightly more dependent at entry, but no significant
difference in MAS, SMES, or Barthel
13% loss to follow up at 3 months
Blinding stated, but no description given
No intervention-related reasons for withdrawal
35Repetitive task training for improving functional ability after stroke (Review)
Copyright © 2014 The Cochrane Collaboration. Published by John Wiley & Sons, Ltd.
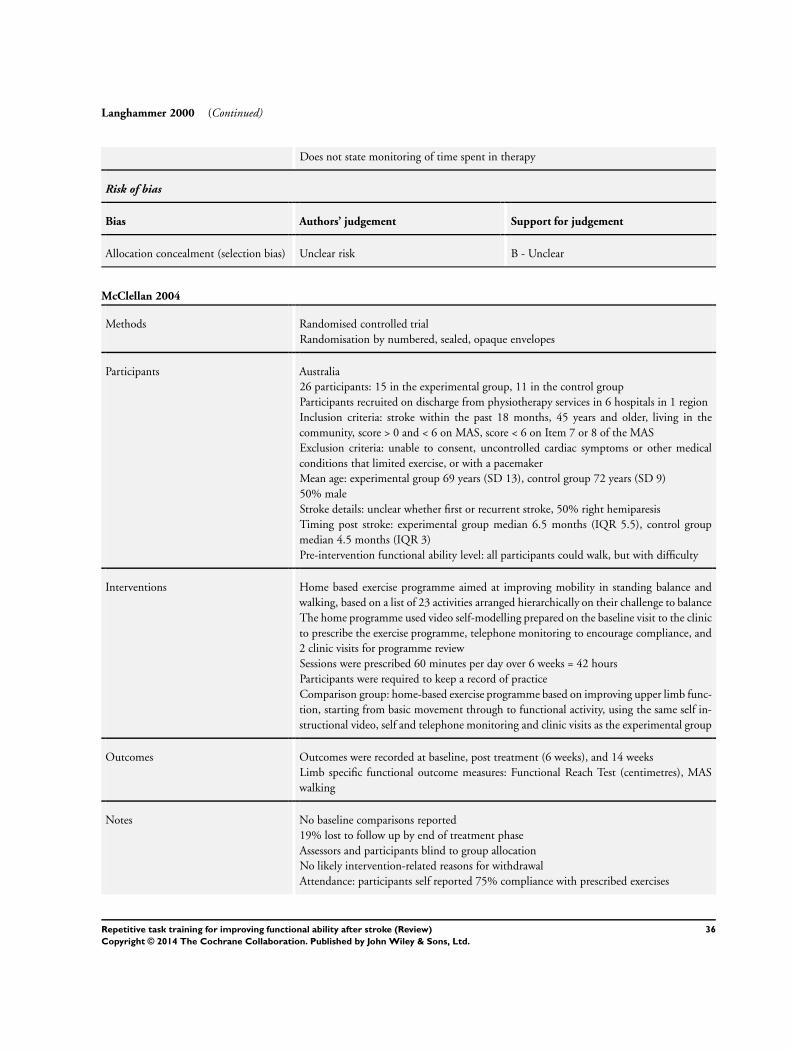
Langhammer 2000 (Continued)
Does not state monitoring of time spent in therapy
Risk of bias
Bias Authors’ judgement Support for judgement
Allocation concealment (selection bias) Unclear risk B - Unclear
McClellan 2004
Methods Randomised controlled trial
Randomisation by numbered, sealed, opaque envelopes
Participants Australia
26 participants: 15 in the experimental group, 11 in the control group
Participants recruited on discharge from physiotherapy services in 6 hospitals in 1 region
Inclusion criteria: stroke within the past 18 months, 45 years and older, living in the
community, score > 0 and < 6 on MAS, score < 6 on Item 7 or 8 of the MAS
Exclusion criteria: unable to consent, uncontrolled cardiac symptoms or other medical
conditions that limited exercise, or with a pacemaker
Mean age: experimental group 69 years (SD 13), control group 72 years (SD 9)
50% male
Stroke details: unclear whether first or recurrent stroke, 50% right hemiparesis
Timing post stroke: experimental group median 6.5 months (IQR 5.5), control group
median 4.5 months (IQR 3)
Pre-intervention functional ability level: all participants could walk, but with difficulty
Interventions Home based exercise programme aimed at improving mobility in standing balance and
walking, based on a list of 23 activities arranged hierarchically on their challenge to balance
The home programme used video self-modelling prepared on the baseline visit to the clinic
to prescribe the exercise programme, telephone monitoring to encourage compliance, and
2 clinic visits for programme review
Sessions were prescribed 60 minutes per day over 6 weeks = 42 hours
Participants were required to keep a record of practice
Comparison group: home-based exercise programme based on improving upper limb func-
tion, starting from basic movement through to functional activity, using the same self in-
structional video, self and telephone monitoring and clinic visits as the experimental group
Outcomes Outcomes were recorded at baseline, post treatment (6 weeks), and 14 weeks
Limb specific functional outcome measures: Functional Reach Test (centimetres), MAS
walking
Notes No baseline comparisons reported
19% lost to follow up by end of treatment phase
Assessors and participants blind to group allocation
No likely intervention-related reasons for withdrawal
Attendance: participants self reported 75% compliance with prescribed exercises
36Repetitive task training for improving functional ability after stroke (Review)
Copyright © 2014 The Cochrane Collaboration. Published by John Wiley & Sons, Ltd.
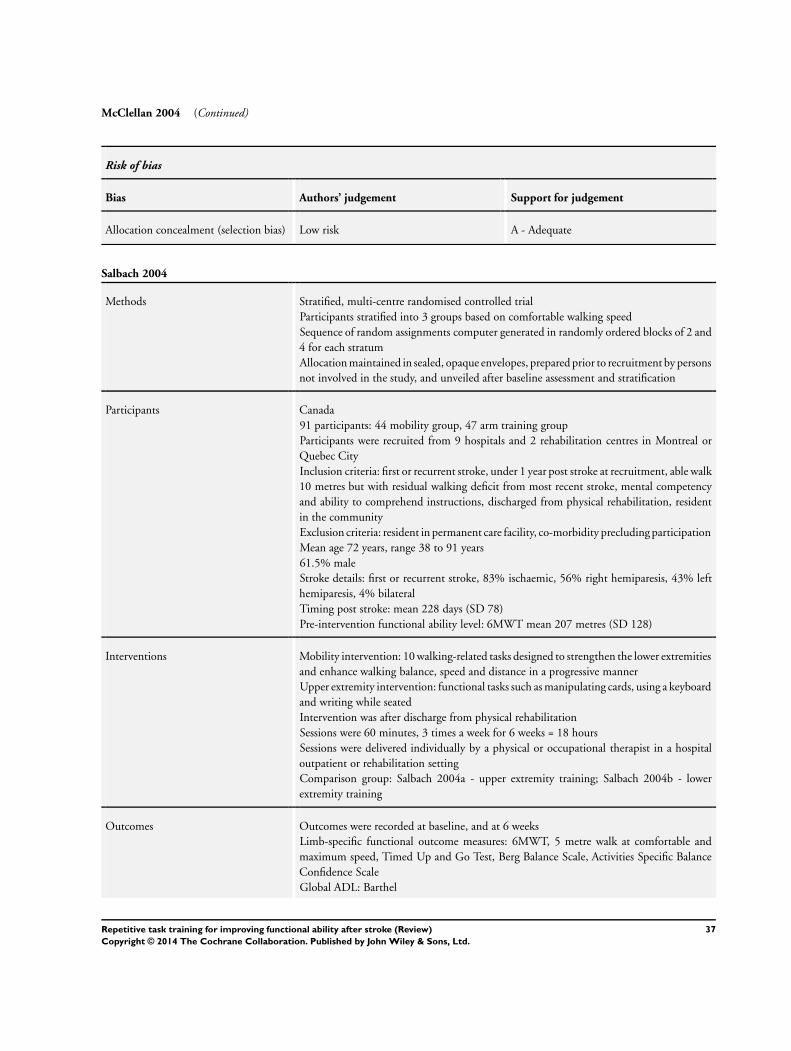
McClellan 2004 (Continued)
Risk of bias
Bias Authors’ judgement Support for judgement
Allocation concealment (selection bias) Low risk A - Adequate
Salbach 2004
Methods Stratified, multi-centre randomised controlled trial
Participants stratified into 3 groups based on comfortable walking speed
Sequence of random assignments computer generated in randomly ordered blocks of 2 and
4 for each stratum
Allocation maintained in sealed, opaque envelopes, prepared prior to recruitment by persons
not involved in the study, and unveiled after baseline assessment and stratification
Participants Canada
91 participants: 44 mobility group, 47 arm training group
Participants were recruited from 9 hospitals and 2 rehabilitation centres in Montreal or
Quebec City
Inclusion criteria: first or recurrent stroke, under 1 year post stroke at recruitment, able walk
10 metres but with residual walking deficit from most recent stroke, mental competency
and ability to comprehend instructions, discharged from physical rehabilitation, resident
in the community
Exclusion criteria: resident in permanent care facility, co-morbidity precluding participation
Mean age 72 years, range 38 to 91 years
61.5% male
Stroke details: first or recurrent stroke, 83% ischaemic, 56% right hemiparesis, 43% left
hemiparesis, 4% bilateral
Timing post stroke: mean 228 days (SD 78)
Pre-intervention functional ability level: 6MWT mean 207 metres (SD 128)
Interventions Mobility intervention: 10 walking-related tasks designed to strengthen the lower extremities
and enhance walking balance, speed and distance in a progressive manner
Upper extremity intervention: functional tasks such as manipulating cards, using a keyboard
and writing while seated
Intervention was after discharge from physical rehabilitation
Sessions were 60 minutes, 3 times a week for 6 weeks = 18 hours
Sessions were delivered individually by a physical or occupational therapist in a hospital
outpatient or rehabilitation setting
Comparison group: Salbach 2004a - upper extremity training; Salbach 2004b - lower
extremity training
Outcomes Outcomes were recorded at baseline, and at 6 weeks
Limb-specific functional outcome measures: 6MWT, 5 metre walk at comfortable and
maximum speed, Timed Up and Go Test, Berg Balance Scale, Activities Specific Balance
Confidence Scale
Global ADL: Barthel
37Repetitive task training for improving functional ability after stroke (Review)
Copyright © 2014 The Cochrane Collaboration. Published by John Wiley & Sons, Ltd.
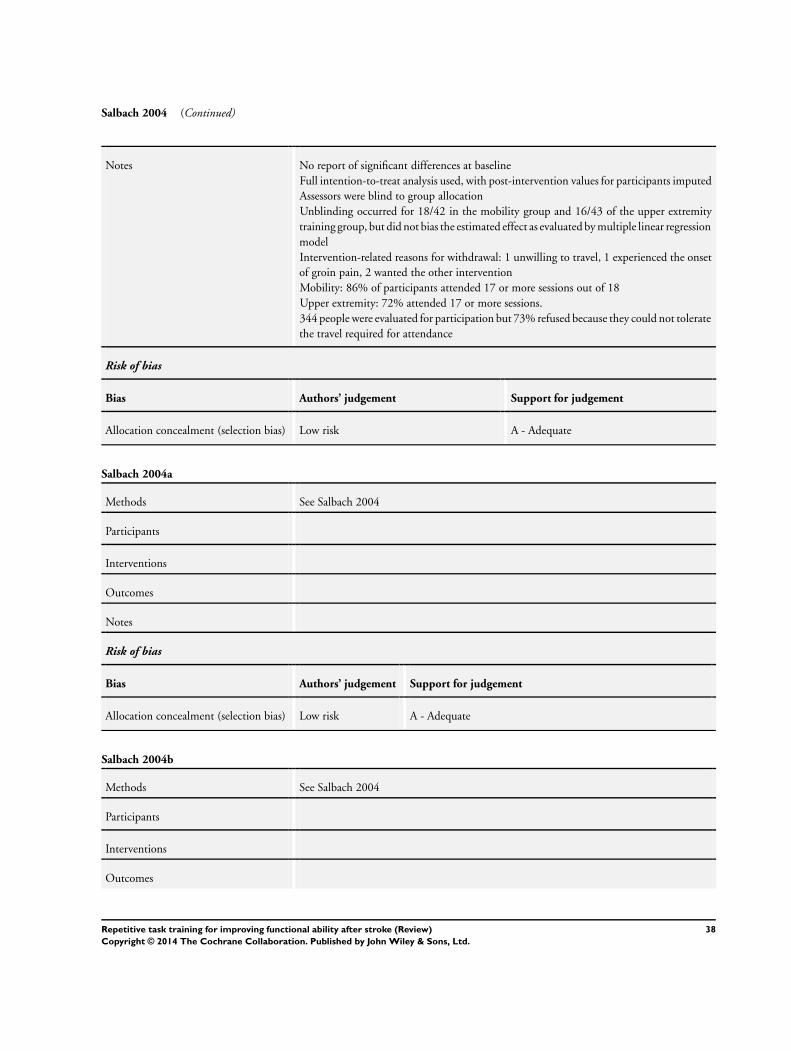
Salbach 2004 (Continued)
Notes No report of significant differences at baseline
Full intention-to-treat analysis used, with post-intervention values for participants imputed
Assessors were blind to group allocation
Unblinding occurred for 18/42 in the mobility group and 16/43 of the upper extremity
training group, but did not bias the estimated effect as evaluated by multiple linear regression
model
Intervention-related reasons for withdrawal: 1 unwilling to travel, 1 experienced the onset
of groin pain, 2 wanted the other intervention
Mobility: 86% of participants attended 17 or more sessions out of 18
Upper extremity: 72% attended 17 or more sessions.
344 people were evaluated for participation but 73% refused because they could not tolerate
the travel required for attendance
Risk of bias
Bias Authors’ judgement Support for judgement
Allocation concealment (selection bias) Low risk A - Adequate
Salbach 2004a
Methods See Salbach 2004
Participants
Interventions
Outcomes
Notes
Risk of bias
Bias Authors’ judgement Support for judgement
Allocation concealment (selection bias) Low risk A - Adequate
Salbach 2004b
Methods See Salbach 2004
Participants
Interventions
Outcomes
38Repetitive task training for improving functional ability after stroke (Review)
Copyright © 2014 The Cochrane Collaboration. Published by John Wiley & Sons, Ltd.
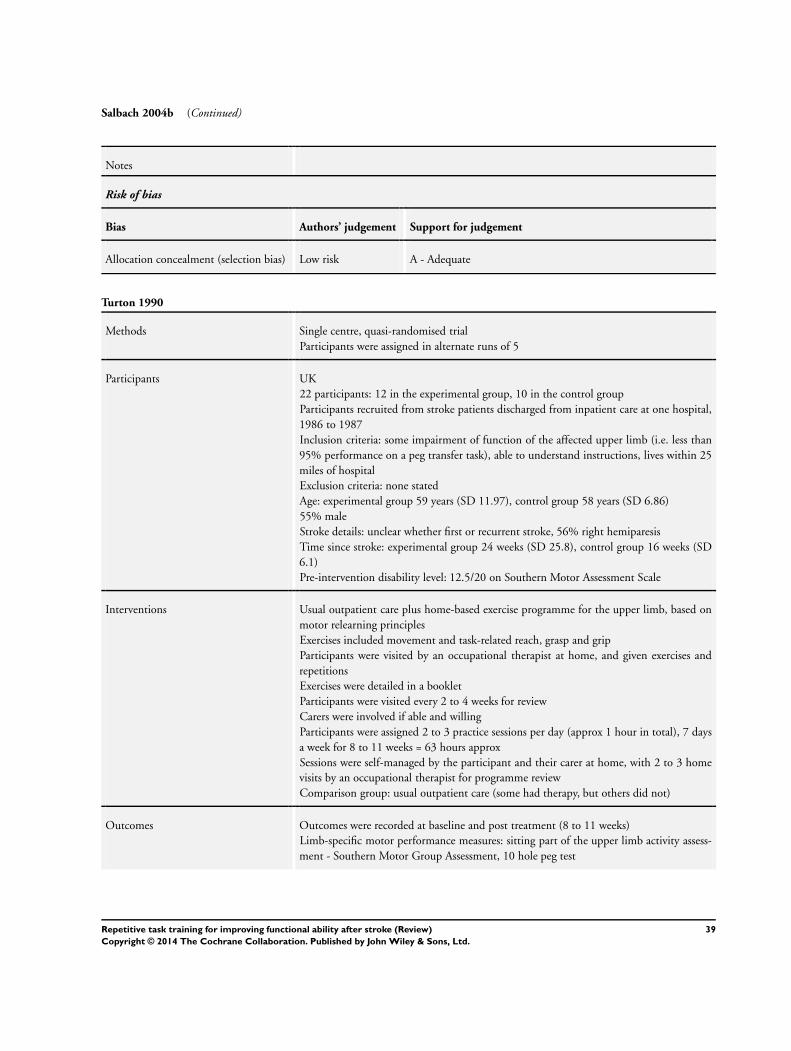
Salbach 2004b (Continued)
Notes
Risk of bias
Bias Authors’ judgement Support for judgement
Allocation concealment (selection bias) Low risk A - Adequate
Turton 1990
Methods Single centre, quasi-randomised trial
Participants were assigned in alternate runs of 5
Participants UK
22 participants: 12 in the experimental group, 10 in the control group
Participants recruited from stroke patients discharged from inpatient care at one hospital,
1986 to 1987
Inclusion criteria: some impairment of function of the affected upper limb (i.e. less than
95% performance on a peg transfer task), able to understand instructions, lives within 25
miles of hospital
Exclusion criteria: none stated
Age: experimental group 59 years (SD 11.97), control group 58 years (SD 6.86)
55% male
Stroke details: unclear whether first or recurrent stroke, 56% right hemiparesis
Time since stroke: experimental group 24 weeks (SD 25.8), control group 16 weeks (SD
6.1)
Pre-intervention disability level: 12.5/20 on Southern Motor Assessment Scale
Interventions Usual outpatient care plus home-based exercise programme for the upper limb, based on
motor relearning principles
Exercises included movement and task-related reach, grasp and grip
Participants were visited by an occupational therapist at home, and given exercises and
repetitions
Exercises were detailed in a booklet
Participants were visited every 2 to 4 weeks for review
Carers were involved if able and willing
Participants were assigned 2 to 3 practice sessions per day (approx 1 hour in total), 7 days
a week for 8 to 11 weeks = 63 hours approx
Sessions were self-managed by the participant and their carer at home, with 2 to 3 home
visits by an occupational therapist for programme review
Comparison group: usual outpatient care (some had therapy, but others did not)
Outcomes Outcomes were recorded at baseline and post treatment (8 to 11 weeks)
Limb-specific motor performance measures: sitting part of the upper limb activity assess-
ment - Southern Motor Group Assessment, 10 hole peg test
39Repetitive task training for improving functional ability after stroke (Review)
Copyright © 2014 The Cochrane Collaboration. Published by John Wiley & Sons, Ltd.

Turton 1990 (Continued)
Notes Baseline differences: difference in time since stroke: experimental group mean of 24 weeks,
and usual care mean of 16 weeks
10 Hole Peg Test performance: experimental group more disabled, home therapy group
has more carers living at home
No loss to follow up at end of treatment phase
Outcome assessor not blinded to treatment group
No intervention-related reasons for withdrawal
Self-reported rates of compliance: mean 68% (SD 25). 3/12 participants rated less than
50%
Risk of bias
Bias Authors’ judgement Support for judgement
Allocation concealment (selection bias) Unclear risk D - Not used
Van Vliet 2005
Methods Single centre randomised controlled trial
Randomisation was by computer-generated random sequence provided by an independent
person
Blocked randomisation was used
Allocations were provided in envelopes and opened after initial assessment
Participants UK
120 participants: 60 in experimental group, 60 in control group
Participants were recruited from admissions to a stroke rehabilitation ward over a period
of 21 months
Inclusion criteria: diagnosis of stroke, referral to physiotherapy
Exclusion criteria: more than 2 weeks post stroke, unconscious on admission, unable to
toilet independently prior to stroke, living more than 25 km from hospital, unable to
tolerate more than 30 minutes of physical tasks required in initial assessment
Mean age: experimental group 75 years (SD 9.1), control group 73.3 (SD 10.4)
50% male
Stroke details: unclear whether first or recurrent stroke included, 51% right hemiparesis,
46% left hemiparesis, 3% bilateral
Time since stroke: within 14 days
Pre-intervention functional ability level: RMA Gross Function subscale: median/IQR ex-
perimental group 2 (1 to 6), control group 1 (1 to 4)
Interventions Movement science-based therapy: based on the principle that skill in performance is a direct
function of the amount of practice
Programme involved use of everyday objects for functional training, and practice outside
of delivered sessions
Intervention was instead of usual care
Participants received a median 23 minutes treatment by a physiotherapist per week day
(IQR 13 to 32 minutes)
Median total number of minutes of treatment was 365 (IQR 140 to 1160), equating to
40Repetitive task training for improving functional ability after stroke (Review)
Copyright © 2014 The Cochrane Collaboration. Published by John Wiley & Sons, Ltd.

Van Vliet 2005 (Continued)
approximately 6 hours total training time
Treatment was delivered by physiotherapists, occupational therapists and physiotherapy
assistants, in hospital, and as an outpatient after discharge
Treatment was delivered for as long as needed
Comparison group: Bobath-based therapy
Outcomes Outcomes were recorded at baseline, 4 weeks, 3 months and 6 months
Limb-specific functional outcome measures: RMA Scale, Motor Assessment Scale, 6MWS,
10 hole peg test
Global functional measures: Barthel, Extended ADL
Notes Baseline differences: control group had higher median scores for Rivermead gross function,
and leg and trunk subscales, and for supine to side lying, supine to sitting, balanced sitting,
and sit to stand sections of the MAS; the experimental group has higher median scores for
the upper arm section of the MAS
29% loss to follow up at 3 months
Outcome assessors blind to treatment allocation; blinding assessed as successful
Intervention-related reasons for withdrawal: 7 participants refused outcome measurement
at 3 months: 5 in the experimental group and 2 in the control group, but reasons are not
known
Risk of bias
Bias Authors’ judgement Support for judgement
Allocation concealment (selection bias) Low risk A - Adequate
Winstein 2004
Methods Stratified, single centre pilot randomised controlled trial
Participants were randomised to groups within severity strata, using Orpington Prognostic
Scale (1.6 to 4.1 = more severe, 4.2 to 6.8 = less severe), using a blocking factor not identified
to study personnel
Sealed envelopes delivered by independent person, and opened on enrolment on next
eligible participant
Participants USA
64 participants: 22 in FTP group, 21 in strength training group, and 21 in usual care group
(only FTP and usual care control group data included in the review)
Participants were recruited from new admissions to a neurorehabilitation services centre
Inclusion criteria: aged 29 to 76, first time stroke confirmed by CT or MRI, initially from
infarction in the anterior circulation, but widened early in the recruitment phase to include
haemorrhagic or pontine stroke, onset of stroke from 2 to 35 days before study entry, FIM
score of 40 to 80, widened to include a broader range early in recruitment phase
Exclusion criteria: peripheral nerve or orthopaedic conditions that interfered with arm
movements, cardiac disease that limited function, subarachnoid haemorrhage within ev-
idence of infarction, progressive hydrocephalus, previous history of brain injury, severe
aphasia, neglect, agitation or depression that could limit participation
41Repetitive task training for improving functional ability after stroke (Review)
Copyright © 2014 The Cochrane Collaboration. Published by John Wiley & Sons, Ltd.
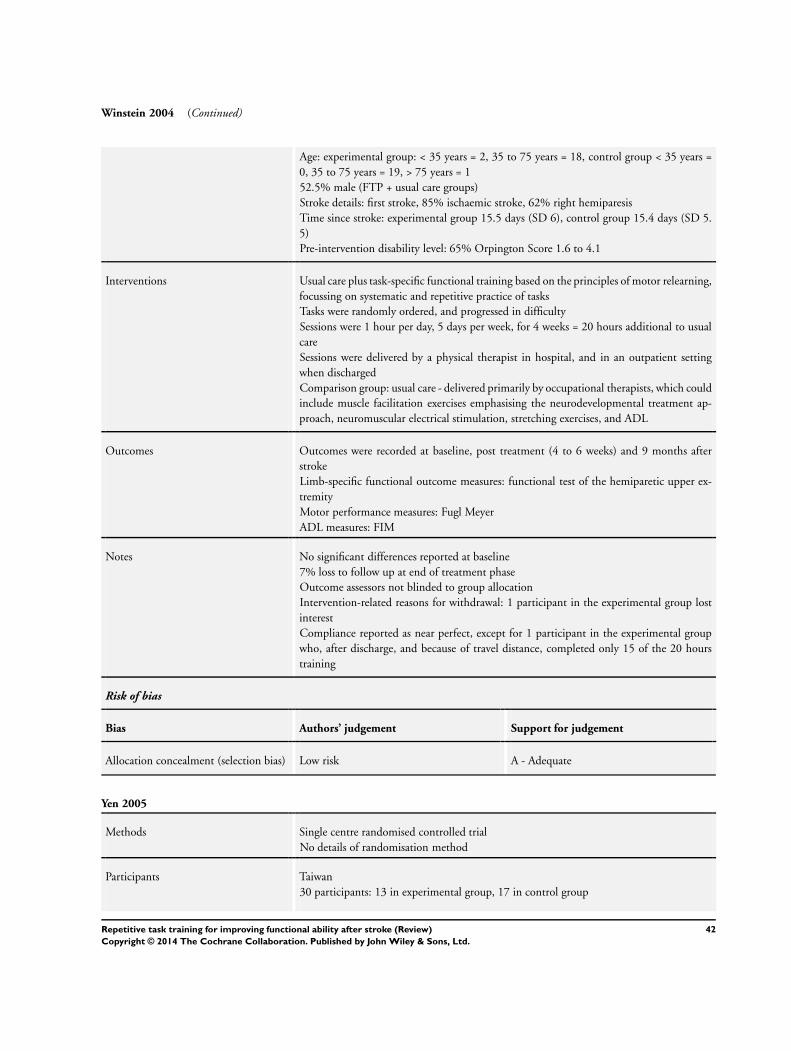
Winstein 2004 (Continued)
Age: experimental group: < 35 years = 2, 35 to 75 years = 18, control group < 35 years =
0, 35 to 75 years = 19, > 75 years = 1
52.5% male (FTP + usual care groups)
Stroke details: first stroke, 85% ischaemic stroke, 62% right hemiparesis
Time since stroke: experimental group 15.5 days (SD 6), control group 15.4 days (SD 5.
5)
Pre-intervention disability level: 65% Orpington Score 1.6 to 4.1
Interventions Usual care plus task-specific functional training based on the principles of motor relearning,
focussing on systematic and repetitive practice of tasks
Tasks were randomly ordered, and progressed in difficulty
Sessions were 1 hour per day, 5 days per week, for 4 weeks = 20 hours additional to usual
care
Sessions were delivered by a physical therapist in hospital, and in an outpatient setting
when discharged
Comparison group: usual care - delivered primarily by occupational therapists, which could
include muscle facilitation exercises emphasising the neurodevelopmental treatment ap-
proach, neuromuscular electrical stimulation, stretching exercises, and ADL
Outcomes Outcomes were recorded at baseline, post treatment (4 to 6 weeks) and 9 months after
stroke
Limb-specific functional outcome measures: functional test of the hemiparetic upper ex-
tremity
Motor performance measures: Fugl Meyer
ADL measures: FIM
Notes No significant differences reported at baseline
7% loss to follow up at end of treatment phase
Outcome assessors not blinded to group allocation
Intervention-related reasons for withdrawal: 1 participant in the experimental group lost
interest
Compliance reported as near perfect, except for 1 participant in the experimental group
who, after discharge, and because of travel distance, completed only 15 of the 20 hours
training
Risk of bias
Bias Authors’ judgement Support for judgement
Allocation concealment (selection bias) Low risk A - Adequate
Yen 2005
Methods Single centre randomised controlled trial
No details of randomisation method
Participants Taiwan
30 participants: 13 in experimental group, 17 in control group
42Repetitive task training for improving functional ability after stroke (Review)
Copyright © 2014 The Cochrane Collaboration. Published by John Wiley & Sons, Ltd.
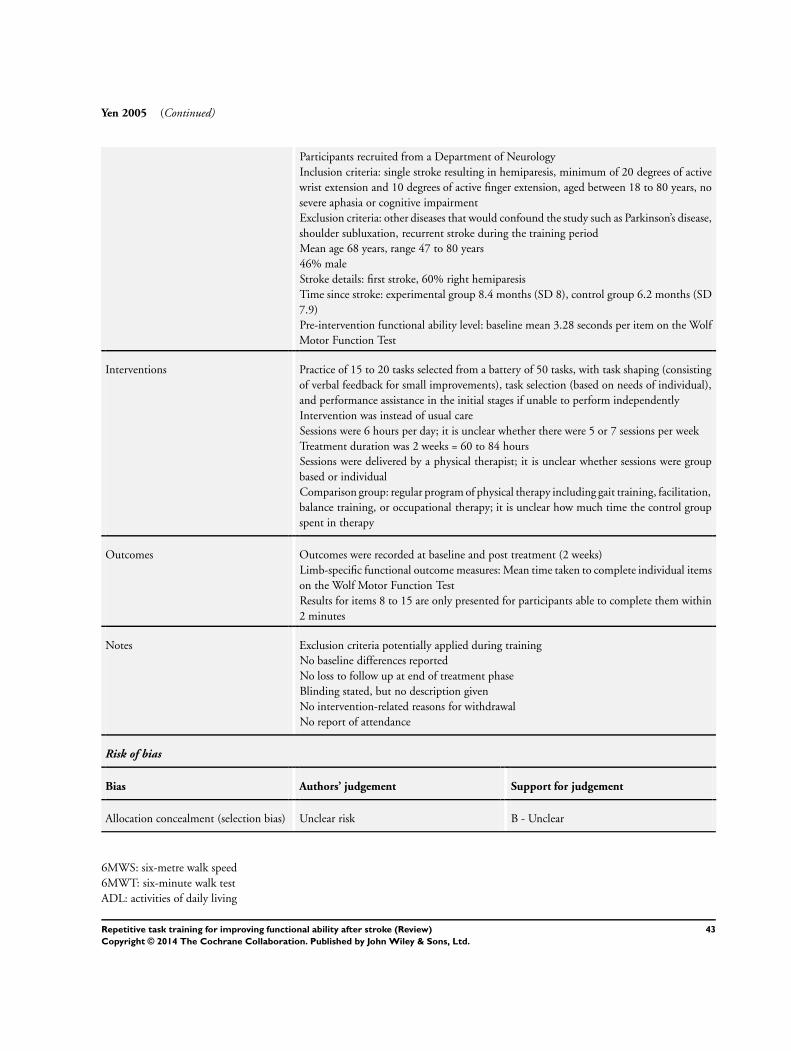
Yen 2005 (Continued)
Participants recruited from a Department of Neurology
Inclusion criteria: single stroke resulting in hemiparesis, minimum of 20 degrees of active
wrist extension and 10 degrees of active finger extension, aged between 18 to 80 years, no
severe aphasia or cognitive impairment
Exclusion criteria: other diseases that would confound the study such as Parkinson’s disease,
shoulder subluxation, recurrent stroke during the training period
Mean age 68 years, range 47 to 80 years
46% male
Stroke details: first stroke, 60% right hemiparesis
Time since stroke: experimental group 8.4 months (SD 8), control group 6.2 months (SD
7.9)
Pre-intervention functional ability level: baseline mean 3.28 seconds per item on the Wolf
Motor Function Test
Interventions Practice of 15 to 20 tasks selected from a battery of 50 tasks, with task shaping (consisting
of verbal feedback for small improvements), task selection (based on needs of individual),
and performance assistance in the initial stages if unable to perform independently
Intervention was instead of usual care
Sessions were 6 hours per day; it is unclear whether there were 5 or 7 sessions per week
Treatment duration was 2 weeks = 60 to 84 hours
Sessions were delivered by a physical therapist; it is unclear whether sessions were group
based or individual
Comparison group: regular program of physical therapy including gait training, facilitation,
balance training, or occupational therapy; it is unclear how much time the control group
spent in therapy
Outcomes Outcomes were recorded at baseline and post treatment (2 weeks)
Limb-specific functional outcome measures: Mean time taken to complete individual items
on the Wolf Motor Function Test
Results for items 8 to 15 are only presented for participants able to complete them within
2 minutes
Notes Exclusion criteria potentially applied during training
No baseline differences reported
No loss to follow up at end of treatment phase
Blinding stated, but no description given
No intervention-related reasons for withdrawal
No report of attendance
Risk of bias
Bias Authors’ judgement Support for judgement
Allocation concealment (selection bias) Unclear risk B - Unclear
6MWS: six-metre walk speed
6MWT: six-minute walk test
ADL: activities of daily living
43Repetitive task training for improving functional ability after stroke (Review)
Copyright © 2014 The Cochrane Collaboration. Published by John Wiley & Sons, Ltd.

CT: computerised tomography
FIM: Functional Independence Measure
FTP: functional task practice
IQR: interquartile range
LACI: lacunar infarct
MAS: Motor Assessment Scale
MRI: magnetic resonance imaging
PACI: partial anterior circulation infarct
RMA: Rivermead Motor Assessment
SD: standard deviation
SMES: Sodring Motor Evaluation Scale
TACI: total anterior circulation infarcts
Characteristics of excluded studies [ordered by study ID]
Study Reason for exclusion
Bagley 2005 Not repetition
Brown 2002 Not functional
Carey 2002 Not functional
Chan 2006 Compared against another RTT-type intervention
Chang 2000 Mixed intervention
Cirstea 2003 Compared against another RTT-type intervention
Desrosiers 2005 Mixed intervention
Duncan 2003 Main focus on exercise rather than function
Eng 2003 Main focus on exercise rather than function
Feys 1998 Not functional
Gelber 1995 Mixed intervention
Hanlon 1996 No baseline measures for function
Husemann 2004 Passive movement
Inaba 1973 Not repetition
Katz-Leurer 2006 Not functional
Kayhan 1996 Unable to contact author to determine nature of intervention
44Repetitive task training for improving functional ability after stroke (Review)
Copyright © 2014 The Cochrane Collaboration. Published by John Wiley & Sons, Ltd.

(Continued)
Khanna 2003 Study did not start
Kilbreath 1997 Author reports study information not available
Krutulyte 2004 No reference to randomisation
Unable to contact author for confirmation
Li 2005 No functional outcome
Liao 2006 Exercise, not task based
Mudie 2002 Not functional
Nelles 2001 Not designed to evaluate intervention
Pang 2006 Mixed intervention: exercise and functional training
Platz 2001 Included participants with traumatic brain injury in sample
Pollock 2002 Not functional
Richards 1993 Mixed intervention
Richards 2004 Mixed intervention
Sunderland 1992 Mixed intervention
Theilman 2004 Compared against another intervention
Wellmon 1997 No functional outcome
Xiao 2002 Unable to determine amount of practice
Yang 2005 Interpreted as exercise, rather than functional task practice
RTT: repetitive task training
Characteristics of ongoing studies [ordered by study ID]
45Repetitive task training for improving functional ability after stroke (Review)
Copyright © 2014 The Cochrane Collaboration. Published by John Wiley & Sons, Ltd.
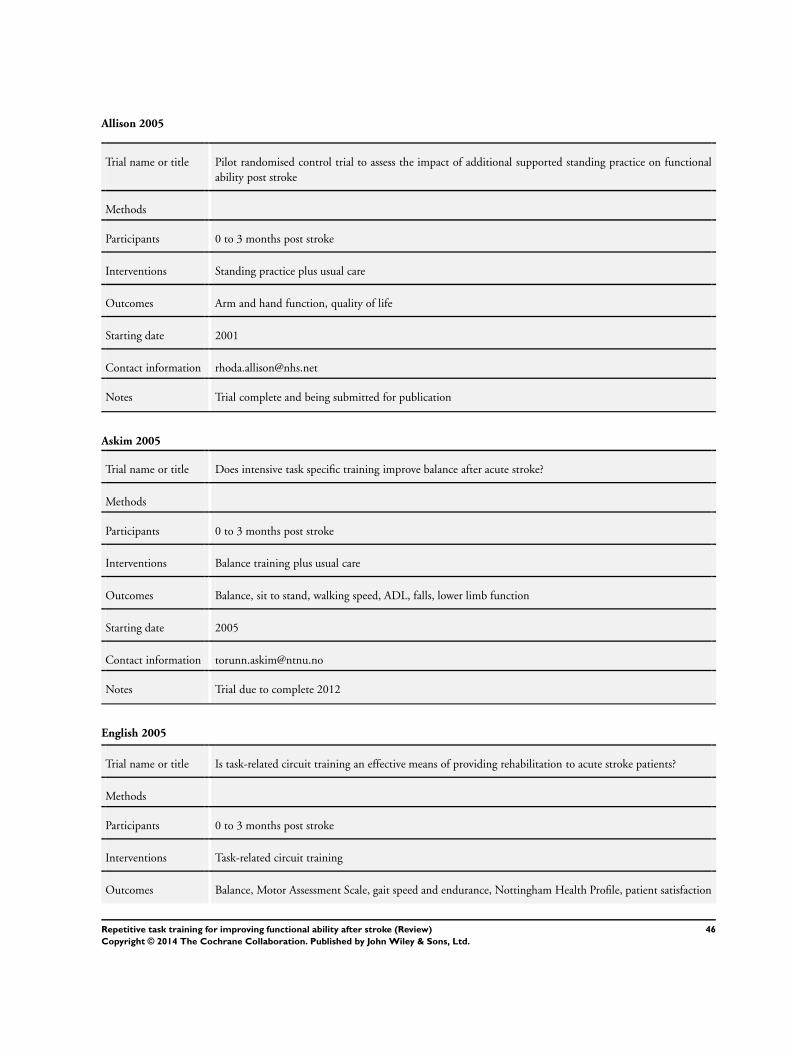
Allison 2005
Trial name or title Pilot randomised control trial to assess the impact of additional supported standing practice on functional
ability post stroke
Methods
Participants 0 to 3 months post stroke
Interventions Standing practice plus usual care
Outcomes Arm and hand function, quality of life
Starting date 2001
Contact information [email protected]
Notes Trial complete and being submitted for publication
Askim 2005
Trial name or title Does intensive task specific training improve balance after acute stroke?
Methods
Participants 0 to 3 months post stroke
Interventions Balance training plus usual care
Outcomes Balance, sit to stand, walking speed, ADL, falls, lower limb function
Starting date 2005
Contact information [email protected]
Notes Trial due to complete 2012
English 2005
Trial name or title Is task-related circuit training an effective means of providing rehabilitation to acute stroke patients?
Methods
Participants 0 to 3 months post stroke
Interventions Task-related circuit training
Outcomes Balance, Motor Assessment Scale, gait speed and endurance, Nottingham Health Profile, patient satisfaction
46Repetitive task training for improving functional ability after stroke (Review)
Copyright © 2014 The Cochrane Collaboration. Published by John Wiley & Sons, Ltd.
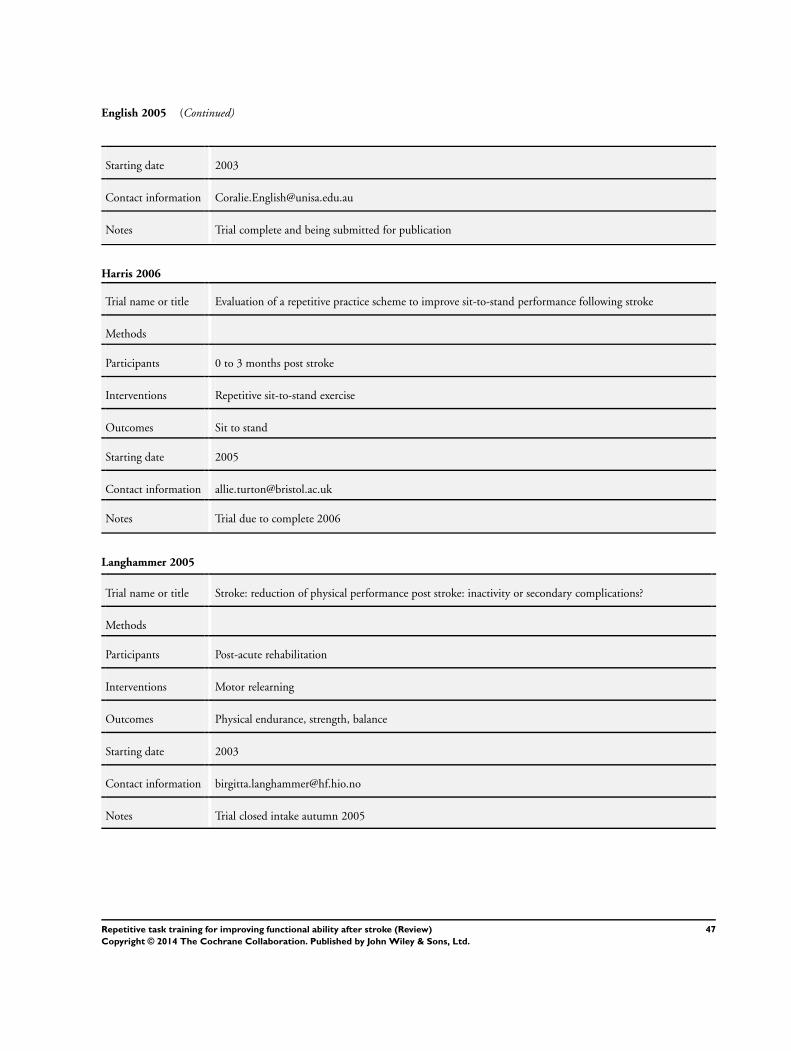
English 2005 (Continued)
Starting date 2003
Contact information [email protected]
Notes Trial complete and being submitted for publication
Harris 2006
Trial name or title Evaluation of a repetitive practice scheme to improve sit-to-stand performance following stroke
Methods
Participants 0 to 3 months post stroke
Interventions Repetitive sit-to-stand exercise
Outcomes Sit to stand
Starting date 2005
Contact information [email protected]
Notes Trial due to complete 2006
Langhammer 2005
Trial name or title Stroke: reduction of physical performance post stroke: inactivity or secondary complications?
Methods
Participants Post-acute rehabilitation
Interventions Motor relearning
Outcomes Physical endurance, strength, balance
Starting date 2003
Contact information [email protected]
Notes Trial closed intake autumn 2005
47Repetitive task training for improving functional ability after stroke (Review)
Copyright © 2014 The Cochrane Collaboration. Published by John Wiley & Sons, Ltd.
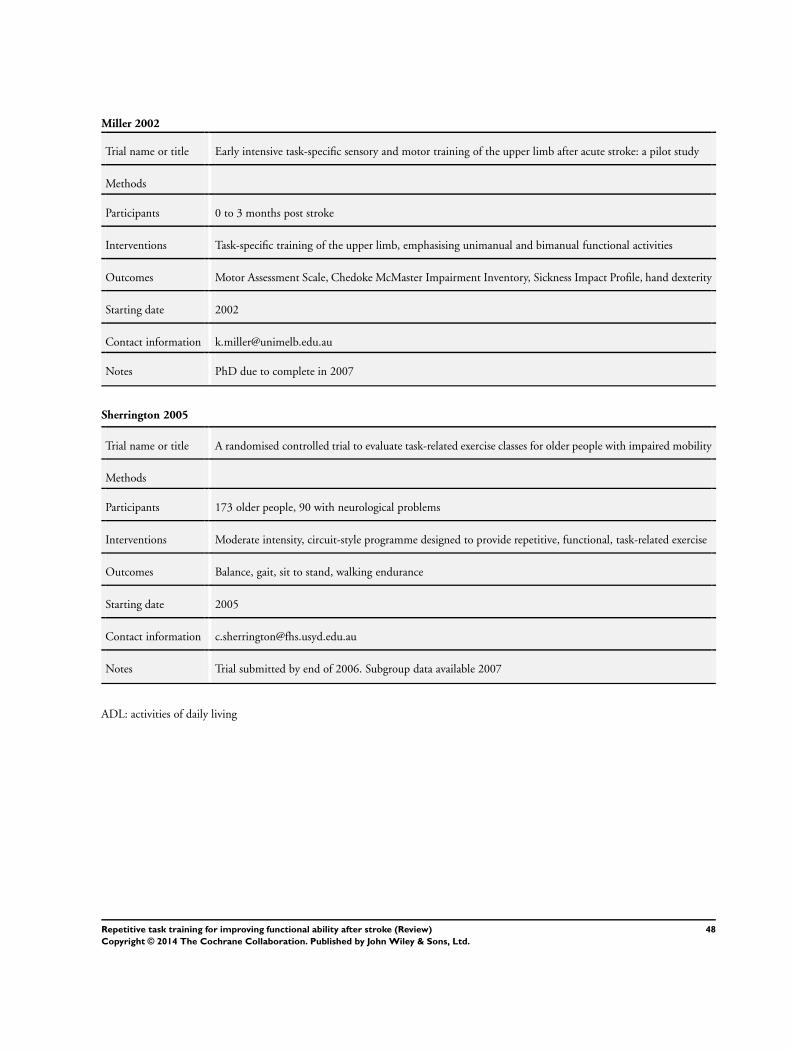
Miller 2002
Trial name or title Early intensive task-specific sensory and motor training of the upper limb after acute stroke: a pilot study
Methods
Participants 0 to 3 months post stroke
Interventions Task-specific training of the upper limb, emphasising unimanual and bimanual functional activities
Outcomes Motor Assessment Scale, Chedoke McMaster Impairment Inventory, Sickness Impact Profile, hand dexterity
Starting date 2002
Contact information [email protected]
Notes PhD due to complete in 2007
Sherrington 2005
Trial name or title A randomised controlled trial to evaluate task-related exercise classes for older people with impaired mobility
Methods
Participants 173 older people, 90 with neurological problems
Interventions Moderate intensity, circuit-style programme designed to provide repetitive, functional, task-related exercise
Outcomes Balance, gait, sit to stand, walking endurance
Starting date 2005
Contact information [email protected]
Notes Trial submitted by end of 2006. Subgroup data available 2007
ADL: activities of daily living
48Repetitive task training for improving functional ability after stroke (Review)
Copyright © 2014 The Cochrane Collaboration. Published by John Wiley & Sons, Ltd.

D A T A A N D A N A L Y S E S
Comparison 1. Upper limb function: post treatment
Outcome or subgroup titleNo. of
studies
No. of
participants Statistical method Effect size
1 Arm function 8 412 Std. Mean Difference (IV, Fixed, 95% CI) 0.17 [-0.03, 0.36]
2 Hand function 5 281 Std. Mean Difference (IV, Fixed, 95% CI) 0.16 [-0.07, 0.40]
3 Sitting balance/reach 5 210 Std. Mean Difference (IV, Fixed, 95% CI) 0.23 [-0.05, 0.50]
Comparison 2. Upper limb function: follow up
Outcome or subgroup titleNo. of
studies
No. of
participants Statistical method Effect size
1 All outcomes 6 246 Std. Mean Difference (IV, Fixed, 95% CI) 0.08 [-0.17, 0.33]
1.1 Under 6 months post
treatment
2 51 Std. Mean Difference (IV, Fixed, 95% CI) 0.50 [-0.06, 1.06]
1.2 6 to 12 months post
treatment
4 195 Std. Mean Difference (IV, Fixed, 95% CI) -0.02 [-0.31, 0.26]
Comparison 3. Upper limb function: subgroup analyses
Outcome or subgroup titleNo. of
studies
No. of
participants Statistical method Effect size
1 Dosage of task practice 11 484 Std. Mean Difference (IV, Fixed, 95% CI) 0.23 [0.05, 0.41]
1.1 0 to 20 hours 8 371 Std. Mean Difference (IV, Fixed, 95% CI) 0.18 [-0.02, 0.39]
1.2 More than 20 hours 3 113 Std. Mean Difference (IV, Fixed, 95% CI) 0.40 [0.03, 0.78]
2 Time since stroke 11 484 Std. Mean Difference (IV, Fixed, 95% CI) 0.23 [0.05, 0.41]
2.1 0 to 15 days 4 239 Std. Mean Difference (IV, Fixed, 95% CI) 0.21 [-0.04, 0.47]
2.2 16 days to 6 months 4 105 Std. Mean Difference (IV, Fixed, 95% CI) 0.24 [-0.14, 0.63]
2.3 More than 6 months 3 140 Std. Mean Difference (IV, Fixed, 95% CI) 0.25 [-0.08, 0.59]
3 Type of intervention 11 484 Std. Mean Difference (IV, Fixed, 95% CI) 0.23 [0.05, 0.41]
3.1 Whole therapy 2 138 Std. Mean Difference (IV, Fixed, 95% CI) 0.16 [-0.18, 0.49]
3.2 Mixed training 6 274 Std. Mean Difference (IV, Fixed, 95% CI) 0.20 [-0.04, 0.44]
3.3 Single task training 3 72 Std. Mean Difference (IV, Fixed, 95% CI) 0.51 [0.03, 0.99]
49Repetitive task training for improving functional ability after stroke (Review)
Copyright © 2014 The Cochrane Collaboration. Published by John Wiley & Sons, Ltd.

Comparison 4. Lower limb function: post treatment
Outcome or subgroup titleNo. of
studies
No. of
participants Statistical method Effect size
1 Walking distance: change from
baseline
3 130 Mean Difference (IV, Random, 95% CI) 54.59 [17.50, 91.68]
2 Walking speed 5 263 Std. Mean Difference (IV, Fixed, 95% CI) 0.29 [0.04, 0.53]
3 Functional ambulation 5 238 Std. Mean Difference (IV, Fixed, 95% CI) 0.25 [-0.00, 0.51]
4 Sit to stand: post
treatment/change from baseline
7 346 Standardised effect (Fixed, 95% CI) 0.35 [0.13, 0.56]
5 Lower limb functional measures 4 177 Std. Mean Difference (IV, Fixed, 95% CI) 0.20 [-0.10, 0.50]
6 Standing balance/reach 3 132 Std. Mean Difference (IV, Fixed, 95% CI) 0.29 [-0.06, 0.63]
Comparison 5. Lower limb function: follow up
Outcome or subgroup titleNo. of
studies
No. of
participants Statistical method Effect size
1 All outcomes 7 250 Std. Mean Difference (IV, Fixed, 95% CI) 0.03 [-0.22, 0.28]
1.1 Under 6 months post
treatment
4 80 Std. Mean Difference (IV, Fixed, 95% CI) 0.11 [-0.33, 0.56]
1.2 6 to 12 months post
treatment
3 170 Std. Mean Difference (IV, Fixed, 95% CI) -0.01 [-0.32, 0.29]
Comparison 6. Lower limb function: subgroup analyses
Outcome or subgroup titleNo. of
studies
No. of
participants Statistical method Effect size
1 Dosage of task practice 10 416 Std. Mean Difference (IV, Fixed, 95% CI) 0.26 [0.06, 0.45]
1.1 0 to 20 hours 8 336 Std. Mean Difference (IV, Fixed, 95% CI) 0.19 [-0.03, 0.40]
1.2 More than 20 hours 2 80 Std. Mean Difference (IV, Fixed, 95% CI) 0.56 [0.11, 1.01]
2 Time since stroke 10 416 Std. Mean Difference (IV, Fixed, 95% CI) 0.26 [0.06, 0.45]
2.1 0 to 15 days 3 197 Std. Mean Difference (IV, Fixed, 95% CI) 0.24 [-0.04, 0.52]
2.2 16 days to 6 months 4 101 Std. Mean Difference (IV, Fixed, 95% CI) 0.29 [-0.11, 0.69]
2.3 More than 6 months 3 118 Std. Mean Difference (IV, Fixed, 95% CI) 0.26 [-0.11, 0.62]
3 Type of intervention 10 416 Std. Mean Difference (IV, Fixed, 95% CI) 0.26 [0.06, 0.45]
3.1 Whole therapy 2 138 Std. Mean Difference (IV, Fixed, 95% CI) 0.10 [-0.24, 0.43]
3.2 Mixed training 5 210 Std. Mean Difference (IV, Fixed, 95% CI) 0.48 [0.20, 0.75]
3.3 Single task training 3 68 Std. Mean Difference (IV, Fixed, 95% CI) -0.07 [-0.55, 0.41]
50Repetitive task training for improving functional ability after stroke (Review)
Copyright © 2014 The Cochrane Collaboration. Published by John Wiley & Sons, Ltd.

Comparison 7. Global motor function
Outcome or subgroup titleNo. of
studies
No. of
participants Statistical method Effect size
1 Global motor function scales 2 138 Std. Mean Difference (IV, Fixed, 95% CI) 0.32 [-0.01, 0.66]
Comparison 8. Secondary outcomes
Outcome or subgroup titleNo. of
studies
No. of
participants Statistical method Effect size
1 Activities of daily living function 5 325 Std. Mean Difference (IV, Fixed, 95% CI) 0.29 [0.07, 0.51]
2 Upper limb impairment 3 184 Std. Mean Difference (IV, Fixed, 95% CI) 0.14 [-0.15, 0.43]
3 Lower limb impairment 2 73 Std. Mean Difference (IV, Fixed, 95% CI) 0.13 [-0.33, 0.59]
4 Quality of life/health status 3 148 Std. Mean Difference (IV, Fixed, 95% CI) 0.08 [-0.24, 0.41]
Comparison 9. Sensitivity analyses
Outcome or subgroup titleNo. of
studies
No. of
participants Statistical method Effect size
1 Allocation concealment 13 512 Std. Mean Difference (IV, Fixed, 95% CI) 0.38 [0.21, 0.56]
1.1 Adequate 8 368 Std. Mean Difference (IV, Fixed, 95% CI) 0.37 [0.17, 0.58]
1.2 Inadequate/unclear 5 144 Std. Mean Difference (IV, Fixed, 95% CI) 0.40 [0.07, 0.74]
2 Comparison groups 13 512 Std. Mean Difference (IV, Fixed, 95% CI) 0.38 [0.21, 0.56]
2.1 Usual care 7 283 Std. Mean Difference (IV, Fixed, 95% CI) 0.27 [0.03, 0.50]
2.2 Attention control 6 229 Std. Mean Difference (IV, Fixed, 95% CI) 0.53 [0.26, 0.80]
3 Equivalence of therapy time 13 512 Std. Mean Difference (IV, Fixed, 95% CI) 0.38 [0.21, 0.56]
3.1 Additional therapy time 2 62 Std. Mean Difference (IV, Fixed, 95% CI) 0.09 [-0.41, 0.59]
3.2 Equivalent therapy time 11 450 Std. Mean Difference (IV, Fixed, 95% CI) 0.42 [0.23, 0.61]
51Repetitive task training for improving functional ability after stroke (Review)
Copyright © 2014 The Cochrane Collaboration. Published by John Wiley & Sons, Ltd.
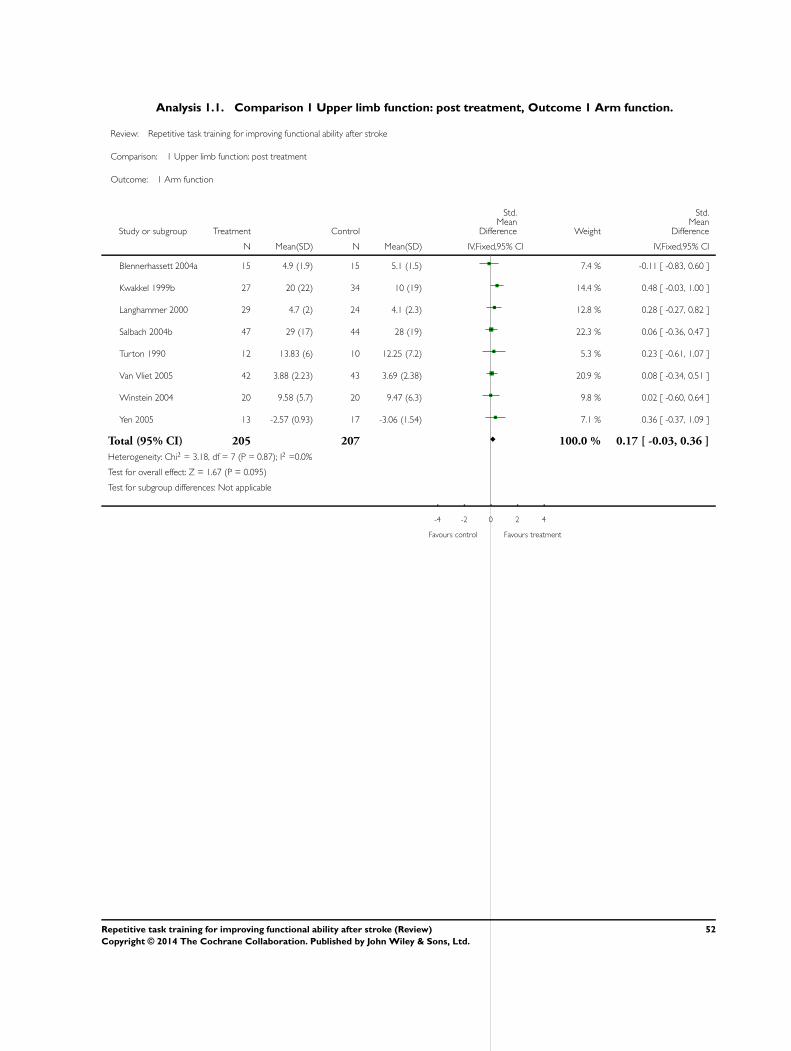
Analysis 1.1. Comparison 1 Upper limb function: post treatment, Outcome 1 Arm function.
Review: Repetitive task training for improving functional ability after stroke
Comparison: 1 Upper limb function: post treatment
Outcome: 1 Arm function
Study or subgroup Treatment Control
Std.Mean
Difference Weight
Std.Mean
Difference
N Mean(SD) N Mean(SD) IV,Fixed,95% CI IV,Fixed,95% CI
Blennerhassett 2004a 15 4.9 (1.9) 15 5.1 (1.5) 7.4 % -0.11 [ -0.83, 0.60 ]
Kwakkel 1999b 27 20 (22) 34 10 (19) 14.4 % 0.48 [ -0.03, 1.00 ]
Langhammer 2000 29 4.7 (2) 24 4.1 (2.3) 12.8 % 0.28 [ -0.27, 0.82 ]
Salbach 2004b 47 29 (17) 44 28 (19) 22.3 % 0.06 [ -0.36, 0.47 ]
Turton 1990 12 13.83 (6) 10 12.25 (7.2) 5.3 % 0.23 [ -0.61, 1.07 ]
Van Vliet 2005 42 3.88 (2.23) 43 3.69 (2.38) 20.9 % 0.08 [ -0.34, 0.51 ]
Winstein 2004 20 9.58 (5.7) 20 9.47 (6.3) 9.8 % 0.02 [ -0.60, 0.64 ]
Yen 2005 13 -2.57 (0.93) 17 -3.06 (1.54) 7.1 % 0.36 [ -0.37, 1.09 ]
Total (95% CI) 205 207 100.0 % 0.17 [ -0.03, 0.36 ]
Heterogeneity: Chi2 = 3.18, df = 7 (P = 0.87); I2 =0.0%
Test for overall effect: Z = 1.67 (P = 0.095)
Test for subgroup differences: Not applicable
-4 -2 0 2 4
Favours control Favours treatment
52Repetitive task training for improving functional ability after stroke (Review)
Copyright © 2014 The Cochrane Collaboration. Published by John Wiley & Sons, Ltd.
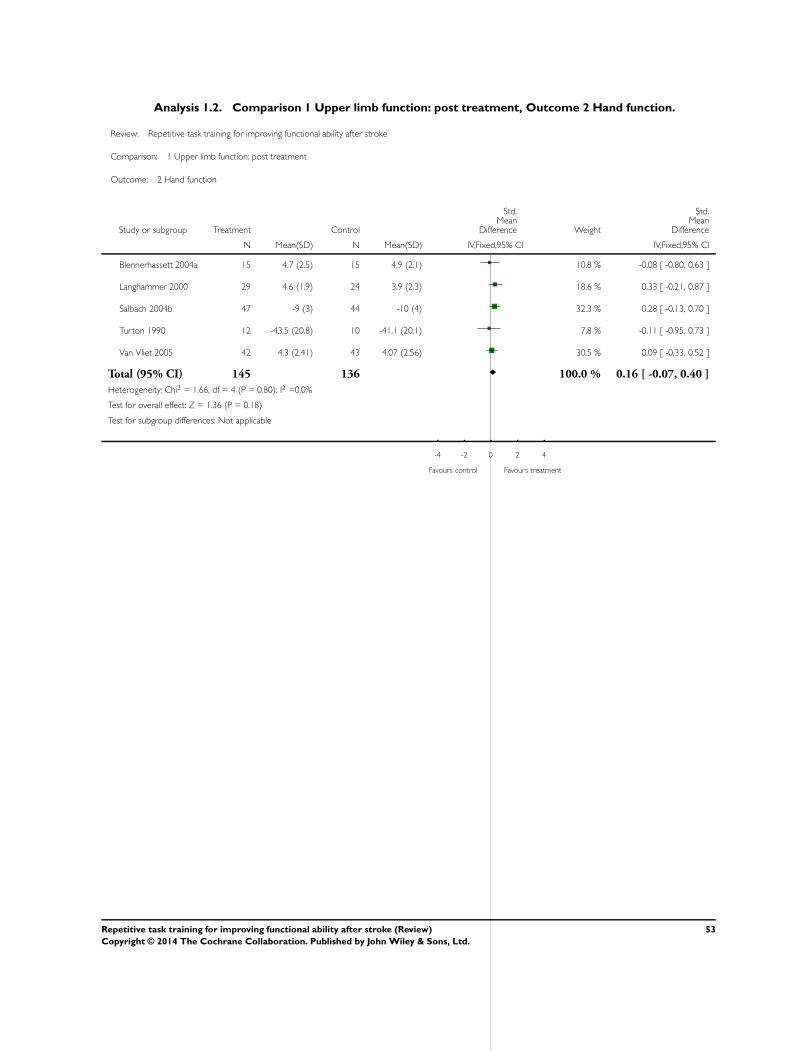
Analysis 1.2. Comparison 1 Upper limb function: post treatment, Outcome 2 Hand function.
Review: Repetitive task training for improving functional ability after stroke
Comparison: 1 Upper limb function: post treatment
Outcome: 2 Hand function
Study or subgroup Treatment Control
Std.Mean
Difference Weight
Std.Mean
Difference
N Mean(SD) N Mean(SD) IV,Fixed,95% CI IV,Fixed,95% CI
Blennerhassett 2004a 15 4.7 (2.5) 15 4.9 (2.1) 10.8 % -0.08 [ -0.80, 0.63 ]
Langhammer 2000 29 4.6 (1.9) 24 3.9 (2.3) 18.6 % 0.33 [ -0.21, 0.87 ]
Salbach 2004b 47 -9 (3) 44 -10 (4) 32.3 % 0.28 [ -0.13, 0.70 ]
Turton 1990 12 -43.5 (20.8) 10 -41.1 (20.1) 7.8 % -0.11 [ -0.95, 0.73 ]
Van Vliet 2005 42 4.3 (2.41) 43 4.07 (2.56) 30.5 % 0.09 [ -0.33, 0.52 ]
Total (95% CI) 145 136 100.0 % 0.16 [ -0.07, 0.40 ]
Heterogeneity: Chi2 = 1.66, df = 4 (P = 0.80); I2 =0.0%
Test for overall effect: Z = 1.36 (P = 0.18)
Test for subgroup differences: Not applicable
-4 -2 0 2 4
Favours control Favours treatment
53Repetitive task training for improving functional ability after stroke (Review)
Copyright © 2014 The Cochrane Collaboration. Published by John Wiley & Sons, Ltd.

Analysis 1.3. Comparison 1 Upper limb function: post treatment, Outcome 3 Sitting balance/reach.
Review: Repetitive task training for improving functional ability after stroke
Comparison: 1 Upper limb function: post treatment
Outcome: 3 Sitting balance/reach
Study or subgroup Treatment Control
Std.Mean
Difference Weight
Std.Mean
Difference
N Mean(SD) N Mean(SD) IV,Fixed,95% CI IV,Fixed,95% CI
de S ze 2001 10 3.3 (0.8) 10 3 (0.8) 9.6 % 0.36 [ -0.53, 1.24 ]
Dean 1997 10 12 (0.95) 9 10.8 (0.9) 7.5 % 1.24 [ 0.23, 2.24 ]
Howe 2005 15 -1.9 (0.8) 18 -2.1 (0.7) 15.9 % 0.26 [ -0.43, 0.95 ]
Langhammer 2000 29 5.4 (0.9) 24 5 (1.5) 25.4 % 0.33 [ -0.22, 0.87 ]
Van Vliet 2005 42 4.54 (1.49) 43 4.63 (1.42) 41.6 % -0.06 [ -0.49, 0.36 ]
Total (95% CI) 106 104 100.0 % 0.23 [ -0.05, 0.50 ]
Heterogeneity: Chi2 = 5.88, df = 4 (P = 0.21); I2 =32%
Test for overall effect: Z = 1.61 (P = 0.11)
Test for subgroup differences: Not applicable
-4 -2 0 2 4
Favours control Favours treatment
54Repetitive task training for improving functional ability after stroke (Review)
Copyright © 2014 The Cochrane Collaboration. Published by John Wiley & Sons, Ltd.
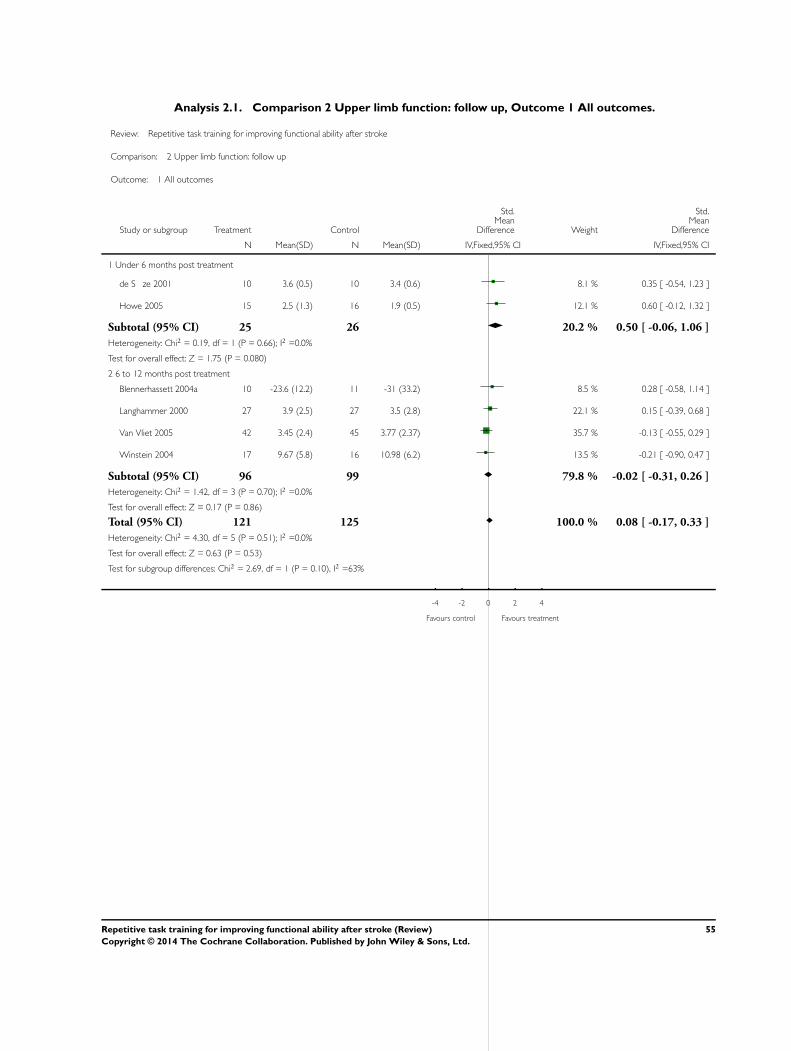
Analysis 2.1. Comparison 2 Upper limb function: follow up, Outcome 1 All outcomes.
Review: Repetitive task training for improving functional ability after stroke
Comparison: 2 Upper limb function: follow up
Outcome: 1 All outcomes
Study or subgroup Treatment Control
Std.Mean
Difference Weight
Std.Mean
Difference
N Mean(SD) N Mean(SD) IV,Fixed,95% CI IV,Fixed,95% CI
1 Under 6 months post treatment
de S ze 2001 10 3.6 (0.5) 10 3.4 (0.6) 8.1 % 0.35 [ -0.54, 1.23 ]
Howe 2005 15 2.5 (1.3) 16 1.9 (0.5) 12.1 % 0.60 [ -0.12, 1.32 ]
Subtotal (95% CI) 25 26 20.2 % 0.50 [ -0.06, 1.06 ]
Heterogeneity: Chi2 = 0.19, df = 1 (P = 0.66); I2 =0.0%
Test for overall effect: Z = 1.75 (P = 0.080)
2 6 to 12 months post treatment
Blennerhassett 2004a 10 -23.6 (12.2) 11 -31 (33.2) 8.5 % 0.28 [ -0.58, 1.14 ]
Langhammer 2000 27 3.9 (2.5) 27 3.5 (2.8) 22.1 % 0.15 [ -0.39, 0.68 ]
Van Vliet 2005 42 3.45 (2.4) 45 3.77 (2.37) 35.7 % -0.13 [ -0.55, 0.29 ]
Winstein 2004 17 9.67 (5.8) 16 10.98 (6.2) 13.5 % -0.21 [ -0.90, 0.47 ]
Subtotal (95% CI) 96 99 79.8 % -0.02 [ -0.31, 0.26 ]
Heterogeneity: Chi2 = 1.42, df = 3 (P = 0.70); I2 =0.0%
Test for overall effect: Z = 0.17 (P = 0.86)
Total (95% CI) 121 125 100.0 % 0.08 [ -0.17, 0.33 ]
Heterogeneity: Chi2 = 4.30, df = 5 (P = 0.51); I2 =0.0%
Test for overall effect: Z = 0.63 (P = 0.53)
Test for subgroup differences: Chi2 = 2.69, df = 1 (P = 0.10), I2 =63%
-4 -2 0 2 4
Favours control Favours treatment
55Repetitive task training for improving functional ability after stroke (Review)
Copyright © 2014 The Cochrane Collaboration. Published by John Wiley & Sons, Ltd.

Analysis 3.1. Comparison 3 Upper limb function: subgroup analyses, Outcome 1 Dosage of task practice.
Review: Repetitive task training for improving functional ability after stroke
Comparison: 3 Upper limb function: subgroup analyses
Outcome: 1 Dosage of task practice
Study or subgroup Treatment Control
Std.Mean
Difference Weight
Std.Mean
Difference
N Mean(SD) N Mean(SD) IV,Fixed,95% CI IV,Fixed,95% CI
1 0 to 20 hours
Blennerhassett 2004a 15 4.5 (2.5) 15 4.1 (2.7) 6.3 % 0.15 [ -0.57, 0.87 ]
de S ze 2001 10 3.3 (0.8) 10 3 (0.8) 4.1 % 0.36 [ -0.53, 1.24 ]
Dean 1997 10 1200 (94.9) 9 1080 (90) 3.2 % 1.24 [ 0.23, 2.24 ]
Howe 2005 15 -1.9 (0.8) 18 -2.1 (0.7) 6.8 % 0.26 [ -0.43, 0.95 ]
Langhammer 2000 29 4.7 (2) 24 4.1 (2.3) 11.0 % 0.28 [ -0.27, 0.82 ]
Salbach 2004b 47 29 (17) 44 28 (19) 19.2 % 0.06 [ -0.36, 0.47 ]
Van Vliet 2005 42 3.88 (2.23) 43 3.69 (2.38) 17.9 % 0.08 [ -0.34, 0.51 ]
Winstein 2004 20 9.58 (5.7) 20 9.47 (6.3) 8.4 % 0.02 [ -0.60, 0.64 ]
Subtotal (95% CI) 188 183 77.0 % 0.18 [ -0.02, 0.39 ]
Heterogeneity: Chi2 = 5.43, df = 7 (P = 0.61); I2 =0.0%
Test for overall effect: Z = 1.72 (P = 0.085)
2 More than 20 hours
Kwakkel 1999b 27 20 (22) 34 10 (19) 12.3 % 0.48 [ -0.03, 1.00 ]
Turton 1990 12 13.83 (6) 10 12.25 (7.2) 4.6 % 0.23 [ -0.61, 1.07 ]
Yen 2005 13 -2.57 (0.93) 17 -3.06 (1.54) 6.1 % 0.36 [ -0.37, 1.09 ]
Subtotal (95% CI) 52 61 23.0 % 0.40 [ 0.03, 0.78 ]
Heterogeneity: Chi2 = 0.27, df = 2 (P = 0.87); I2 =0.0%
Test for overall effect: Z = 2.10 (P = 0.036)
Total (95% CI) 240 244 100.0 % 0.23 [ 0.05, 0.41 ]
Heterogeneity: Chi2 = 6.73, df = 10 (P = 0.75); I2 =0.0%
Test for overall effect: Z = 2.52 (P = 0.012)
Test for subgroup differences: Chi2 = 1.03, df = 1 (P = 0.31), I2 =3%
-4 -2 0 2 4
Favours control Favours treatment
56Repetitive task training for improving functional ability after stroke (Review)
Copyright © 2014 The Cochrane Collaboration. Published by John Wiley & Sons, Ltd.
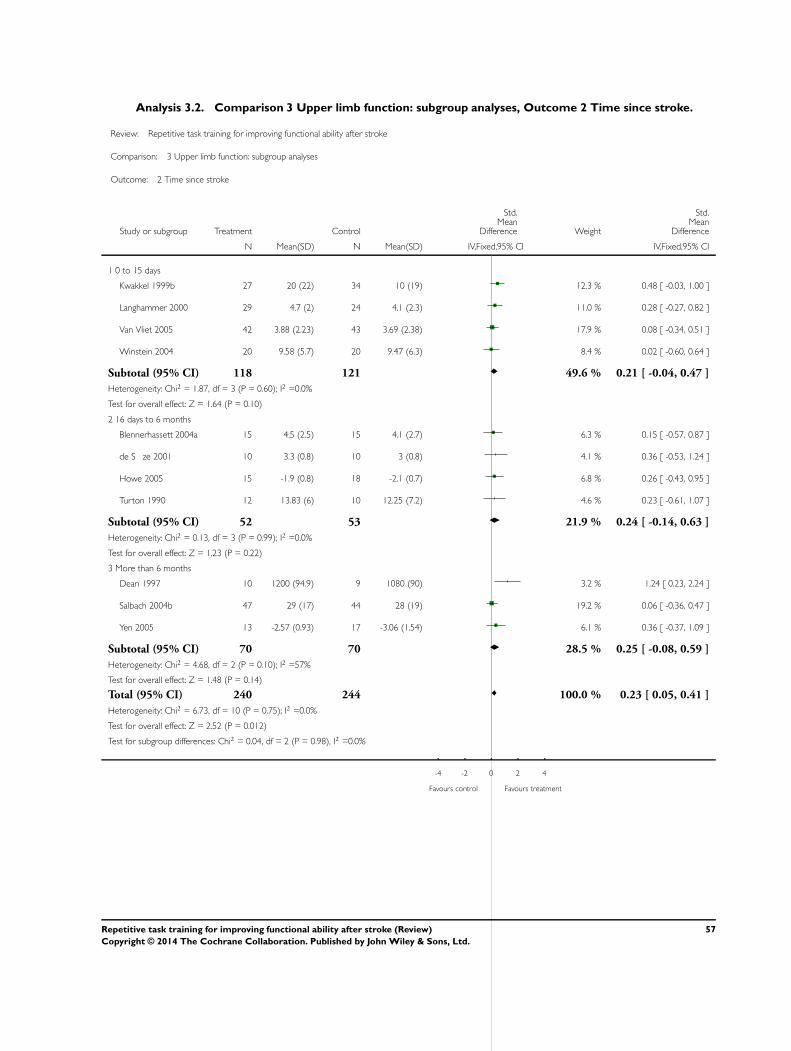
Analysis 3.2. Comparison 3 Upper limb function: subgroup analyses, Outcome 2 Time since stroke.
Review: Repetitive task training for improving functional ability after stroke
Comparison: 3 Upper limb function: subgroup analyses
Outcome: 2 Time since stroke
Study or subgroup Treatment Control
Std.Mean
Difference Weight
Std.Mean
Difference
N Mean(SD) N Mean(SD) IV,Fixed,95% CI IV,Fixed,95% CI
1 0 to 15 days
Kwakkel 1999b 27 20 (22) 34 10 (19) 12.3 % 0.48 [ -0.03, 1.00 ]
Langhammer 2000 29 4.7 (2) 24 4.1 (2.3) 11.0 % 0.28 [ -0.27, 0.82 ]
Van Vliet 2005 42 3.88 (2.23) 43 3.69 (2.38) 17.9 % 0.08 [ -0.34, 0.51 ]
Winstein 2004 20 9.58 (5.7) 20 9.47 (6.3) 8.4 % 0.02 [ -0.60, 0.64 ]
Subtotal (95% CI) 118 121 49.6 % 0.21 [ -0.04, 0.47 ]
Heterogeneity: Chi2 = 1.87, df = 3 (P = 0.60); I2 =0.0%
Test for overall effect: Z = 1.64 (P = 0.10)
2 16 days to 6 months
Blennerhassett 2004a 15 4.5 (2.5) 15 4.1 (2.7) 6.3 % 0.15 [ -0.57, 0.87 ]
de S ze 2001 10 3.3 (0.8) 10 3 (0.8) 4.1 % 0.36 [ -0.53, 1.24 ]
Howe 2005 15 -1.9 (0.8) 18 -2.1 (0.7) 6.8 % 0.26 [ -0.43, 0.95 ]
Turton 1990 12 13.83 (6) 10 12.25 (7.2) 4.6 % 0.23 [ -0.61, 1.07 ]
Subtotal (95% CI) 52 53 21.9 % 0.24 [ -0.14, 0.63 ]
Heterogeneity: Chi2 = 0.13, df = 3 (P = 0.99); I2 =0.0%
Test for overall effect: Z = 1.23 (P = 0.22)
3 More than 6 months
Dean 1997 10 1200 (94.9) 9 1080 (90) 3.2 % 1.24 [ 0.23, 2.24 ]
Salbach 2004b 47 29 (17) 44 28 (19) 19.2 % 0.06 [ -0.36, 0.47 ]
Yen 2005 13 -2.57 (0.93) 17 -3.06 (1.54) 6.1 % 0.36 [ -0.37, 1.09 ]
Subtotal (95% CI) 70 70 28.5 % 0.25 [ -0.08, 0.59 ]
Heterogeneity: Chi2 = 4.68, df = 2 (P = 0.10); I2 =57%
Test for overall effect: Z = 1.48 (P = 0.14)
Total (95% CI) 240 244 100.0 % 0.23 [ 0.05, 0.41 ]
Heterogeneity: Chi2 = 6.73, df = 10 (P = 0.75); I2 =0.0%
Test for overall effect: Z = 2.52 (P = 0.012)
Test for subgroup differences: Chi2 = 0.04, df = 2 (P = 0.98), I2 =0.0%
-4 -2 0 2 4
Favours control Favours treatment
57Repetitive task training for improving functional ability after stroke (Review)
Copyright © 2014 The Cochrane Collaboration. Published by John Wiley & Sons, Ltd.

Analysis 3.3. Comparison 3 Upper limb function: subgroup analyses, Outcome 3 Type of intervention.
Review: Repetitive task training for improving functional ability after stroke
Comparison: 3 Upper limb function: subgroup analyses
Outcome: 3 Type of intervention
Study or subgroup Treatment Control
Std.Mean
Difference Weight
Std.Mean
Difference
N Mean(SD) N Mean(SD) IV,Fixed,95% CI IV,Fixed,95% CI
1 Whole therapy
Langhammer 2000 29 4.7 (2) 24 4.1 (2.3) 11.0 % 0.28 [ -0.27, 0.82 ]
Van Vliet 2005 42 3.88 (2.23) 43 3.69 (2.38) 17.9 % 0.08 [ -0.34, 0.51 ]
Subtotal (95% CI) 71 67 28.9 % 0.16 [ -0.18, 0.49 ]
Heterogeneity: Chi2 = 0.31, df = 1 (P = 0.58); I2 =0.0%
Test for overall effect: Z = 0.91 (P = 0.36)
2 Mixed training
Blennerhassett 2004a 15 4.5 (2.5) 15 4.1 (2.7) 6.3 % 0.15 [ -0.57, 0.87 ]
Kwakkel 1999b 27 20 (22) 34 10 (19) 12.3 % 0.48 [ -0.03, 1.00 ]
Salbach 2004b 47 29 (17) 44 28 (19) 19.2 % 0.06 [ -0.36, 0.47 ]
Turton 1990 12 13.83 (6) 10 12.25 (7.2) 4.6 % 0.23 [ -0.61, 1.07 ]
Winstein 2004 20 9.58 (5.7) 20 9.47 (6.3) 8.4 % 0.02 [ -0.60, 0.64 ]
Yen 2005 13 -2.57 (0.93) 17 -3.06 (1.54) 6.1 % 0.36 [ -0.37, 1.09 ]
Subtotal (95% CI) 134 140 56.9 % 0.20 [ -0.04, 0.44 ]
Heterogeneity: Chi2 = 2.21, df = 5 (P = 0.82); I2 =0.0%
Test for overall effect: Z = 1.64 (P = 0.10)
3 Single task training
de S ze 2001 10 3.3 (0.8) 10 3 (0.8) 4.1 % 0.36 [ -0.53, 1.24 ]
Dean 1997 10 1200 (94.9) 9 1080 (90) 3.2 % 1.24 [ 0.23, 2.24 ]
Howe 2005 15 -1.9 (0.8) 18 -2.1 (0.7) 6.8 % 0.26 [ -0.43, 0.95 ]
Subtotal (95% CI) 35 37 14.2 % 0.51 [ 0.03, 0.99 ]
Heterogeneity: Chi2 = 2.63, df = 2 (P = 0.27); I2 =24%
Test for overall effect: Z = 2.10 (P = 0.036)
Total (95% CI) 240 244 100.0 % 0.23 [ 0.05, 0.41 ]
Heterogeneity: Chi2 = 6.73, df = 10 (P = 0.75); I2 =0.0%
Test for overall effect: Z = 2.52 (P = 0.012)
Test for subgroup differences: Chi2 = 1.58, df = 2 (P = 0.45), I2 =0.0%
-4 -2 0 2 4
Favours control Favours treatment
58Repetitive task training for improving functional ability after stroke (Review)
Copyright © 2014 The Cochrane Collaboration. Published by John Wiley & Sons, Ltd.

Analysis 4.1. Comparison 4 Lower limb function: post treatment, Outcome 1 Walking distance: change
from baseline.
Review: Repetitive task training for improving functional ability after stroke
Comparison: 4 Lower limb function: post treatment
Outcome: 1 Walking distance: change from baseline
Study or subgroup Treatment ControlMean
Difference WeightMean
Difference
N Mean(SD) N Mean(SD) IV,Random,95% CI IV,Random,95% CI
Dean 2000 5 42.03 (30.42) 4 4.76 (4.9) 38.5 % 37.27 [ 10.18, 64.36 ]
Salbach 2004a 44 40 (72) 47 5 (66) 37.8 % 35.00 [ 6.56, 63.44 ]
Blennerhassett 2004b 15 221 (65.4) 15 107 (85.6) 23.7 % 114.00 [ 59.48, 168.52 ]
Total (95% CI) 64 66 100.0 % 54.59 [ 17.50, 91.68 ]
Heterogeneity: Tau2 = 737.75; Chi2 = 6.94, df = 2 (P = 0.03); I2 =71%
Test for overall effect: Z = 2.88 (P = 0.0039)
Test for subgroup differences: Not applicable
-1000 -500 0 500 1000
Favours control Favours treatment
59Repetitive task training for improving functional ability after stroke (Review)
Copyright © 2014 The Cochrane Collaboration. Published by John Wiley & Sons, Ltd.

Analysis 4.2. Comparison 4 Lower limb function: post treatment, Outcome 2 Walking speed.
Review: Repetitive task training for improving functional ability after stroke
Comparison: 4 Lower limb function: post treatment
Outcome: 2 Walking speed
Study or subgroup Treatment Control
Std.Mean
Difference Weight
Std.Mean
Difference
N Mean(SD) N Mean(SD) IV,Fixed,95% CI IV,Fixed,95% CI
Dean 1997 10 33.8 (18.6) 8 29.4 (33.9) 6.9 % 0.16 [ -0.77, 1.09 ]
Dean 2000 5 80.2 (42.8) 4 88.4 (52.2) 3.4 % -0.15 [ -1.47, 1.16 ]
Kwakkel 1999a 26 0.65 (0.46) 34 0.37 (0.41) 21.8 % 0.64 [ 0.12, 1.16 ]
Salbach 2004a 44 0.78 (0.4) 47 0.64 (0.37) 34.8 % 0.36 [ -0.05, 0.78 ]
Van Vliet 2005 42 12.19 (9.05) 43 11.75 (7.88) 33.1 % 0.05 [ -0.37, 0.48 ]
Total (95% CI) 127 136 100.0 % 0.29 [ 0.04, 0.53 ]
Heterogeneity: Chi2 = 3.54, df = 4 (P = 0.47); I2 =0.0%
Test for overall effect: Z = 2.30 (P = 0.021)
Test for subgroup differences: Not applicable
-4 -2 0 2 4
Favours control Favours treatment
60Repetitive task training for improving functional ability after stroke (Review)
Copyright © 2014 The Cochrane Collaboration. Published by John Wiley & Sons, Ltd.
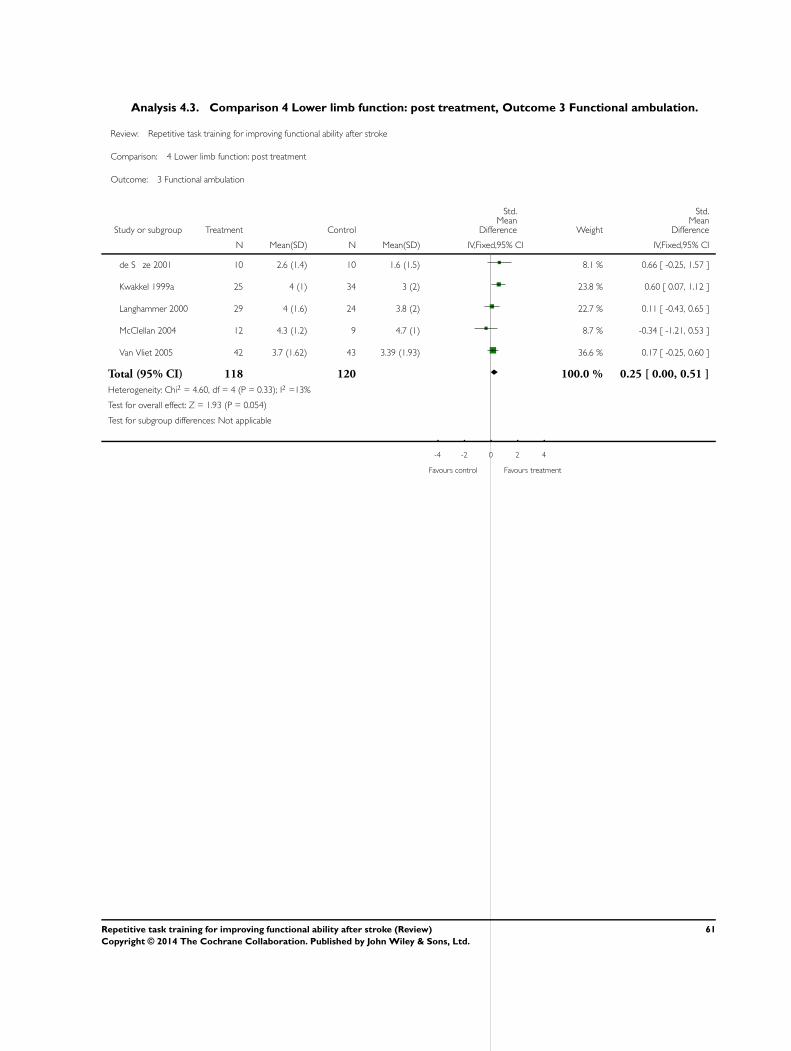
Analysis 4.3. Comparison 4 Lower limb function: post treatment, Outcome 3 Functional ambulation.
Review: Repetitive task training for improving functional ability after stroke
Comparison: 4 Lower limb function: post treatment
Outcome: 3 Functional ambulation
Study or subgroup Treatment Control
Std.Mean
Difference Weight
Std.Mean
Difference
N Mean(SD) N Mean(SD) IV,Fixed,95% CI IV,Fixed,95% CI
de S ze 2001 10 2.6 (1.4) 10 1.6 (1.5) 8.1 % 0.66 [ -0.25, 1.57 ]
Kwakkel 1999a 25 4 (1) 34 3 (2) 23.8 % 0.60 [ 0.07, 1.12 ]
Langhammer 2000 29 4 (1.6) 24 3.8 (2) 22.7 % 0.11 [ -0.43, 0.65 ]
McClellan 2004 12 4.3 (1.2) 9 4.7 (1) 8.7 % -0.34 [ -1.21, 0.53 ]
Van Vliet 2005 42 3.7 (1.62) 43 3.39 (1.93) 36.6 % 0.17 [ -0.25, 0.60 ]
Total (95% CI) 118 120 100.0 % 0.25 [ 0.00, 0.51 ]
Heterogeneity: Chi2 = 4.60, df = 4 (P = 0.33); I2 =13%
Test for overall effect: Z = 1.93 (P = 0.054)
Test for subgroup differences: Not applicable
-4 -2 0 2 4
Favours control Favours treatment
61Repetitive task training for improving functional ability after stroke (Review)
Copyright © 2014 The Cochrane Collaboration. Published by John Wiley & Sons, Ltd.
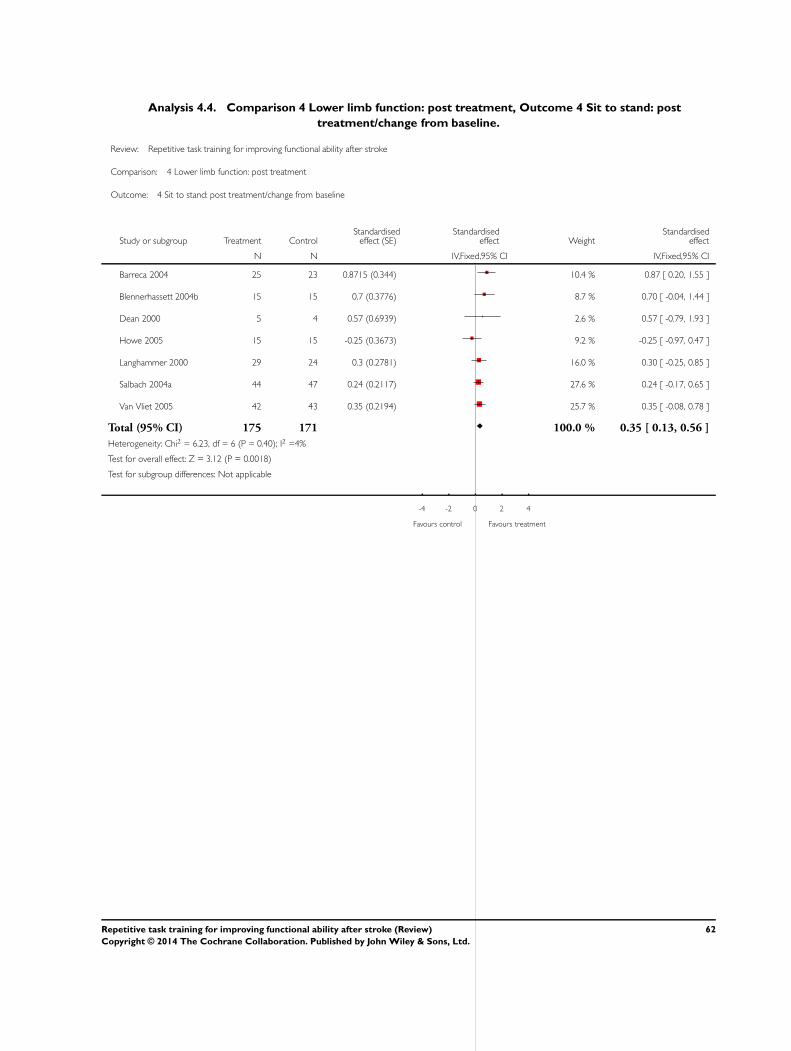
Analysis 4.4. Comparison 4 Lower limb function: post treatment, Outcome 4 Sit to stand: post
treatment/change from baseline.
Review: Repetitive task training for improving functional ability after stroke
Comparison: 4 Lower limb function: post treatment
Outcome: 4 Sit to stand: post treatment/change from baseline
Study or subgroup Treatment ControlStandardised
effect (SE)Standardised
effect WeightStandardised
effect
N N IV,Fixed,95% CI IV,Fixed,95% CI
Barreca 2004 25 23 0.8715 (0.344) 10.4 % 0.87 [ 0.20, 1.55 ]
Blennerhassett 2004b 15 15 0.7 (0.3776) 8.7 % 0.70 [ -0.04, 1.44 ]
Dean 2000 5 4 0.57 (0.6939) 2.6 % 0.57 [ -0.79, 1.93 ]
Howe 2005 15 15 -0.25 (0.3673) 9.2 % -0.25 [ -0.97, 0.47 ]
Langhammer 2000 29 24 0.3 (0.2781) 16.0 % 0.30 [ -0.25, 0.85 ]
Salbach 2004a 44 47 0.24 (0.2117) 27.6 % 0.24 [ -0.17, 0.65 ]
Van Vliet 2005 42 43 0.35 (0.2194) 25.7 % 0.35 [ -0.08, 0.78 ]
Total (95% CI) 175 171 100.0 % 0.35 [ 0.13, 0.56 ]
Heterogeneity: Chi2 = 6.23, df = 6 (P = 0.40); I2 =4%
Test for overall effect: Z = 3.12 (P = 0.0018)
Test for subgroup differences: Not applicable
-4 -2 0 2 4
Favours control Favours treatment
62Repetitive task training for improving functional ability after stroke (Review)
Copyright © 2014 The Cochrane Collaboration. Published by John Wiley & Sons, Ltd.
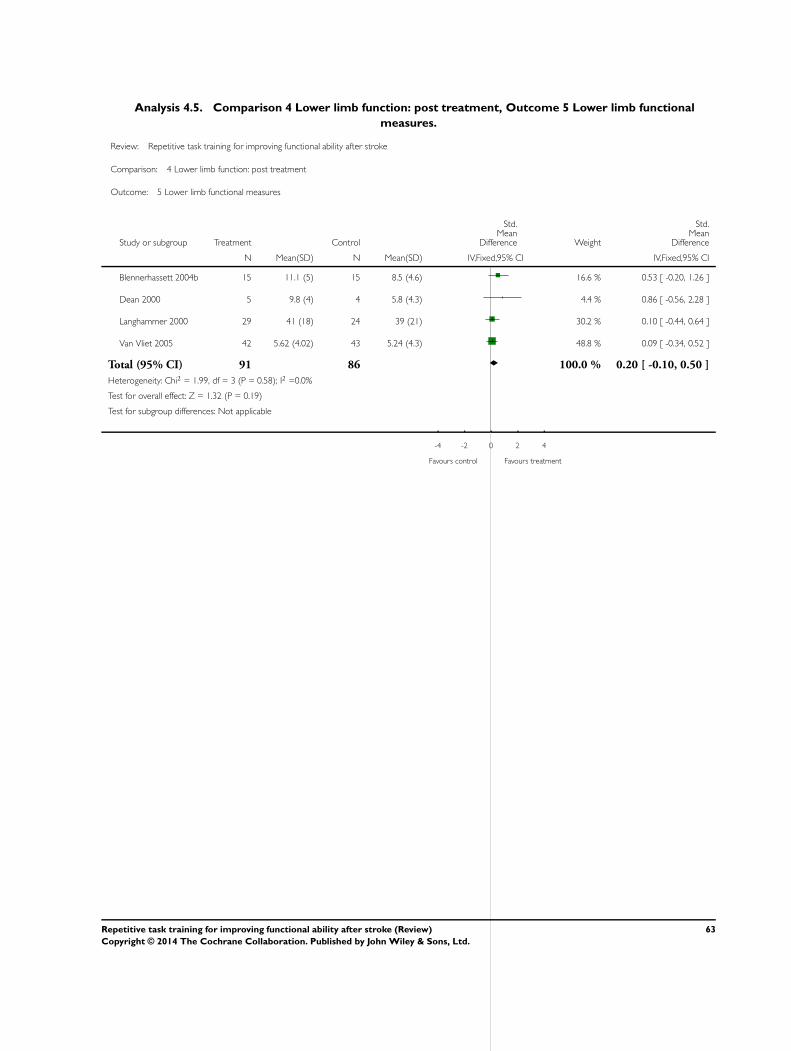
Analysis 4.5. Comparison 4 Lower limb function: post treatment, Outcome 5 Lower limb functional
measures.
Review: Repetitive task training for improving functional ability after stroke
Comparison: 4 Lower limb function: post treatment
Outcome: 5 Lower limb functional measures
Study or subgroup Treatment Control
Std.Mean
Difference Weight
Std.Mean
Difference
N Mean(SD) N Mean(SD) IV,Fixed,95% CI IV,Fixed,95% CI
Blennerhassett 2004b 15 11.1 (5) 15 8.5 (4.6) 16.6 % 0.53 [ -0.20, 1.26 ]
Dean 2000 5 9.8 (4) 4 5.8 (4.3) 4.4 % 0.86 [ -0.56, 2.28 ]
Langhammer 2000 29 41 (18) 24 39 (21) 30.2 % 0.10 [ -0.44, 0.64 ]
Van Vliet 2005 42 5.62 (4.02) 43 5.24 (4.3) 48.8 % 0.09 [ -0.34, 0.52 ]
Total (95% CI) 91 86 100.0 % 0.20 [ -0.10, 0.50 ]
Heterogeneity: Chi2 = 1.99, df = 3 (P = 0.58); I2 =0.0%
Test for overall effect: Z = 1.32 (P = 0.19)
Test for subgroup differences: Not applicable
-4 -2 0 2 4
Favours control Favours treatment
63Repetitive task training for improving functional ability after stroke (Review)
Copyright © 2014 The Cochrane Collaboration. Published by John Wiley & Sons, Ltd.
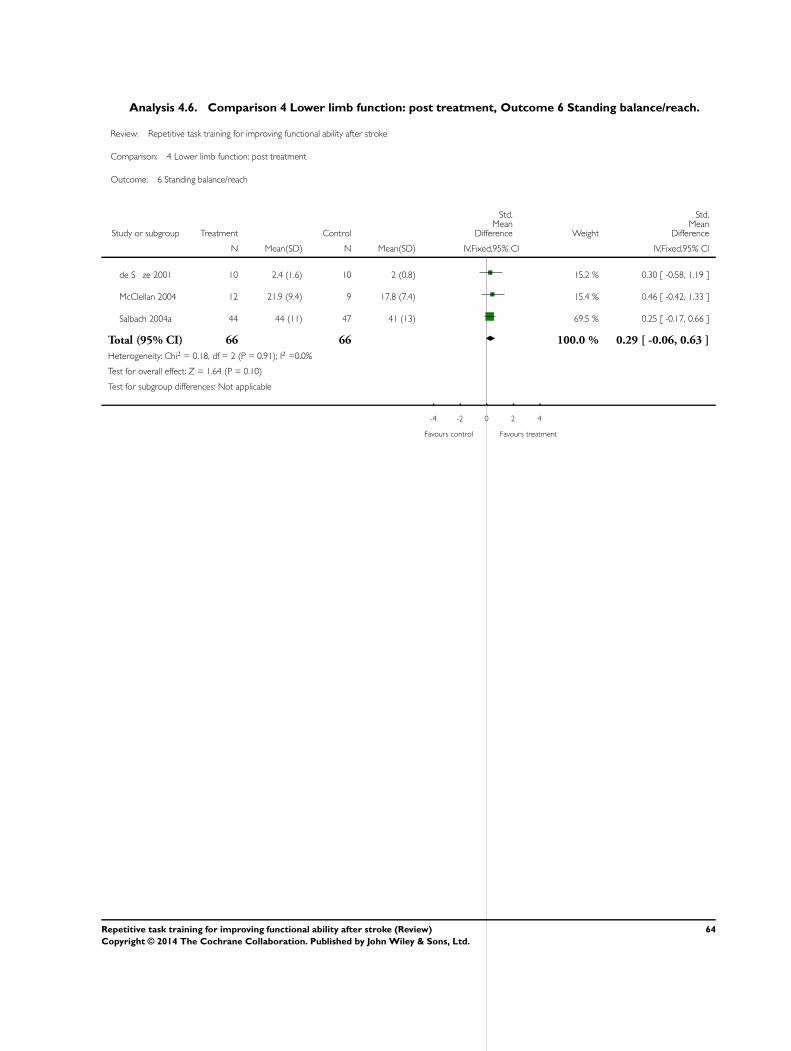
Analysis 4.6. Comparison 4 Lower limb function: post treatment, Outcome 6 Standing balance/reach.
Review: Repetitive task training for improving functional ability after stroke
Comparison: 4 Lower limb function: post treatment
Outcome: 6 Standing balance/reach
Study or subgroup Treatment Control
Std.Mean
Difference Weight
Std.Mean
Difference
N Mean(SD) N Mean(SD) IV,Fixed,95% CI IV,Fixed,95% CI
de S ze 2001 10 2.4 (1.6) 10 2 (0.8) 15.2 % 0.30 [ -0.58, 1.19 ]
McClellan 2004 12 21.9 (9.4) 9 17.8 (7.4) 15.4 % 0.46 [ -0.42, 1.33 ]
Salbach 2004a 44 44 (11) 47 41 (13) 69.5 % 0.25 [ -0.17, 0.66 ]
Total (95% CI) 66 66 100.0 % 0.29 [ -0.06, 0.63 ]
Heterogeneity: Chi2 = 0.18, df = 2 (P = 0.91); I2 =0.0%
Test for overall effect: Z = 1.64 (P = 0.10)
Test for subgroup differences: Not applicable
-4 -2 0 2 4
Favours control Favours treatment
64Repetitive task training for improving functional ability after stroke (Review)
Copyright © 2014 The Cochrane Collaboration. Published by John Wiley & Sons, Ltd.
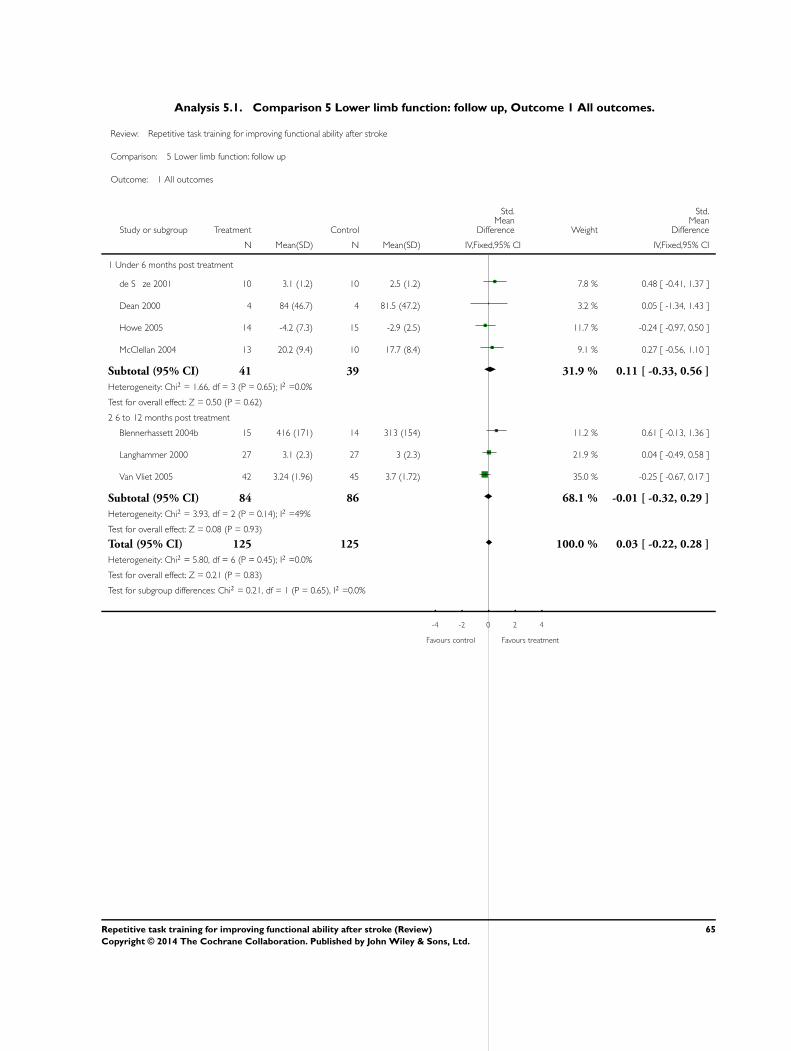
Analysis 5.1. Comparison 5 Lower limb function: follow up, Outcome 1 All outcomes.
Review: Repetitive task training for improving functional ability after stroke
Comparison: 5 Lower limb function: follow up
Outcome: 1 All outcomes
Study or subgroup Treatment Control
Std.Mean
Difference Weight
Std.Mean
Difference
N Mean(SD) N Mean(SD) IV,Fixed,95% CI IV,Fixed,95% CI
1 Under 6 months post treatment
de S ze 2001 10 3.1 (1.2) 10 2.5 (1.2) 7.8 % 0.48 [ -0.41, 1.37 ]
Dean 2000 4 84 (46.7) 4 81.5 (47.2) 3.2 % 0.05 [ -1.34, 1.43 ]
Howe 2005 14 -4.2 (7.3) 15 -2.9 (2.5) 11.7 % -0.24 [ -0.97, 0.50 ]
McClellan 2004 13 20.2 (9.4) 10 17.7 (8.4) 9.1 % 0.27 [ -0.56, 1.10 ]
Subtotal (95% CI) 41 39 31.9 % 0.11 [ -0.33, 0.56 ]
Heterogeneity: Chi2 = 1.66, df = 3 (P = 0.65); I2 =0.0%
Test for overall effect: Z = 0.50 (P = 0.62)
2 6 to 12 months post treatment
Blennerhassett 2004b 15 416 (171) 14 313 (154) 11.2 % 0.61 [ -0.13, 1.36 ]
Langhammer 2000 27 3.1 (2.3) 27 3 (2.3) 21.9 % 0.04 [ -0.49, 0.58 ]
Van Vliet 2005 42 3.24 (1.96) 45 3.7 (1.72) 35.0 % -0.25 [ -0.67, 0.17 ]
Subtotal (95% CI) 84 86 68.1 % -0.01 [ -0.32, 0.29 ]
Heterogeneity: Chi2 = 3.93, df = 2 (P = 0.14); I2 =49%
Test for overall effect: Z = 0.08 (P = 0.93)
Total (95% CI) 125 125 100.0 % 0.03 [ -0.22, 0.28 ]
Heterogeneity: Chi2 = 5.80, df = 6 (P = 0.45); I2 =0.0%
Test for overall effect: Z = 0.21 (P = 0.83)
Test for subgroup differences: Chi2 = 0.21, df = 1 (P = 0.65), I2 =0.0%
-4 -2 0 2 4
Favours control Favours treatment
65Repetitive task training for improving functional ability after stroke (Review)
Copyright © 2014 The Cochrane Collaboration. Published by John Wiley & Sons, Ltd.

Analysis 6.1. Comparison 6 Lower limb function: subgroup analyses, Outcome 1 Dosage of task practice.
Review: Repetitive task training for improving functional ability after stroke
Comparison: 6 Lower limb function: subgroup analyses
Outcome: 1 Dosage of task practice
Study or subgroup Treatment Control
Std.Mean
Difference Weight
Std.Mean
Difference
N Mean(SD) N Mean(SD) IV,Fixed,95% CI IV,Fixed,95% CI
1 0 to 20 hours
Blennerhassett 2004b 15 404 (101) 15 288 (124) 6.5 % 1.00 [ 0.23, 1.76 ]
de S ze 2001 10 70.3 (24.2) 10 70.4 (21.7) 4.9 % 0.00 [ -0.88, 0.87 ]
Dean 1997 10 33.8 (18.6) 8 29.4 (33.9) 4.4 % 0.16 [ -0.77, 1.09 ]
Dean 2000 5 84 (46.7) 4 81.5 (47.2) 2.2 % 0.05 [ -1.27, 1.36 ]
Howe 2005 15 -3.3 (3.7) 15 -2.6 (1.2) 7.3 % -0.25 [ -0.97, 0.47 ]
Langhammer 2000 29 4 (1.6) 24 3.8 (2) 13.0 % 0.11 [ -0.43, 0.65 ]
Salbach 2004a 44 249 (136) 47 209 (132) 22.2 % 0.30 [ -0.12, 0.71 ]
Van Vliet 2005 42 5.62 (4.02) 43 5.24 (4.3) 21.0 % 0.09 [ -0.34, 0.52 ]
Subtotal (95% CI) 170 166 81.5 % 0.19 [ -0.03, 0.40 ]
Heterogeneity: Chi2 = 6.49, df = 7 (P = 0.48); I2 =0.0%
Test for overall effect: Z = 1.71 (P = 0.088)
2 More than 20 hours
Kwakkel 1999a 25 4 (1) 34 3 (2) 13.6 % 0.60 [ 0.07, 1.12 ]
McClellan 2004 12 21.9 (9.4) 9 17.8 (7.4) 4.9 % 0.46 [ -0.42, 1.33 ]
Subtotal (95% CI) 37 43 18.5 % 0.56 [ 0.11, 1.01 ]
Heterogeneity: Chi2 = 0.07, df = 1 (P = 0.79); I2 =0.0%
Test for overall effect: Z = 2.42 (P = 0.015)
Total (95% CI) 207 209 100.0 % 0.26 [ 0.06, 0.45 ]
Heterogeneity: Chi2 = 8.67, df = 9 (P = 0.47); I2 =0.0%
Test for overall effect: Z = 2.58 (P = 0.0098)
Test for subgroup differences: Chi2 = 2.11, df = 1 (P = 0.15), I2 =53%
-4 -2 0 2 4
Favours control Favours treatment
66Repetitive task training for improving functional ability after stroke (Review)
Copyright © 2014 The Cochrane Collaboration. Published by John Wiley & Sons, Ltd.
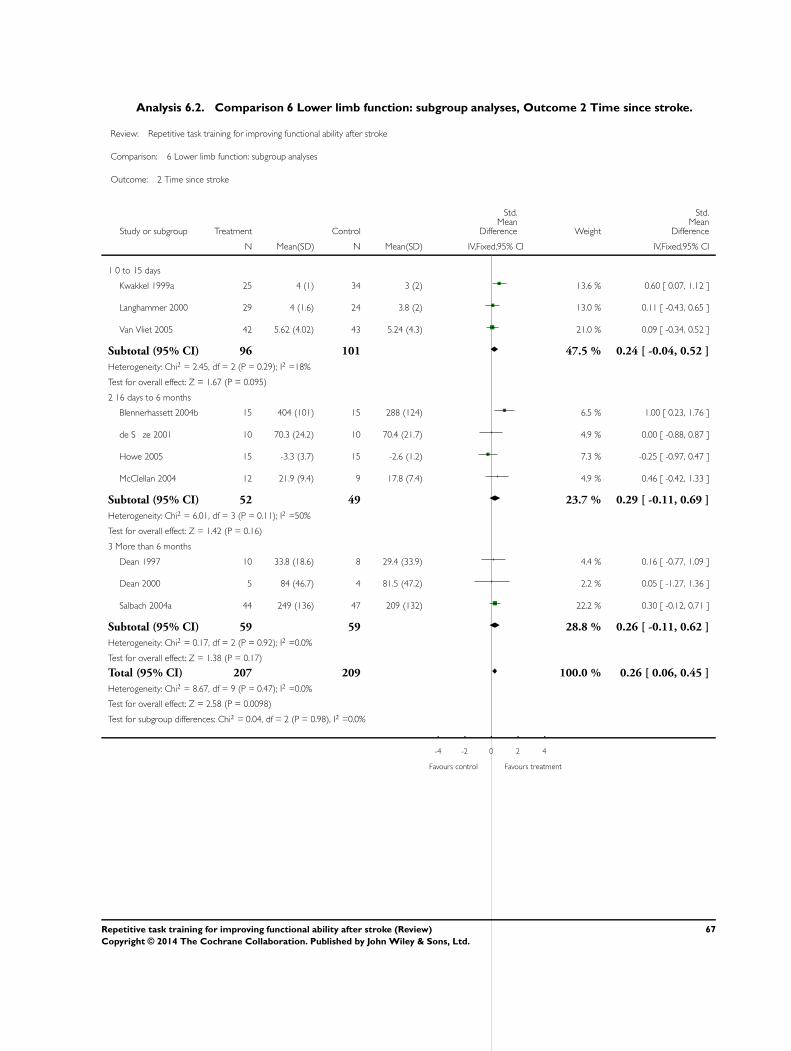
Analysis 6.2. Comparison 6 Lower limb function: subgroup analyses, Outcome 2 Time since stroke.
Review: Repetitive task training for improving functional ability after stroke
Comparison: 6 Lower limb function: subgroup analyses
Outcome: 2 Time since stroke
Study or subgroup Treatment Control
Std.Mean
Difference Weight
Std.Mean
Difference
N Mean(SD) N Mean(SD) IV,Fixed,95% CI IV,Fixed,95% CI
1 0 to 15 days
Kwakkel 1999a 25 4 (1) 34 3 (2) 13.6 % 0.60 [ 0.07, 1.12 ]
Langhammer 2000 29 4 (1.6) 24 3.8 (2) 13.0 % 0.11 [ -0.43, 0.65 ]
Van Vliet 2005 42 5.62 (4.02) 43 5.24 (4.3) 21.0 % 0.09 [ -0.34, 0.52 ]
Subtotal (95% CI) 96 101 47.5 % 0.24 [ -0.04, 0.52 ]
Heterogeneity: Chi2 = 2.45, df = 2 (P = 0.29); I2 =18%
Test for overall effect: Z = 1.67 (P = 0.095)
2 16 days to 6 months
Blennerhassett 2004b 15 404 (101) 15 288 (124) 6.5 % 1.00 [ 0.23, 1.76 ]
de S ze 2001 10 70.3 (24.2) 10 70.4 (21.7) 4.9 % 0.00 [ -0.88, 0.87 ]
Howe 2005 15 -3.3 (3.7) 15 -2.6 (1.2) 7.3 % -0.25 [ -0.97, 0.47 ]
McClellan 2004 12 21.9 (9.4) 9 17.8 (7.4) 4.9 % 0.46 [ -0.42, 1.33 ]
Subtotal (95% CI) 52 49 23.7 % 0.29 [ -0.11, 0.69 ]
Heterogeneity: Chi2 = 6.01, df = 3 (P = 0.11); I2 =50%
Test for overall effect: Z = 1.42 (P = 0.16)
3 More than 6 months
Dean 1997 10 33.8 (18.6) 8 29.4 (33.9) 4.4 % 0.16 [ -0.77, 1.09 ]
Dean 2000 5 84 (46.7) 4 81.5 (47.2) 2.2 % 0.05 [ -1.27, 1.36 ]
Salbach 2004a 44 249 (136) 47 209 (132) 22.2 % 0.30 [ -0.12, 0.71 ]
Subtotal (95% CI) 59 59 28.8 % 0.26 [ -0.11, 0.62 ]
Heterogeneity: Chi2 = 0.17, df = 2 (P = 0.92); I2 =0.0%
Test for overall effect: Z = 1.38 (P = 0.17)
Total (95% CI) 207 209 100.0 % 0.26 [ 0.06, 0.45 ]
Heterogeneity: Chi2 = 8.67, df = 9 (P = 0.47); I2 =0.0%
Test for overall effect: Z = 2.58 (P = 0.0098)
Test for subgroup differences: Chi2 = 0.04, df = 2 (P = 0.98), I2 =0.0%
-4 -2 0 2 4
Favours control Favours treatment
67Repetitive task training for improving functional ability after stroke (Review)
Copyright © 2014 The Cochrane Collaboration. Published by John Wiley & Sons, Ltd.

Analysis 6.3. Comparison 6 Lower limb function: subgroup analyses, Outcome 3 Type of intervention.
Review: Repetitive task training for improving functional ability after stroke
Comparison: 6 Lower limb function: subgroup analyses
Outcome: 3 Type of intervention
Study or subgroup Treatment Control
Std.Mean
Difference Weight
Std.Mean
Difference
N Mean(SD) N Mean(SD) IV,Fixed,95% CI IV,Fixed,95% CI
1 Whole therapy
Langhammer 2000 29 4 (1.6) 24 3.8 (2) 13.0 % 0.11 [ -0.43, 0.65 ]
Van Vliet 2005 42 5.62 (4.02) 43 5.24 (4.3) 21.0 % 0.09 [ -0.34, 0.52 ]
Subtotal (95% CI) 71 67 33.9 % 0.10 [ -0.24, 0.43 ]
Heterogeneity: Chi2 = 0.00, df = 1 (P = 0.96); I2 =0.0%
Test for overall effect: Z = 0.57 (P = 0.57)
2 Mixed training
Blennerhassett 2004b 15 404 (101) 15 288 (124) 6.5 % 1.00 [ 0.23, 1.76 ]
Dean 2000 5 84 (46.7) 4 81.5 (47.2) 2.2 % 0.05 [ -1.27, 1.36 ]
Kwakkel 1999a 25 4 (1) 34 3 (2) 13.6 % 0.60 [ 0.07, 1.12 ]
McClellan 2004 12 21.9 (9.4) 9 17.8 (7.4) 4.9 % 0.46 [ -0.42, 1.33 ]
Salbach 2004a 44 249 (136) 47 209 (132) 22.2 % 0.30 [ -0.12, 0.71 ]
Subtotal (95% CI) 101 109 49.4 % 0.48 [ 0.20, 0.75 ]
Heterogeneity: Chi2 = 3.12, df = 4 (P = 0.54); I2 =0.0%
Test for overall effect: Z = 3.36 (P = 0.00077)
3 Single task training
de S ze 2001 10 70.3 (24.2) 10 70.4 (21.7) 4.9 % 0.00 [ -0.88, 0.87 ]
Dean 1997 10 33.8 (18.6) 8 29.4 (33.9) 4.4 % 0.16 [ -0.77, 1.09 ]
Howe 2005 15 -3.3 (3.7) 15 -2.6 (1.2) 7.3 % -0.25 [ -0.97, 0.47 ]
Subtotal (95% CI) 35 33 16.7 % -0.07 [ -0.55, 0.41 ]
Heterogeneity: Chi2 = 0.49, df = 2 (P = 0.78); I2 =0.0%
Test for overall effect: Z = 0.28 (P = 0.78)
Total (95% CI) 207 209 100.0 % 0.26 [ 0.06, 0.45 ]
Heterogeneity: Chi2 = 8.67, df = 9 (P = 0.47); I2 =0.0%
Test for overall effect: Z = 2.58 (P = 0.0098)
Test for subgroup differences: Chi2 = 5.05, df = 2 (P = 0.08), I2 =60%
-4 -2 0 2 4
Favours control Favours treatment
68Repetitive task training for improving functional ability after stroke (Review)
Copyright © 2014 The Cochrane Collaboration. Published by John Wiley & Sons, Ltd.

Analysis 7.1. Comparison 7 Global motor function, Outcome 1 Global motor function scales.
Review: Repetitive task training for improving functional ability after stroke
Comparison: 7 Global motor function
Outcome: 1 Global motor function scales
Study or subgroup Treatment Control
Std.Mean
Difference Weight
Std.Mean
Difference
N Mean(SD) N Mean(SD) IV,Fixed,95% CI IV,Fixed,95% CI
Langhammer 2000 29 37 (12) 24 33 (15) 38.3 % 0.29 [ -0.25, 0.84 ]
Van Vliet 2005 42 7.85 (3.17) 43 6.69 (3.52) 61.7 % 0.34 [ -0.09, 0.77 ]
Total (95% CI) 71 67 100.0 % 0.32 [ -0.01, 0.66 ]
Heterogeneity: Chi2 = 0.02, df = 1 (P = 0.89); I2 =0.0%
Test for overall effect: Z = 1.89 (P = 0.059)
Test for subgroup differences: Not applicable
-4 -2 0 2 4
Favours control Favours treatment
69Repetitive task training for improving functional ability after stroke (Review)
Copyright © 2014 The Cochrane Collaboration. Published by John Wiley & Sons, Ltd.
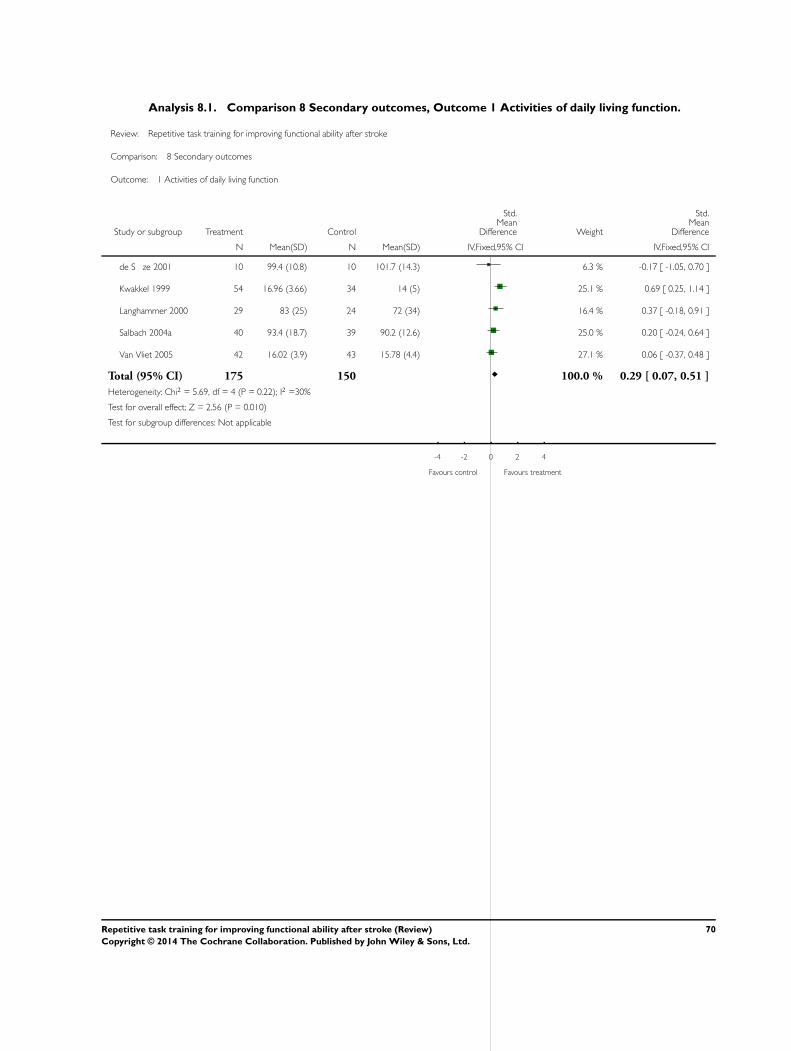
Analysis 8.1. Comparison 8 Secondary outcomes, Outcome 1 Activities of daily living function.
Review: Repetitive task training for improving functional ability after stroke
Comparison: 8 Secondary outcomes
Outcome: 1 Activities of daily living function
Study or subgroup Treatment Control
Std.Mean
Difference Weight
Std.Mean
Difference
N Mean(SD) N Mean(SD) IV,Fixed,95% CI IV,Fixed,95% CI
de S ze 2001 10 99.4 (10.8) 10 101.7 (14.3) 6.3 % -0.17 [ -1.05, 0.70 ]
Kwakkel 1999 54 16.96 (3.66) 34 14 (5) 25.1 % 0.69 [ 0.25, 1.14 ]
Langhammer 2000 29 83 (25) 24 72 (34) 16.4 % 0.37 [ -0.18, 0.91 ]
Salbach 2004a 40 93.4 (18.7) 39 90.2 (12.6) 25.0 % 0.20 [ -0.24, 0.64 ]
Van Vliet 2005 42 16.02 (3.9) 43 15.78 (4.4) 27.1 % 0.06 [ -0.37, 0.48 ]
Total (95% CI) 175 150 100.0 % 0.29 [ 0.07, 0.51 ]
Heterogeneity: Chi2 = 5.69, df = 4 (P = 0.22); I2 =30%
Test for overall effect: Z = 2.56 (P = 0.010)
Test for subgroup differences: Not applicable
-4 -2 0 2 4
Favours control Favours treatment
70Repetitive task training for improving functional ability after stroke (Review)
Copyright © 2014 The Cochrane Collaboration. Published by John Wiley & Sons, Ltd.
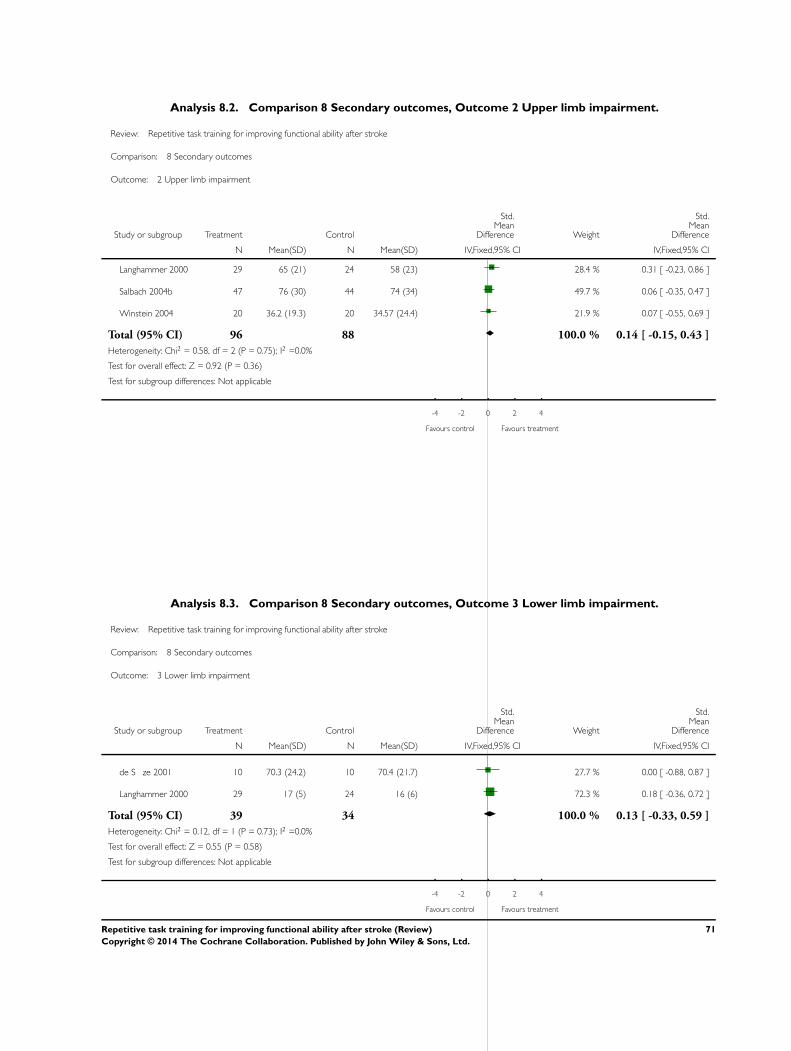
Analysis 8.2. Comparison 8 Secondary outcomes, Outcome 2 Upper limb impairment.
Review: Repetitive task training for improving functional ability after stroke
Comparison: 8 Secondary outcomes
Outcome: 2 Upper limb impairment
Study or subgroup Treatment Control
Std.Mean
Difference Weight
Std.Mean
Difference
N Mean(SD) N Mean(SD) IV,Fixed,95% CI IV,Fixed,95% CI
Langhammer 2000 29 65 (21) 24 58 (23) 28.4 % 0.31 [ -0.23, 0.86 ]
Salbach 2004b 47 76 (30) 44 74 (34) 49.7 % 0.06 [ -0.35, 0.47 ]
Winstein 2004 20 36.2 (19.3) 20 34.57 (24.4) 21.9 % 0.07 [ -0.55, 0.69 ]
Total (95% CI) 96 88 100.0 % 0.14 [ -0.15, 0.43 ]
Heterogeneity: Chi2 = 0.58, df = 2 (P = 0.75); I2 =0.0%
Test for overall effect: Z = 0.92 (P = 0.36)
Test for subgroup differences: Not applicable
-4 -2 0 2 4
Favours control Favours treatment
Analysis 8.3. Comparison 8 Secondary outcomes, Outcome 3 Lower limb impairment.
Review: Repetitive task training for improving functional ability after stroke
Comparison: 8 Secondary outcomes
Outcome: 3 Lower limb impairment
Study or subgroup Treatment Control
Std.Mean
Difference Weight
Std.Mean
Difference
N Mean(SD) N Mean(SD) IV,Fixed,95% CI IV,Fixed,95% CI
de S ze 2001 10 70.3 (24.2) 10 70.4 (21.7) 27.7 % 0.00 [ -0.88, 0.87 ]
Langhammer 2000 29 17 (5) 24 16 (6) 72.3 % 0.18 [ -0.36, 0.72 ]
Total (95% CI) 39 34 100.0 % 0.13 [ -0.33, 0.59 ]
Heterogeneity: Chi2 = 0.12, df = 1 (P = 0.73); I2 =0.0%
Test for overall effect: Z = 0.55 (P = 0.58)
Test for subgroup differences: Not applicable
-4 -2 0 2 4
Favours control Favours treatment
71Repetitive task training for improving functional ability after stroke (Review)
Copyright © 2014 The Cochrane Collaboration. Published by John Wiley & Sons, Ltd.

Analysis 8.4. Comparison 8 Secondary outcomes, Outcome 4 Quality of life/health status.
Review: Repetitive task training for improving functional ability after stroke
Comparison: 8 Secondary outcomes
Outcome: 4 Quality of life/health status
Study or subgroup Treatment Control
Std.Mean
Difference Weight
Std.Mean
Difference
N Mean(SD) N Mean(SD) IV,Fixed,95% CI IV,Fixed,95% CI
Barreca 2004 21 -17.76 (5.03) 19 -17.16 (4.34) 27.1 % -0.12 [ -0.75, 0.50 ]
Kwakkel 1999 29 -9.8 (8.1) 26 -11.6 (7.9) 37.1 % 0.22 [ -0.31, 0.75 ]
Langhammer 2000 29 -22 (18) 24 -24 (21) 35.7 % 0.10 [ -0.44, 0.64 ]
Total (95% CI) 79 69 100.0 % 0.08 [ -0.24, 0.41 ]
Heterogeneity: Chi2 = 0.70, df = 2 (P = 0.71); I2 =0.0%
Test for overall effect: Z = 0.51 (P = 0.61)
Test for subgroup differences: Not applicable
-4 -2 0 2 4
Favours control Favours treatment
72Repetitive task training for improving functional ability after stroke (Review)
Copyright © 2014 The Cochrane Collaboration. Published by John Wiley & Sons, Ltd.
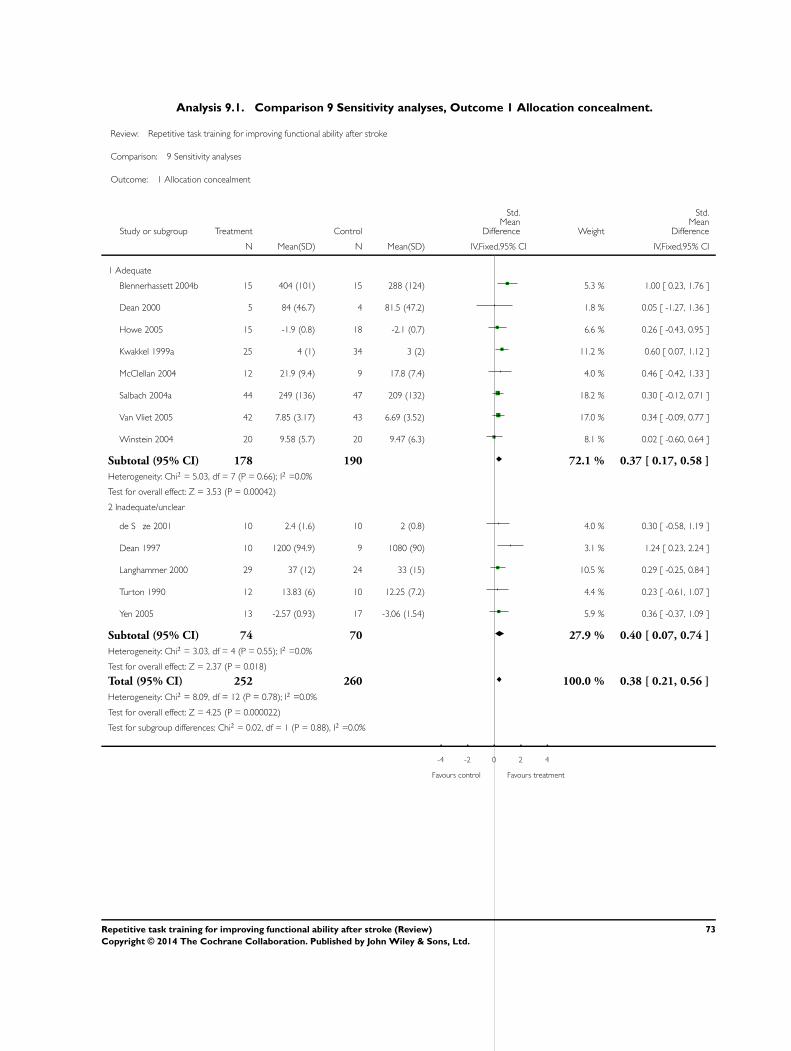
Analysis 9.1. Comparison 9 Sensitivity analyses, Outcome 1 Allocation concealment.
Review: Repetitive task training for improving functional ability after stroke
Comparison: 9 Sensitivity analyses
Outcome: 1 Allocation concealment
Study or subgroup Treatment Control
Std.Mean
Difference Weight
Std.Mean
Difference
N Mean(SD) N Mean(SD) IV,Fixed,95% CI IV,Fixed,95% CI
1 Adequate
Blennerhassett 2004b 15 404 (101) 15 288 (124) 5.3 % 1.00 [ 0.23, 1.76 ]
Dean 2000 5 84 (46.7) 4 81.5 (47.2) 1.8 % 0.05 [ -1.27, 1.36 ]
Howe 2005 15 -1.9 (0.8) 18 -2.1 (0.7) 6.6 % 0.26 [ -0.43, 0.95 ]
Kwakkel 1999a 25 4 (1) 34 3 (2) 11.2 % 0.60 [ 0.07, 1.12 ]
McClellan 2004 12 21.9 (9.4) 9 17.8 (7.4) 4.0 % 0.46 [ -0.42, 1.33 ]
Salbach 2004a 44 249 (136) 47 209 (132) 18.2 % 0.30 [ -0.12, 0.71 ]
Van Vliet 2005 42 7.85 (3.17) 43 6.69 (3.52) 17.0 % 0.34 [ -0.09, 0.77 ]
Winstein 2004 20 9.58 (5.7) 20 9.47 (6.3) 8.1 % 0.02 [ -0.60, 0.64 ]
Subtotal (95% CI) 178 190 72.1 % 0.37 [ 0.17, 0.58 ]
Heterogeneity: Chi2 = 5.03, df = 7 (P = 0.66); I2 =0.0%
Test for overall effect: Z = 3.53 (P = 0.00042)
2 Inadequate/unclear
de S ze 2001 10 2.4 (1.6) 10 2 (0.8) 4.0 % 0.30 [ -0.58, 1.19 ]
Dean 1997 10 1200 (94.9) 9 1080 (90) 3.1 % 1.24 [ 0.23, 2.24 ]
Langhammer 2000 29 37 (12) 24 33 (15) 10.5 % 0.29 [ -0.25, 0.84 ]
Turton 1990 12 13.83 (6) 10 12.25 (7.2) 4.4 % 0.23 [ -0.61, 1.07 ]
Yen 2005 13 -2.57 (0.93) 17 -3.06 (1.54) 5.9 % 0.36 [ -0.37, 1.09 ]
Subtotal (95% CI) 74 70 27.9 % 0.40 [ 0.07, 0.74 ]
Heterogeneity: Chi2 = 3.03, df = 4 (P = 0.55); I2 =0.0%
Test for overall effect: Z = 2.37 (P = 0.018)
Total (95% CI) 252 260 100.0 % 0.38 [ 0.21, 0.56 ]
Heterogeneity: Chi2 = 8.09, df = 12 (P = 0.78); I2 =0.0%
Test for overall effect: Z = 4.25 (P = 0.000022)
Test for subgroup differences: Chi2 = 0.02, df = 1 (P = 0.88), I2 =0.0%
-4 -2 0 2 4
Favours control Favours treatment
73Repetitive task training for improving functional ability after stroke (Review)
Copyright © 2014 The Cochrane Collaboration. Published by John Wiley & Sons, Ltd.
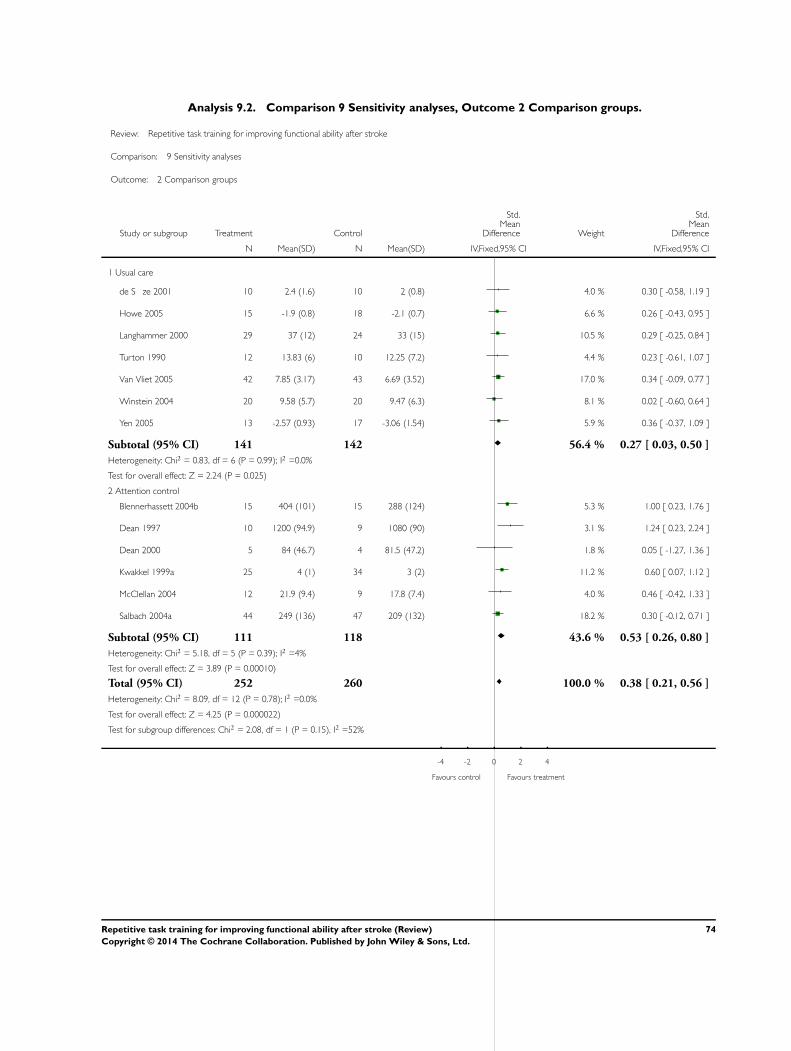
Analysis 9.2. Comparison 9 Sensitivity analyses, Outcome 2 Comparison groups.
Review: Repetitive task training for improving functional ability after stroke
Comparison: 9 Sensitivity analyses
Outcome: 2 Comparison groups
Study or subgroup Treatment Control
Std.Mean
Difference Weight
Std.Mean
Difference
N Mean(SD) N Mean(SD) IV,Fixed,95% CI IV,Fixed,95% CI
1 Usual care
de S ze 2001 10 2.4 (1.6) 10 2 (0.8) 4.0 % 0.30 [ -0.58, 1.19 ]
Howe 2005 15 -1.9 (0.8) 18 -2.1 (0.7) 6.6 % 0.26 [ -0.43, 0.95 ]
Langhammer 2000 29 37 (12) 24 33 (15) 10.5 % 0.29 [ -0.25, 0.84 ]
Turton 1990 12 13.83 (6) 10 12.25 (7.2) 4.4 % 0.23 [ -0.61, 1.07 ]
Van Vliet 2005 42 7.85 (3.17) 43 6.69 (3.52) 17.0 % 0.34 [ -0.09, 0.77 ]
Winstein 2004 20 9.58 (5.7) 20 9.47 (6.3) 8.1 % 0.02 [ -0.60, 0.64 ]
Yen 2005 13 -2.57 (0.93) 17 -3.06 (1.54) 5.9 % 0.36 [ -0.37, 1.09 ]
Subtotal (95% CI) 141 142 56.4 % 0.27 [ 0.03, 0.50 ]
Heterogeneity: Chi2 = 0.83, df = 6 (P = 0.99); I2 =0.0%
Test for overall effect: Z = 2.24 (P = 0.025)
2 Attention control
Blennerhassett 2004b 15 404 (101) 15 288 (124) 5.3 % 1.00 [ 0.23, 1.76 ]
Dean 1997 10 1200 (94.9) 9 1080 (90) 3.1 % 1.24 [ 0.23, 2.24 ]
Dean 2000 5 84 (46.7) 4 81.5 (47.2) 1.8 % 0.05 [ -1.27, 1.36 ]
Kwakkel 1999a 25 4 (1) 34 3 (2) 11.2 % 0.60 [ 0.07, 1.12 ]
McClellan 2004 12 21.9 (9.4) 9 17.8 (7.4) 4.0 % 0.46 [ -0.42, 1.33 ]
Salbach 2004a 44 249 (136) 47 209 (132) 18.2 % 0.30 [ -0.12, 0.71 ]
Subtotal (95% CI) 111 118 43.6 % 0.53 [ 0.26, 0.80 ]
Heterogeneity: Chi2 = 5.18, df = 5 (P = 0.39); I2 =4%
Test for overall effect: Z = 3.89 (P = 0.00010)
Total (95% CI) 252 260 100.0 % 0.38 [ 0.21, 0.56 ]
Heterogeneity: Chi2 = 8.09, df = 12 (P = 0.78); I2 =0.0%
Test for overall effect: Z = 4.25 (P = 0.000022)
Test for subgroup differences: Chi2 = 2.08, df = 1 (P = 0.15), I2 =52%
-4 -2 0 2 4
Favours control Favours treatment
74Repetitive task training for improving functional ability after stroke (Review)
Copyright © 2014 The Cochrane Collaboration. Published by John Wiley & Sons, Ltd.
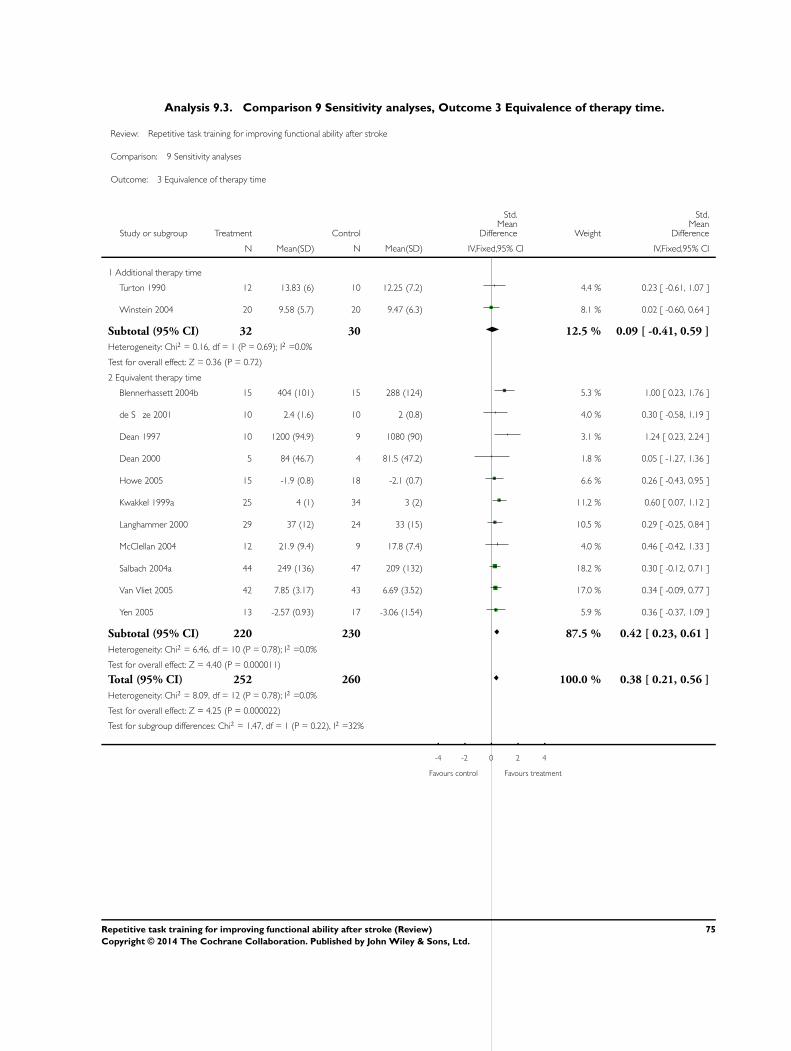
Analysis 9.3. Comparison 9 Sensitivity analyses, Outcome 3 Equivalence of therapy time.
Review: Repetitive task training for improving functional ability after stroke
Comparison: 9 Sensitivity analyses
Outcome: 3 Equivalence of therapy time
Study or subgroup Treatment Control
Std.Mean
Difference Weight
Std.Mean
Difference
N Mean(SD) N Mean(SD) IV,Fixed,95% CI IV,Fixed,95% CI
1 Additional therapy time
Turton 1990 12 13.83 (6) 10 12.25 (7.2) 4.4 % 0.23 [ -0.61, 1.07 ]
Winstein 2004 20 9.58 (5.7) 20 9.47 (6.3) 8.1 % 0.02 [ -0.60, 0.64 ]
Subtotal (95% CI) 32 30 12.5 % 0.09 [ -0.41, 0.59 ]
Heterogeneity: Chi2 = 0.16, df = 1 (P = 0.69); I2 =0.0%
Test for overall effect: Z = 0.36 (P = 0.72)
2 Equivalent therapy time
Blennerhassett 2004b 15 404 (101) 15 288 (124) 5.3 % 1.00 [ 0.23, 1.76 ]
de S ze 2001 10 2.4 (1.6) 10 2 (0.8) 4.0 % 0.30 [ -0.58, 1.19 ]
Dean 1997 10 1200 (94.9) 9 1080 (90) 3.1 % 1.24 [ 0.23, 2.24 ]
Dean 2000 5 84 (46.7) 4 81.5 (47.2) 1.8 % 0.05 [ -1.27, 1.36 ]
Howe 2005 15 -1.9 (0.8) 18 -2.1 (0.7) 6.6 % 0.26 [ -0.43, 0.95 ]
Kwakkel 1999a 25 4 (1) 34 3 (2) 11.2 % 0.60 [ 0.07, 1.12 ]
Langhammer 2000 29 37 (12) 24 33 (15) 10.5 % 0.29 [ -0.25, 0.84 ]
McClellan 2004 12 21.9 (9.4) 9 17.8 (7.4) 4.0 % 0.46 [ -0.42, 1.33 ]
Salbach 2004a 44 249 (136) 47 209 (132) 18.2 % 0.30 [ -0.12, 0.71 ]
Van Vliet 2005 42 7.85 (3.17) 43 6.69 (3.52) 17.0 % 0.34 [ -0.09, 0.77 ]
Yen 2005 13 -2.57 (0.93) 17 -3.06 (1.54) 5.9 % 0.36 [ -0.37, 1.09 ]
Subtotal (95% CI) 220 230 87.5 % 0.42 [ 0.23, 0.61 ]
Heterogeneity: Chi2 = 6.46, df = 10 (P = 0.78); I2 =0.0%
Test for overall effect: Z = 4.40 (P = 0.000011)
Total (95% CI) 252 260 100.0 % 0.38 [ 0.21, 0.56 ]
Heterogeneity: Chi2 = 8.09, df = 12 (P = 0.78); I2 =0.0%
Test for overall effect: Z = 4.25 (P = 0.000022)
Test for subgroup differences: Chi2 = 1.47, df = 1 (P = 0.22), I2 =32%
-4 -2 0 2 4
Favours control Favours treatment
75Repetitive task training for improving functional ability after stroke (Review)
Copyright © 2014 The Cochrane Collaboration. Published by John Wiley & Sons, Ltd.
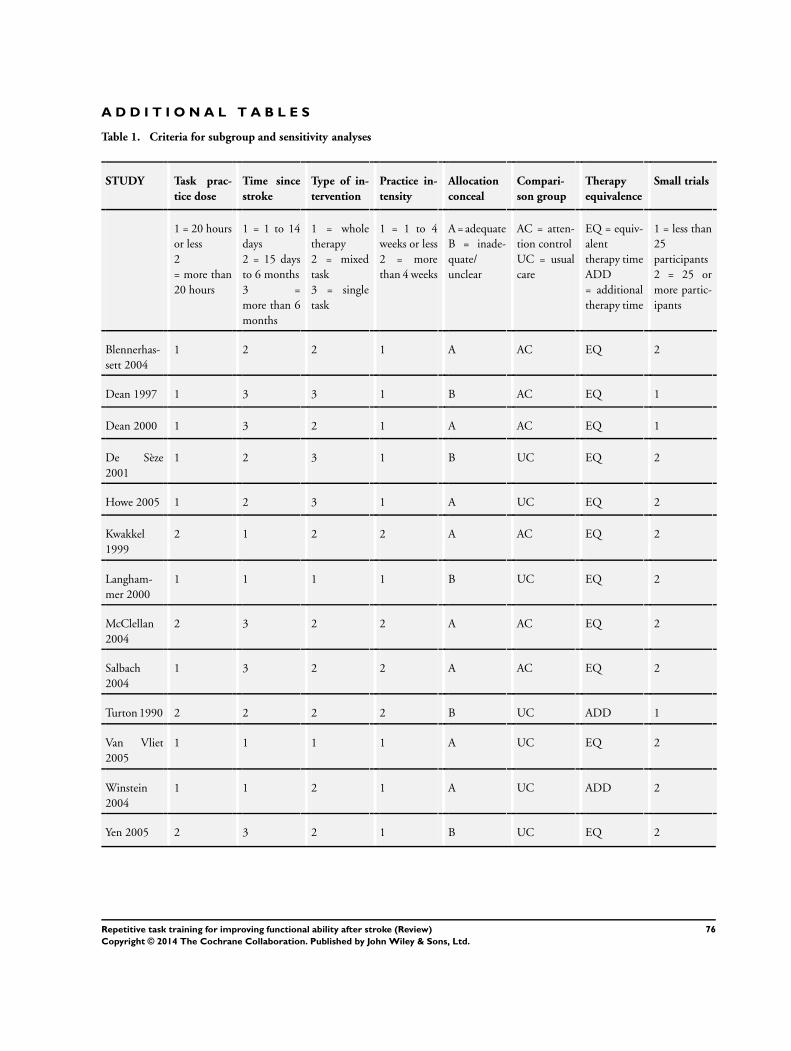
A D D I T I O N A L T A B L E S
Table 1. Criteria for subgroup and sensitivity analyses
STUDY Task prac-
tice dose
Time since
stroke
Type of in-
tervention
Practice in-
tensity
Allocation
conceal
Compari-
son group
Therapy
equivalence
Small trials
1 = 20 hours
or less
2
= more than
20 hours
1 = 1 to 14
days
2 = 15 days
to 6 months
3 =
more than 6
months
1 = whole
therapy
2 = mixed
task
3 = single
task
1 = 1 to 4
weeks or less
2 = more
than 4 weeks
A = adequate
B = inade-
quate/
unclear
AC = atten-
tion control
UC = usual
care
EQ = equiv-
alent
therapy time
ADD
= additional
therapy time
1 = less than
25
participants
2 = 25 or
more partic-
ipants
Blennerhas-
sett 2004
1 2 2 1 A AC EQ 2
Dean 1997 1 3 3 1 B AC EQ 1
Dean 2000 1 3 2 1 A AC EQ 1
De Sèze
2001
1 2 3 1 B UC EQ 2
Howe 2005 1 2 3 1 A UC EQ 2
Kwakkel
1999
2 1 2 2 A AC EQ 2
Langham-
mer 2000
1 1 1 1 B UC EQ 2
McClellan
2004
2 3 2 2 A AC EQ 2
Salbach
2004
1 3 2 2 A AC EQ 2
Turton 1990 2 2 2 2 B UC ADD 1
Van Vliet
2005
1 1 1 1 A UC EQ 2
Winstein
2004
1 1 2 1 A UC ADD 2
Yen 2005 2 3 2 1 B UC EQ 2
76Repetitive task training for improving functional ability after stroke (Review)
Copyright © 2014 The Cochrane Collaboration. Published by John Wiley & Sons, Ltd.
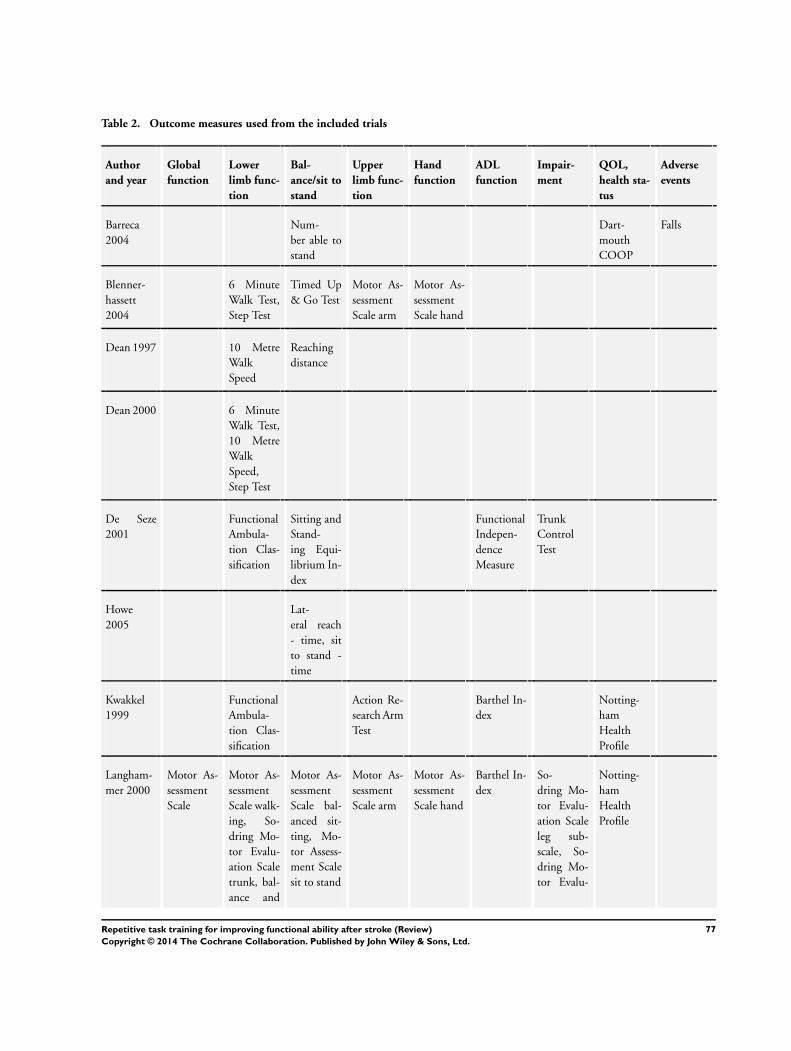
Table 2. Outcome measures used from the included trials
Author
and year
Global
function
Lower
limb func-
tion
Bal-
ance/sit to
stand
Upper
limb func-
tion
Hand
function
ADL
function
Impair-
ment
QOL,
health sta-
tus
Adverse
events
Barreca
2004
Num-
ber able to
stand
Dart-
mouth
COOP
Falls
Blenner-
hassett
2004
6 Minute
Walk Test,
Step Test
Timed Up
& Go Test
Motor As-
sessment
Scale arm
Motor As-
sessment
Scale hand
Dean 1997 10 Metre
Walk
Speed
Reaching
distance
Dean 2000 6 Minute
Walk Test,
10 Metre
Walk
Speed,
Step Test
De Seze
2001
Functional
Ambula-
tion Clas-
sification
Sitting and
Stand-
ing Equi-
librium In-
dex
Functional
Indepen-
dence
Measure
Trunk
Control
Test
Howe
2005
Lat-
eral reach
- time, sit
to stand -
time
Kwakkel
1999
Functional
Ambula-
tion Clas-
sification
Action Re-
search Arm
Test
Barthel In-
dex
Notting-
ham
Health
Profile
Langham-
mer 2000
Motor As-
sessment
Scale
Motor As-
sessment
Scale walk-
ing, So-
dring Mo-
tor Evalu-
ation Scale
trunk, bal-
ance and
Motor As-
sessment
Scale bal-
anced sit-
ting, Mo-
tor Assess-
ment Scale
sit to stand
Motor As-
sessment
Scale arm
Motor As-
sessment
Scale hand
Barthel In-
dex
So-
dring Mo-
tor Evalu-
ation Scale
leg sub-
scale, So-
dring Mo-
tor Evalu-
Notting-
ham
Health
Profile
77Repetitive task training for improving functional ability after stroke (Review)
Copyright © 2014 The Cochrane Collaboration. Published by John Wiley & Sons, Ltd.

Table 2. Outcome measures used from the included trials (Continued)
gait ation Scale
arm
subscale
McClellan
2004
Motor As-
sessment
Scale walk-
ing
Functional
Reach
Salbach
2004, Hig-
gins 2006
6 Minute
Walk
Test, 5 Me-
tre Walk
Speed
Timed Up
& Go Test,
Berg Bal-
ance
Box &
Block Test
9 Hole Peg
Test
Barthel In-
dex
Turton
1990
South-
ern Motor
Group As-
sessment -
upper ex-
tremity
10 Hole
Peg Test
Van Vliet
2005
Rivermead
Motor As-
sessment
Gross
Function
River-
mead Mo-
tor Assess-
ment leg
and trunk,
6 Minute
Walk Test,
Motor As-
sessment
Scale walk-
ing, River-
mead Mo-
tor Assess-
ment leg
and trunk
Motor As-
sessment
Scale bal-
anced sit-
ting, Mo-
tor Assess-
ment Scale
sit to stand
Motor As-
sessment
Scale arm
Motor As-
sessment
Scale hand
Barthel In-
dex
Winstein
2004
Functional
Test of the
Hemi-
paretic
Upper Ex-
tremity
Fugl
Meyer As-
sessment
Yen 2005 Wolf Mo-
tor Func-
tion Test
78Repetitive task training for improving functional ability after stroke (Review)
Copyright © 2014 The Cochrane Collaboration. Published by John Wiley & Sons, Ltd.
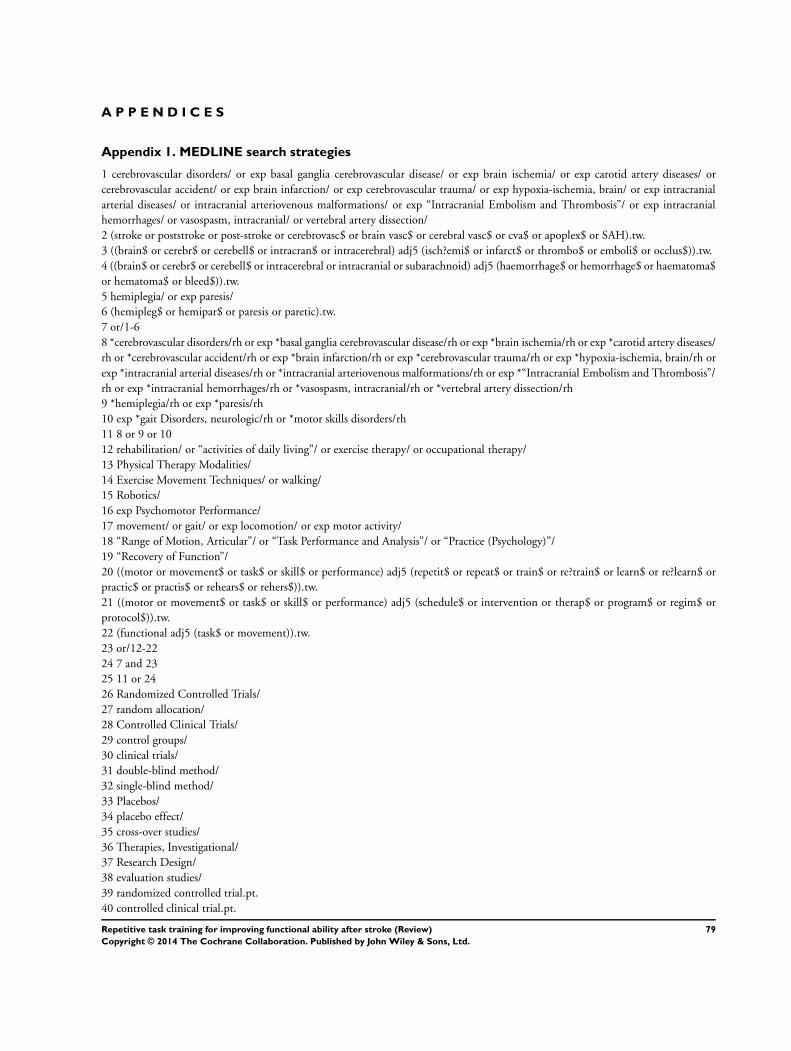
A P P E N D I C E S
Appendix 1. MEDLINE search strategies
1 cerebrovascular disorders/ or exp basal ganglia cerebrovascular disease/ or exp brain ischemia/ or exp carotid artery diseases/ or
cerebrovascular accident/ or exp brain infarction/ or exp cerebrovascular trauma/ or exp hypoxia-ischemia, brain/ or exp intracranial
arterial diseases/ or intracranial arteriovenous malformations/ or exp “Intracranial Embolism and Thrombosis”/ or exp intracranial
hemorrhages/ or vasospasm, intracranial/ or vertebral artery dissection/
2 (stroke or poststroke or post-stroke or cerebrovasc$ or brain vasc$ or cerebral vasc$ or cva$ or apoplex$ or SAH).tw.
3 ((brain$ or cerebr$ or cerebell$ or intracran$ or intracerebral) adj5 (isch?emi$ or infarct$ or thrombo$ or emboli$ or occlus$)).tw.
4 ((brain$ or cerebr$ or cerebell$ or intracerebral or intracranial or subarachnoid) adj5 (haemorrhage$ or hemorrhage$ or haematoma$
or hematoma$ or bleed$)).tw.
5 hemiplegia/ or exp paresis/
6 (hemipleg$ or hemipar$ or paresis or paretic).tw.
7 or/1-6
8 *cerebrovascular disorders/rh or exp *basal ganglia cerebrovascular disease/rh or exp *brain ischemia/rh or exp *carotid artery diseases/
rh or *cerebrovascular accident/rh or exp *brain infarction/rh or exp *cerebrovascular trauma/rh or exp *hypoxia-ischemia, brain/rh or
exp *intracranial arterial diseases/rh or *intracranial arteriovenous malformations/rh or exp *“Intracranial Embolism and Thrombosis”/
rh or exp *intracranial hemorrhages/rh or *vasospasm, intracranial/rh or *vertebral artery dissection/rh
9 *hemiplegia/rh or exp *paresis/rh
10 exp *gait Disorders, neurologic/rh or *motor skills disorders/rh
11 8 or 9 or 10
12 rehabilitation/ or “activities of daily living”/ or exercise therapy/ or occupational therapy/
13 Physical Therapy Modalities/
14 Exercise Movement Techniques/ or walking/
15 Robotics/
16 exp Psychomotor Performance/
17 movement/ or gait/ or exp locomotion/ or exp motor activity/
18 “Range of Motion, Articular”/ or “Task Performance and Analysis”/ or “Practice (Psychology)”/
19 “Recovery of Function”/
20 ((motor or movement$ or task$ or skill$ or performance) adj5 (repetit$ or repeat$ or train$ or re?train$ or learn$ or re?learn$ or
practic$ or practis$ or rehears$ or rehers$)).tw.
21 ((motor or movement$ or task$ or skill$ or performance) adj5 (schedule$ or intervention or therap$ or program$ or regim$ or
protocol$)).tw.
22 (functional adj5 (task$ or movement)).tw.
23 or/12-22
24 7 and 23
25 11 or 24
26 Randomized Controlled Trials/
27 random allocation/
28 Controlled Clinical Trials/
29 control groups/
30 clinical trials/
31 double-blind method/
32 single-blind method/
33 Placebos/
34 placebo effect/
35 cross-over studies/
36 Therapies, Investigational/
37 Research Design/
38 evaluation studies/
39 randomized controlled trial.pt.
40 controlled clinical trial.pt.
79Repetitive task training for improving functional ability after stroke (Review)
Copyright © 2014 The Cochrane Collaboration. Published by John Wiley & Sons, Ltd.
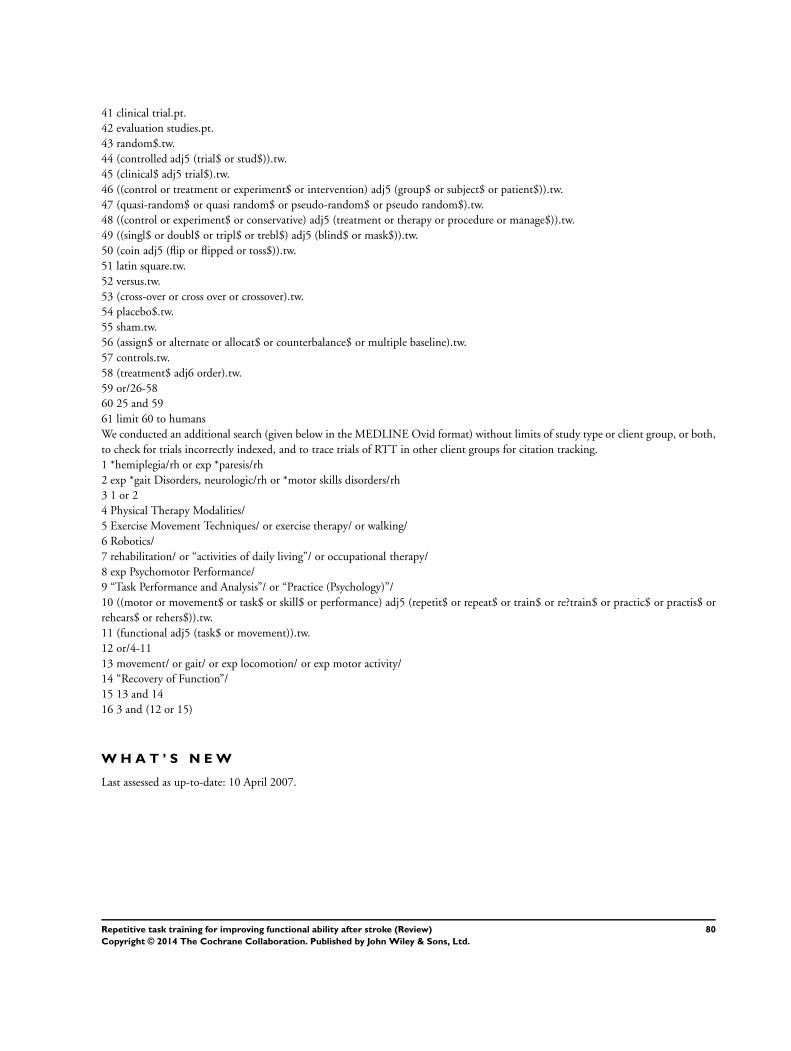
41 clinical trial.pt.
42 evaluation studies.pt.
43 random$.tw.
44 (controlled adj5 (trial$ or stud$)).tw.
45 (clinical$ adj5 trial$).tw.
46 ((control or treatment or experiment$ or intervention) adj5 (group$ or subject$ or patient$)).tw.
47 (quasi-random$ or quasi random$ or pseudo-random$ or pseudo random$).tw.
48 ((control or experiment$ or conservative) adj5 (treatment or therapy or procedure or manage$)).tw.
49 ((singl$ or doubl$ or tripl$ or trebl$) adj5 (blind$ or mask$)).tw.
50 (coin adj5 (flip or flipped or toss$)).tw.
51 latin square.tw.
52 versus.tw.
53 (cross-over or cross over or crossover).tw.
54 placebo$.tw.
55 sham.tw.
56 (assign$ or alternate or allocat$ or counterbalance$ or multiple baseline).tw.
57 controls.tw.
58 (treatment$ adj6 order).tw.
59 or/26-58
60 25 and 59
61 limit 60 to humans
We conducted an additional search (given below in the MEDLINE Ovid format) without limits of study type or client group, or both,
to check for trials incorrectly indexed, and to trace trials of RTT in other client groups for citation tracking.
1 *hemiplegia/rh or exp *paresis/rh
2 exp *gait Disorders, neurologic/rh or *motor skills disorders/rh
3 1 or 2
4 Physical Therapy Modalities/
5 Exercise Movement Techniques/ or exercise therapy/ or walking/
6 Robotics/
7 rehabilitation/ or “activities of daily living”/ or occupational therapy/
8 exp Psychomotor Performance/
9 “Task Performance and Analysis”/ or “Practice (Psychology)”/
10 ((motor or movement$ or task$ or skill$ or performance) adj5 (repetit$ or repeat$ or train$ or re?train$ or practic$ or practis$ or
rehears$ or rehers$)).tw.
11 (functional adj5 (task$ or movement)).tw.
12 or/4-11
13 movement/ or gait/ or exp locomotion/ or exp motor activity/
14 “Recovery of Function”/
15 13 and 14
16 3 and (12 or 15)
W H A T ’ S N E W
Last assessed as up-to-date: 10 April 2007.
80Repetitive task training for improving functional ability after stroke (Review)
Copyright © 2014 The Cochrane Collaboration. Published by John Wiley & Sons, Ltd.

Date Event Description
1 October 2008 Amended Converted to new review format.
C O N T R I B U T I O N S O F A U T H O R S
Beverley French co-ordinated the review process and managed searching and main data input. Beverley French, Lois Thomas, Michael
Leathley, and Joanna McAdam undertook data filtration, extraction, appraisal and analysis. Joanna McAdam was responsible for the
administration of the review process. Chris Sutton provided statistical expertise. Peter Langhorne, Christopher Price, Anne Forster,
Caroline Watkins and Andrew Walker directed the review focus and quality, and undertook critical reading of outputs.
D E C L A R A T I O N S O F I N T E R E S T
The NHS Health Technology Assessment programme is funding this review as part of a wider study, but this is not envisaged to be a
conflict of interest. There are no other conflicts of interest.
S O U R C E S O F S U P P O R T
Internal sources
• No sources of support supplied
External sources
• Department of Health Research and Development Health Technology Assessment Programme, UK.
I N D E X T E R M S
Medical Subject Headings (MeSH)
∗Activities of Daily Living; ∗Physical Therapy Modalities; ∗Recovery of Function; Extremities; Motor Activity; Randomized Controlled
Trials as Topic; Stroke [∗rehabilitation]; Task Performance and Analysis; Walking
MeSH check words
Humans
81Repetitive task training for improving functional ability after stroke (Review)
Copyright © 2014 The Cochrane Collaboration. Published by John Wiley & Sons, Ltd.