Embed Size (px)
Citation preview

U.S. Department Of Transportation National Highway Traffic Safety Administration
Final Regulatory Impact Analysis
Replacement Tire
Consumer Information Program Part 575.106
Office of Regulatory Analysis and Evaluation National Center for Statistics and Analysis
March 2010
People Saving People

Table of Contents
EXECUTIVE SUMMARY .................................................................................................1 I. INTRODUCTION ...............................................................................................................4
A. Energy Independence Security Act (EISA) of 2007 mandated tire consumer information program ......................................................................................................4
B. Final Rule .......................................................................................................................7
II. BACKGROUND .................................................................................................................9
A. RRF vs. RRC and Harmonization with Europe and California .....................................9 B. Tradeoffs of Safety, Traction and Treadwear .............................................................11
III. TEST RESULTS ................................................................................................................16
A. Test Procedure .............................................................................................................16 B. NHTSA Phase I Research ............................................................................................23 C. NHTSA Phase II Research...........................................................................................39
IV. ALTERNATIVES..............................................................................................................56 RRF vs. RRC .....................................................................................................................56 ................................................................................................................................................
V. BENEFITS .........................................................................................................................80 Sensitivity Analysis .........................................................................................................106 VI. COST ..............................................................................................................................110
A. Public Comment Concerning Costs ...........................................................................110 B. Cost Estimates for the Final Rule ..............................................................................115 C. Leadtime ....................................................................................................................118
VII. COST BENEFIT ANALYSES .......................................................................................120 VIII. REGULATORY FLEXIBILITY ACT AND UNFUNDED MANDATES
REFORM ACT ANALYSIS ..........................................................................................127
1
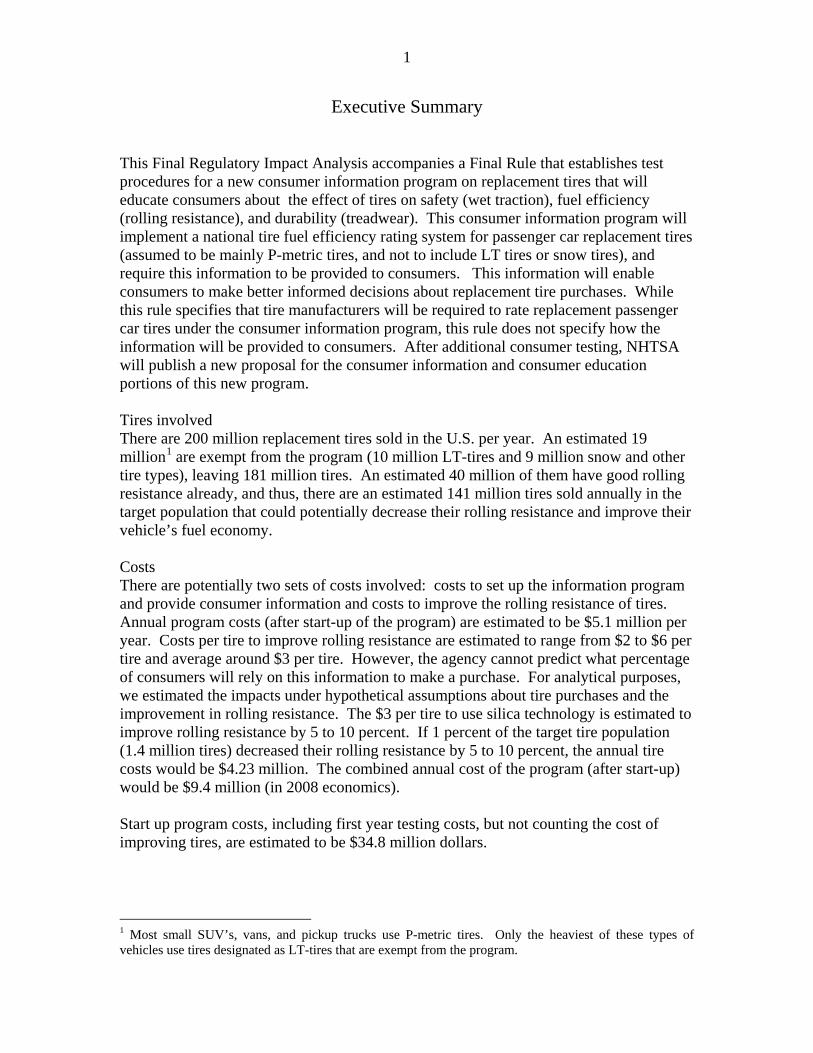
Executive Summary This Final Regulatory Impact Analysis accompanies a Final Rule that establishes test procedures for a new consumer information program on replacement tires that will educate consumers about the effect of tires on safety (wet traction), fuel efficiency (rolling resistance), and durability (treadwear). This consumer information program will implement a national tire fuel efficiency rating system for passenger car replacement tires (assumed to be mainly P-metric tires, and not to include LT tires or snow tires), and require this information to be provided to consumers. This information will enable consumers to make better informed decisions about replacement tire purchases. While this rule specifies that tire manufacturers will be required to rate replacement passenger car tires under the consumer information program, this rule does not specify how the information will be provided to consumers. After additional consumer testing, NHTSA will publish a new proposal for the consumer information and consumer education portions of this new program. Tires involved There are 200 million replacement tires sold in the U.S. per year. An estimated 19 million1
are exempt from the program (10 million LT-tires and 9 million snow and other tire types), leaving 181 million tires. An estimated 40 million of them have good rolling resistance already, and thus, there are an estimated 141 million tires sold annually in the target population that could potentially decrease their rolling resistance and improve their vehicle’s fuel economy.
Costs There are potentially two sets of costs involved: costs to set up the information program and provide consumer information and costs to improve the rolling resistance of tires. Annual program costs (after start-up of the program) are estimated to be $5.1 million per year. Costs per tire to improve rolling resistance are estimated to range from $2 to $6 per tire and average around $3 per tire. However, the agency cannot predict what percentage of consumers will rely on this information to make a purchase. For analytical purposes, we estimated the impacts under hypothetical assumptions about tire purchases and the improvement in rolling resistance. The $3 per tire to use silica technology is estimated to improve rolling resistance by 5 to 10 percent. If 1 percent of the target tire population (1.4 million tires) decreased their rolling resistance by 5 to 10 percent, the annual tire costs would be $4.23 million. The combined annual cost of the program (after start-up) would be $9.4 million (in 2008 economics). Start up program costs, including first year testing costs, but not counting the cost of improving tires, are estimated to be $34.8 million dollars.
1 Most small SUV’s, vans, and pickup trucks use P-metric tires. Only the heaviest of these types of vehicles use tires designated as LT-tires that are exempt from the program.
2
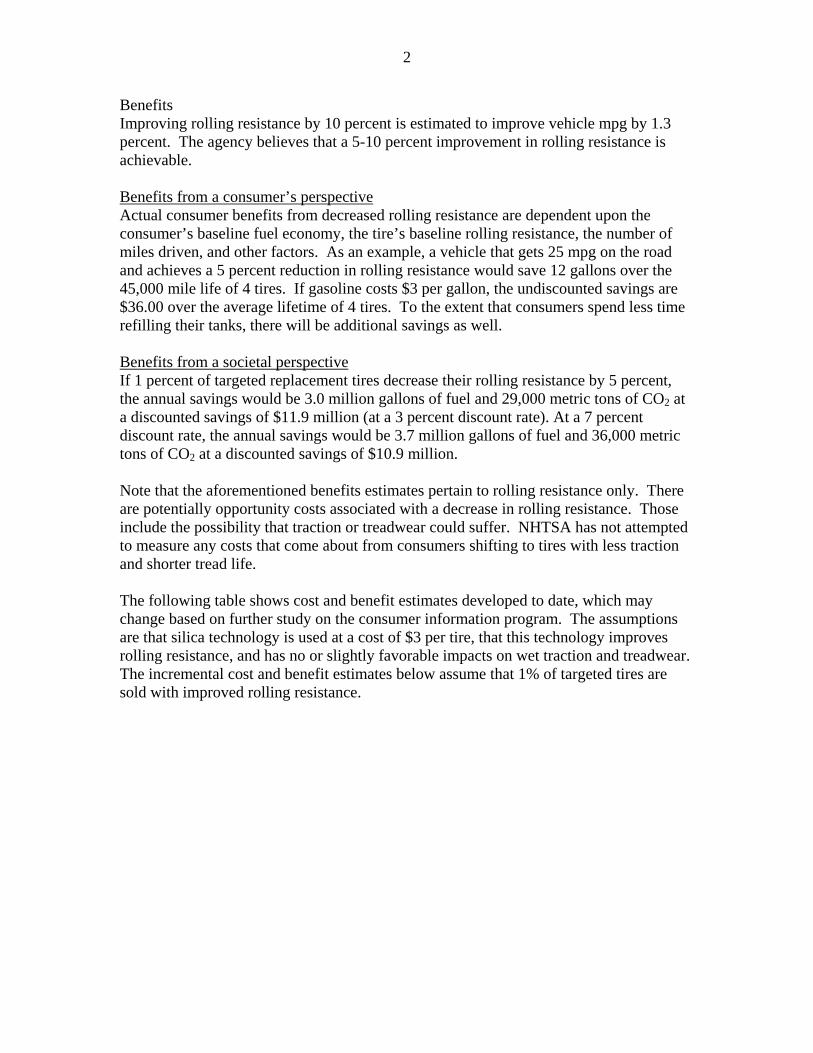
Benefits Improving rolling resistance by 10 percent is estimated to improve vehicle mpg by 1.3 percent. The agency believes that a 5-10 percent improvement in rolling resistance is achievable.
Actual consumer benefits from decreased rolling resistance are dependent upon the consumer’s baseline fuel economy, the tire’s baseline rolling resistance, the number of miles driven, and other factors. As an example, a vehicle that gets 25 mpg on the road and achieves a 5 percent reduction in rolling resistance would save 12 gallons over the 45,000 mile life of 4 tires. If gasoline costs $3 per gallon, the undiscounted savings are $36.00 over the average lifetime of 4 tires. To the extent that consumers spend less time refilling their tanks, there will be additional savings as well.
Benefits from a consumer’s perspective
If 1 percent of targeted replacement tires decrease their rolling resistance by 5 percent, the annual savings would be 3.0 million gallons of fuel and 29,000 metric tons of CO2 at a discounted savings of $11.9 million (at a 3 percent discount rate). At a 7 percent discount rate, the annual savings would be 3.7 million gallons of fuel and 36,000 metric tons of CO2 at a discounted savings of $10.9 million.
Benefits from a societal perspective
Note that the aforementioned benefits estimates pertain to rolling resistance only. There are potentially opportunity costs associated with a decrease in rolling resistance. Those include the possibility that traction or treadwear could suffer. NHTSA has not attempted to measure any costs that come about from consumers shifting to tires with less traction and shorter tread life. The following table shows cost and benefit estimates developed to date, which may change based on further study on the consumer information program. The assumptions are that silica technology is used at a cost of $3 per tire, that this technology improves rolling resistance, and has no or slightly favorable impacts on wet traction and treadwear. The incremental cost and benefit estimates below assume that 1% of targeted tires are sold with improved rolling resistance.

3
Total Costs and Benefits Estimates (in millions of dollars) Average Annual Benefits and Costs over 2013-2050 Span
Assuming 1% of replacement tires are sold with improved rolling resistance
Rolling Resistance
Improvement 5%
Rolling Resistance
Improvement 10%
Rolling Resistance
Improvement 5%
Rolling Resistance
Improvement 10%
Discount Rate 3% 3% 7% 7% Costs $9.4 $9.4 $9.4 $9.4 Benefits $11.6 $23.2 $10.6 $21.2 Net Benefits (Costs)
$2.2 $13.8 $1.2 $11.8
4
I. INTRODUCTION Tire characteristics influence the safety, fuel efficiency, and durability of motor vehicle transportation. Consumers have an inherent interest in all of these factors, but the ratings and relative importance of these characteristics are often overlooked or difficult for consumers to understand. The agency believes that an improved system of consumer information could enable consumers to make more informed choices than the marketplace currently provides. A. Energy Independence and Security Act (EISA) of 2007 mandated consumer tire information program The Motor Vehicle Information and Cost Savings Act, which was enacted in 1972, mandated a federal program to provide consumers with accurate information about the comparative safety and damageability of passenger cars. EISA added a section which gives authority to the Department of Transportation (DOT) to establish a new consumer tire information program to educate consumers about the effect of tires on automobile safety, fuel efficiency, and durability. We have summarized below the requirements of the consumer tire information program enacted as Section 111 by EISA.
1. Tires subject to the consumer information program The national tire fuel efficiency consumer information program mandated by EISA is applicable “only to replacement tires”. Section 575.104 of title 49 CFR is the federal regulation that requires motor vehicle and tire manufacturers and tire brand name owners to provide information indicating the relative performance of passenger car tires in the areas of treadwear, traction, and temperature resistance. This section of NHTSA’s regulations specifies the test procedures to determine uniform tire quality grading standards (UTQGS), and mandates that these standards be molded onto tire sidewalls. Title 49 CFR, section 575.104 applies only to “new pneumatic tires for use on passenger cars … [but] … does not apply to deep tread, winter-type snow tires, space-saver or temporary use spare tires, tires with nominal rim diameters of 12 inches or less, or to limited production.” Accordingly, the tire fuel efficiency consumer information program applies only to replacement passenger car tires2
. NHTSA is maintaining the exclusions in the UTQGS applicability provision.
2. Mandate to create a national tire fuel efficiency rating system In the Consolidated Appropriations Act of 2004,3
2 Passenger car tire means a tire intended for use on passenger cars, multipurpose passenger vehicles, and trucks that have a gross vehicle weight rating (GVWR) of 10,000 pounds or less, and excludes LT tires (LT tires are typical intended for use on light trucks designed to carry heavier loads).
Congress provided funding through the USDOT/NHTSA to the National Academy of Sciences (NAS) to develop and perform a
3 H.R. Rep. No. 108-401, at 971 (Nov. 25, 2003) (Conf. Rep.).

5
national tire fuel efficiency study and literature review.4
The NAS was to assess the feasibility of reducing rolling resistance in replacement tires and the effects of doing so on vehicle fuel consumption, tire wear life and scrap tire generation, and tire operating performance as it relates to motor vehicle safety. Congress asked that the assessment include estimates of the effects of reductions in rolling resistance on consumer spending on fuel and tire replacement.
In April 2006, the Transportation Research Board and the Board on Energy and Environmental Systems, part of the National Academies’ Division on Engineering and Physical Sciences released Special Report 286, Tires and Passenger Vehicle Fuel Economy: Informing Consumers and Improving Performance (2006 NAS Report).5 The 2006 NAS Report concluded that reduction of average rolling resistance of replacement tires by 10 percent was technically and economically feasible, and that such a reduction would increase the fuel economy of passenger vehicles by 1 to 2 percent, saving about 1 to 2 billion gallons of fuel per year nationwide.6
EISA requires NHTSA to “promulgate rules establishing a national tire fuel efficiency consumer information program for replacement tires designed for use on motor vehicles to educate consumers about the effect of tires on automobile fuel efficiency, safety, and durability. EISA specifies that the regulations establishing the program are to be promulgated not later than December 19, 2009.7
Section 111 of EISA specifically mandates “a national tire fuel efficiency rating system for motor vehicle replacement tires to assist consumers in making more educated tire purchasing decisions.” However, NHTSA may “not require permanent labeling of any kind on a tire for the purpose of tire fuel efficiency information.” The only Committee Report commenting on the legislation that eventually became Section 111 of EISA explained that need for this program was established by the 2006 NAS Report, which concluded that if consumers were sufficiently informed and interested, they could bring about a reduction in average rolling resistance (and thus an increase in average on-road fuel economy) by adjusting their tire purchases and by taking proper care of their tires once in service.8
4 Ultimately the task was given to the Committee for the National Tire Efficiency Study of the Transportation Research Board, a division of the National Research Council that is jointly administered by the National Academy of Sciences, the National Academy of Engineering, and the Institute of Medicine. 5 Transportation Research Board Special Report 286, Tires and Passenger Vehicle Fuel Economy, National Research Council of the National Academies (2006). A copy of this report is in docket No. NHTSA-2008-0121-0008. 6 Id. at 2-3. 7 Former President Bush signed EISA into law on December 19, 2007. EISA specifies that “[n]ot later than 24 months after the date of enactment … [NHTSA] shall, after notice and opportunity for comment, promulgate rules establishing a national tire fuel efficiency consumer information program for replacement tires designed for use on motor vehicles to educate consumers about the effect of tires on automobile fuel efficiency, safety, and durability.” 49 U.S.C. § 32304A(a)(1). 8 H.R. Rep. No. 109-537, at 3 (2006).

6
The 2006 NAS Report concluded that rolling resistance measurement of new tires can be informative to consumers, especially if they are accompanied by reliable information on other tire characteristics such as wear resistance and traction.9 The 2006 NAS Report further stated that consumers benefit from the ready availability of easy-to-understand information on all major attributes of their purchases, and that tires are no exception. Tires influence on vehicle fuel is an attribute that is likely to be of interest to many tire buyers.10
3. Communicating information to consumers EISA specifies that this rulemaking to establish a national tire fuel efficiency consumer information program must include “requirements for providing information to consumers, including information at the point of sale and other potential information dissemination methods, including the Internet.” NHTSA believes that the suggestion of point of sale requirements indicates that Congress intended NHTSA’s authority to establish information dissemination requirements to be broad enough to include requirements of both tire manufacturers and tire dealers/retailers and distributors.
4. Specification of test methods Section 111 of EISA also mandates that this rulemaking to establish a national tire fuel efficiency consumer information program include “specifications for test methods for manufacturers to use in assessing and rating tires to avoid variation among test equipment and manufacturers.” After publication of the 2006 NAS Report and in anticipation of Congressional legislation based off its recommendations, NHTSA embarked on a large-scale research project in July 2006 to evaluate existing tire rolling resistance test methods and to examine correlations between tire rolling resistance levels and tire safety performance.11
5. Creating a national consumer education program on tire maintenance Section 111 of EISA further directs NHTSA to establish in this rulemaking “a national tire maintenance consumer education program including, information on tire inflation pressure, alignment, rotation, and treadwear to maximize fuel efficiency, safety, and
9 2006 NAS Report, supra note 10, at 4. The 2006 NAS Report specifically noted that “[i]deally, consumers would have access to information that reflects a tire’s effect on fuel economy averaged over its anticipated lifetime of use, as opposed to a measurement taken during a single point in the tire’s lifetime, usually when it is new.” Id. However, “[n]o standard measure of lifetime tire energy consumption is currently available, and the development of one deserves consideration. Until such a practical measure is developed, rolling resistance measurements of new tires can be informative to consumers…” Id. 10 2006 NAS Report, supra note 10, at 4. 11 See DOT HS 811 119, NHTSA Tire Rolling Resistance Rating System Test Development Project: Phase 1 – Evaluation of Laboratory Test Protocols (June, 2009), docket entry NHTSA-2008-0121-0019.
7
durability.” NHTSA already has some information regarding tire maintenance on its safercar.gov website.12
B. Final Rule The final rule contains test procedures for the wet traction tests, rolling resistance test and treadwear test. While this rule specifies that there will be a consumer information program, this rule does not specify the content of the consumer information program. After additional consumer testing, NHTSA will re-propose a consumer information program in a supplemental notice of proposed rulemaking. 1. Test procedures The final rule requires tire manufacturers to rate the fuel efficiency of their tires using a test procedure developed by the International Organization for Standardization (ISO), ISO 28580:2009(E).13
As for the safety and durability ratings, due to the statutory timeline within which this rulemaking must be completed, NHTSA is specifying to use the test procedures that are already specified under another tire rating system, the uniform tire quality grading standards (UTQGS).14 For the traction test, because we are requiring the collection of slightly different data than under the UTQGS traction test method, a one-time modification in the software used in the test equipment may be necessary. The agency will continue to examine other metrics for safety and durability.15
2. Rolling resistance score metric The NPRM proposed to base a tire’s fuel efficiency rating on rolling resistance force (RRF) as measured by the ISO 28580 test procedure. This is in contrast to basing a fuel efficiency rating on rolling resistance coefficient (RRC), or RRF divided by test load. The proposed European tire fuel efficiency rating system specifies tire ratings based on RRC. NHTSA proposed to base the rolling resistance rating on the RRF metric because such a rating translates more directly to the fuel required to move a tire, and based on the goals of EISA, appears to be a more appropriate metric. Based on the large number of comments received on this issue, and to retain flexibility to use what the agency learns about consumer comprehension from the future consumer 12 See generally http://www.safercar.gov/portal/site/safercar/menuitem.13dd5c887c7e1358fefe0a2f35a67789/?vgnextoid=0e0aaa8c16e35110VgnVCM1000002fd17898RCRD. 13 Reference number ISO 28580:2009(E), International Standard, First Edition 2009-07-01, “Passenger car, truck and bus tyres -- Methods of measuring rolling resistance -- Single point test and correlation of measurement results.” 14 See 49 CFR § 575.104 (2008). 15 NHTSA’s Phase 2 research tested 15 models of replacement tires, as well as the original equipment tires on a fuel economy test vehicle, to examine possible correlations between tire rolling resistance levels and vehicle fuel economy as measured on a dynamometer, wet and dry traction, and indoor and outdoor treadwear. See DOT HS 811 154, National Highway Traffic Safety Administration, NHTSA Tire Rolling Resistance Rating System Test Development Project: Phase 2 – Effects of Tire Rolling Resistance Levels on Traction, Treadwear, and Vehicle Fuel Economy (August 2009), docket entry NHTSA-2008-0121-0035.

8
research, NHTSA will defer a decision on which rolling resistance metric should be used for the fuel efficiency rating and consider that matter further in the future supplemental NPRM and final rule that will finalize the consumer information and education portions of the program. 3. Information dissemination and reporting requirements for tire manufacturers and tire retailers The final rule requires information dissemination from both tire manufacturers and tire retailers. Tire manufacturers are required to report the three ratings to the agency. This is necessary for both enforcement of the rating system, and for development of the consumer information program.
4. Consumer education program NHTSA will implement a consumer education program to inform consumers about the effect of tires and tire maintenance on vehicle fuel economy, safety, and durability. Motorists must be alerted to the fact that even small losses in inflation pressure can greatly reduce tire service life, fuel efficiency, safety, and operating performance.16
Some of NHTSA’s ideas for consumer education include informational posters, brochures, or a fact sheet that tire dealers must display at the point of sale or to be used by NHTSA at trade show exhibits. NHTSA is considering developing a centralized and expansive government website on tires containing a database of all tire rating information.
16 When a tire is under-inflated, the shape of its footprint and the pressure it exerts on the road surface are both altered. One consequence of this alteration can be a reduction in the tire's ability to transmit (or generate) braking force to the road surface. Thus, under-inflated tires may increase a vehicle's stopping distance on wet surfaces. 66 FR 38982, 38986 (July 26, 2001). Under-inflated tires also increase the rolling resistance of vehicles and, correspondingly, decrease their fuel economy. Id.

9
II. BACKGROUND A. RRF vs. RRC and Harmonization with Europe Rolling Resistance Force (RRF) vs. Rolling Resistance Coefficient (RRC) The agency is requiring tire manufacturers to rate the fuel efficiency of their tires by measuring rolling resistance. All of the current test procedures result in a measurement of Rolling Resistance Force (RRF) in pounds or kilograms of resistance, or the equivalent force at the axle in the direction of travel required to make a loaded tire roll. Rolling resistance can also be expressed as Rolling Resistance Coefficient (RRC), which is calculated by dividing the measured RRF by the tire size’s prescribed load during the test. The pending European rating system uses RRC as the metric for a rolling resistance rating/score. It has been offered that the European decision makers were never presented with RRF data by the tire industry during development of their system, only RRC, and therefore never compared the two metrics17
. Therefore, the agency was unable to compare its rationales for choosing RRF vis-à-vis EU decisions.
However, based on the large number of comments received on this issue, and to retain flexibility to use what the agency learns about consumer comprehension from the future consumer research, NHTSA will defer a decision on which rolling resistance metric should be used for the fuel efficiency rating and consider that matter further in the future supplemental NPRM and final rule that will finalize the consumer information and education portions of the program.
Europe is approaching the issue of tire fuel efficiency from two directions. There is currently a proposal before the European Parliament concerning type-approval requirements for the general safety of motor vehicles.
European Union
18
One of the new requirements in this proposal would gradually prohibit tires with a rolling resistance coefficient (RRC) above certain levels beginning in October 2012.
17 15 MR. TUVELL: No, I know that. And let 16 me just mention one thing on that regard. I've 17 been in contact with the Europeans. And I asked 18 them specifically, did you have before you both 19 RRC data and RRF data when you made that decision. 20 And they -- analysis. 21 I talked to the analytical people who 22 worked on it. And the answer they told me was 23 absolutely not. The only thing we had before us 24 was RRC. We're not familiar at all with this 25 potential issue of RRC versus RRF. MR. CANDIDO: And the reason is that the 2 industry historically has worked with RRC. http://energy.ca.gov/transportation/tire_efficiency/documents/2009-02-05_workshop/2009-02-05_TRANSCRIPT.PDF 18 http://ec.europa.eu/enterprise/automotive/safety/new_package.htm

10
Another proposal before the European Parliament would require replacement tires to be rated for rolling resistance, wet grip and noise.19 The rolling resistance rating is determined using the same test procedure as the type-approval directive, International Organization for Standardization (ISO) Standard No. 28580, Passenger car, truck and bus tires – Methods of measuring rolling resistance – Single point test and correlation of measurement results.20 The ratings must be provided to consumers in a label on the tire, and also in technical promotional literature. The label design is the same A to G scale as that used to rate the energy efficiency of household appliances in Europe.21
In 2001, California Senate Bill 1170 authorized the California Energy Commission (CEC) to conduct a study to investigate opportunities for increasing usage of low rolling resistance tires in California.
California
22 The study concluded that there was a potential for substantial vehicle fuel savings from an increase in the use of properly inflated, low rolling resistance tires. As a result of this study, in October 2003, the California state legislature adopted Assembly Bill No. 844 (AB 844),23 which required the CEC to develop a comprehensive fuel efficient tire program.24
The program would consist of three phases. In the first phase, the CEC will develop a database with information on the fuel efficiency of replacement tires sold in California, develop a rating system for the energy efficiency of replacement tires, and develop a manufacturer reporting requirement for the energy efficiency of replacement tires.25 In the second phase, the CEC will consider standards for replacement tires to ensure that replacement tires sold in the state are at least as energy efficient, on average, as original equipment tires.26
• is technically feasible and cost effective;
In deciding whether to adopt standards, the CEC must ensure that a standard:
• does not adversely affect tire safety; • does not adversely affect the average life of replacement tires; and • does not adversely affect the state effort to manage scrap tires.27
19 See http://www.europarl.europa.eu/oeil/FindByProcnum.do?lang=2&procnum=COD/2008/0221 (last visited Feb. 3, 2009) 20 See http://www.iso.org/iso/iso_catalogue/catalogue_tc/catalogue_detail.htm?csnumber=44770 (last visited Feb. 3, 2009). 21 See Council Directive 1992/75/EEC, 1992 O.J. (L 297) 16-19 (on the indication by labeling and standard product information of the consumption of energy and other resources by household appliances). 22 See Cal. Pub. Res. Code §§ 25000.5, 25722-25723 (2009); 2001 Cal. Legis. Serv. Ch. 912 (S.B. 1170) (West). 23 See Cal. Pub Res. Code §§ 25770-25773; 2003 Cal. Legis. Serv. Ch. 645 (A.B. 844) (West). 24 Specifically, AB 844 required the State Energy Resources Conservation Board “to adopt, on or before July 1, 2007, and implement, no later than July 1, 2008, a replacement tire fuel efficiency program of statewide applicability for replacement tires for passenger cars and light-duty trucks, that is designed to ensure that replacement tires sold in the state are at least as energy efficient, on average, as the tires sold in the state as original equipment on those vehicles.” Cal. Pub. Res. Code § 25772. 25 See id. at § 25771. 26 See id. at § 25772. 27 See id. at § 25773.

11
If standards are adopted, the CEC will also develop consumer information requirements for replacement tires for which standards apply. In the third phase, the CEC must review and revise the program at least every three years. B. Tradeoffs of Safety, Traction and Treadwear Tire design involves the selection of several performance factors, each of which affects the others. Tire manufacturers plot these factors: Wet Traction; Dry Traction; Snow Traction; Treadwear; Rolling Resistance, Comfort, Noise, Price, etc. on charts that look like spider webs (See Figures II-1, 2, and 3 for examples). The optimization of one factor is usually at the sacrifice of another factor. The traction factors are the most relevant to safety, since these factors influence a vehicle’s stopping distance. Traction is measured as either a peak or sliding coefficients of friction by a skid trailer. In the past, a hard compound tire that has a very low rolling resistance would usually perform poorly in the wet traction skid tests, having a longer stopping distances in cars equipped with ABS or ESC, and even worse unstable out-of-control stops with cars not equipped with ABS and ESC. These hard compound tires also usually have good treadwear. Technical literature extensively indicates that the tradeoff between fuel economy and safety performance can be significantly reduced or eliminated with advanced compounding technologies, which are usually more expensive and proprietary. It is possible that consumer awareness will help spur technological innovation in this domain. However, many aspects of the tire's construction and manufacture affect how much tradeoff remains, and the results of implementing new technologies, such as silica tread compounds, will vary across manufacturers (which ranges from manufacturers who have decades of experience with the technology to manufacturers who have none). At least for the near future, the agency cannot guarantee that there will not be a tradeoff between fuel efficiency and safety. One advantage of a labeling regime is that consumers can make their own tradeoffs among these factors.

12
Figure II-1 Tire Properties – Example 1

13
Figure II-2 Tire Properties – Example 2

14
Figure II-3 Tire Properties – Example 3

15
Potential Opportunity Costs As with any tire purchase, there are tradeoffs in the tire features, including rolling resistance, safety, and treadwear. While NHTSA expects that manufacturers will typically improve rolling resistance and not tradeoff safety, no such assurance can be made for consumers. Armed with information provided by this new program, consumers will have new information that affects the fuel economy of their vehicle and their pocket book, and wet traction. There are a wide variety of tires on the market with different properties and features. There are no guarantees that consumers won’t choose tires that have low rolling resistance and poor traction.
16
III. TEST RESULTS The agency will require tire manufacturers to rate the fuel efficiency of their tires using an international standard recently issued by the International Organization for Standardization (ISO), ISO 28580:2009(E). In addition, as part of tire research, the agency performed a series of tire tests in different test conditions to determine how the reduction in rolling resistance impacts vehicle safety and fuel economy. The evaluation of the test procedures and the test results from these tests are presented in this chapter. A. Test Procedure As mentioned previously, subsequent to the recommendations for Congressional action issued in the 2006 NAS Report, NHTSA began a research program to evaluate five existing test methods to measure the rolling resistance of light vehicle tires (Phase 1 Research)28
• Society of Automotive Engineers (SAE) J1269 - Sep 2006-09;
, and to examine correlations between tire rolling resistance levels and tire safety performance (Phase 2 Research). The five test methods examined in NHTSA’s Phase 1 Research included four established and one draft tire rolling resistance test procedure. The five test methods were as follows:
Rolling Resistance Measurement Procedure for Passenger Car, Light Truck and Highway Truck and Bus Tires
• SAE J1269 - Sep 2006-09; (Multi Point).
Rolling Resistance Measurement Procedure for Passenger Car, Light Truck and Highway Truck and Bus Tires
• SAE J2452 - Jun 1999; (Single Point).
Stepwise Coastdown Methodology for Measuring Tire Rolling Resistance
• International Organization for Standardization (ISO) 18164:2005(E); (Multi Point).
Passenger car, truck, bus and motorcycle tyres -- Methods of measuring rolling resistance
• ISO/DIS 28580;
(Multi Point).
Passenger car, truck and bus tyres -- Methods of measuring rolling resistance -- Single point test and correlation of measurement results
(Single Point).
The Society of Automotive Engineers (SAE) International is an international standards organization providing voluntary industry standards to advance the state of technical and engineering sciences. The International Organization for Standardization (ISO)29 is a worldwide federation of national standards bodies that prepares standards through technical committees comprised of international organizations, governmental and non-governmental, in liaison with ISO.30
28 See DOT HS 811 119, NHTSA Tire Rolling Resistance Rating System Test Development Project: Phase 1 – Evaluation of Laboratory Test Protocols (June, 2009), docket entry NHTSA-2008-0121-0019. 29 The standards and test methods published by these bodies are proprietary and protected under U.S. copyright law. While we can describe these test methods in our research results, we cannot reprint them in this notice or in our regulations. When dealing with copyrighted industry standards, NHTSA incorporates them by reference into their standards where appropriate. Parties who need to or wish to conduct the actual tests themselves may obtain a copy of the standards by contacting either SAE or ISO. 30 ISO Central Secretariat, 1, ch. de la Voie-Creuse, Case postale 56, CH-1211 Geneva 20, Switzerland, Telephone +41 22 749 01 11, Fax +41 22 733 34 30, www.iso.org.

17
The term “multi point” refers to a method that uses more than one set of conditions to test a tire, usually varying speed, pressure, and/or load. Passenger and light truck tires generally have different test conditions and can have even a different number of test points in the set of conditions. The term “single point” refers to a method that uses a single set of test conditions. However, the set of single point test conditions may differ for passenger and light truck tires. The description of the five test procedures are provided below. (For additional discussion, please see a report titled “NHTSA Tire Rolling Resistance Rating System Test Development Project: Phase 1 – Evaluation of Laboratory Test Protocols”.31
A.1 SAE J1269 Multi Point Test
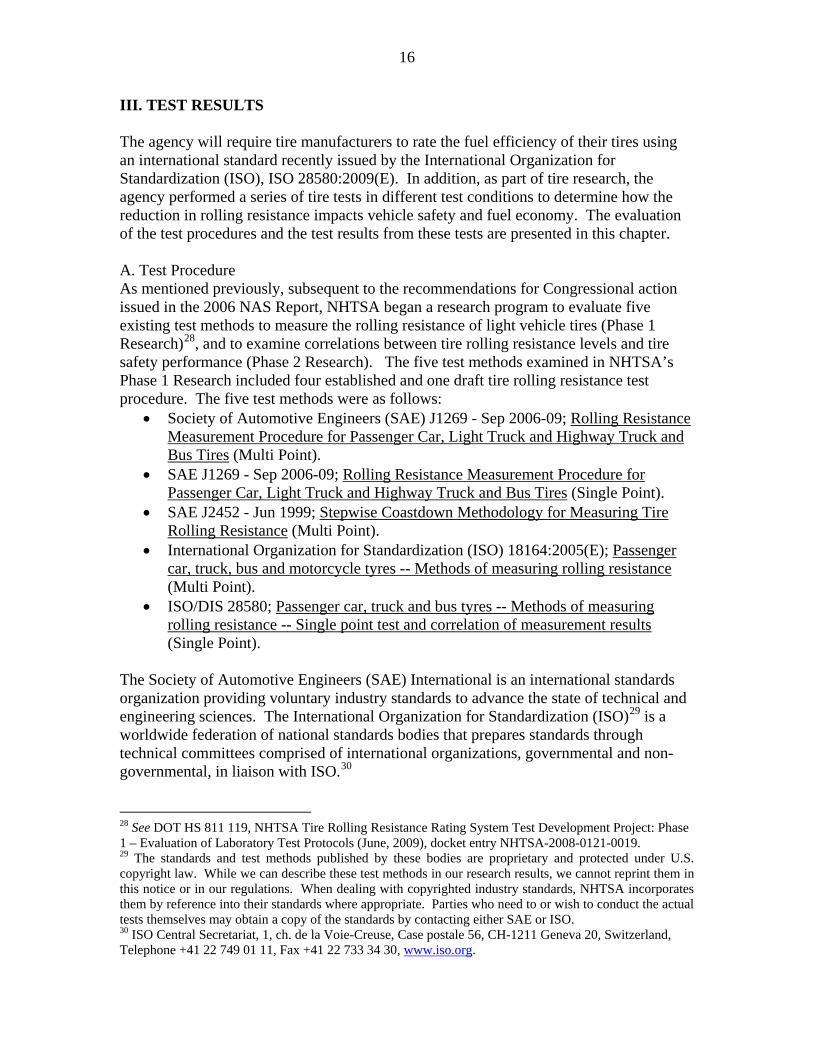
SAE J1269 was originally approved in 1979 as a method of determining rolling resistance at four different load and pressure conditions for Passenger car (P) tires, six test conditions for Light Truck (LT) tires, and five test conditions for truck and bus tires. The Phase 1 research evaluated P and LT tires only, therefore truck and bus test conditions are not considered nor reported. This test method uses a 1.707 m (67.23 inch) roadwheel with grit surface and allows the measurement of rolling resistance by the force, torque or power method. The force method measures the reaction force generated at the axle or spindle supporting the tire specimen (Figure III-1). A multi-axis load cell measures the radial load and force tangential to the contact or test surface. With the torque method, a torque cell is located between the drive motor and the roadwheel that measures the input torque required to maintain the roadwheel speed. The power method measures the electrical energy needed to maintain the roadwheel speed. Based on the equipment installed at the two test labs available for the research, all J1269 single and multi-point testing was conducted on machines that utilize the force method of measurement. Prior to the 2006-09 version of J1269, the pressure used during the test was the maximum pressure found molded on the tire sidewall. These pressures were not always consistent with the maximum pressures from the standardizing bodies for the maximum load. In September 2006, a revision was made to the Recommended Practice for 2007 version of the SAE Handbook. (It should be noted this change was made after the National Academies (NAS) report was issued.) The change revised the definition of “Base Inflation Pressure” (Pr) to specify the inflation pressure corresponding to the maximum load listed in the tables of current T&RA Yearbook or in corresponding tables published by similar organizations. This meaning of Base Inflation Pressure was used in the Phase 1 research.
31 For additional information, see report DOT HS 811 119, NHTSA Tire Rolling Resistance Rating System Test Development Project: Phase 1 – Evaluation of Laboratory Test Protocols (June, 2009), docket entry NHTSA-2008-0121-0019.
18
Figure III-1. Force method Rolling Resistance
A.2. SAE J1269 as a Single Point Test
The J1269 multi-point rolling resistance test provides for calculation of a single rolling resistance value from the results of the multiple test conditions. This rolling resistance value can then be used to compare tires. The 2006-09 version of the standard added an option to run a “Standard Reference Condition” (SRC), a single set of test conditions, in lieu of the multi-point conditions “for the purpose of high volume comparisons.”32
A.3. SAE J2452 Stepwise Coastdown Test
The J2452 Stepwise Coastdown Test Method was developed by tire industry, automotive manufacturers and laboratory representatives in the late 1990’s. This test method is presented by SAE as being valid for pneumatic Passenger car “P” type, metric Light Truck (LT) and high flotation tires. It is acceptable for use on 1.2 meter (48 in.) or greater roadwheels. In the NHTSA Phase 1 research, all work was done using machines with 1.707 m (67.23 inch) roadwheels with grit surface. The machine at Smithers33 and STL34
Unlike the other test methods, J2452 can only be accomplished on Force or Torque machines. No provision is allowed for Power or Deceleration methods.
have been in operation for many years and use the force method. An additional machine was installed at STL during the contract period that uses the torque method.
A.4. ISO 18164:2005(E) Multi Point Test
ISO 18164:2005(E) is very similar to SAE J1269, therefore only the major differences will be discussed. Like J1269, this method has the possibility to measure rolling
32 Society of Automotive Engineers (SAE) J1269 - Sep 2006-09; Rolling Resistance Measurement Procedure for Passenger Car, Light Truck and Highway Truck and Bus Tires 33 Smithers Scientific Services, Inc - Smithers Tire and Automotive Test Center, Ravenna, Ohio 34 Standards Testing Laboratories, Inc. - STL Testing, Massillon, Ohio
RRF = Rolling Resistance Force
1.7 meter Roadwheel
FX = Measured Axle Force

19
resistance with the Force, Torque and Power methods. However, ISO 18164 also includes a Deceleration method. For the Phase 1 research, ISO 18164 was only evaluated on machines that utilize the force method of measurement. ISO 18164 normally specifies a smooth roadwheel 1.5 meter or greater and then uses a 1.7 meter as the reference. ISO 18164 section B4 specifies the test conditions to be used with the 1.707 m (67.23 inch) roadwheel with grit surface. Testing by Smithers and ARDL-STL were carried out using section B4 of the test method on 1.707 m roadwheels with grit surface. This method recommends obtaining the test data in increasing values of the rolling resistance for passenger tires, the opposite of J1269. That is the light load/high pressure Test Point (TP)1 is first, followed by decreasing the pressure for TP2, increase the load and pressure for TP3 then decrease the pressure for TP4 completes the order of running the data points.
A.5. ISO 28580 Single Point Test
At the inception of the Phase 1 research, a copy of the ISO Draft International Standard (DIS) 28580 was provided for evaluation. Since that time, the Final International Standard (FIS) 28580:2009(E) has been issued, which had only minor editorial revisions from the draft version. The four types of machines noted in ISO 18164 are also available for use in ISO 28580.35
The types of methods to measure rolling resistance are Force, Torque, Power and Deceleration. During the Phase 1 research, all ISO 18164 testing was conducted on machines that utilized the force method of measurement.
ISO 28580 specifies a roadwheel of at least 1.707 meters and both smooth and optional grit surface as long as it is kept clean. Testing for this study used a 1.707 m (67.23 inch) roadwheel with grit surface. The Passenger and Light Truck testing was performed at 80km/h as was found in ISO 18164. The single point test load is based on the tire Load index (Li) with SL and XL tires being multiplied by 80 percent. LT or “C” tires have the load adjusted to 85 percent of the Li maximum load. These are shown in Figure III-2 and Figure III-3 below.
35 The machines are for the force, torque, power and deceleration methods.

20
Figure III-2. ISO 28580 Test Conditions for Standard Load (RRSL1) and Extra Load
(RRXL1) Passenger Tires
Figure III-3. ISO 28580 Draft Standard Test Conditions for “C” or LT, Li ≥ 121 Tires
Load
TP 4
TP 3
TP 2
TP 1
Pressure
25% 50% 60%75%85% 100%
100% capped TP 2
TP 5
95% Regulated 28580 LT
Pr+70 kPa
Load
TP 1 TP 3
Pr -30 kPa
Pressure
40% 50% 60% 80% 90%
TP 2 TP 4
250 kPa capped 210 kPa capped
RRXL1
RRSL1
120% Regulated
70% Regulated

21
The Base Inflation Pressure for ISO 28580 does not have the pressure adjustment for testing on the grit surface, as does ISO 18164. The capped pressures are the same as was specified by ISO 18164 for a smooth surface roadwheel.36
Test speed in ISO 28580 is 80 km/h (50 mph nominal), actual is running speed at 80 km/h is 49.7 mph. Test temperature range is specified as 20°C to 30°C. The test temperature is corrected to 25°C using the formula Fr25= Fr[1+K(tamb-25)] where:
Fr is the rolling resistance, in Newtons (“Fr” is referred to by “RRF” in this document) Tamb is the ambient temperature, in degrees Celsius K is equal to:
0.008 for passenger tires 0.010 for truck and bus with load index less than 121 0.006 for truck and bus tires with load index 122 and above
One significant difference between the ISO and SAE single-point tests is the inclusion of a procedure which uses two reference tires to correlate any laboratory to a master laboratory. NHTSA’s research showed significant variation between the two laboratories used, and therefore addressing this variation is a significant issue. Use of the SAE J1269 single-point test would require NHTSA to develop its own procedure to address lab-to-lab variation.
A.6. Difference in ISO 28580 and SAE J1269
While there are a larger numbers of tires tested using the SAE J1269 procedure in the databases NHTSA had access to, NHTSA does not see this as an impediment to adopting the ISO test. NHTSA’s research shows that the results from either method can be cross-correlated to provide the same information. Specification of the ISO 28580 single-point test will allow manufacturers to do one test to comply with both European and U.S. regulations. California is also considering the ISO test for its regulation. The ISO 28580 single-point test uses capped inflation pressure, which NHTSA believes will provide a more accurate representation of in-service behavior. Four types of rolling resistance measurement methods are specified in ISO 28580 single-point, Force, Torque, Power and Deceleration. Due to the data variability that could occur from the use of the many permutations of test equipment options available in ISO 28580, and the lack of power or deceleration-based measurement machines in the US, NHTSA will conduct compliance testing using only the force or torque measurement methods on a 1.7-m roadwheel with an 80-grit surface. Manufacturers may use any test options in ISO 28580 to rate tires, or for that matter any other test, simulation, or calculation method. However the onus is on manufacturers to assure that they have accurate means of calculating equivalent ratings for ISO 28580 testing on the aforementioned equipment. 36 In the capped test, inflation pressure rose as the tire was tested and resulted in slightly lower rolling resistance versus regulated pressure for the same tire in the same test.

22
Table III-1. Comparison of the Five Laboratory Rolling Resistance Test Methods
Evaluated
ISO 28580 Draft ISO 18164:2005(E) SAE J1269 SAE J2452 Single Point Multi Point
Note Ref. ISO 28580 Multi point SRC as Test Conditions
Roadwheel 1.7 m or correction
1.7 m or correction (1.5m with correction)
1.7 m 1.7m 1.219m to 1.707m
Measurement Methods
Force Force Force FR=FX(1+RL/R) Force
FR=FX(1+RL/R) Force
Torque Torque Torque FR=T/R Torque FR=T/R Torque Power Power FR=c*P/v FR=c*P/v
Deceleration Deceleration
Surface Smooth Smooth 80 Grit 80 Grit 80 Grit
Temperature 20 – 30 C 25 C 20 to 28 C 20 to 28 C 20 to 28 C
Ref. Temp. 25 C 25 C 24 C 24 C 24 C
Base Pressure
Molded sidewall load@ T&RA pressure
Molded sidewall load@ T&RA pressure
Percent of Max.
Passenger Passenger B4 Passenger & LT Passenger Passenger
Load Pressure Load Pressure Load Pressure Load Pressure Load Pressure
Load and Pressure
SL 80%
210 kPa Capped 50% +70 kPa
reg. 70% +20 kPa Regulated 90%
-50 kPa (7.3 psi) Capped
30% 1.4 psi reg.
XL 80%
250 kPa Capped 50% -30 kPa
reg.
90% +70 kPa (10.2 psi) reg.
60% -5.8 psi reg.
90% +70 kPa reg. 50%
-30 kPa (4.4 psi) reg.
90% +8.7 psi reg.
C, Truck/ Bus (single) 90% -30 kPa
reg. 50% +70 kPa (10.2 psi) reg.
90% -5.8 psi reg.
85% 100 % Capped
Light Truck (single) Light Truck
(single)
≤Li 121 Highway Truck and Bus B1 100% 100 %
Capped 20% 110 % reg.
Load Pressure 70% 60 % Reg. 40% 50 %
Reg.
100% 100 % Capped 70% 110 %
Reg. 40% 100 % Reg.
100% 95 % Reg. 40% 30 %
Reg. 70% 60 % Reg.
75% 70 % Reg. 40% 60 %
Reg. 100% 100 % Reg.
50% 120 % Reg. 40% 110 %
Reg.
25% 70 % Reg.

23
The choice of which test procedure to specify for measuring rolling resistance is important because measuring rolling resistance requires precise instrumentation, calibration, speed control and equipment alignment for repeatable results. Agency research examining various rolling resistance test methods indicated that the ISO 28580 test method is unique in that it specifies a procedure to correlate results between laboratories, which is a significant issue. Other established test methods lack such a procedure. Further, the ISO 28580 test procedure is also the specified test method in a proposed European Union Directive on tire fuel efficiency, and will likely be the specified method for a proposed California fuel efficiency rating system. Therefore, specification of the ISO 28580 will allow manufacturers to do one test to comply with several regulations. The following section discusses the test results from the NHTSA’s Phase 1 and Phase 2 tire research programs. B. NHTSA Phase 1 Research The Phase 1 research used 600 tires of 25 different model/size combinations to evaluate the five rolling resistance test methods at two different laboratories.37
Tires of each model were purchased with identical or similar build dates and were tested multiple times in each test method, and multiple times at each laboratory.
Some of the technical challenges involved in selection of a test procedure to measure rolling resistance include specifying a test method that avoids variation among test equipment and manufacturers. NHTSA’s research also sought to examine possible tradeoffs between improved rolling resistance and tire safety. The purposes of the NHTSA Phase 1 testing were to:
• Benchmark the current rolling resistance levels in modern passenger vehicle tires in terms of actual rolling force, rolling resistance coefficient, as well as indexed against the ASTM F2493-06 Standard Reference Test Tire (SRTT).
• Analyze the effect of the input variables on the testing conditions for non-linear response.
• Select a test procedure that would be best for a regulation. • Examine the variability of the rolling resistance results from lab to lab, machine to
machine. • Evaluate the effects of first test on a tire versus second test on the same tire. • Investigate methods for reporting the data to consumers.
B.1 Test Tires used in Phase 1 Research Tests The test program utilized an assortment of approximately 600 new tires of 25 different models. 15 tire models were passenger car tire models, 9 were light truck tire models, and
37 This study looked at both Passenger car (P) tires and Light Truck (LT) tires. However, The Energy Independence and Security Act (EISA) limits the applicability of this rulemaking to P tires only.

24
one was the ASTM F2493-06 P225/60R16 97S Standard Reference Test Tire (SRTT). The Energy Independence and Security Act (EISA) of December 2007 required that the National Tire fuel Efficiency Consumer Information Program “apply only to replacement tires covered under section 575.104(c) of title 49, Code of Federal Regulations (UTQGS), in effect on the date of the enactment of the Ten-in-Ten Fuel Economy Act.” Per 575.104(c), the Uniform Tire Quality Grading System (UTQGS) does not apply to deep tread (which is interpreted as light truck tires), winter-type snow tires, space-saver, or temporary use spare tires, or tires with nominal rim diameters of 12 inches or less, or to limited production tires. However, because the research project initiated more than a year prior (July, 2006) to the enactment of EISA, the mix of 25 tire models includes 2 winter-type passenger tire models and 9 light truck tire models. B.1.1 ASTM F2493 Radial Standard Reference Test Tire (SRTT) The ASTM F2493 - Standard Specification for P225/60R16 97S Radial Standard Reference Test Tire provides specifications for a tire “for use as a reference tire for braking traction, snow traction, and wear performance evaluations, but may also be used for other evaluations, such as pavement roughness, noise, or other tests that require a reference tire.” The standard contains detailed specifications for the design, allowable dimensions, and storage of the SRTTs. As can be observed in Figure III-4, the F2493 SRTT is a variant of a modern 16-inch Uniroyal TigerPaw radial passenger vehicle tire and comes marked with a full USDOT Tire Identification Number and UTQGS grades (Table III-2). The SRTTs were used extensively throughout the test programs at both labs (Smithers and ARDL) as the first and last tire in each block of testing in order to track and account for the variation in machine results. In theory, by monitoring first and last tests for each block of testing at each lab with a SRTT, and referencing rolling resistance results for each tire back to the SRTT results for that block of testing, the results should be corrected for variations in the test equipment over that time period, as well as variations in test equipment from lab to lab.
Figure III-4. ASTM F2493-06 Standard Reference Test Tire (SRTT)
679 mm
231 mm

25
Table III-2. Specifications for ASTM F2493-06 SRTT Ti
re M
odel
C
ode
MFG
Size
Load
Inde
x
Spee
d R
atin
g
Mod
el
UTQ
GS
Trea
dwea
r
UTQ
GS
Trac
.
UTQ
GS
Tem
p.
Mea
sure
d Tr
ead
Dep
th
(1/3
2”)
Perf
orm
ance
Le
vel
M14 Uniroyal P225/60R16 97 S ASTM 16" SRTT 540 A B 8 ASTM F 2493-06 Reference
B.1.2. Passenger Tire Models Fifteen DOT-approved passenger tire models were purchased new for testing. Their specifications are detailed in Table III-3.
Table III-3. Specifications for Passenger Tire Models
Test
Pro
gram
A
xis
Tire
Mod
el C
ode
MFG
Size
Load
Inde
x
Spee
d R
atin
g
Mod
el
UTQ
GS
Trea
dwea
r
UTQ
GS
Trac
.
UTQ
GS
Tem
p.
Mea
sure
d Tr
ead
Dep
th (1
/32”
)
Perf
orm
ance
Le
vel
1
G10 Goodyear P205/75R15 97 S Integrity 460 A B 9 Passenger All Season
G11 Goodyear P225/60R17 98 S Integrity 460 A B 8 Passenger All Season
G8 Goodyear 225/60R16 98 S Integrity 460 A B 9 Passenger All Season
G9 Goodyear P205/75R14 95 S Integrity 460 A B 9 Passenger All Season
U3 Dunlop P225/60R17 98 T SP Sport 4000 DSST 360 A B 11 Run Flat
2
B10 Bridgestone 225/60R16 98 Q Blizzak REVO1 - 9 Performance Winter
B15 Dayton 225/60R16 98 S Winterforce - 14 Performance Winter
B13 Bridgestone P225/60R16 97 T Turanza LS-T 700 A B 11 Standard Touring All Season
B14 Bridgestone P225/60R16 97 V Turanza LS-V 400 AA A 11 Grand Touring All Season
B11 Bridgestone P225/60R16 97 H Potenza RE92 OWL 340 A A 11 High Performance All
Season
B12 Bridgestone P225/60R16 98 W Potenza RE750 340 AA A 7 Ultra High Performance
Summer
3
M13 Michelin 225/60R16 98 H Pilot MXM4 300 A A 7 Grand Touring All Season
D10 Cooper 225/60R16 98 H Lifeliner Touring SLE 420 A A 11 Standard Touring All
Season P5 Pep Boys P225/60R16 97 H Touring HR 420 A A 11 Passenger All Season
R4 Pirelli 225/60R16 98 H P6 Four Seasons 400 A A 11 Passenger All Season
B.1.3 Light Truck Tires Nine DOT-approved light truck tire models were purchased for testing. Their specifications are detailed in Table III-4.

26
Table III-4. Specifications for Light Truck Tire Models Te
st P
rogr
am
Axi
s Ti
re M
odel
C
ode
MFG
Size
Load
Inde
x
Spee
d R
atin
g
Mod
el
Mea
sure
d Tr
ead
Dep
th
(1/3
2”)
Perf
orm
ance
Le
vel
4
D7 Cooper LT235/85R16 120(E) N Discoverer ST-C 19 All terrain on/off road
D8 Cooper LT245/75R16 120(E) N Discoverer ST-C 19 All terrain on/off road
D9 Cooper LT265/75R16 120(E) N Discoverer ST-C 19 All terrain on/off road
5
M10 Michelin LT245/75R16 120(E) R Michelin LTX A/S 15 All season on-road
M11 Michelin LT245/75R16 120(E) R Michelin LTX M/S 16 All season on-road
M12 Michelin LT245/75R16 120(E) R Michelin X RADIAL LT 15 All season on-road
6
P4 Pep Boys LT245/75R16 120(E) N Scrambler A/P 15 All season on-road
C9 General LT245/75R16 120(E) Q AmeriTrac TR 15 All terrain on/off road
K4 Kumho LT245/75R16 120(E) Q Road Venture HT 15 All season on-road
Wheels of each size used in the test program were purchased new, in identical lots to minimize wheel-to-wheel variation. Tires participating in multiple tests at the same lab or between two labs were mounted once on a single wheel and continued to be tested on that same wheel until completion of all tests. B.2. Statistical Analysis of Phase 1 test data38
As described, each of the five test methods was used to measure the rolling resistance of the tires in two laboratories. Individual tires were systematically measured as a first test on a new tire, and as subsequent tests on the same tire after measurement on other tests and/or in other laboratories. ANOVA analysis was carried out on the data using SAS software to estimate effects. All models produced high R2 values, above 0.98, and high F values with Probability > F of 0.0001. A general description of the variables analyzed and the effect of each is shown in Table III-5. The most significant variable as measured by any test is the tire type (i.e. individual tire model). This variable was at least an order of magnitude more important to the statistical model than all other variables combined. For each tire type the variability within the group of tires was very low, approximately 2 percent of the mean value.
39
There was a significant offset between data generated by the two labs used in the study of approximately 5 percent. This offset was not linear with force, nor was it uniform for all tests, showing a complete reversal for one test.
38 For the complete test results, see NHTSA Rolling Resistance Rating System Test Development Project: Phase 1 – Evaluation of Laboratory Test Protocols (October 2008). 39 One tire of type C9 was excluded from the analysis since it had abnormally high values on multiple tests compared to the rest of the type C9 tires.
27
The method of inflation maintenance during the test was measured using the SAE J1269 single-point test. In the capped test, the inflation pressure was set to the specified value during the initial cold inflation of the tire and the pressure inside the tire cavity was allowed to rise during the roadwheel testing. In the regulated procedure, the inflation pressure was maintained at the specified pressure during the test using a rotary union coupling. As expected, the higher pressure inside the tire during the capped test produced slightly lower rolling resistance values. In order to study the feasibility of retesting the same tire periodically as a laboratory control tire, or in a possible dispute of test results, the testing involved the use of the same tire for multiple tests. The effect of test order was estimated by comparing the results of tires tested as a first test with tires of the same type that had been tested previously on other tests or in other labs. One test showed a very slight effect of test order, with a magnitude only slightly more than the random variability. Three tests showed that the effect of repeating tests on the same tire and found that this had little to no effect on test results.
Table III-5: Variables Analyzed in Study and General Comments on Significance Variable Significance
of Effect Comments
Tire Type Very High Rank ordering of tires shows significant separation of tires by group using any test
Laboratory High Smithers showed higher results on four tests and lower results on one test than STL40
Inflation Maintenance, (Capped vs. Regulated)
Significant Only measured on SAE J1269 single-point test
Test Order (First vs. Subsequent Tests)
None / Slight Three tests showed no statistical significance, one test showed significance with a very small effect, and one test could not be analyzed due to data covariance
Table III-6 compares the variability for the six standard measures of rolling resistance studied using the five test methods. Variability of the tests is very low, as evidenced by the coefficient of variation (C.V.) values of approximately 2 percent. The potential for discrimination in Table III-6 is an estimate of the ability of a test measure to classify the entire range of data for the tires of the study into groups. It is calculated as the range of the means of the data (maximum mean value - minimum mean value) divided by three times the root mean square error for the test. For most tests, the maximum number of groups that the 25 tire models could be divided into ranged from five to six.
40 The tests were conducted at two different laboratories, Smithers and STL.

28
Table III-6. Variability and Discrimination of Tests for Rolling Resistance of Passenger
Tires Test C.V.
(%) Range of
Data Means41
Potential for Discrimination
(Passenger Tires) SAE J1269 Single-Point 2.37% 4.99 5 ISO 28580 Single-Point 2.21% 5.38 5 SAE J1269 Multi-Point (calculated @ SRC)
2.27% 5.06 5
ISO 18164 Multi-Point42 5.25% 4.87 3 SAE J2452 (calculated @ SRC) 1.81% 4.89 6 SAE J2452 (SMERF43 1.87% ) 4.70 6
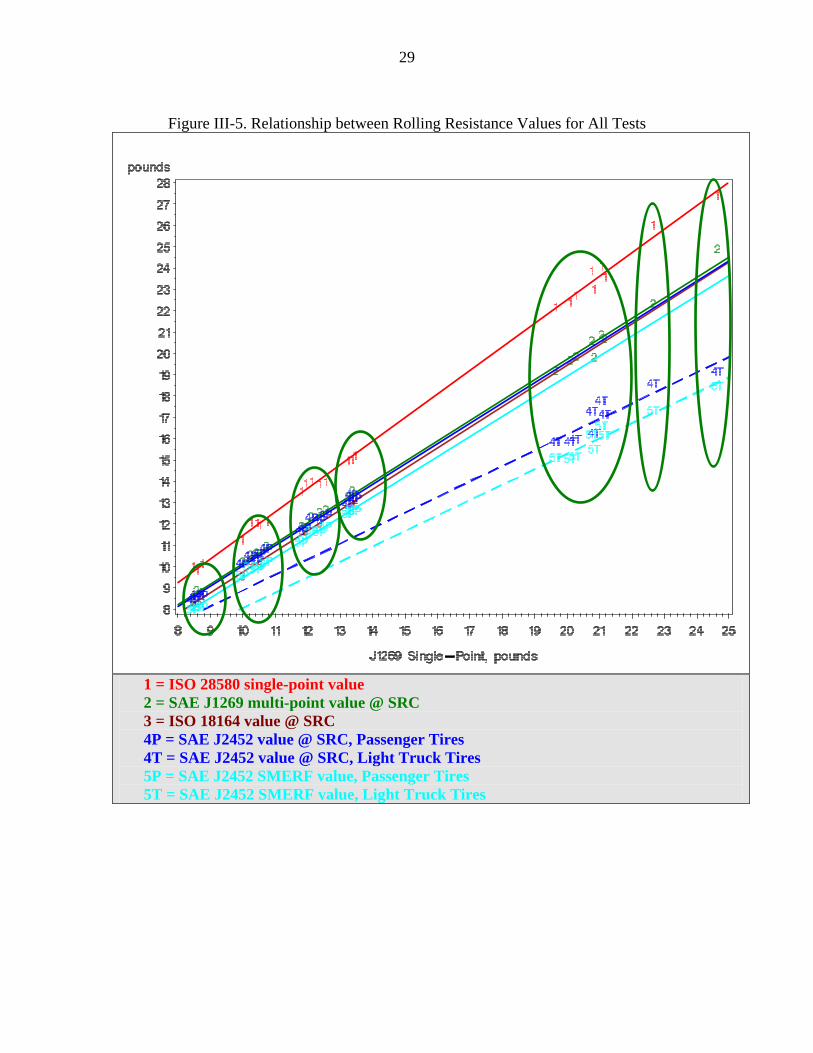
Based on the low C.V. of each test and the range of data, it appears that any of the tests could be selected to distinguish the rolling resistance values of the tires selected for the study. The test protocols involved different load, inflation, and speed conditions, and it is known that changes in any of these conditions produce different rolling resistance values. Additionally, some values are directly measured, while others are estimated from regression of the data. Thus, the next step in the analysis was to determine if the tests are measuring the same property of the tires, or if the reported rolling resistance is unique to the test conditions or calculations used to generate the response surface. The values in Figure III-5, showing the pounds force of rolling resistance for each test plotted versus the pounds force found on the SAE J1269 single-point test, appear to be divided in seven groups. It is clear that there is a linear relationship between each test and the SAE J1269 test. If each group contains the same tires tested by each of the different tests, it can be assumed that the tests are all measuring the same property of the tire. The population of the circled groups, numbers 1 through 7 from left to right (lowest to highest rolling resistance), are shown in Table III-7. The tires are listed in order of rolling resistance force values for each test individually. All groups contain the same tires no matter which test was used to rank order the tires (for example, Group 1 contains B11, G8, and G11 regardless of test used). However, the rank ordering of individual tires within a group can change from test to test and are within the expected variation of the tests. It should be noted that the rolling resistance values of tires are a continuous function. Therefore, the group divisions are shown to reinforce the consistency between the tests, and should not be construed as representing groupings of the entire population of tires.
41 Passenger tires only; (maximum mean value – minimum mean value) of tires in study. 42 Only 10 passenger tires tested. 43 SMERF: Standard Mean Equivalent Rolling Force, defined as “for any tire is the MERF for that tire under standard load/inflation conditions defined in Standard Reference Condition. For this document (J2452), the final SMERF is also calculated by weighting the SMERF obtained for the EPA urban and Highway cycles, as discussed previously for MERF calculation”.
29
Figure III-5. Relationship between Rolling Resistance Values for All Tests
1 = ISO 28580 single-point value
2 = SAE J1269 multi-point value @ SRC 3 = ISO 18164 value @ SRC 4P = SAE J2452 value @ SRC, Passenger Tires 4T = SAE J2452 value @ SRC, Light Truck Tires 5P = SAE J2452 SMERF value, Passenger Tires 5T = SAE J2452 SMERF value, Light Truck Tires

30
Table III-7. Grouping of Tires by Rolling Resistance Force – Lowest to Highest
Group Population J1269 single-
point J1269 multi-
point@ SRC
ISO 28580 ISO 18164 J2452 @ SRC
J2452, SMERF
1 B11 G8
G11
G11 B11 G8
G8 B11 G11
G11 G8 B11
G11 B11 G8
G11 G8 B11
2
G9 G10 M13 M14 B10*
G9 G10 M14 M13 B10*
G9 M13 M14 G10 B10*
G9 M14 G10
G9 M13 G10 M14 B10*
G9 M13 G10 M14 B10*
3
D10 U3 P5
B14 B15*
U3 D10 P5
B14 B15*
D10 B14 U3
B15* P5
U3 B14
D10 U3 B14 P5
B15*
D10 U3 B14 P5
B15*
4 R4
B13 B12
B12 R4
B13
R4 B13 B12
B13 B12
R4 B12 B13
R4 B12 B13
Passenger
Light Truck
Tires Tires
5
M10 M12 M11 D8 K4 D7 P4
M10 M12 K4
M11 D8 P4 D7
M10 M12 M11 K4 P4 D8 D7
M12 M10 M11 K4 P4 D8 D7
M12 M10 M11 K4 P4 D8 D7
6 D9 D9 D9 D9 D9 7 C9 C9 C9 C9 C9
*Snow tires Figure III-6 shows the rolling resistance coefficient values plotted versus the RRC for the J1269 single-point test. These data can be divided into 5 groups. Again, each group contains the same tires no matter which test is used to rank the tires. We may conclude that the tests have nearly equal ability to discriminate between tires, and that all tests are measuring the same property of the tires in the study, within the error limit of the individual test.

31
Figure III-6. Tires Ranked by All Tests Using Rolling Resistance Coefficient (RRC)
1 = ISO 28580 single-point value
2 = SAE J1269 multi-point value @ SRC 3 = ISO 18164 value @ SRC 4P = SAE J2452 value @ SRC, Passenger Tires 4T = SAE J2452 value @ SRC, Light Truck Tires 5P = SAE J2452 SMERF value, Passenger Tires 5T = SAE J2452 SMERF value, Light Truck Tires
For any given test there was a significant offset between the data generated by the two labs used in the Phase 1 research. This offset was not consistent between tests, or even between tire types within the same test in some cases. If a test is to be used to compare the rolling resistance of tires tested at different facilities and at different times, some
B.3 Lab-to-lab Correlation Procedures
32
method to account for this offset needs to be developed. Two possible methods were investigated in this study: 1) development of a lab-to-lab correlation equation; and 2) use of the ASTM F2493 Standard Reference Test Tire (SRTT) to normalize data across labs. The former method was used in the previous section to correct the data to that expected from a single lab (Smithers, in this case). It is also currently under investigation as part of the ISO 28580 standard. In addition to the normal lab calibration procedures within each lab, this correlation would have to be developed across the entire range of rolling resistance values. There is evidence that a single equation for all tire types may not be sufficient to correct data for all tires. No data is available from this study to determine if a lab-to-lab correlation developed at a given time would remain constant over time, or if offsets and/or drifts will occur in a lab that will require a standardization procedure to be employed. The ASTM F2493 SRTT was used as in internal standard for each lab and all data within the lab for a test was normalized to the SRTT value. This strategy was very successful for lab-to-lab correlation. It has the added benefit of showing good test method-to test method correlation for passenger tires. The advantages to this method are that it would automatically correct for any systematic drift within a laboratory and that it would fit well into any existing SPC/SQC procedures in place in a lab. It could be further refined by providing a “certified” rolling resistance value to each individual SRTT. Additional work would be needed to investigate whether the rolling resistance value of the SRTT is constant over time before this strategy could be employed. Values are compared in pounds rolling resistance, as reported by the laboratories. The conversion to RRc is a scalar that will not affect the correlation between labs so a separate analysis is not required. Where possible the correlation between the identical tire, measured at each lab, is compared. Otherwise, the means of values for each tire type are used for the comparisons. A linear correlation between labs generally provided an excellent fit for correlation. Since the physical lab calibration procedure provides a zero value for the test it is appropriate to model the values with a zero intercept for each lab. A second order fit with a zero intercept provides a slightly better correlation between labs.
B.3.1 Lab-to-Lab Correlation
Figure III-7 shows the relationship for rolling resistance values for tires tested at ARDL-STL and at Smithers. Unlike the J1269, in the ISO 28580 test procedure, tires of the identical barcode were not tested at each lab and the relationship is based on the mean values by tire type in each lab. The relationship between the labs is linear and fits Equation III-1 below, with an R2 of 0.9975. This calculation is shown as the solid black line in Figure III-7. Since the calibration procedure at both labs requires a calibration at zero, it may be argued that the intercept should also be forced to zero. This relationship is shown in Equation III-2 and as the dashed red line in Figure III-7 below. Analysis of the residual values indicates that Equation III-2 is a slightly better fit. Compared to the slope of zero for the residuals using Equation III-2, Equation III-1predicts values

33
approximately 0.02 pounds (0.08 percent) lower for the highest rolling resistance light truck tire. In practical terms, within this range of rolling resistance values and with a standard deviation for the test of approximately 2 percent for these tires, the equations are indistinguishable.
Equation III-1. (Expected Value at Smithers) = -0.099369974 + 1.012042485*(Value at ARDL-STL) Equation III-2. (Expected Value at Smithers) = 0.9967824134*(Value at ARDL-STL) + 0.0004918546*(Value at ARDL-STL)2
Figure III-7. Rolling Resistance Values for Tires Tested at ARDL-STL and Smithers Using the ISO 28580 Single-Point Method

34
B.3.2 Normalization to the ASTM F2493-06 Standard Reference Test Tire (SRTT)
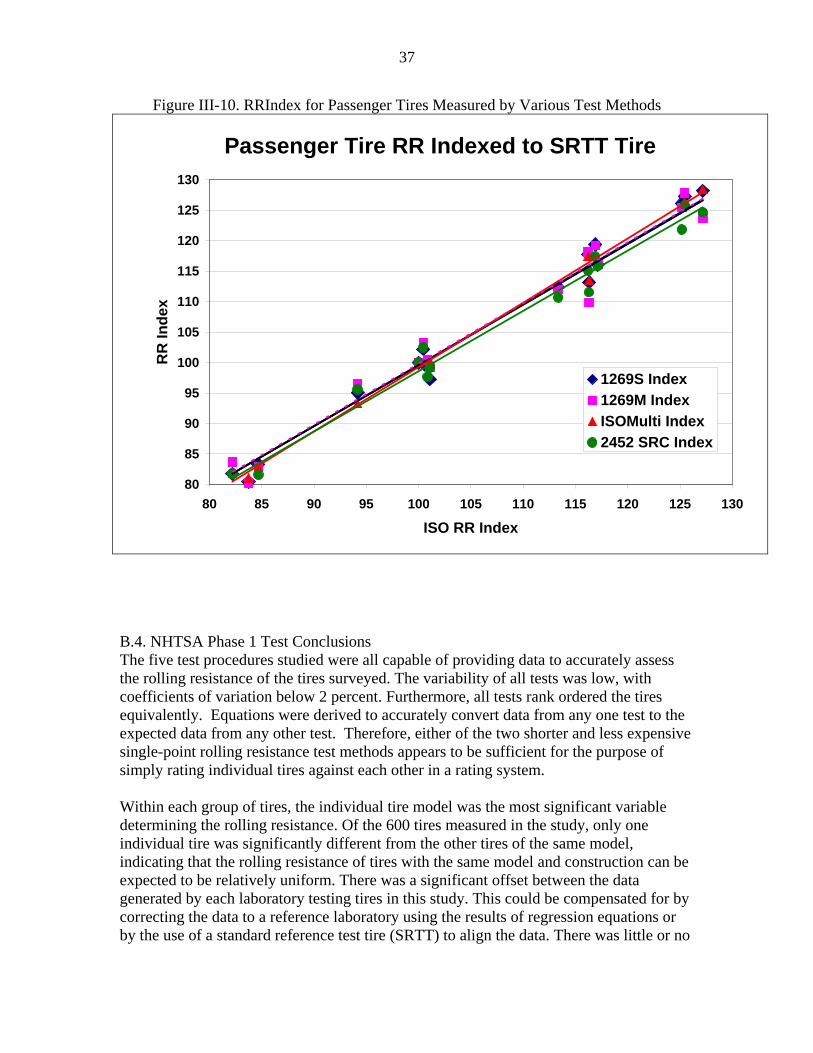
Tire M14, the SRTT manufactured according to ASTM F2493-06, was included in all aspects of the study. The fact that there were linear relationships between labs and between all tests for passenger tires indicates that this tire may be used as an internal standard for test reference. Accordingly, all values for passenger tires were normalized to the average value of the SRTT tested at the same conditions. For ease, the values were multiplied by 100 to give an index of rolling resistance (RRIndex). Figure III-8 shows the correlation between labs for each test using the RRIndex values. Comparing these to the correlations from the previous section shows that the correlations continue to be linear between labs. Figure III-9 shows that using RRIndex the correlation between labs for the ISO and SAE tests are nearly identical. More importantly, all correlations between labs are now very nearly one-to-one for each test, with an average of 1.0022 as shown in Table III-8. The standard deviation of 0.0112 is within the normal range of test repeatability found. Thus, normalization to the SRTT value is a valid method of maintaining correlation between labs. Finally, Figure III-10 shows that not only are the correlations nearly identical between tests, but the actual values obtained for RRIndex are equivalent for passenger tires, no matter which test is employed to measure the rolling resistance. The use of the SRTT as a reference and statistical process control techniques within each lab will give results that can be directly compared. For passenger tires, normalization of RRc data to the RRc of the Standard Tire could also be used as a measure of rolling resistance. Since this data set contains nearly all the same size passenger tires, and were therefore tested at the same load, no substantial conclusions could be drawn about any advantages or disadvantages for this calculation.

35
Figure III-8. Lab-to-Lab Correlation Using RRIndex (Normalized to SRTT)
Numbers represent various load/inflation conditions

36
Figure III-9. Correlation of ISO and SAE Test Values for ARDL-STL (-A-) and
Smithers (-S-) Normalized to SRTT Value
Table III-8. Correlation between Labs Using RRIndex, Normalized to SRTT Test (Smithers Index) = (ARDL-STL Index)
X: SAE J1269 Single-Point 0.9884 ISO 28580 Single-Point 0.9911
SAE J1269 Multi-Point @ SRC 1.0046 ISO 18164 Multi-Point (All Conditions) 0.9966
SAE J2452, Calculated @ SRC 1.0163 SAE J2452, SMERF 1.0167
Average 1.0022 ± 0.0112
37
Figure III-10. RRIndex for Passenger Tires Measured by Various Test Methods
Passenger Tire RR Indexed to SRTT Tire
80
85
90
95
100
105
110
115
120
125
130
80 85 90 95 100 105 110 115 120 125 130
ISO RR Index
RR
Inde
x
1269S Index1269M IndexISOMulti Index2452 SRC Index
B.4. NHTSA Phase 1 Test Conclusions The five test procedures studied were all capable of providing data to accurately assess the rolling resistance of the tires surveyed. The variability of all tests was low, with coefficients of variation below 2 percent. Furthermore, all tests rank ordered the tires equivalently. Equations were derived to accurately convert data from any one test to the expected data from any other test. Therefore, either of the two shorter and less expensive single-point rolling resistance test methods appears to be sufficient for the purpose of simply rating individual tires against each other in a rating system. Within each group of tires, the individual tire model was the most significant variable determining the rolling resistance. Of the 600 tires measured in the study, only one individual tire was significantly different from the other tires of the same model, indicating that the rolling resistance of tires with the same model and construction can be expected to be relatively uniform. There was a significant offset between the data generated by each laboratory testing tires in this study. This could be compensated for by correcting the data to a reference laboratory using the results of regression equations or by the use of a standard reference test tire (SRTT) to align the data. There was little or no

38
significant effect of repeat rolling resistance testing on the same tire. Therefore, repeat testing of the same calibration tire appears to be viable. The pressure rise in the tire during testing using a capped inflation procedure reduced the rolling resistance compared to maintaining the pressure at a constant pressure during the test. Therefore, the choice of a test that uses capped inflation pressure for some or all of the test points should provide a better representation of in-service behavior. NHTSA’s research has shown that both single- and multi-point tests are equally effective and essentially produce the same rating if results are normalized to the 16-inch SRTT.44
Single-point tests are less expensive and take less time than multi-point test methods. Accordingly, NHTSA concludes that a single-point, rather than a multi-point, test will better serve the purposes of the final rule.
Since all procedures provided reliable and equivalent information about the rank-order of rolling resistance for the tires studied, a single-point test is the most cost effective option. The increased information about the response of an individual tire’s rolling resistance due to changes in pressure, load, or speed inherent in the multi-point test procedures do not warrant the increased cost of the testing. The most significant provision of the ISO 28580 method is the use of defined reference tires to allow comparison of data between labs on a standardized basis. The use of any other procedure would require extensive evaluation and definition of a method to allow direct comparison of results generated in different laboratories or even on different machines in the same laboratory. Finally, the adoption the ISO 28580 standard is expected to promote harmonization of global standards for testing of tire rolling resistance. Between the two single-point tests, NHTSA has decided to specify the ISO 28580 test. The ISO 28580 single-point test was still a draft when proposed in the agency’s rulemaking notice, but is now a final international standard.45
The test procedures evaluated by the agency did not change between the draft and final versions of the standard.
44 See NHTSA Rolling Resistance Rating System Test Development Project: Phase 1 – Evaluation of Laboratory Test Protocols (October 2008). A copy of this report and other research reports relied on in this proposal will be placed in the docket. 45 On June 24, 2009, the ISO 28580 was adopted as a final international standard (Stage 60.60: “International Standard published”). See http://www.iso.org/iso/iso_catalogue/catalogue_tc/catalogue_detail.htm?csnumber=44770.
39
C. NHTSA Phase 2 Research The purposes of the NHTSA Phase 2 testing were to explore relationship between tire rolling resistance and safety & fuel economy measures in terms of traction and treadwear, as shown below46
• NHTSA San Angelo Outdoor Testing. In the test facility, the standard UTQG treadwear and traction tests were conducted. In addition, additional wet & dry traction test were conducted
:
• Smithers Indoor Laboratory Testing. Tires were tested indoor for their indoor dry traction and indoor treadwear rate.
• EPA Dynamometer Fuel Economy Testing. Tires were test to determine effects of 16 tire groups on a single vehicles economy rating. Additionally, effects of placard and low tire pressure on vehicles fuel economy were studied.
The Phase 1 test program utilized an assortment of approximately 600 new tires of 25 different models. Fifteen tire models were passenger, nine were light truck tire models, and one was the ASTM F2493-06 P225/60R16 97S Standard Reference Test Tire (SRTT). As discussed, only the 16 tire models covered by the EISA requirements were tested in Phase 2. This includes the DOT labeled ASTM SRTT tire and the original equipment tires that came on the fuel economy test vehicle.
C.1 Test Tires used in Phase 2 Research
Fifteen DOT-approved passenger tire models were purchased new for testing. Their specifications are detailed in Table III-3. The passenger tires were separated into three axes in the test program:
C.2 Passenger Tire Models
46 For additional discussion, see DOT HS 811 154, National Highway Traffic Safety Administration, NHTSA Tire Fuel Efficiency Consumer Information Program Development: Phase 2 – Effects of Tire Rolling Resistance Levels on Traction, Treadwear, and Vehicle Fuel Economy (August 2009), docket entry NHTSA-2008-0121-0035.

40
Figure III-11. Passenger Tire Axes
When possible, tires were tested on wheels of the corresponding “measuring rim width” for their size. Wheels of each size used in the test program were purchased new, in identical lots to minimize wheel-to-wheel variation. Tires participating in multiple tests at the same lab or between two labs were mounted once on a single wheel and continued to be tested on that same wheel until completion of all tests.
C.3.1. Traction Data Analysis
C.3 Statistical Analysis of Phase 2 Test Results
Sixteen tire models representing a range of rolling resistance and of other characteristics were tested for both dry and wet traction by NHTSA. Data is reported as Slide Number (coefficient of friction x 102) and as a ratio to the course monitoring tire (ASTM E501 Standard Reference Test Tire), which is run along with the test tires. The coefficient of variation for the data ranged from 4% to 6%. There appears to be no significant relationship between dry traction values and rolling resistance for the tires studied. For wet traction there is a significant trend for the wet traction values to decrease as the rolling resistance improves. This is particularly evident for the sliding friction values.
C.3.1.1. Dry Traction Data
Table III-9 shows the average Slide Number, and its ratio to the E501 tire. Table III-10 shows the Pearson Product Moment Correlation of the values for dry traction to the tire rolling resistance. The Pearson value indicates the strength and direction of the correlation with values ranging from -1 for complete inverse correlation, to +1 for complete direct correlation, with values near zero indicating no correlation between the
1 Mfg. - Goodyear 4 Sizes 1 Model - Integrity + 1 Runflat
1 Mfg. - Bridgestone 1 Size - P225/60R16 6 Tire Models
4 Mfg. 1 Size - P225/60R16 1 Speed Rating - H
G9 P205/75R14 S G10 P205/75R15 S G8 225/60R16 S G11 P225/60R17 S
M14 Reference Tire ASTM SRTT S
B11 Potenza RE-92A H
B14 Turanza LS-V
B10 Blizzak REVO 1 Q
B12 Potenza RE750 W
B13 Turanza LS-T
B15 Winterforce S
M13 Michelin Pilot MXM4 H
P5 Pep Boys Touring HR
D10 Cooper Lifeliner Touring SLE H
R4 Pirelli P6 Four Seasons H
U3 P225/60R17 T
Axis #2
Axis #3
Axis #1

41
measures. It is evident that there is very little correlation between the traction and rolling resistance for these tires. For a value to be statistically significant the probability > |r| would have to be less than 0.050, and no value approaches that number. Figure III-12 and Figure III-13 display clearly that there is no indication that a tire with improved rolling resistance will necessarily have lower dry traction performance in this test.

42
Table III-9. Dry Traction Results, Slide Number and Ratio to E501 Reference Tire
Tire Type
ISO 28580 Rolling
Resistance, lbs
Traction Asphalt Concrete
Peak Value Sliding Value Peak Value Sliding Value Slide
Number Ratio E501
Slide Number
Ratio E501
Slide Number
Ratio E501
Slide Number
Ratio E501
B10 12.02 93.83 94 77.65 127 96.45 91 86.63 107 B11 10.13 94.77 96 60.73 98 101.12 93 74.43 91 B12 15.22 103.90 106 56.33 89 108.18 102 71.95 88 B13 15.01 94.87 94 57.63 96 91.93 88 76.42 98 B14 13.90 101.50 102 75.76 125 107.58 100 85.02 106 B15 13.99 90.64 92 66.99 107 91.93 86 75.42 97 D10 13.56 94.60 95 62.10 101 102.71 96 74.77 94 G10 12.09 98.53 96 74.00 101 102.07 94 78.39 97 G11 10.02 97.45 99 64.66 93 104.07 96 75.95 93 G8 9.83 94.41 95 65.95 110 93.25 88 75.31 95 G9 11.27 98.25 98 74.16 109 102.20 95 78.82 97
M13 12.07 100.12 101 53.75 82 105.62 97 69.66 85 M14 11.96 99.53 101 66.67 104 105.50 97 81.70 100 P5 14.02 95.61 95 56.97 96 94.63 90 71.52 92 R4 14.98 104.19 106 71.13 112 107.86 103 84.38 104 U3 13.91 91.75 94 67.23 108 100.22 93 79.71 103
E501 - 99.23 100 63.48 100 107.15 100 80.32 100 Table III-10. Pearson Product Moment Correlation of Dry Traction to Rolling Resistance
Correlation to ISO 28580
Rolling Resistance
Pearson Product Moment Correlation Asphalt, Dry Traction Concrete, Dry Traction
Peak Value Sliding Value Peak Value Sliding Value Slide
Number Ratio E501
Slide Number
Ratio E501
Slide Number
Ratio E501
Slide Number
Ratio E501
0.209 0.200 -0.158 0.045 0.056 0.209 0.069 0.217 Probability > |r| 0.2518 0.2730 0.3886 0.8073 0.7602 0.2507 0.7059 0.2336
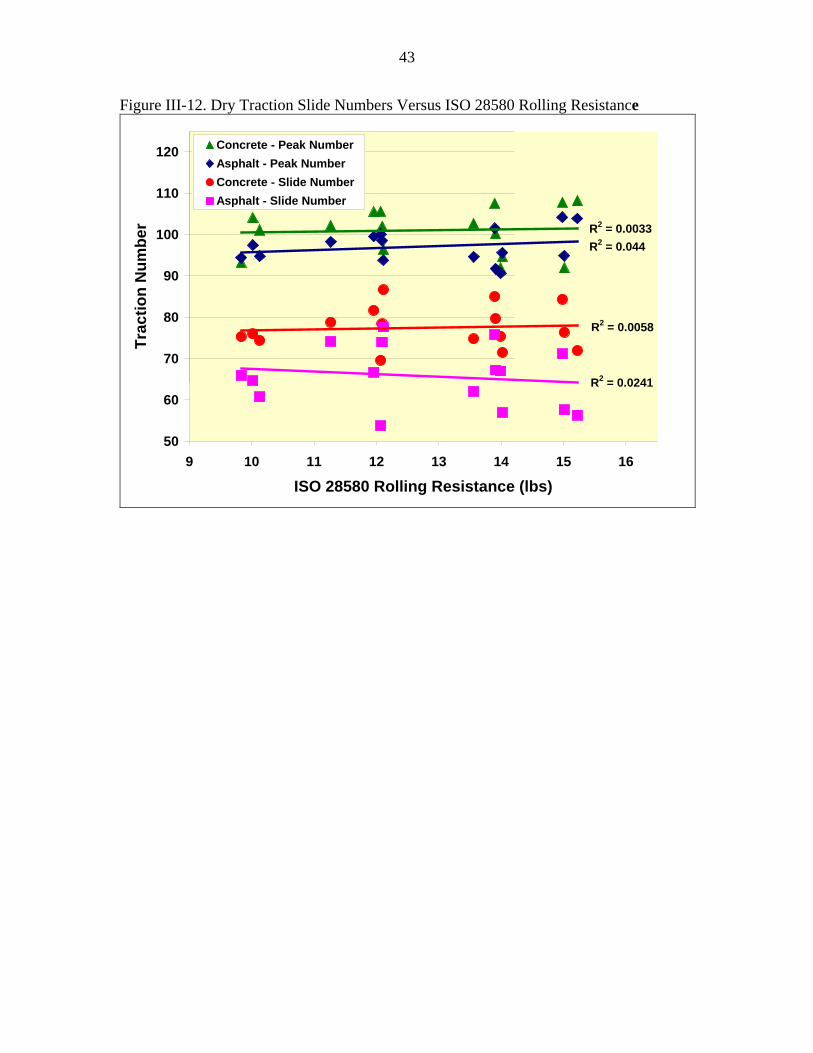
43
Figure III-12. Dry Traction Slide Numbers Versus ISO 28580 Rolling Resistance
R2 = 0.0033R2 = 0.044
R2 = 0.0058
R2 = 0.0241
50
60
70
80
90
100
110
120
9 10 11 12 13 14 15 16
ISO 28580 Rolling Resistance (lbs)
Trac
tion
Num
ber
Concrete - Peak NumberAsphalt - Peak NumberConcrete - Slide NumberAsphalt - Slide Number

44
Figure III-13. Dry Traction Ratio to E501 Course Monitoring Tire Versus Rolling Resistance
R2 = 0.0003R2 = 0.047R2 = 0.0445R2 = 0.0469
75
85
95
105
115
125
135
9 10 11 12 13 14 15 16
ISO 28580 Rolling Resistance (lbs)
Rat
io to
AST
M E
501
Valu
eAsphalt - Slide Ratio
Concrete - Slide Ratio
Asphalt - Peak Ratio
Concrete - Peak Ratio
C.3.1.2 Wet Traction Measurements
Table III-11 shows the average Slide Number, and its ratio to the E501 tire for the wet traction testing. Table III-12 shows the Pearson Product Moment Correlation of the values for wet traction to the tire rolling resistance. The Pearson value indicates the strength and direction of the correlation with values ranging from -1 for complete inverse correlation, to +1 for complete direct correlation, with values near zero indicating no correlation between the measures. For a value to be statistically significant the probability > |r| should be less than 0.050. The sliding values all have a strong and significant relationship between better rolling resistance and poorer wet traction. The peak values display the same tendency but the relationship is much weaker. Figure III-14 and Figure III-15 display these trends graphically for the Slide Numbers and the ratio to the E501 monitoring tire respectively. Even though these tires were not new, having been previously tested for rolling resistance in the laboratory, the UTQGS procedure was used for this testing and the results should display the same trends seen in new tires. The UTQGS traction rating is based on the wet sliding value on asphalt and concrete. Figure III-16 displays the wet traction slide number with the critical values to achieve an A or AA traction rating. Figure III-17 displays the data for the concrete surface. While most of these tires were labeled A for traction and tested as such, it is clear that the values increase within the range as rolling resistance increases. From these data, it appears that there tires with lower rolling resistance values will have poorer wet traction performance. This will be particularly significant to consumers without ABS systems on their vehicles
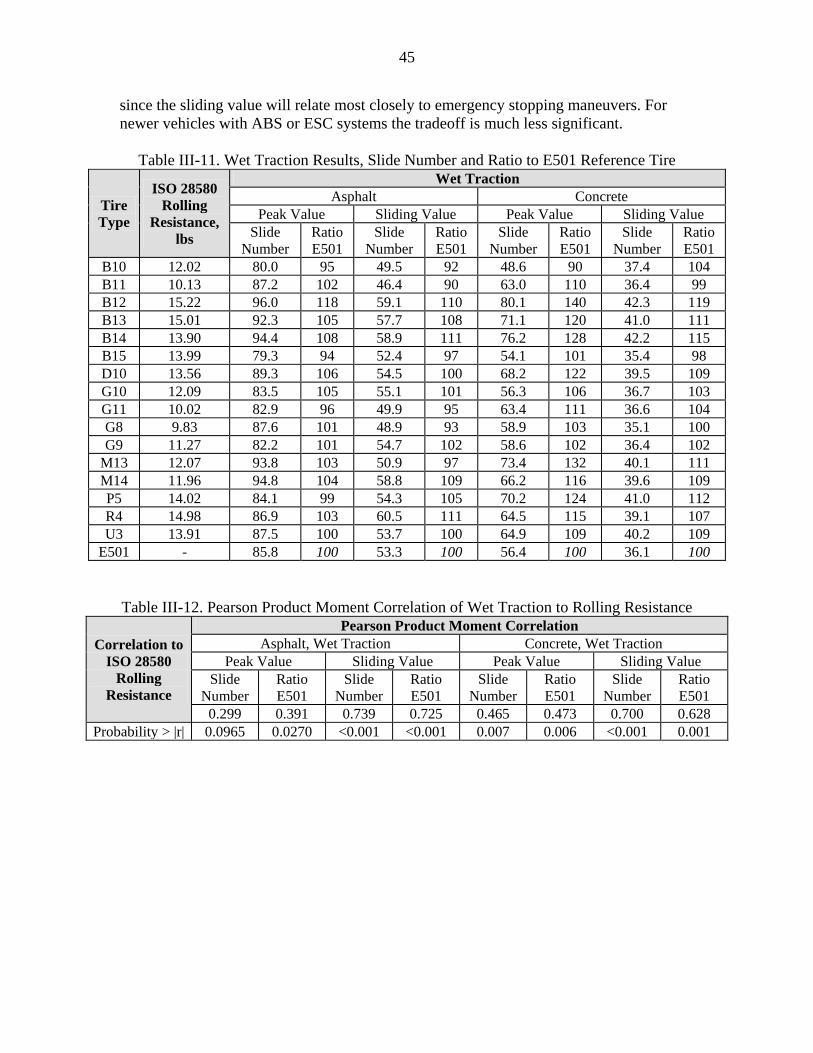
45
since the sliding value will relate most closely to emergency stopping maneuvers. For newer vehicles with ABS or ESC systems the tradeoff is much less significant.
Table III-11. Wet Traction Results, Slide Number and Ratio to E501 Reference Tire
Tire Type
ISO 28580 Rolling
Resistance, lbs
Wet Traction Asphalt Concrete
Peak Value Sliding Value Peak Value Sliding Value Slide
Number Ratio E501
Slide Number
Ratio E501
Slide Number
Ratio E501
Slide Number
Ratio E501
B10 12.02 80.0 95 49.5 92 48.6 90 37.4 104 B11 10.13 87.2 102 46.4 90 63.0 110 36.4 99 B12 15.22 96.0 118 59.1 110 80.1 140 42.3 119 B13 15.01 92.3 105 57.7 108 71.1 120 41.0 111 B14 13.90 94.4 108 58.9 111 76.2 128 42.2 115 B15 13.99 79.3 94 52.4 97 54.1 101 35.4 98 D10 13.56 89.3 106 54.5 100 68.2 122 39.5 109 G10 12.09 83.5 105 55.1 101 56.3 106 36.7 103 G11 10.02 82.9 96 49.9 95 63.4 111 36.6 104 G8 9.83 87.6 101 48.9 93 58.9 103 35.1 100 G9 11.27 82.2 101 54.7 102 58.6 102 36.4 102
M13 12.07 93.8 103 50.9 97 73.4 132 40.1 111 M14 11.96 94.8 104 58.8 109 66.2 116 39.6 109 P5 14.02 84.1 99 54.3 105 70.2 124 41.0 112 R4 14.98 86.9 103 60.5 111 64.5 115 39.1 107 U3 13.91 87.5 100 53.7 100 64.9 109 40.2 109
E501 - 85.8 100 53.3 100 56.4 100 36.1 100 Table III-12. Pearson Product Moment Correlation of Wet Traction to Rolling Resistance
Correlation to ISO 28580
Rolling Resistance
Pearson Product Moment Correlation Asphalt, Wet Traction Concrete, Wet Traction
Peak Value Sliding Value Peak Value Sliding Value Slide
Number Ratio E501
Slide Number
Ratio E501
Slide Number
Ratio E501
Slide Number
Ratio E501
0.299 0.391 0.739 0.725 0.465 0.473 0.700 0.628 Probability > |r| 0.0965 0.0270 <0.001 <0.001 0.007 0.006 <0.001 0.001

46
Figure III-14 Wet Traction Slide Numbers Versus ISO 28580 Rolling Resistance
R2 = 0.0875
R2 = 0.2116
R2 = 0.5511
R2 = 0.5035
30
40
50
60
70
80
90
100
110
9 10 11 12 13 14 15 16
ISO 28580 Rolling Resistance (lbs)
Trac
tion
Num
ber
Asphalt - Peak NumberConcrete - Peak NumberAsphalt - Slide NumberConcrete - Slide Number

47
Figure III-15. Wet Traction Ratio to E501 Course Monitoring Tire Versus Rolling Resistance
R2 = 0.2273
R2 = 0.4133R2 = 0.524R2 = 0.1657
85
95
105
115
125
135
145
9 10 11 12 13 14 15 16
ISO 28580 Rolling Resistance (lbs)
Rat
io to
AST
M E
501
Valu
eConcrete - Peak RatioConcrete - Slide RatioAsphalt - Slide RatioAsphalt - Peak Ratio

48
Figure III-16. Asphalt Wet Traction Rating Versus ISO 28580 Rolling Resistance
R2 = 0.5175
0.37
0.42
0.47
0.52
0.57
9 10 11 12 13 14 15 16
ISO 28580 Rolling Resistance (lbs)
Adj
uste
d Tr
actio
n C
oeffi
cien
t (M
u a)
AA
Tra
ctio
n G
rade
A T
ract
ion
Gra
deB
Tra
ctio
n G
rade
Figure III-17 Concrete Wet Traction Rating Versus ISO 28580 Rolling Resistance
R2 = 0.405
0.25
0.27
0.29
0.31
0.33
0.35
0.37
0.39
0.41
0.43
9 10 11 12 13 14 15 16
ISO 28580 Rolling Resistance (lbs)
Adj
uste
d Tr
actio
n C
oeffi
cien
t (M
u c) AA
Tra
ctio
n G
rade
A
Trac
tion
Gra
de
B T
ract
ion
Gra
de

49
There was not a good correlation between the rolling resistance and the UTQGS treadwear grade of the tires studied. Four tire models which were selected to represent the range of rolling resistance of the models studied, along with the SRTT (tire type M14), were tested by NHTSA according to the UTQGS testing protocol for treadwear. Although these tires were previously tested for rolling resistance in a laboratory, the wear rates and projected mileages are expected to be similar to those for new tires of the same model. Measurements were taken across the tire at six locations in each groove (1 through 4). Data were analyzed by tire type, by groove, by shoulder (groove 1&4) or tread center (groove 2&3). The coefficients of variation for the wear rates are approximately 0.5% for all tire types indicating that comparisons between tire types at these conditions are reliable. Models for the wear rate against course mileage produced R2 values of 0.94 to 0.97 for linear models and 0.98 to 0.99 for quadratic models. For all tire types except B13 the quadratic term was statistically significant, indicating that the wear rate tends to change (either increase or decrease) as the tire wears.
C.2 Analysis of Wear Data from UTQGS Course
Table III-13. Analysis of Tire Wear Data
Tire Type Coefficient of Variation
Groove 1 to 4 Shoulder Versus Tread Center
Non-Linear Behavior
B11 0.30% Groove 1 shows faster wear rate47
Shoulder wear rate faster than tread
center Wear rate tends to
increase
B13 0.44% - Similar wear rates No change in wear rate
G8 0.51% Groove 4 shows slower wear rate48 Similar wear rates
Wear rate tends to increase
M13 0.54% - Tread center wear
rate faster than shoulder
Wear rate tends to decrease
M14 0.43% - Tread center wear
rate faster than shoulder
Wear rate tends to decrease
Table III-14 shows the treadwear rates and projected mileage to 2/32nds tread depth for the tires. For each model the wear rates for the shoulder and tread center were compared along with the projected lifetime for each area. For tire type B11 the wear rate in the shoulder area was significantly faster than the wear rate in the tread center with a corresponding decrease in projected mileage. For tire type M14 the wear rate in the tread center was significantly faster than in the shoulder area with significantly shorter projected tread life in this area. Tire type M13 had faster wear rates in the tread center but this was partially offset by a lesser groove depth in the tread center. Figure III-18 shows the projected average tire mileage to wear out and the minimum projected mileage, versus the rolling resistance for the tire. From these data, there is no relationship between
47 Data was influenced by high wear rate of tire #3146. The other B11 tires showed no anomalous behavior for individual grooves 48 All type G8 tires showed anomalous behavior for groove 4

50
expected tire lifetime and rolling resistance. Since the tread depth may affect both rolling resistance and tire lifetime the average wear rate and the fastest wear rate, either from the shoulder or tread center area, was compared to the rolling resistance. It is evident from Figure III-19 that there is no clear relationship between wear rate and rolling resistance for these tires. In summary, there is no evidence from this data that a tire with reduced rolling resistance will necessarily have reduced tread life.
Table III-14. Wear Rates and Projected Mileage to 2/32nds Tread Depth from UTQGS
Treadwear Course Performance Level
Tir
e T
ype
Rol
ling
Res
ista
nce,
Rep
orte
d W
ear
Rat
e,
mil/
1000
mi
Proj
ecte
d T
read
Life
, m
iles
Wea
r R
ate
in
Shou
lder
, m
il/10
00m
i W
ear
Rat
e in
T
read
Cen
ter,
m
il/10
00m
i
Proj
ecte
d L
ife,
mile
s (S
houl
der)
Proj
ecte
d L
ife,
mile
s (T
read
C
ente
r)
High performance all season B11 10.13 5.155 54,840 5.752 4.528 48,550 63,200 Standard touring all season B13 15.01 6.463 52,020 6.374 6.276 51,790 54,540 Passenger all season G8 9.83 6.447 45,390 6.211 6.471 46,460 45,840 Grand touring all season M13 12.07 5.448 41,310 4.795 5.768 45,150 40,500 Standard reference test tire M14 11.96 5.558 45,000 4.359 6.449 56,730 39,230
Figure III-18. Projected Tire Mileage to Wearout (Average and Minimum) Versus ISO
28580 Rolling Resistance
UTQG Course Wear Versus Rolling Resistance
35,000
40,000
45,000
50,000
55,000
60,000
9 10 11 12 13 14 15 16
ISO 28580 Rolling Resistance, pounds
Proj
ecte
d Li
fetim
e, m
iles
Average MilesMinimum Miles

51
Figure III-19 Average and Fastest Treadwear Rate Versus ISO 28580 Rolling Resistance
Wear Rates Versus Rolling Resistance
5
5.2
5.4
5.6
5.8
6
6.2
6.4
6.6
9 10 11 12 13 14 15 16ISO 28580 Rolling Resistance, pounds
Wea
r Rat
e, m
ils /
1000
mile
s
AverageFastest
C.3. Comparison of Rolling Resistance Force by Performance Levels When the rolling resistance results from passenger tires were compared by performance levels, tires designed for passenger cars for all seasons, “Passenger All Seasons” showed a relatively large difference among all season tires. It ranges from 9.84 lbs for the Goodyear tire to 14.98 lbs. for the Pirelli tire, as shown in Table III-15 and Figure III-20. When compared to all season tires, the Performance Winter (winter tires) and the Grand Touring had a relatively small difference in rolling resistance force, 4.19 & 5.15 lbs. versus 1.97 lbs. for the Performance Winter and 1.83 lbs. for the Grand Touring. The results in Table III-16 indicated that the rolling resistance of a tire could be reduced without adversely affecting the performance.

52
Table III-15. Comparison of Rolling Resistance Force (lbs.) by Performance Levels
Performance Winter Model RRF RRF Difference Bridgestone Blizzak REVO1 12.02 Dayton Winterforce 13.99 1.97 Passenger All Seasons Goodyear Passenger All Seasons 9.83 Pep Boys Touring HR 14.02 4.19 Pirelli Passenger All Seasons 14.98 5.15 Grand Touring Bridgestone Grand Touring All Seasons 13.90 1.83 Michelin Pilot MXM4 12.07
Comparison Between Performance Levels
12.0213.99
9.83
14.02 14.9813.90
12.07
0.002.004.006.008.00
10.0012.0014.0016.00
Brid
gest
one
Bliz
zak
REV
O1
Day
ton
Win
terfo
rce
Goo
dyea
r Pas
seng
er A
llSe
ason
s
Pep
Boys
Tou
ring
HR
Pire
lli Pa
ssen
ger A
llSe
ason
s
Brid
gest
one
Gra
ndTo
urin
g Al
l Sea
sons
Mic
helin
Pilo
t MXM
4
RR
For
ce
Figure III-20. Comparison between performance levels for passenger tires.
C.4 Fuel saving vs. rolling resistance We expect a significant increase in fuel economy as tire rolling resistance improves. Data presented in the PRIA indicated that according to NHTSA dynamometer testing, a 10 percent reduction in rolling resistance results in a 1.1 percent improvement in vehicle fuel economy, as shown below:

53
Table III-16 Reduction in RR force vs. Fuel Saved – Data from PRIA
Test Increase for 1 lb RR force decrease
Increase for 10% RR force decrease
Highway cycle 0.33 mpg 1.1% City Cycle 0.18 mpg 1.0%
High Speed Cycle 0.23 mpg 1.3% Cold City Cycle 0.17 mpg 1.1%
Air Conditioning Cycle 0.13 mpg 0.8% For example, when Bridgestone Grand Touring All Season tire (P225/60R16) is replaced by Michelin Grand Touring All Season tire (225/60R16), it would result in a 13% reduction in rolling resistance force. The 13% reduction in RR force would result in a 1.4% improvement in fuel economy.49
Comments Concerning Underestimation of Benefits NRDC and ICCT felt that benefits were underestimated, since NHTSA incorrectly applied the results of NHTSA’s fuel economy tests in its fuel savings calculation. NRDC and ICCT felt that: When the tires were changed to measure the fuel economy impact of tire rolling resistance the dynamometer load curve was not changed to reflect the benefits of improved rolling resistance from the rear wheels. Thus, both NRDC and ICCT felt that NHTSA’s estimate that a 10% reduction in rolling resistance increases mpg by 1.1% understates fuel savings by about 40% because of how NHTSA conducted the dynamometer test. The following from ICCT’s comment, illustrates their and NRDC’s concern:
We believe that NHTSA may have underestimated the benefits of the rule due to an incorrect assessment of the impact of reduced rolling resistance on fuel economy. Table III-16 on page 56 of NHSTA-2008-0121-0015.11 [sic] shows a 1.0% improvement on the city cycle and a 1.1% improvement on the highway cycle with a 10% reduction in rolling resistance. Figure 3.1 of the National Academy of Sciences report indicates that about one-third of useful energy delivered to the wheels is used to overcome rolling resistance for the example vehicle, indicating that the estimated 1-2% range of improvements estimated by the NAS for a 10% improvement in rolling resistance may be conservative. Our understanding is that NHTSA used a “Phase 2” testing program using a two-wheeled dynamometer to calculate the impact of tire rolling resistance on fuel economy at 1% and 1.1% for city and highway driving respectively. According to Consumer Reports, the 2008 Impala used for
49 For example, with a 25 mph baseline, 10,000 miles travel per year, with 13% reduction in RRF, the resulting fuel saving can be calculated with the following equation: 10,000 x [1/25 – 1/(25x(1+((0.13/0.1)x0.011))] = 5.6 gallons. The effects of RRF on fuel economy are further discussed in Chapter V.
54
the testing has 61% of its total weight on the drive wheels. That means that the testing for Phase 2 would only capture the effect of 61% of the on-road tire rolling resistance. The other 39% from the rear wheels is incorporated into the dynamometer load curve. When the tires were changed to measure the fuel economy impact of tire rolling resistance, our understanding is that the 39% contribution from the rear wheels contained in the dynamometer load curve was not changed to reflect the benefits of improved rolling resistance from the rear wheels. If this occurred, the benefits may be underpredicted by about 40% for similar front-wheel drive vehicles and perhaps more for rear-wheel drive. We recommend that NHSTA [sic] re-assess this test method to make sure that the benefits of this important proposed program are properly understood.
ICCT and NRDC also felt that NHTSA needed to clarify how it conducted the dynamometer testing. NHTSA’s Response: NHTSA agrees with commenters that the effect of tire rolling resistance on vehicle fuel economy used in the NPRM and PRIA were underestimated. In response to the ICCT comments, we examined vehicle coastdown data and analyzed the affects on the fuel economy dynamometer coefficients vs. changes in tire rolling resistance. We integrated these effects over the whole fuel economy cycle. From this data we estimate that total fuel consumption vis-à-vis rolling resistance was underestimated by approximately 20% for all non-OE tires (not the 60% claimed by the ICCT). Thus, we now believe that that a 10% reduction in rolling resistance increases mpg by 1.3%, as compared to the 1.1% we estimated in the PRIA. The vehicle fuel economy test dynamometer applies a “road load” (i.e. braking) force to compensate for the rear tires and aerodynamics (the car is stationary during the test and only the front wheels are rotated). The amount of the force applied is calculated from actual vehicle coast-downs on the test track and applied to a complex equation for inertia, friction (including rolling resistance of the rear tires), and wind resistance as a function of speed. As ICCT and NRDC pointed out, when we increased the rolling resistance of the tires we should have increased the braking force on the dynamometer which would have increased fuel consumption. This is only true for the rolling resistance part of the equation which dominates near 40 kph; below 10 kph the inertia term dominates and above 100 kph the aerodynamic term dominates. We have a second track test on the vehicle using tires with higher rolling resistance and from that can calculate the increased force versus the time/speed of the test and by integrating the areas under the curves determine the amount of the force that should have been applied versus what was actually applied. From that we estimate the increased amount of fuel that would have been consumed.

55
Since issuance of the NPRM, the Tire Rack has published a study of on-road vehicle fuel economy for a 2009 Toyota Prius using seven different tire models.50 Using the fuel economy results from the Prius, and the available tire rolling resistance data from other sources51
for five of the seven tire models, there was an approximate 1.38 percent improvement in fuel economy for a 10 percent decrease RRF (slightly higher than the agency’s new estimate of 1.3 percent).
C.5 Summary of Phase 2 tests The wet condition test results showed that the wet traction slide number with the critical values to achieve an A or AA traction rating. While most of these tires were labeled A for traction and tested as such, it is clear that of the tires tested the wet traction values decrease as rolling resistance decreases. This will be particularly significant to consumers without ABS systems on their vehicles since the sliding value will relate most closely to emergency stopping maneuvers. However, for newer vehicles with ABS or ESC systems the tradeoff is much less significant. The treadwear test data showed that there is no relationship between expected tire lifetime and rolling resistance. Since the tread depth may affect both rolling resistance and tire lifetime the average wear rate and the fastest wear rate, either from the shoulder or tread center area, was compared to the rolling resistance. The test data showed that there is no clear relationship between wear rate and rolling resistance for these tires. In summary, there is no evidence from this data that a tire with reduced rolling resistance will necessarily have reduced tread life.
50 See http://www.tirerack.com/tires/tests/testDisplay.jsp?ttid=121 (last accessed Oct. 12, 2009). 51 RMA & ExxonMobil comments to the tire rolling resistance docket.

56
IV ALTERNATIVES There were two areas in which the agency considered alternative regulatory approaches. These alternatives include: Rolling Resistance measurement Data presentation
Rolling Resistance Force (RRF) vs. Rolling Resistance Coefficient (RRC)
Rolling resistance force is simply the manifestation of all of the energy losses associated with the rolling of a tire under load. Accordingly, in a laboratory, rolling resistance is measured by running a tire under load on a test wheel (referred to as “roadwheel”). The energy consumed in driving the tire is measured and the energy recovered from the tire is measured by the test equipment. The difference is the heat energy lost which is the measure of rolling resistance; the smaller the difference, the more fuel efficient the tire. NHTSA is only interested in the force required to maintain a steady state of movement, i.e., speed. Therefore the steady state, or constant, speed test methods are the only ones considered by NHTSA. Rolling resistance coefficient (RRC) is another measurement of rolling resistance sometimes specified in a test method. To determine RRC, the rolling resistance force (RRF) determined from the test machines must be divided by the load at which the test was performed. RRC is discussed in greater detail below in section V of this notice. Figure IV-1 shows a typical laboratory test machine for measuring rolling resistance. In this test a tire and rim are mounted on the machine. The tire is held against the roadwheel by an actuating cylinder aligned with the center of the roadwheel. A drive motor coupled to the roadwheel rotates the roadwheel. Consequently, the roadwheel drives the tire through friction at the contact patch. The tire’s rolling resistance retards the roadwheel’s rotation speed. This effect is then measured using any combination of the forces, torques, speeds, or acceleration of the roadwheel. Then the rolling resistance is calculated from the measured quantities. A tire’s rolling resistance is the energy consumed by a rolling tire, or the mechanical energy converted into heat by a tire, moving a unit distance on the roadway. The magnitude of rolling resistance depends on the tire used, the nature of the surface on which it rolls, and the operating conditions – inflation pressure, load, and speed. Id.

57
Electric Motor
Test drum
Tire on wheel Actuating cylinderElectric Motor
Test drum
Tire on wheel Actuating cylinderElectric Motor
Test drum
Tire on wheel Actuating cylinder
Figure IV-1. Typical Test Configuration for Rolling Resistance Measurements
Four measurement methods of energy loss are in common use and prescribed in test procedures, although not all of the methods are advocated in every standard.52 The methods described in the test standards include the following: measurement of the resistive force at the tire spindle while rolling at constant speed (force method), measurement of the resistive torque on the roadwheel hub at constant speed (torque method), measurement of the electrical power used by the motor to keep the roadwheel rotating at a constant speed (power method), and measurement of deceleration when the driving force at the roadwheel is discontinued (deceleration method).53
The two methods evaluated in NHTSA research were the force and torque methods. Therefore deceleration and power methods are not discussed.
1.1.1
The force method measures the force at the tire spindle. See Figure IV-2. The roadwheel is brought up to the specified test speed and the tire is warmed up (warm-up) to an equilibrium temperature. The tire is then lightly loaded
Force Method
54
52 The proposed test procedure, ISO 28580, has provisions to use all four methods to measure the energy loss.
to measure the losses caused by the spindle holding the tire and aerodynamic losses from the tire spinning. This force measurement is referred to as the skim load value. The tire is then loaded to the test load
53 National Highway Traffic Safety Administration, The Pneumatic Tire, DOT HS 810 561, at 515 (February 2006). 54 Lightly loaded is not a specific number of pounds, but just enough load to keep the tire in contact with the roadwheel, so that the speed of the tire is equal to the speed of the roadwheel surface so there is no slippage.

58
and successive readings of the resistive force at the tire spindle while rolling at constant speed are taken until consistent force values are obtained.55
Figure IV-2. Force Method Rolling Resistance
The reported force value is equal to the measured force at the spindle minus the skim load value, thereby reporting actual Rolling Resistance Force (RRF) value of the tire. This force is trying to slow down the rotation or travel of the roadwheel due to the energy loss.
1.1.2
The torque method measures the energy, or torque, required to maintain the rotation of the roadwheel. The roadwheel is connected to the motor through a “torque cell.” See Figure IV-3. The roadwheel is brought up to speed and the tire is warmed up (warm-up) to an equilibrium temperature. The tire is then lightly loaded to measure the losses caused by the spindle holding the tire and aerodynamic losses from the tire spinning (skim load value). The tire is then loaded to the test load and successive readings of the resistive torque on the roadwheel hub at constant speed are taken until consistent force values are obtained.
Torque Method
55 As the machinery ramps up the tire speed to the specified test speed, the force values measured bounce around at first. An accurate measurement can only be taken when the tire is moving at a constant speed and is at a constant temperature. Thus, there is a slight delay from ramping up to the specified test speed, and the measurement of an accurate and steady force reading.
RRF = Rolling Resistance Force
1.7 meter Roadwheel
FX = Measured Spindle Force

59
Figure IV-3. Torque Method Rolling Resistance
The values measured for skim and loaded torque must be processed to determine the force (RRF). The skim must be subtracted from the loaded torque value divided by the radius of the roadwheel to determine the tires contribution to the total loss. The result is Rolling Resistance Force (RRF). The output of the rolling resistance test machines is used to calculate the rolling resistance force (RRF) in pounds of force (lbf) or Newtons (N) at the interface of the tire and drum, or the force at the axle in the direction of travel required to make a loaded tire roll. Rolling resistance is often expressed and reported in terms of Rolling Resistance Coefficient (RRC) (N/kN, kg/tonne, lbf/kip), which is the rolling resistance force divided by the test load on the tire.56 Since rolling resistance changes with the load on the tire, this makes direct comparisons between the tires tested at different loads difficult. The pending European rating system uses RRC as the metric for a rolling resistance rating/score. It has been offered that the European decision makers were never presented with RRF data by the tire industry during development of their system, only RRC, and therefore never compared the two metrics.57
Therefore, the agency was unable to compare its rationales for choosing RRF vis-à-vis EU decisions.
However, based on the large number of comments received on this issue, and to retain flexibility to use what the agency learns about consumer comprehension from the future consumer research, NHTSA will defer a decision on which rolling resistance metric should be used for the fuel efficiency rating and consider that matter further in the future supplemental NPRM and final rule that will finalize the consumer information and education portions of the program. To aid in guiding further discussion, we have analyzed some of these issues below. But the agency will reach no conclusion in this rulemaking, and will discuss the rolling resistance rating metric further in the supplementary notice of proposed rulemaking. 56 Most test procedures specify test load as a percentage of the maximum load rating of the tire being tested. For example, the ISO 28580 test procedure specifies a load of 80% of the maximum sidewall load. 57 http://energy.ca.gov/transportation/tire_efficiency/documents/2009-02-05_workshop/2009-02-05_TRANSCRIPT.PDF
Motor
Torque Cell 1.7 meter roadwheel
80 grit Surface
T = torque

60
1.1.3
The concept of rolling resistance coefficient (RRC) stems from the fact that, ignoring vehicle inputs, the equilibrium (i.e., fully warmed up) rolling resistance of a new radial tire varies primarily with applied load, inflation pressure, and speed. Investigations such as those by Clark et al. during the 1970s indicated that the equilibrium tire rolling resistance of radial passenger tires was not linear with pressure or speed, but did appear linear with load. In the 1979 handbook prepared for the U.S. Department of Transportation, Clark and Dodge explain the concept and application of the rolling resistance coefficient
Theory of RRF and RRC
58
:
“In all four of these sets of data (two bias and two radial tire models) the linear relationship between load and rolling resistance is very close, and further, to a very close approximation the rolling resistance vanishes at zero load, with a straight line drawn through the data points nearly intersecting the origin of rolling resistance and load. … The linear nature of the equilibrium rolling resistance as a function of load is apparently fortuitous, but is well known and has led to the common and very useful concept of the coefficient of rolling resistance, which is defined as the rolling resistance divided by the load carried.”
In their paper, the authors continue on to explain how the rolling resistance coefficient can be used to evaluate different tires for a known vehicle59
:
“The coefficient of rolling resistance is a convenient concept since it allows one to compare various tires for use on the same vehicle. The load carried by a tire will be the same on a given vehicle in a given tire position, so a comparison of the rolling resistance coefficients will show which tire is the most efficient for a given application. On the other hand, tests of tire rolling resistance are usually carried out at the tire rated load or at some relatively large fraction of it, such as 80 percent of tire rated load. Direct presentation of the rolling resistance under these conditions is dependent on the load carried by the tire, which, of course, varies for different tire sizes. Hence, the concept of the coefficient is a generalizing and extremely useful one for both the presentation and interpretation of data.”
Therefore, the concept of rolling resistance coefficient (RRC) would appear advantageous when calculating the expected rolling resistance of a tire, or of tires of different load ranges or sizes, for “a given vehicle in a given tire position.
” The coefficient RRC transforms the “energy per unit distance” measure of RRF into terms of “energy per unit distance and unit load” on the tire. As stated earlier, no simple relationship exists between rolling resistance and pressure or speed that would allow the calculation of similar coefficients for these two inputs.
58. Clark & Dodge, p.7. 59. Clark & Dodge, p.7.

61
To determine the sensitivity of a tire’s rolling resistance to load and pressure, the first rolling resistance test standard, SAE J1269 (1979), evaluated tire rolling resistance over a range of three pressures and two loads at 80 km/h (50 mph) (Figure IV-4. ). For passenger tires, the two test loads are 50 and 90 percent60
of the maximum load limit of the tire. The combination of pressure and load conditions result in four discrete test points (TP 1 to TP 4). Skim loads are subtracted from each test point and the data is corrected while still in terms of RRF. If desired, the standard specifies an option to fit a least-squares regression model to the data, which uses separate equations for passenger, light truck, and highway truck and bus tires. The linear regression equation for passenger car tires is:
FR = FZ(A0+A1FZ+A2/p) FZ = Tire load (N [lbf])
p = Equilibrium inflation pressure (kPa [psi]) A0, A1, A2 = Coefficients
Equation IV-1. SAE J1269 Linear Regression Equation for Passenger Car Tires
Figure IV-4. SAE J1269 Recommended Test - Evaluates Response of Rolling
Resistance Force Over a Range of Three Pressures and Two Loads
60 90 percent of maximum rated tire load is a logical upper limit for test load, since FMVSS 571.110 requires that the vehicle normal load on a tire not exceed 94 percent of the rated load of the tire at the vehicle manufacturer’s recommended cold inflation pressure of the tire. For passenger tires installed on MPV, truck, bus, or trailers, the allowable rated load of the tire is reduced by 10 percent and the normal load must still not exceed the 94 percent of the de-rated load.
Pr+70 kPa
Pr -50 kPa capped
Load
TP 4
TP 3
TP 2
TP 1
Pr -30 kPa
Pressure
40% 50% 60% 70% 90%
Test Speed of 80 km/h [50 mph]
62
After determining the coefficients of the equation in J1269, a predicted rolling resistance can be calculated at any load and pressure.61
Equation IV-1
In the original SAE J1269, the RRC is determined by dividing the RRF by the corresponding test load on the tire. Since RRC is assumed to be a constant, any RRF, whether measured or predicted by the regression equation, can be used in the calculation. The latest version of SAE J1269 (2006) specifies a Standard Reference Condition (SRC), consisting of a single load and pressure, from which can be used to calculate a standard RRF and RRC. This latest version of the standard still recommends use of the multi-point test, but states that the test may be conducted at the single-point SRC conditions “which may be used for the purpose of high volume comparisons.”62
However, no version of J1269 states how RRC, whether determined from multi or single-point methods, is to be used.
ISO 18164 (1992-1998)63
specifies a rolling resistance test with a single load and single inflation condition, which can be run at either a single speed or three speeds. Annex B of the standard specifies optional test conditions for determining the speed and/or load and inflation sensitivity of a tire. The standard states:
“The rolling resistance of a tyre will vary with speed, load and inflation pressure, as well as other factors. Depending on the circumstances of particular tyre applications, it can be useful to determine the effect of these tyre-related parameters for the individual tyre to be tested. If such information is desired, the options indicated in (Annex) B.2 and B.3 are recommended.”
In Annex B.2 of ISO 18164, the speed sensitivity of passenger tires is evaluated at 50 km/h, 90 km/h and 120 km/h in sequence. In Annex B.3, the load and inflation sensitivity of passenger tires are evaluated at two loads, 50 and 90 percent of maximum load, and two pressures, +70 kPa and -30 kPa from the single-point pressure (Figure IV-5). Like the preceding SAE J1269, ISO 18164 subtracts skim loads and corrects the data in terms of RRF. Unlike J1269, 18164 does not contain an option in Annex B to fit a regression equation to data from multiple loads and pressures. If using the multi-point test conditions, a RRC must be determined from dividing a measured RRF by its corresponding test load. Again, since RRC is assumed to be a constant, any measured RRF can be used in the calculation. The ISO 18164 standard also does not state how RRC is to be used.
61 SAE J1269 (SEP, 2000, Sept.) p. 10 states: “The resulting regression equation may be used to calculate values for rolling resistance at loads and pressures other than those tested, but extrapolation far beyond the range of the test matrix, particularly for the region of high load and low pressure, is not advised.” 62. SAE (2006). J1269 - Surface Vehicle Recommended Practice for Rolling Resistance Measurement Procedure for Passenger Car, Light Truck, and Highway
Truck and Bus Tires. Issued 1979-11, Revised 2006-09, Superseding J1269 SEP2000, p. 5. Warrendale, PA: Society of Automotive Engineers. 63 ISO 18164 was issued in 2005 but states that it is a compilation of three older individual standards (ISO 8767:1992, ISO 9948:1992 and ISO 13327:1998), which have since been withdrawn.

63
Figure IV-5. ISO 18164 Annex B - Response of Rolling Resistance Force (RRF)
Over a Range of Three Speeds, Two Pressures, and Two Loads The later SAE J2452 (circa 1999) goes farther in continuously measuring rolling resistance over a stepwise speed coastdown from 115 to 15 km/h (71 to 9 mph). As with SAE J1269 and ISO 18164, J2454 recommends testing at a matrix of loads and pressures64
:
“In order to obtain a complete quantification of tire rolling resistance as a function of load, inflation pressure, and speed, the load/pressure matrices specified in 7.2.1 should be used. However, if needed, the stepwise coastdown can be performed for a single load/pressure condition.”
The first data reduction process uses a mathematical model to describe a tire’s rolling resistance as a function of load, inflation pressure, and speed. Interestingly, while the J2452 test includes a definition of RRC, it does not calculate RRC in the standard. Instead, the standard calculates a mean equivalent rolling force (MERF), which is the average rolling resistance of a tire at a load/inflation condition over a driving cycle with a specified speed-time profile. J2452 also allows calculation of a standard mean equivalent rolling force (SMERF) at a single-point reference condition (a single load, pressure, and speed).
64. SAE (2006). J2452 - Surface Vehicle Recommended Practice for Stepwise Coastdown Methodology for Measuring Tire Rolling Resistance. Issued 1999-06. p. 8. Warrendale, PA: Society of Automotive Engineers.
Pr+70 kPa
Load
TP 1 TP 3
Pr -30 kPa
Pressure
90%
TP 2 TP 4
50%
Test Speeds of 50 km/h, 90 km/h and 120 km/h

64
To save time and expense, the ISO 2858065
Figure IV-6 rolling resistance standard calculates rolling
resistance RRF at single load, pressure, and speed ( ). Subtraction of skim values and corrections are conducted with the data in the RRF format, then the rolling resistance coefficient (RRC) is determined by dividing the RRF by the nominal test load on the tire (Equation IV-2).
RRC = RRF/Lm
RRC = Rolling resistance coefficient (dimensionless) RRF = Rolling resistance in newtons Lm = Test load in knewtons
Equation IV-2. ISO 28580 Rolling Resistance Coefficient
Figure IV-6 ISO 28580 Test Conditions for Standard Load Passenger Tires
As with the three other test standards, there is no mention in ISO 28580 of how RRC is to be used. However, the test standard states in its scope:
“Measurement of tyres using this method enables comparisons to be made between the rolling resistance of new test tyres when they are free-rolling straight ahead, in a position perpendicular to the drum outer surface, and in steady-state conditions.”
The most straightforward interpretation is that the rolling resistance coefficient in ISO 28580 is intended to normalize rolling resistance by test load to allow a relative 65 ISO 28580:2009(E), International Standard, First Edition 2009-07-01, “Passenger car, truck and bus tyres -- Methods of measuring rolling resistance -- Single point test and correlation of measurement results.”
Load
Pressure
80%
210 kPa capped TP
Test Speed of 80 km/h (50 mph)

65
comparison of the energy consumption of tires of all sizes and load ranges. However, the previous discussion has illustrated how the RRC coefficients from multi-point (multi-load) rolling resistance are used to calculate the rolling resistance of a tire at a known wheel load (vehicle load divided by four), usually for the purpose of evaluating a tire or tires for a given vehicle. This calls into question whether the RRC calculated from a test at single load can also be used for such purposes.
1.1.4
There are a number of assumptions that must be fulfilled to be able to predict the response of a tire’s rolling resistance over a range of loads from measurement of rolling resistance at a single load. First, since a single-point in space can have an infinite number of lines pass through it, a second point must be defined in order to determine the sensitivity of a tire’s rolling resistance to load. For the purposes of a single-point RRC, this second point is defined as the origin (
Using RRC from a Single-Load Test to Predict Rolling Resistance at Any Load
Figure IV-6). Since this function is a straight line defined by two points, the actual response of rolling resistance to load changes should be fairly linear or errors will be induced. Second, to use RRC as a scalar to vehicle load, the rolling resistance coefficient should be constant (i.e., a flat line) over the range of practical tire loads or errors will be induced (Figure IV-7).
Figure IV-6. Theoretical Single-Load Rolling Resistance (RRF)
Load
Rolling Resistance (N)
80%
Theoretical RRF
Test Speed of 80 km/h (50 mph), Capped Pressure of 210 kPa (30 psi)
Tire B
Tire A

66
Figure IV-7. Theoretical Single-Load Rolling Resistance Coefficient (RRC)
In Phase 1 of this project, the agency measured the rolling resistance of 16 passenger tire models in a number of single and multi-point tests. Figure IV-9 displays rolling resistance data for the tires over a range of loads in the various tests (all points were collected at the identical pressure and speed). Note that the two points are connected with straight lines to emphasize that the RRF is not a linear function passing through the intercept. It is likely that the actual RRF values do pass through the intercept (i.e., there is zero rolling resistance at zero load), but that the function is actually non-linear as is hypothesized in the SAE J1269 (multi-point) regression shown in Equation IV-1. Figure displays rolling resistance (RRC) data for same tires over the range of loads. It’s important to note that the RRC values in FigureIV-10 at different loads are not constant, sometimes increasing and sometimes decreasing with load depending on the given tire model. In other words, RRC does not appear to be a constant coefficient, which is why the multi-point tests evaluate rolling resistance over a range of loads and use non-linear regressions to predict a tire’s response to load.
Load 80%
Tire A
Test Speed of 80 km/h (50 mph), Capped Pressure of 210 kPa (30 psi)
Tire B
Theoretical RRC
Rolling Resistance Coefficient
(Dimensionless)

67
Type B10 B11 B12 B13 B14 B15 D10 G10G11 G8 G9 M13 M14 P5 R4 U3
Fr
0123456789
1011121314151617
Load0 200 400 600 800 1000 1200 1400 1600
Figure IV-9 Rolling Resistance of 16 Passenger Tires
Versus Load at Constant Pressure (Average of 8 Values)

68
Type B10 B11 B12 B13 B14 B15 D10 G10G11 G8 G9 M13 M14 P5 R4 U3
Cr
0.006
0.008
0.010
0.012
Load600 800 1000 1200 1400 1600
Figure IV-10 Rolling Resistance Coefficient of 16 Passenger Tires
Versus Load at Constant Pressure (Average of 8 Values) Beyond the inconsistencies with RRC, there exist practical problems in that very few vehicles are operated at the GAWR/GVWR listed on the placard, and few tire dealers have vehicle scales that allow determination of actual vehicle weight. Without a known corner load for a tire, the RRC cannot be used to calculate a rolling resistance for a given tire model. A standard estimate of percentage of a vehicle’s GVWR to use RRC to estimate an average RRF for the four tires on vehicle would likely not be more predictive than the RRF measured at 80 percent of maximum tire load rating. Also, there comes additional difficulty in predicting the rolling resistance of a tire for a given vehicle from a single-pressure test. The allowable placard inflation pressures for standard load passenger car tires range from 180 kPa (26 psi) to 240kPa (35 psi), and up to 280 kPa (41 psi) for extra load tires. No similar coefficient is available from ISO 2858066
66 Note that the coefficient in the SAE J1269 test for passenger tires is A2/p: rolling resistance varies by the inverse of the inflation pressure.
to correct the expected RRF from the 210 kPa (30 psi) standard load (250 kPa
69
[36 psi] extra load) test pressure in the standard to the actual placard operating pressure of the vehicle, which can differ by axle. Therefore, the idea of calculating rolling resistance for a “specific vehicle in a given tire position”67
is not usually possible with RRC, unless its tires operate at the ISO 28580 test pressure, or a multi-point rolling resistance test is used to generate a regression equation from tests at multiple pressures.
Finally, it must be noted that laboratory rolling resistance tests are completed at what would be considered a neutral vehicle suspension condition (no toe, camber, or caster angle). However, in use, the same tire may be used in varying suspension geometries from vehicle to vehicle. As indicated by the book “The Pneumatic Tire68
,” vehicle suspension geometry, especially toe angle, can influence tire rolling resistance during all phases of operation:
“Taking as an example a 225/60R16 tire with a rolling resistance of 47 N at a load of 620 kg, inflation pressure 2.2 bars and speed of 80 kph, the cornering stiffness is about 1.5 kN/deg (86 N/mrad). For a total toe angle of 0.3° (0.15°/tire), the rolling resistance increases by about 0.6 N, or 1.3%, while at 1.0° of total toe (0.5°/tire), the increase is 6.5 N, or about 14%. Clearly, if the vehicle is configured with a significant toe angle, the resulting increase in rolling resistance can quickly counteract any improvements made in tire design.”
1.1.5
It has been asserted that RRC would be more useful than RRF as a basis of rating tires for consumers who are looking to replace tires on their vehicle with tires of the same size but different maximum load ratings. The FMVSS No. 139 allows tire maximum load ratings to be determined from one of six international organizations,
Discussion
69
67 Clark & Dodge, p.7.
or to be specified to the agency by an individual manufacturer. For example, the agency’s Phase 1 research used a large number of tire models of the most popular P-metric replacement tire size in 2007, which was P225/60R16. The standard load P225/60R16 Goodyear Integrity tire (type G12), which was OE on the test vehicle, has a load index of 97 that allows it to carry a maximum of 730 kg (1609 lbs) at maximum pressure. The metric designated 225/60R16 Goodyear Integrity tire (type G8) has a load index of 98, allowing it to carry 750 kg (1653 lbs), or 20 kg (44 lbs) more at maximum pressure. Per ISO 28580, both tires are
68 LaClair, T. J., Rolling Resistance, p. 498, in The Pneumatic Tire, Gent, A.N., & Walter, J.D. (Ed.). (2006). DOT HS 810 561. Published under contract DTNH22-02-P-07210. Washington, DC: National Highway Traffic Safety Administration. 69 The tire load rating shall be that specified either in a submission made by an individual manufacturer, pursuant to S4, or in one of the publications described in S4 for its size designation, type and each appropriate inflation pressure. If the maximum load rating for a particular tire size is shown in more than one of the publications described in S4, each tire of that size designation shall have a maximum load rating that is not less than the published maximum load rating, or if there are differing maximum load ratings for the same tire size designation, not less then the lowest published maximum load rating. S4 (1) The Tire and Rim Association; (2) The European Tyre and Rim Technical Organization; (3) Japan Automobile Tire Manufacturers’ Association, Inc.; (4) Tyre & Rim Association of Australia; (5) Associacao Latino Americana de Pneus e Aros (Brazil); (6) South African Bureau of Standards. (Source: FMVSS No. 571.139.
70
tested at 80 percent of maximum load, resulting in the G8 tire being tested at 16 kg (35 lbf) more load in the rolling resistance test. In this test, the average rolling resistance of the P225/60R16 Integrity tire was 9.47 lbs, and the 225/60R16 was 9.83 lbs, a 0.36 lbf (+4%) difference. To adjust for the different test loads, the rolling resistance coefficient (RRC) is calculated. Accounting for significant digits, the RRC of the P225/60R16 is 9.47 lbf / 1287 lbf = 0.0074 lbf/lbf and the RRC of the 225/60R16 is 9.83 lbf / 1322 lbf = 0.0074 lbf/lbf. Therefore, since the RRC values were identical, the 4 percent difference between the two Integrity tires likely resulted from the different test loads, not the tires themselves. If the tires were rated strictly on the ISO 28580 RRF magnitudes, the P225/60R16 tire has lower rolling resistance than the 225/60R16 tire. This issue has implications in that for many sizes of tires, the metric designated tires (usually of European or Asian manufacture) have a marginally higher load index than the P-metric tires.70
As a result, the metric tires would be tested at higher loads than P-metric tires of the same size and yield slightly higher rolling resistance. However, this does not appear to be a penalty in that a tire of a given size that is rated with a higher load index, for instance a 98 load index rather than a 97, could be operated at higher loads on heavier vehicles and actually generate more rolling resistance.
Nonetheless, normalizing all tires to their test load with RRC in order to provide a relative measure of their rolling resistance may be useful if the normalization is indeed consistent across all tire sizes. It is therefore necessary to think outside the context of selecting tires for a known vehicle and tire position, and instead consider the rating system as a whole. Neither RRF nor RRC have been used before to rate a large population of tires in a common rating system. It is absolutely factual to state that for a given vehicle, which has a single nominal tire load, RRF and RRC will produce identical rankings of tires of the same size and load index. However, the proposed tire fuel efficiency rating system must rate all tires in the system independently of specific vehicles, and recognize that a given tire model may be operated at many different loads. In 2009, Lambillotte estimated that a rolling resistance rating system in the United States may cover greater than 20,000 individual passenger tire stockkeeping units (i.e., unique tire brand/model/size/pattern, etc., designations).71 Therefore, it is important to consider the implications of using RRC to categorize a wide range of tires in a rating system. When RRC is applied over a large range of tire sizes, it tends to produce lower relative values for larger tires than for smaller tires, despite the fact that the larger tires will very likely use more energy. This in turn skews the grades of tires when compared in a common system. Schuring and Futamura reported this trend in 1980’s era tires (13-15 inch tires sizes)72
:
70 In a survey of 69 tire sizes sold by the Tire Rack in both P-metric and Euro-metric sizes: 12 percent had equal load designations, 85 percent had load designations from 1 to 6 load index numbers higher (average of 1.5) for the Euro-metric size and 1 size had a higher load index designation for the P-metric tire. 71. Lambillotte, B. (2009, February 5). California Energy Commission’s Fuel Efficient Tire Program. PowerPoint Presentation. Akron, OH: Smithers Scientific Services, Inc. 72. Schuring & Futamura, pp. 315–367.

71
“If a family of tires of different sizes would be tested for rolling loss at a maximum load (prescribed by the Tire and Rim Association), or at a fixed fraction of maximum load, as well as at a constant pressure and constant speed, and if rolling loss would be directly proportional to maximum load (or a fraction thereof), then by definition, the rolling loss coefficient derived from these test would be independent of size. This however is not the rule.
Rolling loss does increase not quite in proportion with increasing maximum load (or fractions of it); hence, the rolling-loss coefficient of larger tires is mostly smaller than those of smaller tires. … The reason for the slight decline in the rolling-loss coefficient with tire size is not clear. We may speculate that the load formula (a rather complex empirical relation between permissible tire load, pressure, and tire dimensions, developed and continuously amended over the decades by the Tire and Rim Association) had been adjusted such that larger tires experience slightly lower strains than smaller tires.”
What Schuring and Futamura observed in 13- to 15-inch diameter tire sizes, and has since been magnified as tires reach 30-inch diameters and beyond, is a result of the load term (Lm) in the denominator of the RRC equation (RRC = RRF/Lm
Equation
). This is where the non-linear formulas that determine the maximum load ratings for tires have a large effect. For instance, IV-3 is the maximum load formula used by the Tire and Rim Association, Inc. Note the multiple coefficients raised to powers, as well as the three different values for the K coefficient depending on the aspect ratio of the tire
.
Maximum Load “L” (kg) = (K) x (P0.50) x (Sd1.39) x (Dr + Sd) 73
Variable 30 Series Through 35 Series 40 Series Through 45 Series 50 Series Through 80 Series K 5.00 x 10⁻⁵ 5.67 x 10⁻⁵ 6.67 x 10⁻⁵ Sd [0.34848+0.6497(A)] x S.85 [0.34848+0.6497(A)] x S.70 A H/S.85 H/S.70
S.70 / S.85 Nominal Tire Section (mm) H Section Height (mm)
Dr Rim Diameter Code (mm) P Inflation Pressure (kPa); 240 kPa for Standard Load Tires or 280 kPa for Extra Load Tires
Equation IV-3. T&RA Load Formula for “P” Type Tires (S.I. Units) It is obvious that the Tire and Rim Association load formula is going to provide three different, non-linear curves for maximum load across the range of passenger tire sizes to be rated in the tire fuel economy system. Dividing the rolling resistance force (RRF) by this non-linear and discontinuous function will result in a non-linear and discontinuous set of values for RRC. Additionally, certain P-metric tires of aspect ratios 30-45 have maximum loads that do not follow the T&RA formulas, and were instead set equal to ISO loads in order to harmonize internationally. Worse yet, a sizable portion of tires sold in
73. The Tire & Rim Association. (2004). Engineering Design Information for Ground Vehicle Tires, Pages 1-11 & 1-15, Rev. 5. http://www.us-tra.org/traPubs.html.

72
the United States are metric tires (tire sizes lacking a “P” at the beginning), and are rated by a different set of equations under the ISO standards. The Tire Rack has an excellent description of the two systems in layman’s terms74
:
“P-metric sized tires are the ones with the "P" at the beginning of the tire size, (such as P225/60R16 listed above). They were introduced in the United States in the late 70s and are installed on vehicles primarily used to carry passengers including cars, station wagons, sport utility vehicles and even light duty pickup trucks. Their load capacity is based on an engineering formula which takes into account their physical size (the volume of space for air inside the tire) and the amount of air pressure (how tightly the air molecules are compressed). Since all P-metric sizes are all based on the formula for load, vehicle manufacturers can design their new vehicles (weights and wheel well dimensions) around either existing or new tire sizes. Metric or Euro metric sized tires are the ones without the "P" at the beginning, (such as 185R14 or the 225/60R16 listed above). Using metric dimensions to reflect a tire's width actually began in Europe in the late 60s. However, since Euro metric sizes have been added over time based on the load and dimensional requirements of new vehicles, the tire manufacturers designed many new tire sizes and load capacities around the needs of new vehicles. Not quite as uniform as creating sizes using a formula, but they got the job done.”
Therefore, the idea of generating a linear, dimensionless coefficient in RRC by dividing RRF by 80 percent of maximum rated tire load puts either the three different T&RA non-linear load formulas, or the ad hoc European system of load capacities into the denominator of the equation. While the effects on selecting tires for a given vehicle are almost certainly negligible, the effects on rating all tires of all sizes in a common system with RRC may be significant. For instance, Figure shows the RRF calculated for values of passenger tire rolling resistance reported by the Rubber Manufacturers Association (RMA) to the California Energy Commission 75
Figure IV-8
versus the load index reported for the tires. Excluding what appear to be outliers, the values range from 5 pounds to approximately 22 pounds. shows the values of RRC for the same tires. Excluding the same tires that appear to be outliers, the values range from 6 to approximately 14. Two important conclusions can be seen in this data:
1. The range of RRF values from lowest to highest is ~1.3 times the mean value for all tires, while the range for RRC values is only ~0.8 times the mean value. This means that RRF will have a greater ability to discriminate tires across the entire range of passenger tires. (As previously noted, at a given load index the values
74. The Tire Rack (2009). Tire Tech Information/General Tire Information. P-Metric and Euro Metric Tire Sizing.
http://www.tirerack.com/tires/tiretech/techpage.jsp?techid=24.
75. Rubber Manufacturers Association. (2009). Comments TN-48720.pdf, to the April 8, 2009 California Energy Commission Staff Workshop on the Fuel Efficient Tire Program, http://www.energy.ca.gov/transportation/tire_efficiency/documents/2009-04-08_workshop/comments/.

73
for RRF and RRC are related by a constant therefore the ability to discriminate tires at the same load index is identical.)
2. The average value for RRF increases with load index, meaning the amount of energy loss (vehicle fuel consumption) is increasing as tire load indexes increase. However, the average value for RRC decreases as tire load index increases. In fact, dividing by load does not produce a “corrected” value for a tire that is independent of load, but rather a value that is inverse to load.
Figure IV-11. Rolling Resistance Force (SAE J1269 Single-Point, Pounds) Versus Load Index for a Broad Range of Passenger Tires
Fr
5
10
15
20
25
30
35
Load Index
75 85 95 105 115 125
RRF

74
Cr
6789
101112131415161718
Load Index
75 85 95 105 115 125
Figure IV-8. Rolling Resistance Coefficient (SAE J1269) Versus Load Index for a Broad Range of Passenger Tires
This is where the goals of the fuel efficiency rating system must be considered. First and foremost, the system should be intuitive to consumers. Consumers will use the system to purchase tires for their current vehicle, as well as for subsequent vehicles, thus building up a contextual understanding of the ratings over time. Also, consumers may have multiple vehicles in their household or commercial fleet for which they purchase tires. A system based on the rolling resistance of each tire is directly relatable to fuel economy calculations and does not skew larger/higher load tires into better ratings, such as a system using RRC as a basis. Regardless of whether any two tire sizes in the system actually fit on the same vehicle, consumers could be confused by a fuel efficiency system that gives equal or better ratings to larger tires that consume more fuel than to smaller tires that consume less fuel. For instance, in rating light vehicle fuel economy, the estimated fuel mileage given to consumers is not divided by the rated payload capacity of the vehicle. Vehicle fuel economy ratings are instead an estimate of fuel efficiency of all vehicles in the system under the same set of driving conditions. Given vehicle fuel economy, the consumer may then weigh the fuel efficiency of the vehicle against any consideration such as payload capacity, top speed, number of occupant seats, etc. Consumers who require certain cargo or towing capacities are no more able to choose a smaller, more fuel efficient vehicle any more than a consumer with a large truck can choose a small, low-rolling resistance tire. However, the estimated fuel economy of the light vehicles is reported on the same basis regardless of vehicle type. Consumers should understand that heaviest passenger vehicles tend to get the poorest fuel economy in part because the large tires operating under the heavy loads of those vehicles consume more energy.
RRC

75
Another model is the UTQGS system. The UTQGS treadwear rating is intuitive to consumers in that tires with higher grades will, under the same conditions, be expected to last longer than tires with lower grades. This property is reported independent of any other tire property. Take for instance the speed category (maximum speed rating) of the tire. High-performance ZR, V, W, and Y rated tires, which have much lower average treadwear grades than all season S, T, U, and H rated tires, do not use a different reference tire for treadwear grading. Nor is the treadwear rated divided by the speed category. Instead, all tires in the system are referenced on the same scale, even though an ultra-high performance summer tire is likely not available in the OE sizes of a minivan or economy car. The same is true of the traction and temperature resistance ratings. We believer consumers expect high performance tires to have higher traction and temperature resistance ratings than S-rated tires, and would find a relative system, one in which a W-rated tire that is expected to wear out in fewer miles is given a higher rating than an S-rated tire that is expected to last longer, to be confusing. An additional argument has been put forth that by providing consumers with fuel economy recommendations for small and large tires on the same scale (use of RRF), rather than normalizing everything to load capacity (use of RRC), the system may encourage consumers to choose smaller tires with insufficient load carrying capacity for their vehicles, thus creating a safety hazard. This rationale is flawed for many reasons. First, consumers have had a strong economic benefit to purchase under-capacity tires for many decades, namely initial purchase price. The smaller tires in a tire line normally cost less, and purchasing under-capacity tires would be an immediate economic benefit at the time of sale. This is contrasted with a future benefit of 6 to 12 gallons in annual fuel savings from purchasing tires with 10 percent lower rolling resistance than their current tires.76
The issue of lower-cost small tires has not manifested itself as a safety problem due mainly to the fact that consumers lack the equipment to mount their own tires, and that tire installers will not assume the legal liability for installing tires with insufficient load carrying capacity.
Finally, there comes the matter of calculating fuel economy from the output of the rolling resistance test. The calculated rolling resistance can be used to estimate a tire’s power consumption, or when set equivalent to a drag force on a vehicle to calculate its impact on vehicle fuel consumption. The various analyses range from simple to highly complex fuel economy models. In an example of a simplified approach, Pillai defined tire energy loss per hour “E(R)” equal to the rolling resistance x distance traveled per hour.77
76. National Research Council, p. 78.
For example, at the ISO 28580 test speed of 80km/h, a tire with a RRF of 50 N (50 N-m/m) consumes 1.1 kW of power per hour (50 N-m/m * 80 km/h * (1,000 m / 1 km) * (1 h / 3600 s) = 1111 N-m/s = 1.1 kW). For a tire with an RRF of 40 N, it consumes 0.8 kW of power per hour at 80 km/h. Therefore, rolling resistance (RRF) is a ratio of the energy consumed per unit distance, which when expressed at a given speed can differentiate tires on the basis of expected power consumption.
77. Pillai, P.S. (1995). Total Tire Energy Loss Comparison by the Whole Tire Hysteresis and the Rolling Resistance Methods. Tire Science and Technology, TSTCA,
Vol. 23, No. 4, pp. 256-265.

76
The tire energy consumption or vehicle fuel economy approaches require rolling resistance in terms of force for the calculations. Tires of vastly different drag forces can have identical rolling resistance coefficients. Therefore, when the data is reported in terms of RRC, the coefficient must be used to calculate an RRF at a known tire load, or the initial step of converting RRF to RRC at 80 percent of maximum tire load must be reversed. In other words, data reported in terms of RRF is directly relatable to vehicle fuel economy. Whereas data reported in RRC must be transformed back to RRF to allow vehicle fuel economy calculations. Given the nature of RRC to skew tires that consume more fuel into better relative ratings, the question persists as to the value of the extra step of computing a single-point coefficient rather than reporting the data in terms of RRF. In Table IV-1 the rolling resistance values of widely different tires of similar overall diameter and load carrying capacity were compared as they might be used on a light-duty pickup truck with Gross Vehicle Weight Rating of 6400 pounds. The OE tires for this truck were size P265/70R15, which could be replaced with much wider tires ranging from 20 to 24-inch rim diameter. The tested values found for these tires and their rating by both the proposed NHTSA grading system78
and the EU grading system are shown. The final column shows the estimated rolling resistance for the tires on the vehicle at GVWR that was calculated from the regression coefficients of actual multi-point rolling resistance testing. This on-vehicle energy loss is expected to correlate directly with the amount of fuel needed to supply this energy to the drive axle of the vehicle.
Table IV-1. Example Tire and Rim Changes on Light Duty Pickup Truck Tires RRF,
lbs RRF Rating RRC EU Grade Force at GVWR79
OE Tires P265/70R15
14.1 60 0.0080 C 13.2 lbs LT245/75R16 20.5 41 0.0083 C 17.5 lbs
305/40R23 20.6 41 0.0096 D 19.2 lbs 305/35R24 22.3 36 0.0113 E 21.6 lbs 275/45R20 24.3 31 0.0130 F 23.8 lbs
Figure IV-13 shows the rating either by grade based on RRF (Blue) or by RRC (Pink) in Kg/MT for the passenger tires tested versus the estimated on-vehicle rolling resistance of the tires at GVWR. It is clear that either system correctly rank orders the tires in a manner consistent with the expected effects on vehicle fuel economy for the vehicle fitted with these tires. Neither system seems to have an inherent advantage in providing consumers with an estimate of the relative effect that the tires may have on the fuel economy of the vehicle. 78 Considering recent data provided to NHTSA, and comments that room should be provided for improved rolling resistance in the future, were the agency finalizing a 0-100 scale, NHTSA would have revised the range of the scale to be 2.5 lbf to 25 lbf (as opposed to NHTSA’s proposed 5 lbf to 25 lbf range). This would result in a tire fuel efficiency rating (RFE) formula as follows: RFE = (25 – RRF) * 100 / (25 – 2.5) = (25 – RRF) * (100 / 22.5). 79 Calculated from Multi-point testing regression

77
25.0
30.0
35.0
40.0
45.0
50.0
55.0
60.0
65.0
70.0
12.0 14.0 16.0 18.0 20.0 22.0 24.0
Actual Rolling Resistance of Tire at GVWR (Calculated from Multi-Point Regression)
Prop
osed
Tire
Rat
ing,
bas
ed o
n R
RF
7
8
9
10
11
12
13
RR
C, K
g/M
T
OE Tire
Indicates Better Fuel Efficiency
Increased Fuel Consumption
Figure IV-9. Tire Rating Versus Estimated On-Vehicle Tire Rolling Resistance,
RRF (Blue) or by RRC (Pink) One additional concern is the application of RRC in the voluntary rating of LT tires, which is not required but also not prohibited by the rating system.80 In the Phase 1 report on this project, the results clearly demonstrated that light truck tires had much higher rolling resistance forces (RRF) than the passenger tires tested, but had lower RRC values due to their high load capacities and different test conditions. The final example tire is a LT Load Range E tire. The LT tire tested has a maximum sidewall rated inflation pressure of 550 kPa (80 psi) and is appropriately tested at a higher inflation pressure for rating when placed in service on vehicles for which it is designed. If, however, the consumer installs this tire on the vehicle and inflates the tire to the vehicle placard pressure, the resulting rolling resistance for the tire is much higher as shown in column 6. This is addressed to some degree in the ECE proposal, which proposes changing the band definitions downward, by one category between C1 and C2 tires. While the definitions for the ECE proposal are based on vehicle class rather than tire class, the C2 tires in the ECE proposal contain many sizes of LT tires sold in the U.S. In Figure IV-14 the rating by RRF and RRC versus the estimated rolling resistance at GVWR and at placard inflation pressure
80 Because these tires are covered by the proposed European regulation and by the statute, NHTSA anticipates that some manufacturers may wish to voluntarily rate LT tires.
is shown. In this case, the RRC rating estimates a fuel efficiency rating

78
significantly better than the consumer would experience. The RRC rating would, however, be expected to correlate to the performance of the LT tire at its rated inflation pressure.
25.0
30.0
35.0
40.0
45.0
50.0
55.0
60.0
65.0
70.0
12.0 14.0 16.0 18.0 20.0 22.0 24.0Actual Rolling Resistance of Tire at GVWR (Calculated from Multi-Point Regression)
Prop
osed
Tire
Rat
ing,
bas
ed o
n R
RF
7
8
9
10
11
12
13
RR
C, K
g/M
TLT Tire
Figure IV-10. Tire Rating Versus Estimated On-Vehicle Tire Rolling Resistance,
Including Example LT Tire, RRF (Blue) or by RRC (Pink) In summary, a rating based on either RRF or RRC can provide a consumer good information to compare tires for an individual vehicle, with the possible exception of installing LT tires on a light truck that was originally equipped with passenger tires. However, when RRC is applied over a large range of tire sizes, it tends to produce lower relative values for larger tires than for smaller tires, despite the fact that the large tires usually use more fuel on that vehicle. This is where the goals of the fuel efficiency rating system may fail to be met if the overall system is not intuitive to consumers. Consumers will continue to use the system to purchase tires for their current and subsequent vehicles, and may have multiple vehicles in their family for which they purchase tires. It is likely that consumers will be confused by a fuel efficiency system that gives equal or better ratings to larger tires that consume more fuel than to smaller tires that consume less. This may lead to unintended effects on purchasing decisions, such as an owner upgrading to a larger tire size due to misinterpretation of the ratings. For instance, in rating light vehicle fuel economy the estimated fuel mileage given to consumers is not divided by the rated payload capacity of the vehicle. Vehicle fuel

79
economy ratings are instead an estimate of fuel efficiency of a vehicle under typical driving conditions. Consumers may then weigh the fuel efficiency of the vehicle against any consideration such as payload capacity, top speed, number of occupant seats, etc. Dividing the rolling resistance force by a fraction of the maximum load capacity of the tire to avoid larger, less fuel efficient tires from always being rated the lowest appears counter to the goals of the system. Consumers should understand that heaviest passenger vehicles tend to get the poorest fuel economy, in part because the large tires required to carry those vehicles consume more energy. This may in part influence future vehicle purchase decisions. An argument has been put forth that by providing consumers with fuel economy recommendations for small and large tires on the same scale (RRF), rather than normalizing everything with to load capacity (RRC), the system may encourage consumers to choose smaller tires with insufficient load carrying capacity for their vehicles, thus creating a safety hazard. This rationale is flawed for many reasons. First, consumers have had a strong economic benefit to purchase under-capacity tires for many decades, namely initial purchase price. The smaller tires in a tire line normally cost less, and purchasing under-capacity tires would be an immediate economic benefit at the time of sale. This is contrasted with a future benefit of 6 to 12 gallons in annual fuel savings81
from purchasing tires with 10 percent lower rolling resistance than their current tires. The issue of lower-cost small tires has not manifest itself as a safety problem due mainly to the fact that consumers lack the equipment to mount their own tires, and that tire installers will not assume the legal liability for installing tires with insufficient load carrying capacity.
As explained above, NHTSA will communicate tire fuel efficiency information in the form of a rolling resistance rating, because rolling resistance corresponds to the amount of fuel used in the form of mechanical energy dissipated to move the tire. Tire rolling resistance is the most effective metric for rating the “fuel efficiency” of a tire because rolling resistance force (RRF) measures the energy loss that opposes the direction of travel of the rotating tire and, thus, it directly reduces the efficiency of a vehicle in converting the chemical energy in the fuel to motion of the vehicle. Based on the rolling resistance force test value measured using the ISO 28580 test procedure, the fuel efficiency rating of a given replacement passenger car tire will be calculated using a formula specified by NHTSA in a forthcoming rule.
81 National Research Council of the National Academies (2006). Transportation Research Board Special Report 286, Tires and Passenger Vehicle Fuel Economy, p. 78.
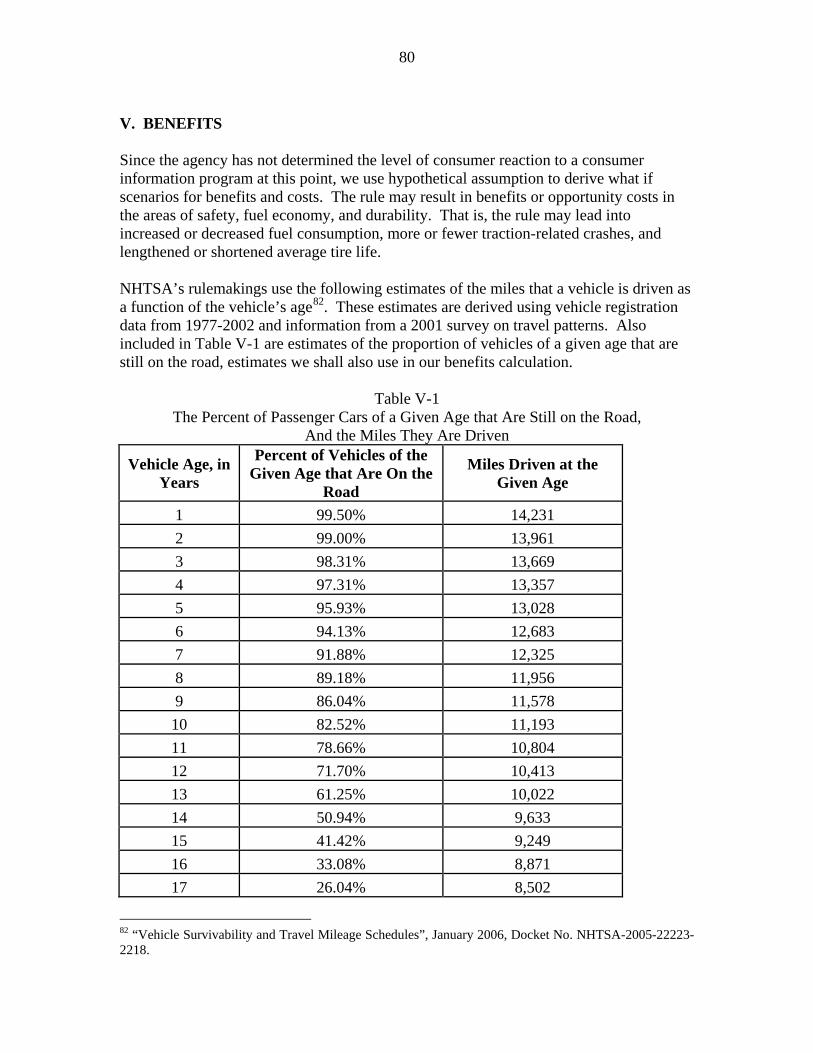
80
V. BENEFITS Since the agency has not determined the level of consumer reaction to a consumer information program at this point, we use hypothetical assumption to derive what if scenarios for benefits and costs. The rule may result in benefits or opportunity costs in the areas of safety, fuel economy, and durability. That is, the rule may lead into increased or decreased fuel consumption, more or fewer traction-related crashes, and lengthened or shortened average tire life. NHTSA’s rulemakings use the following estimates of the miles that a vehicle is driven as a function of the vehicle’s age82
. These estimates are derived using vehicle registration data from 1977-2002 and information from a 2001 survey on travel patterns. Also included in Table V-1 are estimates of the proportion of vehicles of a given age that are still on the road, estimates we shall also use in our benefits calculation.
Table V-1 The Percent of Passenger Cars of a Given Age that Are Still on the Road,
And the Miles They Are Driven
Vehicle Age, in Years
Percent of Vehicles of the Given Age that Are On the
Road
Miles Driven at the Given Age
1 99.50% 14,231 2 99.00% 13,961 3 98.31% 13,669 4 97.31% 13,357 5 95.93% 13,028 6 94.13% 12,683 7 91.88% 12,325 8 89.18% 11,956 9 86.04% 11,578 10 82.52% 11,193 11 78.66% 10,804 12 71.70% 10,413 13 61.25% 10,022 14 50.94% 9,633 15 41.42% 9,249 16 33.08% 8,871 17 26.04% 8,502
82 “Vehicle Survivability and Travel Mileage Schedules”, January 2006, Docket No. NHTSA-2005-22223-2218.

81
Vehicle Age, in Years
Percent of Vehicles of the Given Age that Are On the
Road
Miles Driven at the Given Age
18 20.28% 8,144 19 15.65% 7,799 20 12.00% 7,469 21 9.16% 7,157 22 6.96% 6,866 23 5.27% 6,596 24 3.99% 6,350 25 3.01% 6,131 26 2.27% 5,940
Table V-2 The Percent of Light Trucks of a Given Age that Are Still on the Road,
And the Miles They Are Driven
Vehicle Age, in Years
Percent of Vehicles of the Given Age that Are On the
Road
Miles Driven at the Given Age
1 99.50% 16,085 2 97.41% 15,782 3 96.03% 15,442 4 94.20% 15,069 5 91.90% 14,667 6 89.13% 14,239 7 85.90% 13,790 8 82.26% 13,323 9 78.27% 12,844 10 74.01% 12,356 11 69.56% 11,863 12 65.01% 11,369 13 60.42% 10,879 14 55.17% 10,396 15 50.09% 9,924 16 45.22% 9,468 17 40.62% 9,032 18 36.33% 8,619 19 32.36% 8,234

82
Vehicle Age, in Years
Percent of Vehicles of the Given Age that Are On the
Road
Miles Driven at the Given Age
20 28.73% 7,881 21 25.42% 7,565 22 22.44% 7,288 23 19.75% 7,055 24 17.35% 6,871 25 15.22% 6,739 26 13.32% 6,663
27 11.65% 6,648 28 10.17% 6,648 29 8.87% 6,648 30 7.73% 6,648 31 6.73% 6,648 32 5.86% 6,648 33 5.09% 6,648 34 4.43% 6,648 35 3.85% 6,648 36 3.34% 6,648
FUEL ECONOMY BENEFITS FROM THE CONSUMER’S PERSPECTIVE If a consumer purchased new replacement tires that had lower rolling resistance (and disregarding any opportunity costs on safety or treadwear), what would be the fuel economy benefits? A consumer purchasing replacement tires would save money on fuel if s/he purchases tires with lower rolling resistance. With silica technology we expect an average 5-10% reduction in rolling resistance among improved tires. Also recall that we estimate that each 10% reduction in rolling resistance improves a vehicle’s fuel economy by 1.3%. Suppose the on-road fuel economy of the consumer’s vehicle is x mpg and that a tire with a 5% reduction in rolling resistance is available in the size appropriate for this vehicle. Then with these tires (assuming the consumer replaces all four tires), the vehicle’s fuel economy would be increased by 0.65%. Its fuel consumption would be reduced by
xx 0065.111
−

83
gallons per mile. Over 45,000 miles (the expected life of the tire), the consumer would save
xx 0065.1000,45000,45
−
gallons of fuel. For instance, if the vehicle gets 25.0 mpg, the consumer would save 11.6 gallons over the life of the tire. If fuel costs about $3 per gallon over the tires’ life, the consumer would save about $34.80 (non-discounted). The following table presents the fuel that the consumer would not have to purchase, over the life of the tires, if s/he purchases 4 tires with a 5% reduction in rolling resistance for a vehicle whose on-road fuel economy is 18.9 – 25.0 mpg. The average on-road fuel economy for passenger cars is 25 mpg and for light trucks is 18.9 mpg.
Table V-3 Fuel Saved from the Consumer’s Perspective1
Vehicle On-Road Fuel Economy
Reduction in Rolling
Resistance
Fuel Saved over the Tires' Life,
in Gallons 18.9 5% 15.4 25.0 5% 11.6
1Assumes all four tires are replaced. EXPECTED FUEL SAVINGS The calculation of fuel savings for the final rule assumes that vehicles travel different amounts depending on their age. Because these estimates are different for passenger cars and light trucks, we need to incorporate various additional factors. A summary of the parameters used in the calculation of non-monetized fuel savings is given in Table V-4.
Table V-4 Parameters Used in Non-monetized Fuel Savings Estimates
Parameter Estimate Source of Estimate
Miles driven by passenger cars and light trucks of a given age See Table V-1 (Lu, 2006)
Percent of passenger cars and light trucks of a given age that are still on the road See Table V-2 (Lu, 2006)
% of eligible replacement tires whose rolling resistance is improved 1 What if
Average % reduction in rolling resistance among improved eligible tires 5%
Based on Michelin statements about silica technology
Average # miles an eligible replacement tire is 45,000 miles NHTSA estimate

84
driven before replacement based on Goodyear data83
Average fuel efficiency of passenger cars (PC) (respectively, light trucks [LT]) with eligible replacement tires
84
25.0 mpg PC
(18.9 mpg LT)
NHTSA estimates of on-road fuel economy
of model year 2013 vehicles.
Percent of light truck sales that use LT tires 10% NHTSA estimate P-metric tires are sold annually 181,000,000 Modern Tire Dealer85
Eligible replacement tires whose rolling resistance is worse than that of original equipment
141,000,000 Modern Tire Dealer
LT-metric tires are sold annually 10,000,000 Modern Tire Dealer Increase in fuel economy for each 10% reduction in rolling resistance 1.3% NHTSA research 86
The following set of calculations are provided for the example where 1 percent of eligible replacement tires have 5% reduction in rolling resistance. Other estimates of more tires or better reduction in rolling resistance can be determined by simply multiplying the results of the example calculations by factors. This process and results will be discussed at the end of this example. Our calculation will also use an estimate of the percent of eligible replacement tires that are purchased for use on passenger cars, which is estimated at 50% and is derived from the estimates in Table V-4 as follows: If PPC (respectively, P, LT) denotes the number of P-metric replacement tires purchased for use on passenger cars (respectively, the number of P-metric replacement tires sold, the number of LT replacement tires sold), then the percent of eligible replacement tires that are purchased for use on passenger cars is:
PLT
LTPPCPLT
PPPCP
PPPC
−
−+−=
−−= 111
From Table V-4, we have
PPCPLTLT−+
= 0.1, LT=10,000,000 and P=181,000,000, and
substituting these values produces that 50% of eligible replacement tires are purchased for use on passenger cars. We next compute the annual miles driven per eligible replacement tires. Assuming that, per Table V-4, tires are purchased every 45,000 miles, a passenger car will use its first set of replacement tires when it is 4 years old, and will get new replacement tires when it is
83 http://www.tirebusiness.com/subscriber/databook/piecharts08.html?chart=33 84 These are the fuel economies obtained on the road, as opposed to those measured in EPA’s fuel economy testing. On-road fuel economy is generally 20% lower than that obtained in EPA testing. For more information, see the MY 2012-2016 CAFE PRIA. 85 According to Modern Tire Dealer in 2008, there were 198 million replacement tires sold. http://www.moderntiredealer.com/FAQ/. 86 [Insert reference to Phase II report.]

85
7, 11, 16, and 21 years old, assuming the car hasn’t already been scrapped. The set purchased when the car is 21 years old (if it isn’t yet scrapped) will be its last since they will last until the vehicle is scrapped at age 26. (We are making the simplifying assumptions that the car is driven exactly according to the (Lu, 2006) average mileage schedule, all 4 tires are replaced with each tire purchase, and no intermediate tire purchases are needed (e.g. no flat tire or alignment problem necessitates a tire replacement).) When the car is 4 years old (during the year of the first replacement tire purchase), the original equipment tires will travel their final 3,139 miles and the replacement tires will travel their first 10,218 miles. In the next two years, they will travel 13,028 and 12,683 miles, respectively, according to the (Lu, 2006) schedule. The final 9,071 miles on the first set of replacement tires occurs when the car is 7 years old, leaving 3,254 miles to be traveled on the second set of replacement tires. A complete schedule of the miles driven on each eligible replacement tire as function of the car’s age appears in Table V-5. The analogous schedule for light trucks is presented in Table V-6.
Table V-5 Miles Driver per Eligible Replacement Tire on Passenger Cars
Vehicle Age, in Years
Miles Driven Per Vehicle on Road at the Given Age
Miles Driver per Eligible Replacement Tire in the kth Years After the Tires Are Sold, Where k=…
0 1 2 3 4 5
1 14,231 2 13,961 3 13,669 4 13,357 10,218 5 13,028 13,028 6 12,683 12,683 7 12,325 3,254 9,071 8 11,956 11,956 9 11,578 11,578 10 11,193 11,193 11 10,804 3,785 7,019 12 10,413 10,413 13 10,022 10,022 14 9,633 9,633 15 9,249 9,249 16 8,871 6,973 1,898 17 8,502 8,502 18 8,144 8,144 19 7,799 7,799 20 7,469 7,469

86
Vehicle Age, in Years
Miles Driven Per Vehicle on Road at the Given Age
Miles Driver per Eligible Replacement Tire in the kth Years After the Tires Are Sold, Where k=…
0 1 2 3 4 5
21 7,157 1,044 6,113 22 6,866 6,866 23 6,596 6,596 24 6,350 6,350 25 6,131 6,131 26 5,940 5,940
Total 257,927 25,274 50,765 49,023 44,046 29,868 13,951
Table V-6 Miles Driven per Eligible Replacement Tire on Light Trucks
Vehicle Age, in Years
Miles Driven Per Vehicle on Road at the Given Age
Miles Driver per Eligible Replacement Tire in the kth Years After the Tires Are Sold, Where k=…
0 1 2 3 4 5 6 7
1 16,085 2 15,782 3 15,442 2,309 4 15,069 15,069 5 14,667 14,667 6 14,239 1,284 12,955 7 13,790 13,790 8 13,323 13,323 9 12,844 12,844
10 12,356 8,597 3,759 11 11,863 11,863 12 11,369 11,369 13 10,879 10,879 14 10,396 8,104 2,292 15 9,924 9,924 16 9,468 9,468 17 9,032 9,032 18 8,619 147 8,472 19 8,234 8,234 20 7,881 7,881 21 7,565 7,565 22 7,288 7,288 23 7,055 7,055

87
Vehicle Age, in Years
Miles Driven Per Vehicle on Road at the Given Age
Miles Driver per Eligible Replacement Tire in the kth Years After the Tires Are Sold, Where k=…
0 1 2 3 4 5 6 7
24 6,871 41 6,830 25 6,739 6,739 26 6,663 6,663 27 6,648 6,648 28 6,648 6,648 29 6,648 6,648 30 6,648 6,648 31 6,648 1,683 4,965 32 6,648 6,648 33 6,648 6,648 34 6,648 6,648 35 6,648 6,648 36 6,648 6,648
Total 349,923 22,16
5 72,267 70,019 66,571 35,107 20,351 13,478 4,965 We next estimate the number of eligible replacement tires with improved rolling resistance by vehicle type (passenger cars and light trucks), vehicle age, and the numbers of years after the tires are sold. Per Table V-4, we estimate that between 1 and 10 percent of eligible replacement tires will have their rolling resistance improved as a result of this rule. If only 1% of tires are improved, then 1,410,000 of the 141,000,000 eligible replacement tires sold each year would have improved rolling resistance. Of these, 708,895 would be purchased for use on passenger cars. (Here we are using all of the digits of our estimate of 50% of P-metric tires bought for use on cars, which in more digits is 50.27624%.) As discussed previously, we assume that new replacement tires are purchased for cars that are 4, 7, 11, 16, and 21 years old. The 708,895 tires would be distributed among the cars of these ages in proportion to the proportion of the number of cars of each age. By the (Lu, 2006) survival estimates, 97% (respectively, 92%, 79%, 33%, 9%) of cars are still on the road 4 (respectively, 7, 11, 16, 21) years after purchase. Thus, 31% (i.e., 97/(97+92+79+33+9) of the 708,895 tires would be purchased for cars that are 4 years old, giving that 222,460 eligible replacement tires with improved rolling resistance are sold for use on 4-year old passenger cars. This estimate and the analogous estimates for 7, 11, 16, and 21 year-old cars appear in the fourth column of Table V-7 (the column referring to “k=0” years after the tires are sold). One year later, the 4-year old vehicles are 5 years old, 1.38 percent (i.e. 97.31% - 95.93%) of which have been scrapped and are no longer on the road. Thus the number of eligible replacement tires with improved rolling resistance that were sold for use on 4-year old cars and are still on the road one year later is 219,390 (i.e. (1-0.0138)* 222,460). This number together with the analogous estimates for subsequent years after the tire

88
purchase and tires purchased for cars older than 4 years appear in columns 5-9 of Table V-7 (the columns referring to “k=1” through “k-5” years after the tires are sold).

89
Table V-7
If 1% of the Number of Eligible Replacement Tires with Improved Rolling Resistance on Passenger Cars
Vehicle Age, in Years
% of Cars of Given Age on
the Road
Distribution of New
Replacement Tires
1%of Eligible Replacement Tires with Improved Rolling Resistance in the kthYear After the Tires Are Sold for k=…
0 1 2 3 4 5
1 99.50% 0% - - - - - - 2 99.00% 0% - - - - - - 3 98.31% 0% - - - - - - 4 97.31% 31% 222,460 - - - - - 5 95.93% 0% - 219,390 - - - - 6 94.13% 0% - - 215,441 - - - 7 91.88% 30% 210,046 - - 210,593 - - 8 89.18% 0% - 204,375 - - 204,907 - 9 86.04% 0% - - 197,958 - - 198,473
10 82.52% 0% - - - 190,990 - - 11 78.66% 25% 179,824 - - - 183,617 - 12 71.70% 0% - 167,308 - - - 170,838 13 61.25% 0% - - 149,825 - - - 14 50.94% 0% - - - 134,378 - - 15 41.42% 0% - - - - 121,585 - 16 33.08% 11% 75,624 - - - - 111,445 17 26.04% 0% - 70,300 - - - - 18 20.28% 0% - - 66,251 - - - 19 15.65% 0% - - - 63,183 - - 20 12.00% 0% - - - - 60,877 - 21 9.16% 3% 20,941 - - - - 59,148 22 6.96% 0% - 20,480 - - - - 23 5.27% 0% - - 20,134 - - - 24 3.99% 0% - - - 19,876 - - 25 3.01% 0% - - - - 19,681 - 26 2.27% 0% - - - - - 19,536
Total 100% 708,895 681,853 649,608 619,020 590,668 559,440 If 1 percent of the number of eligible replacement tires with improved rolling resistance that are on light trucks k years after the tires are purchased are obtained according to the same calculations, using that 49.72376% (i.e. 100% - 50.27624%) of replacement P-metric tires are purchased for use on light trucks, and are presented in Table V-8.

90
Table V-8
If 1% of the Number of Eligible Replacement Tires with Improved Rolling Resistance on Light Trucks
Vehicle Age, in Years
% of Cars
of Given Age on
the Road D
istr
ibut
ion
of
New
R
epla
cem
ent
Tir
es Number of Eligible Replacement Tires with Improved Rolling Resistance in the kth
Year After the Tires Are Sold for k=…
0 1 2 3 4 5 6 7
1 100% 0% - - - - - - - - 2 97% 0% - - - - - - - - 3 96% 26% 179,659 - - - - - - - 4 94% 0% - 176,371 - - - - - - 5 92% 0% - - 172,314 - - - - - 6 89% 24% 166,750 - - 167,541 - - - - 7 86% 0% - 161,364 - - 162,130 - - - 8 82% 0% - - 155,490 - - 156,228 - - 9 78% 0% - - - 149,286 - - 149,995 - 10 74% 20% 138,462 - - - 142,926 - - 143,605 11 70% 0% - 132,301 - - - 136,566 - - 12 65% 0% - - 126,281 - - - 130,352 - 13 60% 0% - - - 120,485 - - - 124,369 14 55% 15% 103,215 - - - 114,159 - - - 15 50% 0% - 97,972 - - - 108,360 - - 16 45% 0% - - 93,201 - - - 103,083 - 17 41% 0% - - - 88,914 - - - 98,341 18 36% 10% 67,968 - - - 85,099 - - - 19 32% 0% - 65,270 - - - 81,721 - - 20 29% 0% - - 62,901 - - - 78,754 - 21 25% 0% - - - 60,819 - - - 76,148 22 22% 0% - - - - 59,006 - - - 23 20% 0% - - - - - 57,419 - - 24 17% 5% 32,459 - - - - - 56,041 - 25 15% 0% - 31,768 - - - - - 54,847 26 13% 0% - - 31,164 - - - - - 27 12% 0% - - - 30,644 - - - - 28 10% 0% - - - - 30,190 - - - 29 9% 0% - - - - - 29,798 - - 30 8% 0% - - - - - - 29,458 - 31 7% 2% 12,591 - - - - - - 29,164 32 6% 0% - 12,481 - - - - - - 33 5% 0% - - 12,385 - - - - - 34 4% 0% - - - 12,304 - - - - 35 4% 0% - - - - 12,232 - - - 36 3% 0% - - - - - 12,170 - - Total 100% 701,105 677,527 653,737 629,992 605,744 582,262 547,684 526,474

91
We are now ready to calculate our non-monetized fuel savings. Returning to the case of an assumed 1 percent of replacement tires for passenger cars having an average decrease in rolling resistance of 5%, and we assume that the average car with replacement tires gets an on-road fuel economy of 25 mpg. Also recall that we estimate that each 10% reduction in rolling resistance improves a vehicle’s fuel economy by 1.3%. Thus our 5% reduction in rolling resistance will increase fuel economy by 0.65%. The fuel consumption of our 25 mpg passenger car will be reduced by 0.000258 (i.e. 1/25 – 1/(1.0065*25)) gallons per mile, or 0.0000645802 (i.e. 0.000258/4) gallons per tire-mile. Thus the fuel saved by our 222,460 four-year-old cars with improved tires (from Table V-7), each of which travels 10,218 miles (from Table V-5) is 146,797 (i.e. 0.0000645802 * 222,460 * 10,218) gallons. In general our estimate of the fuel saved by cars is obtained by multiplying the entries of Table V-5 with the corresponding entries of Table V-7 and the reduction of 0.0000645802 gallons per tire-mile in fuel consumption. This results in the following fuel savings estimates for cars.
Table V-9 Estimate of the Fuel Saved by Passenger Cars, in Gallons
Vehicle Age
Estimate of Fuel Saved in the kthYear After the Tires Are Sold, for k=…
0 1 2 3 4 5 1 - - - - - - 2 - - - - - - 3 - - - - - - 4 146,797 - - - - - 5 - 184,584 - - - - 6 - - 176,461 - - - 7 44,140 - - 123,367 - - 8 - 157,802 - - - - 9 - - 148,015 - - - 10 - - - 138,056 - - 11 43,956 - - - 83,232 - 12 - 112,511 - - - - 13 - - 96,970 - - - 14 - - - 83,597 - - 15 - - - - 72,623 - 16 34,055 - - - - 13,660 17 - 38,599 - - - - 18 - - 34,844 - - - 19 - - - 31,823 - - 20 - - - - 29,364 - 21 1,412 - - - - 23,350 22 - 9,081 - - - -
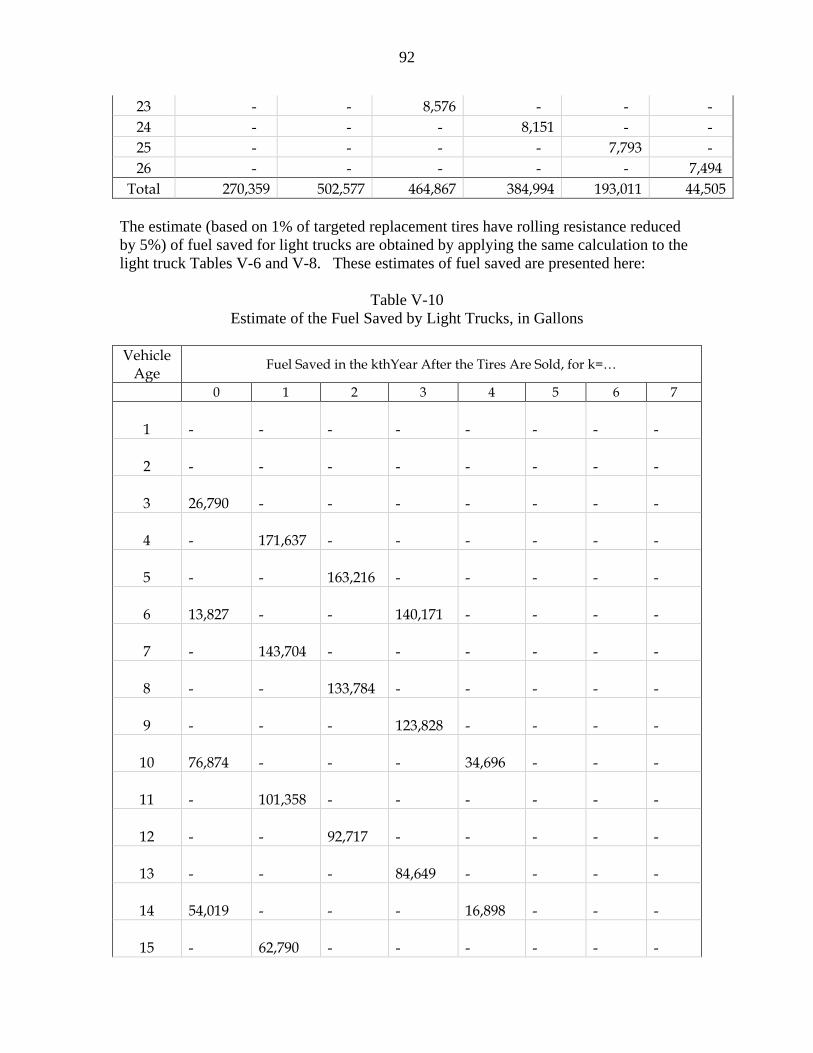
92
23 - - 8,576 - - - 24 - - - 8,151 - - 25 - - - - 7,793 - 26 - - - - - 7,494
Total 270,359 502,577 464,867 384,994 193,011 44,505
The estimate (based on 1% of targeted replacement tires have rolling resistance reduced by 5%) of fuel saved for light trucks are obtained by applying the same calculation to the light truck Tables V-6 and V-8. These estimates of fuel saved are presented here:
Table V-10 Estimate of the Fuel Saved by Light Trucks, in Gallons
Vehicle
Age Fuel Saved in the kthYear After the Tires Are Sold, for k=…
0 1 2 3 4 5 6 7
1 -
-
-
-
-
-
-
-
2 -
-
-
-
-
-
-
-
3 26,790
-
-
-
-
-
-
-
4 -
171,637
-
-
-
-
-
-
5 -
-
163,216
-
-
-
-
-
6 13,827
-
-
140,171
-
-
-
-
7 -
143,704
-
-
-
-
-
-
8 -
-
133,784
-
-
-
-
-
9 -
-
-
123,828
-
-
-
-
10 76,874
-
-
-
34,696
-
-
-
11 -
101,358
-
-
-
-
-
-
12 -
-
92,717
-
-
-
-
-
13 -
-
-
84,649
-
-
-
-
14 54,019
-
-
-
16,898
-
-
-
15 -
62,790
-
-
-
-
-
-

93
16 -
-
56,987
-
-
-
-
-
17 -
-
-
51,862
-
-
-
-
18 645
-
-
-
46,560
-
-
-
19 -
34,708
-
-
-
-
-
-
20 -
-
32,014
-
-
-
-
-
21 -
-
-
29,713
-
-
-
-
22 -
-
-
-
27,772
-
-
-
23 -
-
-
-
-
26,161
-
-
24 86
-
-
-
-
-
24,719
-
25 -
13,826
-
-
-
-
-
-
26 -
-
13,410
-
-
-
-
-
27 -
-
-
13,156
-
-
-
-
28 -
-
-
-
12,962
-
-
-
29 -
-
-
-
-
12,793
-
-
30 -
-
-
-
-
-
12,647
-
31 1,368
-
-
-
-
-
-
9,351
32 -
5,359
-
-
-
-
-
-
33 -
-
5,317
-
-
-
-
-
34 -
-
-
5,282
-
-
-
-
35 -
-
-
-
5,252
-
-
-
36 -
-
-
-
-
5,225
-
-
Total 173,609
533,381
497,446
448,662
144,139
44,179
37,366
9,351

94
Among the several tables in this section, only the last rows of Tables V-9 and V-10 will be used in the remainder of the benefits calculation. We summarize them here for reference:
Table V-11 Fuel Saved, in Gallons, by Vehicle Type and the
Number of Years After the Tires Are Sold
Vehicle Type
Fuel Saved, in Millions of Gallons, in the kth Year After the Tires Are Sold, for k=…
0 1 2 3 4 5 6 7 Passenger
Cars 0.3 0.5 0.5 0.4 0.2 0.04 NA NA
Light Trucks 0.2 0.5 0.5 0.4 0.2 0.04 0.04 0.01 * Based on 1% of targeted replacement tires have rolling resistance reduced by 5%. Taking cumulative sums in the previous table, we arrive at the annual fuel savings:

95
Table V-12 Annual Fuel Saved, in Gallons, by Vehicle Type
Year Fuel Saved, in Millions of Gallons, by Passenger Cars Light Trucks
Year 1 of the Tire Program 0.3 0.2 Year 2 of the Tire Program 0.8 0.7 Year 3 of the Tire Program 1.2 1.2 Year 4 of the Tire Program 1.6 1.7 Year 5 of the Tire Program 1.8 1.8 Year 6 of the Tire Program 1.9 1.8 Year 7 of the Tire Program 1.9 1.9
Year k of the Tire Program, for k≥8 1.9 1.9 EXPECTED CO2 AVOIDED If the rule will save fuel, it will also reduce CO2 emissions. Less CO2 will be emitted from tailpipes (downstream emissions) because replacement tires will generate improved fuel efficiency. In addition, CO2 is emitted from refineries and other sources to produce fuel and deliver it to gas stations, and so less fuel used by vehicles also translated to reduced CO2 emissions from these sources (upstream emissions)87
.
To determine the expected reduction in CO2 resulting from this rule, we note that each gallon of fuel burned corresponds to 9,653 grams of CO2 (including both upstream and downstream emissions), which is derived in the following table:
Table V-13
CO2 Emitted per Gallon of Fuel Burned
Fuel Type % of U.S. Consump-
tion
Tailpipe CO2
Emissions (grams/gal)
Domestic Upstream
CO2 Emissions (grams/gal)
Total CO2 Emissions (grams/gal)
Conventional Gasoline 63.4% 8,920 766 9,686 Federal Reformulated Gasoline 23.4% 8,716 782 9,498 California Reformulated Gasoline 10.7% 8,741 746 9,487 All Gasoline 97.5% 8,852 767 9,619 Diesel 2.5% 10,239 748 10,987 Weighted Average 100.0% 8,887 767 9,653
This figure (9,653 grams per gallon) is the same used in NHTSA’s recently issued Corporate Average Fuel Economy (CAFE) proposed rule for model year 2012-2016 light vehicles.
87 As in the agency’s most recent rulemaking on Corporate Average Fuel Economy, we only consider upstream emissions occurring in the U.S. (“domestic upstream emissions”).
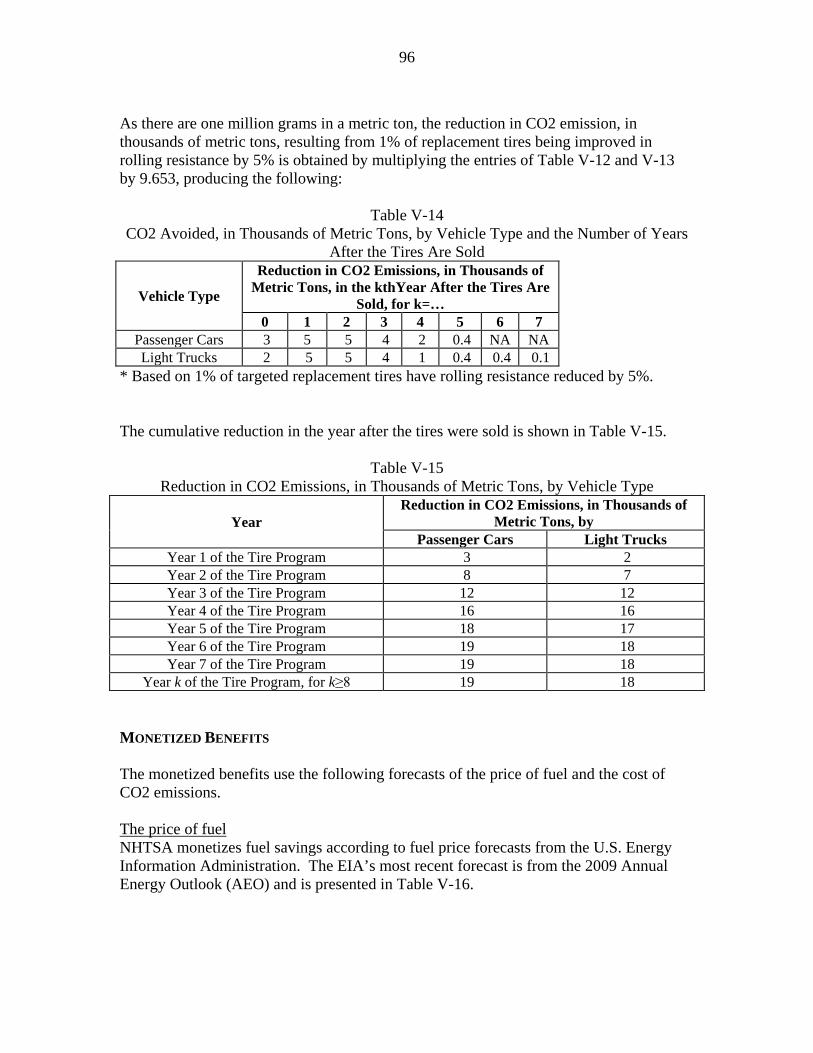
96
As there are one million grams in a metric ton, the reduction in CO2 emission, in thousands of metric tons, resulting from 1% of replacement tires being improved in rolling resistance by 5% is obtained by multiplying the entries of Table V-12 and V-13 by 9.653, producing the following:
Table V-14
CO2 Avoided, in Thousands of Metric Tons, by Vehicle Type and the Number of Years After the Tires Are Sold
Vehicle Type
Reduction in CO2 Emissions, in Thousands of Metric Tons, in the kthYear After the Tires Are
Sold, for k=… 0 1 2 3 4 5 6 7
Passenger Cars 3 5 5 4 2 0.4 NA NA Light Trucks 2 5 5 4 1 0.4 0.4 0.1
* Based on 1% of targeted replacement tires have rolling resistance reduced by 5%. The cumulative reduction in the year after the tires were sold is shown in Table V-15.
Table V-15 Reduction in CO2 Emissions, in Thousands of Metric Tons, by Vehicle Type
Year Reduction in CO2 Emissions, in Thousands of
Metric Tons, by Passenger Cars Light Trucks
Year 1 of the Tire Program 3 2 Year 2 of the Tire Program 8 7 Year 3 of the Tire Program 12 12 Year 4 of the Tire Program 16 16 Year 5 of the Tire Program 18 17 Year 6 of the Tire Program 19 18 Year 7 of the Tire Program 19 18
Year k of the Tire Program, for k≥8 19 18 MONETIZED BENEFITS The monetized benefits use the following forecasts of the price of fuel and the cost of CO2 emissions.
NHTSA monetizes fuel savings according to fuel price forecasts from the U.S. Energy Information Administration. The EIA’s most recent forecast is from the 2009 Annual Energy Outlook (AEO) and is presented in Table V-16.
The price of fuel

97
Table V-16 Fuel Price Forecast, in 2007 Dollars88
Year
AE0 2009 Revised
Forecast of Retail Gasoline
Price
Estimated Federal and State Taxes
Forecast Gasoline Price
Excluding Taxes
Forecast Gasoline Price
Including Externalities
2011 $2.50 $0.43 $2.07 $2.24 2012 $2.70 $0.43 $2.27 $2.44 2013 $2.85 $0.42 $2.42 $2.59 2014 $3.00 $0.42 $2.58 $2.75 2015 $3.16 $0.42 $2.75 $2.92 2016 $3.27 $0.41 $2.86 $3.03 2017 $3.39 $0.41 $2.98 $3.15 2018 $3.48 $0.41 $3.08 $3.25 2019 $3.56 $0.40 $3.16 $3.33 2020 $3.62 $0.40 $3.22 $3.39 2021 $3.64 $0.39 $3.24 $3.41 2022 $3.67 $0.39 $3.28 $3.45 2023 $3.69 $0.39 $3.30 $3.47 2024 $3.69 $0.38 $3.31 $3.48 2025 $3.68 $0.38 $3.30 $3.47 2026 $3.72 $0.38 $3.34 $3.51 2027 $3.72 $0.38 $3.34 $3.51 2028 $3.76 $0.37 $3.39 $3.56 2029 $3.87 $0.37 $3.50 $3.66 2030 $3.82 $0.37 $3.45 $3.62 2031 $3.84 $0.37 $3.47 $3.64 2032 $3.86 $0.36 $3.50 $3.67 2033 $3.88 $0.36 $3.52 $3.69 2034 $3.90 $0.36 $3.54 $3.71 2035 $3.92 $0.36 $3.57 $3.74 2036 $3.95 $0.36 $3.59 $3.76 2037 $3.97 $0.35 $3.61 $3.78 2038 $3.99 $0.35 $3.64 $3.81 2039 $4.01 $0.35 $3.66 $3.83 2040 $4.03 $0.35 $3.68 $3.85
88 This forecast is AEO’s “reference” forecast.
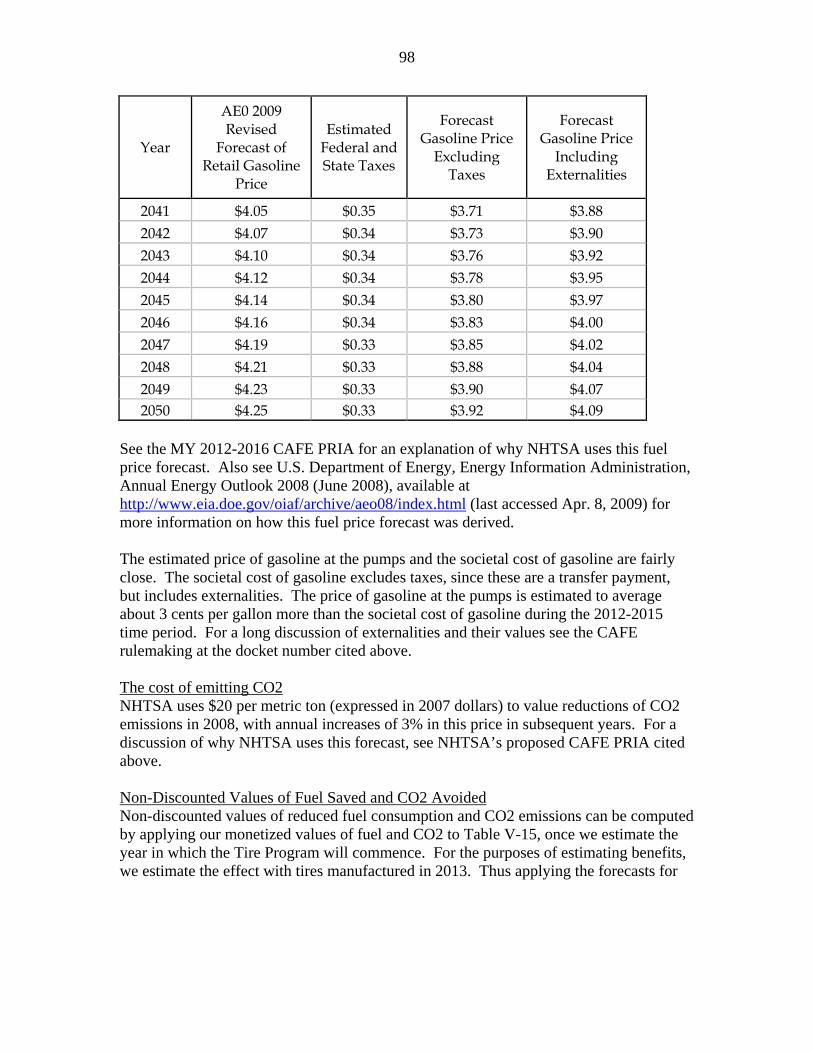
98
Year
AE0 2009 Revised
Forecast of Retail Gasoline
Price
Estimated Federal and State Taxes
Forecast Gasoline Price
Excluding Taxes
Forecast Gasoline Price
Including Externalities
2041 $4.05 $0.35 $3.71 $3.88 2042 $4.07 $0.34 $3.73 $3.90 2043 $4.10 $0.34 $3.76 $3.92 2044 $4.12 $0.34 $3.78 $3.95 2045 $4.14 $0.34 $3.80 $3.97 2046 $4.16 $0.34 $3.83 $4.00 2047 $4.19 $0.33 $3.85 $4.02 2048 $4.21 $0.33 $3.88 $4.04 2049 $4.23 $0.33 $3.90 $4.07 2050 $4.25 $0.33 $3.92 $4.09
See the MY 2012-2016 CAFE PRIA for an explanation of why NHTSA uses this fuel price forecast. Also see U.S. Department of Energy, Energy Information Administration, Annual Energy Outlook 2008 (June 2008), available at http://www.eia.doe.gov/oiaf/archive/aeo08/index.html (last accessed Apr. 8, 2009) for more information on how this fuel price forecast was derived. The estimated price of gasoline at the pumps and the societal cost of gasoline are fairly close. The societal cost of gasoline excludes taxes, since these are a transfer payment, but includes externalities. The price of gasoline at the pumps is estimated to average about 3 cents per gallon more than the societal cost of gasoline during the 2012-2015 time period. For a long discussion of externalities and their values see the CAFE rulemaking at the docket number cited above.
NHTSA uses $20 per metric ton (expressed in 2007 dollars) to value reductions of CO2 emissions in 2008, with annual increases of 3% in this price in subsequent years. For a discussion of why NHTSA uses this forecast, see NHTSA’s proposed CAFE PRIA cited above.
The cost of emitting CO2
Non-discounted values of reduced fuel consumption and CO2 emissions can be computed by applying our monetized values of fuel and CO2 to Table V-15, once we estimate the year in which the Tire Program will commence. For the purposes of estimating benefits, we estimate the effect with tires manufactured in 2013. Thus applying the forecasts for
Non-Discounted Values of Fuel Saved and CO2 Avoided

99
fuel and CO2 prices for 2013, and using a multiplier of 1.021 to convert 2007 dollars into 2008 dollars89
, we arrive at the following estimates:
Table V-17 Annual Non-Discounted Benefits for Passenger Cars
in Millions of 2008 Dollars
Year of Fuel CO2 Total Non-
Benefit Saved Avoided Discounted Benefits
2013 $0.61 $0.05 $0.66 2014 $1.84 $0.15 $1.99 2015 $3.13 $0.25 $3.38 2016 $4.25 $0.34 $4.60 2017 $4.95 $0.40 $5.34 2018 $5.23 $0.42 $5.65 2019 $5.36 $0.43 $5.79 2020 $5.46 $0.44 $5.90 2021 $5.49 $0.46 $5.94 2022 $5.55 $0.47 $6.02 2023 $5.58 $0.48 $6.07 2024 $5.60 $0.50 $6.10 2025 $5.58 $0.51 $6.10 2026 $5.65 $0.53 $6.18 2027 $5.65 $0.54 $6.19 2028 $5.73 $0.56 $6.29 2029 $5.89 $0.58 $6.47 2030 $5.83 $0.60 $6.42 2031 $5.86 $0.61 $6.47 2032 $5.91 $0.63 $6.54 2033 $5.94 $0.65 $6.59 2034 $5.97 $0.67 $6.64 2035 $6.02 $0.69 $6.71 2036 $6.05 $0.71 $6.76 2037 $6.08 $0.73 $6.81 2038 $6.13 $0.75 $6.89 2039 $6.16 $0.78 $6.94 2040 $6.20 $0.80 $7.00 2041 $6.24 $0.82 $7.07
89 We convert 2007 dollars to 2008 dollars according to the Implicit Price Deflator for GDP, available through the U.S. Bureau of Economic Analysis. The seasonally adjusted price indices for U.S. GDP in 2007 and 2008 are 106.221 and 108.481, respectively, so the conversion factor from 2007 dollars to 2008 dollars is 108.481/106.221 = 1.021.

100
2042 $6.28 $0.85 $7.12 2043 $6.31 $0.87 $7.18 2044 $6.36 $0.90 $7.26 2045 $6.39 $0.93 $7.32 2046 $6.44 $0.96 $7.39 2047 $6.47 $0.98 $7.45 2048 $6.50 $1.01 $7.51 2049 $6.55 $1.04 $7.59 2050 $6.58 $1.08 $7.66
Table V-18 Annual Non-Discounted Benefits for Light Trucks
in Millions of 2008 Dollars
Year of Fuel CO2 Total Non-
Benefit Saved Avoided Discounted Benefits
2013 $0.39 $0.03 $0.42 2014 $1.68 $0.14 $1.82 2015 $3.04 $0.25 $3.29 2016 $4.33 $0.35 $4.68 2017 $4.90 $0.39 $5.29 2018 $5.18 $0.41 $5.59 2019 $5.41 $0.43 $5.85 2020 $5.54 $0.45 $5.99 2021 $5.57 $0.46 $6.03 2022 $5.63 $0.48 $6.11 2023 $5.67 $0.49 $6.16 2024 $5.68 $0.51 $6.19 2025 $5.67 $0.52 $6.19 2026 $5.73 $0.54 $6.27 2027 $5.73 $0.55 $6.29 2028 $5.81 $0.57 $6.38 2029 $5.98 $0.59 $6.56 2030 $5.91 $0.60 $6.52 2031 $5.95 $0.62 $6.57 2032 $5.99 $0.64 $6.64 2033 $6.03 $0.66 $6.69 2034 $6.06 $0.68 $6.74 2035 $6.11 $0.70 $6.81 2036 $6.14 $0.72 $6.86

101
2037 $6.17 $0.74 $6.92 2038 $6.22 $0.77 $6.99 2039 $6.26 $0.79 $7.04 2040 $6.29 $0.81 $7.10 2041 $6.34 $0.84 $7.17 2042 $6.37 $0.86 $7.23 2043 $6.40 $0.89 $7.29 2044 $6.45 $0.91 $7.37 2045 $6.48 $0.94 $7.43 2046 $6.53 $0.97 $7.50 2047 $6.57 $1.00 $7.56 2048 $6.60 $1.03 $7.63 2049 $6.65 $1.06 $7.71 2050 $6.68 $1.09 $7.77
Most of the rule’s costs will be incurred when the tires are produced. Thus in order to compare costs and benefits, we shall discount benefits back to the year in which the tires were produced.
Discounted Benefits
Per OMB Circular A-94, NHTSA uses discount rates of 3% and 7%. For more information on these discount rates, see NHTSA’s recent fuel economy proposed rule for model year 2012-2016 light vehicles. The factor applied to discount one dollar back to its
mid-year value k years ago, using a discount rate of r%, is kr −
+
5.0
1001 .
Recall that as a consequence of our assumed tire life of 45,000 miles and VMT schedules for cars and light trucks, replacement tires last at most 7 years. Thus the benefits (fuel saved and CO2 avoided) in year n result from tires manufactured in years n – 7 through n. For instance, light truck tires manufactured in 2015 accrue benefits during the time period in 2015-2022 and those benefits are discounted back to the year of purchase in 2015. We present these values in the following tables.

102
Table V-19
Discounted Benefits for Passenger Cars (Millions of 2008 dollars)
Year of Discounted Discounted Benefit 3% 7%
2013 $0.65 $0.64 2014 $1.93 $1.84 2015 $3.22 $3.03 2016 $4.32 $4.00 2017 $4.99 $4.57 2018 $5.26 $4.81 2019 $5.39 $4.93 2020 $5.49 $5.02 2021 $5.54 $5.06 2022 $5.61 $5.13 2023 $5.65 $5.17 2024 $5.68 $5.20 2025 $5.68 $5.19 2026 $5.75 $5.26 2027 $5.77 $5.28 2028 $5.86 $5.36 2029 $6.02 $5.51 2030 $5.98 $5.47 2031 $6.03 $5.51 2032 $6.09 $5.57 2033 $6.14 $5.61 2034 $6.19 $5.66 2035 $6.25 $5.72 2036 $6.30 $5.76 2037 $6.35 $5.81 2038 $6.41 $5.87 2039 $6.46 $5.91 2040 $6.52 $5.96 2041 $6.58 $6.02 2042 $6.64 $6.07 2043 $6.69 $6.12 2044 $6.76 $6.18 2045 $6.81 $6.23 2046 $6.89 $6.30 2047 $6.94 $6.35 2048 $7.00 $6.40

103
2049 $7.07 $6.47 2050 $7.13 $6.52
Table V-20 Discounted Benefits for Light Trucks
(Millions of 2008 dollars)
Year of Discounted Discounted Benefit 3% 7%
2013 $0.42 $0.41 2014 $1.76 $1.68 2015 $3.12 $2.92 2016 $4.38 $4.03 2017 $4.93 $4.50 2018 $5.20 $4.74 2019 $5.42 $4.93 2020 $5.55 $5.04 2021 $5.59 $5.08 2022 $5.66 $5.15 2023 $5.71 $5.19 2024 $5.74 $5.21 2025 $5.74 $5.21 2026 $5.81 $5.28 2027 $5.83 $5.29 2028 $5.92 $5.38 2029 $6.08 $5.53 2030 $6.04 $5.49 2031 $6.09 $5.53 2032 $6.15 $5.59 2033 $6.20 $5.63 2034 $6.25 $5.68 2035 $6.31 $5.73 2036 $6.36 $5.78 2037 $6.41 $5.83 2038 $6.48 $5.89 2039 $6.53 $5.93 2040 $6.58 $5.98 2041 $6.65 $6.04 2042 $6.70 $6.09 2043 $6.76 $6.14 2044 $6.83 $6.20 2045 $6.88 $6.25

104
2046 $6.95 $6.32 2047 $7.01 $6.37 2048 $7.07 $6.42 2049 $7.14 $6.49 2050 $7.20 $6.55
Table V-21
Discounted Benefits for Passenger Cars and Light Trucks, Combined (Millions of 2008 dollars)
Year of Discounted Discounted Benefit 3% 7%
2013 $1.06 $1.04 2014 $3.68 $3.52 2015 $6.34 $5.95 2016 $8.71 $8.03 2017 $9.91 $9.08 2018 $10.46 $9.55 2019 $10.81 $9.86 2020 $11.04 $10.07 2021 $11.13 $10.14 2022 $11.27 $10.28 2023 $11.36 $10.36 2024 $11.42 $10.41 2025 $11.42 $10.41 2026 $11.56 $10.54 2027 $11.59 $10.57 2028 $11.78 $10.74 2029 $12.11 $11.04 2030 $12.02 $10.96 2031 $12.11 $11.04 2032 $12.24 $11.16 2033 $12.33 $11.24 2034 $12.43 $11.33 2035 $12.56 $11.45 2036 $12.66 $11.54 2037 $12.76 $11.63 2038 $12.89 $11.75 2039 $12.99 $11.84 2040 $13.10 $11.94 2041 $13.23 $12.06 2042 $13.34 $12.16 2043 $13.45 $12.26

105
2044 $13.59 $12.39 2045 $13.70 $12.49 2046 $13.84 $12.62 2047 $13.95 $12.72 2048 $14.07 $12.83 2049 $14.22 $12.96 2050 $14.33 $13.07

106
SENSITIVITY ANALYSIS Our benefits assessment depends on the values of several parameters, listed in Table V-22. In this section we assess the sensitivity of our benefits estimates to the values of these parameters. To examine the sensitivity to a given parameter (for instance, the number of miles a replacement tire is driven before it is replaced), we compute the benefits that would have resulted had the value of the parameter (in this case, 45,000 miles) been increased or reduced by one percent (in this case, to 45,450 or 44,550 miles), holding the values of all other parameters (e.g. fuel price, VMT schedules, etc) at the values used in the benefits calculations. Rather than presenting all benefits estimates that would result under 3% and 7% discounting for each of 2013-2050, we present four of these figures to illustrate the effect. Namely, we present the estimates under 3% and 7% discounting for 2050 and the corresponding combined figures for 2013-2050. For parameters that represent a family of values (e.g. the VMT schedules, or fuel prices), we simultaneously raise or lower all members of the family by one percent (e.g. we raise or lower each AEO reference fuel price by one percent). Note that it makes less sense to raise or lower year-valued parameters (such as the base year for CO2 price increases) by one percent, as this would result in a large change (on the order of 20 years). Thus, rather than raising or lowering the year-valued parameters by one percent, we shall raise or lower them by one year. This affects two parameters: the base year for CO2 price increases and the first year of the tire program. The following table presents the results of our sensitivity analyses. Table V-23 presents the percentage change in the benefits resulting from lowering the values of one parameter at a time.
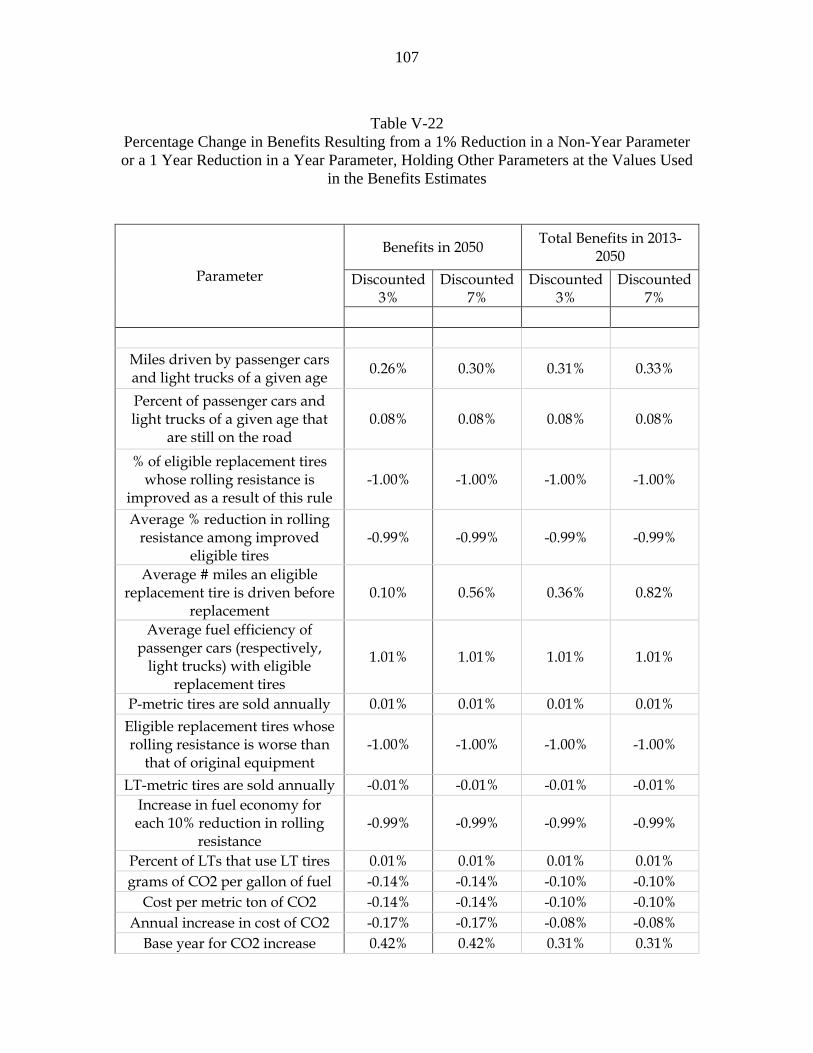
107
Table V-22
Percentage Change in Benefits Resulting from a 1% Reduction in a Non-Year Parameter or a 1 Year Reduction in a Year Parameter, Holding Other Parameters at the Values Used
in the Benefits Estimates
Parameter
Benefits in 2050 Total Benefits in 2013-2050
Discounted 3%
Discounted 7%
Discounted 3%
Discounted 7%
Miles driven by passenger cars and light trucks of a given age 0.26% 0.30% 0.31% 0.33%
Percent of passenger cars and light trucks of a given age that
are still on the road 0.08% 0.08% 0.08% 0.08%
% of eligible replacement tires whose rolling resistance is
improved as a result of this rule -1.00% -1.00% -1.00% -1.00%
Average % reduction in rolling resistance among improved
eligible tires -0.99% -0.99% -0.99% -0.99%
Average # miles an eligible replacement tire is driven before
replacement 0.10% 0.56% 0.36% 0.82%
Average fuel efficiency of passenger cars (respectively,
light trucks) with eligible replacement tires
1.01% 1.01% 1.01% 1.01%
P-metric tires are sold annually 0.01% 0.01% 0.01% 0.01% Eligible replacement tires whose rolling resistance is worse than
that of original equipment -1.00% -1.00% -1.00% -1.00%
LT-metric tires are sold annually -0.01% -0.01% -0.01% -0.01% Increase in fuel economy for each 10% reduction in rolling
resistance -0.99% -0.99% -0.99% -0.99%
Percent of LTs that use LT tires 0.01% 0.01% 0.01% 0.01% grams of CO2 per gallon of fuel -0.14% -0.14% -0.10% -0.10%
Cost per metric ton of CO2 -0.14% -0.14% -0.10% -0.10% Annual increase in cost of CO2 -0.17% -0.17% -0.08% -0.08%
Base year for CO2 increase 0.42% 0.42% 0.31% 0.31%

108
Multiplier to obtain 2008 $ from 2007 $ -1.00% -1.00% -1.00% -1.00%
Cost per tire to improve RR 0.00% 0.00% 0.00% 0.00% First year of tire program -0.83% -0.83% -1.22% -1.23%
Manufacturers’ Claims Manufacturers have made claims about how their tires can perform with new technology. For example, Michelin claims90
that their silica technology can reduce rolling resistance by 10 percent while improving wet traction and keeping treadwear at the same level. The following figure was presented by Michelin in docket comments to the agency, with the statement:
Relationship between traction and rolling resistance “Michelin also wishes to respond to concerns that lowering rolling resistance may lead to reduced wet traction or wear performance. Tire manufacturers make design choices that determine the overall balance of performance of a tire. Improving rolling resistance does not necessarily compromise wet traction or wear life.”
90 www.Regulations.gov Docket entry NHTSA-2008-0121-0048

109
Tire Redesign for RR and Traction Improvement
(higher number represents better performance)
In an article91
91 Bridgestone's new tires can improve fuel economy by four percent, February 11, 2010, Copyright 2010 Newstex LLC
referring to SUV tires, Bridgestone claims that the lower rolling resistance for these Ecopia tires can result in roughly 4 percent better fuel economy when compared to a conventional Bridgestone tire.

110
VI. COSTS The costs of the rule derive from various sources. We expect the costs of the rule to comprise:
• If consumers use the information to purchase tires and demand different tires or if manufacturers believe the information will have such an effect, there will be costs that manufacturers will spend to improve tires; test tires for traction, fuel efficiency, and treadwear; and report the ratings to NHTSA. Even if this final rule has no impact on the types of tires marketed, there will still be costs for testing and reporting the ratings to NHTSA
• Costs that the government will spend to implement the consumer information program.
Note that some of these costs are required to occur under the rule (e.g., testing and reporting costs), while others represent costs that entities may choose to incur to some degree or forego completely (e.g., costs to improve tires). The agency cannot estimate the opportunity costs of the possibility that traction and treadwear properties could be diminished as a result of the rule. We have no basis for estimating what if any changes might occur in safety or treadwear. Section VI.A presents public comment on the PRIA’s cost estimates, and Section VI.B presents cost estimates for this rule that have been revised based on public comment. A. PUBLIC COMMENT CONCERNING COSTS The only comments we received on the PRIA’s cost estimates were from RMA. Their comments fell into six areas: costs to improve tires, testing costs, labeling costs, reporting costs, the reduction in cost from no longer requiring the UTQG molding, and other traction- and treadwear-related costs. Comments Concerning Costs to Improve Tires RMA generally agreed with NHTSA’s estimate that the rolling resistance of a tire could be reduced by 5-10% with no degradation to traction nor treadwear for $3 per tire, on average. RMA stated that the range would be $2-6, not the $2-4 projected by NHTSA, with a “median or average” of $3 per tire. NHTSA’s Response Consistent with RMA’s comment, we continue to use $3 per tire in our cost estimate for silica technology as one potential way that tire manufacturers could respond to the final rule. In this analysis, we are only using the average cost per tire and not the $2 to $6 range, which would be mainly affected by tire size.

111
Comments Concerning Testing Costs RMA felt the PRIA’s testing costs to be vastly underestimated. The PRIA reported testing costs of $3.73 million in the first year and $0.02 million in each subsequent year. RMA estimates that the costs to its eight member companies alone would be $14.7 - $51.1 million in the first year and $10.2 - $27.2 in subsequent years. RMA based its figures on estimates from its eight member companies. RMA describes its lower bound (“best case”) estimates as reflecting a scenario in which: 1) manufacturers would be required to report only tire ratings (and not raw test values), and 2) tires whose reported rating exceeds that obtained by NHTSA in independent testing would be subject to enforcement. Its upper bound (“worst case”) estimates reflect: 1) manufacturers being required to report raw test values as well as ratings, and 2) noncompliance is determined by a one-way tolerance approach. Thus, RMA’s “worst case” figures involve fewer extrapolated ratings (more ratings obtained directly by testing) than the “best case” figures. In its comments, RMA provides a breakout of the combined testing cost for RMA members estimates by several broad categories. In particular, RMA predicts substantial capital costs ($10.7 – $39.0 million) and substantial annual costs for traction and treadwear testing beyond that incurred under UTQG ($8.8 – 23.6 million), each of which was treated as negligible in the PRIA. NHTSA’s Response First, as explained above in section VII.B.2 of the final rule preamble, the agency is not requiring the reporting of raw test values. We continue to believe that only one test per tire SKU will be necessary and that additional testing would be at the tire manufacturers’ option, and will discuss this further in the discussion of enforcement approach in the supplemental NPRM on the consumer information component of this program. It is difficult to respond to RMA’s testing cost estimate because only limited information is provided on its derivation. For instance, RMA does not provide any information regarding how its members arrived at a combined capital cost of $3,275,000 - $7,725,000 to purchase rolling resistance testing equipment (other than that they reflect “best” and “worst” cases, as described above). They do not say how many machines they think they need to buy or what they estimated was the cost of each testing machine. Likewise RMA does not describe how it arrived at figures of $1,542,750 - $3,605,248 to conduct additional traction tests or $7,305,500 - $20,010,976 to conduct additional treadwear tests beyond what the testing they already do under UTQG. They describe these as reflecting the incremental cost of testing individual SKUs rather than “tire lines”, with 2,685 new RMA SKUs annually. Additionally, it seems odd to us that the per-SKU costs implied by RMA’s initial and annual testing costs appear to differ. If, say, RMA’s “best case” estimates reflect x% of SKU’s being tested, then in the first year under the “best case”, RMA is testing 150x SKUs (x% of 15,000) for a total of $949,000, or $6,327/x per SKU. However in the second year under the same assumptions (“best case”), the per-SKU cost is $8,681/x (i.e.,

112
26.85x SKUs tested for $233,080). It is not clear to us, why the same test would cost more in the second year (in constant dollars) than in the first. The same concern applies to RMA’s rolling resistance cost estimates under the “worst case” scenario. The annual testing costs for traction and treadwear appear curious in that the same figures appear to be used for the first year and subsequent years (e.g. $7,305,500 - $20,010,976 for treadwear), although presumably far fewer SKUs would be tested in subsequent years than in the first year (as with rolling resistance). However, although we have the concerns cited above, we acknowledge RMA’s points that we neglected to include capital costs to purchase testing equipment, and we likely underestimated the number of new SKUs produced annually, while overestimating the number of SKUs for sale each year. Note that RMA provided estimates for just RMA members and for the industry. For example, the total current number of SKUs affected by the rule was estimated to be 15,000 for RMA and 19,000 for the industry and the total number of new SKUs added per year was estimated to be 2,685 for RMA members and 3,222 for the industry. We will use the industry estimates for predicting the costs of the final rule. RMA’s “best case” capital cost estimate of a one-time charge of $10.7 million appears reasonable, as a combined cost to the industry ($3.3 million for rolling resistance machines, $1.5 million for additional traction testing equipment, and $5.9 million for additional treadwear testing equipment). We acknowledge that our EWR-based estimate of 125 new SKUs annually was a substantial underestimate, as relatively few SKUs are represented in the EWR database. RMA’s estimate of 3,222 new SKUs annually for the industry is likely to be more accurate. For calculation purposes, we estimate 3,222 new SKUs annually, which would correspond to 17% of SKU’s in any given year being new using RMA’s estimate of 19,000 SKUs for sale per year. We also revise our Smither’s-based estimate of 20,708 SKUs for sale per year downward to this 19,000 figure. We disagree with RMA that measuring peak in additional to slide values in the traction test will result in substantive cost. We believe that this marginal cost is negligible, based on our testing. We agree that the NPRM’s proposed 0-100 point scale would likely lead manufacturers to test substantially more SKUs for traction and treadwear than under UTQG, which used a coarser bin-based rating scale. In our revised cost estimates, we will assume that manufacturers test every SKU for traction and treadwear (as well as rolling resistance), and would have tested none under UTQG. We feel that RMA’s estimates of the cost to test a SKU for traction and treadwear are vastly overstated. Based on RMA’s “worst case” scenario reflected testing every SKU, its estimates of $3.6 million (to test 2,685 SKUs) annually for traction imply per-SKU costs of $1,343 for traction and RMA’s estimate of $20.0 million testing costs for
113
treadwear imply $7,453 per SKU for treadwear. Based on our testing costs, we believe that more reasonable estimates would be $500 to test a SKU for traction and $500 to test a SKU for treadwear in an indoor treadwear test. Each traction and indoor treadwear test uses 2 tires per SKU, while the rolling resistance test uses 1 tire per SKU. Manufacturers could test treadwear using the UTQGS course. Test costs using the UTQGS course are estimated to be about $15,000 per SKU. A small percent of all SKUs are tested on the UTQGS course per year. We assume no incremental testing using the UTQGS course and thus no incremental costs for treadwear testing using the UTQGS course. Based on the Smither’s report, in the NPRM we estimated that testing for rolling resistance would cost about $180 per SKU. Smither’s actually reports that testing 20,708 SKUs would cost $11,182,320 ($540 per SKU), however those cost are for testing in triplicate. So, the cost for testing one tire per SKU are $180 per SKU. This figure represents the cost of performing the test, not including the cost of supplying the tire to be tested, which we estimate to be negligible. Thus, our revised per-SKU costs to test for rolling resistance, traction, and treadwear amount to $1,180 (i.e. $180 + $500 + $500). This would result in testing costs of $22,420,000 in the first year (19,000 SKUs) and $3,801,960 in subsequent years (3,222 new SKUs annually). Combined with our capital costs of $10.7 million, which are only incurred in the first year, our total cost estimates for testing, revised for this final rule, are $33.1 million in the first year and $3.8 million in each subsequent year. Our final testing cost estimates assume one test per SKU for rolling resistance, traction, and treadwear, however, it is possible that manufacturers could test far fewer tires. We examined the possibility of testing just 25 percent of the SKUs to determine whether a reasonable value could be determined. We modeled the Firestone FR380 tire tested for rolling resistance in various sizes by the California Energy Commission by arbitrarily assigning group 1 to 4 to various sizes and modeling the RRF by group {each group containing 25 percent of the tires. All models had R2 values of 0.95+, meaning that you could model the results for other tires no matter which 25 percent you used. For this analysis we assume that all SKUs are tested, but it appears that manufacturers could test only 25 percent of their SKUs and model the rest. The number of tests can be determined by the manufacturers, as explained in section III.A.5 of the final rule preamble. Comments Concerning Labeling Costs Since the labeling requirement is not being implemented at this time, comments on label costs will be considered in further proceedings on this issue. Comments Concerning the Reduction in Cost from No Longer Mandating the UTQG Molding

114
Since this final rule does not change the UTQG molding requirements, comments on their costs will be considered in connection with further proceedings on this issue. Comments Concerning Reporting Costs RMA also felt this item to be underestimated in the PRIA. The PRIA estimated reporting costs at $0.4 million in the first year and $0.1 million in each subsequent year. RMA estimates that the costs to its eight member companies alone would be $3.0 - $8.0 million in the first year and $0.4 - $0.9 in subsequent years. NHTSA’s Response As with the testing costs, little information is provided by RMA regarding how it derived its reporting cost figures making it difficult to address their concern. For instance, RMA provides no further explanation of how its members collectively arrived at a figure of $2,995,000 for initial costs under its “best case” scenario. Presumably this was derived based on component figures (such as labor costs to program computers to compile the reports and capital costs to purchase or upgrade equipment), but such figures are not provided. We feel that even RMA’s “best case” costs are vastly overstated. We understand their figures of $2,995,000 in first-year and $355,000 in subsequent-year costs to represent the combined cost for its 8 member companies. However this would imply annual reporting costs of $44,375 per manufacturer ($355,000/8) and set-up costs of $330,000 per manufacturer (($2,995,000-$355,000)/8). We believe our PRIA per-manufacturer estimates of $3,755 to maintain computers, $287 to produce an annual report to NHTSA on its tire ratings, and $10,000 in setup costs are far more realistic and are based on costs for the early warning system. Comments Concerning Additional Traction-Related Costs RMA’s argued that the agency should quantify the safety disbenefit which could result if consumers chose tires that had better rolling resistance and less traction qualities. NHTSA’s Response Quantifying a safety opportunity cost is difficult on several fronts. First, we don’t know how consumers will react to new ratings and new information. Second, quantifying a potential impact on safety is difficult. If consumers demand fuel efficient but cheap tires, manufacturers may make tires with lower safety ratings than the current market mix. This would mean that it would take more distance to stop, but quantifying exactly how that translates into a difference in stopping distance is difficult. In addition, we don’t know what vehicle the tires will be mounted on and its loading and baseline stopping distance. Once we have a baseline and change in stopping distance, we could estimate a safety impact. However, having two unknowns before getting to this calculation makes the estimate somewhat meaningless.

115
Comments Concerning Additional Treadwear-Related Costs RMA’s argued that there could be increased tire disposal costs if consumers chose tires that achieved higher fuel economy but lower treadwear ratings. NHTSA’s Response As with the safety discussion above, it is hard to tell exactly how consumers will react to new ratings and new information. Developing “what if” scenarios with wide varieties of possible outcomes, without any basis for them, are not very helpful for decision makers. B. COST ESTIMATES FOR THIS FINAL RULE. Based on public comment, we have revised the cost estimates for the final rule. All costs in this section are expressed in 2008 dollars. There are about: 287 million tires sold per year 200 million light vehicle replacement tires sold per year 19 million are LT-tires, snow tires, or others not required to be marked by UTQGS. 40 million tires that already have good rolling resistance Thus, there are about: 181 million tires affected per year 141 million tires in the target population that could improve rolling resistance
Tire Manufacturer Costs
Costs to Improve Tires Tire Costs: There are many different ways to design the tread of a tire and affect its rolling resistance. The approach using silica for which we have estimated costs is a viable approach currently being used by Michelin and other tire manufacturers. There are other approaches using special grades of carbon black or combinations of silica or other additives with special grades of carbon black. However, we believe that all of the approaches currently being used result in additional costs per tire One way to improve the tire’s rolling resistance is to include silica in its tread. This requires processing the silica in ways that result in the silica product being a more expensive material than the carbon black it is replacing and results in a more expensive process to make the tire. So, both the material ends up being more expensive and the tire manufacturing process ends up being more expensive. The increased cost per tire depends upon the size of the tire. The agency estimates that the increased cost at the consumer level is $2.00 to $6.00 per tire for P-metric tires of different sizes and that the average tire affected by this proposal would increase in price by $3.00 if all other tire
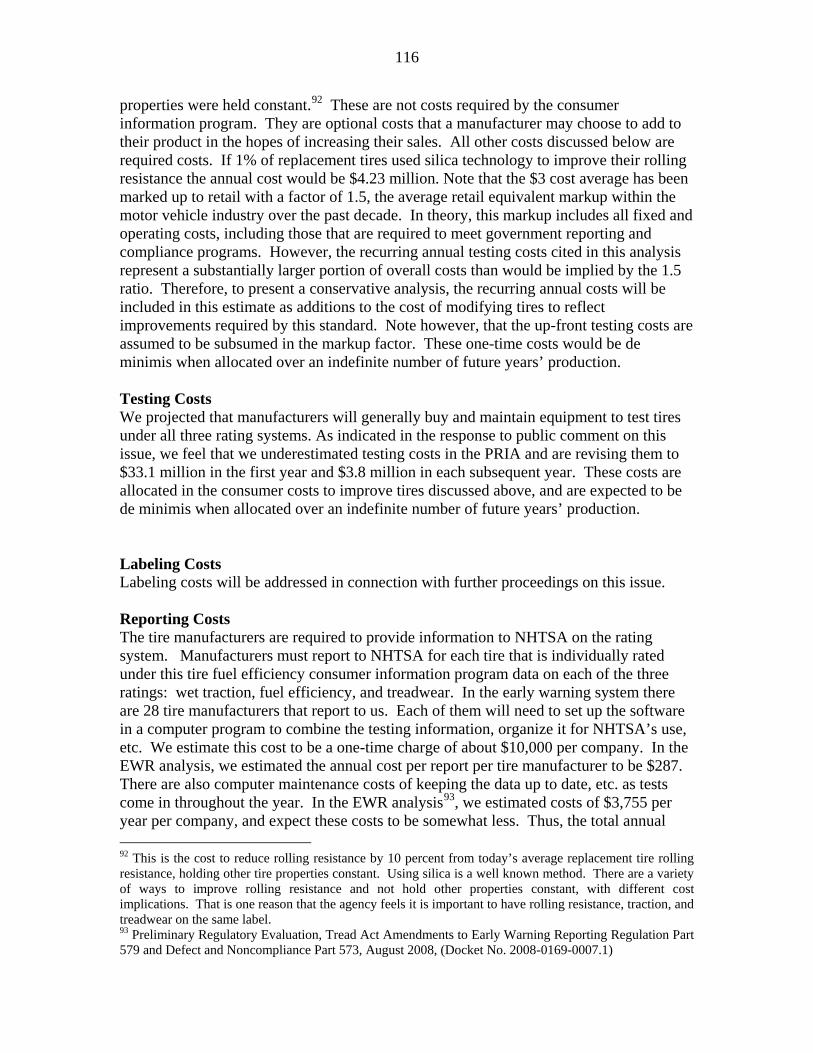
116
properties were held constant.92
These are not costs required by the consumer information program. They are optional costs that a manufacturer may choose to add to their product in the hopes of increasing their sales. All other costs discussed below are required costs. If 1% of replacement tires used silica technology to improve their rolling resistance the annual cost would be $4.23 million. Note that the $3 cost average has been marked up to retail with a factor of 1.5, the average retail equivalent markup within the motor vehicle industry over the past decade. In theory, this markup includes all fixed and operating costs, including those that are required to meet government reporting and compliance programs. However, the recurring annual testing costs cited in this analysis represent a substantially larger portion of overall costs than would be implied by the 1.5 ratio. Therefore, to present a conservative analysis, the recurring annual costs will be included in this estimate as additions to the cost of modifying tires to reflect improvements required by this standard. Note however, that the up-front testing costs are assumed to be subsumed in the markup factor. These one-time costs would be de minimis when allocated over an indefinite number of future years’ production.
Testing Costs We projected that manufacturers will generally buy and maintain equipment to test tires under all three rating systems. As indicated in the response to public comment on this issue, we feel that we underestimated testing costs in the PRIA and are revising them to $33.1 million in the first year and $3.8 million in each subsequent year. These costs are allocated in the consumer costs to improve tires discussed above, and are expected to be de minimis when allocated over an indefinite number of future years’ production. Labeling Costs Labeling costs will be addressed in connection with further proceedings on this issue. Reporting Costs The tire manufacturers are required to provide information to NHTSA on the rating system. Manufacturers must report to NHTSA for each tire that is individually rated under this tire fuel efficiency consumer information program data on each of the three ratings: wet traction, fuel efficiency, and treadwear. In the early warning system there are 28 tire manufacturers that report to us. Each of them will need to set up the software in a computer program to combine the testing information, organize it for NHTSA’s use, etc. We estimate this cost to be a one-time charge of about $10,000 per company. In the EWR analysis, we estimated the annual cost per report per tire manufacturer to be $287. There are also computer maintenance costs of keeping the data up to date, etc. as tests come in throughout the year. In the EWR analysis93
92 This is the cost to reduce rolling resistance by 10 percent from today’s average replacement tire rolling resistance, holding other tire properties constant. Using silica is a well known method. There are a variety of ways to improve rolling resistance and not hold other properties constant, with different cost implications. That is one reason that the agency feels it is important to have rolling resistance, traction, and treadwear on the same label.
, we estimated costs of $3,755 per year per company, and expect these costs to be somewhat less. Thus, the total annual
93 Preliminary Regulatory Evaluation, Tread Act Amendments to Early Warning Reporting Regulation Part 579 and Defect and Noncompliance Part 573, August 2008, (Docket No. 2008-0169-0007.1)

117
cost is estimated to be $4,042 per company. The total costs would be $280,000 + $113,176 = $393,176 for the first year and $113,176 as an annual cost for the 28 tire manufacturers.
Tire Dealer Costs
We estimate that there are approximately 60,000 tire retail establishments nationwide. Based on the Small Business Administration’s data, there are an estimated 20,481 tire dealers (whose main business is selling tires). Based on estimates that there are roughly 100,000 fuel stations in the United States and estimates that about 30 percent of them provide vehicle repair service, we estimate that there are approximately 30,000 service stations (whose main business is selling fuel) that sell tires. In addition, there are many other types of stores and websites that sell tires; we estimate approximately 10,000 national retailers, ‘eTailers’, private brands, specialty tires and department/discount stores that sell tires. Requirements for tire dealers are not being set in this final rule.
Costs to the government occur in three areas: Federal Government Costs
Enforcement costs, where NHTSA would spot check compliance with the requirement. NHTSA estimates that it will set up a $730,000 program to spot check compliance. Web costs, NHTSA estimates that will be spend $550,000 per year setting up and keeping up to date with a web site that includes information on 20,000 tires. Information provided to dealers: Currently NHTSA provides a booklet to tire dealers with the UTQGS information. That booklet is on 8.5” x 11” paper and is 141 pages long. The printing costs are $3,190 per year. A decision has not been made on the continued use of that booklet. Combined the incremental costs are estimated to be $1.28 million. Summary In summary, the final rule is estimated to result in the following costs shown in Table VI-1. Total costs including tire improvements if 1 percent of the target population had improved rolling resistant tires are $39.1 million in the first year and annually $9.4 million in subsequent years. If you examine only the program costs (not counting the tire improvement costs), the costs are $34.8 million in the first year and $5.2 million in subsequent years.
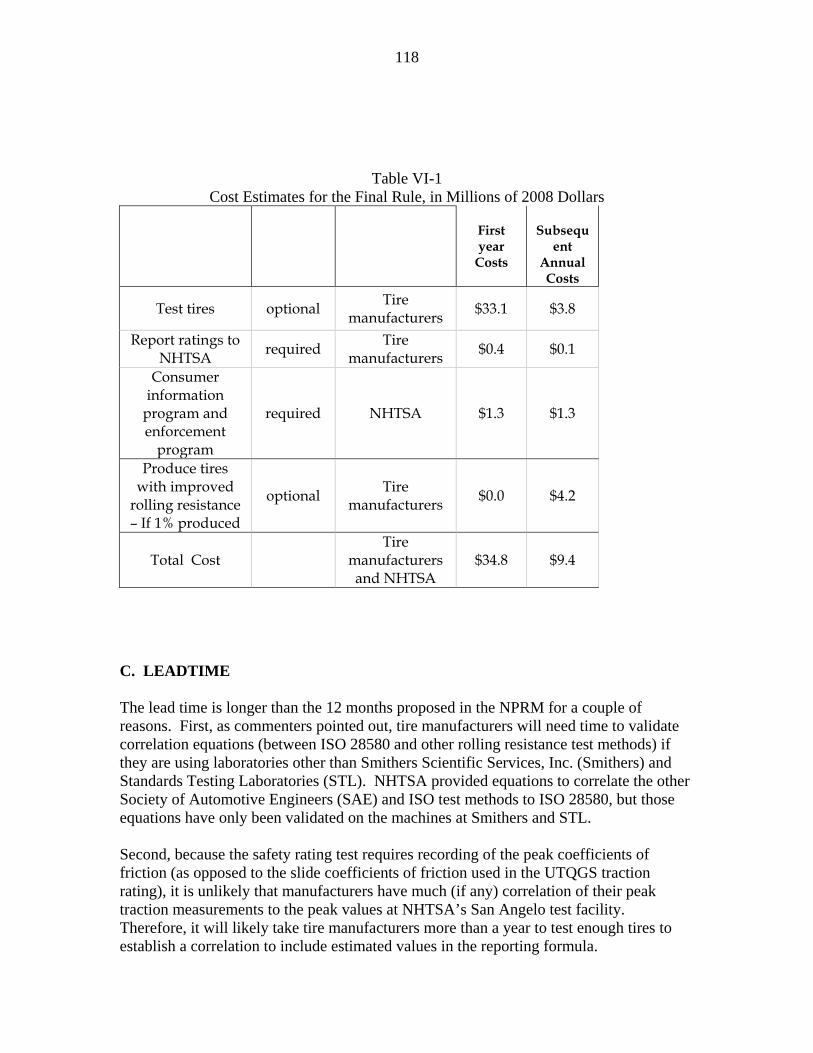
118
Table VI-1 Cost Estimates for the Final Rule, in Millions of 2008 Dollars
First year
Costs
Subsequ
ent Annual Costs
Test tires optional Tire manufacturers $33.1 $3.8
Report ratings to NHTSA required Tire
manufacturers $0.4 $0.1
Consumer information
program and enforcement
program
required NHTSA $1.3 $1.3
Produce tires with improved
rolling resistance – If 1% produced
optional Tire manufacturers $0.0 $4.2
Total Cost Tire
manufacturers and NHTSA
$34.8 $9.4
C. LEADTIME The lead time is longer than the 12 months proposed in the NPRM for a couple of reasons. First, as commenters pointed out, tire manufacturers will need time to validate correlation equations (between ISO 28580 and other rolling resistance test methods) if they are using laboratories other than Smithers Scientific Services, Inc. (Smithers) and Standards Testing Laboratories (STL). NHTSA provided equations to correlate the other Society of Automotive Engineers (SAE) and ISO test methods to ISO 28580, but those equations have only been validated on the machines at Smithers and STL. Second, because the safety rating test requires recording of the peak coefficients of friction (as opposed to the slide coefficients of friction used in the UTQGS traction rating), it is unlikely that manufacturers have much (if any) correlation of their peak traction measurements to the peak values at NHTSA’s San Angelo test facility. Therefore, it will likely take tire manufacturers more than a year to test enough tires to establish a correlation to include estimated values in the reporting formula.

119
Third, manufacturers cannot start rating for fuel efficiency until they are able to purchase certified reference tires from a Reference Lab for the ISO 28580 lab alignment procedure. NHTSA has determined that upon the availability of certified reference tires, manufacturers will be able to accurately rate all tires within 24 months. NHTSA is designating itself as the Reference Lab that will certify reference tires for manufacturers, but needs time to determine an appropriate laboratory to assist with this effort. NHTSA will have the ability to certify reference tires in a little over a year from the issuance of this final rule. Finally, the agency will announce the effective dates with the subsequent final rule.

120
VII. COST BENEFIT ANALYSES In this chapter we combine the costs and benefits from a consumer’s perspective and an overall societal perspective of only the potential improvements to rolling resistance to see if they are likely to be cost beneficial. From the consumer perspective, we examine the case where tires cost an estimated $3 more per tire (or $12 for four) and improve rolling resistance by 5 percent. The fuel savings are dependent upon many factors. We examine light trucks with an average on-road fuel economy of 18.9 mpg and passenger cars with an average on-road fuel economy of 25 mpg.
Table VII-1 Fuel Saved from the Consumer’s Perspective1
Vehicle On-Road Fuel Economy
Reduction in Rolling
Resistance
Fuel Saved over the Tires' Life,
in Gallons 18.9 5% 15 25.0 5% 12
1Assumes all four tires are replaced. If fuel costs $3 per gallon, consumers would only need to save 4 gallons of fuel to save the $12 spent, and the amounts shown in Table VII-1 are much larger than that. If consumers drove 10,000 miles per year, and assuming an average 45,000 miles per tire lifetime, consumers would drive 22.2 percent of the tires lifetime mileage per year. With rounded savings of 12 to 15 gallons at $3 per gallon, the lifetime savings would be $35 to $45.
Table VII-2 illustrates the net impacts of the rule comparing the average annual benefits accrued through 2050 to the average annual costs under each of the 4 scenarios.

121
Table VII-2 Total Costs and Benefits Estimates (in millions of dollars) Average Annual Benefits and Costs over 2013-2050 Span
Assuming 1% of replacement tires are sold with improved rolling resistance
Rolling Resistance
Improvement 5%
Rolling Resistance
Improvement 10%
Rolling Resistance
Improvement 5%
Rolling Resistance
Improvement 10%
Discount Rate 3% 3% 7% 7% Costs $9.4 $9.4 $9.4 $9.4 Benefits $11.6 $23.2 $10.6 $21.2 Net Benefits (Costs)
$2.2 $13.8 $1.2 $11.8

122
VIII. REGULATORY FLEXIBILITY ACT AND UNFUNDED MANDATES REFORM ACT ANALYSIS Regulatory Flexibility Act The Regulatory Flexibility Act of 1980 (5 U.S.C. §601 et seq
.) requires agencies to evaluate the potential effects of their proposed and final rules on small businesses, small organizations and small governmental jurisdictions. In compliance with the Regulatory Flexibility Act, 5 U.S.C. 60l et seq., NHTSA has evaluated the effects of this final rule on small entities. The head of the agency has certified that this rule will not have a significant economic impact on a substantial number of small entities.
The factual basis for the certification (5 U.S.C. 605(b)) is set forth below. Although the agency is not required to issue an initial regulatory flexibility analysis, we discuss below many of the issues that an initial regulatory flexibility analysis would address. 5 U.S.C §603 requires agencies to prepare and make available for public comments initial and final regulatory flexibility analysis (RFA) describing the impact of proposed and final rules on small entities. Section 603(b) of the Act specifies the content of a RFA. Each RFA must contain:
1. A description of the reasons why action by the agency is being considered; 2. A succinct statement of the objectives of, and legal basis for a final rule; 3. A description of and, where feasible, an estimate of the number of small entities
to which the final rule will apply; 4. A description of the projected reporting, recording keeping and other compliance
requirements of a final rule including an estimate of the classes of small entities which will be subject to the requirement and the type of professional skills necessary for preparation of the report or record;
5. An identification, to the extent practicable, of all relevant Federal rules which may duplicate, overlap or conflict with the final rule;
6. Each final regulatory flexibility analysis shall also contain a description of any significant alternatives to the final rule which accomplish the stated objectives of applicable statutes and which minimize any significant economic impact of the final rule on small entities.
1. NHTSA is proposing this action in response to the Energy Independence and Security Act of 2007 (EISA).
Description of the reason why action by the agency is being considered
2. EISA requires the agency to develop a national tire fuel efficiency consumer information program to educate consumers about the effect of tires on automobile fuel efficiency, safety, and durability.
Objectives of, and legal basis for, the final rule
3. Description and estimate of the number of small entities to which the final rule will apply

123
The final rule will affect 28 tire manufacturers, none of which we believe are small businesses. Out of the 60,000 entities that sell tires, there are a substantial number of tire dealers/retailers that are small entities. Since this final rule does not finalize any requirements pertaining to tire retailers, this final rule would not have a significant economic impact on a substantial number of small entities. Business entities are defined as small business using the North American Industry Classification System (NAICS) code, for the purpose of receiving Small Business Administration assistance. The criteria for determining size, as stated in 13 CFR 121.201, are either the number of employees in the firm or total sales. For establishments primarily engaged in manufacturing tires (NAICS 326211), the firm must have less than 1,000 employees to be classified as a small business. For establishments primarily engaged as tire dealers (NAICS 441320), the firm must sell less than $6.0 million to be classified as a small business. For establishments primarily engaged as gasoline stations, (NAICS 447190), the firm must sell less than $7.5 million to be classified as a small business.
The final rule includes reporting requirements for tire manufacturers, which are not small businesses. There are no reporting requirements, record keeping, or other compliance requirements for tire dealers or retailers.
4. A description of the projected reporting, record keeping and other compliance requirements of a final rule including an estimate of the classes of small entities which will be subject to the requirement and the type of professional skills necessary for preparation of the report or record.
The current UTQGS tire marking requirement to some extent may duplicate the information provided on traction and treadwear.
5. An identification, to the extent practicable, of all relevant Federal rules which may duplicate, overlap, or conflict with the final rule
6.
Since this final rule does not finalize any requirements pertaining to tire retailers, this final rule would not have a significant economic impact on a substantial number of small entities.
A description of any significant alternatives to the final rule which accomplish the stated objectives of applicable statutes and which minimize any significant economic impact of the final rule on small entities.
Unfunded Mandates Reform Act
The Unfunded Mandates Reform Act of 1995 (Public Law 104-4) requires agencies to prepare a written assessment of the costs, benefits, and other effects of proposed or final rules that include a Federal mandate likely to result in the expenditures by States, local or tribal governments, in the aggregate, or by the private sector, of more than $100 million

124
annually (adjusted annually for inflation with base year of 1995). Adjusting this amount by the implicit gross domestic product price deflator for 2008 results in $133 million (108.483/81.536 = 1.33). This final rule is not estimated to have total costs of $133 million or more. The assessment may be included in conjunction with other assessments, as it is here.