Embed Size (px)
Citation preview
NATIONAL WHEAT CULTIVAR EVALUATION PROGRAMME UNDER IRRIGATION REPORT 2016
ARC FIELD CROPS DIVISIONSMALL GRAIN INSTITUTE
PRIVATE BAG X29BETHLEHEM 9700
TEL: 058 307 3400Fax: 058 307 3519
www.arc.agric.za
1
Programme ManagerW H Kilian
Project leaderW H Kilian
Technical support teamD Du Plessis
Me E van der Merwe
K Makuoane
B van Rensburg
Me H A Hatting
Me H Mopeli
Me C E Miles
2
TABLE OF CONTENTS
1. INTRODUCTION AND BACKGROUND.................................................................................4
2. SITE SELECTION AND CHARACTERISATION...................................................................5
3. ENTRIES FOR THE 2016 PROGRAM....................................................................................8
4. PLANTING AND TRIAL MONITORING................................................................................11
5. HARVESTING AND OUTCOMES..........................................................................................18
6. STATISTICAL ANALYSIS......................................................................................................19
7. RESULTS..................................................................................................................................20
3
1. INTRODUCTION AND BACKGROUND
Irrigation wheat is increasingly becoming important to the South African wheat industry, as
the area under dryland wheat in the summer rainfall area decreased significantly in the past
few years. Generally, the irrigation wheat area of South Africa can be divided into four main
geographic regions – the Cooler Central irrigation region in the Northern Cape, the Warmer
Northern irrigation region in North West, Limpopo and Gauteng provinces, the Highveld
region in Mpumalanga and Free State, and lastly, the KwaZulu-Natal region.
Mandate of the ARC-SGIThe ARC-Small Grain Institute has the mandate to conduct the National Cultivar Adaptation
programme in all the major irrigation production areas in the Republic of South Africa. This is
done to supply reliable guidelines for the choice of adapted cultivars to small grain producers
and policy makers. Cultivar selection should be based on long-term scientific data and
should be revised annually to make provision for new improved cultivars. ARC-Small Grain
Institute has the specific task and function within its mandate to conduct field trials on all
cultivars from the different breeding institutions. To achieve this goal the Small Grain
Institute requests and enlists the co-operation and co-ordination of other institutions and role
players within the industry to join and assist them with the task of gathering, combining and
presenting the results to the small grain industry. Data collected over the current season
may also be compared with historical data to get a reliable comparison of the longer term
data.
Objectives The specific objective of the study was to carry out wheat cultivar evaluation trials in all the
major irrigation wheat production regions of South Africa, namely KwaZulu-Natal, Highveld,
Cooler Central and Warmer Northern Irrigation areas, in line with the National Cultivar
Evaluation Protocol. The end objective of the cultivar evaluation program under irrigation is
to supply reliable guidelines for the choice of adapted cultivars to its clients and main
benefactors, mainly wheat producers. The data presented in this report were generated
from wheat cultivar adaptation trials under irrigation conditions in South Africa.
4
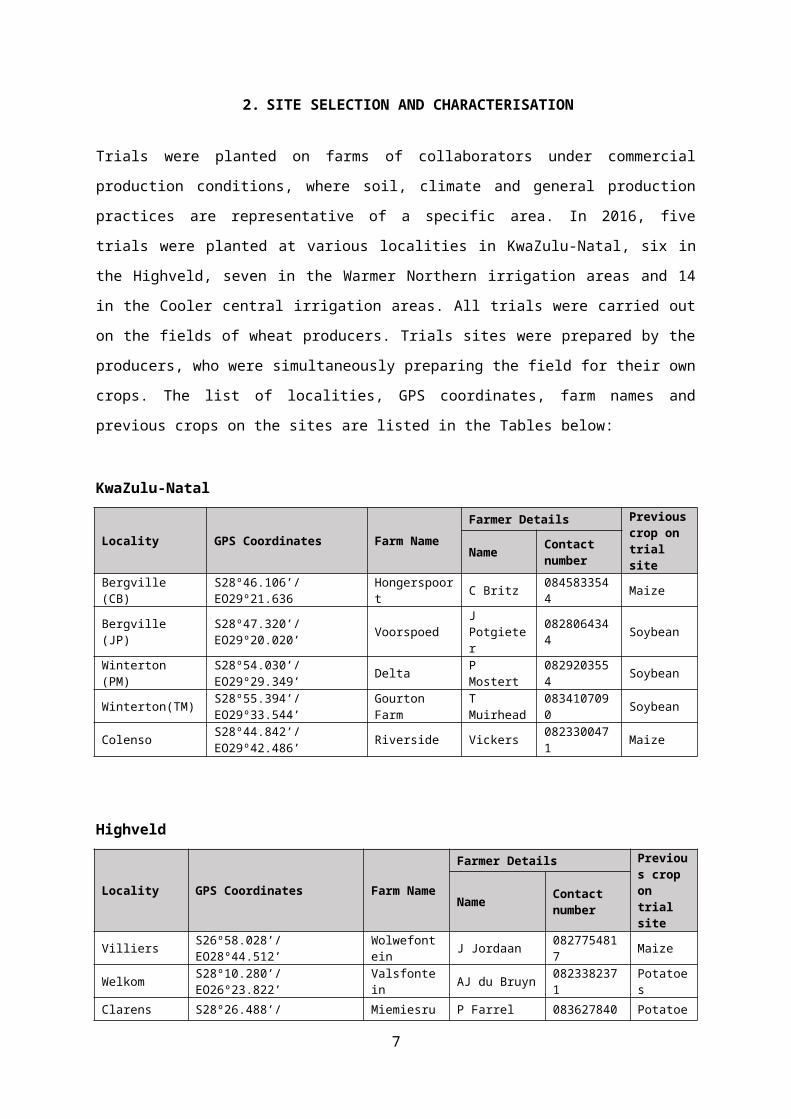
2. SITE SELECTION AND CHARACTERISATION
Trials were planted on farms of collaborators under commercial production conditions, where
soil, climate and general production practices are representative of a specific area. In 2016,
five trials were planted at various localities in KwaZulu-Natal, six in the Highveld, seven in
the Warmer Northern irrigation areas and 14 in the Cooler central irrigation areas. All trials
were carried out on the fields of wheat producers. Trials sites were prepared by the
producers, who were simultaneously preparing the field for their own crops. The list of
localities, GPS coordinates, farm names and previous crops on the sites are listed in the
Tables below:
KwaZulu-Natal
Locality GPS Coordinates Farm NameFarmer Details Previous
crop on trial siteName Contact
numberBergville (CB) S28º46.106’/EO29º21.636 Hongerspoort C Britz 0845833544 Maize
Bergville (JP) S28º47.320’/EO29º20.020’ Voorspoed J Potgieter 0828064344 Soybean
Winterton (PM) S28º54.030’/EO29º29.349’ Delta P Mostert 0829203554 Soybean
Winterton(TM) S28º55.394’/EO29º33.544’ Gourton Farm T Muirhead 0834107090 Soybean
Colenso S28º44.842’/EO29º42.486’ Riverside Vickers 0823300471 Maize
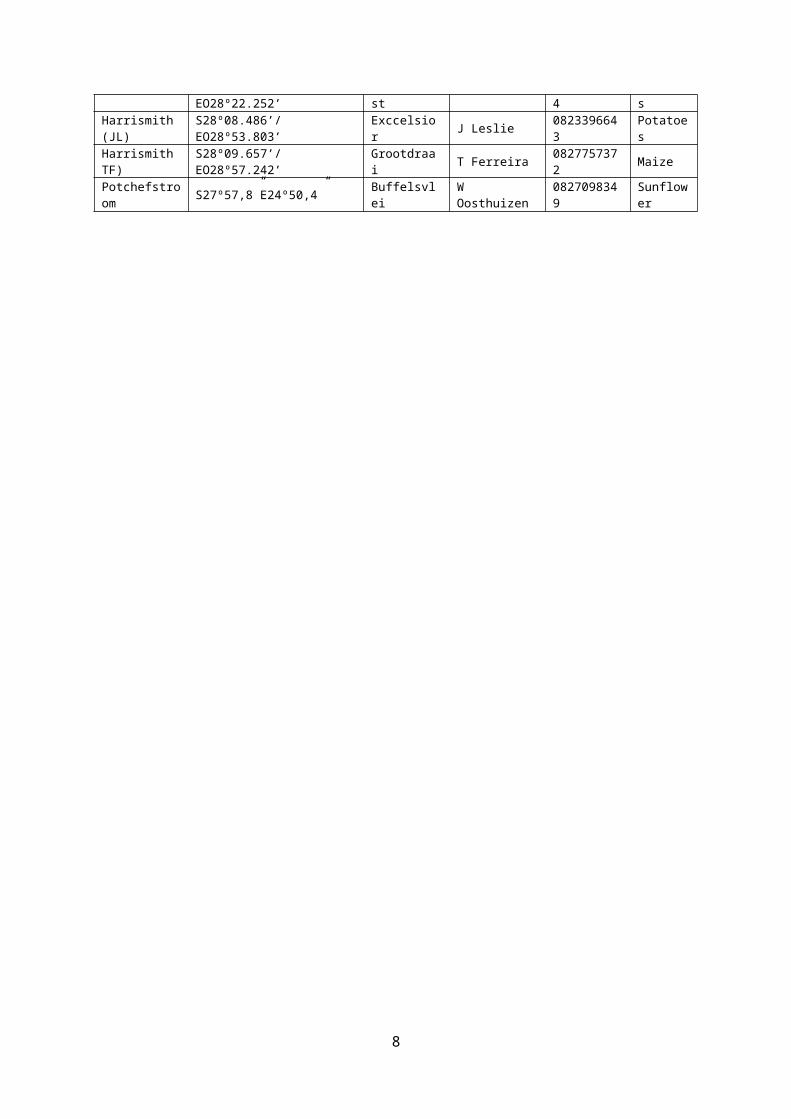
Highveld
Locality GPS Coordinates Farm NameFarmer Details Previous
crop on trial siteName Contact
number
Villiers S26º58.028’/EO28º44.512’ Wolwefontein J Jordaan 0827754817 Maize
Welkom S28º10.280’/EO26º23.822’ Valsfontein AJ du Bruyn 0823382371 Potatoes
Clarens S28º26.488’/EO28º22.252’ Miemiesrust P Farrel 0836278404 Potatoes
Harrismith (JL) S28º08.486’/EO28º53.803’ Exccelsior J Leslie 0823396643 Potatoes
Harrismith TF) S28º09.657’/EO28º57.242’ Grootdraai T Ferreira 0827757372 Maize
Potchefstroom S27º57,8”E24º50,4” Buffelsvlei W Oosthuizen 0827098349 Sunflower
5
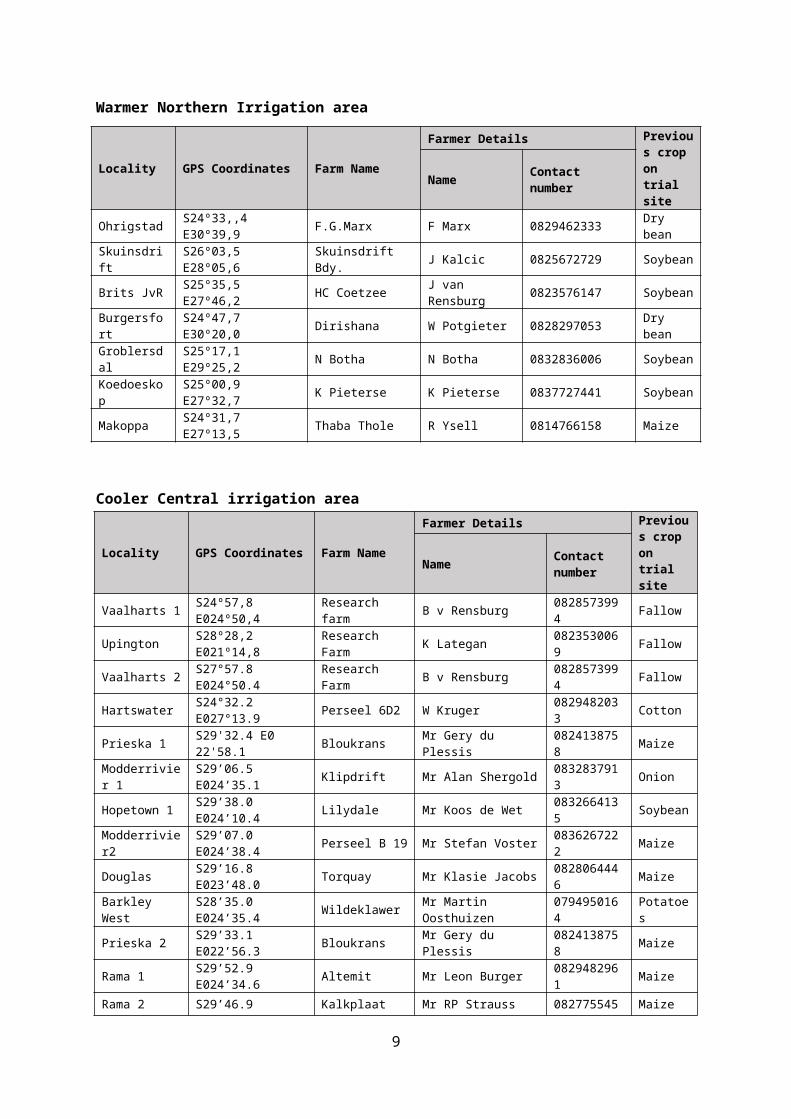
Warmer Northern Irrigation area
Locality GPS Coordinates Farm NameFarmer Details Previous
crop on trial siteName Contact number
Ohrigstad S24º33,,4 E30º39,9 F.G.Marx F Marx 0829462333 Dry bean
Skuinsdrift S26º03,5 E28º05,6 Skuinsdrift Bdy. J Kalcic 0825672729 Soybean
Brits JvR S25º35,5 E27º46,2 HC Coetzee J van Rensburg 0823576147 Soybean
Burgersfort S24º47,7 E30º20,0 Dirishana W Potgieter 0828297053 Dry bean
Groblersdal S25º17,1 E29º25,2 N Botha N Botha 0832836006 Soybean
Koedoeskop S25º00,9 E27º32,7 K Pieterse K Pieterse 0837727441 Soybean
Makoppa S24º31,7 E27º13,5 Thaba Thole R Ysell 0814766158 Maize
Cooler Central irrigation area
Locality GPS Coordinates Farm NameFarmer Details Previous
crop on trial siteName Contact
numberVaalharts 1 S24º57,8 E024º50,4 Research farm B v Rensburg 0828573994 Fallow
Upington S28º28,2 E021º14,8 Research Farm K Lategan 0823530069 Fallow
Vaalharts 2 S27°57.8 E024°50.4 Research Farm B v Rensburg 0828573994 Fallow
Hartswater S24°32.2 E027°13.9 Perseel 6D2 W Kruger 0829482033 Cotton
Prieska 1 S29'32.4 E0 22'58.1 Bloukrans Mr Gery du Plessis 0824138758 Maize
Modderrivier 1 S29’06.5 E024’35.1 Klipdrift Mr Alan Shergold 0832837913 Onion
Hopetown 1 S29’38.0 E024’10.4 Lilydale Mr Koos de Wet 0832664135 Soybean
Modderrivier2 S29’07.0 E024’38.4 Perseel B 19 Mr Stefan Voster 0836267222 Maize
Douglas S29’16.8 E023’48.0 Torquay Mr Klasie Jacobs 0828064446 Maize
Barkley West S28’35.0 E024’35.4 Wildeklawer Mr Martin Oosthuizen 0794950164 Potatoes
Prieska 2 S29’33.1 E022’56.3 Bloukrans Mr Gery du Plessis 0824138758 Maize
Rama 1 S29’52.9 E024’34.6 Altemit Mr Leon Burger 0829482961 Maize
Rama 2 S29’46.9 E024’25.0 Kalkplaat Mr RP Strauss 0827755454 Maize
Hopetown 2 S29’38.4 E024’10.8 Lilydale Mr Koos de Wet 0832664135 Maize
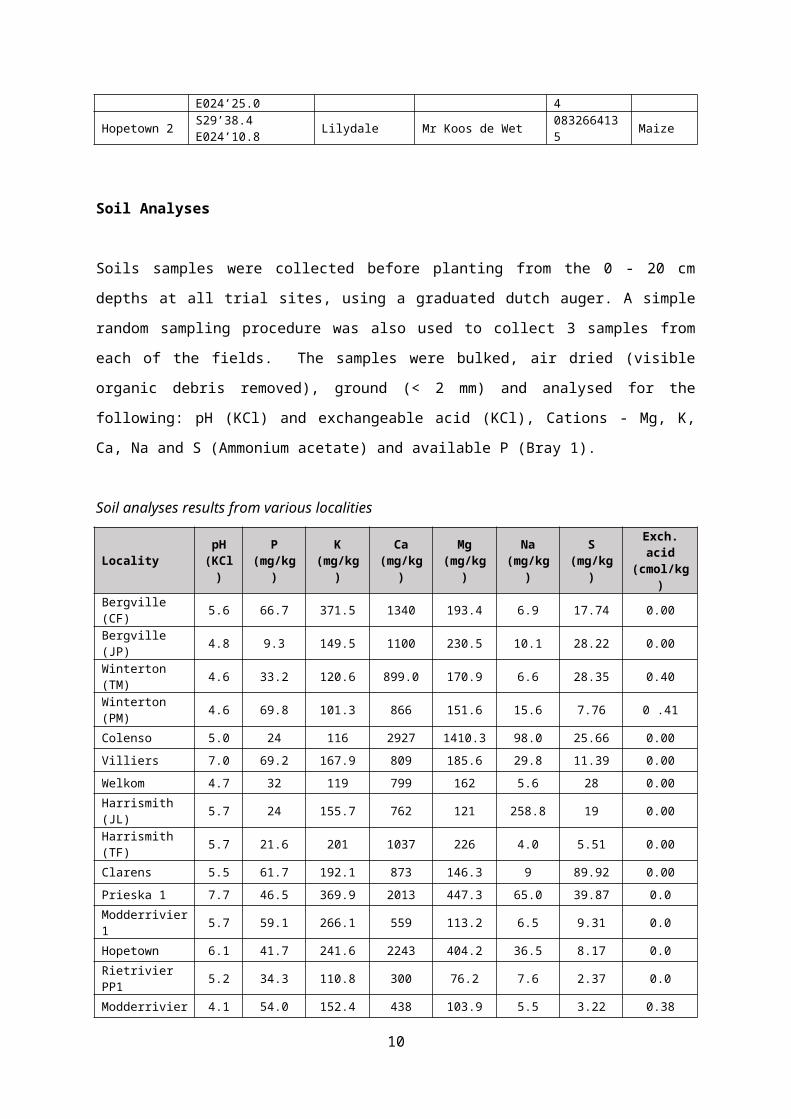
Soil Analyses
Soils samples were collected before planting from the 0 - 20 cm depths at all trial sites, using
a graduated dutch auger. A simple random sampling procedure was also used to collect 3
samples from each of the fields. The samples were bulked, air dried (visible organic debris
removed), ground (< 2 mm) and analysed for the following: pH (KCl) and exchangeable acid
(KCl), Cations - Mg, K, Ca, Na and S (Ammonium acetate) and available P (Bray 1).
Soil analyses results from various localities
6
Locality pH (KCl)
P (mg/kg)
K (mg/kg)
Ca (mg/kg)
Mg (mg/kg)
Na (mg/kg)
S (mg/kg)
Exch. acid (cmol/kg)
Bergville (CF) 5.6 66.7 371.5 1340 193.4 6.9 17.74 0.00
Bergville (JP) 4.8 9.3 149.5 1100 230.5 10.1 28.22 0.00
Winterton (TM) 4.6 33.2 120.6 899.0 170.9 6.6 28.35 0.40
Winterton (PM) 4.6 69.8 101.3 866 151.6 15.6 7.76 0 .41
Colenso 5.0 24 116 2927 1410.3 98.0 25.66 0.00
Villiers 7.0 69.2 167.9 809 185.6 29.8 11.39 0.00
Welkom 4.7 32 119 799 162 5.6 28 0.00
Harrismith (JL) 5.7 24 155.7 762 121 258.8 19 0.00
Harrismith (TF) 5.7 21.6 201 1037 226 4.0 5.51 0.00
Clarens 5.5 61.7 192.1 873 146.3 9 89.92 0.00
Prieska 1 7.7 46.5 369.9 2013 447.3 65.0 39.87 0.0
Modderrivier 1 5.7 59.1 266.1 559 113.2 6.5 9.31 0.0
Hopetown 6.1 41.7 241.6 2243 404.2 36.5 8.17 0.0
Rietrivier PP1 5.2 34.3 110.8 300 76.2 7.6 2.37 0.0
Modderrivier2 4.1 54.0 152.4 438 103.9 5.5 3.22 0.38
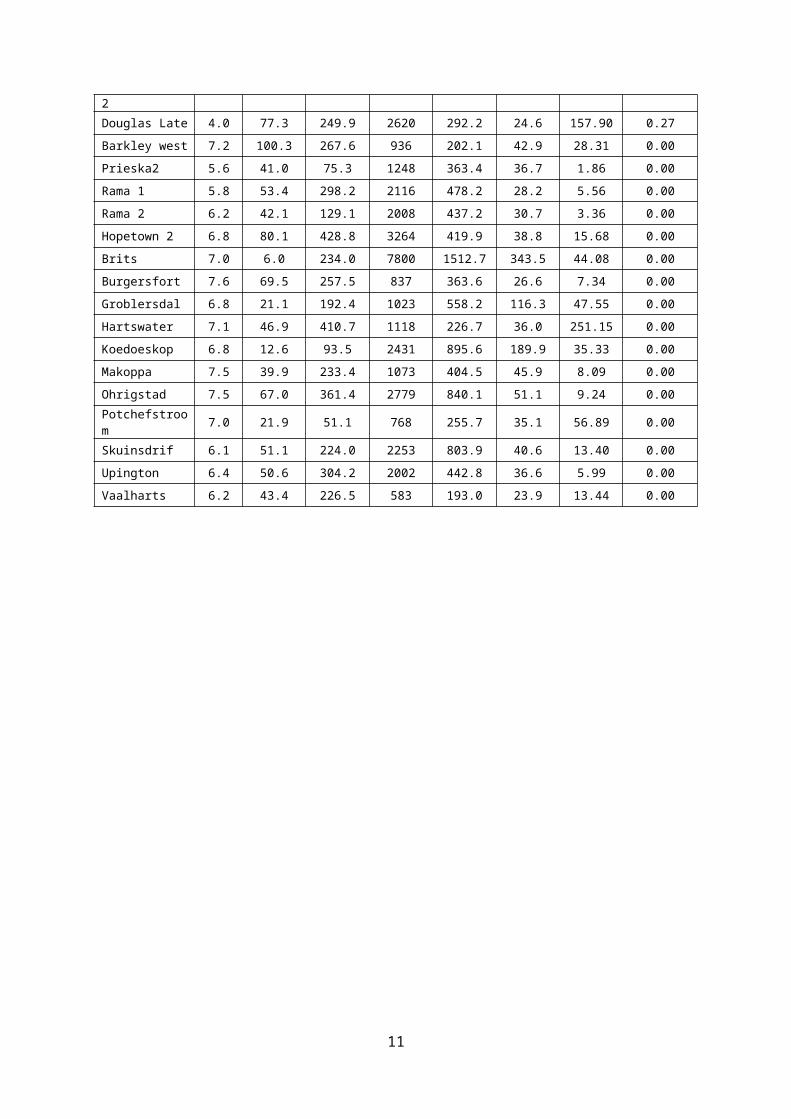
Douglas Late 4.0 77.3 249.9 2620 292.2 24.6 157.90 0.27
Barkley west 7.2 100.3 267.6 936 202.1 42.9 28.31 0.00
Prieska2 5.6 41.0 75.3 1248 363.4 36.7 1.86 0.00
Rama 1 5.8 53.4 298.2 2116 478.2 28.2 5.56 0.00
Rama 2 6.2 42.1 129.1 2008 437.2 30.7 3.36 0.00
Hopetown 2 6.8 80.1 428.8 3264 419.9 38.8 15.68 0.00
Brits 7.0 6.0 234.0 7800 1512.7 343.5 44.08 0.00
Burgersfort 7.6 69.5 257.5 837 363.6 26.6 7.34 0.00
Groblersdal 6.8 21.1 192.4 1023 558.2 116.3 47.55 0.00
Hartswater 7.1 46.9 410.7 1118 226.7 36.0 251.15 0.00
Koedoeskop 6.8 12.6 93.5 2431 895.6 189.9 35.33 0.00
Makoppa 7.5 39.9 233.4 1073 404.5 45.9 8.09 0.00
Ohrigstad 7.5 67.0 361.4 2779 840.1 51.1 9.24 0.00
Potchefstroom 7.0 21.9 51.1 768 255.7 35.1 56.89 0.00
Skuinsdrif 6.1 51.1 224.0 2253 803.9 40.6 13.40 0.00
Upington 6.4 50.6 304.2 2002 442.8 36.6 5.99 0.00
Vaalharts 6.2 43.4 226.5 583 193.0 23.9 13.44 0.00
7
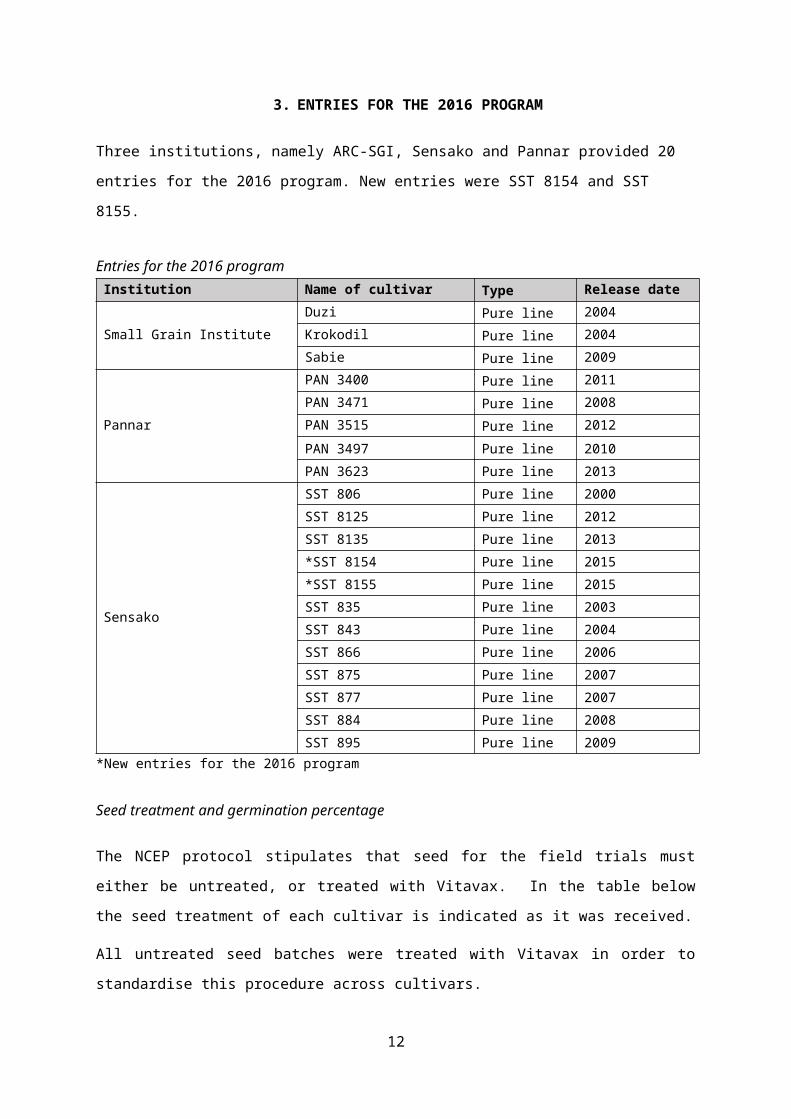
3. ENTRIES FOR THE 2016 PROGRAM
Three institutions, namely ARC-SGI, Sensako and Pannar provided 20 entries for the 2016
program. New entries were SST 8154 and SST 8155.
Entries for the 2016 programInstitution Name of cultivar Type Release date
Small Grain Institute
Duzi Pure line 2004
Krokodil Pure line 2004
Sabie Pure line 2009
Pannar
PAN 3400 Pure line 2011
PAN 3471 Pure line 2008
PAN 3515 Pure line 2012
PAN 3497 Pure line 2010
PAN 3623 Pure line 2013
Sensako
SST 806 Pure line 2000
SST 8125 Pure line 2012
SST 8135 Pure line 2013
*SST 8154 Pure line 2015
*SST 8155 Pure line 2015
SST 835 Pure line 2003
SST 843 Pure line 2004
SST 866 Pure line 2006
SST 875 Pure line 2007
SST 877 Pure line 2007
SST 884 Pure line 2008
SST 895 Pure line 2009*New entries for the 2016 program
Seed treatment and germination percentage
The NCEP protocol stipulates that seed for the field trials must either be untreated, or
treated with Vitavax. In the table below the seed treatment of each cultivar is indicated as it
was received.
All untreated seed batches were treated with Vitavax in order to standardise this procedure
across cultivars.
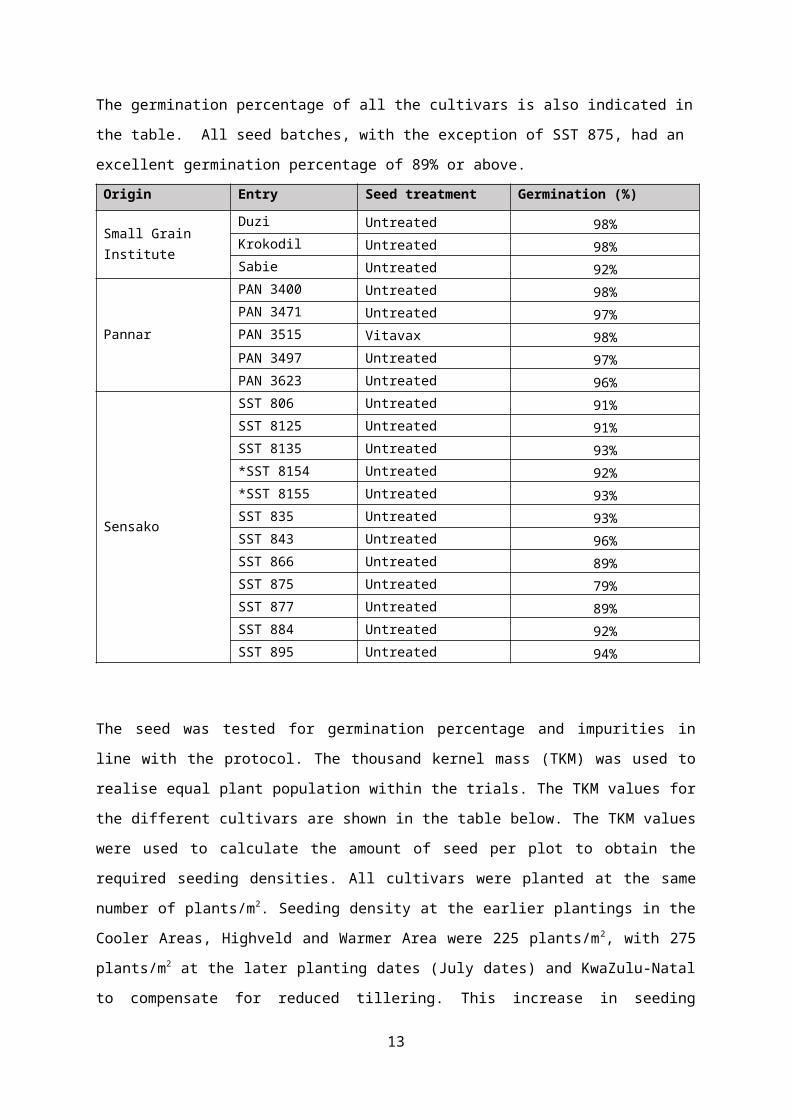
The germination percentage of all the cultivars is also indicated in the table. All seed
batches, with the exception of SST 875, had an excellent germination percentage of 89% or
above.
Origin Entry Seed treatment Germination (%)
8
Small Grain Institute
Duzi Untreated 98%Krokodil Untreated 98%Sabie Untreated 92%
Pannar
PAN 3400 Untreated 98%PAN 3471 Untreated 97%PAN 3515 Vitavax 98%PAN 3497 Untreated 97%PAN 3623 Untreated 96%
Sensako
SST 806 Untreated 91%SST 8125 Untreated 91%SST 8135 Untreated 93%*SST 8154 Untreated 92%*SST 8155 Untreated 93%SST 835 Untreated 93%SST 843 Untreated 96%SST 866 Untreated 89%SST 875 Untreated 79%SST 877 Untreated 89%SST 884 Untreated 92%SST 895 Untreated 94%
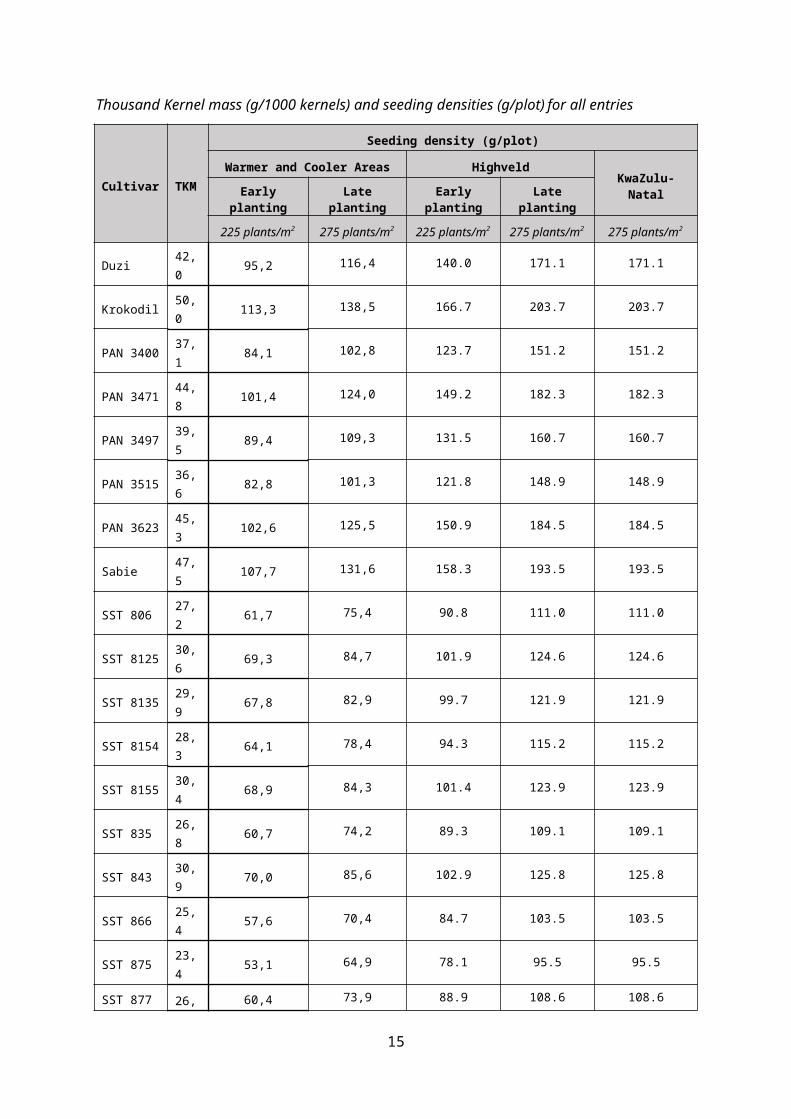
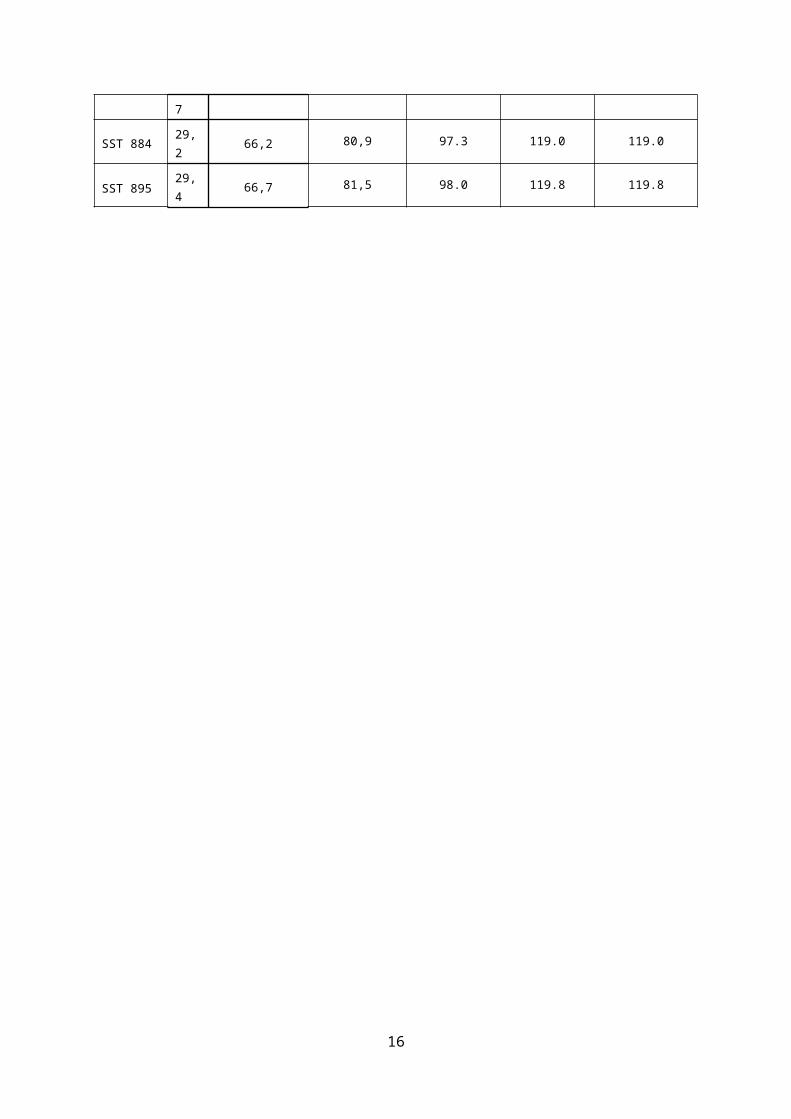
The seed was tested for germination percentage and impurities in line with the protocol. The
thousand kernel mass (TKM) was used to realise equal plant population within the trials. The
TKM values for the different cultivars are shown in the table below. The TKM values were
used to calculate the amount of seed per plot to obtain the required seeding densities. All
cultivars were planted at the same number of plants/m2. Seeding density at the earlier
plantings in the Cooler Areas, Highveld and Warmer Area were 225 plants/m2, with 275
plants/m2 at the later planting dates (July dates) and KwaZulu-Natal to compensate for
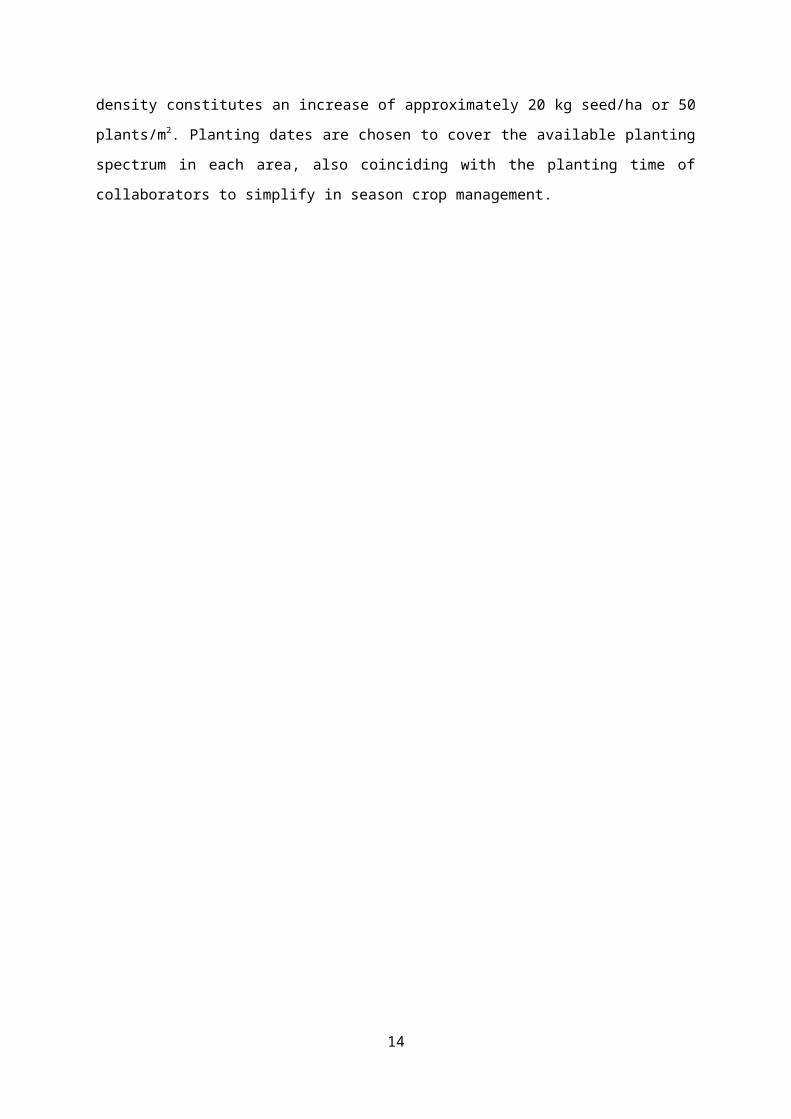
reduced tillering. This increase in seeding density constitutes an increase of approximately
20 kg seed/ha or 50 plants/m2. Planting dates are chosen to cover the available planting
spectrum in each area, also coinciding with the planting time of collaborators to simplify in
season crop management.
9
Thousand Kernel mass (g/1000 kernels) and seeding densities (g/plot) for all entries
Cultivar TKM
Seeding density (g/plot)
Warmer and Cooler Areas HighveldKwaZulu-Natal
Early planting Late planting Early planting Late planting
225 plants/m2 275 plants/m2 225 plants/m2 275 plants/m2 275 plants/m2
Duzi 42,0 95,2 116,4 140.0 171.1 171.1
Krokodil 50,0 113,3 138,5 166.7 203.7 203.7
PAN 3400 37,1 84,1 102,8 123.7 151.2 151.2
PAN 3471 44,8 101,4 124,0 149.2 182.3 182.3
PAN 3497 39,5 89,4 109,3 131.5 160.7 160.7
PAN 3515 36,6 82,8 101,3 121.8 148.9 148.9
PAN 3623 45,3 102,6 125,5 150.9 184.5 184.5
Sabie 47,5 107,7 131,6 158.3 193.5 193.5
SST 806 27,2 61,7 75,4 90.8 111.0 111.0
SST 8125 30,6 69,3 84,7 101.9 124.6 124.6
SST 8135 29,9 67,8 82,9 99.7 121.9 121.9
SST 8154 28,3 64,1 78,4 94.3 115.2 115.2
SST 8155 30,4 68,9 84,3 101.4 123.9 123.9
SST 835 26,8 60,7 74,2 89.3 109.1 109.1
SST 843 30,9 70,0 85,6 102.9 125.8 125.8
SST 866 25,4 57,6 70,4 84.7 103.5 103.5
SST 875 23,4 53,1 64,9 78.1 95.5 95.5
SST 877 26,7 60,4 73,9 88.9 108.6 108.6
SST 884 29,2 66,2 80,9 97.3 119.0 119.0
SST 895 29,4 66,7 81,5 98.0 119.8 119.8
10
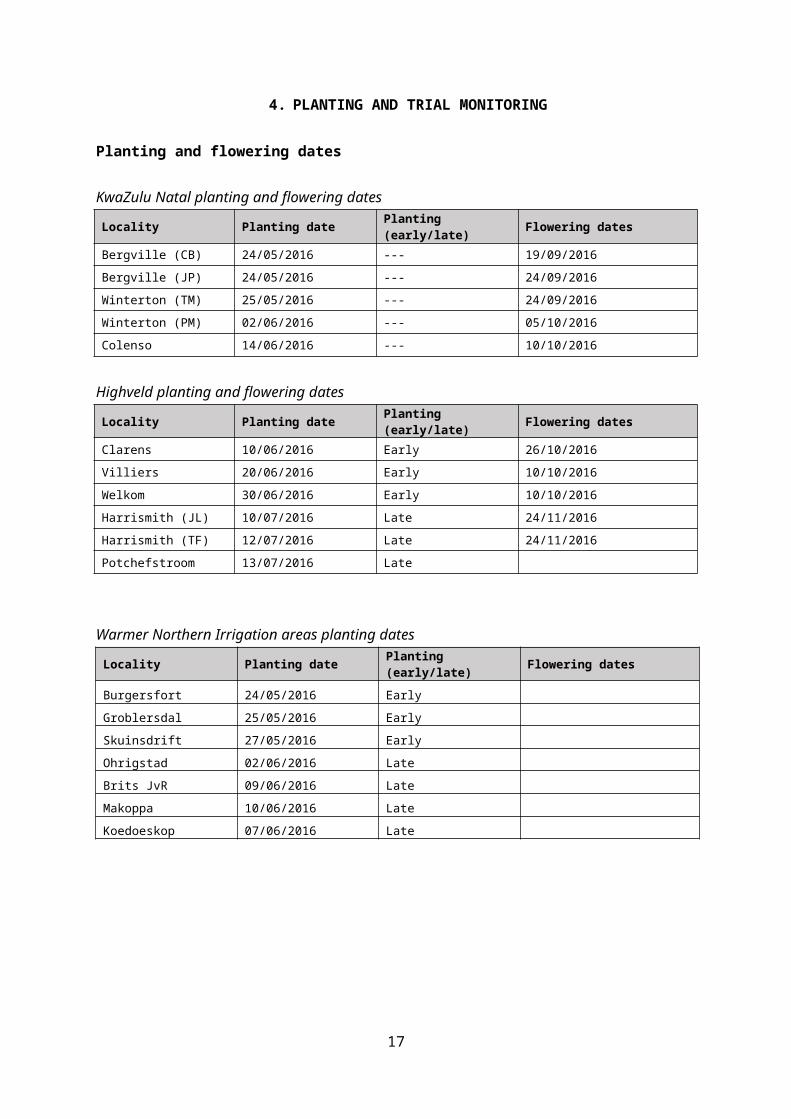
4. PLANTING AND TRIAL MONITORING
Planting and flowering dates
KwaZulu Natal planting and flowering datesLocality Planting date Planting (early/late) Flowering dates
Bergville (CB) 24/05/2016 --- 19/09/2016
Bergville (JP) 24/05/2016 --- 24/09/2016
Winterton (TM) 25/05/2016 --- 24/09/2016
Winterton (PM) 02/06/2016 --- 05/10/2016
Colenso 14/06/2016 --- 10/10/2016
Highveld planting and flowering datesLocality Planting date Planting (early/late) Flowering dates
Clarens 10/06/2016 Early 26/10/2016
Villiers 20/06/2016 Early 10/10/2016
Welkom 30/06/2016 Early 10/10/2016
Harrismith (JL) 10/07/2016 Late 24/11/2016
Harrismith (TF) 12/07/2016 Late 24/11/2016
Potchefstroom 13/07/2016 Late
Warmer Northern Irrigation areas planting datesLocality Planting date Planting (early/late) Flowering dates
Burgersfort 24/05/2016 Early
Groblersdal 25/05/2016 Early
Skuinsdrift 27/05/2016 Early
Ohrigstad 02/06/2016 Late
Brits JvR 09/06/2016 Late
Makoppa 10/06/2016 Late
Koedoeskop 07/06/2016 Late
11
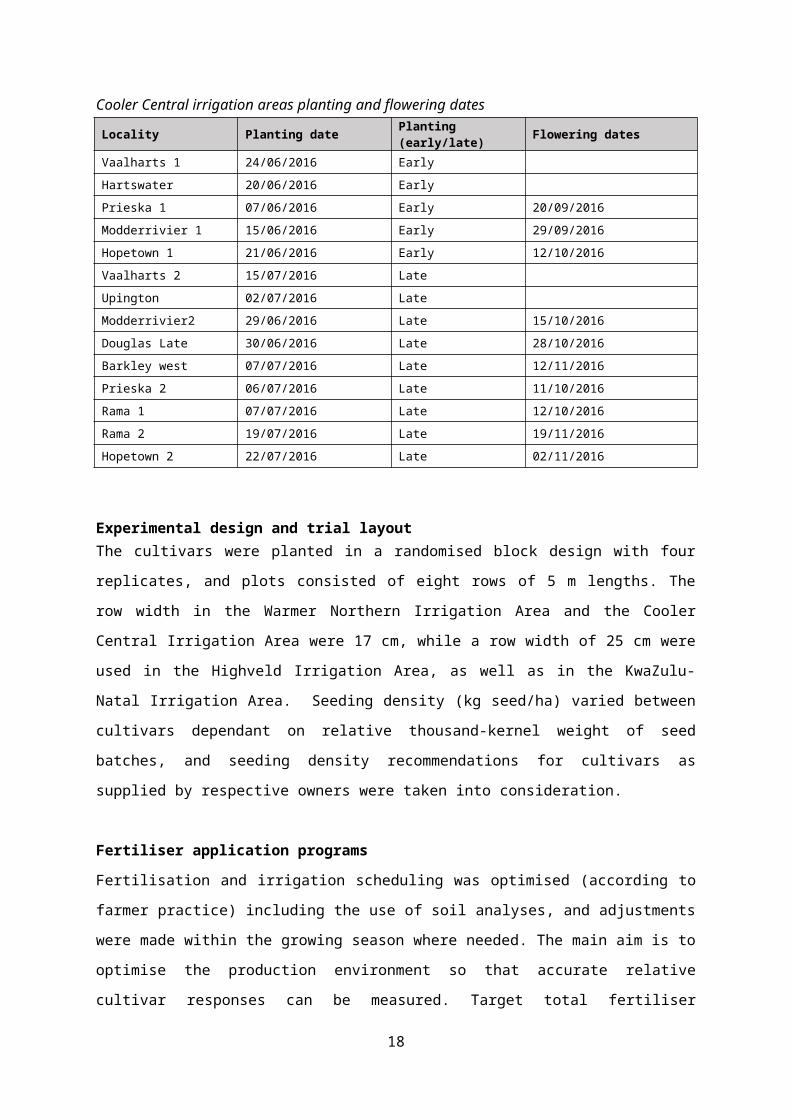
Cooler Central irrigation areas planting and flowering datesLocality Planting date Planting (early/late) Flowering dates
Vaalharts 1 24/06/2016 Early
Hartswater 20/06/2016 Early
Prieska 1 07/06/2016 Early 20/09/2016
Modderrivier 1 15/06/2016 Early 29/09/2016
Hopetown 1 21/06/2016 Early 12/10/2016
Vaalharts 2 15/07/2016 Late
Upington 02/07/2016 Late
Modderrivier2 29/06/2016 Late 15/10/2016
Douglas Late 30/06/2016 Late 28/10/2016
Barkley west 07/07/2016 Late 12/11/2016
Prieska 2 06/07/2016 Late 11/10/2016
Rama 1 07/07/2016 Late 12/10/2016
Rama 2 19/07/2016 Late 19/11/2016
Hopetown 2 22/07/2016 Late 02/11/2016
Experimental design and trial layoutThe cultivars were planted in a randomised block design with four replicates, and plots
consisted of eight rows of 5 m lengths. The row width in the Warmer Northern Irrigation Area
and the Cooler Central Irrigation Area were 17 cm, while a row width of 25 cm were used in
the Highveld Irrigation Area, as well as in the KwaZulu-Natal Irrigation Area. Seeding
density (kg seed/ha) varied between cultivars dependant on relative thousand-kernel weight
of seed batches, and seeding density recommendations for cultivars as supplied by
respective owners were taken into consideration.
Fertiliser application programsFertilisation and irrigation scheduling was optimised (according to farmer practice) including
the use of soil analyses, and adjustments were made within the growing season where
needed. The main aim is to optimise the production environment so that accurate relative
cultivar responses can be measured. Target total fertiliser application was 220 kg N/ha, 30
kg P/ha and 20 kg K/ha. The fertiliser application rates and application dates are presented
in the tables below:
12
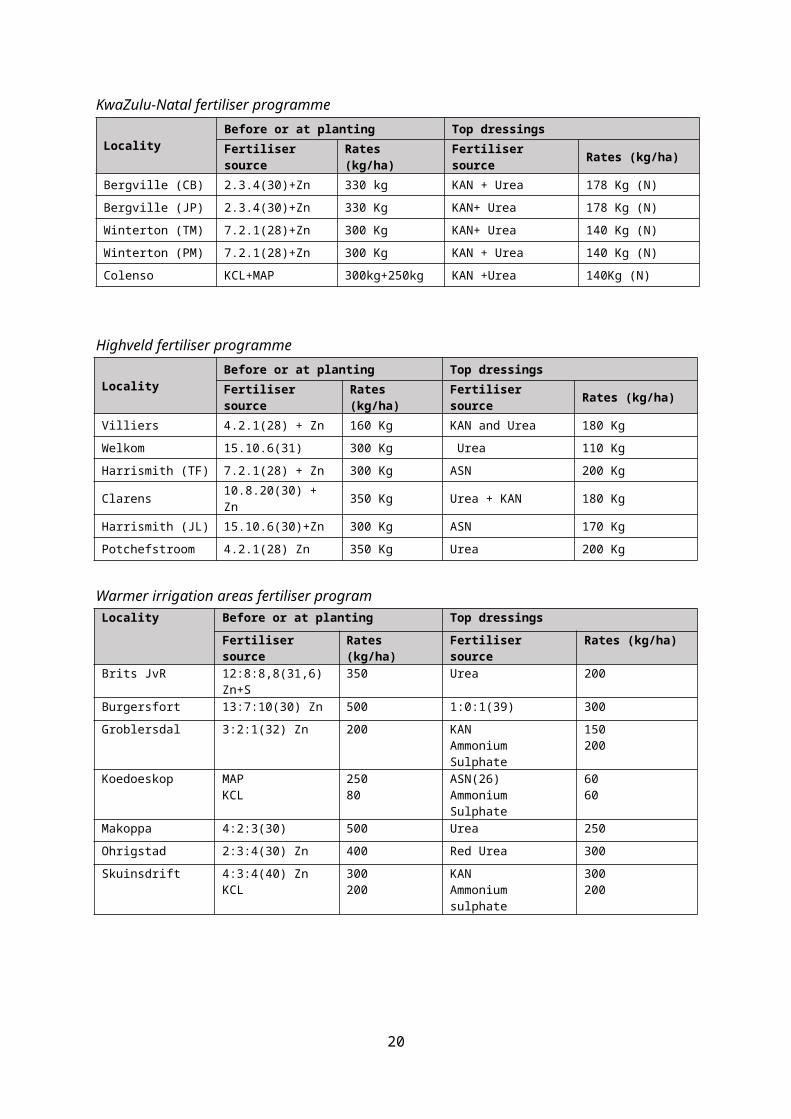
KwaZulu-Natal fertiliser programme
LocalityBefore or at planting Top dressings
Fertiliser source Rates (kg/ha) Fertiliser source Rates (kg/ha)
Bergville (CB) 2.3.4(30)+Zn 330 kg KAN + Urea 178 Kg (N)
Bergville (JP) 2.3.4(30)+Zn 330 Kg KAN+ Urea 178 Kg (N)
Winterton (TM) 7.2.1(28)+Zn 300 Kg KAN+ Urea 140 Kg (N)
Winterton (PM) 7.2.1(28)+Zn 300 Kg KAN + Urea 140 Kg (N)
Colenso KCL+MAP 300kg+250kg KAN +Urea 140Kg (N)
Highveld fertiliser programme
LocalityBefore or at planting Top dressings
Fertiliser source Rates (kg/ha) Fertiliser source Rates (kg/ha)
Villiers 4.2.1(28) + Zn 160 Kg KAN and Urea 180 Kg
Welkom 15.10.6(31) 300 Kg Urea 110 Kg
Harrismith (TF) 7.2.1(28) + Zn 300 Kg ASN 200 Kg
Clarens 10.8.20(30) + Zn 350 Kg Urea + KAN 180 Kg
Harrismith (JL) 15.10.6(30)+Zn 300 Kg ASN 170 Kg
Potchefstroom 4.2.1(28) Zn 350 Kg Urea 200 Kg
Warmer irrigation areas fertiliser programLocality Before or at planting Top dressings
Fertiliser source Rates (kg/ha) Fertiliser source Rates (kg/ha)
Brits JvR 12:8:8,8(31,6) Zn+S 350 Urea 200
Burgersfort 13:7:10(30) Zn 500 1:0:1(39) 300
Groblersdal 3:2:1(32) Zn 200 KAN Ammonium Sulphate
150200
Koedoeskop MAP KCL
25080
ASN(26)Ammonium Sulphate
6060
Makoppa 4:2:3(30) 500 Urea 250
Ohrigstad 2:3:4(30) Zn 400 Red Urea 300
Skuinsdrift 4:3:4(40) ZnKCL
300200
KANAmmonium sulphate
300200
13
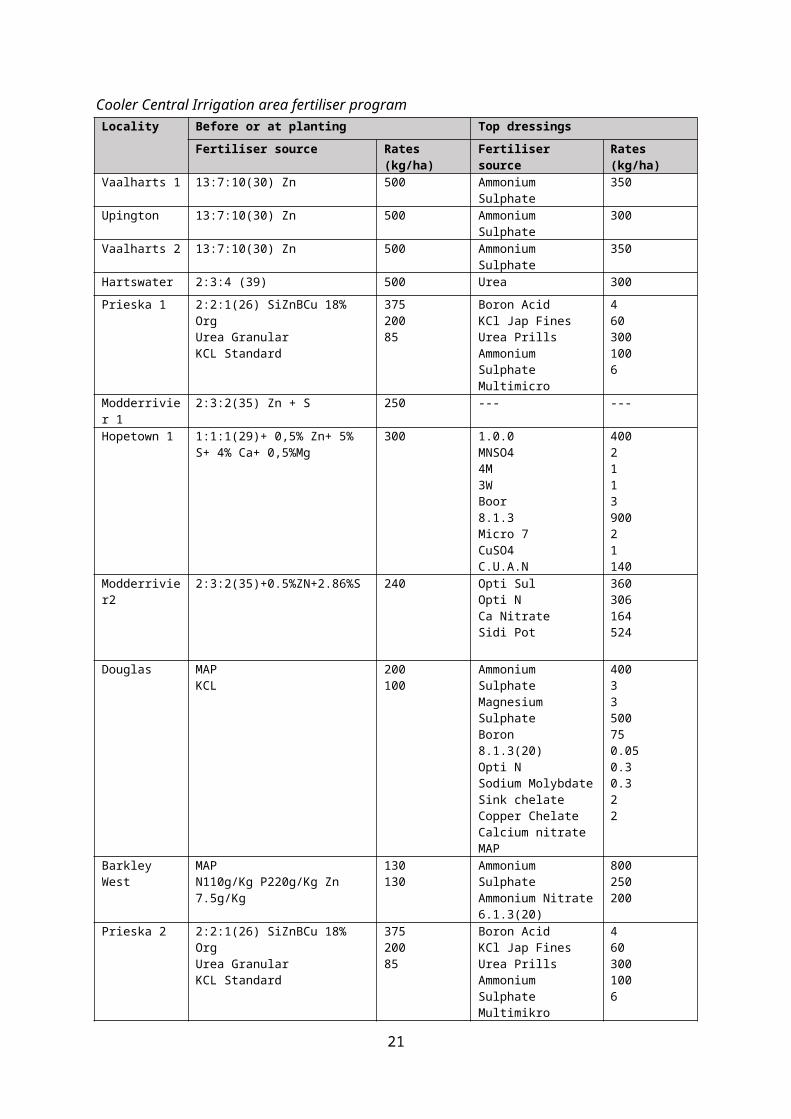
Cooler Central Irrigation area fertiliser programLocality Before or at planting Top dressings
Fertiliser source Rates (kg/ha) Fertiliser source Rates (kg/ha)
Vaalharts 1 13:7:10(30) Zn 500 Ammonium Sulphate 350
Upington 13:7:10(30) Zn 500 Ammonium Sulphate 300
Vaalharts 2 13:7:10(30) Zn 500 Ammonium Sulphate 350
Hartswater 2:3:4 (39) 500 Urea 300
Prieska 1 2:2:1(26) SiZnBCu 18% OrgUrea GranularKCL Standard
37520085
Boron AcidKCl Jap FinesUrea PrillsAmmonium SulphateMultimicro
4603001006
Modderrivier 1 2:3:2(35) Zn + S 250 --- ---
Hopetown 1 1:1:1(29)+ 0,5% Zn+ 5% S+ 4% Ca+ 0,5%Mg
300 1.0.0MNSO44M3WBoor8.1.3Micro 7CuSO4C.U.A.N
400211390021140
Modderrivier2 2:3:2(35)+0.5%ZN+2.86%S 240 Opti SulOpti NCa NitrateSidi Pot
360306164524
Douglas MAPKCL
200100
Ammonium SulphateMagnesium Sulphate Boron8.1.3(20)Opti NSodium MolybdateSink chelateCopper ChelateCalcium nitrateMAP
40033500750.050.30.322
Barkley West MAPN110g/Kg P220g/Kg Zn 7.5g/Kg
130130
Ammonium SulphateAmmonium Nitrate6.1.3(20)
800250200
Prieska 2 2:2:1(26) SiZnBCu 18% Org Urea GranularKCL Standard
375200 85
Boron AcidKCl Jap FinesUrea PrillsAmmonium SulphateMultimikro
4603001006
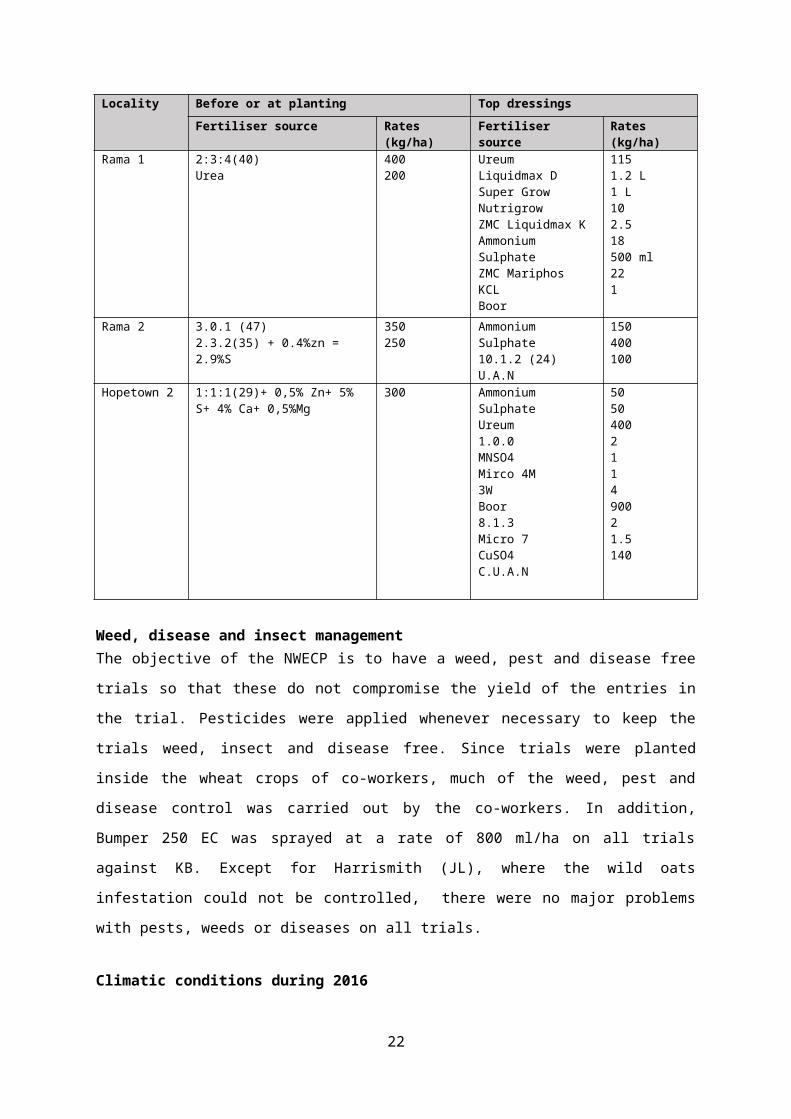
Rama 1 2:3:4(40)Urea
400200
UreumLiquidmax DSuper GrowNutrigrowZMC Liquidmax KAmmonium SulphateZMC MariphosKCLBoor
1151.2 L1 L102.518500 ml221
Rama 2 3.0.1 (47)2.3.2(35) + 0.4%zn = 2.9%S
350250
Ammonium Sulphate10.1.2 (24)U.A.N
150400100
14
Locality Before or at planting Top dressings
Fertiliser source Rates (kg/ha) Fertiliser source Rates (kg/ha)
Hopetown 2 1:1:1(29)+ 0,5% Zn+ 5% S+ 4% Ca+ 0,5%Mg
300 Ammonium SulphateUreum1.0.0MNSO4Mirco 4M3WBoor8.1.3Micro 7CuSO4C.U.A.N
5050400211490021.5140
Weed, disease and insect managementThe objective of the NWECP is to have a weed, pest and disease free trials so that these do
not compromise the yield of the entries in the trial. Pesticides were applied whenever
necessary to keep the trials weed, insect and disease free. Since trials were planted inside
the wheat crops of co-workers, much of the weed, pest and disease control was carried out
by the co-workers. In addition, Bumper 250 EC was sprayed at a rate of 800 ml/ha on all
trials against KB. Except for Harrismith (JL), where the wild oats infestation could not be
controlled, there were no major problems with pests, weeds or diseases on all trials.
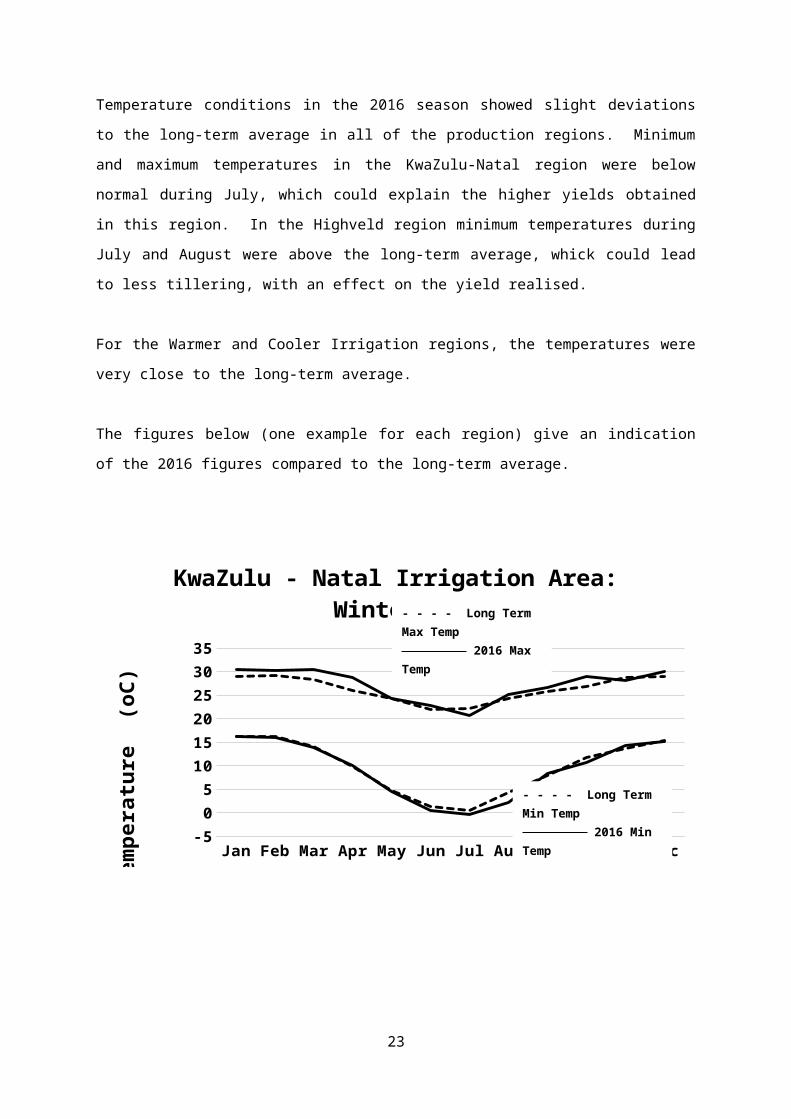
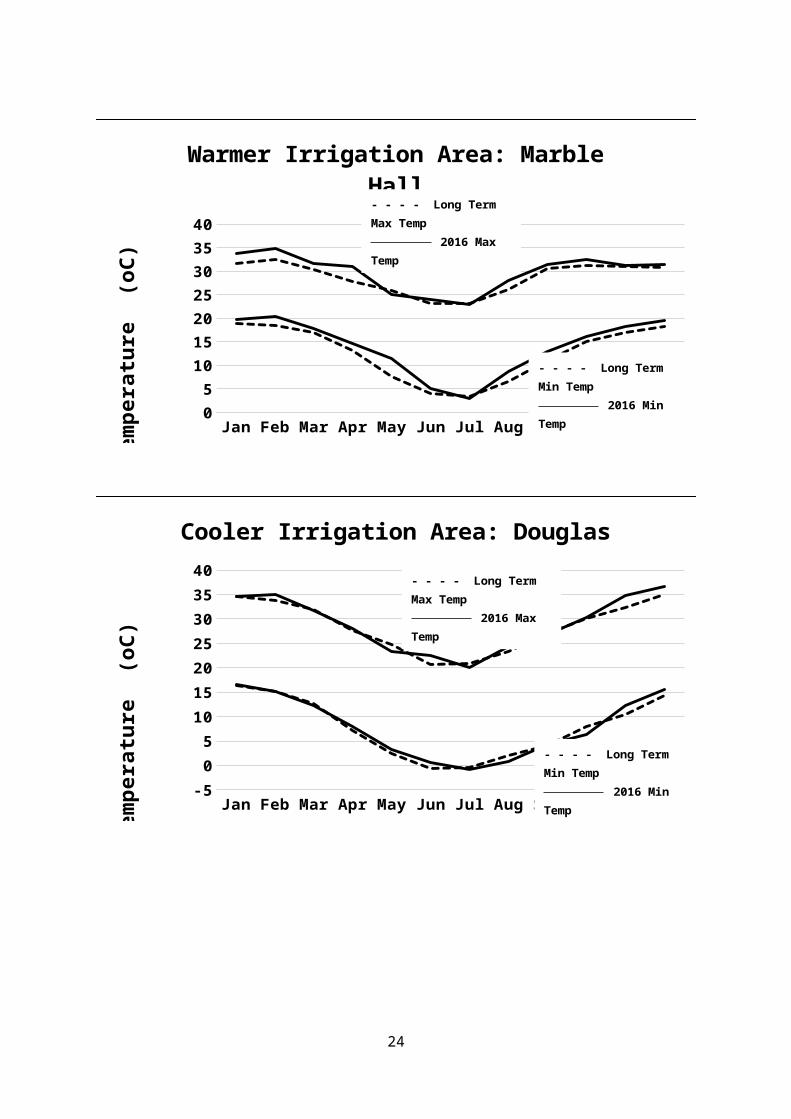
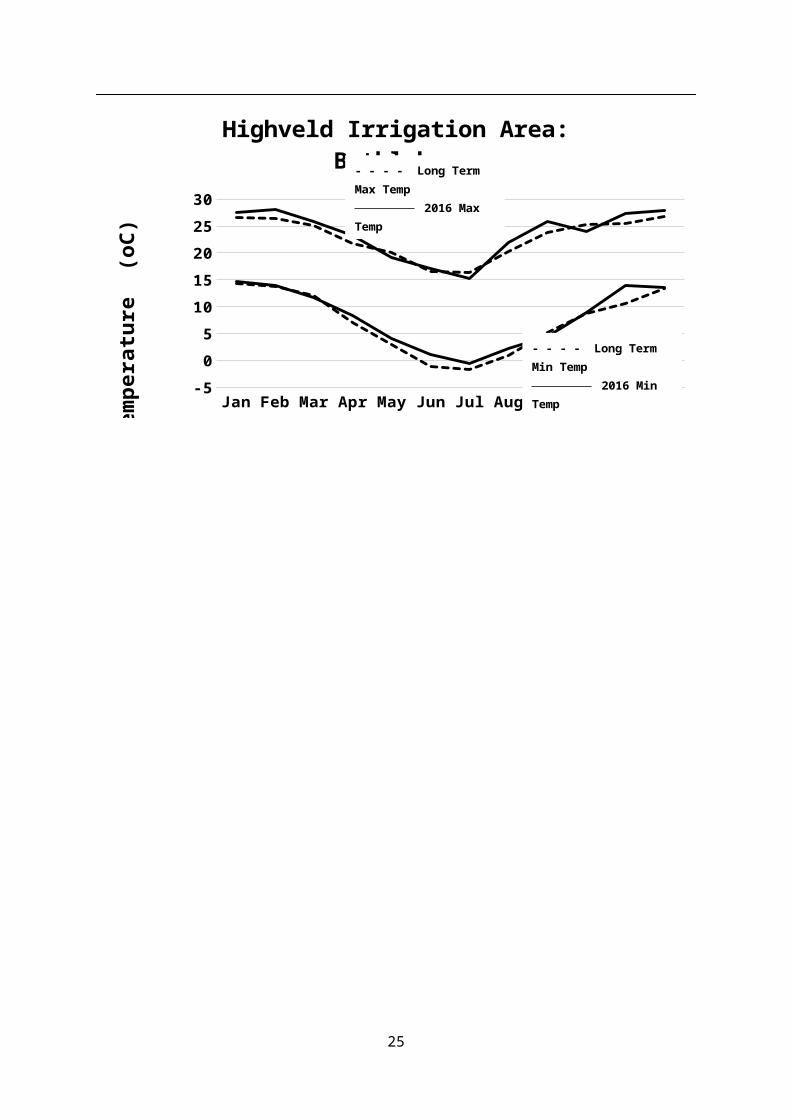
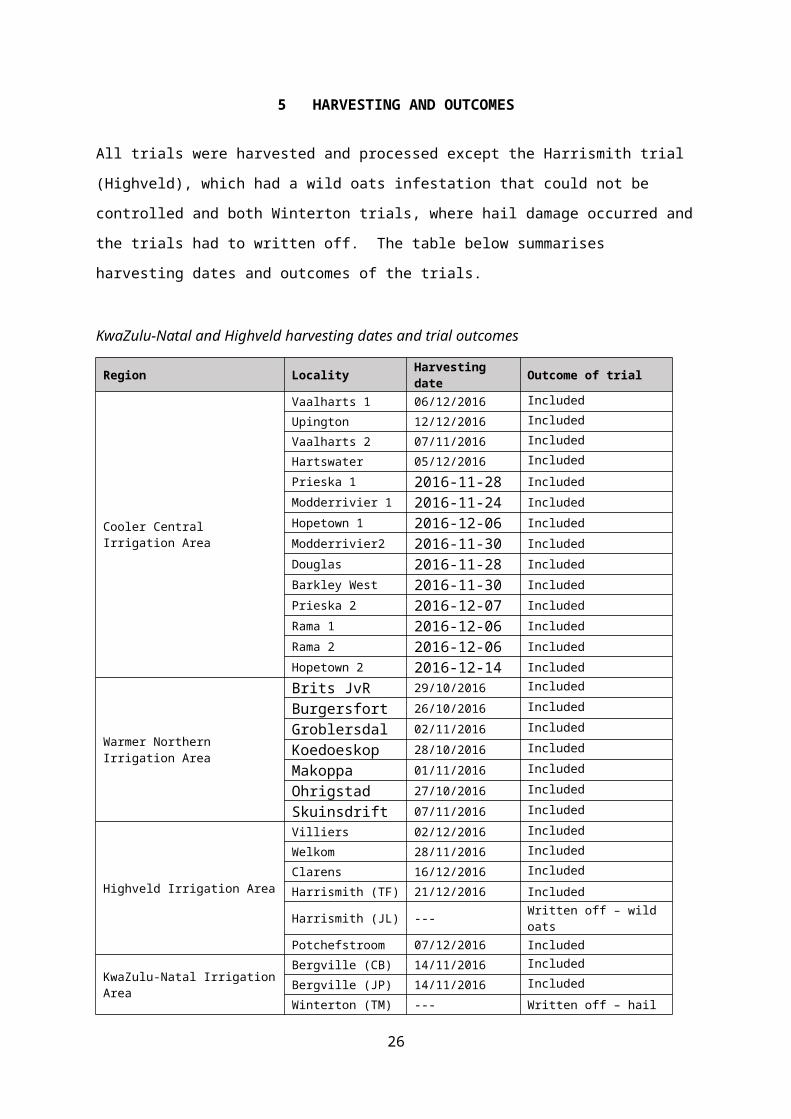
Climatic conditions during 2016Temperature conditions in the 2016 season showed slight deviations to the long-term
average in all of the production regions. Minimum and maximum temperatures in the
KwaZulu-Natal region were below normal during July, which could explain the higher yields
obtained in this region. In the Highveld region minimum temperatures during July and
August were above the long-term average, whick could lead to less tillering, with an effect on
the yield realised.
For the Warmer and Cooler Irrigation regions, the temperatures were very close to the
long-term average.
The figures below (one example for each region) give an indication of the 2016 figures
compared to the long-term average.
15
Jan Feb Mar Apr May Jun Jul Aug Sep Oct Nov Dec-5
0
5
10
15
20
25
30
35
KwaZulu - Natal Irrigation Area: WintertonTe
mpe
ratu
re (
oC)
Jan Feb Mar Apr May Jun Jul Aug Sep Oct Nov Dec0
5
10
15
20
25
30
35
40
Warmer Irrigation Area: Marble Hall
Tem
pera
ture
(oC
)
- - - - Long Term Max Temp 2016 Max Temp
- - - - Long Term Min Temp 2016 Min Temp
16
- - - - Long Term Max Temp 2016 Max Temp
- - - - Long Term Min Temp 2016 Min Temp
Jan Feb Mar Apr May Jun Jul Aug Sep Oct Nov Dec-5
0
5
10
15
20
25
30
35
40
Cooler Irrigation Area: DouglasTe
mpe
ratu
re (
oC)
- - - - Long Term Min Temp 2016 Min Temp
- - - - Long Term Max Temp 2016 Max Temp
Jan Feb Mar Apr May Jun Jul Aug Sep Oct Nov Dec-5
0
5
10
15
20
25
30
Highveld Irrigation Area: Bethlehem
Tem
pera
ture
(oC
)
- - - - Long Term Max Temp 2016 Max Temp
- - - - Long Term Min Temp 2016 Min Temp
17
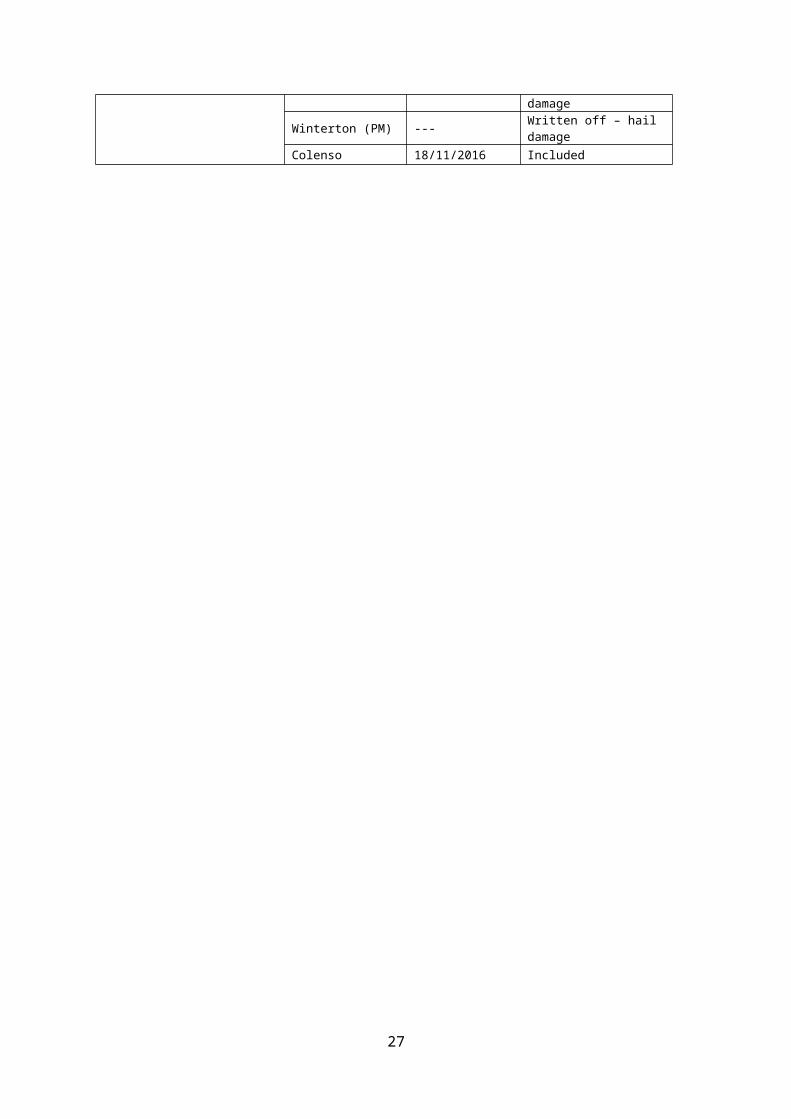
5 HARVESTING AND OUTCOMES
All trials were harvested and processed except the Harrismith trial (Highveld), which had a
wild oats infestation that could not be controlled and both Winterton trials, where hail
damage occurred and the trials had to written off. The table below summarises harvesting
dates and outcomes of the trials.
KwaZulu-Natal and Highveld harvesting dates and trial outcomes
Region Locality Harvesting date Outcome of trial
Cooler Central Irrigation Area
Vaalharts 1 06/12/2016 Included
Upington 12/12/2016 Included
Vaalharts 2 07/11/2016 Included
Hartswater 05/12/2016 Included
Prieska 1 2016-11-28 Included
Modderrivier 1 2016-11-24 Included
Hopetown 1 2016-12-06 Included
Modderrivier2 2016-11-30 Included
Douglas 2016-11-28 Included
Barkley West 2016-11-30 Included
Prieska 2 2016-12-07 Included
Rama 1 2016-12-06 Included
Rama 2 2016-12-06 Included
Hopetown 2 2016-12-14 Included
Warmer Northern Irrigation Area
Brits JvR 29/10/2016 Included
Burgersfort 26/10/2016 Included
Groblersdal 02/11/2016 Included
Koedoeskop 28/10/2016 Included
Makoppa 01/11/2016 Included
Ohrigstad 27/10/2016 Included
Skuinsdrift 07/11/2016 Included
Highveld Irrigation Area
Villiers 02/12/2016 Included
Welkom 28/11/2016 Included
Clarens 16/12/2016 Included
Harrismith (TF) 21/12/2016 Included
Harrismith (JL) --- Written off – wild oats
Potchefstroom 07/12/2016 Included
KwaZulu-Natal Irrigation Area
Bergville (CB) 14/11/2016 Included
Bergville (JP) 14/11/2016 Included
Winterton (TM) --- Written off – hail damage
Winterton (PM) --- Written off – hail damage
Colenso 18/11/2016 Included
18
6. STATISTICAL ANALYSIS
Grain yield and quality measurements (hectolitre mass, protein content and falling number)
for entries in the cultivar trials in the respective irrigation areas, AMMI analysis for genotype,
cultivar x environment interaction (G x E), and combined analyses per region and over years
are presented in this report. The empirical ranking of the entries is indicated in the tables,
although this does not necessarily mean that the cultivars differ significantly. For this
purpose the LSD’s (P ≤ 0.05) for a significant effect are also included.
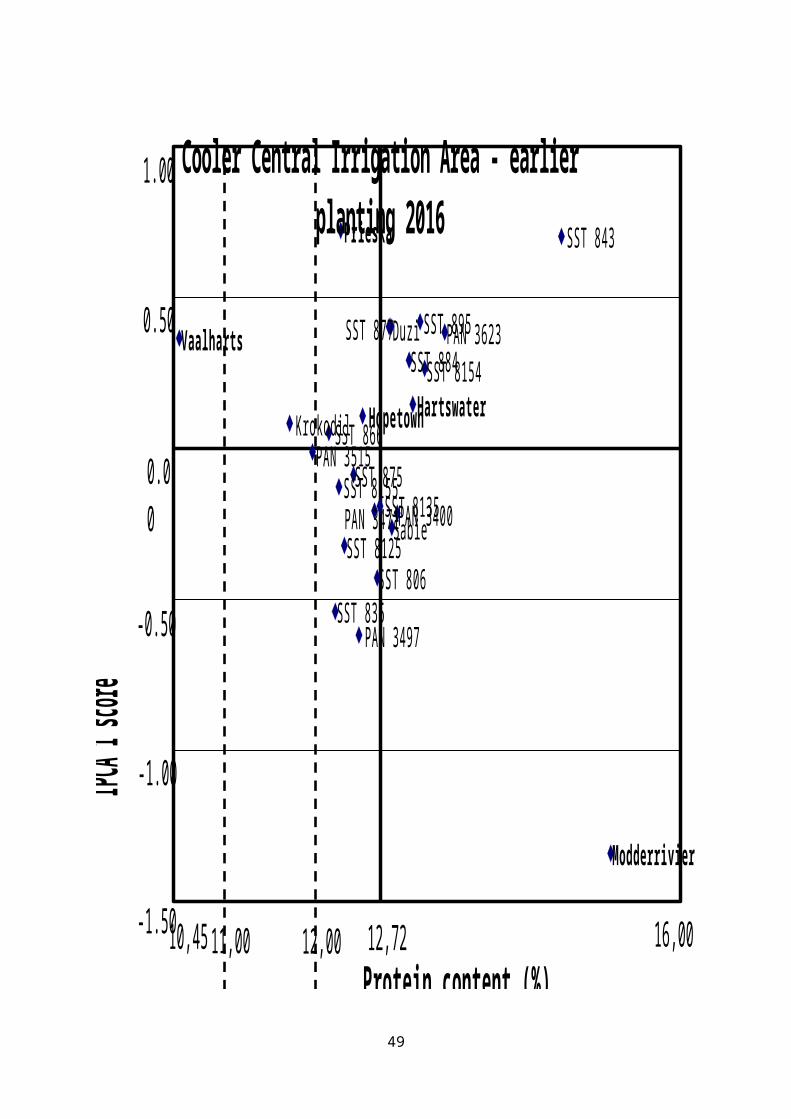
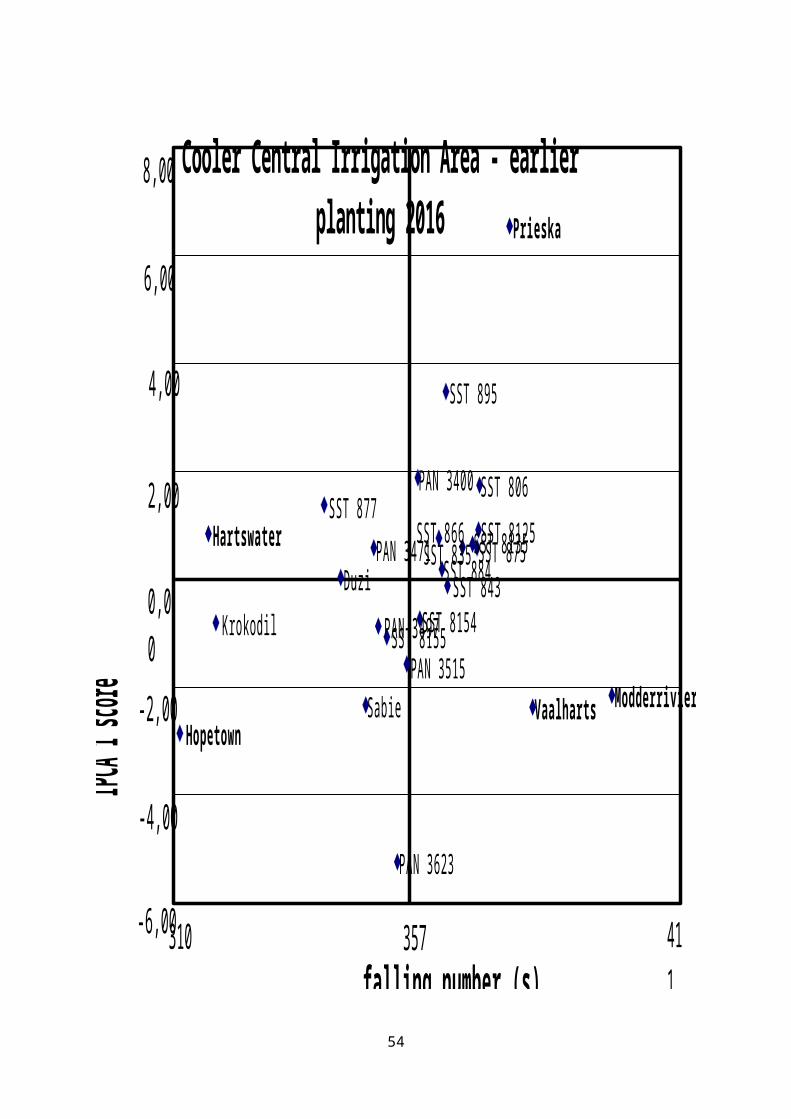
The AMMI-model (Additive Main Effects and Multiplicative Interaction) follows a unitary
approach by integrating the analysis of variance of the main effects with the G x E interaction
principal components analysis. The power of this statistical tool (AMMI) lies in the biplot
whereby environments and genotypes showing the same reaction patterns are grouped.
From the AMMI analysis, the four highest ranked cultivars for the respective analysis were
also calculated. By studying the biplot, certain patterns attributed to the main effects (G and
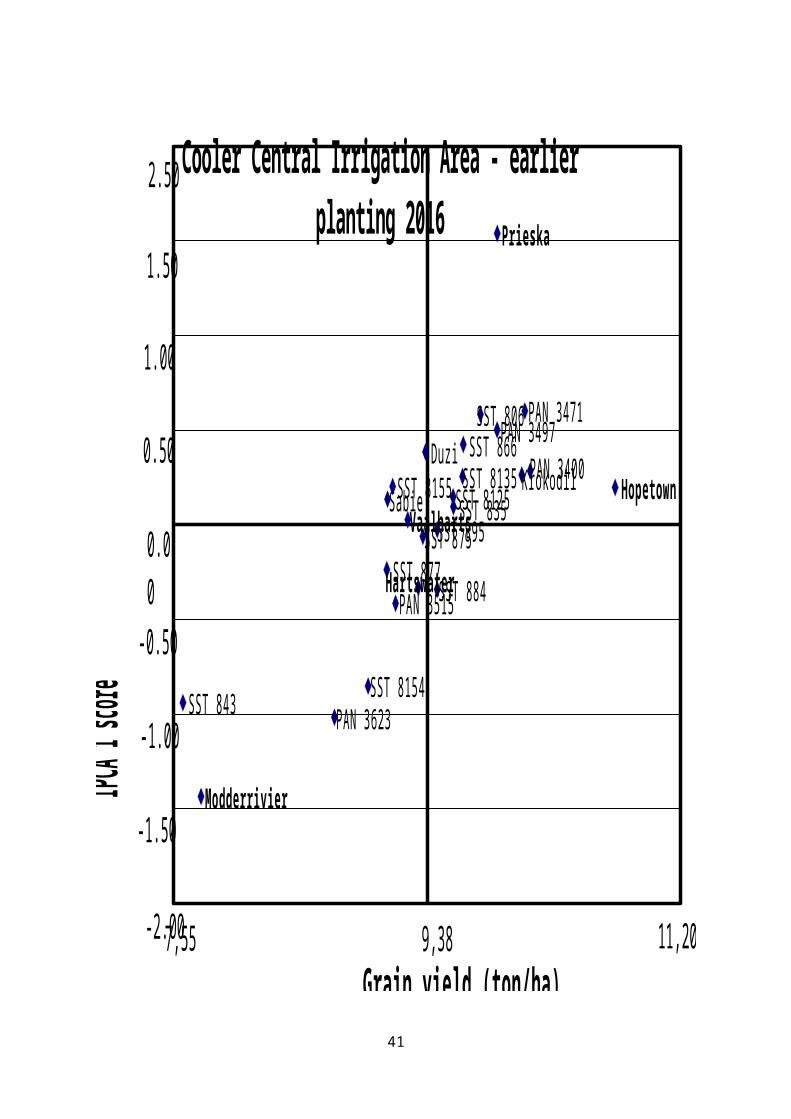
E), as well as the interaction (G x E) can be seen. The biplot gives an indication of average
yields as well as the yield stability of the cultivar. The mean additive main effects of a cultivar
or environment are stipulated on the X-axis while the multiplicative interaction (G x E) is
described on the Y-axis as an IPCA-1 score and can be a negative or a positive value. An
IPCA-1 score of zero (horizontal line) implicates that a cultivar or environment shows little
interaction and therefore a stable yield response.
19
7. RESULTS
COOLER CENTRAL IRRIGATION AREAS
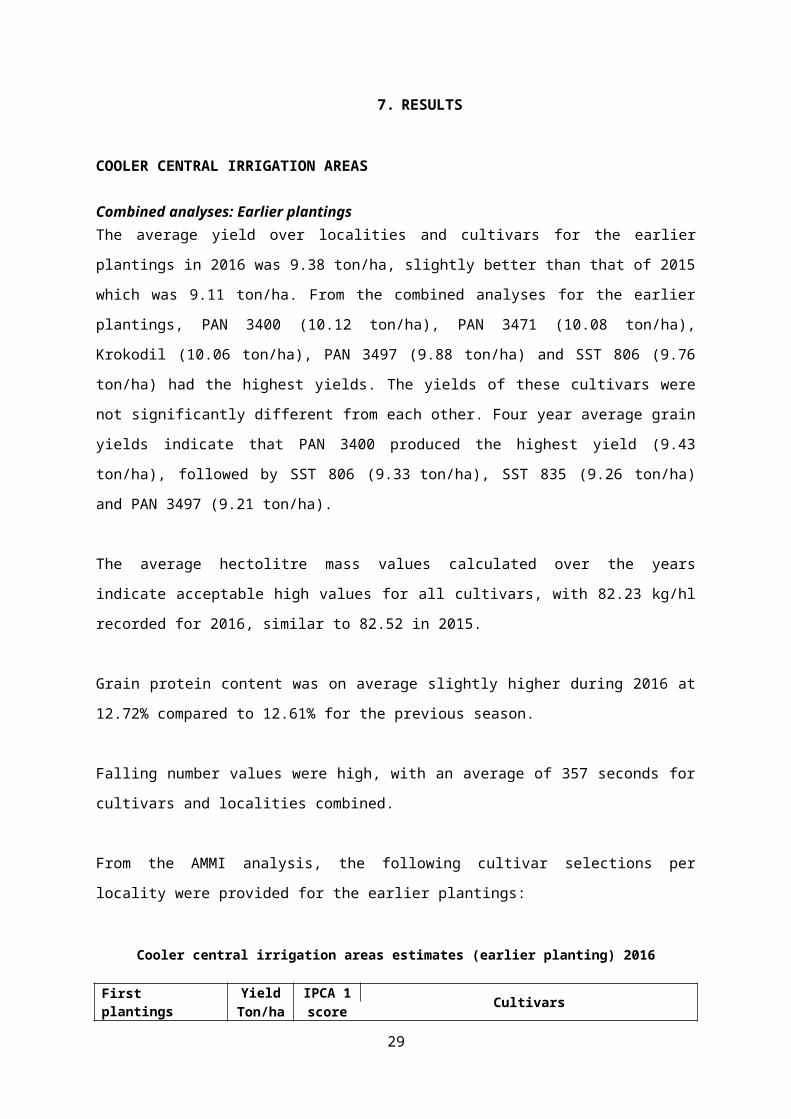
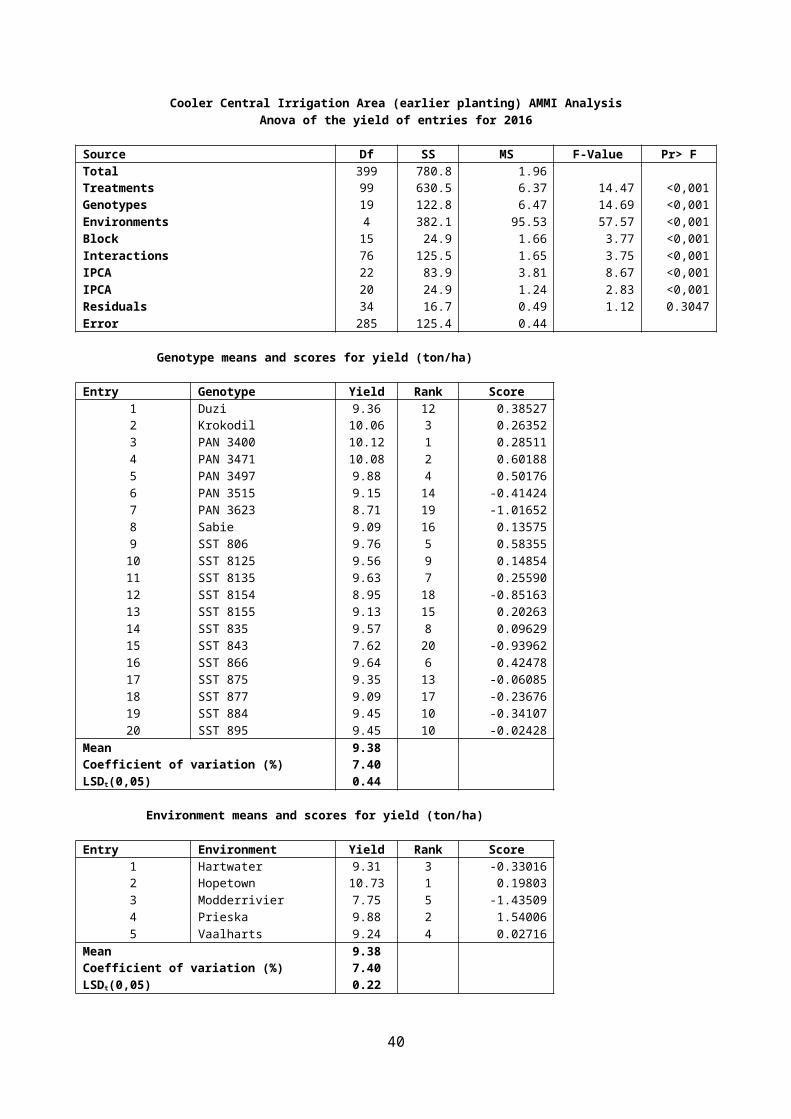
Combined analyses: Earlier plantingsThe average yield over localities and cultivars for the earlier plantings in 2016 was 9.38
ton/ha, slightly better than that of 2015 which was 9.11 ton/ha. From the combined analyses
for the earlier plantings, PAN 3400 (10.12 ton/ha), PAN 3471 (10.08 ton/ha), Krokodil (10.06
ton/ha), PAN 3497 (9.88 ton/ha) and SST 806 (9.76 ton/ha) had the highest yields. The
yields of these cultivars were not significantly different from each other. Four year average
grain yields indicate that PAN 3400 produced the highest yield (9.43 ton/ha), followed by
SST 806 (9.33 ton/ha), SST 835 (9.26 ton/ha) and PAN 3497 (9.21 ton/ha).
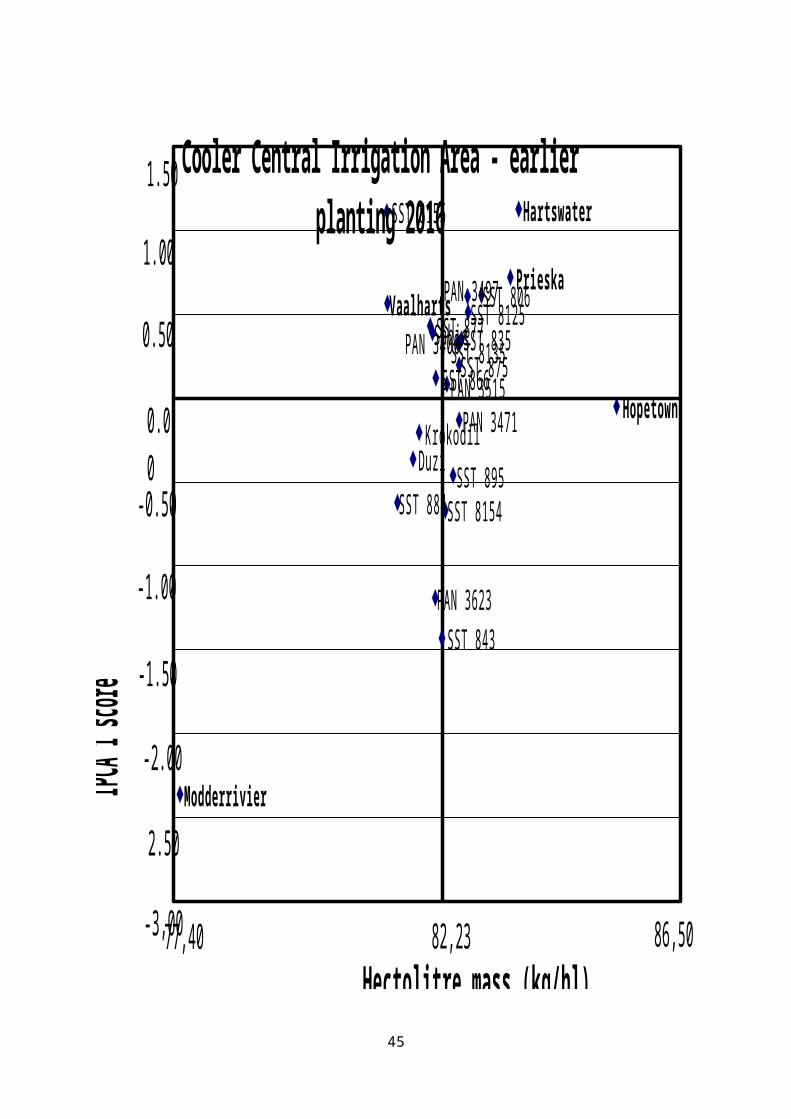
The average hectolitre mass values calculated over the years indicate acceptable high
values for all cultivars, with 82.23 kg/hl recorded for 2016, similar to 82.52 in 2015.
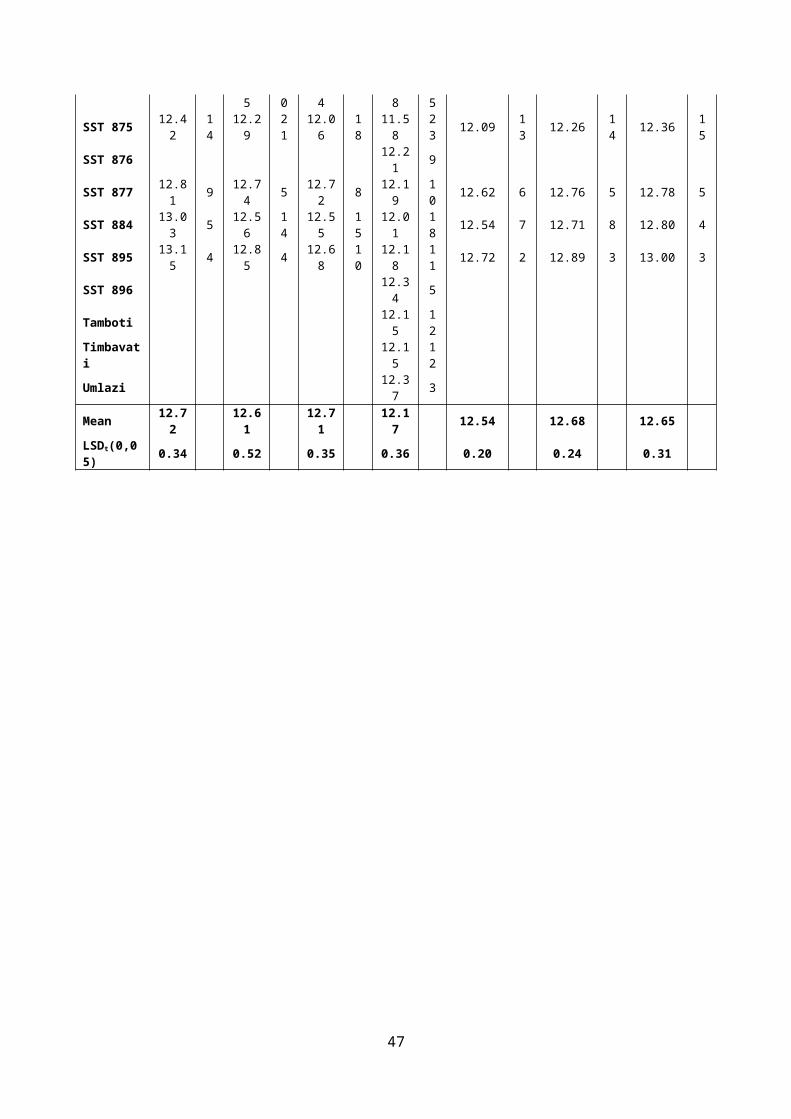
Grain protein content was on average slightly higher during 2016 at 12.72% compared to
12.61% for the previous season.
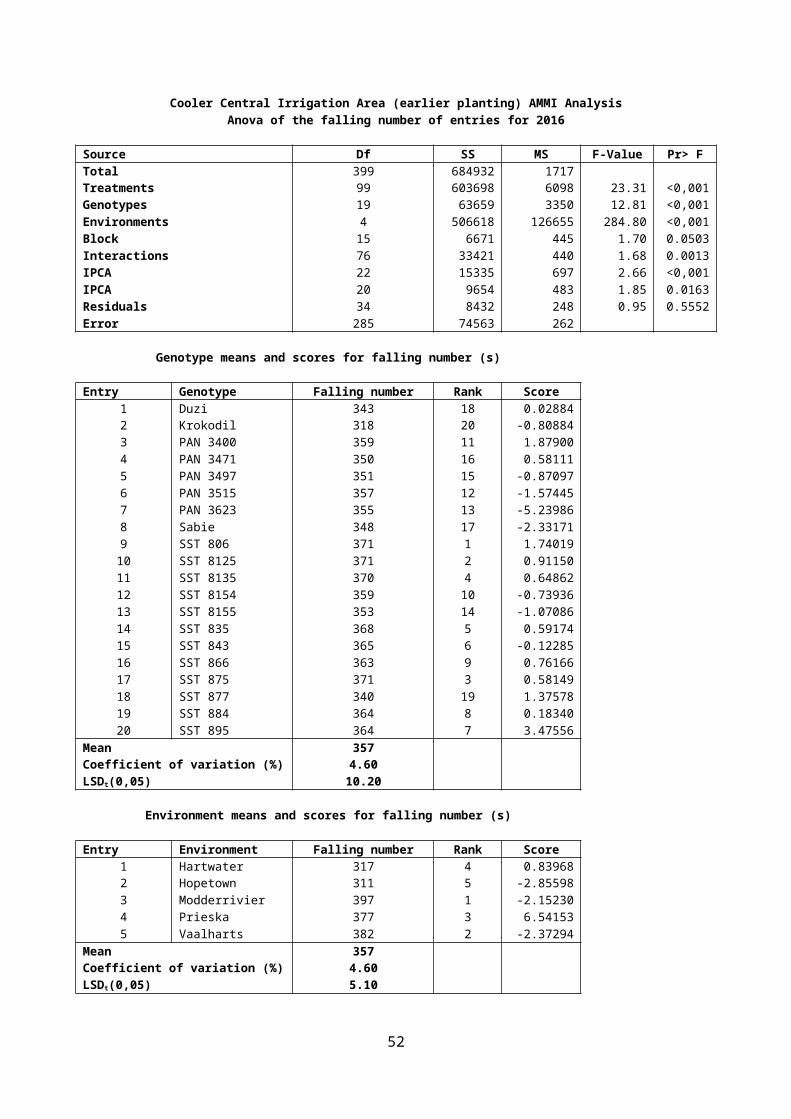
Falling number values were high, with an average of 357 seconds for cultivars and localities
combined.
From the AMMI analysis, the following cultivar selections per locality were provided for the
earlier plantings:
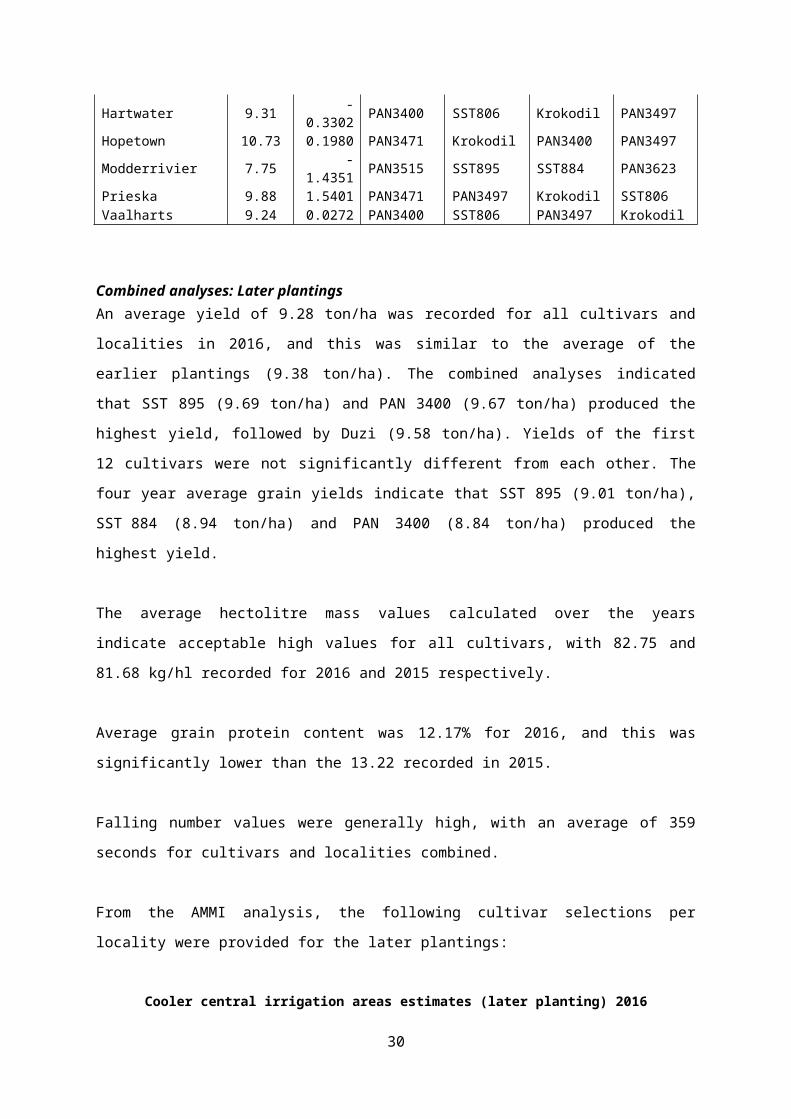
Cooler central irrigation areas estimates (earlier planting) 2016
First plantingsYield IPCA 1
CultivarsTon/ha score
Hartwater 9.31 -0.3302 PAN3400 SST806 Krokodil PAN3497Hopetown 10.73 0.1980 PAN3471 Krokodil PAN3400 PAN3497Modderrivier 7.75 -1.4351 PAN3515 SST895 SST884 PAN3623Prieska 9.88 1.5401 PAN3471 PAN3497 Krokodil SST806Vaalharts 9.24 0.0272 PAN3400 SST806 PAN3497 Krokodil
Combined analyses: Later plantings
20
An average yield of 9.28 ton/ha was recorded for all cultivars and localities in 2016, and this
was similar to the average of the earlier plantings (9.38 ton/ha). The combined analyses
indicated that SST 895 (9.69 ton/ha) and PAN 3400 (9.67 ton/ha) produced the highest yield,
followed by Duzi (9.58 ton/ha). Yields of the first 12 cultivars were not significantly different
from each other. The four year average grain yields indicate that SST 895 (9.01 ton/ha),
SST 884 (8.94 ton/ha) and PAN 3400 (8.84 ton/ha) produced the highest yield.
The average hectolitre mass values calculated over the years indicate acceptable high
values for all cultivars, with 82.75 and 81.68 kg/hl recorded for 2016 and 2015 respectively.
Average grain protein content was 12.17% for 2016, and this was significantly lower than the
13.22 recorded in 2015.
Falling number values were generally high, with an average of 359 seconds for cultivars and
localities combined.
From the AMMI analysis, the following cultivar selections per locality were provided for the
later plantings:
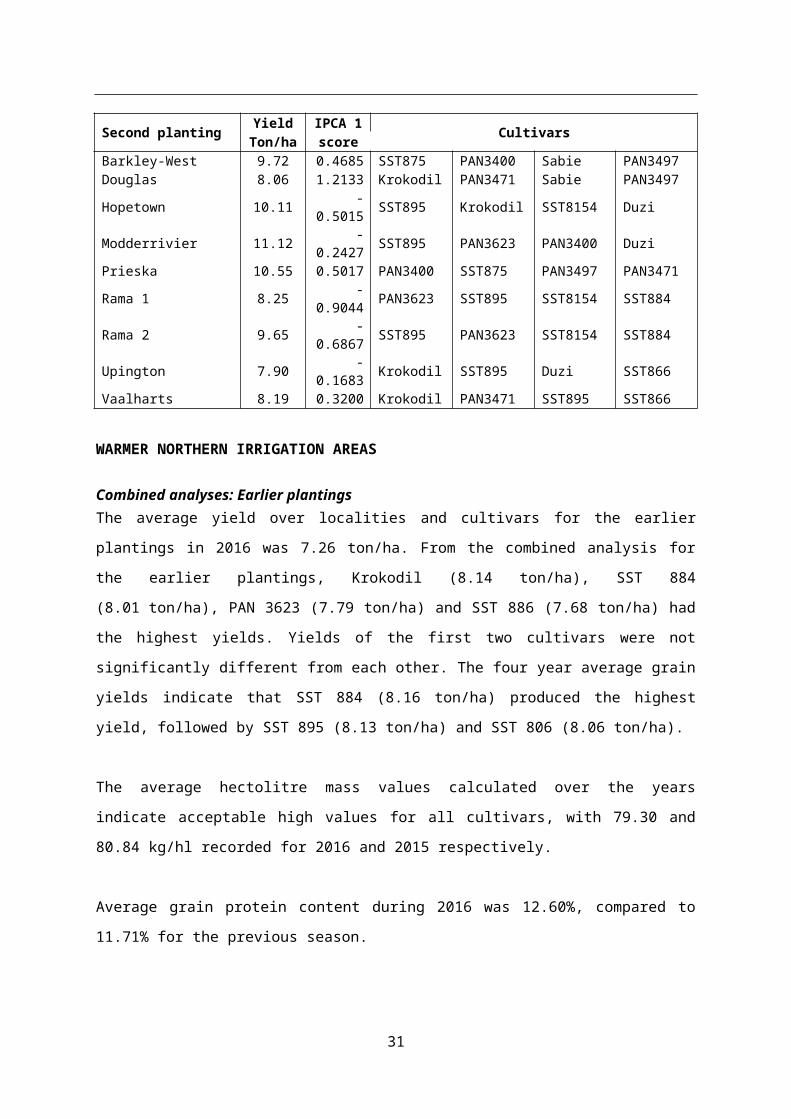
Cooler central irrigation areas estimates (later planting) 2016
Second plantingYield IPCA 1
CultivarsTon/ha score
Barkley-West 9.72 0.4685 SST875 PAN3400 Sabie PAN3497Douglas 8.06 1.2133 Krokodil PAN3471 Sabie PAN3497Hopetown 10.11 -0.5015 SST895 Krokodil SST8154 DuziModderrivier 11.12 -0.2427 SST895 PAN3623 PAN3400 DuziPrieska 10.55 0.5017 PAN3400 SST875 PAN3497 PAN3471Rama 1 8.25 -0.9044 PAN3623 SST895 SST8154 SST884Rama 2 9.65 -0.6867 SST895 PAN3623 SST8154 SST884Upington 7.90 -0.1683 Krokodil SST895 Duzi SST866Vaalharts 8.19 0.3200 Krokodil PAN3471 SST895 SST866
WARMER NORTHERN IRRIGATION AREAS
Combined analyses: Earlier plantingsThe average yield over localities and cultivars for the earlier plantings in 2016 was 7.26
ton/ha. From the combined analysis for the earlier plantings, Krokodil (8.14 ton/ha), SST 884
(8.01 ton/ha), PAN 3623 (7.79 ton/ha) and SST 886 (7.68 ton/ha) had the highest yields.
Yields of the first two cultivars were not significantly different from each other. The four year
21
average grain yields indicate that SST 884 (8.16 ton/ha) produced the highest yield, followed
by SST 895 (8.13 ton/ha) and SST 806 (8.06 ton/ha).
The average hectolitre mass values calculated over the years indicate acceptable high
values for all cultivars, with 79.30 and 80.84 kg/hl recorded for 2016 and 2015 respectively.
Average grain protein content during 2016 was 12.60%, compared to 11.71% for the
previous season.
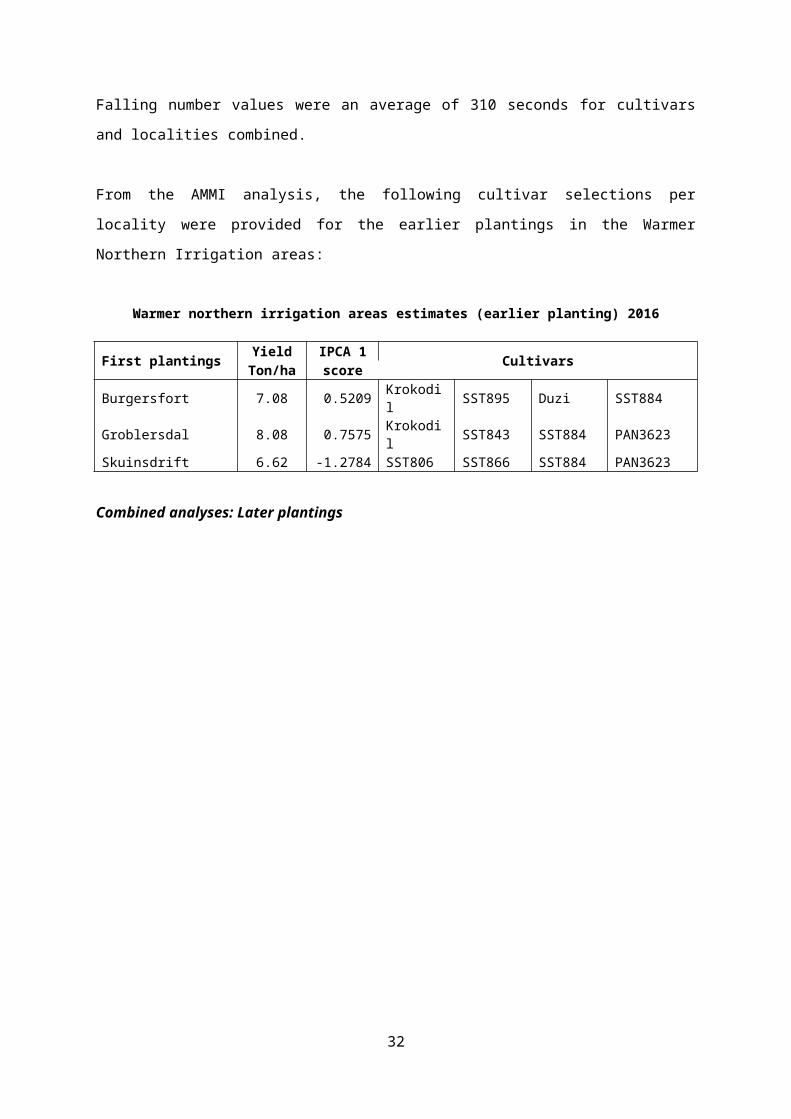
Falling number values were an average of 310 seconds for cultivars and localities combined.
From the AMMI analysis, the following cultivar selections per locality were provided for the
earlier plantings in the Warmer Northern Irrigation areas:
Warmer northern irrigation areas estimates (earlier planting) 2016
First plantingsYield IPCA 1
CultivarsTon/ha score
Burgersfort 7.08 0.5209 Krokodil SST895 Duzi SST884Groblersdal 8.08 0.7575 Krokodil SST843 SST884 PAN3623Skuinsdrift 6.62 -1.2784 SST806 SST866 SST884 PAN3623
Combined analyses: Later plantings
22
An average yield of 7.57 ton/ha was recorded for later plantings of the Warmer Northern
Irrigation areas in 2016. This average yield was similar to the earlier plantings which had
7.26 ton/ha. The combined analysis indicated that PAN 3400 (8.22 ton/ha) produced the
highest yield, followed by SST 895 (8.03 ton/ha) and PAN 3623 (8.00 ton/ha). The four year
average grain yields indicate that PAN 3400 (7.97 ton/ha) produced the highest yield,
followed by SST 895 (7.81 ton/ha) and SST 866 (7.68).
The average hectolitre mass values calculated over the years indicate acceptable high
values for all cultivars, with 82.01 and 82.32 kg/hl recorded for 2016 and 2015, respectively.
Grain protein content was on average slightly lower during 2016 at 12.06%, compared to
12.72% for the previous season.
Falling number values were generally high, with an average of 356 seconds for cultivars and
localities combined.
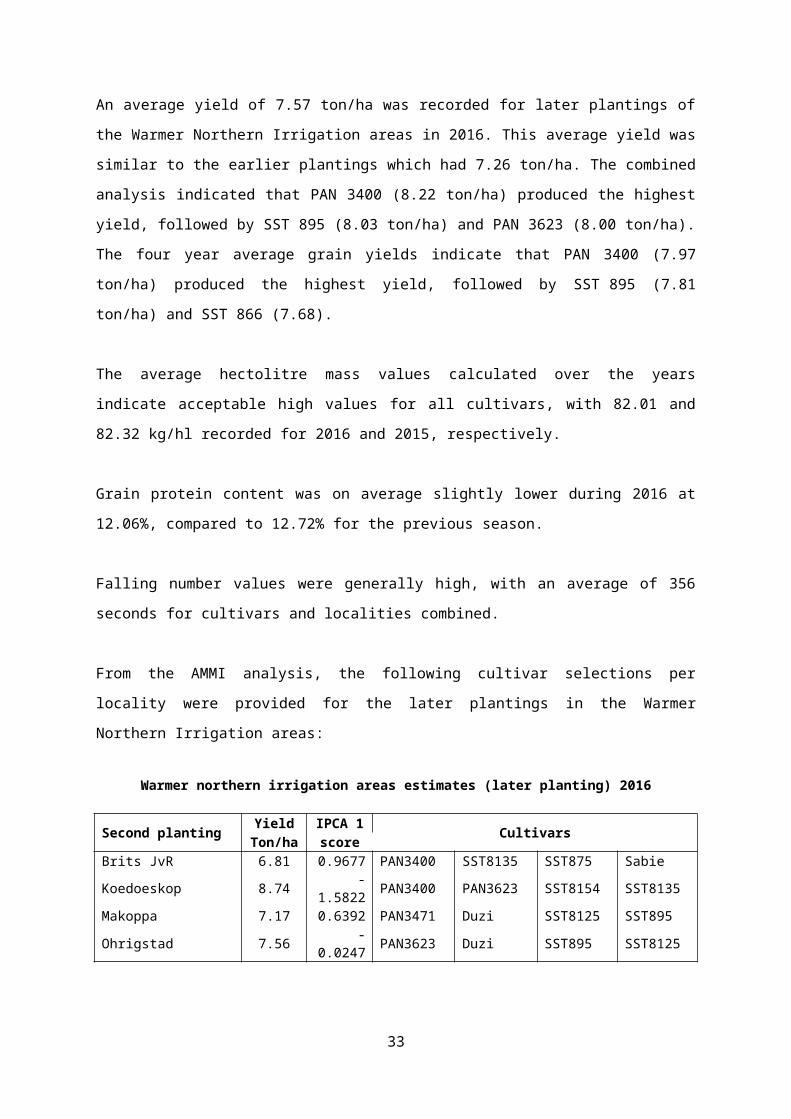
From the AMMI analysis, the following cultivar selections per locality were provided for the
later plantings in the Warmer Northern Irrigation areas:
Warmer northern irrigation areas estimates (later planting) 2016
Second plantingYield IPCA 1
CultivarsTon/ha score
Brits JvR 6.81 0.9677 PAN3400 SST8135 SST875 SabieKoedoeskop 8.74 -1.5822 PAN3400 PAN3623 SST8154 SST8135Makoppa 7.17 0.6392 PAN3471 Duzi SST8125 SST895Ohrigstad 7.56 -0.0247 PAN3623 Duzi SST895 SST8125
HIGHVELD
Combined analyses earlier planting dateThe average yield over localities and cultivars for the Highveld in 2016 was 7.06 ton/ha,
significantly lower than 2015 which had a yield of 8.55 ton/ha. From the combined analysis
for the earlier plantings, PAN 3497 (8.38 ton/ha), SST 835 (7.40 ton/ha), PAN 3471 (7.34
ton/ha) and PAN 3400 (7.33 ton/ha) had the highest yields. The yield of PAN 3497 was
significantly higher than the rest of the entries. The three year average grain yields indicate
that PAN 3497 (8.71 ton/ha) produced the highest yield, followed by SST 835 (8.23 ton/ha)
and SST 884 (8.18 ton/ha).
23
The average hectolitre mass values calculated over the years indicate acceptable high
values for all cultivars, with 81.36 kg/hl and 83.39 kg/hl recorded for 2016 and 2015,
respectively.
Average grain protein content was very high in 2016 at 13.46%, which is significantly higher
than in 2015 (11.60%).
Falling number values were generally high, with an average of 304 seconds for cultivars and
localities combined.
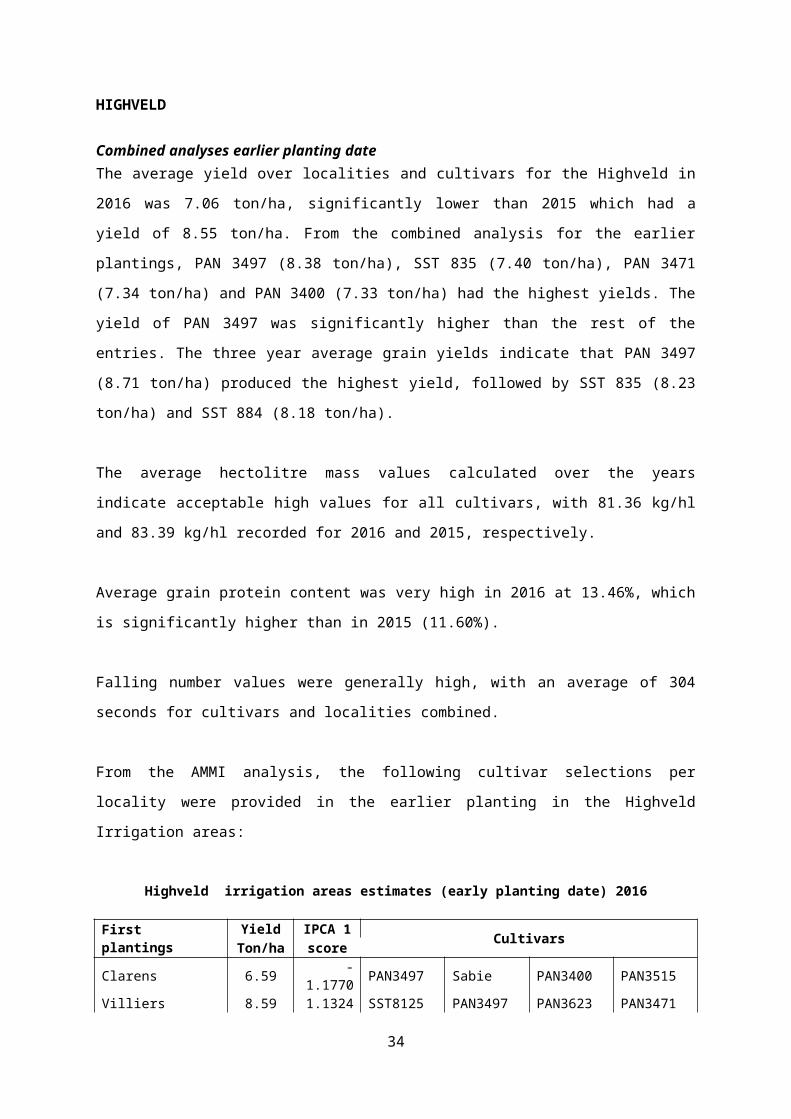
From the AMMI analysis, the following cultivar selections per locality were provided in the
earlier planting in the Highveld Irrigation areas:
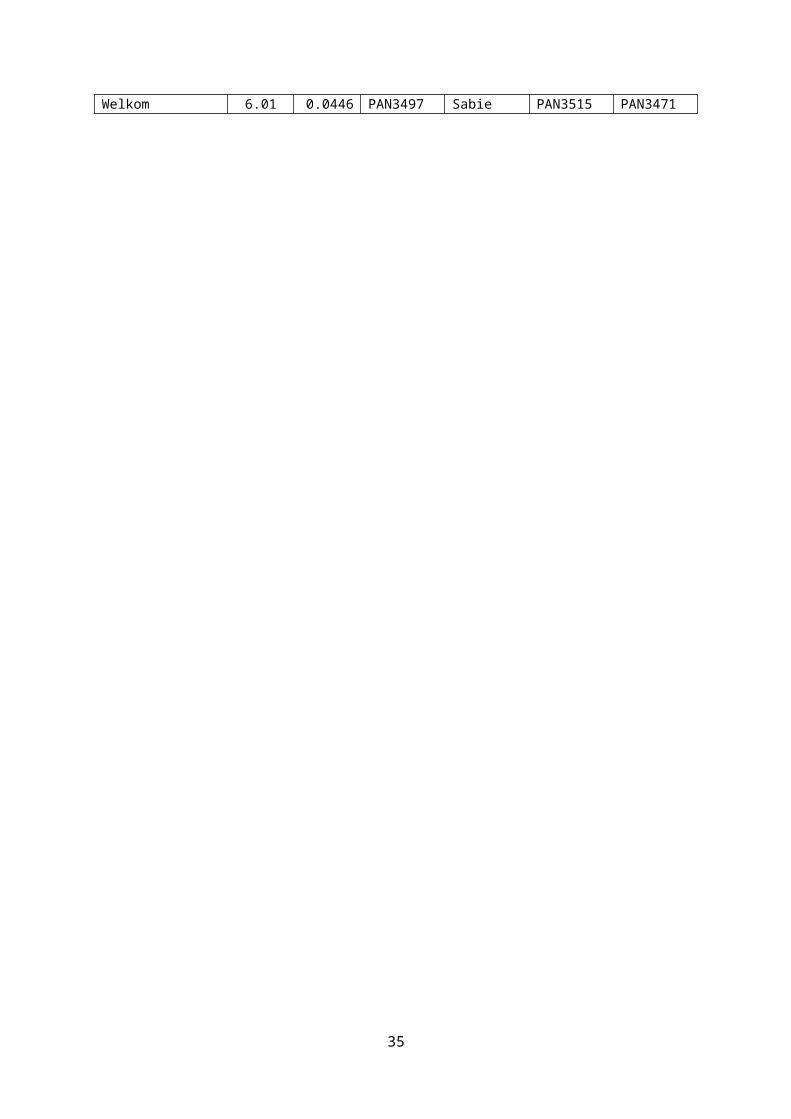
Highveld irrigation areas estimates (early planting date) 2016
First plantingsYield IPCA 1
CultivarsTon/ha score
Clarens 6.59 -1.1770 PAN3497 Sabie PAN3400 PAN3515Villiers 8.59 1.1324 SST8125 PAN3497 PAN3623 PAN3471Welkom 6.01 0.0446 PAN3497 Sabie PAN3515 PAN3471
24
Combined analyses later planting dateThe average yield over localities and cultivars for the later planting in the Highveld in 2016
was 7.85 ton/ha. This was significantly higher than the 6.29 ton/ha recorded in 2015. From
the combined analysis for the earlier plantings, PAN 3623 (9.38 ton/ha), Krokodil
(8.57 ton/ha), SST 895 (8.32 ton/ha) and SST 835 (8.22 ton/ha) had the highest yields. The
yield of PAN 3623 was significantly higher than all the other entries. The four year average
grain yields indicate that SST 835 (7.85 ton/ha) produced the highest yield, followed by SST
895 (7.63 ton/ha) and Krokodil (7.60 ton/ha).
The average hectolitre mass values calculated over the years indicate acceptable high
values for all cultivars, with 78.63 kg/hl and 81.44 kg/hl recorded for 2016 and 2015,
respectively.
Average grain protein content was high in 2016 at 12.40%, lower than in 2015 (13.60%).
Falling number values were generally high, with an average of 316 seconds for cultivars and
localities combined.
Since only two localities were available no AMMI analyses was done for the later planting in
the Highveld Irrigation areas.
KWAZULU NATAL
Combined analysesThe average yield over localities and cultivars in 2016 was 6.61 ton/ha. From the combined
analysis, SST 8154 (7.35 ton/ha), PAN 3515 (7.23 ton/ha), SST 8135 (7.21 ton/ha) and PAN
3400 (7.07 ton/ha) had the highest yields. The yields of these cultivars were not significantly
different from each other. The four year average grain yields indicate that SST 806
(6.97 ton/ha) produced the highest yield, followed by SST 835 (6.92 ton/ha) and Krokodil
(6.82 ton/ha).
The average hectolitre mass values for 2016 indicated high values for all cultivars, with an
average of 79.45 kg/hl.
Grain protein content was high during 2016 at 12.58%.
25
Falling number values were generally high, with an average of 333 seconds for cultivars and
localities combined.
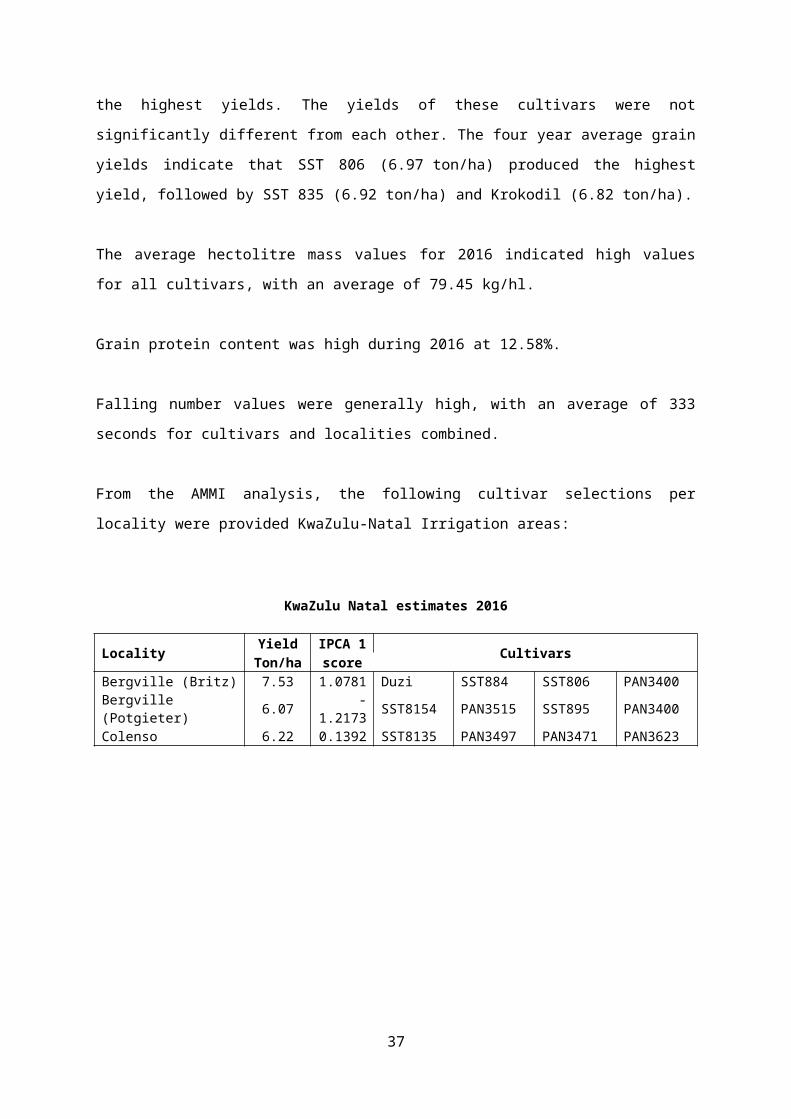
From the AMMI analysis, the following cultivar selections per locality were provided
KwaZulu-Natal Irrigation areas:
KwaZulu Natal estimates 2016
LocalityYield IPCA 1
CultivarsTon/ha score
Bergville (Britz) 7.53 1.0781 Duzi SST884 SST806 PAN3400Bergville (Potgieter) 6.07 -1.2173 SST8154 PAN3515 SST895 PAN3400Colenso 6.22 0.1392 SST8135 PAN3497 PAN3471 PAN3623
26
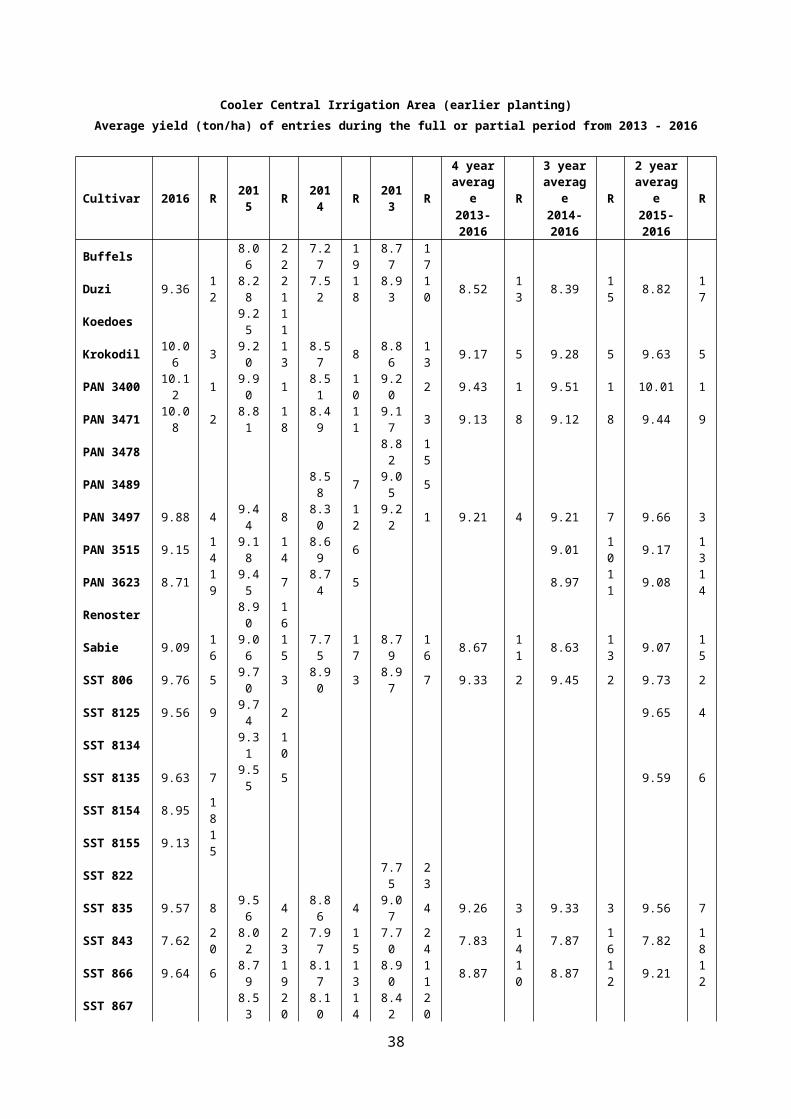
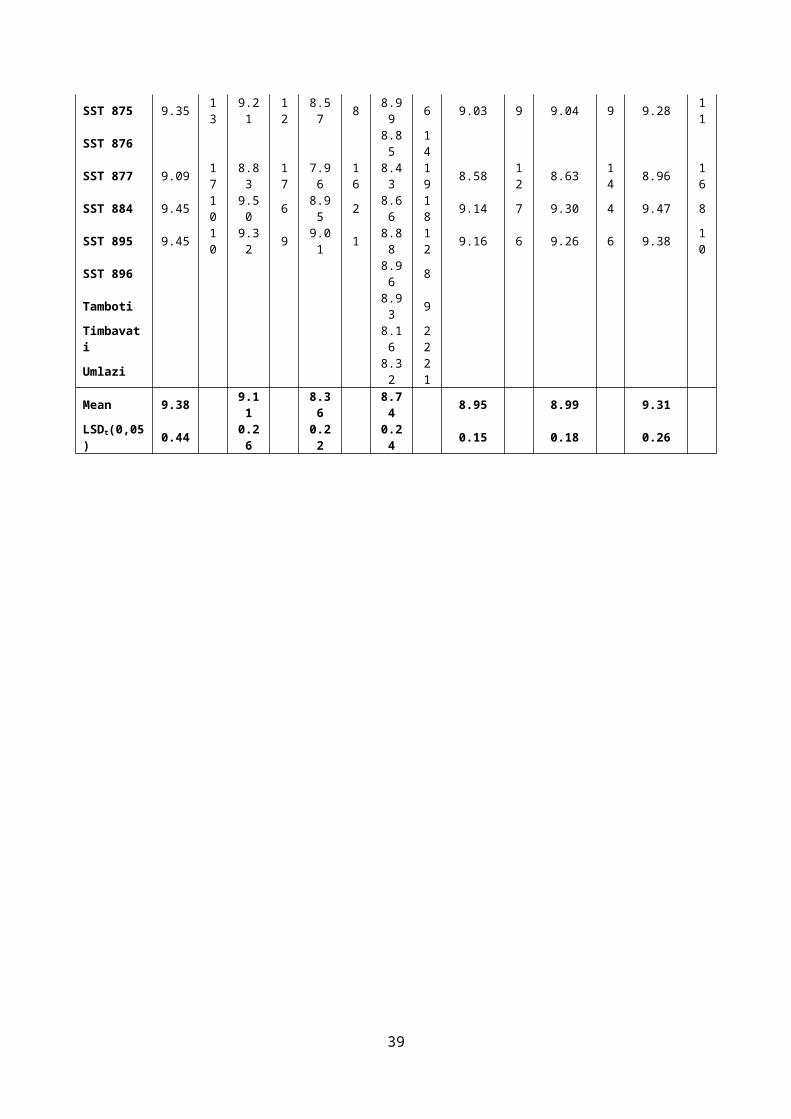
Cooler Central Irrigation Area (earlier planting)Average yield (ton/ha) of entries during the full or partial period from 2013 - 2016
Cultivar 2016 R 2015 R 2014 R 2013 R4 year
average R3 year
average R2 year
average R2013-2016
2014-2016
2015-2016
Buffels 8.06 22 7.27 19 8.77 17
Duzi 9.36 12 8.28 21 7.52 18 8.93 10 8.52 13 8.39 15 8.82 17
Koedoes 9.25 11
Krokodil 10.06 3 9.20 13 8.57 8 8.86 13 9.17 5 9.28 5 9.63 5
PAN 3400 10.12 1 9.90 1 8.51 10 9.20 2 9.43 1 9.51 1 10.01 1
PAN 3471 10.08 2 8.81 18 8.49 11 9.17 3 9.13 8 9.12 8 9.44 9
PAN 3478 8.82 15
PAN 3489 8.58 7 9.05 5
PAN 3497 9.88 4 9.44 8 8.30 12 9.22 1 9.21 4 9.21 7 9.66 3
PAN 3515 9.15 14 9.18 14 8.69 6 9.01 10 9.17 13
PAN 3623 8.71 19 9.45 7 8.74 5 8.97 11 9.08 14
Renoster 8.90 16
Sabie 9.09 16 9.06 15 7.75 17 8.79 16 8.67 11 8.63 13 9.07 15
SST 806 9.76 5 9.70 3 8.90 3 8.97 7 9.33 2 9.45 2 9.73 2
SST 8125 9.56 9 9.74 2 9.65 4
SST 8134 9.31 10
SST 8135 9.63 7 9.55 5 9.59 6
SST 8154 8.95 18
SST 8155 9.13 15
SST 822 7.75 23
SST 835 9.57 8 9.56 4 8.86 4 9.07 4 9.26 3 9.33 3 9.56 7
SST 843 7.62 20 8.02 23 7.97 15 7.70 24 7.83 14 7.87 16 7.82 18
SST 866 9.64 6 8.79 19 8.17 13 8.90 11 8.87 10 8.87 12 9.21 12
SST 867 8.53 20 8.10 14 8.42 20
SST 875 9.35 13 9.21 12 8.57 8 8.99 6 9.03 9 9.04 9 9.28 11
SST 876 8.85 14
SST 877 9.09 17 8.83 17 7.96 16 8.43 19 8.58 12 8.63 14 8.96 16
SST 884 9.45 10 9.50 6 8.95 2 8.66 18 9.14 7 9.30 4 9.47 8
SST 895 9.45 10 9.32 9 9.01 1 8.88 12 9.16 6 9.26 6 9.38 10
SST 896 8.96 8
Tamboti 8.93 9
Timbavati 8.16 22
Umlazi 8.32 21
Mean 9.38 9.11 8.36 8.74 8.95 8.99 9.31 LSDt(0,05) 0.44 0.26 0.22 0.24 0.15 0.18 0.26
27
Cooler Central Irrigation Area (earlier planting) AMMI AnalysisAnova of the yield of entries for 2016
Source Df SS MS F-Value Pr> FTotal 399 780.8 1.96Treatments 99 630.5 6.37 14.47 <0,001Genotypes 19 122.8 6.47 14.69 <0,001Environments 4 382.1 95.53 57.57 <0,001Block 15 24.9 1.66 3.77 <0,001Interactions 76 125.5 1.65 3.75 <0,001IPCA 22 83.9 3.81 8.67 <0,001IPCA 20 24.9 1.24 2.83 <0,001Residuals 34 16.7 0.49 1.12 0.3047Error 285 125.4 0.44
Genotype means and scores for yield (ton/ha)
Entry Genotype Yield Rank Score1 Duzi 9.36 12 0.385272 Krokodil 10.06 3 0.263523 PAN 3400 10.12 1 0.285114 PAN 3471 10.08 2 0.601885 PAN 3497 9.88 4 0.501766 PAN 3515 9.15 14 -0.414247 PAN 3623 8.71 19 -1.016528 Sabie 9.09 16 0.135759 SST 806 9.76 5 0.58355
10 SST 8125 9.56 9 0.1485411 SST 8135 9.63 7 0.2559012 SST 8154 8.95 18 -0.8516313 SST 8155 9.13 15 0.2026314 SST 835 9.57 8 0.0962915 SST 843 7.62 20 -0.9396216 SST 866 9.64 6 0.4247817 SST 875 9.35 13 -0.0608518 SST 877 9.09 17 -0.2367619 SST 884 9.45 10 -0.3410720 SST 895 9.45 10 -0.02428
Mean 9.38 Coefficient of variation (%) 7.40 LSDt(0,05) 0.44
Environment means and scores for yield (ton/ha)
Entry Environment Yield Rank Score1 Hartwater 9.31 3 -0.330162 Hopetown 10.73 1 0.198033 Modderrivier 7.75 5 -1.435094 Prieska 9.88 2 1.540065 Vaalharts 9.24 4 0.02716
Mean 9.38 Coefficient of variation (%) 7.40 LSDt(0,05) 0.22
28
DuziKrokodilPAN 3400
PAN 3471PAN 3497
PAN 3515
PAN 3623
Sabie
SST 806
SST 8125SST 8135
SST 8154
SST 8155SST 835
SST 843
SST 866
SST 875SST 877
SST 884
SST 895
Hartswater
Hopetown
Modderrivier
Prieska
Vaalharts
Cooler Central Irrigation Area - earlier planting 2016
Grain yield (ton/ha)
IPCA 1 sc
ore
0.50
7,55 11,209,38
-1.50
1.00
0.00
-0.50
-1.00
1.50
-2.00
2.50
29
Cooler Central Irrigation Area (earlier planting)Average hectolitre mass (kg/hl) of entries during the full or partial period from 2013 - 2016
Cultivar 2016 R 2015 R 2014 R 2013 R4 year
average R3 year
average R2 year
average R2013-2016
2014-2016
2015-2016
Buffels 81.17 22 79.12 17 78.51 23
Duzi 81.70 18 81.62 20 78.90 19 79.32 22 80.39 14 80.74 16 81.66 16
Koedoes 81.83 19
Krokodil 81.81 17 82.00 16 80.47 10 78.49 24 80.69 11 81.43 12 81.91 15
PAN 3400 82.50 8 83.49 3 80.22 13 80.77 9 81.75 5 82.07 5 83.00 5
PAN 3471 82.53 6 83.77 1 81.11 4 81.25 5 82.17 2 82.47 2 83.15 2
PAN 3478 81.33 3
PAN 3489 82.46 1 81.73 1
PAN 3497 82.68 3 83.44 5 81.03 5 81.09 7 82.06 3 82.38 3 83.06 3
PAN 3515 82.31 10 82.38 13 79.74 15 81.48 11 82.35 12
PAN 3623 82.10 14 82.99 9 80.83 6 81.97 7 82.55 10
Renoster 81.06 23
Sabie 82.05 15 82.09 15 79.06 18 79.44 21 80.66 12 81.07 14 82.07 13
SST 806 82.93 1 83.64 2 81.14 3 81.45 2 82.29 1 82.57 1 83.29 1
SST 8125 82.69 2 83.28 6 82.99 6
SST 8134 82.13 14
SST 8135 82.54 5 83.48 4 83.01 4
SST 8154 82.28 11
SST 8155 81.23 20
SST 822 80.59 12
SST 835 82.57 4 83.28 6 80.33 11 81.29 4 81.87 4 82.06 6 82.93 7
SST 843 82.22 12 83.18 8 80.48 8 80.96 8 81.71 7 81.96 8 82.70 8
SST 866 82.11 13 81.87 18 80.72 7 80.52 13 81.31 9 81.57 10 81.99 14
SST 867 82.90 10 80.31 12 80.17 14
SST 875 82.53 6 82.47 12 80.48 8 80.67 11 81.54 8 81.83 9 82.50 11
SST 876 81.15 6
SST 877 82.01 16 81.26 21 79.26 16 79.63 17 80.54 13 80.84 15 81.64 18
SST 884 81.42 19 81.89 17 79.94 14 79.64 16 80.72 10 81.08 13 81.66 17
SST 895 82.42 9 82.67 11 81.17 2 80.71 10 81.74 6 82.09 4 82.55 9
SST 896 79.49 20
Tamboti 79.51 19
Timbavati 79.58 18
Umlazi 79.73 15
Mean 82.23 82.52 80.36 80.29 81.39 81.73 82.50 LSDt(0,05) 0.62 0.61 0.46 0.63 0.27 0.33 0.44
30
Cooler Central Irrigation Area (earlier planting) AMMI AnalysisAnova of the hectolitre mass of entries for 2016
Source Df SS MS F-Value Pr> FTotal 399 3557 8.92Treatments 99 3264 32.97 35.59 <0,001Genotypes 19 73 3.83 4.14 <0,001Environments 4 2917 729.27 369.48 <0,001Block 15 30 1.97 2.13 0.0089Interactions 76 274 3.61 3.89 <0,001IPCA 22 236 10.71 11.56 <0,001IPCA 20 16 0.82 0.89 0.6064Residuals 34 22 0.65 0.70 0.8953Error 285 264 0.93
Genotype means and scores for hectolitre mass (kg/hl)
Entry Genotype Hectolitre mass Rank Score1 Duzi 81.70 18 -0.362992 Krokodil 81.81 17 -0.204723 PAN 3400 82.50 8 0.329874 PAN 3471 82.53 6 -0.130835 PAN 3497 82.68 3 0.606426 PAN 3515 82.31 10 0.083327 PAN 3623 82.10 14 -1.189688 Sabie 82.05 15 0.390069 SST 806 82.93 1 0.61214
10 SST 8125 82.69 2 0.5126511 SST 8135 82.54 5 0.3294712 SST 8154 82.28 11 -0.6689413 SST 8155 81.23 20 1.1093214 SST 835 82.57 4 0.3512615 SST 843 82.22 12 -1.4304916 SST 866 82.11 13 0.1201717 SST 875 82.53 6 0.1972918 SST 877 82.01 16 0.4293319 SST 884 81.42 19 -0.6230820 SST 895 82.42 9 -0.46056
Mean 82.23 Coefficient of variation (%) 1.20 LSDt(0,05) 0.62
Environment means and scores for hectolitre mass (kg/hl)
Entry Environment Hectolitre mass Rank Score1 Hartwater 83.60 2 1.125402 Hopetown 85.36 1 -0.049253 Modderrivier 77.51 5 -2.359804 Prieska 83.45 3 0.719645 Vaalharts 81.24 4 0.56401
Mean 82.23 Coefficient of variation (%) 1.20 LSDt(0,05) 0.31
31
DuziKrokodil
PAN 3400
PAN 3471
PAN 3497
PAN 3515
PAN 3623
SabieSST 806
SST 8125SST 8135
SST 8154
SST 8155
SST 835
SST 843
SST 866SST 875SST 877
SST 884SST 895
Hartswater
Hopetown
Modderrivier
PrieskaVaalharts
Cooler Central Irrigation Area - earlier planting 2016
Hectolitre mass (kg/hl)
IPCA 1 sc
ore
0.50
77,40 86,5082,23
-1.50
1.00
0.00
-0.50
-1.00
1.50
-2.00
2.50
-3,00
32
Cooler Central Irrigation Area (earlier planting)Average protein content (%) of entries during the full or partial period from 2013 - 2016
Cultivar 2016 R 2015 R 2014 R 2013 R4 year
average R3 year
average R2 year
average R2013-2016
2014-2016
2015-2016
Buffels 12.74 5 12.75 7 12.24 8
Duzi 12.83 8 12.45 18 12.94 3 12.35 4 12.64 4 12.74 7 12.64 10
Koedoes 12.88 3
Krokodil 11.72 20 11.59 23 11.82 19 11.37 24 11.63 14 11.71 16 11.66 18
PAN 3400 12.90 6 12.51 17 12.84 6 12.27 7 12.63 5 12.75 6 12.71 7
PAN 3471 12.65 12 12.73 7 12.58 13 11.91 20 12.47 8 12.65 9 12.69 8
PAN 3478 12.07 16
PAN 3489 12.56 14 11.73 22
PAN 3497 12.48 13 12.55 15 12.70 9 11.74 21 12.37 11 12.58 10 12.52 11
PAN 3515 11.97 19 12.44 19 12.15 17 12.19 15 12.21 16
PAN 3623 13.42 2 12.94 2 13.15 2 13.17 2 13.18 2
Renoster 12.61 13
Sabie 12.84 7 12.64 12 12.88 5 12.29 6 12.66 3 12.79 4 12.74 6
SST 806 12.68 11 12.33 20 12.65 12 12.10 14 12.44 9 12.55 11 12.51 12
SST 8125 12.32 15 12.54 16 12.43 14
SST 8134 12.73 7
SST 8135 12.71 10 12.65 10 12.68 6
SST 8154 13.20 3
SST 8155 12.26 16
SST 822 12.94 2
SST 835 12.22 17 12.7 9 12.67 11 12.06 17 12.41 10 12.53 12 12.46 13
SST 843 14.70 1 13.79 1 14.36 1 13.76 1 14.15 1 14.28 1 14.25 1
SST 866 12.15 18 12.18 22 12.47 16 11.97 19 12.19 12 12.27 13 12.17 17
SST 867 12.65 10 12.94 3 12.08 15
SST 875 12.42 14 12.29 21 12.06 18 11.58 23 12.09 13 12.26 14 12.36 15
SST 876 12.21 9
SST 877 12.81 9 12.74 5 12.72 8 12.19 10 12.62 6 12.76 5 12.78 5
SST 884 13.03 5 12.56 14 12.55 15 12.01 18 12.54 7 12.71 8 12.80 4
SST 895 13.15 4 12.85 4 12.68 10 12.18 11 12.72 2 12.89 3 13.00 3
SST 896 12.34 5
Tamboti 12.15 12
Timbavati 12.15 12
Umlazi 12.37 3
Mean 12.72 12.61 12.71 12.17 12.54 12.68 12.65 LSDt(0,05) 0.34 0.52 0.35 0.36 0.20 0.24 0.31
33
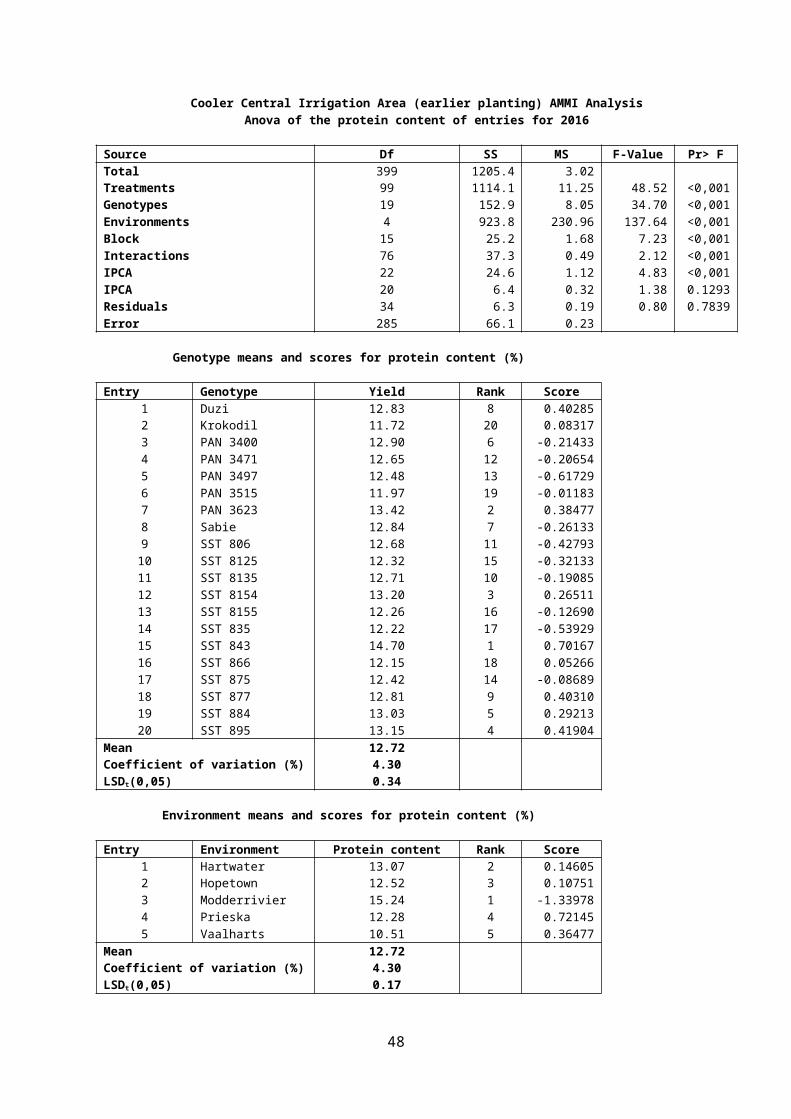
Cooler Central Irrigation Area (earlier planting) AMMI AnalysisAnova of the protein content of entries for 2016
Source Df SS MS F-Value Pr> FTotal 399 1205.4 3.02Treatments 99 1114.1 11.25 48.52 <0,001Genotypes 19 152.9 8.05 34.70 <0,001Environments 4 923.8 230.96 137.64 <0,001Block 15 25.2 1.68 7.23 <0,001Interactions 76 37.3 0.49 2.12 <0,001IPCA 22 24.6 1.12 4.83 <0,001IPCA 20 6.4 0.32 1.38 0.1293Residuals 34 6.3 0.19 0.80 0.7839Error 285 66.1 0.23
Genotype means and scores for protein content (%)
Entry Genotype Yield Rank Score1 Duzi 12.83 8 0.402852 Krokodil 11.72 20 0.083173 PAN 3400 12.90 6 -0.214334 PAN 3471 12.65 12 -0.206545 PAN 3497 12.48 13 -0.617296 PAN 3515 11.97 19 -0.011837 PAN 3623 13.42 2 0.384778 Sabie 12.84 7 -0.261339 SST 806 12.68 11 -0.42793
10 SST 8125 12.32 15 -0.3213311 SST 8135 12.71 10 -0.1908512 SST 8154 13.20 3 0.2651113 SST 8155 12.26 16 -0.1269014 SST 835 12.22 17 -0.5392915 SST 843 14.70 1 0.7016716 SST 866 12.15 18 0.0526617 SST 875 12.42 14 -0.0868918 SST 877 12.81 9 0.4031019 SST 884 13.03 5 0.2921320 SST 895 13.15 4 0.41904
Mean 12.72 Coefficient of variation (%) 4.30 LSDt(0,05) 0.34
Environment means and scores for protein content (%)
Entry Environment Protein content Rank Score1 Hartwater 13.07 2 0.146052 Hopetown 12.52 3 0.107513 Modderrivier 15.24 1 -1.339784 Prieska 12.28 4 0.721455 Vaalharts 10.51 5 0.36477
Mean 12.72 Coefficient of variation (%) 4.30 LSDt(0,05) 0.17
34
Duzi
Krokodil
PAN 3400PAN 3471
PAN 3497
PAN 3515
PAN 3623
Sabie
SST 806SST 8125
SST 8135
SST 8154
SST 8155
SST 835
SST 843
SST 866SST 875
SST 877SST 884
SST 895
HartswaterHopetown
Modderrivier
Prieska
Vaalharts
Cooler Central Irrigation Area - earlier planting 2016
Protein content (%)
IPCA 1 sc
ore
0.50
10,45 16,0012,72-1.50
1.00
0.00
-0.50
-1.00
11,00 12,00
35
Cooler Central Irrigation Area (earlier planting)Average falling number (s) of entries during the full or partial period from 2013 - 2016
Cultivar 2016 R 2015 R 2014 R 2013 R4 year
average R3 year
average R2 year
average R2013-2016
2014-2016
2015-2016
Buffels 338 15 359 4 334 11
Duzi 343 18 331 20 351 16 326 18 338 12 342 14 337 16
Koedoes 339 13
Krokodil 318 20 323 23 329 19 303 24 318 14 323 16 320 18
PAN 3400 359 11 335 18 356 11 322 20 343 11 350 10 347 13
PAN 3471 350 16 349 5 354 12 330 13 346 8 351 9 349 11
PAN 3478 329 16
PAN 3489 358 7 335 10
PAN 3497 351 15 345 8 358 6 326 19 345 9 351 8 348 12
PAN 3515 357 12 333 19 349 17 346 13 345 14
PAN 3623 355 13 346 7 347 18 349 11 350 9
Renoster 330 21
Sabie 348 17 339 14 359 5 330 13 344 10 349 12 344 15
SST 806 371 1 352 2 361 3 340 2 356 1 361 1 361 1
SST 8125 371 2 342 11 357 5
SST 8134 354 1
SST 8135 370 4 350 3 360 2
SST 8154 359 10
SST 8155 353 14
SST 822 308 22
SST 835 368 5 344 9 357 9 332 12 350 7 356 5 356 7
SST 843 365 6 342 12 363 2 339 5 352 4 356 4 353 8
SST 866 363 9 337 16 364 1 338 6 350 6 355 7 350 10
SST 867 337 17 352 15 320 21
SST 875 371 3 343 10 358 8 337 7 352 3 357 2 357 4
SST 876 330 15
SST 877 340 19 327 22 352 14 308 23 332 13 340 15 334 17
SST 884 364 8 348 6 353 13 340 3 351 5 355 6 356 6
SST 895 364 7 350 4 356 10 344 1 353 2 357 3 357 3
SST 896 337 8
Tamboti 327 17
Timbavati 336 9
Umlazi 340 4
Mean 357 341 354 330 345 350 349 LSDt(0,05) 10.20 10.95 7.96 8.22 4.50 5.70 7.40
36
Cooler Central Irrigation Area (earlier planting) AMMI AnalysisAnova of the falling number of entries for 2016
Source Df SS MS F-Value Pr> FTotal 399 684932 1717Treatments 99 603698 6098 23.31 <0,001Genotypes 19 63659 3350 12.81 <0,001Environments 4 506618 126655 284.80 <0,001Block 15 6671 445 1.70 0.0503Interactions 76 33421 440 1.68 0.0013IPCA 22 15335 697 2.66 <0,001IPCA 20 9654 483 1.85 0.0163Residuals 34 8432 248 0.95 0.5552Error 285 74563 262
Genotype means and scores for falling number (s)
Entry Genotype Falling number Rank Score1 Duzi 343 18 0.028842 Krokodil 318 20 -0.808843 PAN 3400 359 11 1.879004 PAN 3471 350 16 0.581115 PAN 3497 351 15 -0.870976 PAN 3515 357 12 -1.574457 PAN 3623 355 13 -5.239868 Sabie 348 17 -2.331719 SST 806 371 1 1.74019
10 SST 8125 371 2 0.9115011 SST 8135 370 4 0.6486212 SST 8154 359 10 -0.7393613 SST 8155 353 14 -1.0708614 SST 835 368 5 0.5917415 SST 843 365 6 -0.1228516 SST 866 363 9 0.7616617 SST 875 371 3 0.5814918 SST 877 340 19 1.3757819 SST 884 364 8 0.1834020 SST 895 364 7 3.47556
Mean 357 Coefficient of variation (%) 4.60 LSDt(0,05) 10.20
Environment means and scores for falling number (s)
Entry Environment Falling number Rank Score1 Hartwater 317 4 0.839682 Hopetown 311 5 -2.855983 Modderrivier 397 1 -2.152304 Prieska 377 3 6.541535 Vaalharts 382 2 -2.37294
Mean 357 Coefficient of variation (%) 4.60 LSDt(0,05) 5.10
37
38
DuziKrokodil
PAN 3400
PAN 3471
PAN 3497PAN 3515
PAN 3623
Sabie
SST 806
SST 8125SST 8135
SST 8154SST 8155
SST 835SST 843
SST 866SST 875
SST 877
SST 884
SST 895
Hartswater
HopetownModderrivier
Prieska
Vaalharts
Cooler Central Irrigation Area - earlier planting 2016
falling number (s)
IPCA 1 sc
ore
6,00
310 411357-6,00
8,00
0,00
-2,00
-4,00
4,00
2,00
39
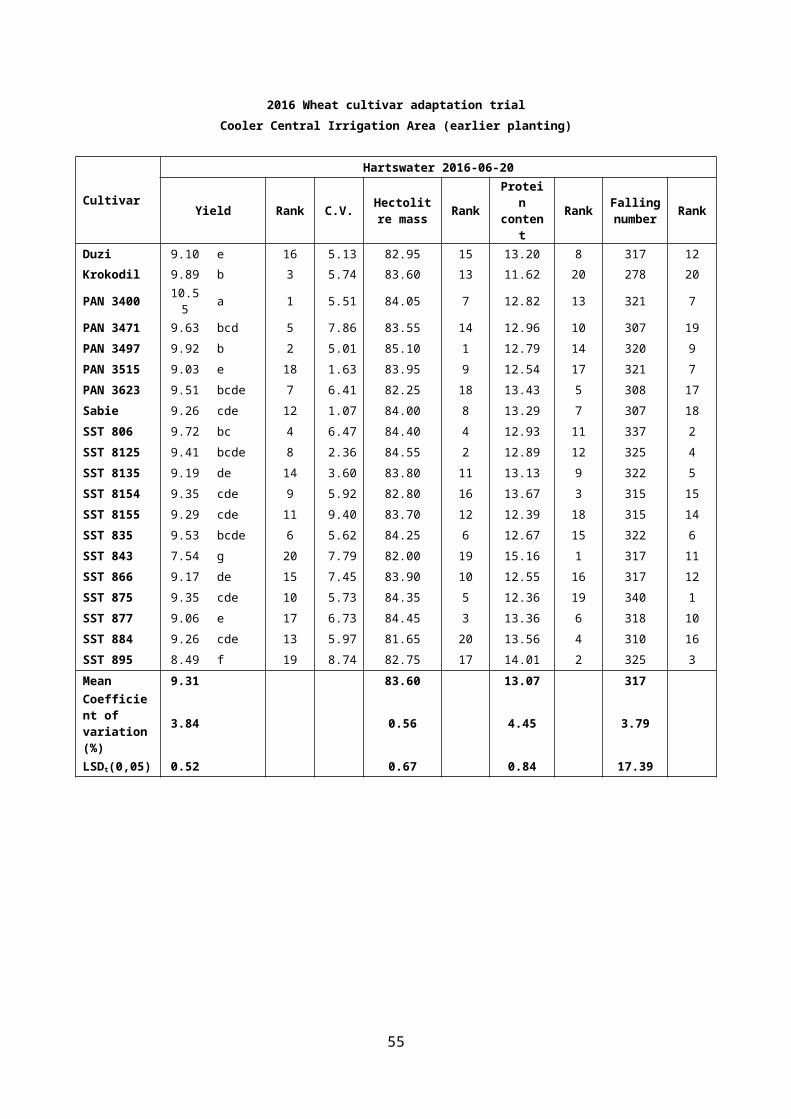
2016 Wheat cultivar adaptation trialCooler Central Irrigation Area (earlier planting)
CultivarHartswater 2016-06-20
Yield Rank C.V. Hectolitre mass Rank Protein
content Rank Falling number Rank
Duzi 9.10 e 16 5.13 82.95 15 13.20 8 317 12
Krokodil 9.89 b 3 5.74 83.60 13 11.62 20 278 20
PAN 3400 10.55 a 1 5.51 84.05 7 12.82 13 321 7
PAN 3471 9.63 bcd 5 7.86 83.55 14 12.96 10 307 19
PAN 3497 9.92 b 2 5.01 85.10 1 12.79 14 320 9
PAN 3515 9.03 e 18 1.63 83.95 9 12.54 17 321 7
PAN 3623 9.51 bcde 7 6.41 82.25 18 13.43 5 308 17
Sabie 9.26 cde 12 1.07 84.00 8 13.29 7 307 18
SST 806 9.72 bc 4 6.47 84.40 4 12.93 11 337 2
SST 8125 9.41 bcde 8 2.36 84.55 2 12.89 12 325 4
SST 8135 9.19 de 14 3.60 83.80 11 13.13 9 322 5
SST 8154 9.35 cde 9 5.92 82.80 16 13.67 3 315 15
SST 8155 9.29 cde 11 9.40 83.70 12 12.39 18 315 14
SST 835 9.53 bcde 6 5.62 84.25 6 12.67 15 322 6
SST 843 7.54 g 20 7.79 82.00 19 15.16 1 317 11
SST 866 9.17 de 15 7.45 83.90 10 12.55 16 317 12
SST 875 9.35 cde 10 5.73 84.35 5 12.36 19 340 1
SST 877 9.06 e 17 6.73 84.45 3 13.36 6 318 10
SST 884 9.26 cde 13 5.97 81.65 20 13.56 4 310 16
SST 895 8.49 f 19 8.74 82.75 17 14.01 2 325 3
Mean 9.31 83.60 13.07 317 Coefficient of variation (%)
3.84 0.56 4.45 3.79
LSDt(0,05) 0.52 0.67 0.84 17.39
40
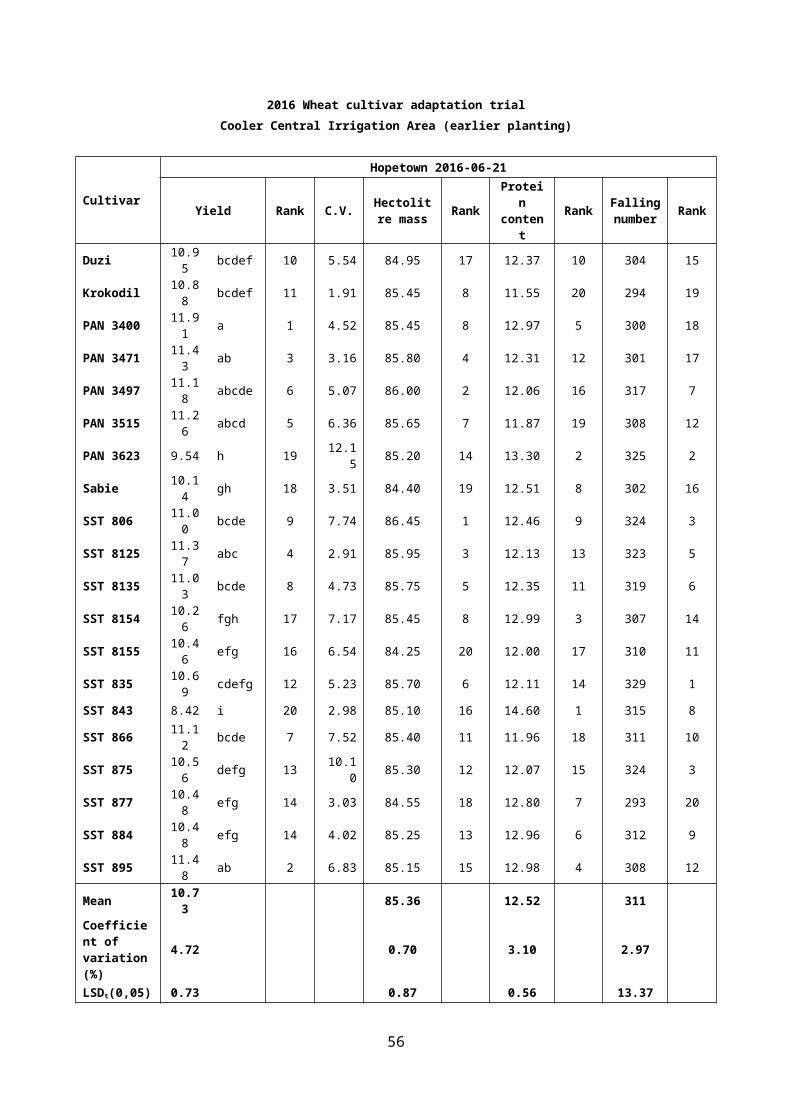
2016 Wheat cultivar adaptation trialCooler Central Irrigation Area (earlier planting)
CultivarHopetown 2016-06-21
Yield Rank C.V. Hectolitre mass Rank Protein
content Rank Falling number Rank
Duzi 10.95 bcdef 10 5.54 84.95 17 12.37 10 304 15
Krokodil 10.88 bcdef 11 1.91 85.45 8 11.55 20 294 19
PAN 3400 11.91 a 1 4.52 85.45 8 12.97 5 300 18
PAN 3471 11.43 ab 3 3.16 85.80 4 12.31 12 301 17
PAN 3497 11.18 abcde 6 5.07 86.00 2 12.06 16 317 7
PAN 3515 11.26 abcd 5 6.36 85.65 7 11.87 19 308 12
PAN 3623 9.54 h 19 12.15 85.20 14 13.30 2 325 2
Sabie 10.14 gh 18 3.51 84.40 19 12.51 8 302 16
SST 806 11.00 bcde 9 7.74 86.45 1 12.46 9 324 3
SST 8125 11.37 abc 4 2.91 85.95 3 12.13 13 323 5
SST 8135 11.03 bcde 8 4.73 85.75 5 12.35 11 319 6
SST 8154 10.26 fgh 17 7.17 85.45 8 12.99 3 307 14
SST 8155 10.46 efg 16 6.54 84.25 20 12.00 17 310 11
SST 835 10.69 cdefg 12 5.23 85.70 6 12.11 14 329 1
SST 843 8.42 i 20 2.98 85.10 16 14.60 1 315 8
SST 866 11.12 bcde 7 7.52 85.40 11 11.96 18 311 10
SST 875 10.56 defg 13 10.10 85.30 12 12.07 15 324 3
SST 877 10.48 efg 14 3.03 84.55 18 12.80 7 293 20
SST 884 10.48 efg 14 4.02 85.25 13 12.96 6 312 9
SST 895 11.48 ab 2 6.83 85.15 15 12.98 4 308 12
Mean 10.73 85.36 12.52 311 Coefficient of variation (%)
4.72 0.70 3.10 2.97
LSDt(0,05) 0.73 0.87 0.56 13.37
41

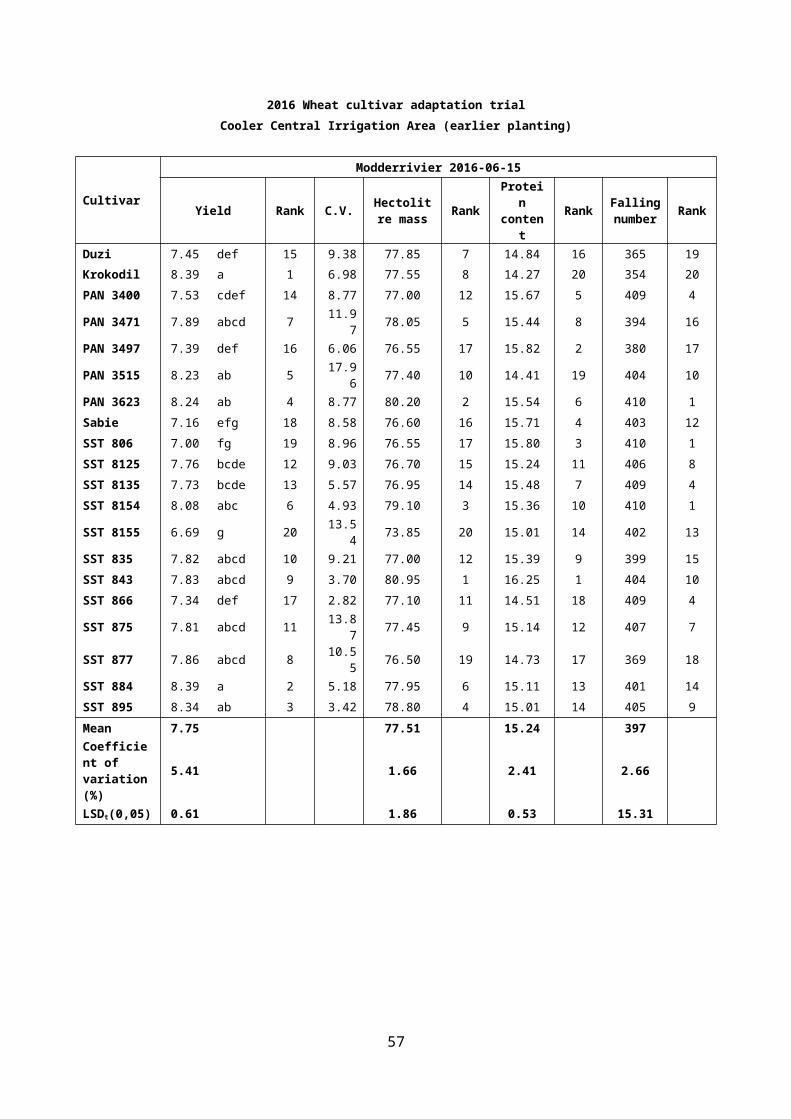
2016 Wheat cultivar adaptation trialCooler Central Irrigation Area (earlier planting)
CultivarModderrivier 2016-06-15
Yield Rank C.V. Hectolitre mass Rank Protein
content Rank Falling number Rank
Duzi 7.45 def 15 9.38 77.85 7 14.84 16 365 19
Krokodil 8.39 a 1 6.98 77.55 8 14.27 20 354 20
PAN 3400 7.53 cdef 14 8.77 77.00 12 15.67 5 409 4
PAN 3471 7.89 abcd 7 11.97 78.05 5 15.44 8 394 16
PAN 3497 7.39 def 16 6.06 76.55 17 15.82 2 380 17
PAN 3515 8.23 ab 5 17.96 77.40 10 14.41 19 404 10
PAN 3623 8.24 ab 4 8.77 80.20 2 15.54 6 410 1
Sabie 7.16 efg 18 8.58 76.60 16 15.71 4 403 12
SST 806 7.00 fg 19 8.96 76.55 17 15.80 3 410 1
SST 8125 7.76 bcde 12 9.03 76.70 15 15.24 11 406 8
SST 8135 7.73 bcde 13 5.57 76.95 14 15.48 7 409 4
SST 8154 8.08 abc 6 4.93 79.10 3 15.36 10 410 1
SST 8155 6.69 g 20 13.54 73.85 20 15.01 14 402 13
SST 835 7.82 abcd 10 9.21 77.00 12 15.39 9 399 15
SST 843 7.83 abcd 9 3.70 80.95 1 16.25 1 404 10
SST 866 7.34 def 17 2.82 77.10 11 14.51 18 409 4
SST 875 7.81 abcd 11 13.87 77.45 9 15.14 12 407 7
SST 877 7.86 abcd 8 10.55 76.50 19 14.73 17 369 18
SST 884 8.39 a 2 5.18 77.95 6 15.11 13 401 14
SST 895 8.34 ab 3 3.42 78.80 4 15.01 14 405 9
Mean 7.75 77.51 15.24 397 Coefficient of variation (%)
5.41 1.66 2.41 2.66
LSDt(0,05) 0.61 1.86 0.53 15.31
42

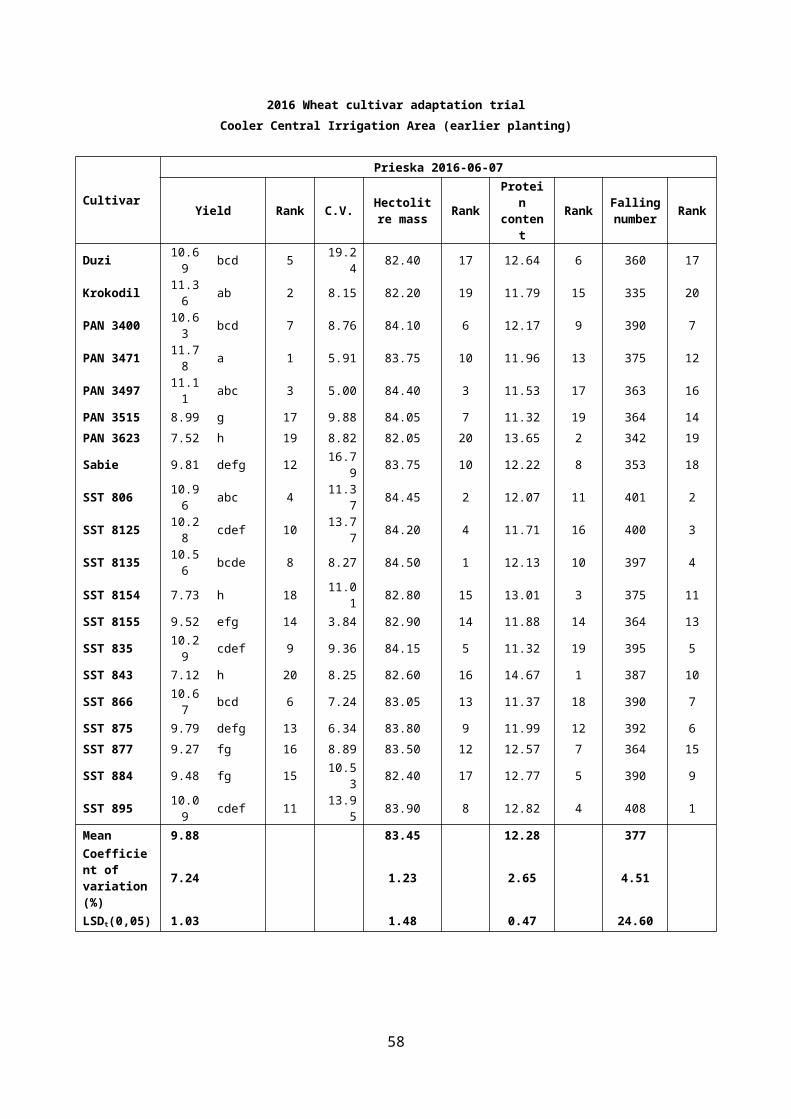
2016 Wheat cultivar adaptation trialCooler Central Irrigation Area (earlier planting)
CultivarPrieska 2016-06-07
Yield Rank C.V. Hectolitre mass Rank Protein
content Rank Falling number Rank
Duzi 10.69 bcd 5 19.24 82.40 17 12.64 6 360 17
Krokodil 11.36 ab 2 8.15 82.20 19 11.79 15 335 20
PAN 3400 10.63 bcd 7 8.76 84.10 6 12.17 9 390 7
PAN 3471 11.78 a 1 5.91 83.75 10 11.96 13 375 12
PAN 3497 11.11 abc 3 5.00 84.40 3 11.53 17 363 16
PAN 3515 8.99 g 17 9.88 84.05 7 11.32 19 364 14
PAN 3623 7.52 h 19 8.82 82.05 20 13.65 2 342 19
Sabie 9.81 defg 12 16.79 83.75 10 12.22 8 353 18
SST 806 10.96 abc 4 11.37 84.45 2 12.07 11 401 2
SST 8125 10.28 cdef 10 13.77 84.20 4 11.71 16 400 3
SST 8135 10.56 bcde 8 8.27 84.50 1 12.13 10 397 4
SST 8154 7.73 h 18 11.01 82.80 15 13.01 3 375 11
SST 8155 9.52 efg 14 3.84 82.90 14 11.88 14 364 13
SST 835 10.29 cdef 9 9.36 84.15 5 11.32 19 395 5
SST 843 7.12 h 20 8.25 82.60 16 14.67 1 387 10
SST 866 10.67 bcd 6 7.24 83.05 13 11.37 18 390 7
SST 875 9.79 defg 13 6.34 83.80 9 11.99 12 392 6
SST 877 9.27 fg 16 8.89 83.50 12 12.57 7 364 15
SST 884 9.48 fg 15 10.53 82.40 17 12.77 5 390 9
SST 895 10.09 cdef 11 13.95 83.90 8 12.82 4 408 1
Mean 9.88 83.45 12.28 377 Coefficient of variation (%)
7.24 1.23 2.65 4.51
LSDt(0,05) 1.03 1.48 0.47 24.60
43

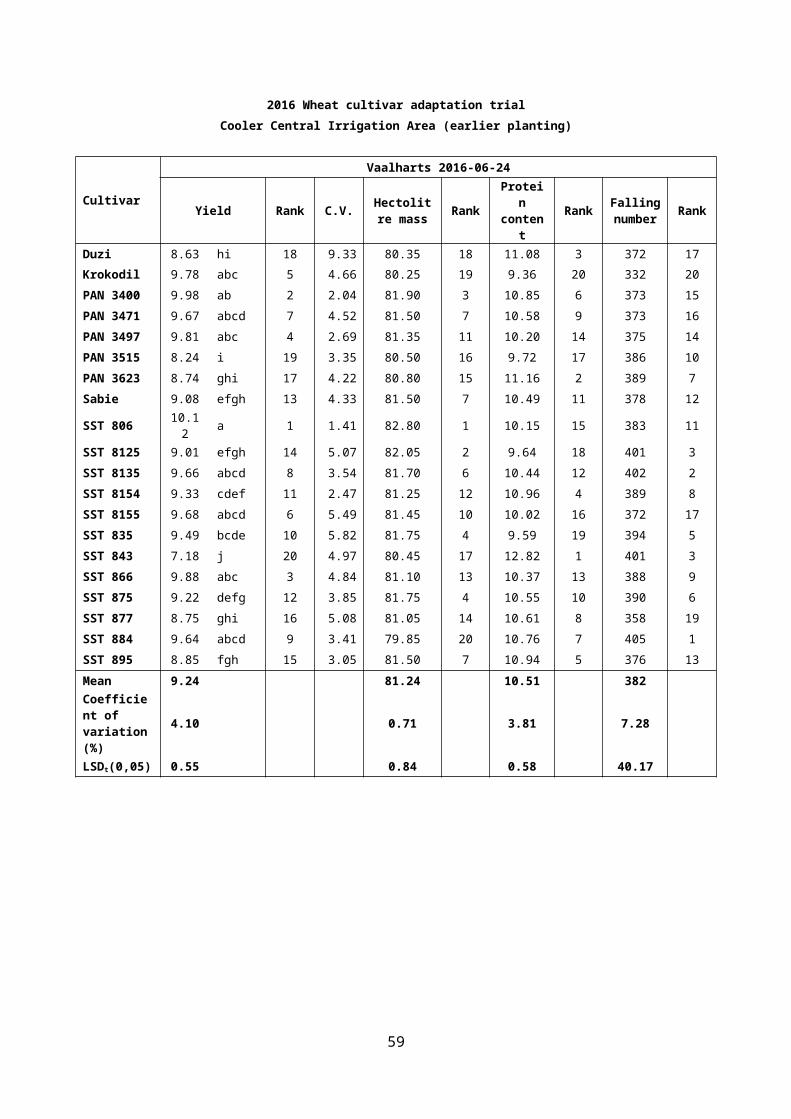
2016 Wheat cultivar adaptation trialCooler Central Irrigation Area (earlier planting)
CultivarVaalharts 2016-06-24
Yield Rank C.V. Hectolitre mass Rank Protein
content Rank Falling number Rank
Duzi 8.63 hi 18 9.33 80.35 18 11.08 3 372 17
Krokodil 9.78 abc 5 4.66 80.25 19 9.36 20 332 20
PAN 3400 9.98 ab 2 2.04 81.90 3 10.85 6 373 15
PAN 3471 9.67 abcd 7 4.52 81.50 7 10.58 9 373 16
PAN 3497 9.81 abc 4 2.69 81.35 11 10.20 14 375 14
PAN 3515 8.24 i 19 3.35 80.50 16 9.72 17 386 10
PAN 3623 8.74 ghi 17 4.22 80.80 15 11.16 2 389 7
Sabie 9.08 efgh 13 4.33 81.50 7 10.49 11 378 12
SST 806 10.12 a 1 1.41 82.80 1 10.15 15 383 11
SST 8125 9.01 efgh 14 5.07 82.05 2 9.64 18 401 3
SST 8135 9.66 abcd 8 3.54 81.70 6 10.44 12 402 2
SST 8154 9.33 cdef 11 2.47 81.25 12 10.96 4 389 8
SST 8155 9.68 abcd 6 5.49 81.45 10 10.02 16 372 17
SST 835 9.49 bcde 10 5.82 81.75 4 9.59 19 394 5
SST 843 7.18 j 20 4.97 80.45 17 12.82 1 401 3
SST 866 9.88 abc 3 4.84 81.10 13 10.37 13 388 9
SST 875 9.22 defg 12 3.85 81.75 4 10.55 10 390 6
SST 877 8.75 ghi 16 5.08 81.05 14 10.61 8 358 19
SST 884 9.64 abcd 9 3.41 79.85 20 10.76 7 405 1
SST 895 8.85 fgh 15 3.05 81.50 7 10.94 5 376 13
Mean 9.24 81.24 10.51 382 Coefficient of variation (%)
4.10 0.71 3.81 7.28
LSDt(0,05) 0.55 0.84 0.58 40.17
44
Cooler Central Irrigation Area (later planting)Average yield (ton/ha) of entries during the full or partial period from 2013 - 2016
Cultivar 2016 R 2015 R 2014 R 2013 R4 year
average R3 year
average R2 year
average R2013-2016
2014-2016
2015-2016
Buffels 6.68 23 6.84 19 7.39 24
Duzi 9.58 3 7.52 20 7.25 18 7.48 19 7.95 13 8.11 15 8.55 15
Koedoes 9.25 3
Krokodil 9.51 4 8.74 10 8.30 6 8.47 5 8.76 4 8.85 5 9.13 7
PAN 3400 9.67 2 9.04 7 8.17 7 8.48 4 8.84 3 8.96 4 9.35 2
PAN 3471 9.47 5 8.80 9 8.04 11 8.15 11 8.62 6 8.77 7 9.14 6
PAN 3478 7.88 16
PAN 3489 8.07 10 8.10 12
PAN 3497 9.43 9 8.34 16 8.12 8 7.46 22 8.34 10 8.63 10 8.89 11
PAN 3515 9.39 11 8.30 17 7.57 15 8.42 12 8.84 12
PAN 3623 9.45 6 9.25 4 8.50 1 9.07 2 9.35 3
Renoster 9.45 1
Sabie 8.91 17 7.40 21 7.55 16 7.92 15 7.95 14 7.95 16 8.16 18
SST 806 9.22 14 8.57 12 8.34 4 8.26 8 8.60 8 8.71 9 8.90 9
SST 8125 8.85 18 8.42 15 8.64 14
SST 8134 8.95 8
SST 8135 9.36 12 8.43 14 8.90 7
SST 8154 9.31 13
SST 8155 8.85 19
SST 822 7.47 21
SST 835 9.19 15 8.19 18 8.09 9 8.06 13 8.38 9 8.49 11 8.69 13
SST 843 8.49 20 8.43 13 7.52 17 7.70 18 8.03 12 8.15 14 8.46 16
SST 866 9.45 6 9.11 6 7.73 13 8.15 10 8.61 7 8.76 8 9.28 5
SST 867 6.74 22 7.65 14 7.86 17
SST 875 9.45 8 8.65 11 8.30 5 8.28 7 8.67 5 8.80 6 9.05 8
SST 876 8.24 9
SST 877 9.01 16 7.70 19 7.86 12 7.97 14 8.14 11 8.19 13 8.36 17
SST 884 9.42 10 9.15 5 8.37 3 8.81 1 8.94 2 8.98 3 9.29 4
SST 895 9.69 1 9.25 2 8.44 2 8.65 2 9.01 1 9.13 1 9.47 1
SST 896 8.64 3
Tamboti 8.30 6
Timbavati 7.46 23
Umlazi 7.47 20
Mean 9.28 8.45 7.93 8.03 8.49 8.62 8.91 LSDt(0,05) 0.33 0.28 0.17 0.18 0.13 0.16 0.23
45

Cooler Central Irrigation Area (later planting) AMMI AnalysisAnova of the yield of entries for 2016
Source Df SS MS F-Value Pr> FTotal 719 1436.2 2.00Treatments 179 1157.7 6.47 13.43 <0,001Genotypes 19 67.2 3.54 7.34 <0,001Environments 8 932.2 116.53 100.16 <0,001Block 27 31.4 1.16 2.41 <0,001Interactions 152 158.3 1.04 2.16 <0,001IPCA 26 54.0 2.08 4.31 <0,001IPCA 24 30.9 1.29 2.67 <0,001Residuals 102 73.3 0.72 1.49 0.0029Error 513 247.1 0.48
Genotype means and scores for yield (ton/ha)
Entry Genotype Yield Rank Score1 Duzi 9.58 3 -0.005912 Krokodil 9.51 4 0.606263 PAN 3400 9.67 2 0.125554 PAN 3471 9.47 5 0.411465 PAN 3497 9.43 9 0.400726 PAN 3515 9.39 11 0.104327 PAN 3623 9.45 6 -0.844808 Sabie 8.91 17 0.911129 SST 806 9.22 14 0.01290
10 SST 8125 8.85 18 0.1324811 SST 8135 9.36 12 -0.1816312 SST 8154 9.31 13 -0.6594613 SST 8155 8.85 19 0.2565314 SST 835 9.19 15 -0.1247215 SST 843 8.49 20 -0.5594816 SST 866 9.45 6 0.1141717 SST 875 9.45 8 0.2668518 SST 877 9.01 16 -0.0502419 SST 884 9.42 10 -0.3591020 SST 895 9.69 1 -0.55702
Mean 9.28 Coefficient of variation (%) 7.70 LSDt(0,05) 0.33
Environment means and scores for yield (ton/ha)
Entry Environment Yield Rank Score1 Barkley-West 9.72 4 0.468522 Douglas 8.06 8 1.213323 Hopetown 10.11 3 -0.501474 Modderrivier 11.12 1 -0.242715 Prieska 10.55 2 0.501726 Rama 1 8.25 6 -0.904357 Rama 2 9.65 5 -0.686698 Upington 7.90 9 -0.168349 Vaalharts 8.19 7 0.32000
Mean 9.28 Coefficient of variation (%) 7.70 LSDt(0,05) 0.22
46
Duzi
Krokodil
PAN 3400
PAN 3471PAN 3497
PAN 3515
PAN 3623
Sabie
SST 806SST 8125
SST 8135
SST 8154
SST 8155
SST 835
SST 843
SST 866SST 875
SST 877
SST 884
SST 895
Barkley-West
Douglas
Hopetown
Modderrivier
Prieska
Rama 1
Rama 2
Upington
Vaalharts
Cooler Central Irrigation Area - later planting 2016
Grain yield (ton/ha)
IPCA 1 sc
ore
0.50
7,85 11,709,28-1.50
1.00
0.00
-0.50
-1.00
1.50
47
Cooler Central Irrigation Area (later planting)Average hectolitre mass (kg/hl) of entries during the full or partial period from 2013 - 2016
Cultivar 2016 R 2015 R 2014 R 2013 R4 year
average R3 year
average R2 year
average R2013-2016
2014-2016
2015-2016
Buffels 79.88 22 79.69 16 77.54 20
Duzi 82.46 15 80.88 20 79.66 17 77.63 19 80.16 13 81.00 15 81.67 16
Koedoes 82.66 4
Krokodil 82.66 11 82.71 3 80.72 10 78.24 10 81.08 5 82.03 6 82.69 4
PAN 3400 82.49 13 82.17 8 80.94 6 78.74 6 81.09 4 81.87 8 82.33 9
PAN 3471 83.23 5 82.65 5 81.17 4 78.97 2 81.51 2 82.35 2 82.94 3
PAN 3478 78.76 5
PAN 3489 81.63 2 79.52 1
PAN 3497 83.03 7 81.87 10 81.78 1 78.74 6 81.36 3 82.23 4 82.45 8
PAN 3515 82.79 10 81.34 16 80.52 13 81.55 12 82.07 12
PAN 3623 83.41 3 83.02 2 80.59 12 82.34 3 83.22 2
Renoster 80.96 19
Sabie 81.87 19 81.37 15 79.91 15 77.72 17 80.22 11 81.05 14 81.62 17
SST 806 83.02 8 82.21 7 81.13 5 77.85 16 81.05 6 82.12 5 82.62 6
SST 8125 82.47 14 81.31 17 81.89 15
SST 8134 80.99 18
SST 8135 82.81 9 81.52 13 82.17 10
SST 8154 83.63 1
SST 8155 81.47 20
SST 822 78.17 11
SST 835 83.14 6 81.38 14 80.77 9 78.44 8 80.93 8 81.76 9 82.26 10
SST 843 83.61 2 83.87 1 81.51 3 78.90 4 81.97 1 83.00 1 83.74 1
SST 866 82.63 12 82.30 6 80.21 14 78.08 13 80.81 9 81.71 10 82.47 7
SST 867 80.50 21 80.87 7 77.97 14
SST 875 82.41 16 81.67 12 80.85 8 77.94 15 80.72 10 81.64 11 82.04 14
SST 876 78.92 3
SST 877 82.16 18 79.76 23 79.09 19 77.69 18 79.68 14 80.34 16 80.96 18
SST 884 82.36 17 81.73 11 79.21 18 77.43 22 80.18 12 81.10 13 82.05 13
SST 895 83.25 4 81.98 9 80.64 11 78.12 12 81.00 7 81.96 7 82.62 5
SST 896 77.34 23
Tamboti 78.33 9
Timbavati 76.84 24
Umlazi 77.46 21
Mean 82.75 81.68 80.57 78.14 80.84 81.75 82.32 LSDt(0,05) 0.54 0.54 0.44 0.64 0.31 0.30 0.39
48
Cooler Central Irrigation Area (later planting) AMMI AnalysisAnova of the hectolitre mass of entries for 2016
Source Df SS MS F-Value Pr> FTotal 719 1827.8 2.542Treatments 179 1087.7 6.077 5.06 <0,001Genotypes 19 217.0 11.421 9.51 <0,001Environments 8 394.3 49.283 10.74 <0,001Block 27 123.9 4.587 3.82 <0,001Interactions 152 476.4 3.134 2.61 <0,001IPCA 26 176.8 6.800 5.66 <0,001IPCA 24 115.8 4.826 4.02 <0,001Residuals 102 183.8 1.802 1.50 0.0026Error 513 616.3 1.201
Genotype means and scores for hectolitre mass (kg/hl)
Entry Genotype Hectolitre mass Rank Score1 Duzi 82.46 15 0.740032 Krokodil 82.66 11 -0.099673 PAN 3400 82.49 13 0.097094 PAN 3471 83.23 5 -0.208505 PAN 3497 83.03 7 0.160086 PAN 3515 82.79 10 0.232687 PAN 3623 83.41 3 -0.669768 Sabie 81.87 19 1.757719 SST 806 83.02 8 0.26069
10 SST 8125 82.47 14 -0.0445411 SST 8135 82.81 9 0.1248712 SST 8154 83.63 1 -0.4915513 SST 8155 81.47 20 0.1378014 SST 835 83.14 6 -0.0317315 SST 843 83.61 2 -1.0726316 SST 866 82.63 12 -0.1614017 SST 875 82.41 16 0.0621218 SST 877 82.16 18 0.4080519 SST 884 82.36 17 -0.6472820 SST 895 83.25 4 -0.55405
Mean 82.75 Coefficient of variation (%) 1.40 LSDt(0,05) 0.54
Environment means and scores for hectolitre mass (kg/hl)
Entry Environment Hectolitre mass Rank Score1 Barkley-West 83.10 3 0.408752 Douglas 82.76 5 0.413263 Hopetown 82.46 7 0.338814 Modderrivier 83.12 2 1.173015 Prieska 84.20 1 1.169226 Rama 1 83.00 4 0.202897 Rama 2 82.76 5 1.267538 Upington 81.69 8 0.611189 Vaalharts 81.62 9 1.19641
Mean 82.75 Coefficient of variation (%) 1.40 LSDt(0,05) 0.36
49

Duzi
KrokodilPAN 3400
PAN 3471
PAN 3497PAN 3515
PAN 3623
Sabie
SST 806
SST 8125SST 8135
SST 8154
SST 8155SST 835
SST 843
SST 866
SST 875
SST 877
SST 884SST 895
Barkley-WestDouglasHopetown
Modderrivier Prieska
Rama 1
Rama 2
Upington
Vaalharts
Cooler Central Irrigation Area - later planting 2016
Hectolitre mass (kg/hl)
IPCA 1 sc
ore
0.50
81,40 84,5082,75-1.50
1.00
0.00
-0.50
-1.00
1.50 -2.00
2.00
50

Cooler Central Irrigation Area (later planting)Average protein content (%) of entries during the full or partial period from 2013 - 2016
Cultivar 2016 R 2015 R 2014 R 2013 R4 year
average R3 year
average R2 year
average R2013-2016
2014-2016
2015-2016
Buffels 13.21 13 13.14 6 11.96 9
Duzi 12.40 3 13.17 15 13.10 8 12.10 4 12.69 3 12.89 6 12.79 5
Koedoes 13.49 5
Krokodil 11.44 20 11.75 23 12.21 19 11.38 24 11.70 14 11.80 16 11.60 18
PAN 3400 12.27 7 13.27 11 13.18 4 11.89 11 12.65 5 12.91 5 12.77 6
PAN 3471 11.95 15 13.06 18 12.95 14 11.69 20 12.41 11 12.65 12 12.51 14
PAN 3478 12.10 4
PAN 3489 13.04 12 11.75 17
PAN 3497 12.09 11 13.19 14 13.06 9 11.78 15 12.53 7 12.78 8 12.64 11
PAN 3515 11.69 19 12.79 21 12.71 17 12.40 15 12.24 17
PAN 3623 12.95 2 13.71 2 13.29 2 13.32 2 13.33 2
Renoster 12.80 20
Sabie 12.38 4 13.52 4 13.06 9 11.81 14 12.69 3 12.99 4 12.95 3
SST 806 12.02 14 13.34 9 13.26 3 11.70 19 12.58 6 12.87 7 12.68 9
SST 8125 12.13 10 13.13 16 12.63 12
SST 8134 13.39 7
SST 8135 12.14 9 13.35 8 12.75 6
SST 8154 12.28 6
SST 8155 11.90 16
SST 822 12.25 2
SST 835 12.03 13 13.30 10 12.99 13 11.58 23 12.48 10 12.77 9 12.67 10
SST 843 13.65 1 14.40 1 14.56 1 13.44 1 14.01 1 14.20 1 14.03 1
SST 866 11.70 18 12.79 21 12.88 15 11.69 20 12.27 12 12.46 13 12.25 16
SST 867 13.62 3 13.06 9 11.84 13
SST 875 11.73 17 12.93 19 12.54 18 11.64 22 12.21 13 12.40 14 12.33 15
SST 876 11.97 8
SST 877 12.08 12 13.09 17 13.13 7 11.75 17 12.51 8 12.77 10 12.59 13
SST 884 12.15 8 13.25 12 12.81 16 11.77 16 12.50 9 12.74 11 12.70 8
SST 895 12.37 5 13.44 6 13.18 4 12.07 7 12.77 2 13.00 3 12.91 4
SST 896 12.14 3
Tamboti 11.93 10
Timbavati 12.09 6
Umlazi 11.87 12
Mean 12.17 13.22 13.06 11.92 12.57 12.81 12.68 LSDt(0,05) 0.30 0.30 0.27 0.30 0.15 0.17 0.22
51
Cooler Central Irrigation Area (later planting) AMMI AnalysisAnova of the protein content of entries for 2016
Source Df SS MS F-Value Pr> FTotal 719 1290.2 1.79Treatments 179 1062.1 5.93 18.13 <0,001Genotypes 19 155.2 8.17 24.96 <0,001Environments 8 843.9 105.49 47.34 <0,001Block 27 60.2 2.23 6.81 <0,001Interactions 152 63.0 0.41 1.27 0.0311IPCA 26 22.1 0.85 2.60 <0,001IPCA 24 13.8 0.57 1.75 0.0154Residuals 102 27.1 0.27 0.81 0.9024Error 513 167.9 0.33
Genotype means and scores for protein content (%)
Entry Genotype Protein content Rank Score
1 Duzi 12.40 3 0.389172 Krokodil 11.44 20 -0.505733 PAN 3400 12.27 7 0.093714 PAN 3471 11.95 15 0.095645 PAN 3497 12.09 11 0.487996 PAN 3515 11.69 19 0.392897 PAN 3623 12.95 2 -0.116078 Sabie 12.38 4 0.423969 SST 806 12.02 14 0.25752
10 SST 8125 12.13 10 0.4449711 SST 8135 12.14 9 0.0117512 SST 8154 12.28 6 -0.1438213 SST 8155 11.90 16 0.2009314 SST 835 12.03 13 -0.1794015 SST 843 13.65 1 -0.8041916 SST 866 11.70 18 -0.3977417 SST 875 11.73 17 -0.1046018 SST 877 12.08 12 0.0283119 SST 884 12.15 8 -0.2720520 SST 895 12.37 5 -0.30325
Mean 12.17 Coefficient of variation (%) 5.30 LSDt(0,05) 0.30
Environment means and scores for protein content (%)
Entry Environment Protein content Rank Score
1 Barkley-West 12.63 3 -0.353012 Douglas 14.14 1 -0.824403 Hopetown 12.25 5 0.227914 Modderrivier 12.04 6 0.004615 Prieska 10.59 8 -0.592926 Rama 1 11.82 7 -0.212487 Rama 2 12.28 4 0.738168 Upington 13.23 2 0.362539 Vaalharts 10.53 9 0.64960
Mean 12.17 Coefficient of variation (%) 5.30 LSDt(0,05) 0.20
52

Duzi
Krokodil
PAN 3400PAN 3471
PAN 3497PAN 3515
PAN 3623
Sabie
SST 806
SST 8125
SST 8135
SST 8154
SST 8155
SST 835
SST 843
SST 866
SST 875
SST 877
SST 884SST 895Barkley-West
Douglas
Hopetown
Modderrivier
Prieska
Rama 1
Rama 2
Upington
Vaalharts
Cooler Central Irrigation Area - later planting 2016
Protein content (%)
IPCA 1 sc
ore
0,20
10,48 14,6012,17
-0,40
1,00
0.00
-0,20
-1,00
0,60
-0,40
0,80
-0,60
-0,80
11,00 12,00
53
Cooler Central Irrigation Area (later planting)Average falling number (s) of entries during the full or partial period from 2013 - 2016
Cultivar 2016 R 2015 R 2014 R 2013 R4 year
average R3 year
average R2 year
average R2013-2016
2014-2016
2015-2016
Buffels 342 21 379 12 372 14
Duzi 354 16 343 18 374 15 368 16 360 12 357 13 349 15
Koedoes 350 12
Krokodil 329 20 335 23 349 19 333 24 336 14 338 16 332 18
PAN 3400 351 17 347 15 380 10 374 9 363 9 359 11 349 14
PAN 3471 358 13 363 5 380 11 374 10 368 8 367 7 360 8
PAN 3478 381 2
PAN 3489 366 17 376 4
PAN 3497 358 13 346 16 375 14 362 20 360 11 359 10 352 13
PAN 3515 348 18 343 19 378 13 356 14 345 16
PAN 3623 363 7 372 1 356 18 364 9 368 2
Renoster 348 13
Sabie 356 15 348 13 372 16 367 18 361 10 359 12 352 12
SST 806 373 2 352 11 388 3 373 13 371 2 371 3 362 6
SST 8125 375 1 364 4 370 1
SST 8134 369 2
SST 8135 362 10 353 10 358 8
SST 8154 359 12
SST 8155 363 8
SST 822 347 23
SST 835 371 3 354 9 384 8 374 8 371 4 370 4 362 5
SST 843 367 5 365 3 386 5 375 7 373 1 373 1 366 3
SST 866 361 11 359 7 385 7 373 11 369 6 368 6 360 9
SST 867 339 22 387 4 355 22
SST 875 369 4 357 8 389 1 370 15 371 3 372 2 363 4
SST 876 380 3
SST 877 339 19 344 17 381 9 359 21 355 13 354 15 341 17
SST 884 363 9 359 6 385 6 376 4 371 5 369 5 361 7
SST 895 364 6 342 20 389 2 383 1 369 7 365 8 353 11
SST 896 375 6
Tamboti 367 17
Timbavati 363 19
Umlazi 373 12
Mean 359 352 378 369 364 362 356 LSDt(0,05) 7.30 13.45 8.17 9.18 4.50 5.20 6.80
54
Cooler Central Irrigation Area (later planting) AMMI AnalysisAnova of the falling number of entries for 2016
Source Df SS MS F-Value Pr> FTotal 719 1150709 1600Treatments 179 1014961 5670 24.08 <0,001Genotypes 19 87122 4585 19.48 <0,001Environments 8 853158 106645 192.28 <0,001Block 27 14975 555 2.36 <0,001Interactions 152 74681 491 2.09 <0,001IPCA 26 29503 1135 4.82 <0,001IPCA 24 21076 878 3.73 <0,001Residuals 102 24102 236 1.00 0.4768Error 513 120773 235
Genotype means and scores for falling number (s)
Entry Genotype Falling number Rank Score1 Duzi 354 16 -1.973832 Krokodil 329 20 -4.642423 PAN 3400 351 17 0.953484 PAN 3471 358 13 1.125675 PAN 3497 358 13 -0.356216 PAN 3515 348 18 -2.596277 PAN 3623 363 7 2.000128 Sabie 356 15 0.621779 SST 806 373 2 0.40613
10 SST 8125 375 1 0.1307111 SST 8135 362 10 2.0008712 SST 8154 359 12 0.2912013 SST 8155 363 8 0.9727414 SST 835 371 3 -0.0093115 SST 843 367 5 2.0276016 SST 866 361 11 2.3840517 SST 875 369 4 0.1058018 SST 877 339 19 -5.4700519 SST 884 363 9 1.0494620 SST 895 364 6 0.97848
Mean 359 Coefficient of variation (%) 4.40 LSDt(0,05) 7.30
Environment means and scores for falling number (s)
Entry Environment Falling number Rank Score1 Barkley-West 395 3 5.852712 Douglas 316 9 -4.864963 Hopetown 363 5 1.310324 Modderrivier 384 4 3.345985 Prieska 327 7 -0.227236 Rama 1 320 8 -2.538287 Rama 2 328 6 -2.882828 Upington 403 1 -0.345729 Vaalharts 397 2 0.34999
Mean 359 Coefficient of variation (%) 4.40 LSDt(0,05) 4.90
55
56
Duzi
Krokodil
PAN 3400PAN 3471
PAN 3497
PAN 3515
PAN 3623
Sabie SST 806SST 8125
SST 8135
SST 8154SST 8155
SST 835
SST 843SST 866
SST 875
SST 877
SST 884SST 895
Barkley-West
Douglas
Hopetown
Modderrivier
Prieska
Rama 1Rama 2
UpingtonVaalharts
Cooler Central Irrigation Area - later planting 2016
Falling number (s)
IPCA 1 sc
ore
314 414359
-4,00
8,00
0.00
-2,00
4,00
2,00
6,00
-6,00
-8,00
57
2016 Wheat cultivar adaptation trialCooler Central Irrigation Area (later planting)
CultivarBarkly West 2016-07-05
Yield Rank C.V. Hectolitre mass Rank Protein
content Rank Falling number Rank
Duzi 10.05 abcd 7 1.12 82.45 17 12.77 6 377 17
Krokodil 9.36 bcd 16 9.21 83.50 4 11.98 18 344 20
PAN 3400 10.47 a 1 4.94 82.85 14 12.78 5 410 1
PAN 3471 10.16 abc 5 7.06 83.50 4 12.26 16 405 12
PAN 3497 10.05 abcd 6 13.25 83.05 12 12.43 13 388 16
PAN 3515 9.88 abcd 8 2.56 82.85 14 11.98 18 350 18
PAN 3623 10.33 ab 3 2.91 83.40 8 13.57 2 397 13
Sabie 10.43 a 2 3.44 83.45 7 12.44 12 393 14
SST 806 9.86 abcd 9 1.95 82.60 16 12.63 10 410 1
SST 8125 9.32 bcd 17 8.51 82.20 18 12.64 9 409 8
SST 8135 9.58 abcd 13 9.87 83.50 4 12.31 14 409 10
SST 8154 9.50 abcd 14 17.56 84.20 2 12.98 4 393 15
SST 8155 9.20 cd 18 4.93 82.00 19 12.22 17 410 1
SST 835 9.78 abcd 11 5.26 83.65 3 12.68 7 409 8
SST 843 8.09 e 20 11.85 84.30 1 14.33 1 410 1
SST 866 9.49 abcd 15 10.86 83.20 11 12.55 11 410 1
SST 875 10.19 abc 4 1.76 83.30 9 11.97 20 410 1
SST 877 9.73 abcd 12 5.50 83.25 10 12.27 15 345 19
SST 884 9.82 abcd 10 4.78 81.65 20 12.68 7 410 1
SST 895 9.13 d 19 11.04 83.00 13 13.03 3 408 11
Mean 9.72 83.10 12.63 395 Coefficient of variation (%)
7.33 0.83 2.99 3.34
LSDt(0,05) 1.03 1.00 0.55 19.07
58
2016 Wheat cultivar adaptation trialCooler Central Irrigation Area (later planting)
CultivarDouglas 2016-06-30
Yield Rank C.V. Hectolitre mass Rank Protein
content Rank Falling number Rank
Duzi 8.39 bcde 9 19.86 82.50 13 13.96 13 321 8
Krokodil 8.65 abc 4 8.41 82.05 18 14.32 7 311 12
PAN 3400 8.55 abcd 5 7.79 82.40 14 14.18 8 311 14
PAN 3471 8.86 abc 3 7.70 82.70 12 13.78 15 309 17
PAN 3497 9.04 ab 2 12.11 83.50 4 13.39 19 313 11
PAN 3515 9.11 a 1 11.61 83.40 6 13.03 20 303 20
PAN 3623 6.57 h 20 4.39 82.35 15 15.30 2 306 18
Sabie 8.42 abcde 7 8.28 82.10 17 14.11 10 311 12
SST 806 7.91 def 13 5.77 83.85 1 13.78 15 323 4
SST 8125 7.92 def 12 2.90 83.40 6 13.70 18 329 1
SST 8135 7.88 def 14 6.26 83.30 8 14.34 6 309 16
SST 8154 7.31 fg 18 7.61 81.65 19 14.41 5 319 9
SST 8155 7.93 def 11 9.25 80.35 20 13.78 15 311 15
SST 835 7.77 ef 15 10.43 83.60 2 14.18 8 325 3
SST 843 6.64 gh 19 3.39 82.95 10 15.58 1 305 19
SST 866 8.53 abcd 6 9.92 83.45 5 14.00 12 313 10
SST 875 8.40 abcde 8 14.10 83.00 9 13.80 14 323 4
SST 877 7.43 f 17 13.61 82.30 16 14.03 11 328 2
SST 884 7.72 ef 16 6.85 82.85 11 14.49 4 323 6
SST 895 8.18 cde 10 5.04 83.55 3 14.55 3 322 7
Mean 8.06 82.76 14.14 316 Coefficient of variation (%)
6.11 1.25 4.09 4.37
LSDt(0,05) 0.71 1.50 0.84 19.94
59
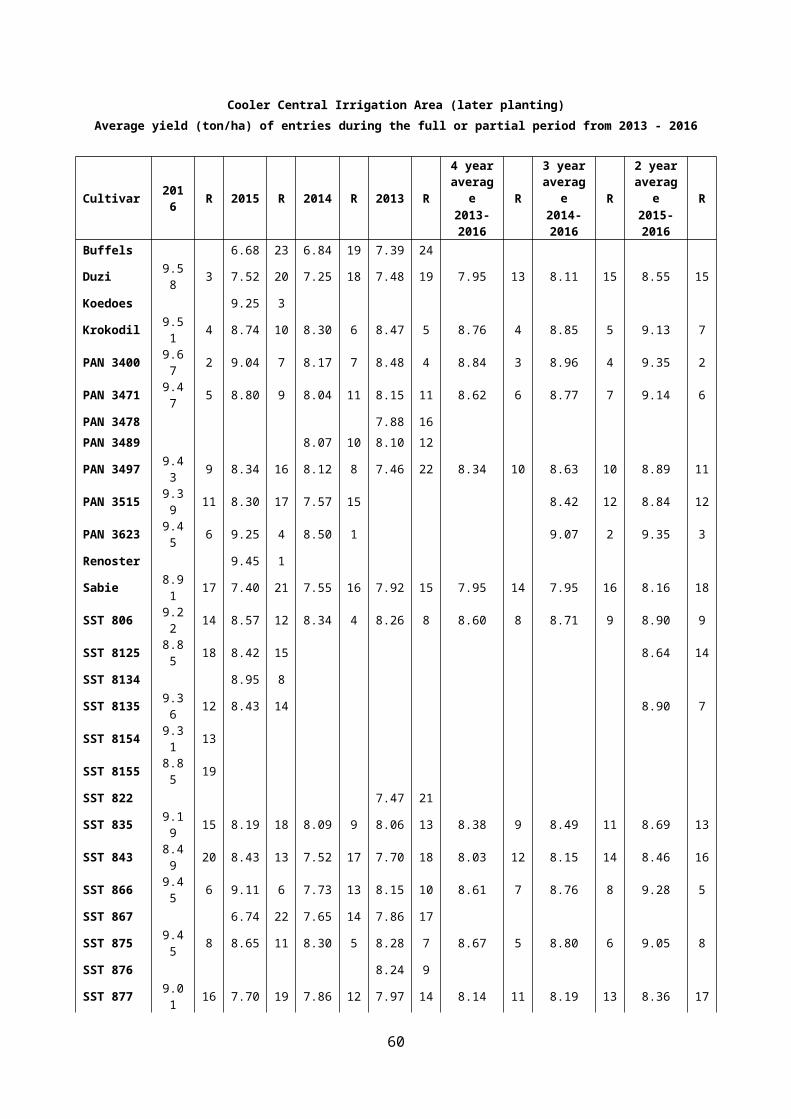
2016 Wheat cultivar adaptation trialCooler Central Irrigation Area (later planting)
CultivarHopetown 2016-07-22
Yield Rank C.V. Hectolitre mass Rank Protein
content Rank Falling number Rank
Duzi 10.22 abcde 9 10.62 83.40 4 12.73 3 338 18
Krokodil 11.07 ab 2 9.94 82.25 11 11.13 20 331 19
PAN 3400 10.06 bcde 11 15.78 81.20 18 12.02 15 319 20
PAN 3471 9.15 e 20 12.44 81.30 17 12.23 11 345 16
PAN 3497 9.65 cde 14 17.34 83.35 5 12.09 13 356 14
PAN 3515 10.58 abcd 5 8.22 82.30 10 11.82 17 354 15
PAN 3623 10.24 abcde 8 7.48 82.70 9 13.00 2 383 4
Sabie 9.36 de 19 12.82 80.80 19 12.15 12 367 9
SST 806 10.57 abcd 6 3.58 83.35 5 12.27 9 389 2
SST 8125 9.80 bcde 13 15.30 82.25 11 12.55 4 399 1
SST 8135 10.06 bcde 11 11.07 82.25 11 12.39 7 387 3
SST 8154 10.60 abcd 4 2.50 84.20 1 11.59 19 373 8
SST 8155 9.60 cde 17 6.56 81.35 16 12.06 14 359 13
SST 835 10.13 abcde 10 8.60 83.15 7 12.54 6 375 6
SST 843 9.62 cde 15 3.08 83.85 2 13.58 1 373 7
SST 866 10.33 abcde 7 4.96 82.25 11 11.71 18 377 5
SST 875 9.61 cde 16 9.22 82.15 15 12.01 16 362 11
SST 877 9.59 cde 18 10.29 80.40 20 12.55 4 339 17
SST 884 10.69 abc 3 3.34 82.85 8 12.26 10 360 12
SST 895 11.36 a 1 4.98 83.75 3 12.38 8 367 10
Mean 10.11 82.46 12.25 363 Coefficient of variation (%)
8.77 1.51 4.80 6.13
LSDt(0,05) 1.28 1.80 0.85 32.14
60
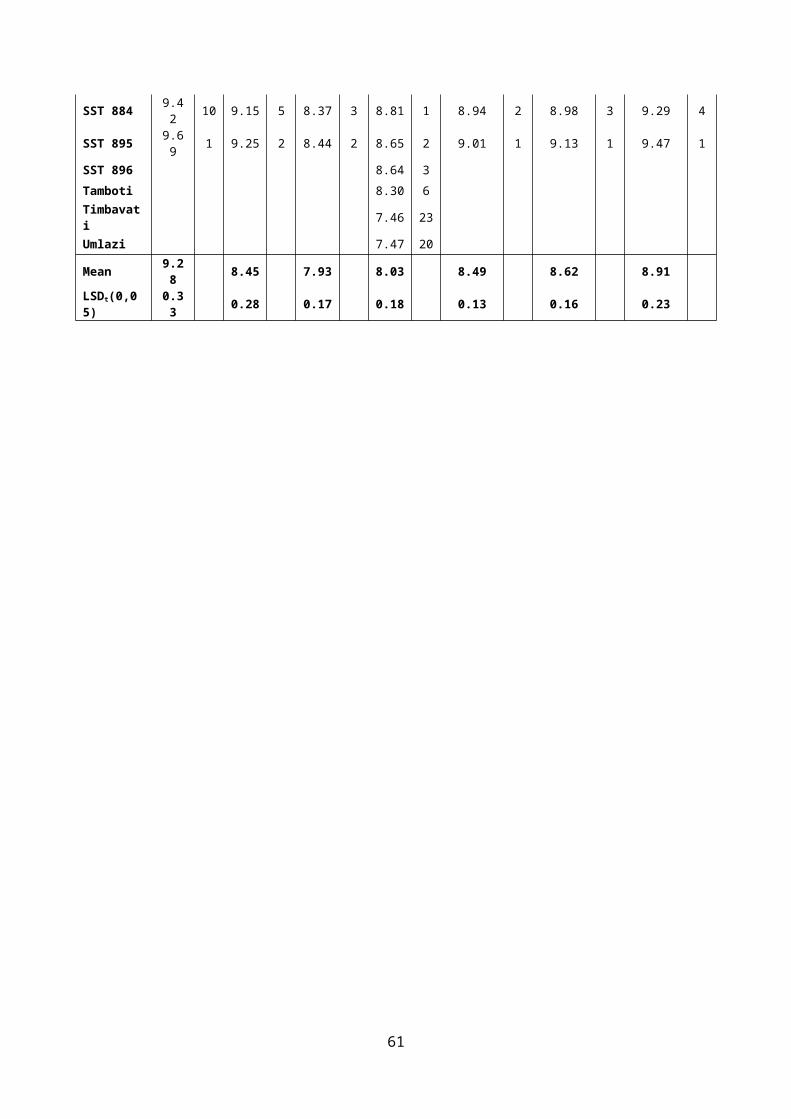
2016 Wheat cultivar adaptation trialCooler Central Irrigation Area (later planting)
CultivarModderrivier 2016-06-29
Yield Rank C.V. Hectolitre mass Rank Protein
content Rank Falling number Rank
Duzi 10.87 bcdef 15 5.30 80.00 19 12.27 5 373 17
Krokodil 11.40 abcd 7 8.30 82.00 16 11.07 20 336 20
PAN 3400 11.43 abcd 6 10.30 83.45 13 12.17 7 372 18
PAN 3471 11.18 abcdef 11 3.21 83.90 5 12.12 8 385 13
PAN 3497 11.57 abc 3 3.29 84.10 4 12.10 10 387 11
PAN 3515 10.60 def 18 3.89 82.50 15 11.93 12 375 16
PAN 3623 11.59 ab 2 10.59 83.70 9 12.53 3 400 3
Sabie 10.46 ef 19 10.09 79.85 20 12.60 2 376 15
SST 806 11.07 abcdef 12 4.29 84.70 1 11.78 14 406 1
SST 8125 10.70 cdef 16 5.61 83.75 8 11.52 17 404 2
SST 8135 11.50 abc 5 4.51 83.50 12 12.11 9 391 10
SST 8154 11.39 abcd 8 2.54 84.65 2 12.30 4 383 14
SST 8155 10.63 def 17 7.15 81.75 18 11.64 16 386 12
SST 835 11.82 a 1 3.19 83.80 7 11.87 13 395 6
SST 843 10.35 f 20 4.25 84.60 3 13.99 1 397 5
SST 866 11.23 abcde 10 1.78 83.60 10 11.28 19 398 4
SST 875 10.94 bcdef 13 7.14 83.20 14 11.36 18 393 7
SST 877 10.93 bcdef 14 5.99 82.00 16 11.77 15 341 19
SST 884 11.52 abc 4 3.65 83.55 11 12.02 11 393 8
SST 895 11.28 abcde 9 9.90 83.85 6 12.27 5 392 9
Mean 11.12 83.12 12.04 384 Coefficient of variation (%)
5.43 1.61 2.67 3.77
LSDt(0,05) 0.87 1.94 0.47 20.92
61
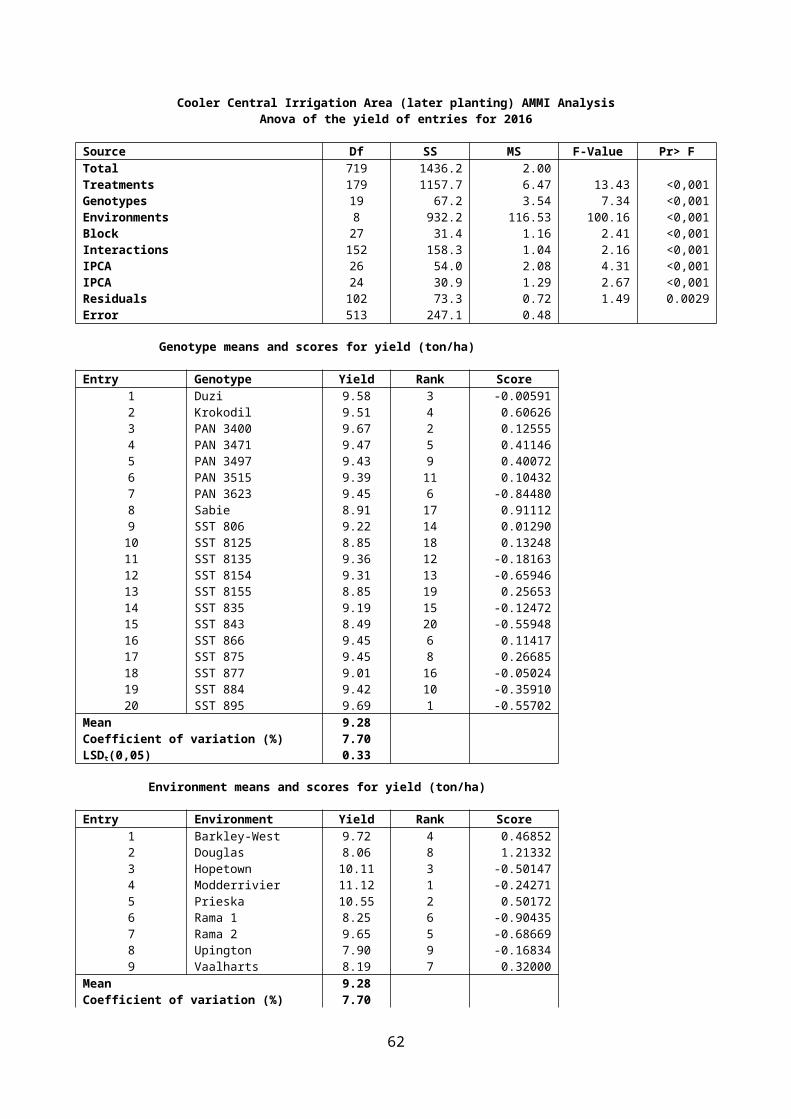
2016 Wheat cultivar adaptation trialCooler Central Irrigation Area (later planting)
CultivarPrieska 2016-07-06
Yield Rank C.V. Hectolitre mass Rank Protein
content Rank Falling number Rank
Duzi 10.65 cdef 10 6.59 84.70 4 10.60 6 317 17
Krokodil 11.38 ab 2 0.78 84.45 6 9.66 20 301 20
PAN 3400 11.02 abcd 4 8.84 84.25 9 10.48 9 318 16
PAN 3471 10.09 fghi 16 6.46 84.40 8 10.30 16 328 11
PAN 3497 10.28 efgh 15 15.18 84.00 12 10.42 11 319 15
PAN 3515 10.32 defgh 14 5.07 84.65 5 10.05 19 316 18
PAN 3623 10.68 bcdef 8 4.71 84.00 12 11.20 2 328 10
Sabie 11.47 a 1 3.16 85.70 1 10.40 13 327 12
SST 806 10.67 bcdef 9 6.59 84.95 3 10.36 15 340 2
SST 8125 9.78 hi 19 12.25 83.75 16 10.46 10 339 3
SST 8135 10.59 cdefg 11 6.71 84.45 6 10.15 18 326 13
SST 8154 9.93 ghi 17 5.90 85.15 2 10.87 4 325 14
SST 8155 9.91 ghi 18 7.44 83.40 19 10.16 17 332 7
SST 835 10.43 defgh 13 6.10 84.15 10 10.42 11 342 1
SST 843 9.40 i 20 6.72 83.95 14 13.01 1 339 4
SST 866 10.83 abcde 6 5.01 83.50 18 10.38 14 329 9
SST 875 11.27 abc 3 5.27 83.85 15 10.53 7 338 5
SST 877 10.76 bcdef 7 4.60 83.65 17 10.51 8 308 19
SST 884 10.59 cdefg 11 7.25 83.00 20 10.68 5 331 8
SST 895 10.93 abcde 5 3.46 84.10 11 11.18 3 335 6
Mean 10.55 84.20 10.59 327 Coefficient of variation (%)
4.64 0.60 2.81 2.78
LSDt(0,05) 0.71 0.73 0.43 13.13
62
2016 Wheat cultivar adaptation trialCooler Central Irrigation Area (later planting)
CultivarRama 1 2016-07-07
Yield Rank C.V. Hectolitre mass Rank Protein
content Rank Falling number Rank
Duzi 8.84 abcd 5 12.36 83.65 5 12.10 5 319 11
Krokodil 6.70 j 20 19.18 81.40 20 11.55 14 303 20
PAN 3400 8.70 abcde 6 5.07 82.10 17 12.24 3 307 19
PAN 3471 8.11 defgh 13 6.99 83.35 7 11.76 8 316 15
PAN 3497 8.24 cdefg 11 6.73 82.95 10 11.79 7 327 5
PAN 3515 8.69 abcde 7 7.40 83.75 4 11.23 19 319 11
PAN 3623 9.01 ab 3 4.82 84.85 1 12.45 2 312 16
Sabie 7.12 ij 19 14.28 82.80 12 12.17 4 312 17
SST 806 8.31 bcdefg 10 10.88 81.80 19 11.24 18 327 6
SST 8125 7.76 fghi 16 6.46 82.55 15 11.53 15 337 2
SST 8135 8.35 bcdefg 9 6.89 82.60 14 12.05 6 328 4
SST 8154 9.06 ab 2 7.69 84.05 3 11.66 11 318 13
SST 8155 7.68 ghi 17 8.66 82.70 13 11.66 11 322 8
SST 835 8.16 defgh 12 11.30 82.50 16 11.52 16 338 1
SST 843 7.43 hij 18 9.22 83.15 8 13.87 1 320 9
SST 866 7.97 efgh 15 12.54 83.05 9 11.31 17 318 13
SST 875 8.96 abc 4 7.06 82.00 18 11.20 20 337 3
SST 877 8.04 efgh 14 10.20 83.40 6 11.76 8 310 18
SST 884 8.49 bcdef 8 7.15 82.90 11 11.59 13 323 7
SST 895 9.39 a 1 6.03 84.45 2 11.69 10 319 10
Mean 8.25 83.00 11.82 320 Coefficient of variation (%)
6.29 1.31 4.66 4.50
LSDt(0,05) 0.75 1.57 0.80 20.84
63
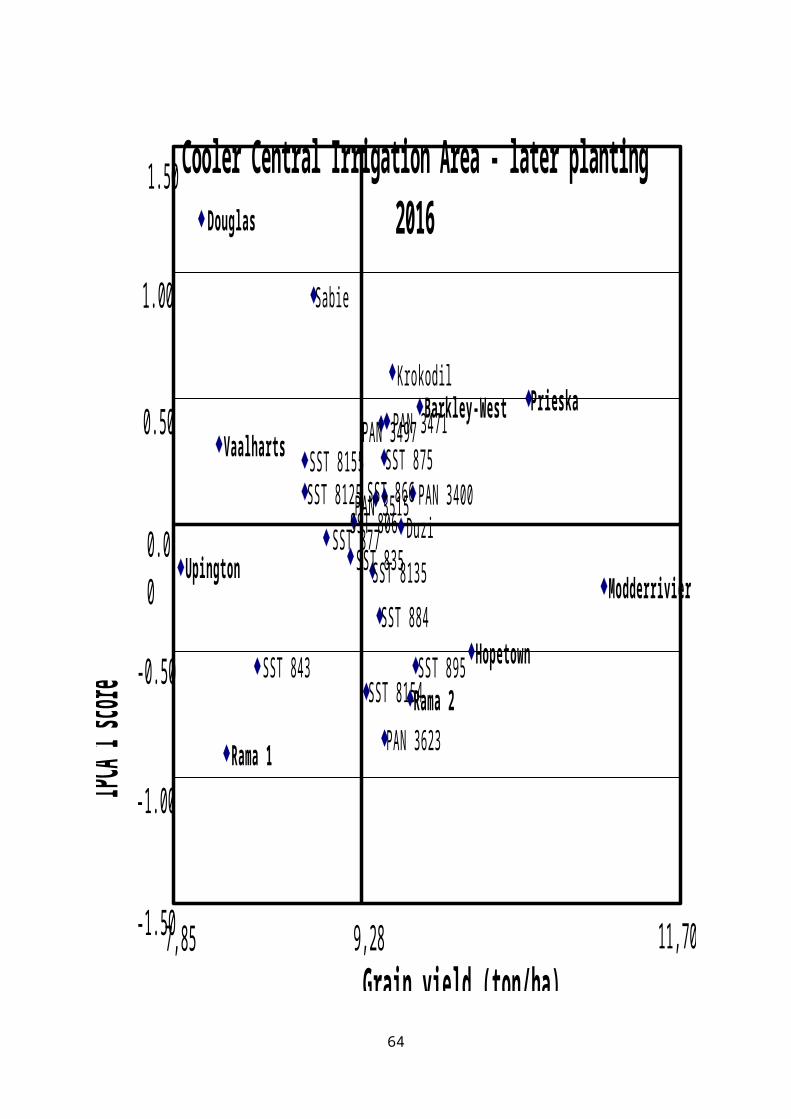
2016 Wheat cultivar adaptation trialCooler Central Irrigation Area (later planting)
CultivarRama 2 2016-07-19
Yield Rank C.V. Hectolitre mass Rank Protein
content Rank Falling number Rank
Duzi 9.76 abcde 9 6.25 81.95 16 12.83 5 321 13
Krokodil 9.23 ef 16 3.46 83.50 6 11.51 18 315 17
PAN 3400 10.07 abcd 5 3.55 82.65 12 12.69 7 316 16
PAN 3471 9.91 abcde 7 7.49 83.70 5 12.12 14 323 12
PAN 3497 9.63 bcde 11 4.70 81.75 18 12.87 4 325 8
PAN 3515 9.71 abcde 10 5.57 82.75 10 11.37 20 324 10
PAN 3623 10.38 a 2 2.50 84.45 2 13.07 1 324 9
Sabie 8.59 f 19 6.90 79.50 20 12.90 3 314 19
SST 806 9.20 ef 18 14.97 81.95 16 12.22 11 363 1
SST 8125 9.22 ef 17 5.73 82.55 13 12.72 6 357 2
SST 8135 10.13 abc 4 2.57 82.95 8 12.00 15 317 15
SST 8154 9.89 abcde 8 6.50 84.20 3 12.27 10 315 17
SST 8155 8.58 f 20 4.74 82.20 15 12.38 8 337 5
SST 835 9.35 de 15 5.96 83.00 7 11.68 17 345 3
SST 843 9.50 cde 13 6.22 85.00 1 12.98 2 337 6
SST 866 10.42 a 1 4.07 82.80 9 11.45 19 314 20
SST 875 9.47 cde 14 4.69 82.35 14 11.89 16 339 4
SST 877 9.52 cde 12 3.41 81.45 19 12.17 13 318 14
SST 884 10.04 abcd 6 8.57 82.70 11 12.20 12 324 10
SST 895 10.35 ab 3 6.80 83.85 4 12.34 9 328 7
Mean 9.65 82.76 12.28 328 Coefficient of variation (%)
5.28 1.41 5.31 4.91
LSDt(0,05) 0.74 1.69 0.94 23.27
64
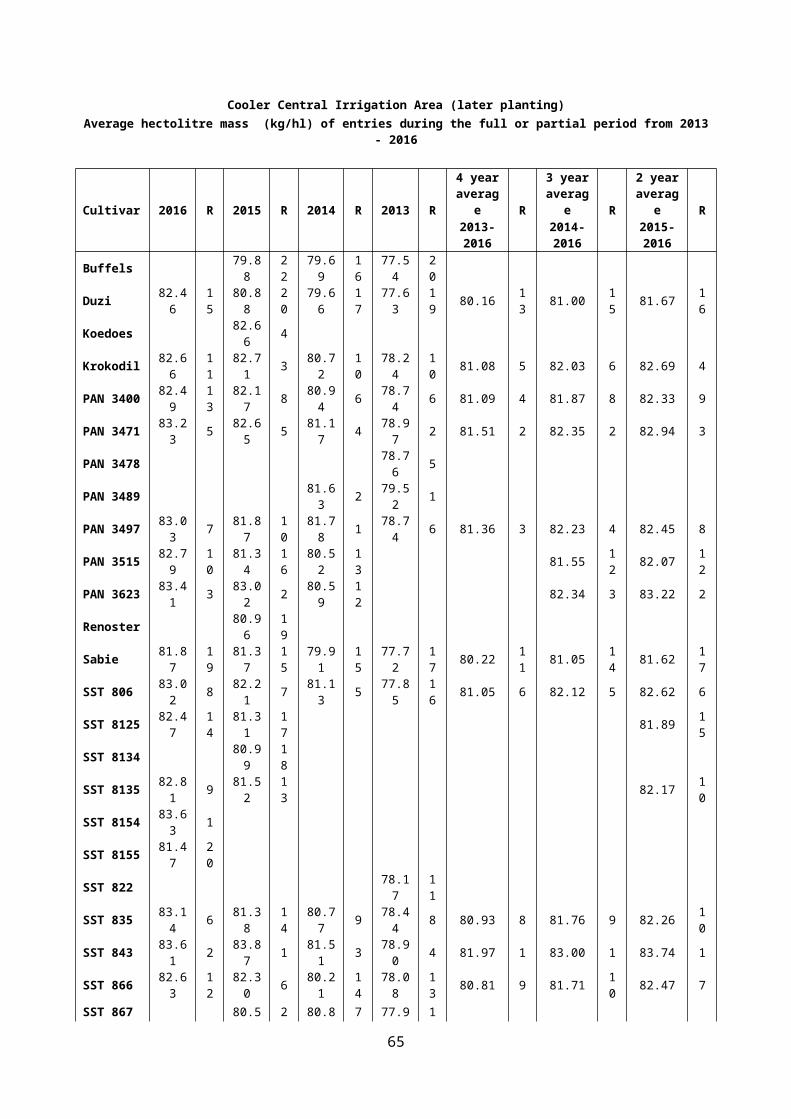
2016 Wheat cultivar adaptation trialCooler Central Irrigation Area (later planting)
CultivarUpington 2016-07-05
Yield Rank C.V. Hectolitre mass Rank Protein
content Rank Falling number Rank
Duzi 8.83 a 1 5.35 81.70 9 13.20 13 409 8
Krokodil 8.77 ab 2 5.96 83.20 4 12.31 20 367 20
PAN 3400 8.23 abcd 5 9.28 81.35 13 13.25 12 410 1
PAN 3471 8.69 ab 3 7.62 83.70 3 12.51 19 410 1
PAN 3497 7.83 defg 10 7.95 81.85 8 13.29 10 398 16
PAN 3515 8.19 abcde 6 8.27 81.50 12 12.86 17 398 15
PAN 3623 8.59 abc 4 5.39 83.85 2 14.32 1 410 1
Sabie 7.14 gh 19 3.30 80.35 18 13.66 3 402 14
SST 806 7.29 fgh 18 3.70 81.05 14 13.27 11 409 10
SST 8125 6.78 h 20 7.38 80.20 19 13.30 9 396 17
SST 8135 7.79 defg 12 6.44 80.85 15 13.34 7 410 1
SST 8154 7.74 defg 14 19.69 82.75 5 13.63 4 406 12
SST 8155 7.81 defg 11 0.97 78.80 20 12.87 16 410 1
SST 835 7.78 defg 13 2.19 82.05 7 12.97 15 406 13
SST 843 7.96 cdef 9 4.27 83.90 1 13.89 2 410 1
SST 866 7.53 efg 16 6.39 80.75 16 12.53 18 409 9
SST 875 7.56 defg 15 5.10 80.55 17 13.07 14 410 1
SST 877 7.49 efg 17 4.80 81.60 10 13.56 5 391 19
SST 884 7.96 cdef 8 5.17 81.60 10 13.33 8 393 18
SST 895 8.10 bcde 7 5.78 82.10 6 13.49 6 407 11
Mean 7.90 81.69 13.23 403 Coefficient of variation (%)
6.15 0.95 3.70 2.81
LSDt(0,05) 0.70 1.13 0.71 16.40
65
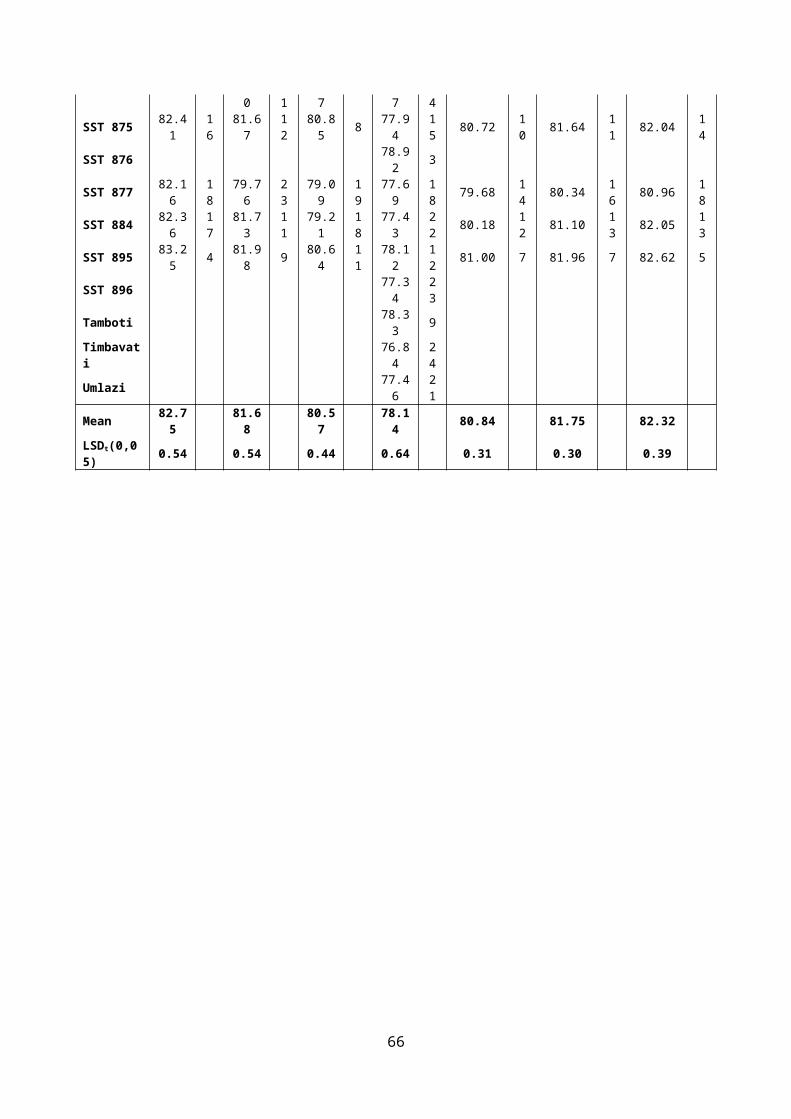
2016 Wheat cultivar adaptation trialCooler Central Irrigation Area (later planting)
CultivarVaalharts 2016-07-15
Yield Rank C.V. Hectolitre mass Rank Protein
content Rank Falling number Rank
Duzi 8.59 bc 5 5.55 81.80 9 11.12 2 410 2
Krokodil 9.06 ab 2 4.78 81.60 10 9.44 20 351 20
PAN 3400 8.47 cd 8 3.36 82.15 6 10.65 9 394 14
PAN 3471 9.07 a 1 3.82 82.55 3 10.52 11 399 13
PAN 3497 8.54 cd 6 3.48 82.70 2 10.44 12 407 6
PAN 3515 7.39 h 18 4.61 81.45 12 10.92 5 392 15
PAN 3623 7.68 fgh 15 2.27 81.35 13 11.10 3 409 4
Sabie 7.24 h 20 4.66 82.25 5 10.97 4 404 8
SST 806 8.10 def 13 3.25 82.95 1 10.66 8 390 16
SST 8125 8.34 cde 11 4.30 81.55 11 10.75 7 408 5
SST 8135 8.38 cde 10 4.29 81.90 7 10.55 10 386 17
SST 8154 8.41 cd 9 4.44 81.85 8 10.78 6 400 12
SST 8155 8.28 cde 12 5.62 80.70 18 10.31 15 402 11
SST 835 7.54 gh 17 3.41 82.40 4 10.43 13 403 9
SST 843 7.38 h 19 3.04 80.75 17 11.62 1 410 1
SST 866 8.75 abc 3 1.75 81.10 16 10.05 18 379 18
SST 875 8.64 abc 4 4.58 81.30 15 9.73 19 410 3
SST 877 7.61 gh 16 4.83 81.35 13 10.06 17 368 19
SST 884 7.91 efg 14 7.81 80.10 20 10.07 16 407 6
SST 895 8.49 cd 7 5.10 80.60 19 10.41 14 403 9
Mean 8.19 81.62 10.53 397 Coefficient of variation (%)
4.02 0.84 5.90 4.21
LSDt(0,05) 0.48 0.99 0.90 24.15
66
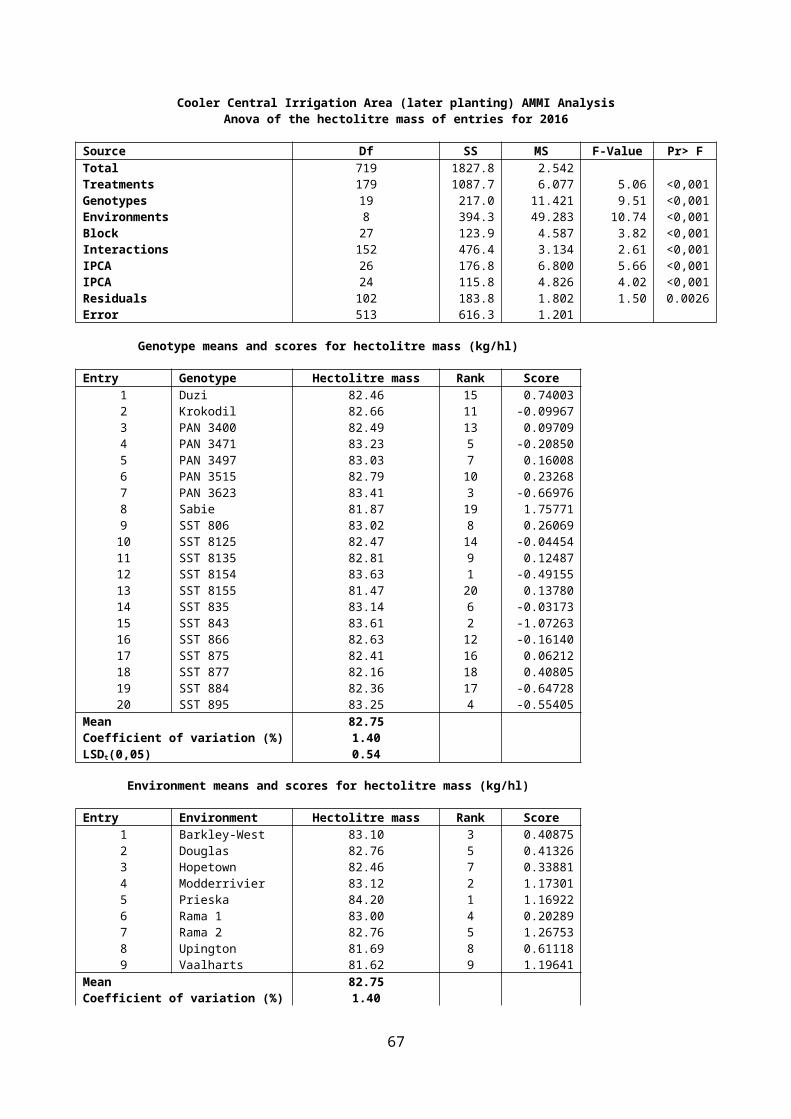
Warmer Northern Irrigation Area (earlier planting)Average yield (ton/ha) of entries during the full or partial period from 2013- 2016
Cultivar 2016 R 2015 R 2014 R 2013 R4 year
average R3 year
average R2 year
average R2013-2016
2014-2016
2015-2016
Buffels 7.17 21 7.84 17 6.33 23
Duzi 7.20 11 7.54 18 7.96 14 7.01 12 7.43 11 7.57 13 7.37 15
Koedoes 8.18 11
Krokodil 8.14 1 7.95 15 7.92 15 6.88 17 7.72 9 8.00 8 8.04 5
PAN 3400 7.29 8 8.52 3 8.07 13 7.87 1 7.94 4 7.96 9 7.90 6
PAN 3471 6.50 20 7.84 17 8.56 6 7.09 10 7.50 10 7.63 12 7.17 16
PAN 3478 7.36 7
PAN 3489 8.55 7 7.57 4
PAN 3497 6.90 15 8.26 10 8.87 2 7.16 8 7.80 6 8.01 6 7.58 11
PAN 3515 6.78 18 8.14 12 8.19 12 7.70 11 7.46 14
PAN 3623 7.79 3 8.32 9 7.53 18 7.88 10 8.05 3
Renoster 7.96 14
Sabie 6.73 19 6.93 22 8.39 9 6.96 14 7.25 13 7.35 15 6.83 18
SST 806 7.21 10 8.45 6 9.04 1 7.55 5 8.06 3 8.23 3 7.83 7
SST 8125 7.00 14 7.98 13 7.49 13
SST 8134 8.37 7
SST 8135 7.27 9 8.36 8 7.81 5
SST 8154 7.09 12
SST 8155 6.90 16
SST 822 7.09 10
SST 835 7.04 13 8.47 5 8.74 5 7.37 6 7.91 5 8.08 5 7.76 10
SST 843 7.60 6 7.50 19 6.46 19 6.12 24 6.92 14 7.19 16 7.55 12
SST 866 7.68 4 7.89 16 8.86 3 6.57 20 7.75 7 8.14 4 7.78 9
SST 867 6.85 23 8.51 8 6.57 20
SST 875 7.62 5 8.48 4 7.91 16 6.95 15 7.74 8 8.00 7 8.05 4
SST 876 7.01 12
SST 877 6.85 17 7.45 20 8.30 10 6.91 16 7.38 12 7.53 14 7.15 17
SST 884 8.01 2 8.59 2 8.28 11 7.74 2 8.16 1 8.29 2 8.30 1
SST 895 7.57 7 8.63 1 8.74 4 7.59 3 8.13 2 8.31 1 8.10 2
SST 896 6.82 18
Tamboti 6.71 19
Timbavati 6.56 22
Umlazi 7.12 9
Mean 7.26 7.99 8.25 7.04 7.69 7.87 7.68 LSDt(0,05) 0.33 0.23 0.22 0.67 0.15 0.14 0.19
67
Warmer Northern Irrigation Area (earlier planting) AMMI AnalysisAnova of the yield of entries for 2016
Source Df SS MS F-Value Pr> FTotal 239 204.62 0.856Treatments 59 175.06 2.967 18.75 <0,001Genotypes 19 45.48 2.394 15.12 <0,001Environments 2 89.76 44.879 162.05 <0,001Block 9 2.49 0.277 1.75 0.0813Interactions 38 39.83 1.048 6.62 <0,001IPCA 20 24.59 1.230 7.77 <0,001IPCA 18 15.24 0.846 5.35 <0,001Residuals 0 0.00Error 171 27.06 0.158
Genotype means and scores for yield (ton/ha)
Entry Genotype Yield Rank Score1 Duzi 7.20 11 0.312212 Krokodil 8.14 1 0.443333 PAN 3400 7.29 8 -0.158964 PAN 3471 6.50 20 0.306905 PAN 3497 6.90 15 -0.256826 PAN 3515 6.78 18 0.115987 PAN 3623 7.79 3 -0.089168 Sabie 6.73 19 0.850529 SST 806 7.21 10 -0.91483
10 SST 8125 7.00 14 0.1371111 SST 8135 7.27 9 0.1023112 SST 8154 7.09 12 -0.2790313 SST 8155 6.90 16 -0.0515414 SST 835 7.04 13 -0.3336515 SST 843 7.60 6 0.1760616 SST 866 7.68 4 -0.2999717 SST 875 7.62 5 0.1716118 SST 877 6.85 17 -0.1032819 SST 884 8.01 2 0.0535520 SST 895 7.57 7 -0.18232
Mean 7.26 Coefficient of variation (%) 5.60 LSDt(0,05) 0.33
Environment means and scores for yield (ton/ha)
Entry Environment Yield Rank Score1 Burgersfort 7.08 2 0.520862 Groblersdal 8.08 1 0.757533 Skuinsdrift 6.62 3 -1.27839
Mean 7.26 Coefficient of variation (%) 5.60 LSDt(0.05) 0.13
68
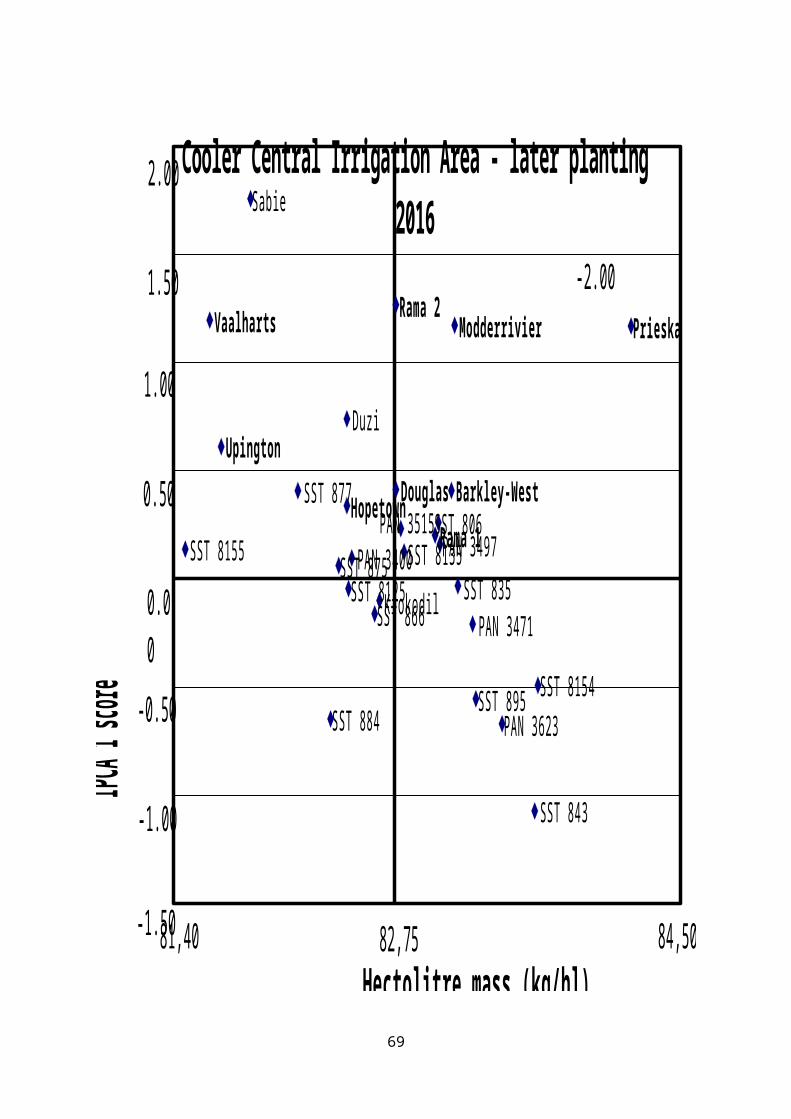
DuziKrokodil
PAN 3400
PAN 3471
PAN 3497
PAN 3515
PAN 3623
Sabie
SST 806
SST 8125 SST 8135
SST 8154
SST 8155
SST 835
SST 843
SST 866
SST 875
SST 877
SST 884
SST 895
Burgersfort
Groblersdal
Skuinsdrift
Warmer Northern Irrigation Area - earlier planting 2016
Grain yield (ton/ha)
IPCA 1 sc
ore1.00
0.50
0.00
-1.50
-0.50
6.47 8,357.26
-1.00
69
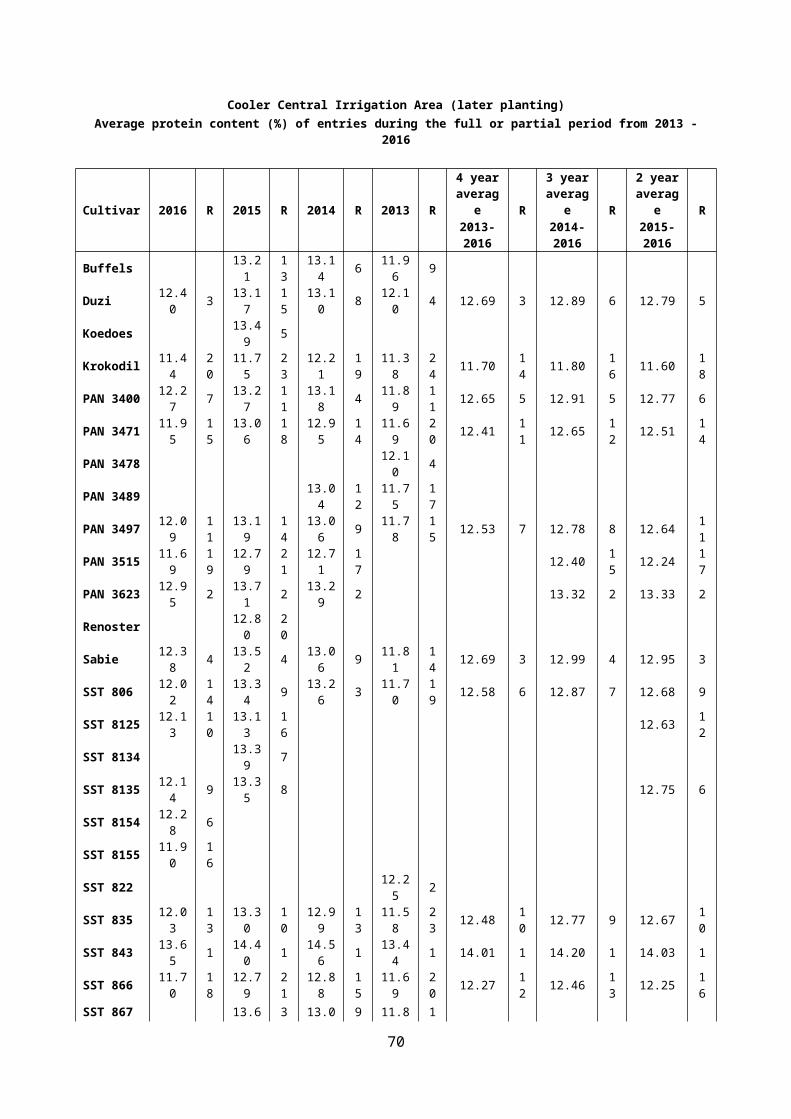
Warmer Northern Irrigation Area (earlier planting)Average hectolitre mass (kg/hl) of entries during the full or partial period from 2013- 2016
Cultivar 2016 R 2015 R 2014 R 2013 R4 year
average R3 year
average R2 year
average R2013-2016
2014-2016
2015-2016
Buffels 79.99 21 81.32 15 79.70 24
Duzi 79.15 13 80.67 15 80.77 19 80.40 15 80.25 11 80.20 13 79.91 13
Koedoes 81.67 4
Krokodil 79.67 6 80.81 13 81.00 17 79.80 22 80.32 10 80.49 12 80.24 9
PAN 3400 78.88 14 80.75 14 82.29 5 81.00 9 80.73 7 80.64 10 79.82 14
PAN 3471 80.27 1 81.65 5 82.20 7 81.70 2 81.46 1 81.37 1 80.96 2
PAN 3478 81.70 2
PAN 3489 83.02 1 82.40 1
PAN 3497 79.80 3 81.24 8 82.30 4 81.20 6 81.14 5 81.11 6 80.52 6
PAN 3515 79.37 11 80.85 12 81.79 9 80.67 8 80.11 10
PAN 3623 80.18 2 81.57 6 81.49 12 81.08 7 80.88 3
Renoster 80.09 19
Sabie 78.83 15 80.16 18 81.40 14 80.40 15 80.20 12 80.13 14 79.50 17
SST 806 79.55 8 81.74 3 82.54 2 81.40 4 81.31 2 81.28 3 80.65 4
SST 8125 78.73 17 80.46 17 79.60 16
SST 8134 78.87 23
SST 8135 79.30 12 81.36 7 80.33 7
SST 8154 79.65 7
SST 8155 78.47 19
SST 822 80.30 18
SST 835 79.77 4 81.21 9 82.45 3 81.30 5 81.18 4 81.14 5 80.49 7
SST 843 79.68 5 82.58 1 81.75 10 81.10 7 81.28 3 81.34 2 81.13 1
SST 866 79.53 9 80.66 16 81.80 8 80.60 14 80.65 8 80.66 9 80.10 11
SST 867 80.06 20 81.47 13 80.70 12
SST 875 78.80 16 81.09 10 81.73 11 80.70 12 80.58 9 80.54 11 79.95 12
SST 876 81.10 7
SST 877 78.70 18 79.00 22 81.10 16 80.40 15 79.80 14 79.60 16 78.85 18
SST 884 78.32 20 80.92 11 80.91 18 80.10 20 80.06 13 80.05 15 79.62 15
SST 895 79.43 10 81.84 2 82.23 6 81.00 9 81.13 6 81.17 4 80.64 5
SST 896 80.10 20
Tamboti 80.90 11
Timbavati 80.30 18
Umlazi 79.80 22
Mean 79.30 80.84 81.77 80.75 80.72 80.72 80.18 LSDt(0,05) 1.03 0.60 0.45 0.57 0.32 0.37 0.53
70
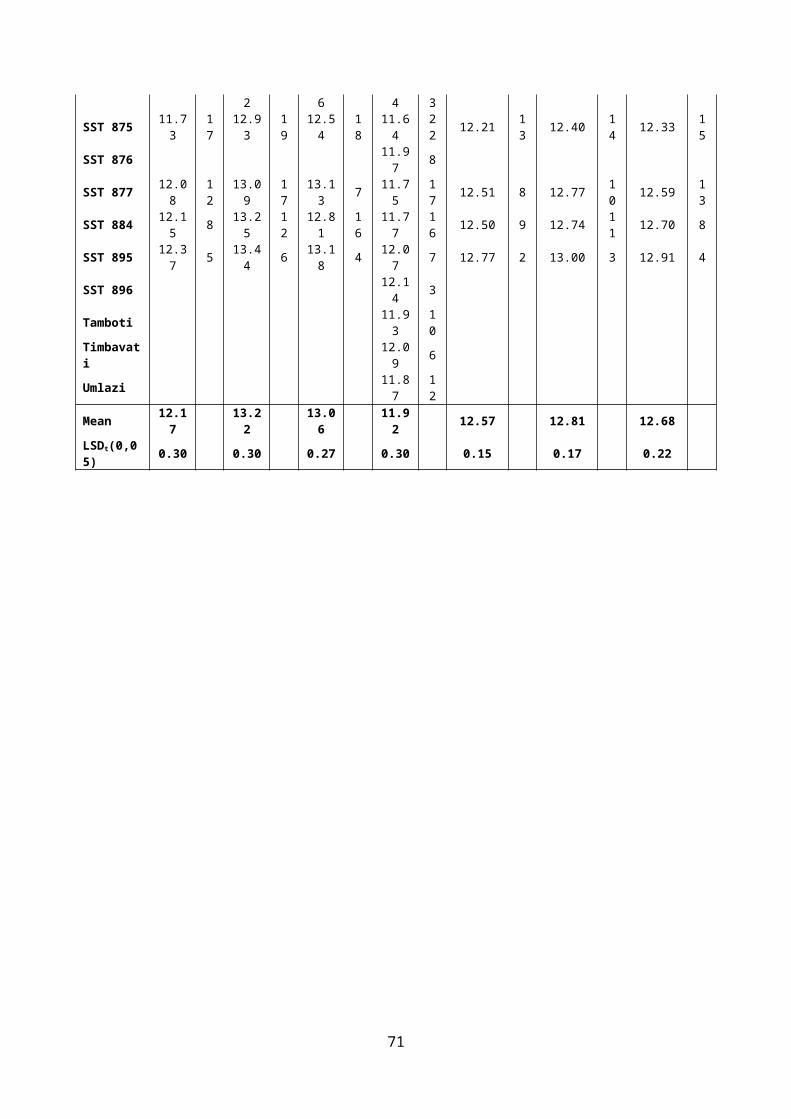
Warmer Northern Irrigation Area (earlier planting) AMMI AnalysisAnova of the hectolitre mass of entries for 2016
Source Df SS MS F-Value Pr> FTotal 239 1860.5 7.78Treatments 59 1565.5 26.53 16.43 <0,001Genotypes 19 68.8 3.62 2.24 0.0034Environments 2 1390.3 695.16 332.71 <0,001Block 9 18.8 2.09 1.29 0.2434Interactions 38 106.4 2.80 1.73 0.0096IPCA 20 67.3 3.36 2.08 0.0063IPCA 18 39.1 2.17 1.35 0.1651Residuals 0 0.0Error 171 276.1 1.61
Genotype means and scores for hectolitre mass (kg/hl)
Entry Genotype Hectolitre mass Rank Score1 Duzi 79.15 13 0.120302 Krokodil 79.67 6 -0.322163 PAN 3400 78.88 14 -0.103904 PAN 3471 80.27 1 -0.534005 PAN 3497 79.80 3 -0.387216 PAN 3515 79.37 11 0.192027 PAN 3623 80.18 2 -0.705278 Sabie 78.83 15 0.480399 SST 806 79.55 8 0.44974
10 SST 8125 78.73 17 0.8729111 SST 8135 79.30 12 0.1128812 SST 8154 79.65 7 -0.5667713 SST 8155 78.47 19 0.2243014 SST 835 79.77 4 0.2914515 SST 843 79.68 5 -0.8774116 SST 866 79.53 9 0.0597017 SST 875 78.80 16 -0.1846518 SST 877 78.70 18 0.7198119 SST 884 78.32 20 0.0588320 SST 895 79.43 10 0.09903
Mean 79.30 Coefficient of variation (%) 1.60 LSDt(0,05) 1.03
Environment means and scores for hectolitre mass (kg/hl)
Entry Environment Hectolitre mass Rank Score1 Burgersfort 82.23 1 1.623072 Groblersdal 79.35 2 -1.085443 Skuinsdrift 76.33 3 -0.53763
Mean 79.30 Coefficient of variation (%) 1.60 LSDt(0.05) 0.40
71
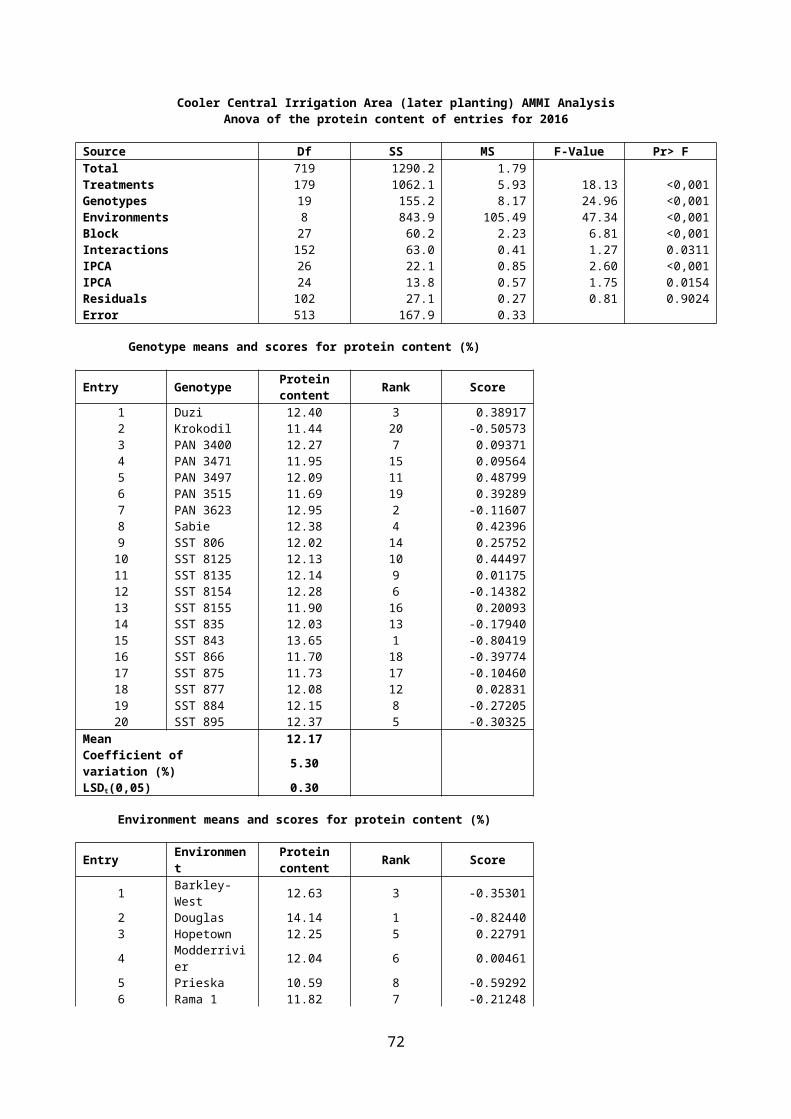
Duzi
Krokodil
PAN 3400
PAN 3471PAN 3497
PAN 3515
PAN 3623
Sabie SST 806
SST 8125
SST 8135
SST 8154
SST 8155 SST 835
SST 843
SST 866
SST 875
SST 877
SST 884 SST 895
Burgersfort
Groblersdal
Skuinsdrift
Warmer Northern Irrigation Area - earlier planting 2016
Hectolitre mass (kg/hl)
IPCA 1 sc
ore
1.00
0.50
0.00
-1.50
-0.50
76,25 83,2579,30
-1.00
1.50
2.00
77,00
72
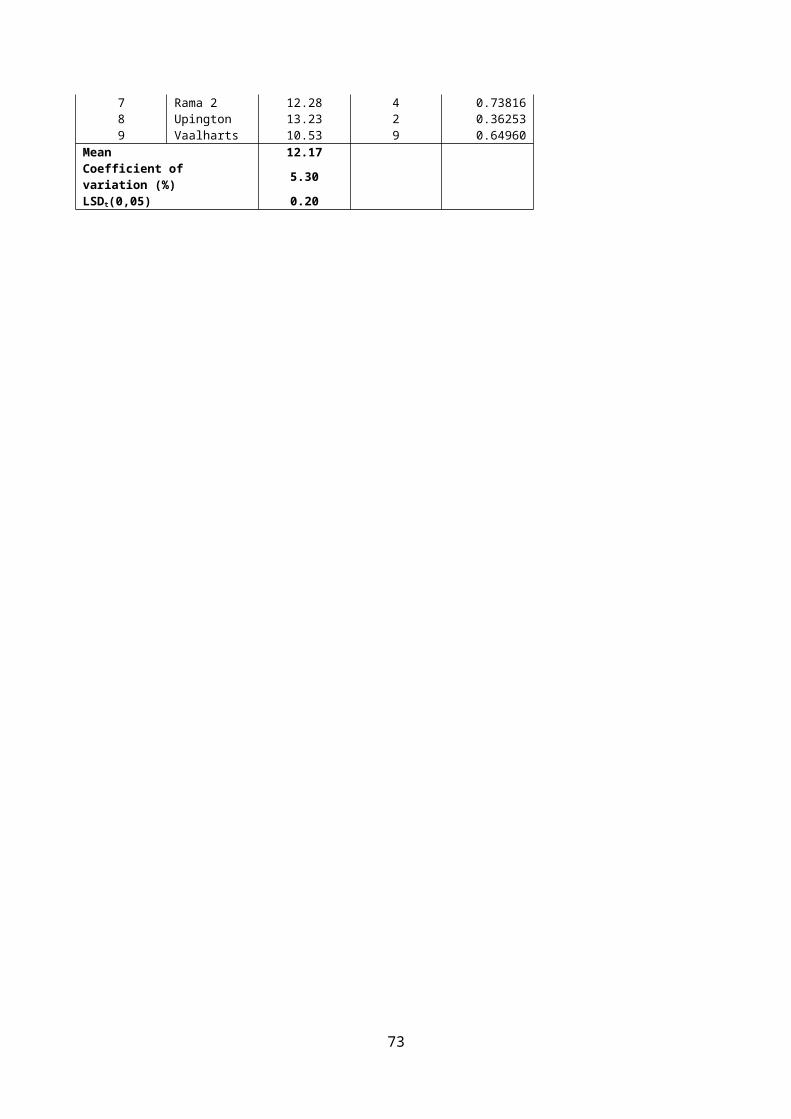
Warmer Northern Irrigation Area (earlier planting)Average protein content (%) of entries during the full or partial period from 2013- 2016
Cultivar 2016 R 2015 R 2014 R 2013 R4 year
average R3 year
average R2 year
average R2013-2016
2014-2016
2015-2016
Buffels 12.07 3 10.36 8 10.21 4
Duzi 12.09 19 11.82 10 10.74 4 10.24 3 11.22 6 11.55 7 11.96 13
Koedoes 11.99 6
Krokodil 12.19 18 10.70 23 9.92 19 9.68 22 10.62 14 10.94 16 11.45 18
PAN 3400 13.16 2 12.01 4 10.18 12 10.19 5 11.39 2 11.78 4 12.59 2
PAN 3471 12.69 6 11.48 16 10.36 8 9.76 19 11.07 8 11.51 9 12.09 9
PAN 3478 9.61 23
PAN 3489 10.14 13 9.81 14
PAN 3497 12.21 17 12.01 4 10.05 18 9.78 18 11.01 10 11.42 10 12.11 8
PAN 3515 12.34 16 11.40 19 10.06 17 11.27 14 11.87 16
PAN 3623 12.48 12 12.21 2 11.61 2 12.10 2 12.35 4
Renoster 11.26 20
Sabie 13.03 3 11.96 7 10.57 7 9.71 20 11.32 3 11.85 3 12.50 3
SST 806 12.59 10 11.57 15 10.10 16 9.79 16 11.01 10 11.42 11 12.08 10
SST 8125 12.45 13 11.45 17 11.95 14
SST 8134 11.75 11
SST 8135 12.72 5 11.64 13 12.18 5
SST 8154 12.76 4
SST 8155 12.40 14
SST 822 11.14 2
SST 835 12.59 10 11.44 18 10.12 15 9.99 11 11.04 9 11.38 12 12.02 11
SST 843 13.90 1 13.34 1 12.61 1 11.80 1 12.91 1 13.28 1 13.62 1
SST 866 12.09 19 11.12 22 10.28 11 9.69 21 10.80 13 11.16 15 11.61 17
SST 867 11.94 8 10.32 10 10.12 6
SST 875 12.65 8 11.21 21 10.14 13 9.94 13 10.99 12 11.33 13 11.93 15
SST 876 9.79 16
SST 877 12.38 15 11.58 14 10.62 5 10.01 10 11.15 7 11.53 8 11.98 12
SST 884 12.64 9 11.65 12 10.75 3 10.08 7 11.28 5 11.68 6 12.15 7
SST 895 12.67 7 11.84 9 10.59 6 10.04 9 11.29 4 11.70 5 12.26 5
SST 896 9.99 11
Tamboti 9.81 14
Timbavati 9.61 23
Umlazi 10.08 7
Mean 12.60 11.71 10.50 10.04 11.22 11.62 12.15 LSDt(0,05) 0.72 0.45 0.43 0.53 0.25 0.29 0.39
73
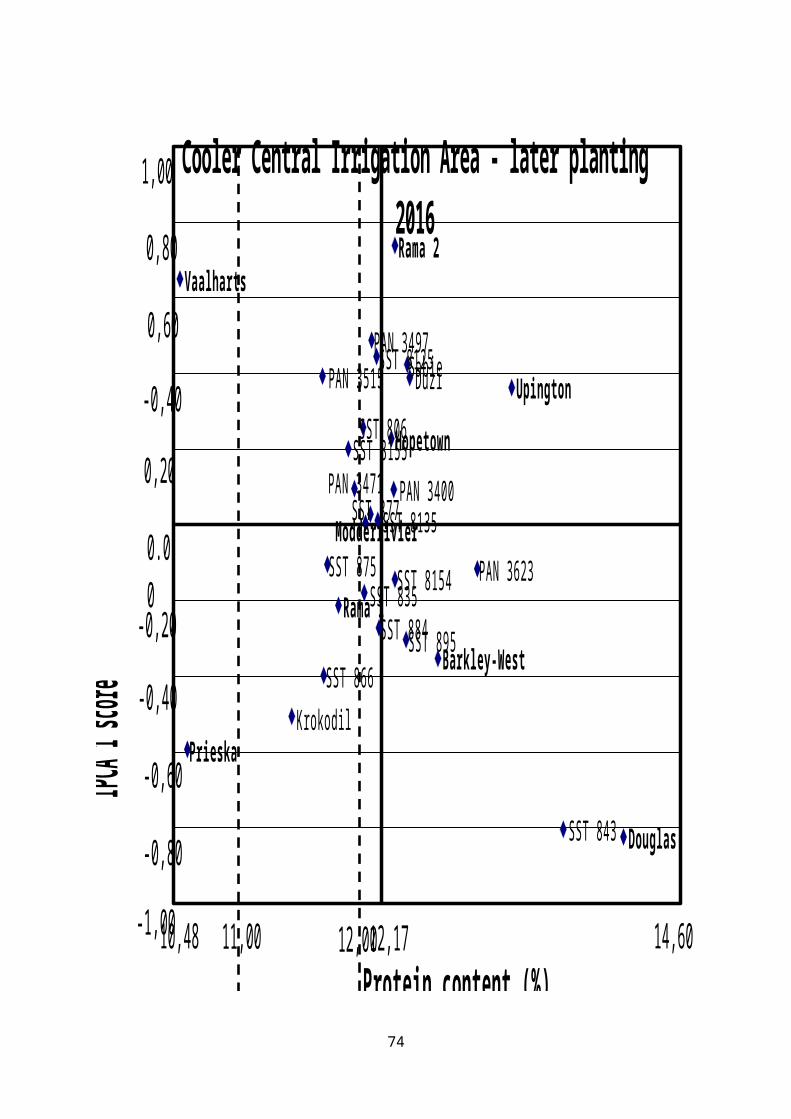
Warmer Northern Irrigation Area (earlier planting) AMMI AnalysisAnova of the protein content of entries for 2016
Source Df SS MS F-Value Pr> FTotal 239 358.89 1.502Treatments 59 216.76 3.674 4.79 <0,001Genotypes 19 39.14 2.060 2.68 <0,001Environments 2 156.97 78.483 64.64 <0,001Block 9 10.93 1.214 1.58 0.1239Interactions 38 20.66 0.544 0.71 0.8945IPCA 20 15.02 0.751 0.98 0.4899IPCA 18 5.63 0.313 0.41 0.9849Residuals 0 0.00Error 171 131.20 0.767
Genotype means and scores for protein content (%)
Entry Genotype Protein content Rank Score1 Duzi 12.09 19 -0.514182 Krokodil 12.19 18 0.268483 PAN 3400 13.16 2 0.484704 PAN 3471 12.69 6 0.034675 PAN 3497 12.21 17 0.013046 PAN 3515 12.34 16 0.025587 PAN 3623 12.48 12 0.251378 Sabie 13.03 3 0.256469 SST 806 12.59 10 -0.16901
10 SST 8125 12.45 13 -0.2826711 SST 8135 12.72 5 -0.1540212 SST 8154 12.76 4 0.2503813 SST 8155 12.40 14 -0.1507414 SST 835 12.59 10 -0.0220615 SST 843 13.90 1 0.4136016 SST 866 12.09 19 -0.0221417 SST 875 12.65 8 0.3627118 SST 877 12.38 15 -0.1178219 SST 884 12.64 9 -0.0970120 SST 895 12.67 7 -0.83134
Mean 12.60 Coefficient of variation (%) 7.10 LSDt(0,05) 0.72
Environment means and scores for protein content (%)
Entry Environment Protein content Rank Score1 Burgersfort 11.48 3 0.968252 Groblersdal 12.95 2 -0.999753 Skuinsdrift 13.37 1 0.03150
Mean 12.60 Coefficient of variation (%) 7.10 LSDt(0.05) 0.28
74
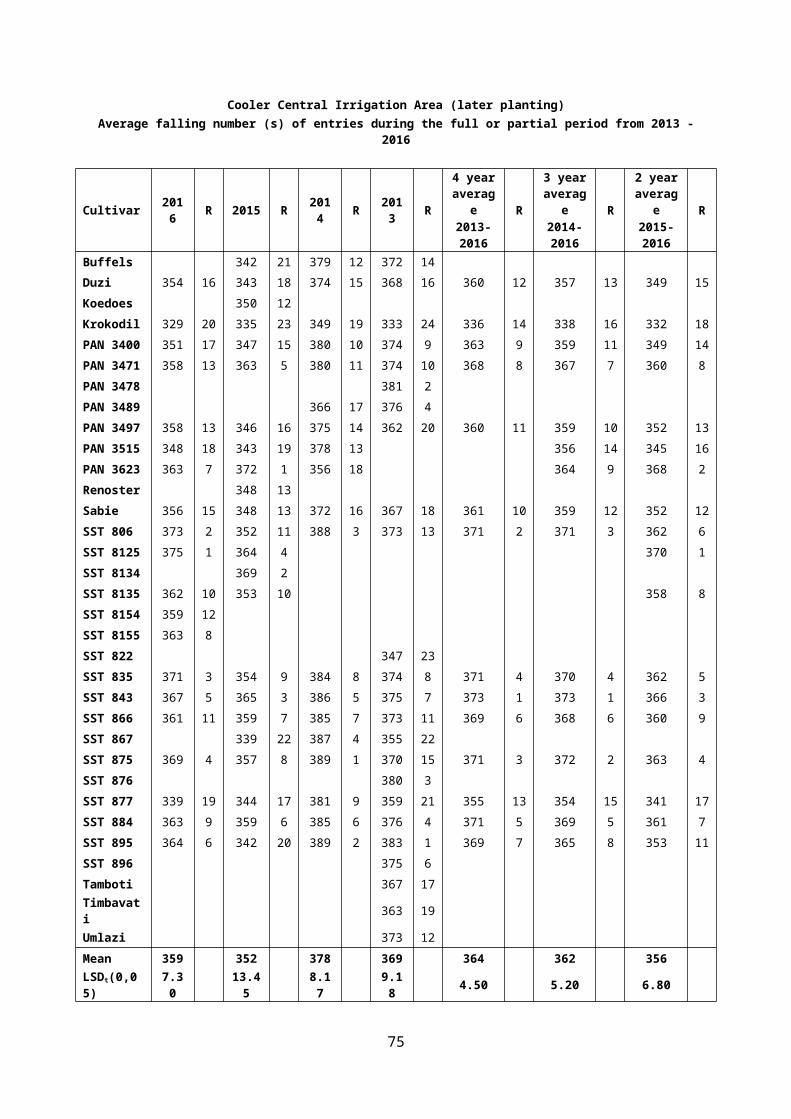
Duzi
Krokodil
PAN 3400
PAN 3471PAN 3497 PAN 3515
PAN 3623 Sabie
SST 806SST 8125
SST 8135
SST 8154
SST 8155SST 835
SST 843
SST 866
SST 875
SST 877 SST 884
SST 895
Burgersfort
Groblersdal
Skuinsdrift
Warmer Northern Irrigation Area - earlier planting 2016
Protein content (%)
IPCA 1 sc
ore
1.00
0.50
0.00
-1.50
-0.50
11,40 14,2012,60
-1.00
1.50
12,00
75
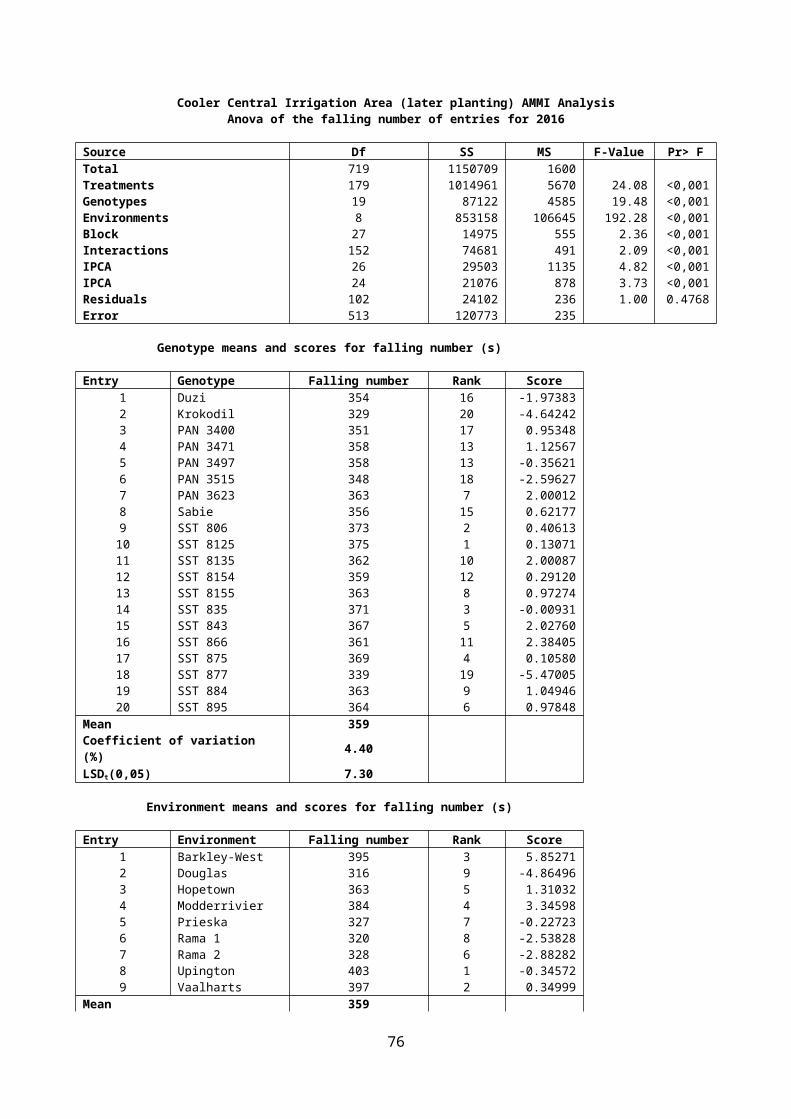
Warmer Northern Irrigation Area (earlier planting)Average falling number (s) of entries during the full or partial period from 2013- 2016
Cultivar 2016 R 2015 R 2014 R 2013 R4 year
average R3 year
average R2 year
average R2013-2016
2014-2016
2015-2016
Buffels 352 14 394 4 309 14
Duzi 318 6 352 15 393 9 301 18 341 7 354 6 335 8
Koedoes 365 2
Krokodil 274 20 312 23 362 19 264 24 303 14 316 16 293 18
PAN 3400 300 16 356 10 393 10 310 12 340 9 349 12 328 13
PAN 3471 307 14 355 11 394 5 297 21 338 11 352 9 331 11
PAN 3478 317 7
PAN 3489 393 10 296 22
PAN 3497 307 13 360 5 393 8 299 20 340 8 353 8 333 9
PAN 3515 304 15 344 20 389 15 346 13 324 16
PAN 3623 296 19 354 12 381 18 344 15 325 15
Renoster 330 22
Sabie 313 11 349 17 392 12 313 11 342 6 351 10 331 10
SST 806 332 1 363 4 395 1 353 1 361 1 363 1 347 1
SST 8125 315 9 357 8 336 7
SST 8134 357 9
SST 8135 296 18 363 3 330 10
SST 8154 320 5
SST 8155 320 4
SST 822 300 19
SST 835 317 8 359 7 395 3 324 4 348 4 357 5 338 5
SST 843 324 2 351 16 388 17 277 23 335 12 354 7 338 6
SST 866 323 3 353 13 395 2 326 3 349 3 357 3 338 4
SST 867 344 20 391 14 310 13
SST 875 311 12 345 19 394 6 308 15 339 10 350 11 328 14
SST 876 315 10
SST 877 299 17 346 18 388 16 305 16 334 13 344 14 323 17
SST 884 318 7 359 6 394 7 304 17 344 5 357 4 338 3
SST 895 314 10 368 1 392 13 334 2 352 2 358 2 341 2
SST 896 318 6
Tamboti 316 9
Timbavati 320 5
Umlazi 316 8
Mean 310 352 390 310 340 350 331 LSDt(0,05) 21.00 10.71 5.31 12.93 6.40 6.90 10.41
76
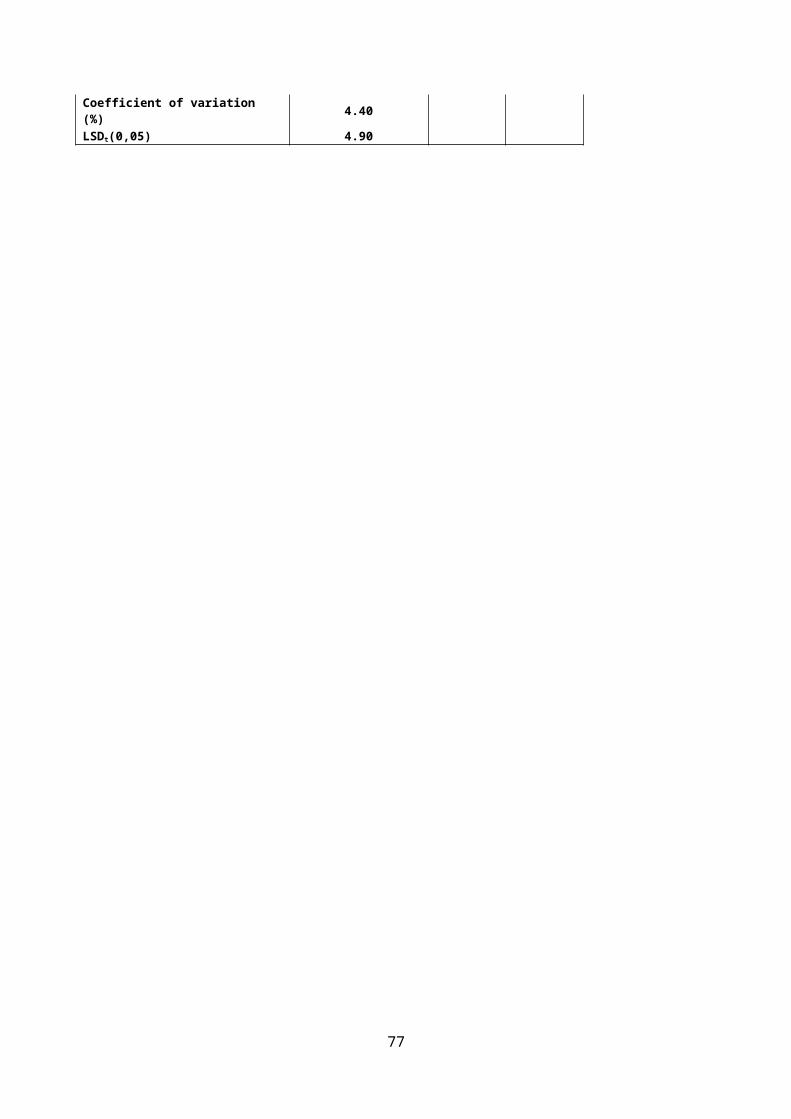
Warmer Northern Irrigation Area (earlier planting) AMMI AnalysisAnova of the falling number of entries for 2016
Source Df SS MS F-Value Pr> FTotal 239 267711 1120Treatments 59 146213 2478 3.73 <0,001Genotypes 19 39009 2053 3.09 <0,001Environments 2 53475 26738 30.63 <0,001Block 9 7857 873 1.31 0.2329Interactions 38 53729 1414 2.13 <0,001IPCA 20 43690 2184 3.29 <0,001IPCA 18 10039 558 0.84 0.6522Residuals 0 0Error 171 113641 665
Genotype means and scores for falling number (s)
Entry Genotype Falling number Rank Score1 Duzi 318 6 0.716512 Krokodil 274 20 5.820293 PAN 3400 300 16 0.038414 PAN 3471 307 14 1.247615 PAN 3497 307 13 1.427006 PAN 3515 304 15 1.128967 PAN 3623 296 19 2.733818 Sabie 313 11 -1.448369 SST 806 332 1 -2.71019
10 SST 8125 315 9 0.4337211 SST 8135 296 18 2.2206412 SST 8154 320 5 -1.5152513 SST 8155 320 4 0.6798814 SST 835 317 8 0.0209315 SST 843 324 2 -3.1792116 SST 866 323 3 -2.0274217 SST 875 311 12 2.0249918 SST 877 299 17 -2.5143319 SST 884 318 7 -3.7369920 SST 895 314 10 -1.36099
Mean 310 Coefficient of variation (%) 8.40 LSDt(0,05) 21.00
Environment means and scores for falling number (s)
Entry Environment Falling number Rank Score1 Burgersfort 316 2 3.675532 Groblersdal 290 3 -8.327993 Skuinsdrift 325 1 4.65246
Mean 310 Coefficient of variation (%) 8.40 LSDt(0.05) 8.13
77
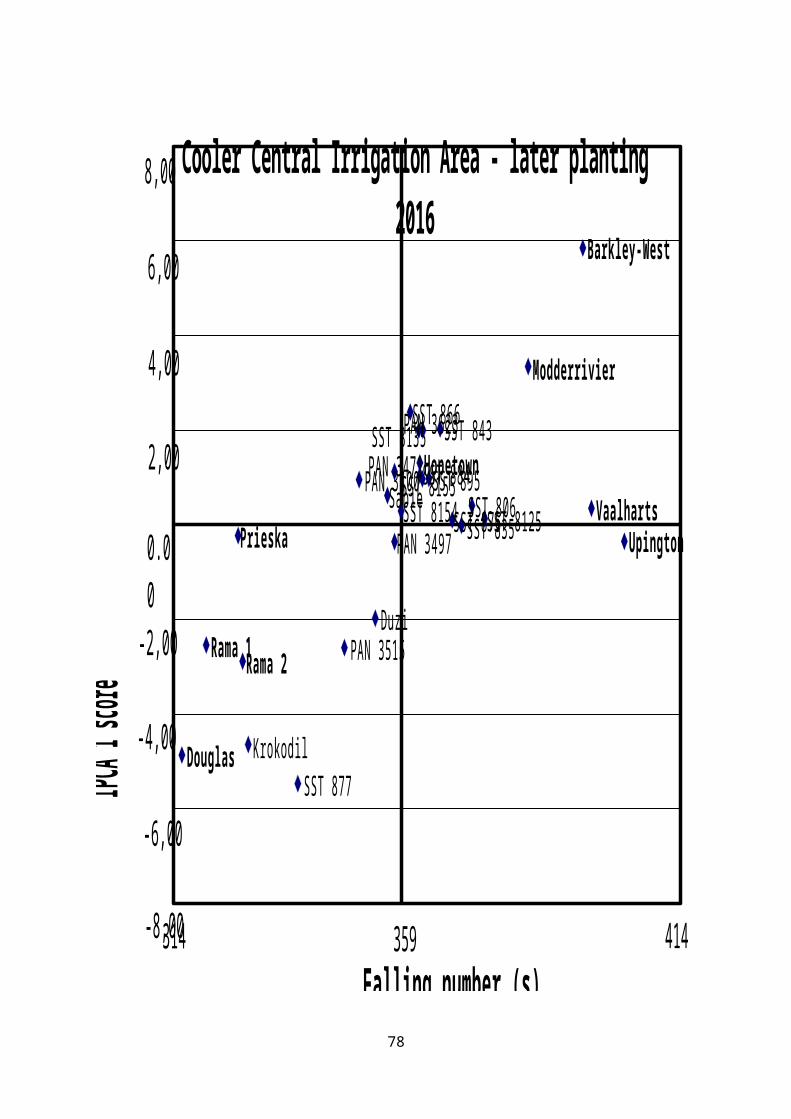
Duzi
Krokodil
PAN 3400
PAN 3471PAN 3497PAN 3515
PAN 3623
Sabie
SST 806
SST 8125
SST 8135
SST 8154
SST 8155SST 835
SST 843
SST 866
SST 875
SST 877
SST 884
SST 895
Burgersfort
Groblersdal
Skuinsdrift
Warmer Northern Irrigation Area - earlier planting 2016
Falling number (s)
IPCA 1 sc
ore
6.00
4,00
0,00
-10,00
-2,00
273 340310
-4,00
8,00
2,00
-8,00
-6,00
78
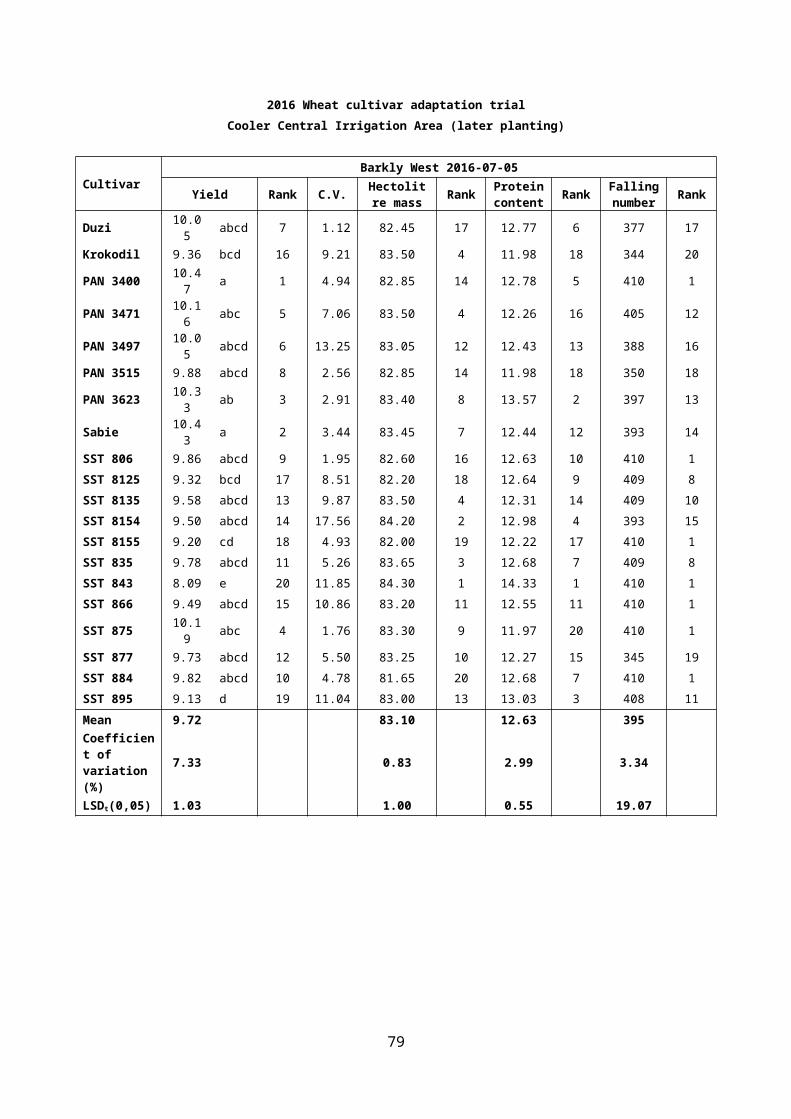
2016 Wheat cultivar adaptation trialWarmer Northern Irrigation Area (earlier planting)
CultivarBurgersfort 2016-05-24
Yield Rank C.V. Hectolitre mass Rank Protein
content Rank Falling number Rank
Duzi 7.62 abc 3 6.27 82.15 11 10.70 19 327 4
Krokodil 8.08 a 1 5.84 82.00 12 11.33 12 295 19
PAN 3400 6.95 defg 12 5.74 81.50 17 12.43 2 321 7
PAN 3471 6.44 gh 19 5.87 82.35 10 11.77 5 327 4
PAN 3497 6.96 defg 11 7.61 81.90 14 11.03 17 309 17
PAN 3515 6.53 gh 16 3.42 82.60 6 11.16 14 312 14
PAN 3623 7.26 cde 8 5.67 81.95 13 11.75 6 311 16
Sabie 7.21 cdef 9 3.94 82.80 4 12.03 3 317 11
SST 806 6.77 efgh 13 3.86 83.15 1 11.35 11 340 1
SST 8125 7.40 bcd 6 3.77 82.90 3 10.95 18 330 2
SST 8135 7.39 bcd 7 9.44 82.40 9 11.43 8 313 13
SST 8154 6.65 fgh 15 4.51 81.65 16 11.85 4 320 8
SST 8155 6.49 gh 18 3.19 81.85 15 11.04 16 317 11
SST 835 6.52 gh 17 1.61 83.10 2 11.41 10 319 9
SST 843 6.69 efgh 14 5.39 81.25 20 13.28 1 297 18
SST 866 7.19 cdef 10 5.85 82.60 6 11.15 15 318 10
SST 875 7.60 abc 5 4.65 81.50 17 11.75 6 328 3
SST 877 6.32 h 20 5.88 82.80 4 11.25 13 292 20
SST 884 7.61 abc 4 5.56 81.50 17 11.42 9 312 15
SST 895 7.85 ab 2 2.69 82.60 6 10.59 20 321 6
Mean 7.08 82.23 11.48 316 Coefficient of variation (%)
5.72 0.75 7.24 5.78
LSDt(0,05) 0.59 0.89 1.20 26.44
79
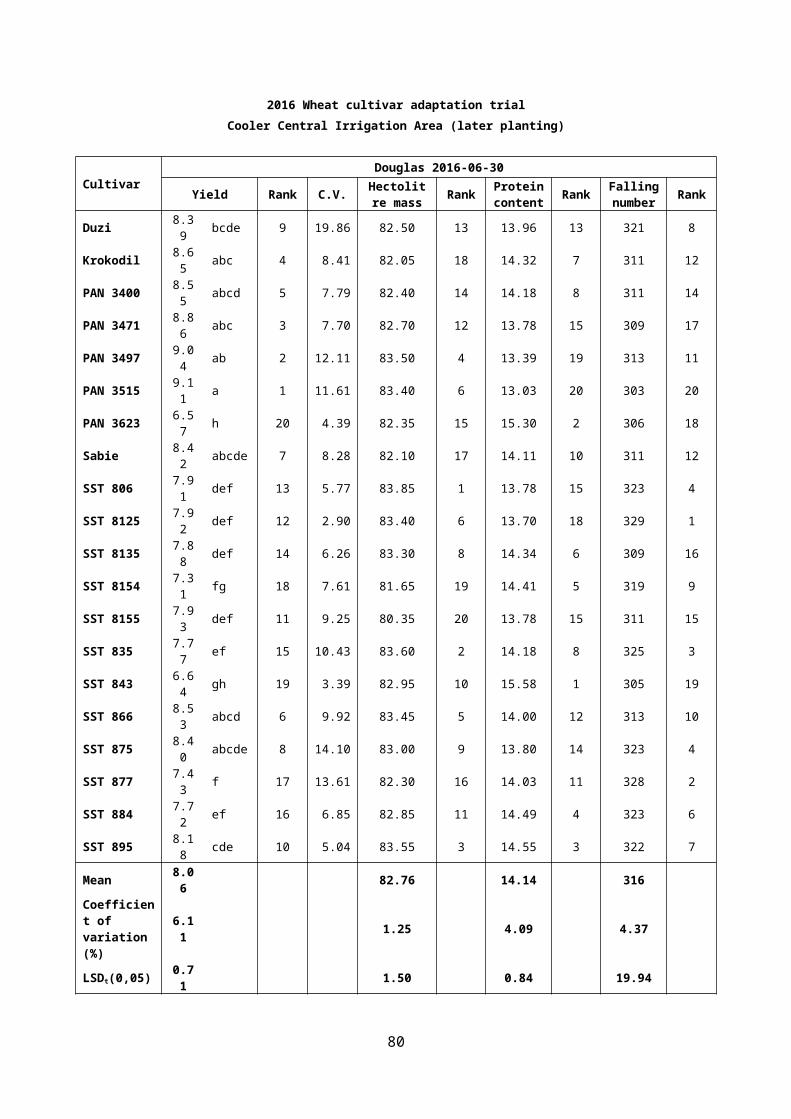
2016 Wheat cultivar adaptation trialWarmer Northern Irrigation Area (earlier planting)
CultivarGroblersdal 2016-05-25
Yield Rank C.V. Hectolitre mass Rank Protein
content Rank Falling number Rank
Duzi 7.87 efg 10 9.59 78.60 17 13.16 4 292 11
Krokodil 9.39 a 1 6.33 79.80 5 12.27 20 205 20
PAN 3400 8.05 def 7 3.33 78.50 18 12.95 10 278 13
PAN 3471 7.60 fgh 17 3.68 81.00 1 13.16 4 275 15
PAN 3497 7.20 h 19 8.27 79.50 8 12.48 19 275 14
PAN 3515 7.81 fg 13 4.93 79.20 12 12.59 17 274 16
PAN 3623 8.82 bc 4 5.30 80.95 2 12.71 15 253 19
Sabie 8.01 defg 8 1.78 79.40 9 13.01 8 304 7
SST 806 7.14 h 20 6.82 78.90 15 13.15 6 333 1
SST 8125 7.48 gh 18 7.47 77.15 20 12.99 9 290 12
SST 8135 7.94 efg 9 5.09 79.20 12 13.20 3 257 18
SST 8154 7.80 fg 14 2.26 80.30 4 12.83 13 312 5
SST 8155 7.86 fg 11 4.48 78.65 16 12.82 14 295 10
SST 835 7.75 fg 16 7.70 79.25 11 12.93 12 297 9
SST 843 9.29 ab 2 2.94 80.95 2 13.93 1 332 2
SST 866 8.40 cde 6 5.62 79.70 6 12.64 16 320 4
SST 875 8.52 cd 5 4.63 79.35 10 12.52 18 273 17
SST 877 7.86 fg 12 5.49 78.00 19 12.94 11 300 8
SST 884 9.09 ab 3 4.56 78.95 14 13.09 7 328 3
SST 895 7.76 fg 15 3.77 79.70 6 13.71 2 305 6
Mean 8.08 79.35 12.95 290 Coefficient of variation (%)
4.66 1.51 3.88 9.73
LSDt(0,05) 0.54 0.17 0.73 40.80
80
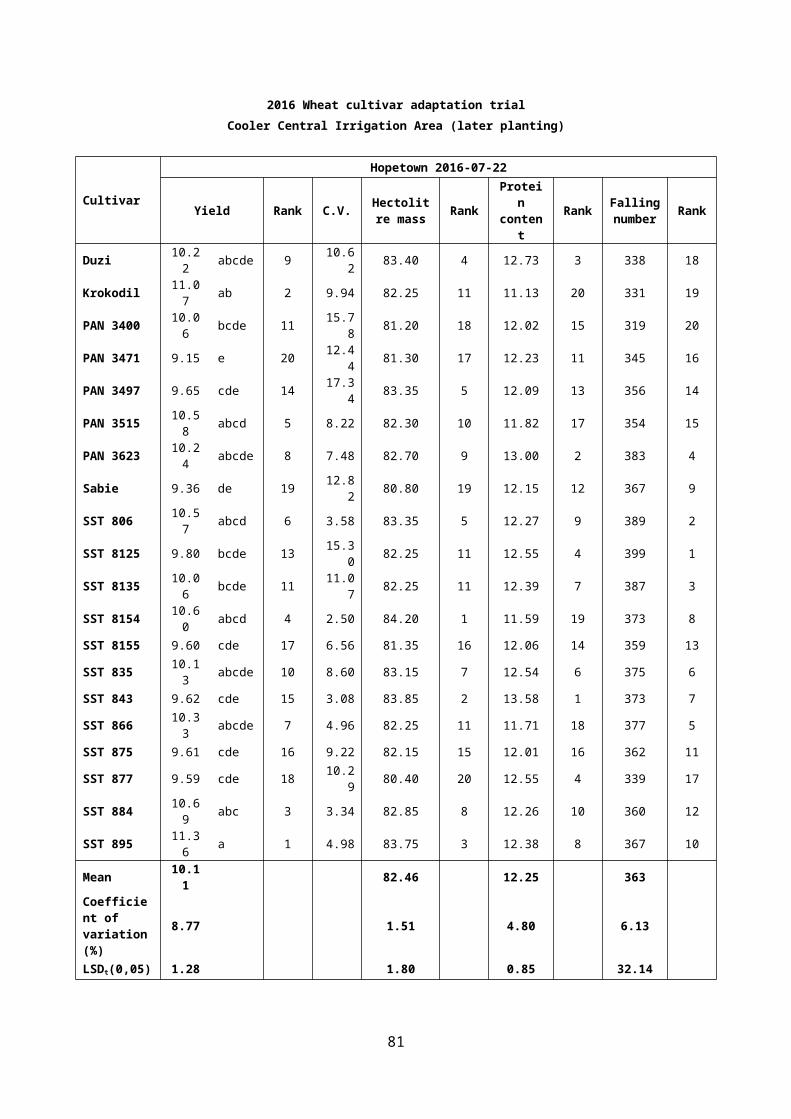
2016 Wheat cultivar adaptation trialWarmer Northern Irrigation Area (earlier planting)
CultivarSkuinsdrift 2016-05-27
Yield Rank C.V. Hectolitre mass Rank Protein
content Rank Falling number Rank
Duzi 6.11 ij 17 1.59 76.70 8 12.43 20 337 3
Krokodil 6.94 cdef 6 5.42 77.20 4 12.98 17 321 13
PAN 3400 6.86 cdefg 7 4.45 76.65 9 14.09 2 301 20
PAN 3471 5.47 k 19 6.55 77.45 3 13.13 14 318 15
PAN 3497 6.54 fghi 12 8.87 78.00 1 13.12 15 337 3
PAN 3515 6.01 j 18 6.97 76.30 11 13.26 13 326 9
PAN 3623 7.30 abcd 4 3.63 77.65 2 12.99 16 325 10
Sabie 4.98 l 20 4.99 74.30 20 14.05 3 318 16
SST 806 7.71 a 1 6.89 76.60 10 13.27 12 323 12
SST 8125 6.12 ij 16 8.22 76.15 14 13.42 9 325 10
SST 8135 6.47 fghij 13 5.21 76.30 11 13.54 7 319 14
SST 8154 6.82 defgh 10 8.13 77.00 5 13.58 6 328 8
SST 8155 6.34 hij 15 3.38 74.90 18 13.32 11 349 1
SST 835 6.84 cdefg 8 5.63 76.95 6 13.43 8 336 5
SST 843 6.83 defg 9 3.81 76.85 7 14.48 1 344 2
SST 866 7.43 ab 2 6.32 76.30 11 12.48 19 331 6
SST 875 6.76 efgh 11 6.50 75.55 16 13.68 5 331 7
SST 877 6.38 ghij 14 5.11 75.30 17 12.97 18 306 19
SST 884 7.33 abc 3 4.19 74.50 19 13.42 9 313 18
SST 895 7.10 bcde 5 5.74 76.00 15 13.71 4 317 17
Mean 6.62 76.33 13.37 325 Coefficient of variation (%)
5.08 1.07 3.11 6.67
LSDt(0,05) 0.49 1.19 0.60 31.34
81
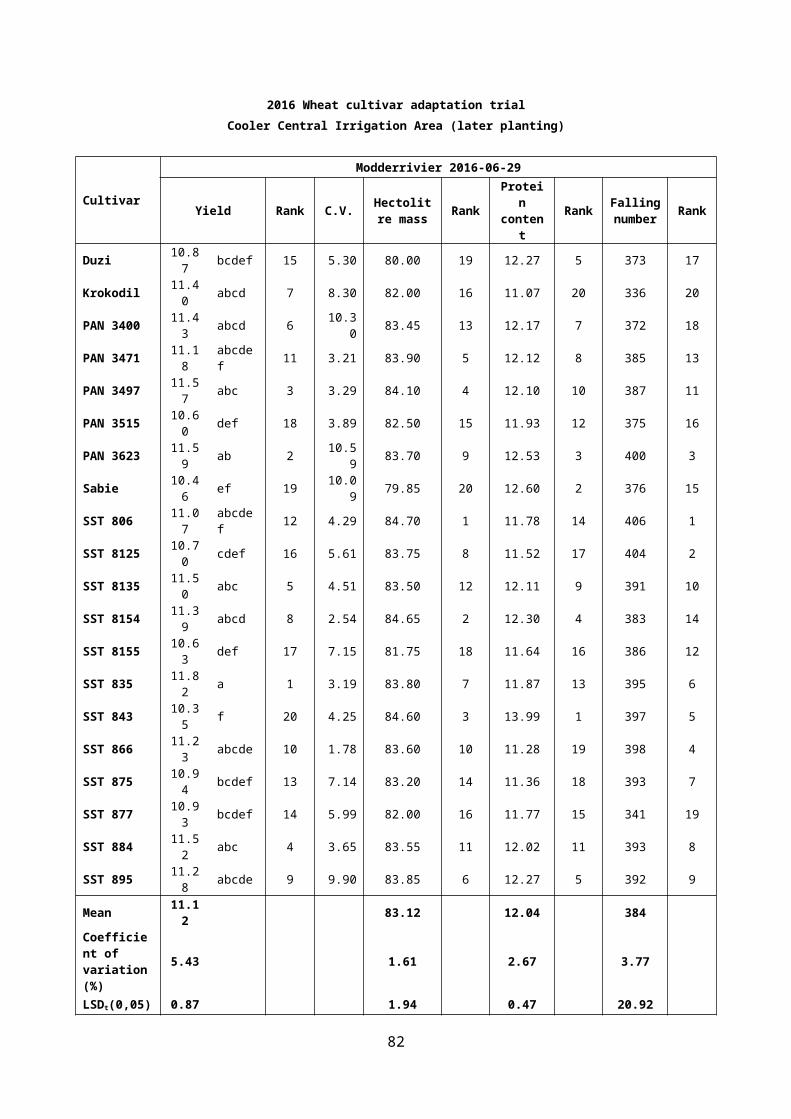
Warmer Northern Irrigation Area (later planting)Average yield (ton/ha) of entries during the full or partial period from 2013- 2016
Cultivar 2016 R 2015 R 2014 R 2013 R4 year
average R3 year
average R2 year
average R2013-2016
2014-2016
2015-2016
Buffels 7.11 20 7.20 17 6.59 24
Duzi 7.86 4 7.75 13 7.46 11 7.02 16 7.52 8 7.69 7 7.80 6
Koedoes 7.95 6
Krokodil 7.45 12 8.36 2 7.21 16 7.28 8 7.57 5 7.67 8 7.90 3
PAN 3400 8.22 1 8.41 1 8.19 1 7.06 15 7.97 1 8.27 1 8.31 1
PAN 3471 7.67 8 7.86 9 7.44 12 7.22 9 7.55 6 7.66 9 7.77 7
PAN 3478 7.48 5
PAN 3489 7.27 14 7.47 6
PAN 3497 7.38 16 7.84 10 7.65 8 6.80 21 7.41 9 7.62 10 7.61 11
PAN 3515 7.31 17 7.52 17 7.68 7 7.51 12 7.42 14
PAN 3623 8.00 3 7.76 12 7.76 6 7.84 3 7.88 5
Renoster 8.03 5
Sabie 7.12 19 6.92 22 6.98 18 6.95 18 6.99 14 7.01 15 7.02 18
SST 806 7.39 15 7.28 18 7.62 9 6.98 17 7.32 11 7.43 13 7.34 15
SST 8125 7.75 6 7.65 15 7.70 9
SST 8134 7.92 7
SST 8135 7.72 7 8.05 3 7.89 3
SST 8154 7.75 5
SST 8155 7.55 11
SST 822 6.70 23
SST 835 7.57 10 7.55 16 7.96 4 7.49 4 7.64 4 7.70 6 7.56 13
SST 843 6.94 20 7.15 19 6.90 19 7.10 13 7.02 13 7.00 16 7.05 17
SST 866 7.42 14 7.71 14 8.06 3 7.53 3 7.68 3 7.73 5 7.56 12
SST 867 6.77 23 7.26 15 7.16 11
SST 875 7.45 12 7.88 8 7.40 13 6.90 19 7.41 10 7.57 11 7.66 10
SST 876 7.56 2
SST 877 7.23 18 6.99 21 7.59 10 7.17 10 7.25 12 7.27 14 7.11 16
SST 884 7.63 9 7.79 11 7.85 5 6.83 20 7.52 7 7.76 4 7.71 8
SST 895 8.03 2 8.04 4 8.11 2 7.07 14 7.81 2 8.06 2 8.03 2
SST 896 6.73 22
Tamboti 7.67 1
Timbavati 7.11 12
Umlazi 7.30 7
Mean 7.57 7.66 7.56 7.13 7.48 7.61 7.63 LSDt(0,05) 0.35 0.23 0.20 0.52 0.15 0.15 0.20
82

Warmer Northern Irrigation Area (later planting) AMMI AnalysisAnova of the yield of entries for 2016
Source Df SS MS F-Value Pr> FTotal 319 350.2 1.098Treatments 79 288.6 3.653 16.05 <0,001Genotypes 19 30.4 1.601 7.03 <0,001Environments 3 169.1 56.361 69.51 <0,001Block 12 9.7 0.811 3.56 <0,001Interactions 57 89.1 1.563 6.87 <0,001IPCA 21 59.3 2.822 12.40 <0,001IPCA 19 19.0 1.002 4.40 <0,001Residuals 17 10.8 0.634 2.79 <0,001Error 228 51.9 0.228
Genotype means and scores for yield (ton/ha)
Entry Genotype Yield Rank Score1 Duzi 7.86 4 0.140782 Krokodil 7.45 12 0.245773 PAN 3400 8.22 1 -0.277264 PAN 3471 7.67 8 0.668765 PAN 3497 7.38 16 0.493156 PAN 3515 7.31 17 0.147577 PAN 3623 8.00 3 -0.588688 Sabie 7.12 19 0.769109 SST 806 7.39 15 0.55370
10 SST 8125 7.75 6 0.2623111 SST 8135 7.72 7 -0.2841912 SST 8154 7.75 5 -0.4376413 SST 8155 7.55 11 -0.0423614 SST 835 7.57 10 0.0221615 SST 843 6.94 20 -0.9191816 SST 866 7.42 14 -0.3936917 SST 875 7.45 12 0.3988718 SST 877 7.23 18 -0.2472319 SST 884 7.63 9 -0.3981020 SST 895 8.03 2 -0.11383
Mean 7.57 Coefficient of variation (%) 6.60 LSDt(0,05) 0.35
Environment means and scores for yield (ton/ha)
Entry Environment Yield Rank Score1 Brits JvR 6.81 4 0.967672 Koedoeskop 8.74 1 -1.582193 Makoppa 7.17 3 0.639184 Ohrigstad 7.56 2 -0.02467
Mean 7.57 Coefficient of variation (%) 6.60 LSDt(0.05) 0.16
83
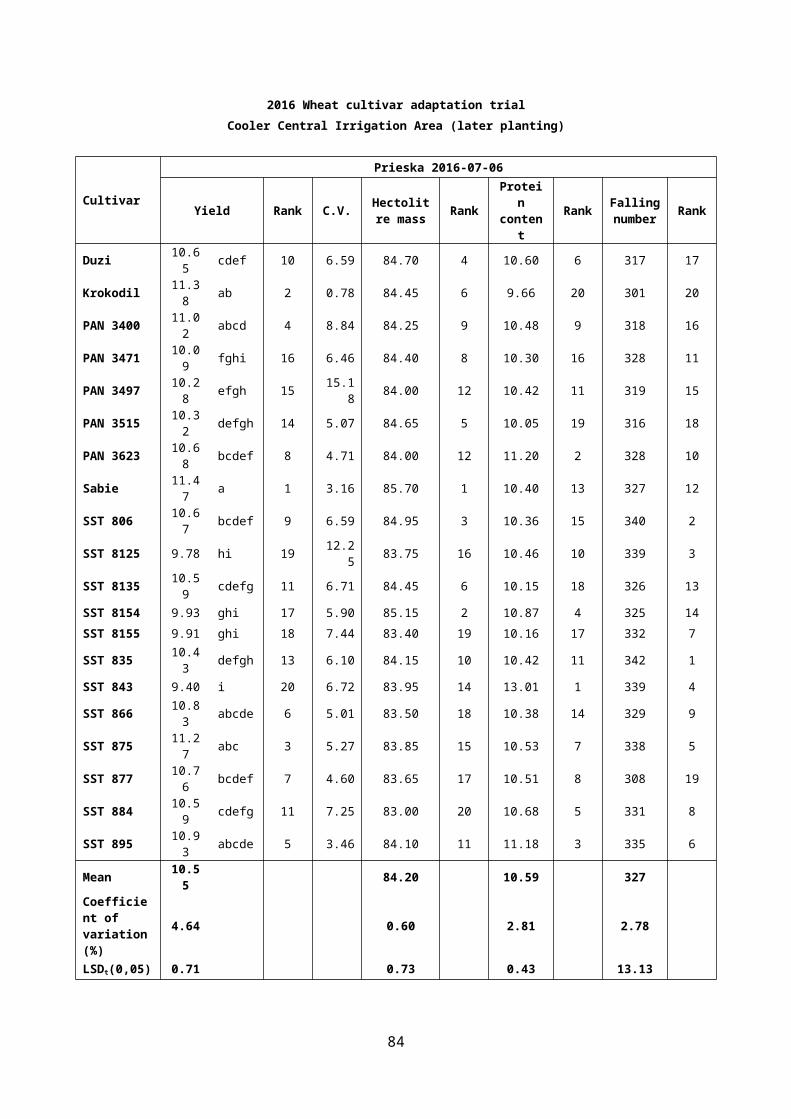
DuziKrokodil
PAN 3400
PAN 3471PAN 3497
PAN 3515
PAN 3623
Sabie
SST 806
SST 8125
SST 8135SST 8154
SST 8155SST 835
SST 843
SST 866
SST 875
SST 877SST 884
SST 895
Brits
Koedoeskop
Makoppa
Ohrigstad
Warmer Northern Irrigation Area - later planting 2016
Grain yield (ton/ha)
IPCA 1 sc
ore
1,00
6,78 9,05-2,00
1,50
0,50
0,00
-1,50
-0,50
7.57
-1,00
84
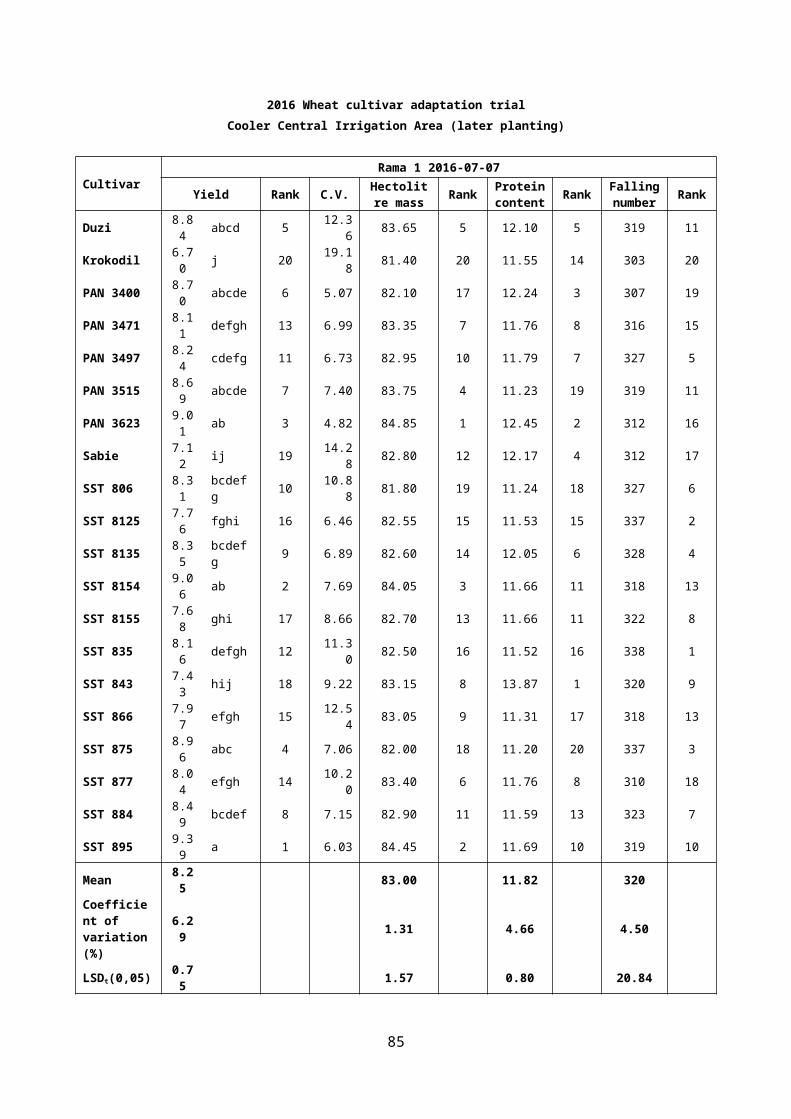
Warmer Northern Irrigation Area (later planting)Average hectolitre mass (kg/hl) of entries during the full or partial period from 2013- 2016
Cultivar 2016 R 2015 R 2014 R 2013 R4 year
average R3 year
average R2 year
average R2013-2016
2014-2016
2015-2016
Buffels 81.87 18 78.59 17 82.50 19
Duzi 81.66 15 82.17 16 78.88 12 82.20 21 81.23 11 80.90 12 81.92 14
Koedoes 82.26 14
Krokodil 81.60 17 82.65 9 79.72 4 82.70 14 81.67 6 81.32 7 82.13 12
PAN 3400 81.94 11 83.05 5 79.29 7 83.10 7 81.85 4 81.43 6 82.50 6
PAN 3471 82.75 1 83.32 2 79.45 6 83.90 1 82.36 2 81.84 3 83.04 1
PAN 3478 83.90 1
PAN 3489 80.46 1 83.40 4
PAN 3497 82.20 7 83.47 1 80.05 2 83.70 3 82.36 1 81.91 1 82.84 3
PAN 3515 80.96 20 82.18 15 78.81 14 80.65 13 81.57 16
PAN 3623 81.94 11 83.25 3 79.59 5 81.59 4 82.60 5
Renoster 81.12 21
Sabie 81.61 16 81.54 19 78.70 16 82.20 21 81.01 12 80.62 14 81.58 15
SST 806 82.30 6 83.14 4 78.99 9 82.90 10 81.83 5 81.48 5 82.72 4
SST 8125 82.20 7 82.33 12 82.27 11
SST 8134 80.77 23
SST 8135 82.01 10 82.83 8 82.42 7
SST 8154 82.46 5
SST 8155 81.34 19
SST 822 82.30 20
SST 835 82.51 3 82.31 13 78.89 11 82.80 13 81.63 7 81.24 8 82.41 9
SST 843 82.75 1 83.04 6 79.76 3 83.00 8 82.14 3 81.85 2 82.90 2
SST 866 82.50 4 82.34 11 78.84 13 82.60 17 81.57 8 81.23 9 82.42 7
SST 867 82.95 7 78.80 15 83.30 5
SST 875 81.94 11 81.96 17 79.24 8 82.90 10 81.51 10 81.05 11 81.95 13
SST 876 83.30 5
SST 877 81.51 18 81.41 20 77.73 19 82.90 10 80.89 13 80.22 16 81.46 18
SST 884 81.85 14 81.11 22 78.58 18 81.80 23 80.84 14 80.51 15 81.48 17
SST 895 82.20 7 82.38 10 78.91 10 82.60 17 81.52 9 81.16 10 82.29 10
SST 896 81.80 23
Tamboti 83.00 8
Timbavati 82.70 14
Umlazi 82.70 14
Mean 82.01 82.32 79.12 82.84 81.60 81.19 82.25 LSDt(0,05) 0.75 0.68 0.56 0.77 0.35 0.39 0.50
85
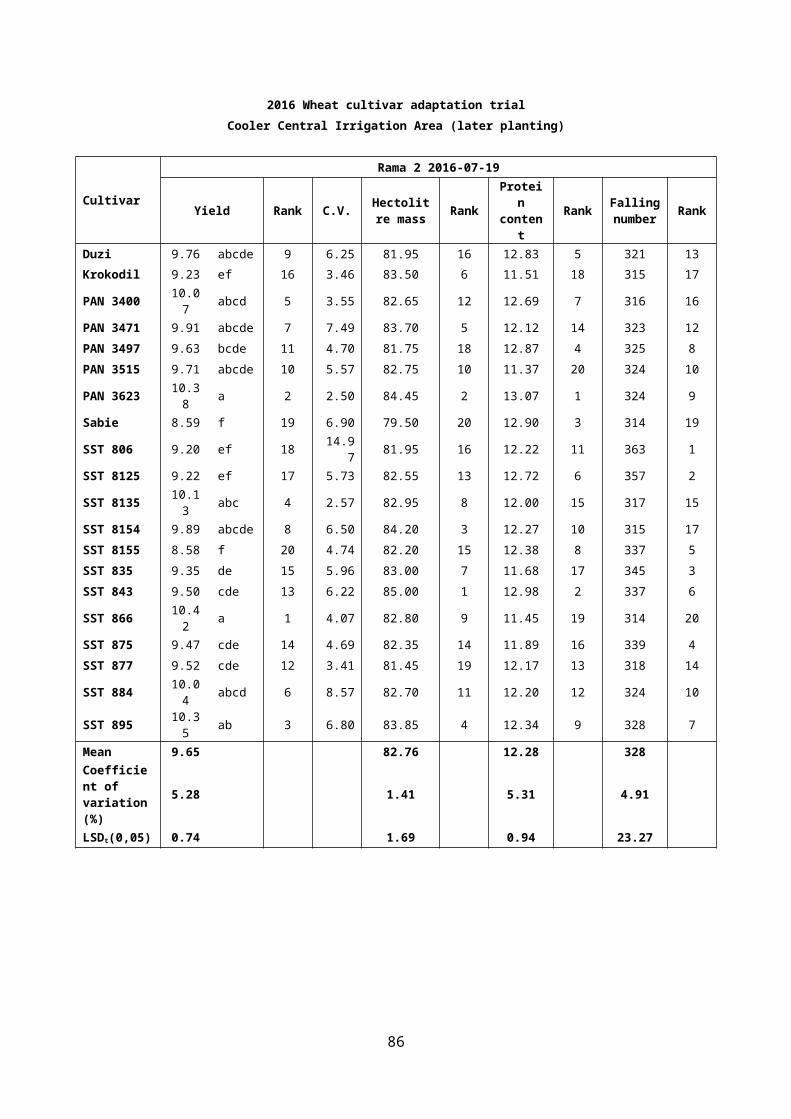
Warmer Northern Irrigation Area (later planting) AMMI AnalysisAnova of the hectolitre mass of entries for 2016
Source Df SS MS F-Value Pr> FTotal 319 538.6 1.689Treatments 79 264.2 3.344 3.21 <0,001Genotypes 19 68.3 3.596 3.45 <0,001Environments 3 63.6 21.201 6.86 <0,001Block 12 37.1 3.092 2.97 <0,001Interactions 57 132.2 2.320 2.23 <0,001IPCA 21 59.7 2.842 2.73 <0,001IPCA 19 43.4 2.284 2.19 0.0036Residuals 17 29.1 1.714 1.65 0.0544Error 228 237.4 1.041
Genotype means and scores for hectolitre mass (kg/hl)
Entry Genotype Hectolitre mass Rank Score1 Duzi 81.66 15 -0.561412 Krokodil 81.60 17 -0.381783 PAN 3400 81.94 11 0.028224 PAN 3471 82.75 1 0.116185 PAN 3497 82.20 7 0.572096 PAN 3515 80.96 20 0.344947 PAN 3623 81.94 11 -0.840398 Sabie 81.61 16 -0.262119 SST 806 82.30 6 0.54504
10 SST 8125 82.20 7 0.4046511 SST 8135 82.01 10 -0.1713912 SST 8154 82.46 5 -0.7092013 SST 8155 81.34 19 -0.0213214 SST 835 82.51 3 0.5287315 SST 843 82.75 1 -0.5843916 SST 866 82.50 4 0.3192217 SST 875 81.94 11 0.3847418 SST 877 81.51 18 0.5052219 SST 884 81.85 14 -0.2162020 SST 895 82.20 7 -0.00082
Mean 82.01 Coefficient of variation (%) 1.30 LSDt(0,05) 0.75
Environment means and scores for hectolitre mass (kg/hl)
Entry Environment Hectolitre mass Rank Score1 Brits JvR 82.75 1 0.771892 Koedoeskop 81.99 2 -1.687593 Makoppa 81.67 3 0.454834 Ohrigstad 81.64 4 0.46087
Mean 82.01 Coefficient of variation (%) 1.30 LSDt(0.05) 0.33
86
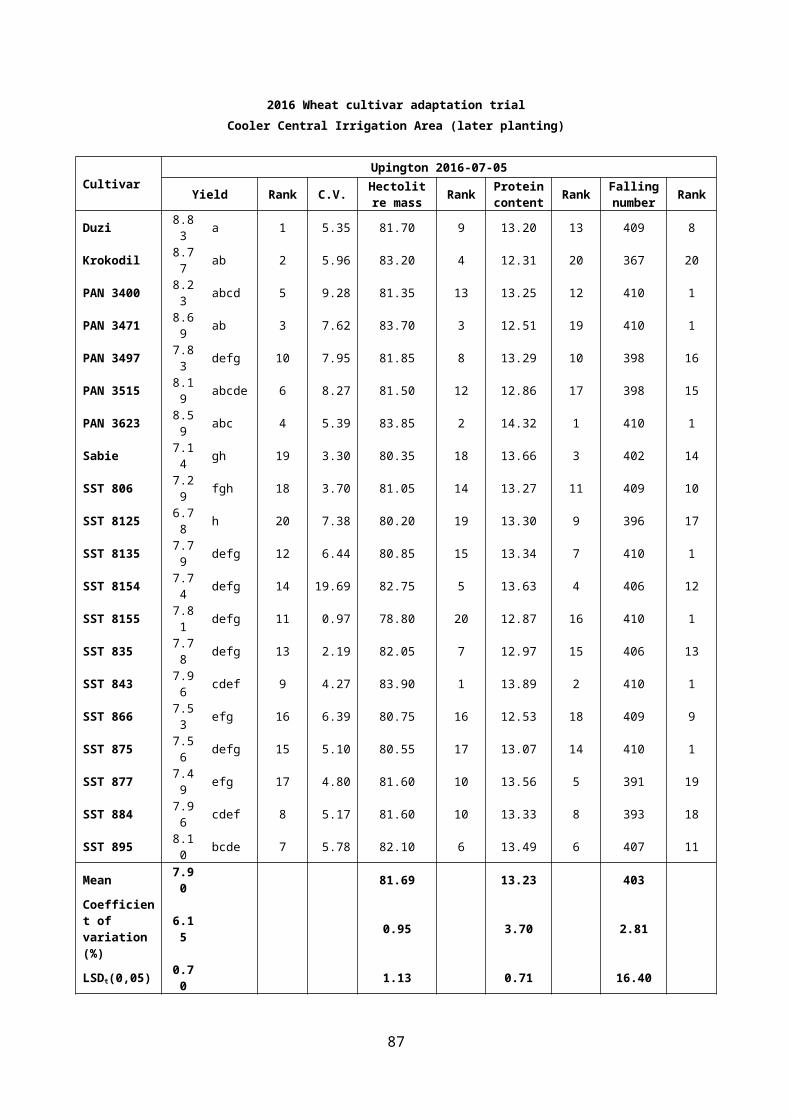
Duzi
Krokodil
PAN 3400PAN 3471
PAN 3497
PAN 3515
PAN 3623
Sabie
SST 806SST 8125
SST 8135
SST 8154
SST 8155
SST 835
SST 843
SST 866SST 875SST 877
SST 884
SST 895
Brits
Koedoeskop
MakoppaOhrigstad
Warmer Northern Irrigation Area - later planting 2016
Hectolitre mass (kg/hl)
IPCA 1 sc
ore1,00
80,94 83,00-2,00
0,50
0,00
-1,50
-0,50
82,01
-1,00
87
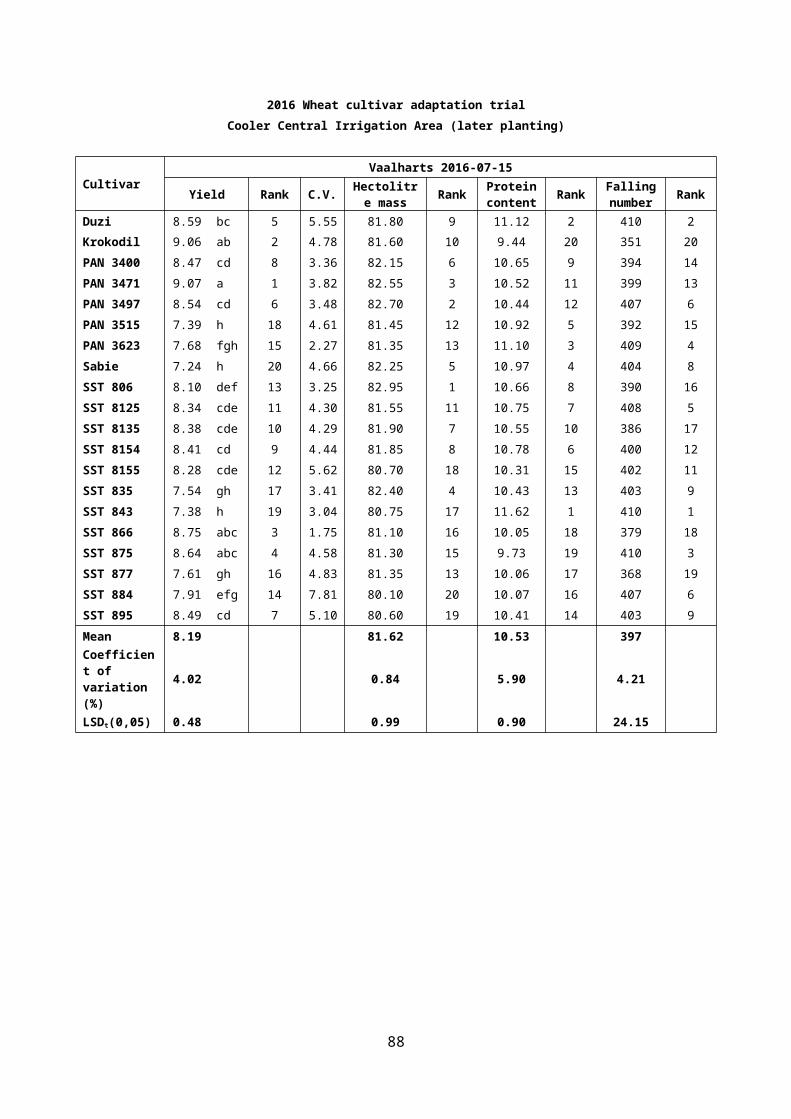
Warmer Northern Irrigation Area (later planting)Average protein content (%) of entries during the full or partial period from 2013- 2016
Cultivar 2016 R 2015 R 2014 R 2013 R4 year
average R3 year
average R2 year
average R2013-2016
2014-2016
2015-2016
Buffels 13.11 3 12.38 8 11.31 5
Duzi 11.93 14 12.78 10 12.41 7 11.24 9 12.09 6 12.37 9 12.36 11
Koedoes 12.85 6
Krokodil 11.48 20 11.75 23 11.42 19 10.60 24 11.31 14 11.55 16 11.62 18
PAN 3400 12.25 5 12.84 7 12.30 9 11.27 6 12.17 3 12.46 5 12.55 5
PAN 3471 12.03 12 12.47 19 11.90 16 11.34 4 11.94 10 12.13 12 12.25 13
PAN 3478 11.25 8
PAN 3489 12.03 13 10.63 23
PAN 3497 12.10 10 12.76 12 12.62 2 10.65 22 12.03 7 12.49 4 12.43 9
PAN 3515 11.71 16 12.11 22 11.89 17 11.90 15 11.91 17
PAN 3623 12.45 2 12.89 5 12.61 3 12.65 2 12.67 2
Renoster 12.46 20
Sabie 12.39 4 12.83 9 12.52 5 11.26 7 12.25 2 12.58 3 12.61 3
SST 806 12.22 6 12.68 14 12.23 11 10.83 18 11.99 8 12.38 8 12.45 8
SST 8125 11.72 15 12.59 17 12.16 14
SST 8134 12.84 7
SST 8135 12.09 11 12.63 16 12.36 8
SST 8154 12.43 3
SST 8155 11.54 19
SST 822 11.73 2
SST 835 12.21 7 12.74 13 12.13 12 10.82 20 11.98 9 12.36 10 12.48 7
SST 843 13.06 1 13.92 1 13.20 1 12.08 1 13.07 1 13.39 1 13.49 1
SST 866 11.70 17 12.51 18 11.82 18 11.02 17 11.76 12 12.01 13 12.11 15
SST 867 13.19 2 12.60 4 10.83 18
SST 875 11.64 18 12.24 21 11.91 15 10.82 20 11.65 13 11.93 14 11.94 16
SST 876 11.15 12
SST 877 12.18 8 12.78 10 12.42 6 11.24 9 12.16 4 12.46 6 12.48 6
SST 884 11.94 13 12.68 14 11.97 14 11.09 15 11.92 11 12.20 11 12.31 12
SST 895 12.18 8 12.92 4 12.26 10 11.07 16 12.11 5 12.45 7 12.55 4
SST 896 11.42 3
Tamboti 11.10 14
Timbavati 11.14 13
Umlazi 11.19 11
Mean 12.06 12.72 12.24 11.13 12.03 12.33 12.37 LSDt(0,05) 0.43 0.36 0.32 0.56 0.20 0.22 0.28
88

Warmer Northern Irrigation Area (later planting) AMMI AnalysisAnova of the protein content of entries for 2016
Source Df SS MS F-Value Pr> FTotal 319 843.4 2.64Treatments 79 750.5 9.50 25.20 <0,001Genotypes 19 43.2 2.27 6.03 <0,001Environments 3 679.5 226.49 392.51 <0,001Block 12 6.9 0.58 1.53 0.1142Interactions 57 27.8 0.49 1.29 0.0972IPCA 21 14.0 0.67 1.76 0.0234IPCA 19 9.1 0.48 1.27 0.2066Residuals 17 4.7 0.28 0.74 0.7603Error 228 86.0 0.38
Genotype means and scores for protein content (%)
Entry Genotype Protein content Rank Score1 Duzi 11.93 14 -0.396452 Krokodil 11.48 20 -0.215493 PAN 3400 12.25 5 -0.103284 PAN 3471 12.03 12 0.057285 PAN 3497 12.10 10 0.028446 PAN 3515 11.71 16 0.121127 PAN 3623 12.45 2 0.353388 Sabie 12.39 4 0.237429 SST 806 12.22 6 0.56231
10 SST 8125 11.72 15 0.1105111 SST 8135 12.09 11 0.2725112 SST 8154 12.43 3 0.0113413 SST 8155 11.54 19 -0.6632614 SST 835 12.21 7 0.2501915 SST 843 13.06 1 -0.4775816 SST 866 11.70 17 0.1810417 SST 875 11.64 18 -0.0384518 SST 877 12.18 8 -0.0794619 SST 884 11.94 13 -0.4650320 SST 895 12.18 8 0.25346
Mean 12.06 Coefficient of variation (%) 5.20 LSDt(0,05) 0.43
Environment means and scores for protein content (%)
Entry Environment Protein content Rank Score1 Brits JvR 13.05 2 -0.106042 Koedoeskop 11.99 3 0.126163 Makoppa 9.72 4 -0.969584 Ohrigstad 13.49 1 0.94946
Mean 12.06 Coefficient of variation (%) 5.20 LSDt(0.05) 0.19
89
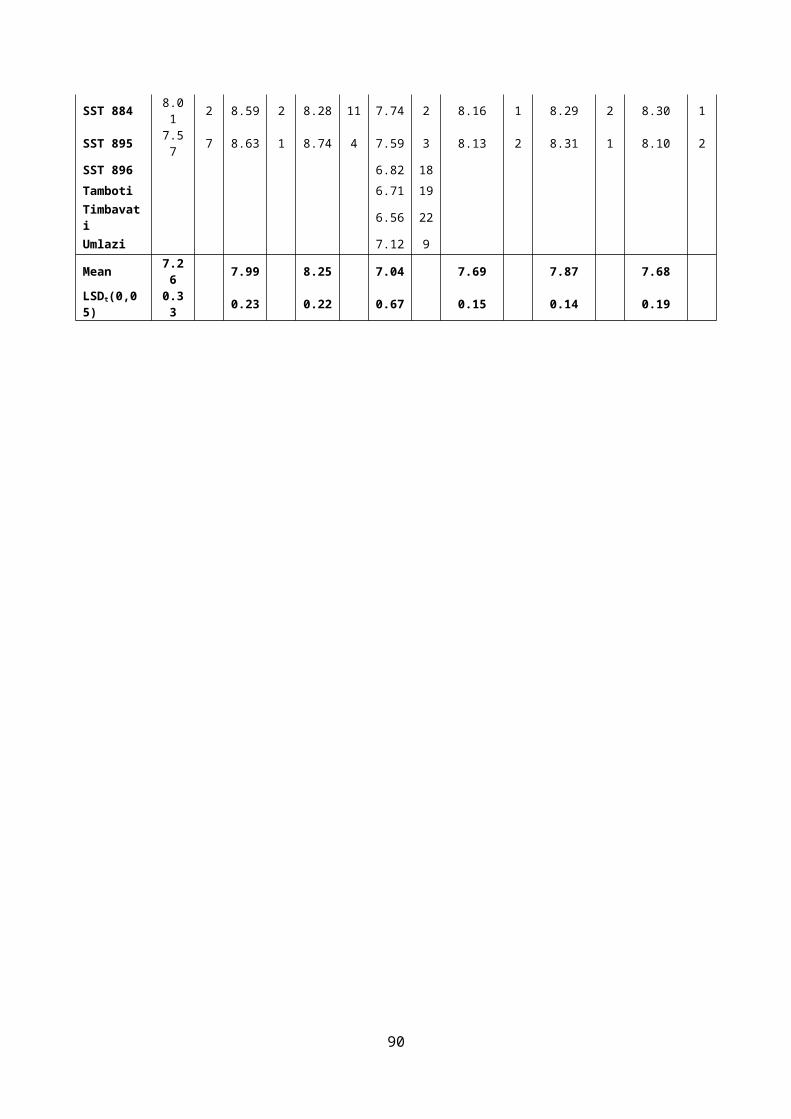
Duzi
KrokodilPAN 3400
PAN 3471PAN 3497PAN 3515
PAN 3623Sabie
SST 806
SST 8125
SST 8135
SST 8154
SST 8155
SST 835
SST 843
SST 866
SST 875SST 877
SST 884
SST 895
Brits
Koedoeskop
Makoppa
Ohrigstad
Warmer Northern Irrigation Area - later planting 2016
Protein content (%)
IPCA 1 sc
ore
1,00
10,00 11,009,67 14,00
1,50
0,50
0,00
-1,50
-0,50
12,06
-1,00
90
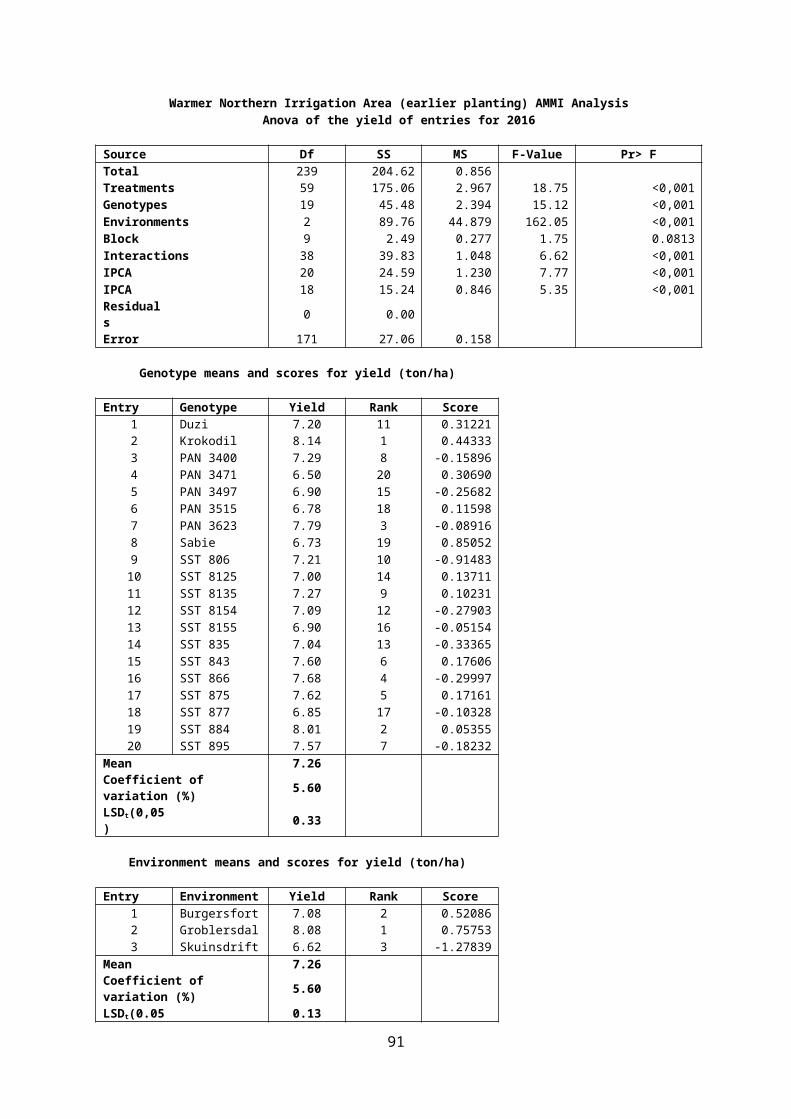
Warmer Northern Irrigation Area (later planting)Average falling number (s) of entries during the full or partial period from 2013- 2016
Cultivar 2016 R 2015 R 2014 R 2013 R4 year
average R3 year
average R2 year
average R2013-2016
2014-2016
2015-2016
Buffels 367 15 356 8 344 14
Duzi 360 9 371 11 350 15 344 16 356 9 360 9 365 7
Koedoes 371 8
Krokodil 323 20 346 23 314 19 314 24 324 14 327 16 334 18
PAN 3400 348 17 367 16 353 11 344 14 353 12 356 13 357 15
PAN 3471 351 16 380 1 345 17 352 11 357 8 358 12 365 8
PAN 3478 345 13
PAN 3489 342 18 358 5
PAN 3497 366 3 361 18 350 14 339 19 354 11 359 10 363 11
PAN 3515 351 15 355 21 355 10 354 14 353 16
PAN 3623 361 6 379 2 353 12 364 3 370 3
Renoster 364 17
Sabie 357 12 360 19 359 3 347 12 356 10 359 11 359 14
SST 806 373 1 369 14 364 1 362 2 367 1 369 1 371 2
SST 8125 369 2 377 3 373 1
SST 8134 374 4
SST 8135 355 13 371 10 363 10
SST 8154 345 18
SST 8155 362 5
SST 822 323 23
SST 835 360 8 371 9 358 4 362 3 363 4 363 5 365 6
SST 843 361 6 373 5 350 15 352 10 359 7 361 7 367 5
SST 866 354 14 373 5 357 5 367 1 363 3 361 8 363 12
SST 867 352 22 357 6 344 17
SST 875 366 4 372 7 355 9 360 4 363 2 364 2 369 4
SST 876 356 6
SST 877 333 19 357 20 352 13 329 22 343 13 347 15 345 17
SST 884 359 10 370 12 356 7 353 8 360 6 362 6 365 9
SST 895 358 11 370 13 362 2 356 7 361 5 363 4 364 10
SST 896 352 9
Tamboti 335 20
Timbavati 335 21
Umlazi 342 18
Mean 356 367 352 346 356 358 362 LSDt(0,05) 12.73 10.12 12.27 14.46 6.30 6.91 8.05
91
Warmer Northern Irrigation Area (later planting) AMMI AnalysisAnova of the falling number of entries for 2016
Source Df SS MS F-Value Pr> FTotal 319 473309 1484Treatments 79 393815 4985 15.03 <0,001Genotypes 19 43256 2277 6.86 <0,001Environments 3 308891 102964 320.04 <0,001Block 12 3861 322 0.97 0.4785Interactions 57 41667 731 2.20 <0,001IPCA 21 33612 1601 4.83 <0,001IPCA 19 5412 285 0.86 0.6347Residuals 17 2643 155 0.47 0.9647Error 228 75633 332
Genotype means and scores for falling number (s)
Entry Genotype Falling number Rank Score1 Duzi 360 9 -1.496162 Krokodil 323 20 -4.070453 PAN 3400 348 17 0.013634 PAN 3471 351 16 -0.097145 PAN 3497 366 3 0.096086 PAN 3515 351 15 -2.104287 PAN 3623 361 6 2.055498 Sabie 357 12 2.778449 SST 806 373 1 -2.85459
10 SST 8125 369 2 -0.4994611 SST 8135 355 13 2.1527612 SST 8154 345 18 1.7131113 SST 8155 362 5 -0.9378314 SST 835 360 8 0.1771615 SST 843 361 6 3.1034416 SST 866 354 14 1.0364417 SST 875 366 4 0.0684218 SST 877 333 19 -4.7250519 SST 884 359 10 2.0305920 SST 895 358 11 1.55939
Mean 356 Coefficient of variation (%) 5.10 LSDt(0,05) 12.73
Environment means and scores for falling number (s)
Entry Environment Falling number Rank Score1 Brits JvR 326 3 -3.452762 Koedoeskop 376 2 6.370783 Makoppa 396 1 2.718464 Ohrigstad 324 4 -5.63647
Mean 356 Coefficient of variation (%) 5.10 LSDt(0.05) 5.69
92
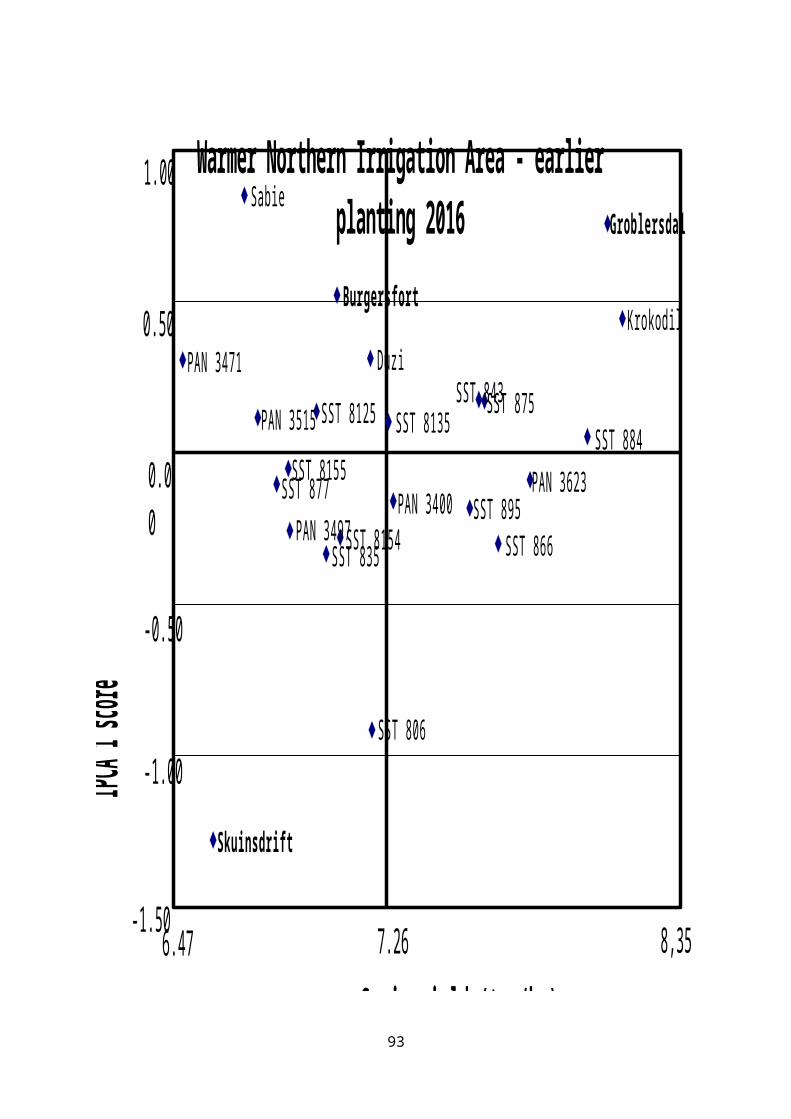
Duzi
Krokodil
PAN 3400PAN 3471 PAN 3497
PAN 3515
PAN 3623Sabie
SST 806
SST 8125
SST 8135SST 8154
SST 8155
SST 835
SST 843
SST 866
SST 875
SST 877
SST 884SST 895
Brits
Koedoeskop
Makoppa
Ohrigstad
Warmer Northern Irrigation Area - later planting 2016
Falling number (s)
IPCA 1 sc
ore
6,00
2,00
-6,00
320 405
8,00
4,00
0,00
-8,00
-2,00
356
-4,00
93
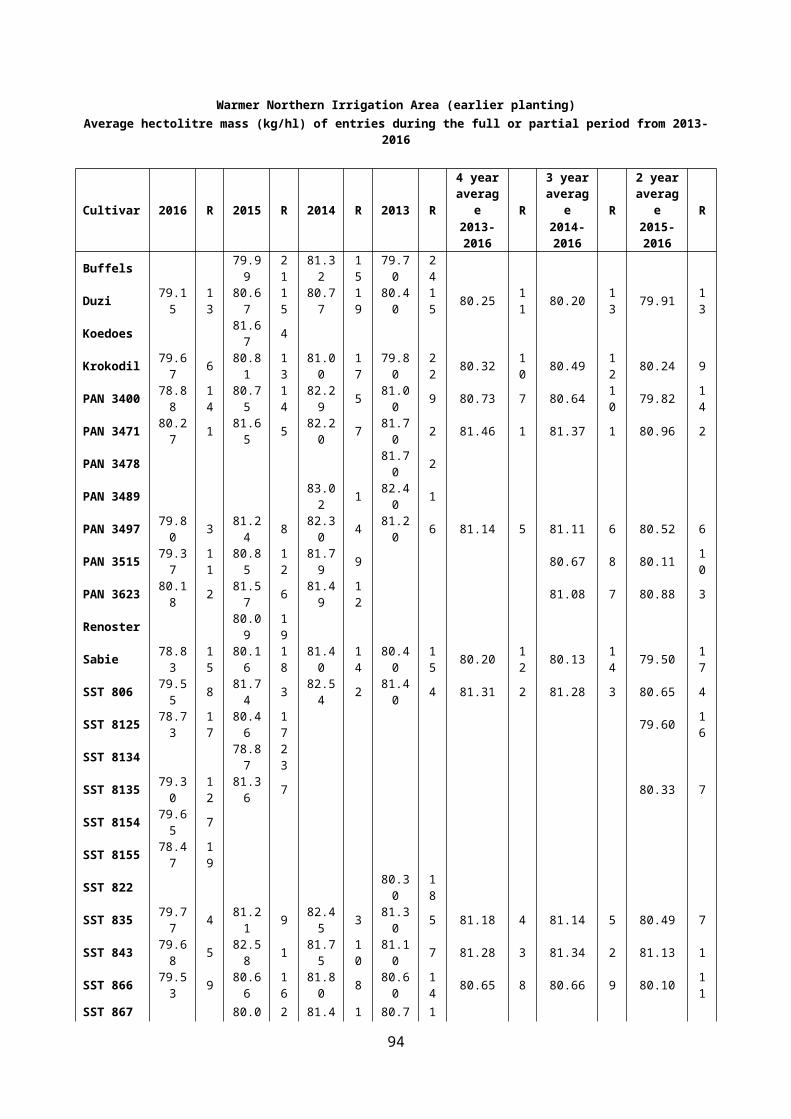
2016 Wheat cultivar adaptation trialWarmer Northern Irrigation Area (later planting)
CultivarBrits (JvR) 2016-06-09
Yield Rank C.V. Hectolitre mass Rank Protein
content Rank Falling number Rank
Duzi 6.55 fgh 15 2.39 82.40 12 13.19 8 331 7
Krokodil 7.11 abcde 8 3.03 82.25 14 12.33 19 317 17
PAN 3400 7.58 a 1 4.00 82.25 14 13.60 6 317 17
PAN 3471 7.22 abcd 5 5.81 84.05 2 12.87 11 330 9
PAN 3497 7.15 abcde 6 3.57 83.65 3 13.00 9 332 5
PAN 3515 6.39 gh 17 6.83 81.25 20 12.60 16 332 5
PAN 3623 6.15 h 19 3.19 82.15 16 13.76 3 319 15
Sabie 7.23 abcd 4 2.62 81.95 18 13.69 4 321 12
SST 806 7.13 abcde 7 3.12 84.10 1 12.81 13 342 1
SST 8125 6.99 cdef 11 4.20 82.95 9 12.23 20 340 2
SST 8135 7.44 abc 3 9.34 82.10 17 12.84 12 316 19
SST 8154 6.70 efg 13 2.75 83.10 7 13.80 2 313 20
SST 8155 6.76 defg 12 5.31 82.75 11 12.45 18 335 4
SST 835 7.02 cdef 10 8.24 83.35 5 13.29 7 331 8
SST 843 5.03 i 20 12.80 82.95 9 14.13 1 326 11
SST 866 6.57 fgh 14 3.91 83.55 4 12.71 14 318 16
SST 875 7.51 ab 2 2.68 83.20 6 12.63 15 338 3
SST 877 6.18 h 18 4.45 83.10 7 13.64 5 321 13
SST 884 6.42 gh 16 3.65 81.45 19 12.59 17 319 14
SST 895 7.02 bcdef 9 4.86 82.40 12 12.90 10 330 10
Mean 6.81 82.75 13.05 326 Coefficient of variation (%)
4.96 1.00 6.52 2.99
LSDt(0,05) 0.49 1.20 1.23 14.11
94

2016 Wheat cultivar adaptation trialWarmer Northern Irrigation Area (later planting)
CultivarKoedoeskop 2016-06-07
Yield Rank C.V. Hectolitre mass Rank Protein
content Rank Falling number Rank
Duzi 8.60 gh 12 5.02 82.65 4 11.64 15 364 17
Krokodil 8.34 hi 13 3.19 82.25 6 11.60 16 322 20
PAN 3400 10.04 a 1 9.14 81.80 12 12.37 4 367 16
PAN 3471 7.58 kl 19 5.84 82.60 5 12.02 10 368 15
PAN 3497 7.85 jk 17 2.99 81.25 18 12.15 6 389 7
PAN 3515 8.19 hij 15 4.36 80.25 20 11.48 18 354 18
PAN 3623 9.92 ab 2 5.12 83.35 3 12.06 9 399 3
Sabie 7.15 l 20 3.45 82.00 10 12.50 2 399 2
SST 806 7.68 k 18 4.32 81.45 14 12.31 5 375 13
SST 8125 8.31 hi 14 3.55 81.45 14 12.01 12 385 9
SST 8135 9.53 bcd 4 1.58 82.20 7 12.07 8 383 10
SST 8154 9.82 abc 3 7.33 83.70 1 12.42 3 387 8
SST 8155 8.83 fg 11 4.64 81.45 14 11.55 17 378 12
SST 835 8.84 fg 10 4.04 81.55 13 12.09 7 378 11
SST 843 9.29 def 6 5.15 83.70 1 12.96 1 401 1
SST 866 9.28 def 7 4.73 81.95 11 11.39 19 375 14
SST 875 7.97 ijk 16 4.10 81.30 17 11.83 14 390 6
SST 877 8.95 efg 9 4.58 80.70 19 11.96 13 328 19
SST 884 9.40 cde 5 2.69 82.05 9 11.30 20 393 5
SST 895 9.27 def 8 5.14 82.10 8 12.02 10 394 4
Mean 8.74 81.99 11.99 376 Coefficient of variation (%)
3.65 1.03 3.83 6.57
LSDt(0,05) 0.46 1.23 0.66 35.74
95
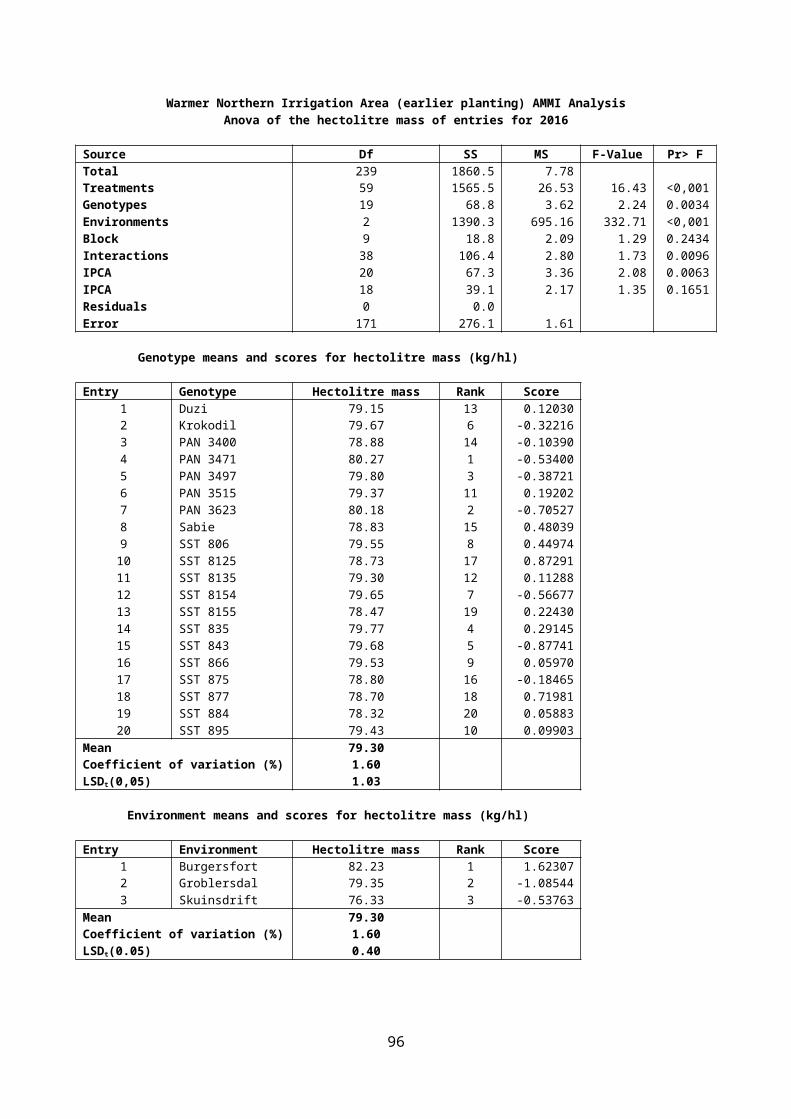
2016 Wheat cultivar adaptation trialWarmer Northern Irrigation Area (later planting)
CultivarOhrigstad 2016-06-02
Yield Rank C.V. Hectolitre mass Rank Protein
content Rank Falling number Rank
Duzi 8.22 abc 4 5.30 81.05 15 12.98 17 337 5
Krokodil 7.15 ef 16 8.93 80.75 16 12.65 19 310 17
PAN 3400 7.72 abcde 7 4.66 81.70 11 13.30 15 318 12
PAN 3471 8.15 abcd 5 3.77 82.50 3 13.55 9 312 15
PAN 3497 7.12 ef 18 10.11 81.90 9 13.52 10 338 3
PAN 3515 7.36 cdef 13 10.38 80.65 17 13.39 13 327 8
PAN 3623 8.34 a 1 5.59 81.20 13 14.26 2 325 10
Sabie 6.93 ef 19 13.06 80.60 18 13.81 7 310 16
SST 806 7.37 cdef 12 10.53 81.80 10 14.28 1 366 1
SST 8125 8.25 ab 3 8.13 82.50 3 13.27 16 342 2
SST 8135 7.44 bcdef 10 8.68 81.20 13 13.86 5 310 18
SST 8154 7.14 ef 17 2.26 81.25 12 13.66 8 307 20
SST 8155 7.39 bcdef 11 10.56 80.35 19 12.30 20 338 4
SST 835 7.22 ef 15 4.31 82.20 8 13.86 5 326 9
SST 843 7.74 abcde 6 17.22 82.35 7 14.00 4 309 19
SST 866 7.33 def 14 13.83 83.35 1 13.42 11 316 14
SST 875 7.70 abcde 8 11.05 82.50 3 12.88 18 335 6
SST 877 6.68 f 20 5.19 80.00 20 13.40 12 330 7
SST 884 7.69 abcde 9 6.12 82.40 6 13.39 13 320 11
SST 895 8.33 a 2 12.95 82.60 2 14.02 3 316 13
Mean 7.56 81.64 13.49 324 Coefficient of variation (%)
7.94 1.07 4.82 6.36
LSDt(0,05) 0.87 1.27 0.94 29.85
96
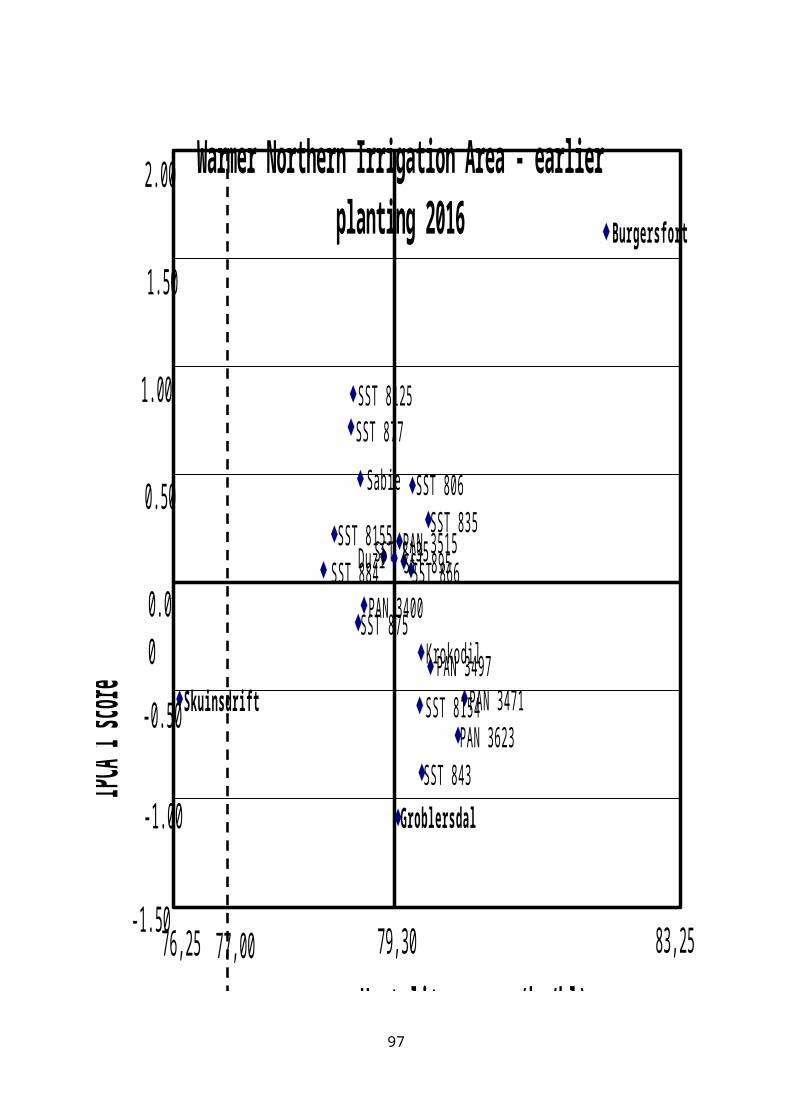
2016 Wheat cultivar adaptation trialWarmer Northern Irrigation Area (later planting)
CultivarMakoppa 2016-06-10
Yield Rank C.V. Hectolitre mass Rank Protein
content Rank Falling number Rank
Duzi 8.07 a 1 15.64 80.55 20 9.93 3 407 5
Krokodil 7.18 bcd 14 3.29 81.15 15 9.34 18 343 20
PAN 3400 7.54 abcd 4 3.20 82.00 4 9.73 8 392 16
PAN 3471 7.73 ab 2 6.88 81.85 9 9.70 11 392 15
PAN 3497 7.39 bcd 7 4.37 82.00 4 9.72 10 406 6
PAN 3515 7.31 bcd 10 2.59 81.70 12 9.37 17 391 17
PAN 3623 7.58 abc 3 6.84 81.05 17 9.73 7 404 10
Sabie 7.19 bcd 13 3.44 81.90 7 9.57 14 400 12
SST 806 7.38 bcd 8 6.77 81.85 9 9.48 15 410 1
SST 8125 7.44 bcd 6 1.55 81.90 7 9.38 16 410 1
SST 8135 6.45 f 19 4.12 82.55 2 9.60 12 410 1
SST 8154 7.36 bcd 9 5.09 81.80 11 9.84 5 375 18
SST 8155 7.21 bcd 12 2.64 80.80 18 9.85 4 398 13
SST 835 7.21 bcd 11 2.43 82.95 1 9.59 13 405 9
SST 843 5.70 g 20 7.02 82.00 4 11.15 1 410 1
SST 866 6.50 f 18 6.35 81.15 15 9.27 19 406 7
SST 875 6.61 ef 17 5.34 80.75 19 9.23 20 402 11
SST 877 7.12 cde 15 4.73 82.25 3 9.72 9 353 19
SST 884 7.01 def 16 7.93 81.50 14 10.49 2 406 7
SST 895 7.50 bcd 5 4.19 81.70 12 9.77 6 394 14
Mean 7.17 81.67 9.72 396 Coefficient of variation (%)
5.43 0.83 3.59 4.30
LSDt(0,05) 0.56 0.98 0.50 24.61
97

Highveld Irrigation Area (earlier planting)
Average yield (ton/ha) of entries during the full or partial period from 2014- 2016
Cultivar 2016 R 2015 R 2014 R3 year
average R2 year
average R2014- 2016
2015-2016
Buffels 6.95 23 7.51 19
Duzi 6.67 17 8.17 19 8.25 10 7.70 15 7.42 17
Koedoes 8.25 18
Krokodil 6.85 15 8.66 10 8.43 5 7.98 8 7.75 13
PAN 3400 7.33 4 8.36 16 8.19 13 7.96 9 7.84 10
PAN 3471 7.34 3 8.48 15 8.32 8 8.05 5 7.91 5
PAN 3489 8.47 3
PAN 3497 8.38 1 9.51 1 8.25 9 8.71 1 8.94 1
PAN 3515 7.24 6 8.50 14 7.83 16 7.86 11 7.87 7
PAN 3623 6.94 12 9.02 4 8.13 14 8.03 6 7.98 4
Renoster 8.76 8
Sabie 6.89 13 8.10 21 8.10 15 7.70 14 7.50 15
SST 806 7.17 7 8.54 13 8.32 7 8.01 7 7.86 8
SST 8125 7.31 5 8.31 17 7.81 11
SST 8134 9.26 2
SST 8135 7.10 9 8.98 5 8.04 3
SST 8154 6.83 16
SST 8155 7.15 8
SST 835 7.40 2 8.82 7 8.47 3 8.23 2 8.11 2
SST 843 6.64 19 8.12 20 7.73 17 7.50 16 7.38 18
SST 866 6.43 20 8.64 11 8.24 12 7.77 13 7.53 14
SST 867 8.88 6 7.65 18
SST 875 7.05 10 8.72 9 8.76 2 8.18 4 7.89 6
SST 877 6.99 11 8.62 12 8.25 10 7.95 10 7.80 12
SST 884 6.66 18 9.03 3 8.86 1 8.18 3 7.85 9
SST 895 6.89 14 8.05 22 8.38 6 7.78 12 7.47 16
Mean 7.06 8.55 8.22 7.97 7.83
LSDt(0,05) 0.36 0.26 0.24 0.16 0.22
Due to unforeseen circumstances no trials were processed for the Highveld earlier planting dates in 2013
98
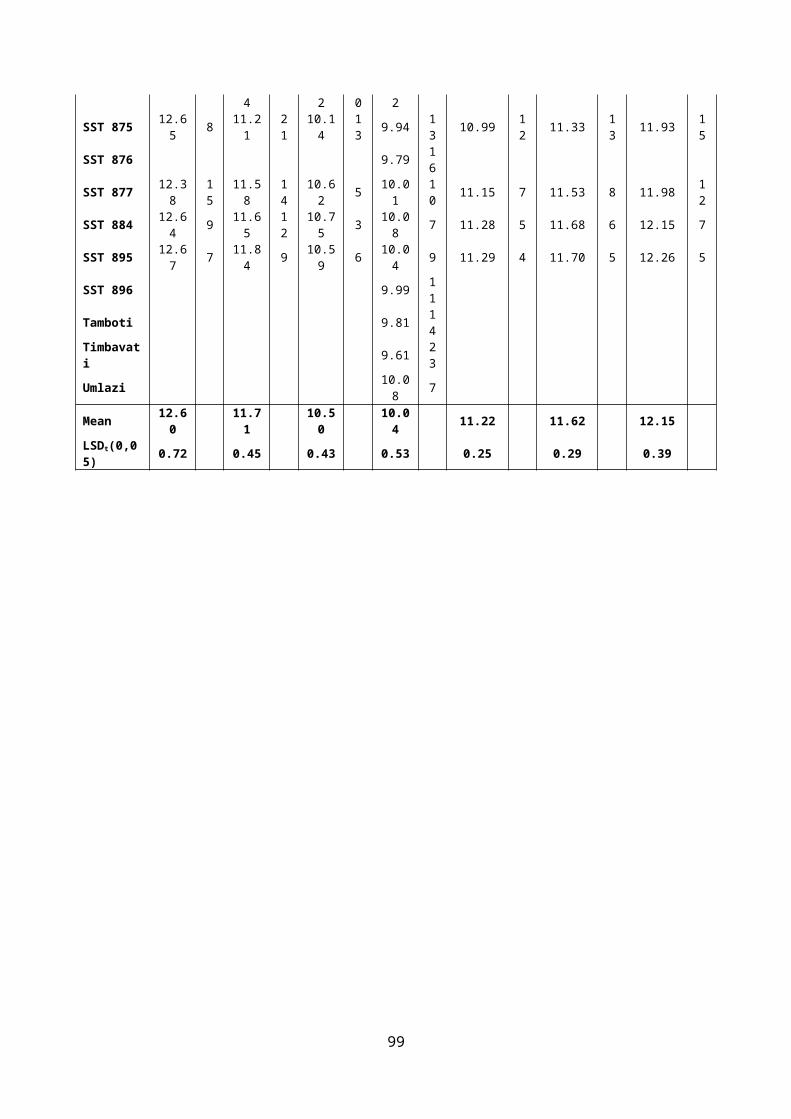
Highveld Irrigation Area (earlier planting) AMMI AnalysisAnova of the yield of entries for 2016
Source Df SS MS F-Value Pr> FTotal 239 407.0 1.70Treatments 59 371.1 6.29 36.00 <0,001Genotypes 19 38.5 2.02 11.59 <0,001Environments 2 292.1 146.06 216.89 <0,001Block 9 6.1 0.67 3.85 <0,001Interactions 38 40.5 1.07 6.10 <0,001IPCA 20 28.5 1.43 8.16 <0,001IPCA 18 12.0 0.67 3.81 <0,001Residuals 0 0.0Error 171 29.9 0.17
Genotype means and scores for yield (ton/ha)
Entry Genotype Yield Rank Score1 Duzi 6.67 17 0.063122 Krokodil 6.85 15 0.275603 PAN 3400 7.33 4 -0.227454 PAN 3471 7.34 3 0.203975 PAN 3497 8.38 1 -0.637286 PAN 3515 7.24 6 -0.335447 PAN 3623 6.94 12 0.475148 Sabie 6.89 13 -0.874759 SST 806 7.17 7 0.13357
10 SST 8125 7.31 5 0.5024011 SST 8135 7.10 9 0.2894012 SST 8154 6.83 16 -0.1069513 SST 8155 7.15 8 -0.1545814 SST 835 7.40 2 -0.0036615 SST 843 6.64 19 -0.4896716 SST 866 6.43 20 0.2056817 SST 875 7.05 10 0.3450218 SST 877 6.99 11 -0.1189619 SST 884 6.66 18 0.4260520 SST 895 6.89 14 0.02879
Mean 7.06 Coefficient of variation (%) 6.20 LSDt(0,05) 0.36
Environment means and scores for yield (ton/ha)
Entry Environment Yield Rank Score1 Clarens 6.59 2 -1.177042 Villiers 8.59 1 1.132443 Welkom 6.01 3 0.04461
Mean 7.06 Coefficient of variation (%) 6.20 LSDt(0.05) 0.14
99
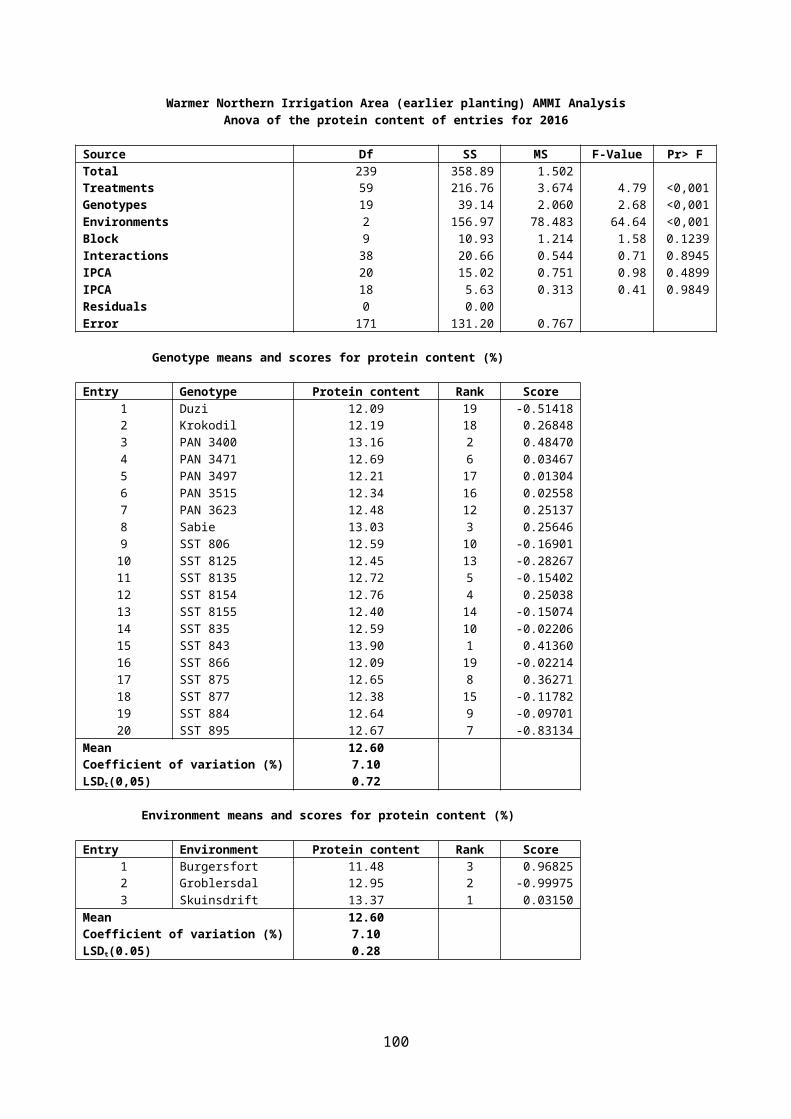
Duzi
Krokodil
PAN 3400
PAN 3471
PAN 3497
PAN 3515
PAN 3623
SST 895
SST 806
SST 8125
SST 8135
SST 8154SST 8155
SST 835
SST 843
SST 866SST 875
SST 877
SST 884
Sabie
Clarens
Villiers
Welkom
Highveld Irrigation Area - earlier planting 2016
Grain yield (ton/ha)
IPCA 1 sc
ore
1.00
0.50
0.00
-1.50
-0.50
5.95 8.857,06
-1.00
1.50
100
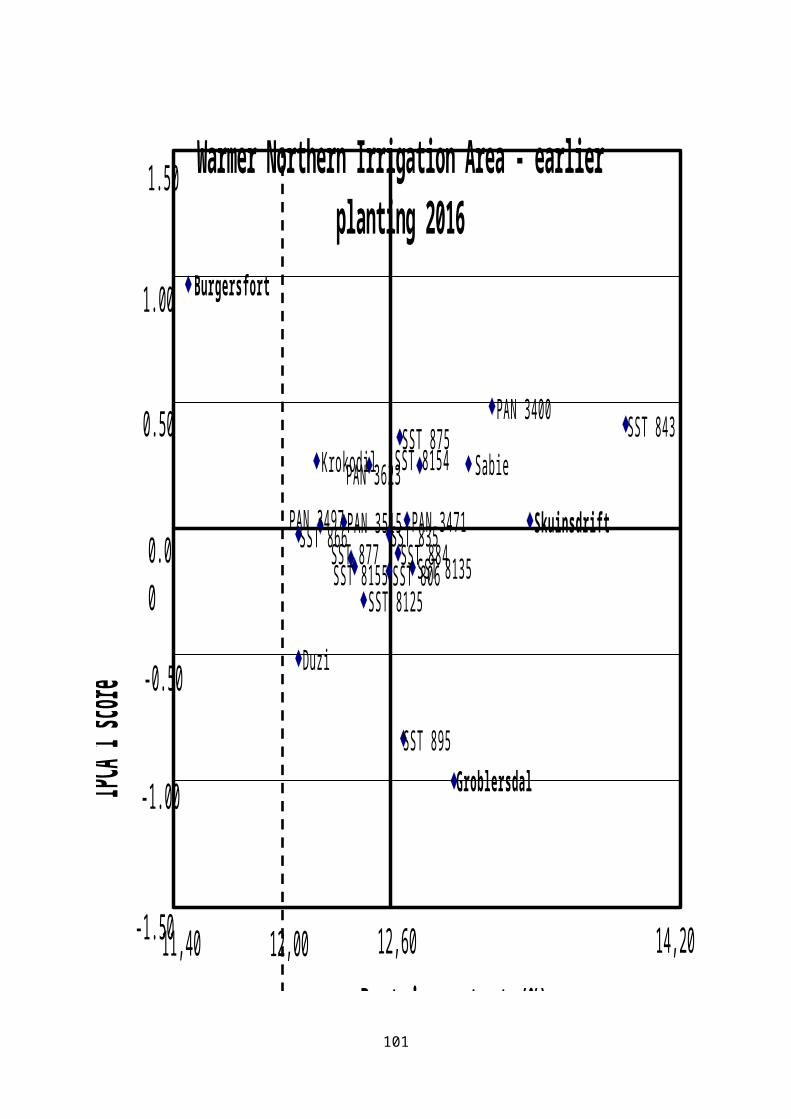
Highveld Irrigation Area (earlier planting)
Average hectolitre mass (kg/hl) of entries during the full or partial period from 2014- 2016
Cultivar 2016 R 2015 R 2014 R3 year average
R2 year average
R2014- 2016 2015-2016
Buffels 81.64 20 80.61 19
Duzi 81.28 12 80.88 23 81.15 16 81.10 16 81.08 18
Koedoes 83.47 14
Krokodil 80.69 16 83.19 16 81.01 18 81.63 12 81.94 13
PAN 3400 81.44 10 82.91 18 81.40 13 81.92 10 82.18 12
PAN 3471 82.31 2 84.40 5 82.54 2 83.08 3 83.36 4
PAN 3489 82.99 1
PAN 3497 83.33 1 83.72 11 82.22 6 83.09 2 83.53 2
PAN 3515 81.17 14 83.68 12 81.67 10 82.17 8 82.43 10
PAN 3623 80.11 18 84.50 4 81.90 9 82.17 9 82.31 11
Renoster 81.59 21
Sabie 81.78 6 81.47 22 81.23 15 81.49 15 81.63 16
SST 806 82.28 3 84.79 2 82.39 4 83.15 1 83.54 1
SST 8125 81.25 13 83.92 8 82.59 9
SST 8134 83.05 17
SST 8135 82.17 4 84.51 3 83.34 5
SST 8154 81.81 5
SST 8155 80.66 17
SST 835 81.56 9 84.36 6 82.06 7 82.66 5 82.96 6
SST 843 81.75 7 85.01 1 82.43 3 83.06 4 83.38 3
SST 866 81.09 15 82.41 19 81.54 11 81.68 11 81.75 14
SST 867 83.66 13 81.13 17
SST 875 81.62 8 83.85 9 82.05 8 82.51 7 82.74 7
SST 877 79.91 19 83.28 15 81.32 14 81.50 14 81.60 17
SST 884 79.60 20 83.77 10 81.48 12 81.62 13 81.69 15
SST 895 81.40 11 83.99 7 82.30 5 82.56 6 82.70 8
Mean 81.36 83.39 81.76 82.21 82.48
LSDt(0,05) 0.82 1.39 0.68 0.55 0.84
Due to unforeseen circumstances no trials were processed for the Highveld earlier planting dates in 2013
101

Highveld Irrigation Area (earlier planting) AMMI AnalysisAnova of the hectolitre mass of entries for 2016
Source Df SS MS F-Value Pr> FTotal 239 535.7 2.241Treatments 59 352.2 5.970 6.10 <0,001Genotypes 19 176.8 9.307 9.52 <0,001Environments 2 67.7 33.827 18.75 <0,001Block 9 16.2 1.805 1.85 0.0634Interactions 38 107.7 2.835 2.90 <0,001IPCA 20 77.5 3.875 3.96 <0,001IPCA 18 30.3 1.681 1.72 0.0401Residuals 0 0.0Error 171 167.2 0.978
Genotype means and scores for hectolitre mass (kg/hl)
Entry Genotype Hectolitre mass Rank Score1 Duzi 81.28 12 -0.329322 Krokodil 80.69 16 0.145963 PAN 3400 81.44 10 -0.463384 PAN 3471 82.31 2 -0.200855 PAN 3497 83.33 1 -0.885306 PAN 3515 81.17 14 -0.168787 PAN 3623 80.11 18 1.008978 Sabie 81.78 6 -0.791449 SST 806 82.28 3 0.01955
10 SST 8125 81.25 13 0.0792211 SST 8135 82.17 4 0.0834312 SST 8154 81.81 5 0.3404413 SST 8155 80.66 17 -0.1151014 SST 835 81.56 9 0.2278615 SST 843 81.75 7 0.4009716 SST 866 81.09 15 0.0298817 SST 875 81.62 8 -0.3235618 SST 877 79.91 19 -0.2571719 SST 884 79.60 20 0.9958120 SST 895 81.40 11 0.20280
Mean 81.36 Coefficient of variation (%) 1.20 LSDt(0,05) 0.82
Environment means and scores for hectolitre mass (kg/hl)
Entry Environment Hectolitre mass Rank Score1 Clarens 80.65 3 -1.602632 Villiers 81.49 2 1.325143 Welkom 81.93 1 0.27749
Mean 81.36 Coefficient of variation (%) 1.20 LSDt(0.05) 0.32
102
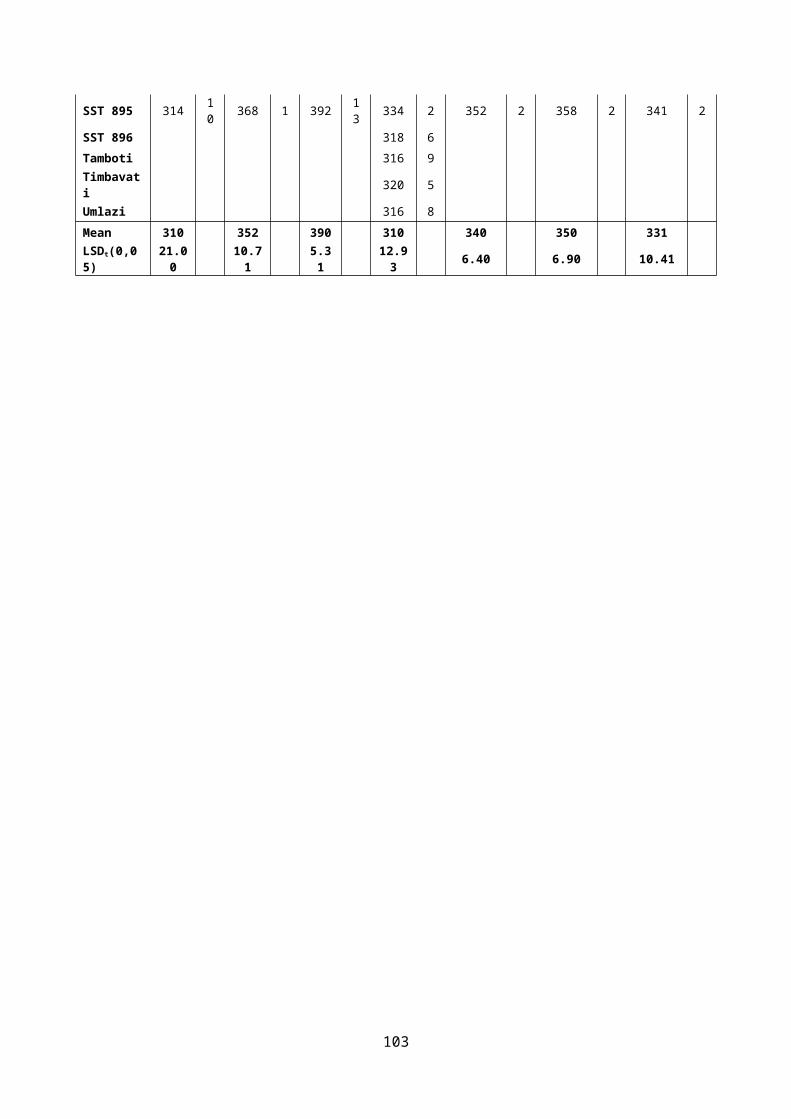
Duzi
Krokodil
PAN 3400
PAN 3471
PAN 3497
PAN 3515
PAN 3623
SST 895
SST 806SST 8125 SST 8135
SST 8154
SST 8155
SST 835SST 843
SST 866
SST 875SST 877
SST 884
Sabie
Clarens
Villiers
Welkom
Highveld Irrigation Areas - earlier planting 2016
Hectollitre mass (kg/hl)
IPCA 1 sc
ore
1.00
0.50
0.00
-1.50
-0.50
79.55 83.8581,36
-1.00
1.50 2.00
-2.00
103
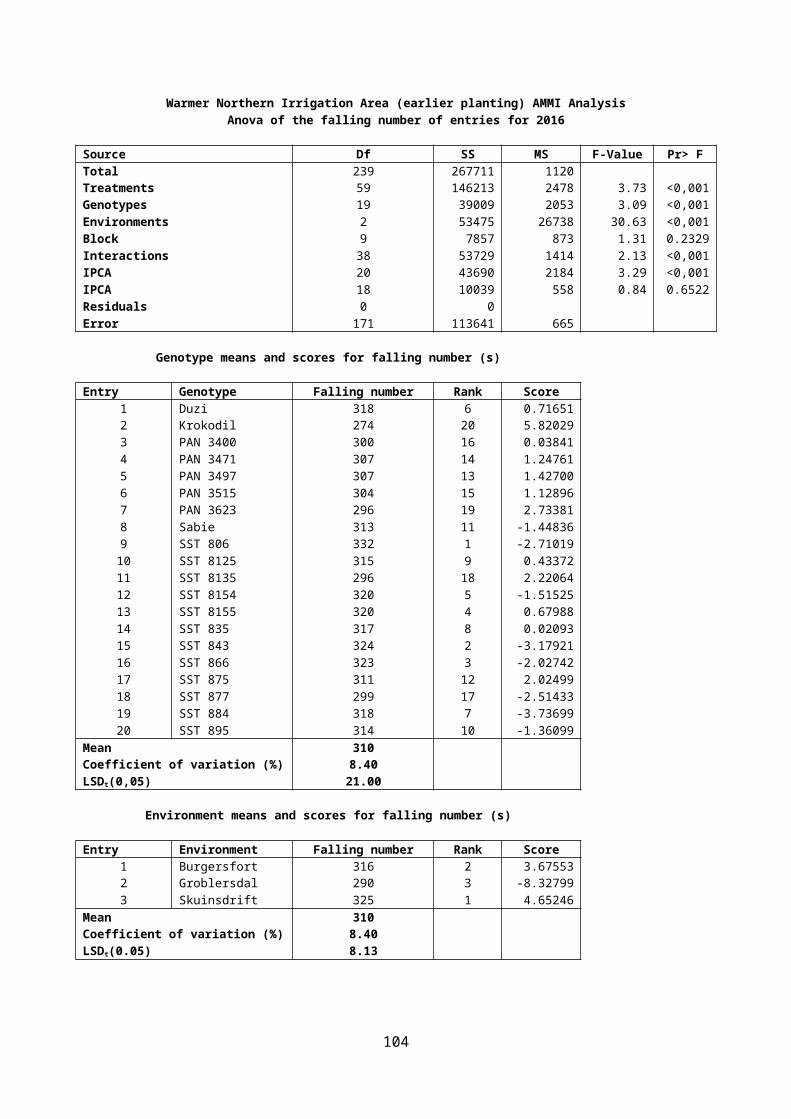
Highveld Irrigation Area (earlier planting)
Average protein content (%) of entries during the full or partial period from 2014- 2016
Cultivar 2016 R 2015 R 2014 R3 year average
R2 year average
R2014- 2016 2015-2016
Buffels 11.64 7 12.44 5
Duzi 13.49 10 11.38 16 12.22 9 12.36 10 12.44 10
Koedoes 11.61 9
Krokodil 12.56 20 10.73 23 11.65 19 11.65 16 11.65 18
PAN 3400 13.25 14 11.60 10 12.27 7 12.37 8 12.43 11
PAN 3471 13.23 15 11.25 19 12.18 13 12.22 11 12.24 16
PAN 3489 11.91 18
PAN 3497 12.79 18 11.73 6 12.10 15 12.21 12 12.26 14
PAN 3515 13.05 17 11.30 18 12.25 8 12.20 13 12.18 17
PAN 3623 13.95 2 12.08 3 12.50 2 12.84 2 13.02 2
Renoster 11.56 12
Sabie 13.53 9 11.87 4 12.18 13 12.53 4 12.70 4
SST 806 13.56 8 11.62 8 12.20 11 12.46 6 12.59 5
SST 8125 13.42 11 11.14 22 12.28 12
SST 8134 11.86 5
SST 8135 13.36 12 11.58 11 12.47 8
SST 8154 13.92 3
SST 8155 12.72 19
SST 835 13.36 12 11.18 20 11.95 16 12.16 14 12.27 13
SST 843 15.07 1 13.45 1 13.27 1 13.93 1 14.26 1
SST 866 13.72 5 11.18 20 12.22 9 12.37 9 12.45 9
SST 867 11.45 14 12.45 3
SST 875 13.11 16 11.41 15 11.92 17 12.15 15 12.26 14
SST 877 13.79 4 11.35 17 12.20 11 12.45 7 12.57 6
SST 884 13.62 6 11.52 13 12.32 6 12.49 5 12.57 6
SST 895 13.61 7 12.20 2 12.45 3 12.75 3 12.91 3
Mean 13.46 11.60 12.25 12.45 12.53
LSDt(0,05) 0.43 0.60 0.43 0.29 0.37
Due to unforeseen circumstances no trials were processed for the Highveld earlier planting dates in 2013
104
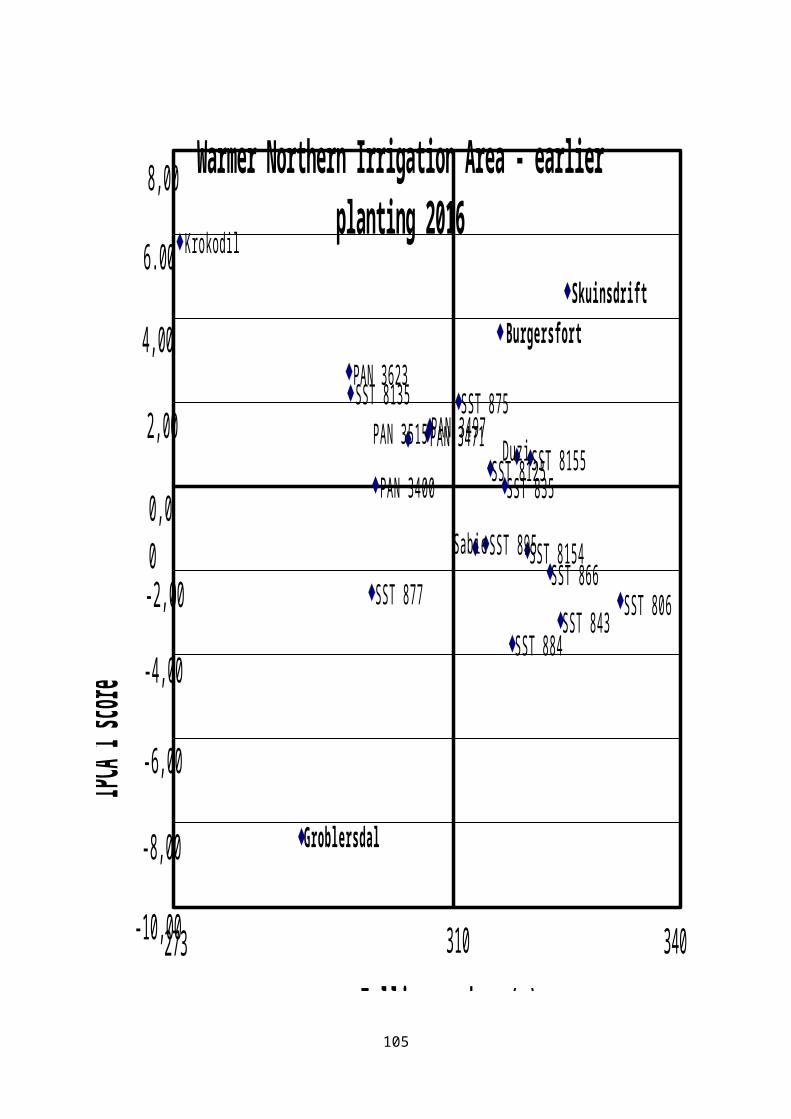
Highveld Irrigation Area (earlier planting) AMMI AnalysisAnova of the protein content of entries for 2016
Source Df SS MS F-Value Pr> FTotal 239 244.84 1.024Treatments 59 193.33 3.277 12.44 <0,001Genotypes 19 66.11 3.479 13.21 <0,001Environments 2 107.14 53.568 74.55 <0,001Block 9 6.47 0.719 2.73 0.0054Interactions 38 20.08 0.528 2.01 0.0014IPCA 20 15.75 0.787 2.99 <0,001IPCA 18 4.34 0.241 0.91 0.5619Residuals 0 0.00Error 171 45.05 0.263
Genotype means and scores for protein content (%)
Entry Genotype Protein content Rank Score1 Duzi 13.49 10 -0.137592 Krokodil 12.56 20 0.090603 PAN 3400 13.25 14 0.526364 PAN 3471 13.23 15 0.042855 PAN 3497 12.79 18 0.721476 PAN 3515 13.05 17 0.111707 PAN 3623 13.95 2 -0.217298 Sabie 13.53 9 0.449999 SST 806 13.56 8 -0.14320
10 SST 8125 13.42 11 -0.0001111 SST 8135 13.36 12 0.0172512 SST 8154 13.92 3 -0.0830313 SST 8155 12.72 19 0.0992914 SST 835 13.36 12 0.1158815 SST 843 15.07 1 -0.1505016 SST 866 13.72 5 -0.6313517 SST 875 13.11 16 0.1204618 SST 877 13.79 4 -0.0749819 SST 884 13.62 6 -0.5612720 SST 895 13.61 7 -0.29653
Mean 13.46 Coefficient of variation (%) 4.00 LSDt(0,05) 0.43
Environment means and scores for protein content (%)
Entry Environment Protein content Rank Score1 Clarens 13.60 2 -1.075662 Villiers 12.58 3 0.890323 Welkom 14.19 1 0.18534
Mean 13.46 Coefficient of variation (%) 4.00 LSDt(0.05) 0.17
105
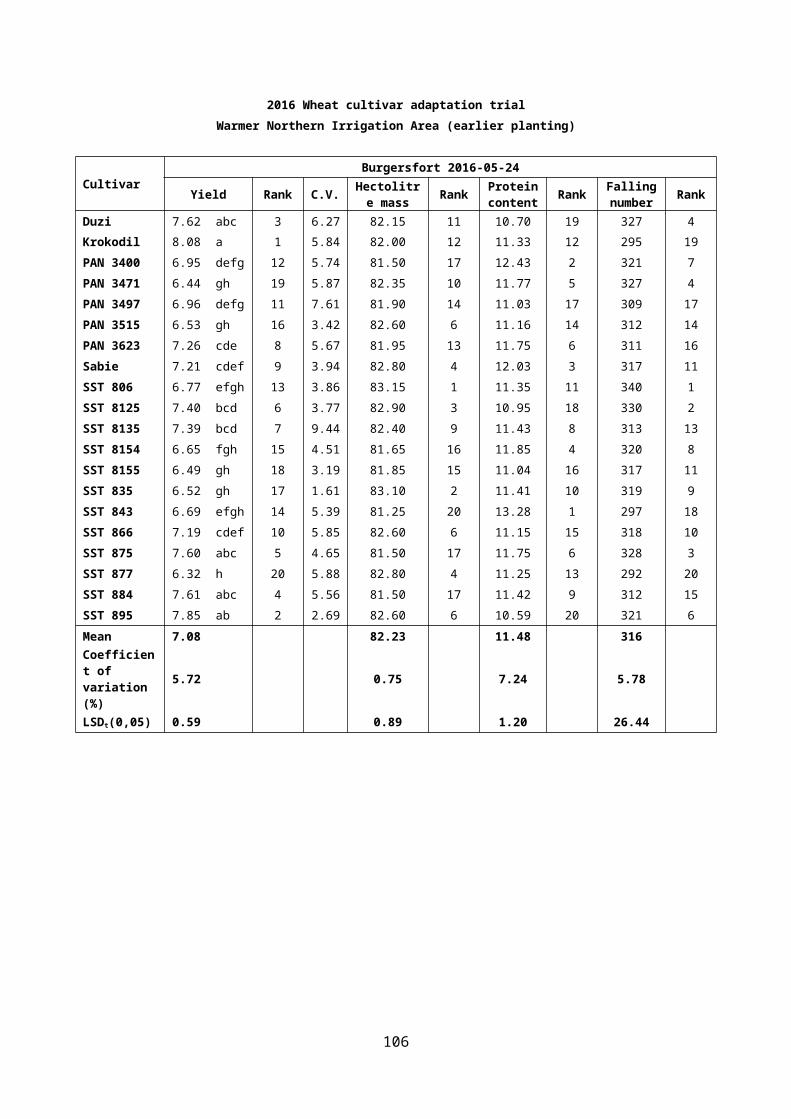
DuziKrokodil
PAN 3400
PAN 3471
PAN 3497
PAN 3515
PAN 3623
SST 895
SST 806SST 8125SST 8135
SST 8154SST 8155 SST 835
SST 843
SST 866
SST 875
SST 877
SST 884
Sabie
Clarens
Villiers
Welkom
Highveld Irrigation Area - earlier planting 2016
Protein content (%)
IPCA 1 sc
ore
1.00
0.50
0.00
-1.50
-0.50
12,50 15,4013,46
-1.00
1.502.00
-2.00
106
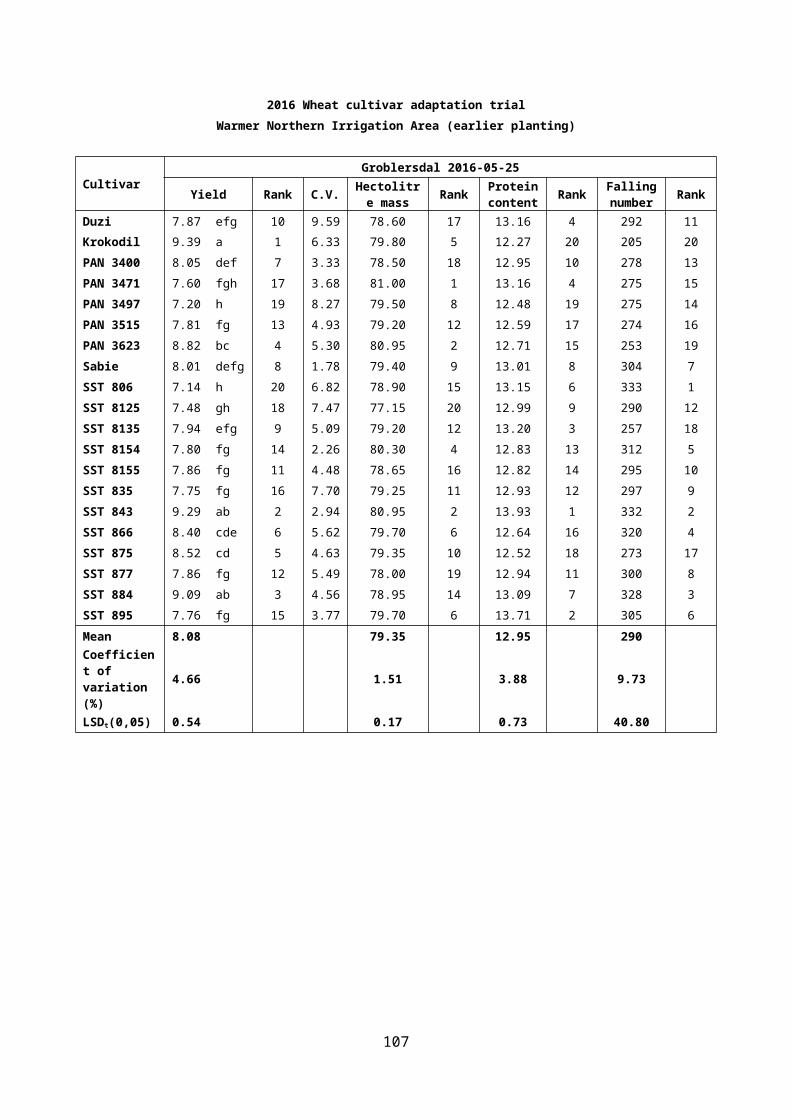
Highveld Irrigation Area (earlier planting)Average falling number (s) of entries during the full or partial period from 2014- 2016
Cultivar 2016 R 2015 R 2014 R3 year average
R2 year average
R2014- 2016 2015-2016
Buffels 325 12 352 10
Duzi 281 18 311 20 334 18 309 14 296 16
Koedoes 331 6
Krokodil 239 19 305 22 329 19 291 16 272 18
PAN 3400 320 7 303 23 354 9 326 9 311 11
PAN 3471 304 12 310 21 356 5 323 12 307 14
PAN 3489 344 15
PAN 3497 317 8 325 12 346 12 330 7 321 7
PAN 3515 284 17 316 17 336 17 312 13 300 15
PAN 3623 238 20 325 11 344 14 303 15 282 17
Renoster 313 19
Sabie 303 14 329 7 343 16 325 10 316 10
SST 806 340 1 338 2 349 11 343 2 339 1
SST 8125 315 10 324 14 320 8
SST 8134 316 18
SST 8135 299 15 319 15 309 12
SST 8154 311 11
SST 8155 303 13
SST 835 321 5 337 4 359 3 339 4 329 4
SST 843 321 6 331 5 355 7 336 6 326 6
SST 866 328 3 326 10 362 1 339 5 327 5
SST 867 328 8 356 4
SST 875 326 4 337 3 355 6 339 3 331 3
SST 877 317 9 319 16 345 13 327 8 318 9
SST 884 288 16 327 9 354 8 323 11 308 13
SST 895 333 2 342 1 360 2 345 1 337 2
Mean 304 323 349 325 314 LSDt(0,05) 26.73 16.47 16.27 11.41 15.69 Due to unforeseen circumstances no trials were processed for the Highveld earlier planting dates in 2013
107
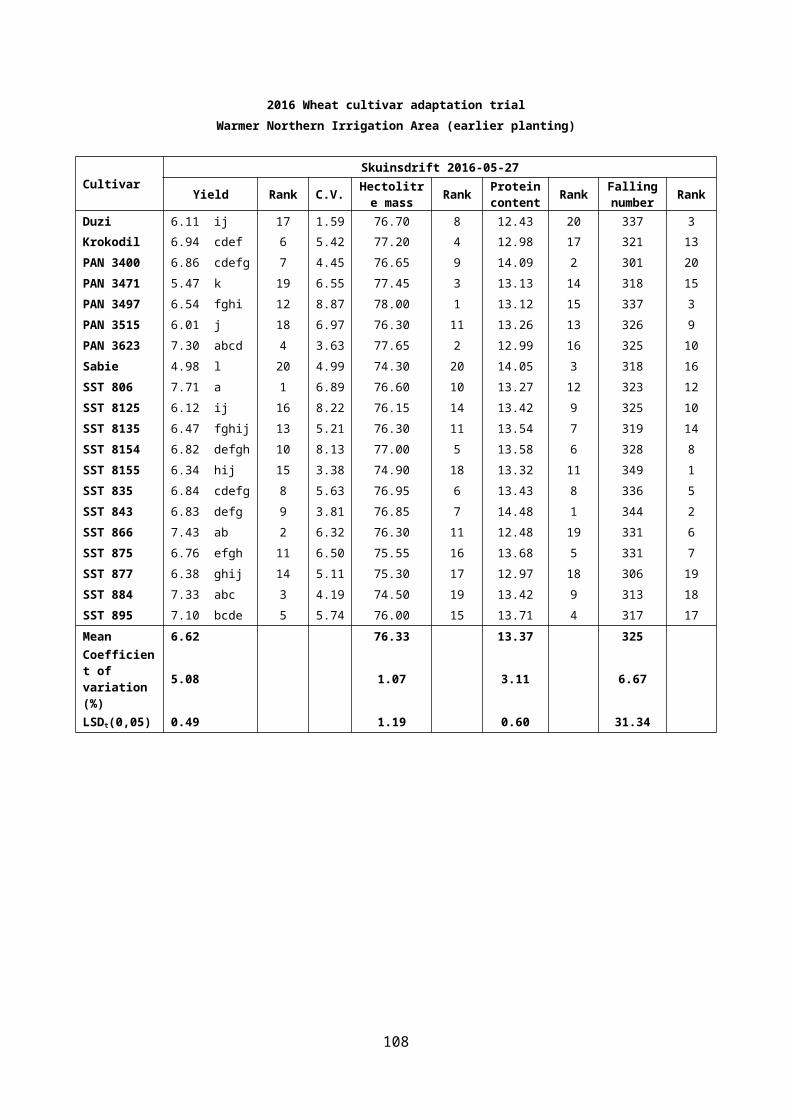
Highveld Irrigation Area (earlier planting) AMMI AnalysisAnova of the falling number of entries for 2016
Source Df SS MS F-Value Pr> FTotal 239 515049 2155Treatments 59 315960 5355 5.78 <0,001Genotypes 19 171660 9035 9.75 <0,001Environments 2 70428 35214 7.81 <0,001Block 9 40605 4512 4.87 <0,001Interactions 38 73871 1944 2.10 <0,001IPCA 20 63561 3178 3.43 <0,001IPCA 18 10310 573 0.62 0.8824Residuals 0 0Error 171 158484 927
Genotype means and scores for falling number (s)
Entry Genotype Falling number Rank Score1 Duzi 281 18 1.020332 Krokodil 239 19 1.480593 PAN 3400 320 7 -1.969224 PAN 3471 304 12 0.530165 PAN 3497 317 8 -3.362366 PAN 3515 284 17 -0.816327 PAN 3623 238 20 4.190908 Sabie 303 14 -3.215449 SST 806 340 1 -1.88627
10 SST 8125 315 10 -1.9771911 SST 8135 299 15 0.9001512 SST 8154 311 11 2.1555613 SST 8155 303 13 0.2909714 SST 835 321 5 -3.7149915 SST 843 321 6 2.8504516 SST 866 328 3 0.5680417 SST 875 326 4 -2.0889418 SST 877 317 9 -0.9003119 SST 884 288 16 6.1885620 SST 895 333 2 -0.24466
Mean 304 Coefficient of variation (%) 10.90 LSDt(0,05) 26.73
Environment means and scores for falling number (s)
Entry Environment Falling number Rank Score1 Clarens 328 1 -9.082742 Villiers 295 2 5.616633 Welkom 289 3 3.46611
Mean 304 Coefficient of variation (%) 10.90 LSDt(0.05) 10.35
108
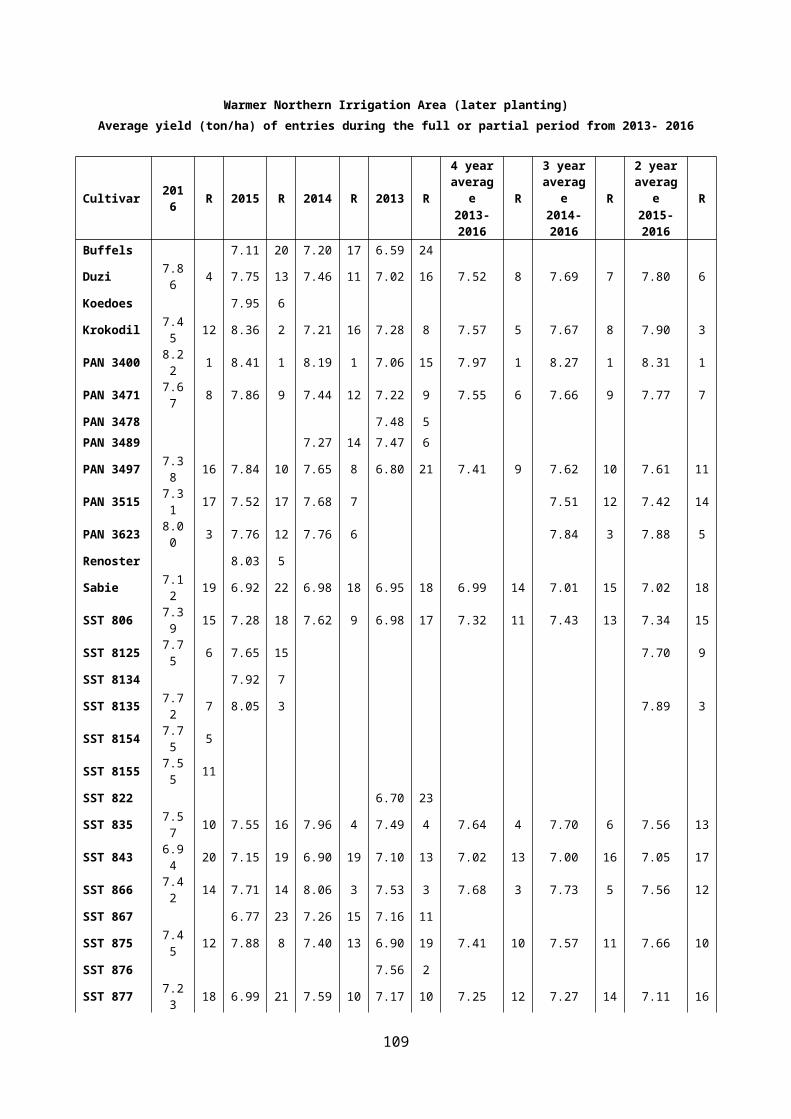
DuziKrokodil
PAN 3400
PAN 3471
PAN 3497
PAN 3515
PAN 3623
SST 895
SST 806SST 8125
SST 8135
SST 8154
SST 8155
SST 835
SST 843
SST 866
SST 875
SST 877
SST 884
Sabie
Clarens
Villiers
Welkom
Highveld Irrigation Area - earlier planting 2016
Falling number (s)
IPCA 1 sc
ore8,00
6,00
0.00
-10,00
-2,00
236 251304
-6,00
4,00
2,00
-4,00
-8,00
109

2016 Wheat cultivar adaptation trialHighveld Irrigation Area (earlier planting)
CultivarClarens_2016-06-10
Yield Rank C.V. Hectolitre mass Rank Protein
content Rank Falling number Rank
Duzi 5.88 ijk 18 4.87 81.05 8 13.68 9 294 17
Krokodil 5.99 hij 17 9.47 79.55 17 12.60 19 249 19
PAN 3400 7.11 bc 3 9.43 81.22 7 12.87 17 363 5
PAN 3471 6.63 defg 9 5.21 82.02 3 13.36 13 322 12
PAN 3497 8.77 a 1 4.21 84.17 1 12.13 20 372 3
PAN 3515 7.10 bcd 4 6.77 80.52 13 13.22 14 314 15
PAN 3623 6.01 hij 16 9.38 77.55 19 14.24 4 222 20
Sabie 7.16 b 2 7.69 82.20 2 13.15 16 357 7
SST 806 6.59 efg 10 8.71 81.55 4 13.90 8 382 1
SST 8125 6.40 fgh 13 10.43 80.65 9 13.63 10 356 8
SST 8135 6.19 ghi 14 7.34 81.45 6 13.41 11 314 16
SST 8154 6.53 efg 11 6.45 80.42 14 14.09 5 316 14
SST 8155 7.08 bcd 5 6.55 80.42 14 12.73 18 325 11
SST 835 7.07 bcd 6 7.37 80.55 11 13.37 12 377 2
SST 843 7.00 bcde 7 3.99 80.55 11 15.22 1 321 13
SST 866 5.44 k 20 6.44 80.37 16 14.59 2 347 10
SST 875 6.17 ghi 15 8.94 81.55 4 13.18 15 371 4
SST 877 6.66 cdef 8 7.10 79.32 18 14.04 7 351 9
SST 884 5.54 jk 19 7.42 77.30 20 14.41 3 258 18
SST 895 6.44 fgh 12 9.52 80.65 9 14.08 6 359 6
Mean 6.59 80.65 13.60 328 Coefficient of variation (%)
4.96 1.24 5.30 12.27
LSDt(0,05) 0.47 1.45 1.04 58.26
110

2016 Wheat cultivar adaptation trialHighveld Irrigation Area (earlier planting)
CultivarVilliers_2016-06-20
Yield Rank C.V. Hectolitre mass Rank Protein
content Rank Falling number Rank
Duzi 7.99 fg 17 8.88 80.87 15 12.32 18 269 17
Krokodil 8.62 bcdefg 10 4.26 80.65 17 11.77 20 233 20
PAN 3400 8.58 bcdefg 11 5.04 80.50 19 12.92 3 305 9
PAN 3471 9.10 abc 4 9.08 82.35 5 12.46 13 294 11
PAN 3497 9.31 ab 2 5.14 82.52 3 12.51 11 288 12
PAN 3515 8.32 defg 15 3.15 80.70 16 12.54 10 265 18
PAN 3623 9.12 abc 3 2.61 81.15 12 12.74 6 239 19
Sabie 7.11 h 20 12.92 80.60 18 12.99 2 281 16
SST 806 8.91 abcde 7 6.05 82.45 4 12.63 8 328 2
SST 8125 9.59 a 1 1.89 81.90 9 12.66 7 286 14
SST 8135 8.84 abcde 8 3.77 82.62 2 12.36 15 288 13
SST 8154 8.30 efg 16 3.64 82.15 7 12.87 5 318 6
SST 8155 8.75 bcdef 9 2.71 81.15 12 11.89 19 299 10
SST 835 9.08 abcd 5 3.02 82.10 8 12.58 9 283 15
SST 843 7.90 g 18 9.54 82.67 1 13.78 1 338 1
SST 866 7.88 gh 19 8.65 81.32 11 12.36 15 325 3
SST 875 8.97 abcde 6 3.84 81.52 10 12.44 14 315 7
SST 877 8.39 cdefg 14 6.54 79.17 20 12.90 4 313 8
SST 884 8.50 cdefg 13 3.02 81.05 14 12.33 17 324 4
SST 895 8.52 cdefg 12 2.13 82.30 6 12.48 12 322 5
Mean 8.59 81.49 12.58 295 Coefficient of variation (%)
6.25 0.81 2.51 8.61
LSDt(0,05) 0.78 0.96 0.46 36.78
111
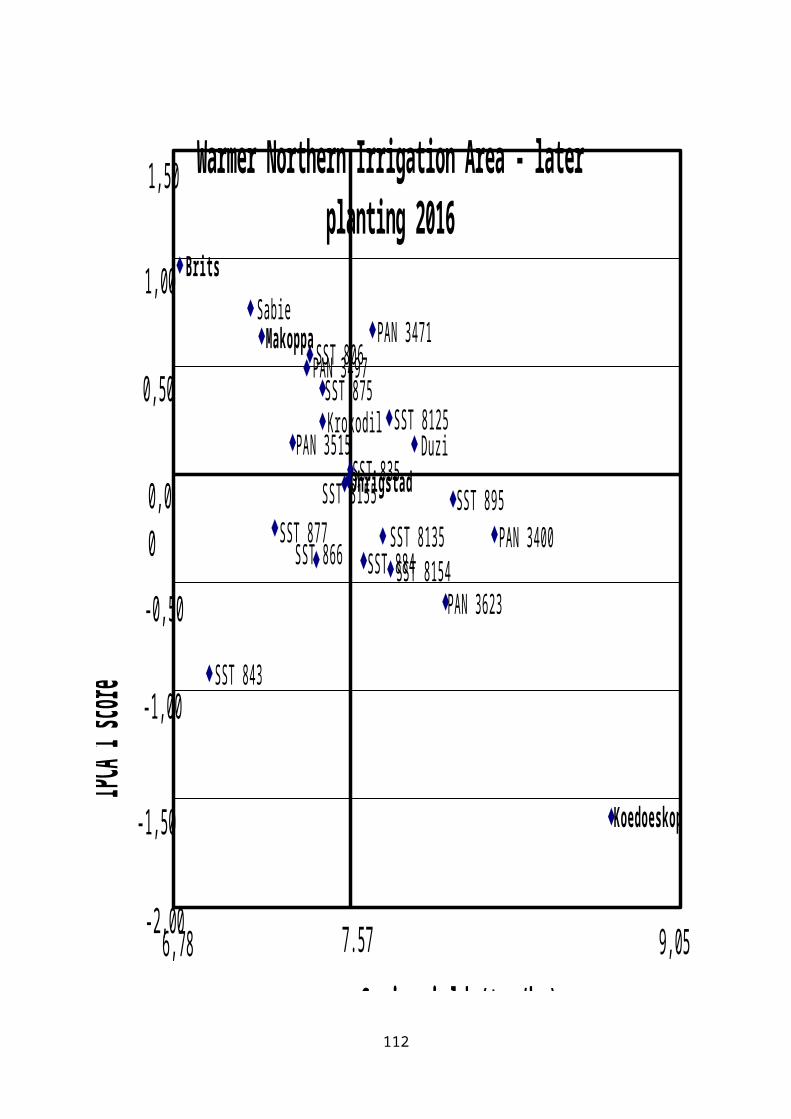
2016 Wheat cultivar adaptation trialHighveld Irrigation Area (earlier planting)
CultivarWelkom AJ_2016-06-30
Yield Rank C.V. Hectolitre mass Rank Protein
content Rank Falling number Rank
Duzi 6.13 bcde 7 6.45 81.92 11 14.45 4 279 16
Krokodil 5.92 efgh 14 2.43 81.87 12 13.30 20 236 20
PAN 3400 6.28 bcd 5 5.16 82.60 4 13.96 14 293 10
PAN 3471 6.30 bc 4 5.22 82.55 5 13.87 15 296 9
PAN 3497 7.08 a 1 2.71 83.27 1 13.72 16 292 12
PAN 3515 6.31 bc 3 4.66 82.27 8 13.39 19 272 17
PAN 3623 5.69 fgh 17 2.49 81.62 14 14.85 2 254 19
Sabie 6.41 b 2 5.30 82.55 5 14.45 4 271 18
SST 806 6.01 cdef 10 6.62 82.82 3 14.15 10 310 3
SST 8125 5.94 efgh 12 4.98 81.20 18 13.98 13 305 4
SST 8135 6.28 bcd 5 4.02 82.42 7 14.33 7 296 8
SST 8154 5.65 gh 18 4.86 82.85 2 14.78 3 300 7
SST 8155 5.63 h 19 9.59 80.40 20 13.55 18 286 14
SST 835 6.07 cde 8 7.46 82.02 9 14.14 11 303 6
SST 843 5.02 i 20 5.53 82.02 9 16.21 1 304 5
SST 866 5.96 defg 11 6.02 81.57 15 14.22 9 312 2
SST 875 6.02 cdef 9 4.17 81.80 13 13.71 17 293 11
SST 877 5.92 efgh 15 7.57 81.22 17 14.44 6 286 13
SST 884 5.93 efgh 13 4.00 80.45 19 14.10 12 284 15
SST 895 5.72 fgh 16 6.27 81.25 16 14.28 8 319 1
Mean 6.01 81.93 14.19 289 Coefficient of variation (%)
3.82 0.80 2.13 5.47
LSDt(0,05) 0.33 0.94 0.44 22.87
112

Highveld Irrigation Area (later planting) Average yield (ton/ha) of entries during the full or partial period from 2013- 2016
Cultivar 2016 R 2015 R 2014 R * 2013 R
4 year average R
3 year average R
2 year average R2013-
20162014-2016
2015-2016
Buffels 5.62 22 8.16 8 7.29 10
Duzi 7.41 16 5.41 23 8.00 12 7.03 14 6.96 12 6.94 15 6.41 18
Koedoes 6.53 8
Krokodil 8.57 2 6.61 5 8.52 3 6.71 17 7.60 3 7.90 2 7.59 3
PAN 3400 7.79 14 6.58 6 8.17 7 7.37 8 7.48 5 7.51 5 7.19 7
PAN 3471 8.04 7 6.05 16 7.89 15 7.82 2 7.45 6 7.33 9 7.04 9
PAN 3478 7.83 1
PAN 3489 8.20 6 7.78 3
PAN 3497 7.54 15 6.04 17 8.75 2 7.68 6 7.50 4 7.45 7 6.79 14
PAN 3515 7.81 12 6.06 14 7.46 18 7.11 12 6.93 12
PAN 3623 9.38 1 6.93 2 7.89 15 8.07 1 8.15 1
Renoster 6.49 10
Sabie 7.85 11 6.01 19 8.39 5 7.53 7 7.45 7 7.35 8 6.93 13
SST 806 8.08 5 6.70 3 8.04 10 6.84 15 7.41 8 7.25 10 7.39 4
SST 8125 8.04 6 6.02 18 7.03 10
SST 8134 6.54 7
SST 8135 7.90 10 6.61 3 7.25 5
SST 8154 7.79 13
SST 8155 6.73 20
SST 822 4.43 24
SST 835 8.22 4 6.51 9 8.94 1 7.71 5 7.85 1 7.89 3 7.37 5
SST 843 7.06 19 6.39 12 7.23 19 4.52 23 6.30 14 6.89 16 6.72 15
SST 866 7.33 17 6.06 15 7.92 13 6.55 21 6.96 11 7.10 13 6.69 16
SST 867 6.33 13 8.46 4 7.23 12
SST 875 7.93 9 6.01 20 7.55 17 7.08 13 7.14 10 7.16 11 6.97 11
SST 876 6.63 18
SST 877 7.21 18 5.81 21 8.13 9 6.56 20 6.93 13 7.05 14 6.51 17
SST 884 7.94 8 6.39 11 8.02 11 6.40 22 7.19 9 7.45 6 7.16 8
SST 895 8.32 3 6.95 1 7.91 14 7.35 9 7.63 2 7.72 4 7.63 2
SST 896 6.63 19
Tamboti 7.77 4
Timbavati 6.80 16
Umlazi 7.27 11
Mean 7.85 6.29 8.09 6.95 7.27 7.38 7.10 LSDt(0,05) 0.45 0.21 0.29 0.96 0.21 0.18 0.22 *Only Daniëlsrus data
113

Highveld Irrigation Area (later planting) Average hectolitre mass (kg/hl) of entries during the full or partial period from 2013- 2016
Cultivar 2016 R 2015 R 2014 R * 2013 R
4 year average R
3 year average R
2 year average R2013-
20162014-2016
2015-2016
Buffels 80.28 22 79.15 16 79.40 12
Duzi 78.48 12 80.47 19 78.91 17 78.23 20 79.02 11 79.29 13 79.47 15
Koedoes 81.93 8
Krokodil 78.16 14 81.63 12 78.59 18 79.00 17 79.35 10 79.46 12 79.90 12
PAN 3400 77.53 17 82.03 7 79.36 14 79.38 13 79.57 9 79.64 10 79.78 13
PAN 3471 80.15 2 82.49 4 80.55 4 80.08 6 80.82 1 81.06 2 81.32 2
PAN 3478 80.73 2
PAN 3489 81.28 1 81.90 1
PAN 3497 79.51 6 81.39 14 81.00 2 80.48 3 80.59 3 80.63 5 80.45 7
PAN 3515 78.34 13 80.83 16 79.61 10 79.59 11 79.58 14
PAN 3623 79.64 4 82.86 2 79.23 15 80.58 6 81.25 4
Renoster 80.37 21
Sabie 77.20 19 78.28 23 79.60 11 78.80 18 78.47 13 78.79 16 77.74 18
SST 806 79.81 3 82.77 3 80.29 6 79.85 9 80.68 2 80.90 3 81.29 3
SST 8125 78.83 9 81.34 15 80.08 10
SST 8134 80.56 18
SST 8135 78.55 11 81.79 6 80.17 7
SST 8154 78.81 10
SST 8155 77.30 18
SST 822 76.50 24
SST 835 79.54 5 82.14 6 80.51 5 79.93 8 80.53 4 80.73 4 80.84 6
SST 843 80.30 1 83.06 1 80.69 3 78.05 21 80.53 5 81.35 1 81.68 1
SST 866 77.94 15 81.89 9 79.90 7 79.63 10 79.84 8 79.91 9 79.91 11
SST 867 81.63 12 79.81 8 80.30 5
SST 875 79.06 8 81.71 11 79.60 11 79.05 16 79.86 7 80.12 8 80.39 8
SST 876 79.60 11
SST 877 76.44 20 80.42 20 79.65 9 79.10 15 78.90 12 78.84 15 78.43 17
SST 884 77.70 16 80.83 16 78.26 19 77.00 23 78.45 14 78.93 14 79.27 16
SST 895 79.35 7 82.37 5 79.48 13 79.18 14 80.09 6 80.40 7 80.86 5
SST 896 77.65 22
Tamboti 80.43 4
Timbavati 79.98 7
Umlazi 78.80 18
Mean 78.63 81.44 79.76 79.29 79.76 80.01 80.13 LSDt(0,05) 0.86 1.22 0.66 1.05 0.57 0.62 0.82 *Only Daniëlsrus data
114
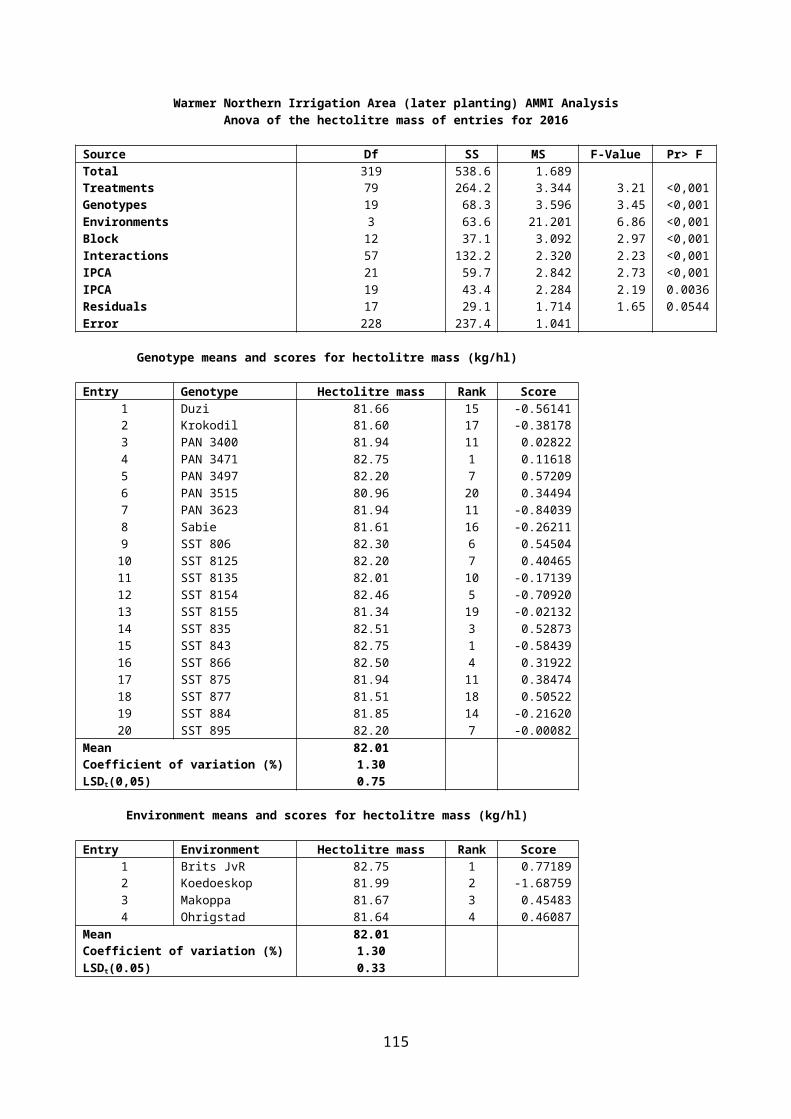
Highveld Irrigation Area (later planting)Average protein content (%) of entries during the full or partial period from 2013- 2016
Cultivar 2016 R 2015 R 2014 R * 2013 R
4 year average R
3 year average R
2 year average R2013-
20162014-2016
2015-2016
Buffels 13.68 10 10.48 6 12.98 10
Duzi 12.62 5 13.87 6 10.31 8 13.38 5 12.55 3 12.27 7 13.24 6
Koedoes 13.97 4
Krokodil 11.39 20 12.79 22 9.66 19 11.29 24 11.28 14 11.28 16 12.09 18
PAN 3400 12.59 7 13.37 16 10.49 5 12.72 17 12.29 7 12.15 9 12.98 9
PAN 3471 12.35 11 13.35 17 10.31 8 12.54 21 12.14 11 12.00 10 12.85 12
PAN 3478 12.60 18
PAN 3489 9.98 14 12.58 20
PAN 3497 12.59 6 13.46 14 9.80 18 12.86 12 12.18 9 11.95 12 13.03 8
PAN 3515 11.88 18 12.67 23 9.86 17 11.47 15 12.28 17
PAN 3623 13.06 2 13.77 9 10.56 4 12.46 3 13.42 2
Renoster 13.48 13
Sabie 12.58 8 14.21 2 10.31 8 12.60 18 12.43 6 12.39 5 13.40 3
SST 806 12.42 10 13.32 18 10.77 2 13.80 4 12.58 2 12.62 2 12.87 11
SST 8125 12.07 17 13.23 20 12.65 15
SST 8134 13.65 11
SST 8135 12.16 16 13.39 9 12.78 10
SST 8154 12.17 15
SST 8155 12.69 4
SST 822 14.63 2
SST 835 12.27 14 13.27 19 10.17 12 12.25 23 11.99 12 11.90 13 12.77 14
SST 843 13.45 1 14.97 1 11.78 1 16.19 1 14.10 1 13.40 1 14.21 1
SST 866 12.34 12 13.54 12 9.98 14 12.82 14 12.17 10 11.95 11 12.94 10
SST 867 13.91 5 10.02 13 12.84 13
SST 875 11.70 19 13.19 21 9.91 16 12.99 9 11.95 13 11.60 14 12.45 16
SST 876 13.94 3
SST 877 12.75 3 13.79 8 10.67 3 12.73 15 12.49 4 12.40 4 13.27 5
SST 884 12.28 13 13.83 7 10.45 7 12.50 22 12.26 8 12.19 8 13.05 7
SST 895 12.55 9 14.00 3 10.26 11 13.13 8 12.48 5 12.27 6 13.28 4
SST 896 13.19 6
Tamboti 12.73 16
Timbavati 13.15 7
Umlazi 12.93 11
Mean 12.40 13.60 10.30 13.06 12.35 12.14 12.97 LSDt(0,05) 0.40 0.49 0.56 1.29 0.28 0.29 0.33 *Only Daniëlsrus data
115
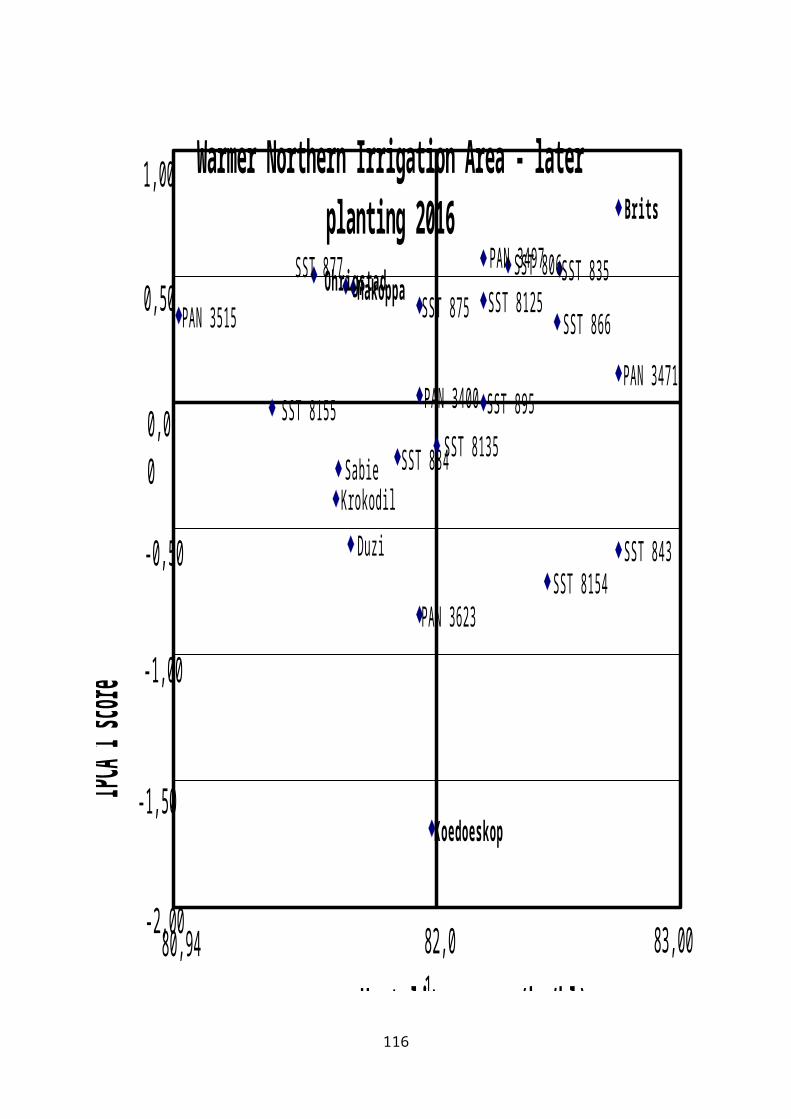
Highveld Irrigation Area (later planting)Average falling number (s) of entries during the full or partial period from 2013- 2016
Cultivar 2016 R 2015 R 2014 R * 2013 R
4 year average R
3 year average R
2 year average R2013-
20162014-2016
2015-2016
Buffels 299 20 302 16 259 20
Duzi 319 9 303 17 308 13 303 8 308 9 310 11 311 12
Koedoes 309 11
Krokodil 284 19 291 23 281 19 210 24 266 14 285 16 287 18
PAN 3400 324 8 314 4 323 7 302 9 316 4 320 6 319 6
PAN 3471 319 10 313 9 299 17 269 17 300 12 310 10 316 8
PAN 3478 274 15
PAN 3489 296 18 232 23
PAN 3497 317 12 305 16 326 5 284 13 308 10 316 8 311 11
PAN 3515 296 18 297 21 319 11 304 15 297 16
PAN 3623 303 17 313 6 302 15 306 13 308 14
Renoster 299 19
Sabie 317 12 301 18 305 14 330 2 313 6 312 9 309 13
SST 806 332 4 323 1 324 6 260 19 310 7 304 14 327 1
SST 8125 325 6 317 2 321 5
SST 8134 310 10
SST 8135 282 20 305 8 293 13
SST 8154 315 14
SST 8155 305 16
SST 822 237 22
SST 835 334 2 314 3 322 9 319 3 322 1 323 3 324 3
SST 843 318 11 313 7 323 8 279 14 308 8 318 7 316 8
SST 866 326 5 309 12 341 1 310 6 321 3 325 2 317 7
SST 867 305 13 332 4 316 5
SST 875 332 3 314 5 336 3 304 7 321 2 327 1 323 4
SST 876 273 16
SST 877 312 15 296 22 316 12 261 18 296 13 308 12 304 15
SST 884 324 7 305 14 339 2 242 21 303 11 323 5 314 10
SST 895 336 1 313 8 320 10 288 12 314 5 323 4 324 2
SST 896 288 11
Tamboti 296 10
Timbavati 346 1
Umlazi 317 4
Mean 316 307 317 283 308 313 312 LSDt(0,05) 30.54 8.32 26.10 71.11 14.26 11.84 12.99 *Only Daniëlsrus data
116

2016 Wheat cultivar adaptation trialHighveld Irrigation Area (later planting)
CultivarHarrismith TF_2016-07-12
Yield Rank C.V. Hectolitre mass Rank Protein
content Rank Falling number Rank
Duzi 7.09 fgh 13 6.12 77.45 11 12.22 11 323 19
Krokodil 6.87 ghi 14 5.81 76.53 16 11.28 20 302 20
PAN 3400 6.35 k 18 3.12 75.15 19 12.51 5 368 10
PAN 3471 6.72 ij 16 2.71 79.10 3 12.28 10 356 13
PAN 3497 5.39 m 20 4.87 77.53 9 11.92 17 373 8
PAN 3515 7.20 efg 10 1.22 77.23 12 11.73 19 342 16
PAN 3623 7.79 bc 4 0.79 78.83 5 12.77 2 343 14
Sabie 5.80 l 19 8.83 75.90 18 12.75 3 357 12
SST 806 7.60 bcd 5 2.00 79.28 2 12.45 8 391 1
SST 8125 7.95 b 2 1.23 78.05 8 12.13 12 385 3
SST 8135 7.12 fgh 11 2.79 77.05 13 12.47 7 329 18
SST 8154 7.23 efg 9 4.79 77.48 10 12.11 13 366 11
SST 8155 6.38 jk 17 2.48 76.40 17 12.36 9 342 15
SST 835 7.31 def 7 5.77 78.83 5 12.48 6 373 7
SST 843 7.26 def 8 1.31 80.45 1 13.71 1 384 4
SST 866 7.11 fgh 12 3.11 76.63 15 12.11 13 389 2
SST 875 7.55 cde 6 5.03 78.73 7 11.88 18 370 9
SST 877 6.79 hi 15 5.01 74.27 20 12.74 4 338 17
SST 884 7.91 bc 3 3.18 76.75 14 12.01 16 376 6
SST 895 8.52 a 1 5.07 79.05 4 12.08 15 383 5
Mean 7.10 77.53 12.30 360 Coefficient of variation (%)
3.58 0.80 1.90 5.43
LSDt(0,05) 0.37 0.90 0.34 28.22
117
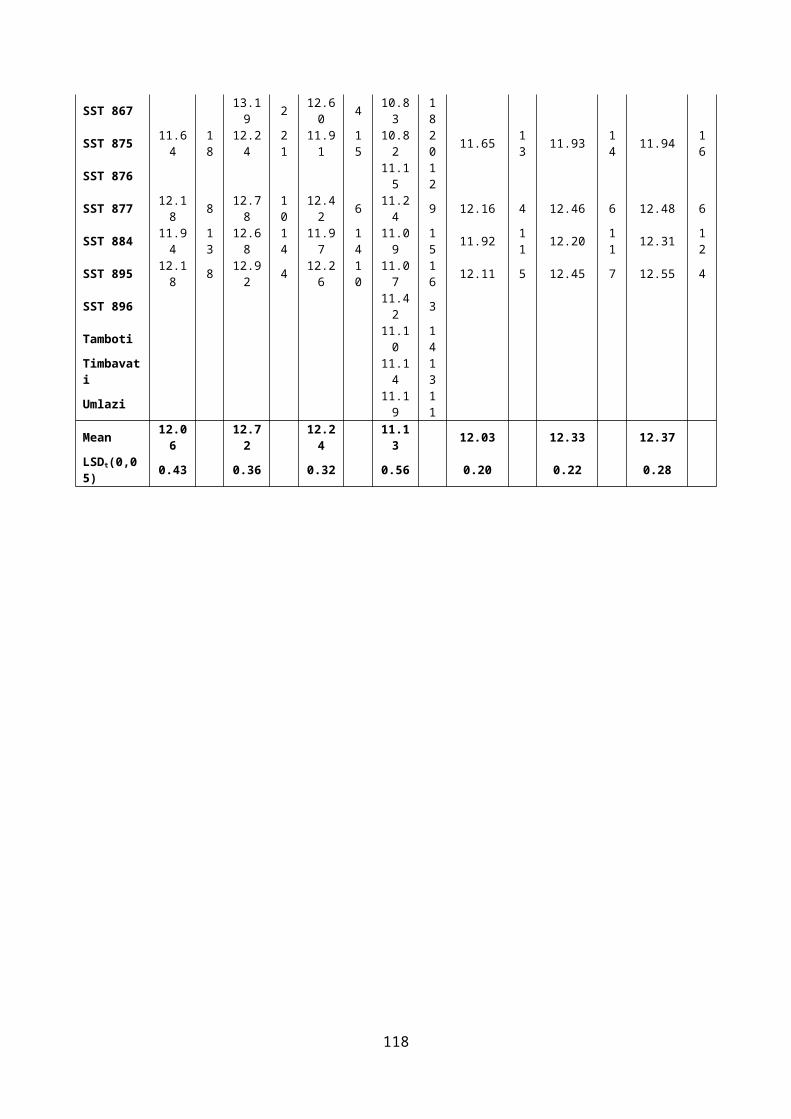
2016 Wheat cultivar adaptation trialHighveld Irrigation Area (later planting)
CultivarPotchefstroom_2016-07-13
Yield Rank C.V. Hectolitre mass Rank Protein
content Rank Falling number Rank
Duzi 7.72 ij 16 5.85 79.50 13 13.02 4 314 1
Krokodil 10.27 b 2 4.78 79.80 10 11.51 20 265 12
PAN 3400 9.23 de 6 11.86 79.90 9 12.67 8 280 7
PAN 3471 9.35 cd 5 4.46 81.20 2 12.41 12 281 6
PAN 3497 9.70 bcd 4 6.75 81.50 1 13.27 2 262 17
PAN 3515 8.42 gh 10 6.22 79.45 14 12.04 16 250 19
PAN 3623 10.97 a 1 1.42 80.45 3 13.35 1 263 15
Sabie 9.89 bc 3 6.82 78.50 19 12.42 11 278 8
SST 806 8.56 fgh 9 7.74 80.35 4 12.39 13 272 9
SST 8125 8.14 ghij 13 6.08 79.60 12 12.02 17 264 14
SST 8135 8.67 efg 8 3.20 80.05 8 11.85 18 236 20
SST 8154 8.36 gh 11 8.93 80.15 6 12.23 14 264 13
SST 8155 7.09 kl 19 7.13 78.20 20 13.02 4 269 11
SST 835 9.13 def 7 4.63 80.25 5 12.07 15 294 3
SST 843 6.86 l 20 5.15 80.15 6 13.18 3 252 18
SST 866 7.54 jk 18 7.51 79.25 16 12.56 9 263 16
SST 875 8.31 ghi 12 6.17 79.40 15 11.53 19 294 2
SST 877 7.64 jk 17 8.21 78.60 18 12.76 7 286 5
SST 884 7.96 hij 15 7.21 78.65 17 12.54 10 272 10
SST 895 8.12 ghij 14 8.09 79.65 11 13.02 4 288 4
Mean 8.59 79.73 12.49 272 Coefficient of variation (%)
4.85 0.87 4.20 13.33
LSDt(0,05) 0.60 1.00 0.73 53.33
118

KwaZulu-Natal Irrigation AreaAverage yield (ton/ha) of entries during the full or partial period from 2013- 2016
Cultivar 2016 R 2015 R 2014 R * 2013 R
4 year average R
3 year average R
2 year average R2013-
20162014-2016
2015-2016
Buffels 4.35 23 5.80 19 6.89 20
Duzi 6.82 8 5.24 17 6.67 15 7.28 15 6.50 10 6.24 1
1 6.03 9
Koedoes 5.52 12
Krokodil 6.68 12 5.77 5 7.08 9 7.75 5 6.82 3 6.51 6 6.23 5
PAN 3400 7.07 4 5.33 14 7.21 6 7.31 13 6.73 6 6.53 5 6.20 7
PAN 3471 6.65 13 5.33 15 7.53 4 7.64 8 6.79 4 6.50 8 5.99 11
PAN 3478 7.11 17
PAN 3489 7.53 3 8.24 1
PAN 3497 5.95 17 5.13 18 7.01 11 7.46 10 6.39 11 6.03 1
4 5.54 17
PAN 3515 7.23 2 5.73 7 6.97 12 6.64 3 6.48 2
PAN 3623 6.81 9 5.69 8 6.87 13 6.46 9 6.25 4
Renoster 6.18 1
Sabie 5.52 20 4.85 21 6.77 14 7.93 3 6.27 13 5.71 1
6 5.19 18
SST 806 6.81 10 5.57 9 7.79 2 7.70 6 6.97 1 6.72 1 6.19 8
SST 8125 6.76 11 4.88 20 5.82 14
SST 8134 6.00 4
SST 8135 7.21 3 6.13 2 6.67 1
SST 8154 7.35 1
SST 8155 5.83 19
SST 822 6.59 23
SST 835 6.56 14 5.25 16 7.86 1 8.02 2 6.92 2 6.56 4 5.91 13
SST 843 6.20 16 5.37 13 6.54 16 6.34 24 6.11 14 6.04 1
3 5.79 15
SST 866 5.89 18 5.54 11 7.05 10 7.66 7 6.53 9 6.16 12 5.71 16
SST 867 4.36 22 6.44 17 7.07 18
SST 875 6.26 15 5.75 6 7.25 5 7.87 4 6.78 5 6.42 10 6.01 10
SST 876 6.93 19
SST 877 6.85 7 5.06 19 6.19 18 7.37 11 6.36 12 6.03 1
5 5.95 12
SST 884 6.90 5 6.01 3 7.15 7 6.80 21 6.71 7 6.69 2 6.46 3
SST 895 6.86 6 5.54 10 7.13 8 7.23 16 6.69 8 6.51 7 6.20 6
SST 896 7.36 12
Tamboti 7.30 14
Timbavati 6.66 22
Umlazi 7.52 9
Mean 6.61 5.42 6.99 7.33 6.61 6.36 6.03 LSDt(0,05) 0.35 0.19 0.35 0.62 0.18 0.18 0.20
119
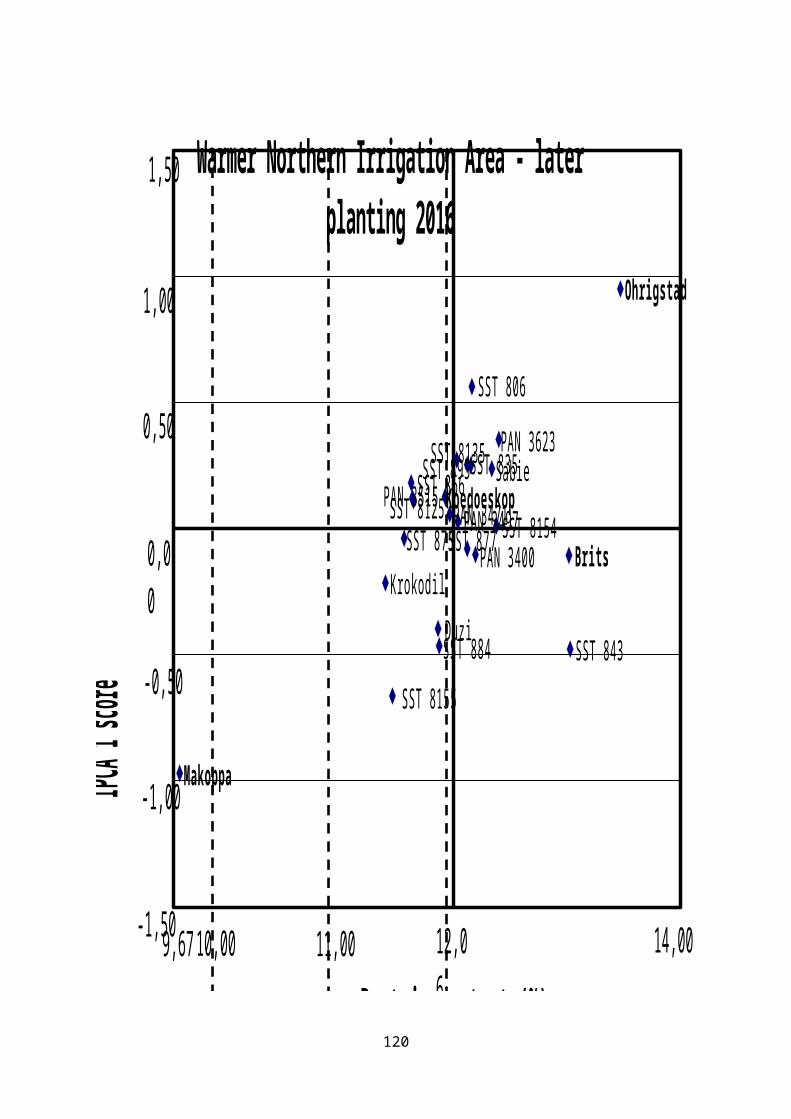
* Only Bergville data
120
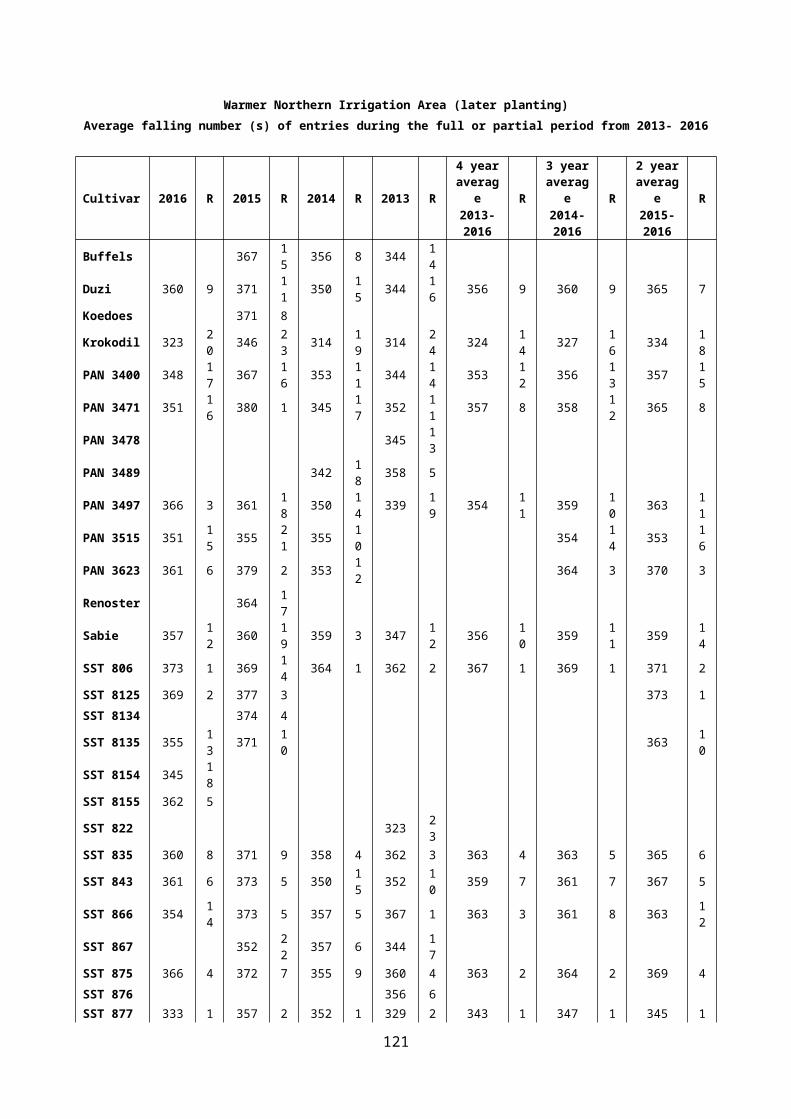
KwaZulu Natal Irrigation Area AMMI AnalysisAnova of the yield of entries for for 2016
Source Df SS MS F-Value Pr> FTotal 239 250.18 1.047Treatments 59 214.89 3.642 20.22 <0,001Genotypes 19 58.54 3.081 17.11 <0,001Environments 2 103.38 51.689 103.56 <0,001Block 9 4.49 0.499 2.77 0.0047Interactions 38 52.97 1.394 7.74 <0,001IPCA 20 28.38 1.419 7.88 <0,001IPCA 18 24.59 1.366 7.59 <0,001Residuals 0 0.00Error 171 30.80 0.180
Genotype means and scores for yield (ton/ha)
Entry Genotype Yield Rank Score1 Duzi 6.82 8 0.520492 Krokodil 6.68 12 -0.324223 PAN 3400 7.07 4 -0.141134 PAN 3471 6.65 13 0.275305 PAN 3497 5.95 17 -0.447816 PAN 3515 7.23 2 -0.234467 PAN 3623 6.81 9 0.069788 Sabie 5.52 20 0.248969 SST 806 6.81 10 0.44179
10 SST 8125 6.76 11 0.0299311 SST 8135 7.21 3 0.0204312 SST 8154 7.35 1 -0.7493813 SST 8155 5.83 19 0.2387314 SST 835 6.56 14 0.5093415 SST 843 6.20 16 -0.4148516 SST 866 5.89 18 0.1088517 SST 875 6.26 15 -0.3326318 SST 877 6.85 7 0.2316919 SST 884 6.90 5 0.4465420 SST 895 6.86 6 -0.49735
Mean 6.61 Coefficient of variation (%) 6.50 LSDt(0,05) 0.35
Environment means and scores for yield (ton/ha)
Entry Environment Yield Rank Score1 Bergville (Britz) 7.53 1 1.078092 Bergville (Potgieter) 6.07 3 -1.217343 Colenso 6.22 2 0.13925
Mean 6.61 Coefficient of variation (%) 6.50 LSDt(0.05) 0.13
121
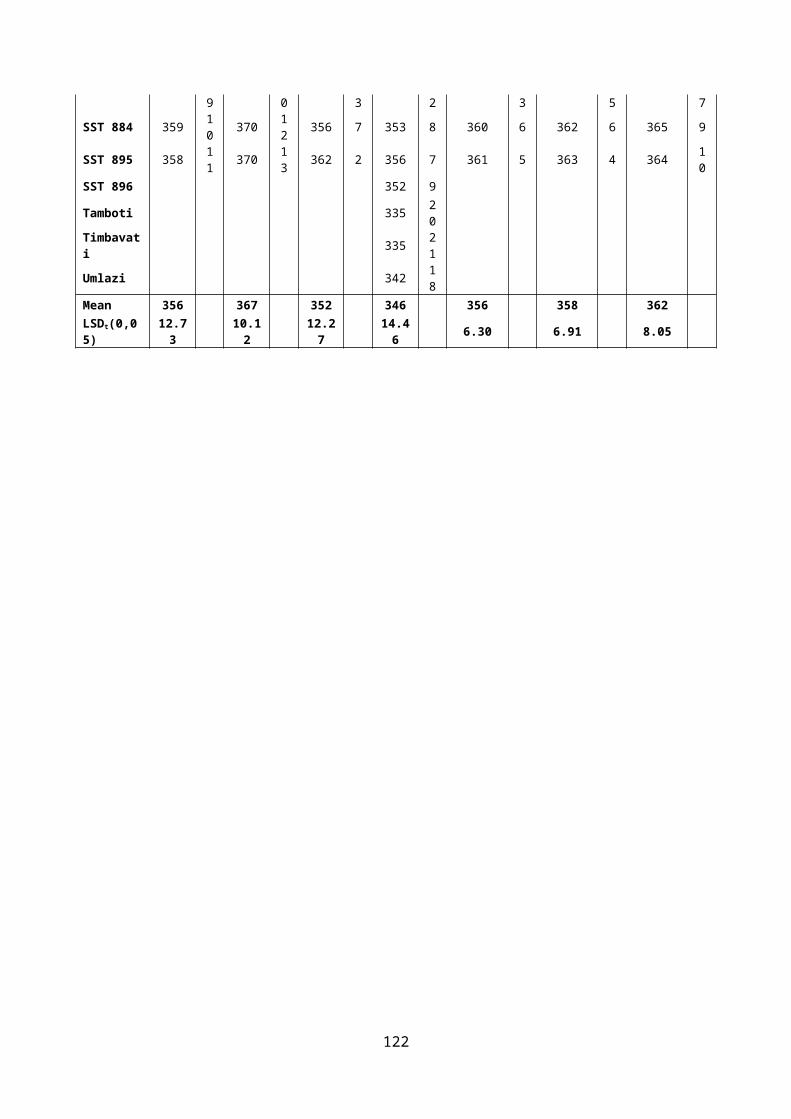
Duzi
Krokodil
PAN 3400
PAN 3471
PAN 3497
PAN 3515
PAN 3623Sabie
SST 806
SST 8125 SST 8135
SST 8154
SST 8155
SST 835
SST 843
SST 866
SST 875
SST 877
SST 884
SST 895
Bergville Brits
Bergville Potgieter
Colenso
KwaZulu-Natal Irrigation Area - 2016
Grain yield (ton/ha)
IPCA 1 sc
ore
1.00
0.50
0.00
-1.50
-0.50
5,50 8,006,61
-1.00
1.50
122

KwaZulu-Natal Irrigation AreaAverage hectolitre mass (kg/hl) of entries during the full or partial period from 2013- 2016
Cultivar 2016 R 2015 R 2014 R * 2013 R4 year
average R3 year
average R2 year
average R2013-2016
2014-2016
2015-2016
Buffels 80.61 19 80.38 19 78.69 1
Duzi 79.35 13 81.23 17 81.26 16 78.53 2 80.09 7 80.61 14 80.29 14
Koedoes 82.02 11
Krokodil 79.66 9 81.83 12 81.96 12 75.52 12 79.74 10 81.15 9 80.75 10
PAN 3400 78.34 17 81.38 16 82.83 9 74.44 18 79.25 11 80.85 12 79.86 15
PAN 3471 80.74 3 82.44 4 83.15 4 76.74 7 80.77 2 82.11 3 81.59 4
PAN 3478 76.26 8
PAN 3489 83.96 1 75.27 14
PAN 3497 81.25 1 82.07 8 83.59 2 78.00 5 81.23 1 82.30 1 81.66 1
PAN 3515 79.99 6 82.07 8 82.81 10 81.62 7 81.03 6
PAN 3623 80.03 5 81.78 13 81.44 15 81.08 10 80.91 8
Renoster 80.36 21
Sabie 78.45 16 80.30 22 80.89 17 75.50 13 78.79 13 79.88 15 79.38 17
SST 806 80.10 4 83.19 1 83.30 3 75.14 15 80.43 3 82.20 2 81.65 3
SST 8125 79.62 11 82.15 6 80.89 9
SST 8134 80.65 18
SST 8135 76.84 20 82.56 3 79.70 13
SST 8154 79.85 8
SST 8155 78.34 17
SST 822 74.26 20
SST 835 79.59 12 82.61 2 83.07 5 74.20 21 79.87 9 81.76 5 81.10 5
SST 843 80.91 2 82.40 5 82.93 8 74.07 22 80.08 8 82.08 4 81.66 2
SST 866 79.22 14 81.55 15 82.40 11 78.41 3 80.40 4 81.06 11 80.39 13
SST 867 80.38 20 81.66 13 75.76 11
SST 875 79.65 10 81.62 14 82.95 7 76.16 10 80.10 6 81.41 8 80.64 11
SST 876 74.79 17
SST 877 78.23 19 79.52 23 80.45 18 74.89 16 78.27 14 79.40 16 78.88 18
SST 884 78.82 15 82.12 7 81.58 14 73.89 23 79.10 12 80.84 13 80.47 12
SST 895 79.96 7 82.03 10 82.96 6 76.23 9 80.30 5 81.65 6 81.00 7
SST 896 74.41 19
Tamboti 77.17 6
Timbavati 73.73 24
Umlazi 78.22 4
Mean 79.45 81.60 82.29 75.85 79.89 81.25 80.66 LSDt(0,05) 2.23 0.65 0.53 3.57 0.62 0.41 1.23
* Only Bergville data
123
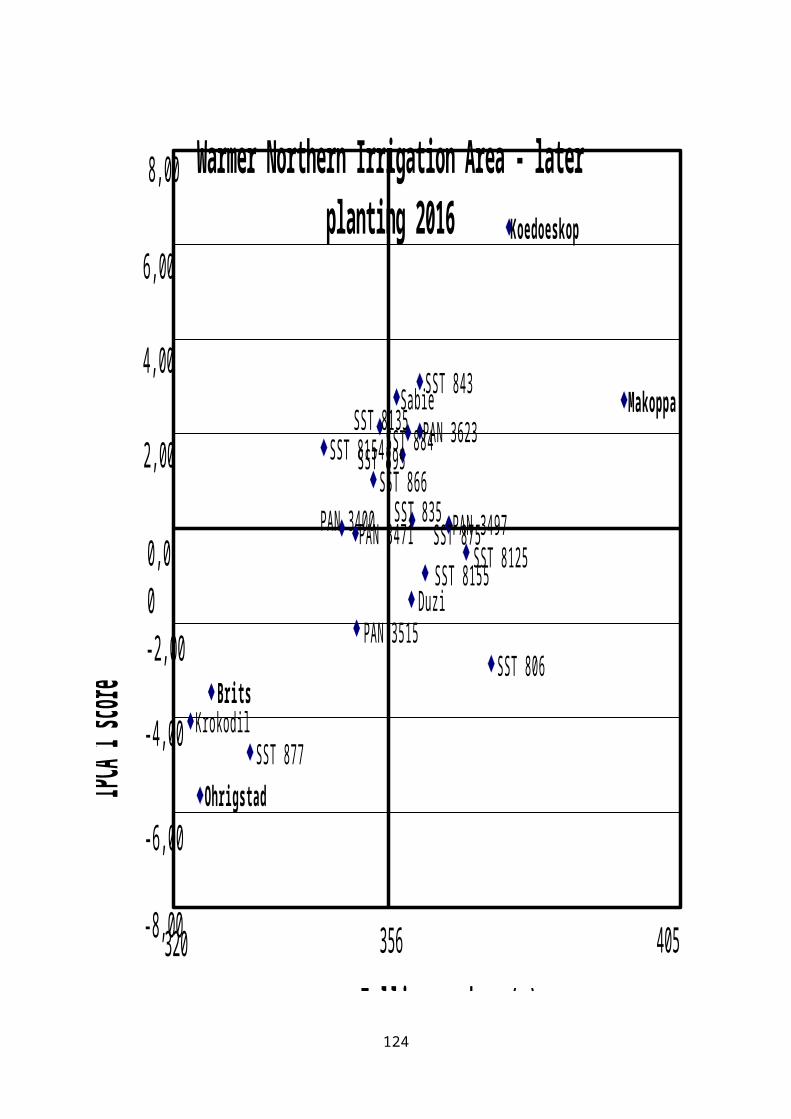
KwaZulu Natal Irrigation Area AMMI AnalysisAnova of the hectolitre mass of entries for 2016
Source Df SS MS F-Value Pr> FTotal 239 2519.8 10.54Treatments 59 1097.9 18.61 2.43 <0,001Genotypes 19 250.2 13.17 1.72 0.0372Environments 2 484.8 242.38 19.54 <0,001Block 9 111.6 12.41 1.62 0.1132Interactions 38 362.9 9.55 1.25 0.1737IPCA 20 335.9 16.80 2.19 0.0037IPCA 18 27.0 1.50 0.20 0.9999Residuals 0 0.0Error 171 1310.3 7.66
Genotype means and scores for hectolitre mass (kg/hl)
Entry Genotype Hectolitre mass Rank Score1 Duzi 79.35 13 -0.113612 Krokodil 79.66 9 0.274363 PAN 3400 78.34 17 0.299704 PAN 3471 80.74 3 -0.091805 PAN 3497 81.25 1 0.140146 PAN 3515 79.99 6 0.381117 PAN 3623 80.03 5 0.132228 Sabie 78.45 16 -0.107529 SST 806 80.10 4 0.58318
10 SST 8125 79.62 11 0.3271511 SST 8135 76.84 20 -2.6170212 SST 8154 79.85 8 -0.3076613 SST 8155 78.34 17 0.3085114 SST 835 79.59 12 0.3879015 SST 843 80.91 2 -0.6483816 SST 866 79.22 14 0.1656617 SST 875 79.65 10 0.4949918 SST 877 78.23 19 0.6369719 SST 884 78.82 15 -0.0270220 SST 895 79.96 7 -0.21889
Mean 79.45 Coefficient of variation (%) 3.50 LSDt(0,05) 2.23
Environment means and scores for hectolitre mass (kg/hl)
Entry Environment Hectolitre mass Rank Score1 Bergville (Britz) 81.19 1 2.445452 Bergville (Potgieter) 79.45 2 -0.911703 Colenso 77.71 3 -1.53375
Mean 79.45 Coefficient of variation (%) 3.50 LSDt(0.05) 0.86
124

Duzi
KrokodilPAN 3400
PAN 3471PAN 3497
PAN 3515PAN 3623
Sabie
SST 806SST 8125
SST 8135
SST 8154
SST 8155 SST 835
SST 843
SST 866SST 875SST 877
SST 884SST 895
Bergville Brits
Bergville Potgieter
Colenso
KwaZulu-Natal Irrigation Area - 2016
Hectolitre mass (kg/hl)
IPCA 1 sc
ore
2.00
1,00
0.00
-3,00
-1,00
76,80 82,1079,45
-2.00
3,00
77,00
125

KwaZulu-Natal Irrigation AreaAverage protein content (%) of entries during the full or partial period from 2013- 2016
Cultivar 2016 R 2015 R 2014 R * 2013 R4 year
average R3 year
average R2 year
average R2013-2016
2014-2016
2015-2016
Buffels 15.34 2 12.83 2 14.10 7
Duzi 12.46 10 14.49 12 12.56 5 13.63 18 13.28 6 13.17 6 13.48 8
Koedoes 14.57 10
Krokodil 11.67 20 13.81 23 11.44 19 12.96 24 12.47 14 12.31 16 12.74 18
PAN 3400 12.80 5 14.34 15 12.07 15 13.78 14 13.25 8 13.07 9 13.57 6
PAN 3471 12.45 12 14.26 16 12.23 12 13.58 20 13.13 11 12.98 11 13.36 13
PAN 3478 13.76 15
PAN 3489 12.42 7 13.64 17
PAN 3497 12.26 17 14.24 17 11.90 17 14.18 6 13.15 10 12.80 12 13.25 15
PAN 3515 11.95 19 13.91 21 11.97 16 12.61 15 12.93 17
PAN 3623 13.15 3 14.69 7 12.78 3 13.54 3 13.92 4
Renoster 14.20 19
Sabie 12.86 4 15.18 4 12.41 8 13.48 21 13.48 3 13.48 4 14.02 3
SST 806 12.30 16 14.59 9 12.38 9 14.05 8 13.33 5 13.09 8 13.45 11
SST 8125 12.39 14 14.54 11 13.47 9
SST 8134 14.69 7
SST 8135 12.56 7 14.49 12 13.53 5
SST 8154 12.66 6
SST 8155 12.07 18
SST 822 14.96 2
SST 835 12.55 8 14.22 18 12.24 11 13.59 19 13.15 9 13.00 10 13.39 12
SST 843 14.29 1 16.01 1 14.37 1 16.06 1 15.18 1 14.89 1 15.15 1
SST 866 12.41 13 13.86 22 12.12 13 13.85 11 13.06 12 12.80 13 13.14 16
SST 867 15.20 3 12.09 14 14.55 3
SST 875 12.33 15 14.19 20 11.86 18 13.32 23 12.92 13 12.79 14 13.26 14
SST 876 13.82 13
SST 877 12.52 9 14.87 6 12.27 10 14.01 9 13.42 4 13.22 5 13.70 5
SST 884 12.46 10 14.44 14 12.48 6 13.67 16 13.26 7 13.13 7 13.45 10
SST 895 13.39 2 14.94 5 12.76 4 14.42 4 13.88 2 13.70 2 14.17 2
SST 896 13.84 12
Tamboti 13.94 10
Timbavati 14.28 5
Umlazi 13.38 22
Mean 12.58 14.57 12.38 13.95 13.35 13.16 13.55 LSDt(0,05) 0.60 0.44 0.43 0.58 0.26 0.29 0.38
* Only Bergville data
126
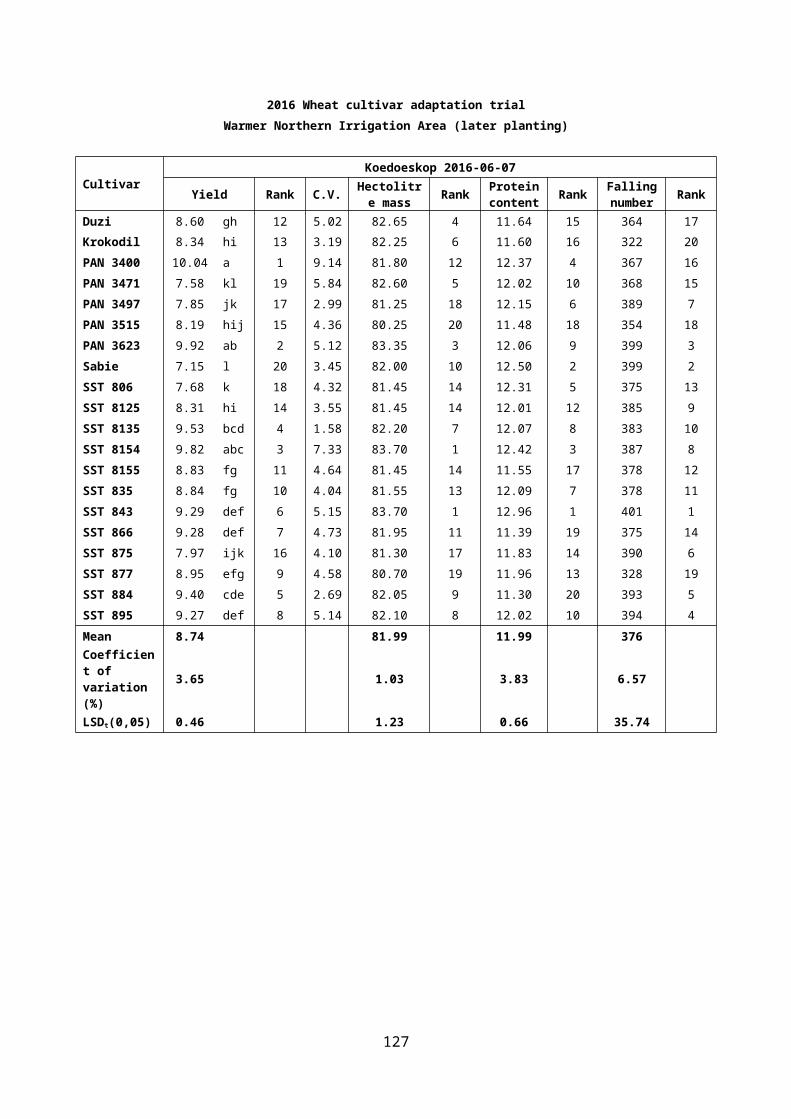
KwaZulu Natal Irrigation Area AMMI AnalysisAnova of the protein content of entries for 2016
Source Df SS MS F-Value Pr> FTotal 239 289.66 1.212Treatments 59 186.14 3.155 6.30 <0,001Genotypes 19 70.43 3.707 7.40 <0,001Environments 2 91.74 45.869 23.10 <0,001Block 9 17.87 1.985 3.96 <0,001Interactions 38 23.97 0.631 1.26 0.1628IPCA 20 15.68 0.784 1.56 0.0664IPCA 18 8.30 0.461 0.92 0.5549Residuals 0 0.00Error 171 85.65 0.501
Genotype means and scores for protein content (%)
Entry Genotype Protein content Rank Score1 Duzi 12.46 10 -0.110432 Krokodil 11.67 20 0.047213 PAN 3400 12.80 5 0.290184 PAN 3471 12.45 12 -0.354795 PAN 3497 12.26 17 0.111196 PAN 3515 11.95 19 0.112127 PAN 3623 13.15 3 0.359898 Sabie 12.86 4 -0.351619 SST 806 12.30 16 0.50082
10 SST 8125 12.39 14 0.0944411 SST 8135 12.56 7 0.2386412 SST 8154 12.66 6 0.2638113 SST 8155 12.07 18 0.4331614 SST 835 12.55 8 -0.0099015 SST 843 14.29 1 -0.5738616 SST 866 12.41 13 -0.1706217 SST 875 12.33 15 -0.0706218 SST 877 12.52 9 0.1588519 SST 884 12.46 10 -0.3334620 SST 895 13.39 2 -0.63502
Mean 12.58 Coefficient of variation (%) 5.90 LSDt(0,05) 0.60
Environment means and scores for protein content (%)
Entry Environment Protein content Rank Score1 Bergville (Britz) 13.39 1 -1.060102 Bergville (Potgieter) 11.89 3 0.146673 Colenso 12.45 2 0.91343
Mean 12.58 Coefficient of variation (%) 5.90 LSDt(0.05) 0.23
127

DuziKrokodil
PAN 3400
PAN 3471
PAN 3497PAN 3515
PAN 3623
Sabie
SST 806
SST 8125SST 8135SST 8154
SST 8155
SST 835
SST 843
SST 866SST 875
SST 877
SST 884
SST 895
Bergville Brits
Bergville Potgieter
Colenso
KwaZulu-Natal Irrigation Area - 2016
Protein content (%)
IPCA 1 sc
ore
1.00
0,50
0.00
-1,50
-0,50
11,60 14,6012,58
-1.00
1,50
12,00
128

KwaZulu-Natal Irrigation AreaAverage falling number (s) of entries during the full or partial period from 2013- 2016
Cultivar 2016 R 2015 R 2014 R * 2013 R4 year
average R3 year
average R2 year
average R2013-2016
2014-2016
2015-2016
Buffels 304 16 297 8 330 4
Duzi 331 14 303 17 246 17 318 8 299 12 293 14 317 13
Koedoes 318 1
Krokodil 290 20 297 21 190 19 284 18 265 14 259 16 293 18
PAN 3400 349 2 309 9 282 14 320 7 315 3 313 8 329 2
PAN 3471 335 11 318 2 289 12 280 19 305 7 314 7 327 6
PAN 3478 332 3
PAN 3489 307 5 302 11
PAN 3497 330 15 308 12 286 13 287 15 303 8 308 11 319 11
PAN 3515 332 13 301 20 276 15 303 13 316 16
PAN 3623 320 19 313 7 217 18 283 15 316 15
Renoster 295 22
Sabie 333 12 317 4 275 16 350 1 319 2 308 10 325 8
SST 806 336 9 309 10 316 1 243 23 301 10 320 3 322 9
SST 8125 344 4 316 5 330 1
SST 8134 306 15
SST 8135 324 18 309 10 317 11
SST 8154 338 7
SST 8155 329 16
SST 822 266 20
SST 835 340 6 315 6 303 6 252 21 303 9 319 4 328 4
SST 843 349 1 308 12 314 3 195 24 291 13 324 1 329 3
SST 866 345 3 307 14 315 2 291 14 314 4 322 2 326 7
SST 867 301 19 300 7 295 13
SST 875 327 17 310 8 291 11 298 12 306 6 309 9 318 12
SST 876 286 17
SST 877 335 10 293 23 293 10 309 9 307 5 307 12 314 17
SST 884 336 8 318 3 297 9 248 22 300 11 317 6 327 5
SST 895 340 5 303 18 313 4 338 2 323 1 319 5 321 10
SST 896 286 16
Tamboti 325 5
Timbavati 304 10
Umlazi 325 5
Mean 333 308 285 294 304 307 321 LSDt(0,05) 12.90 14.54 16.54 11.70 9.30 8.60 9.60
* Only Bergville data
129
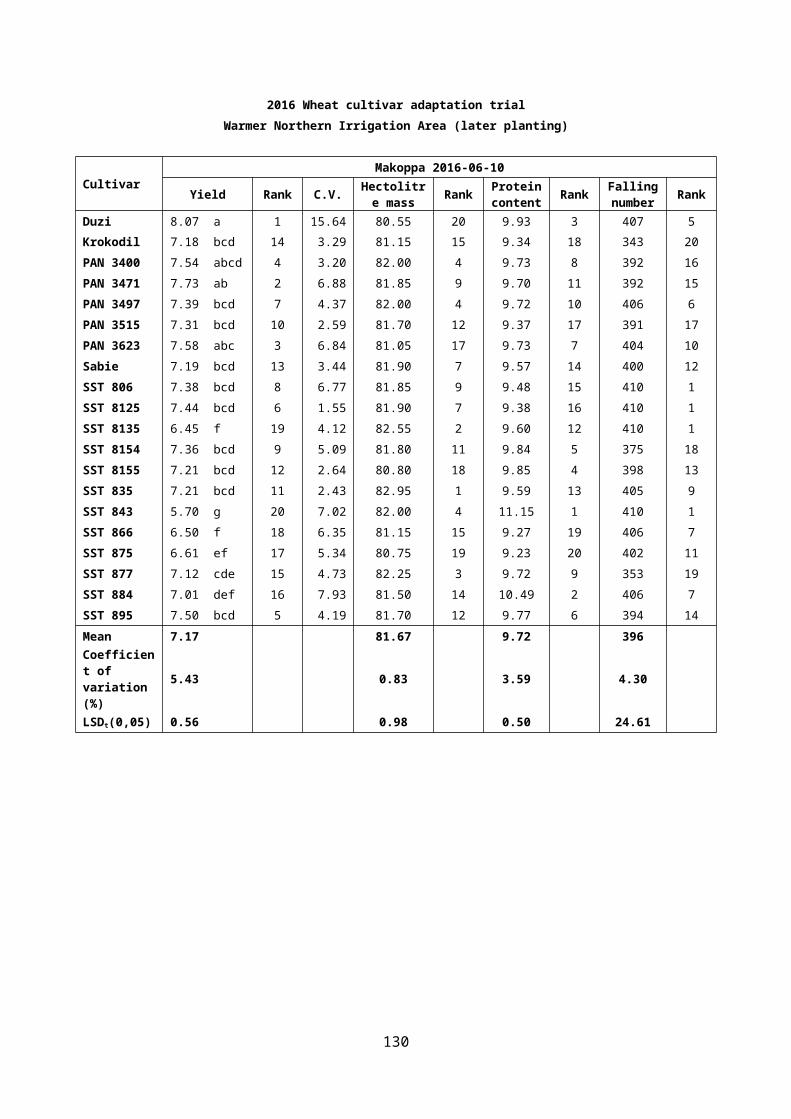
KwaZulu Natal Irrigation Area AMMI AnalysisAnova of the falling number of entries for 2016
Source Df SS MS F-Value Pr> FTotal 239 713080 2984Treatments 59 667350 11311 46.57 <0,001Genotypes 19 37255 1961 8.07 <0,001Environments 2 613467 306734 657.10 <0,001Block 9 4201 467 1.92 0.0518Interactions 38 16628 438 1.80 0.0060IPCA 20 12239 612 2.52 <0,001IPCA 18 4389 244 1.00 0.4578Residuals 0 0Error 171 41530 243
Genotype means and scores for falling number (s)
Entry Genotype Falling number Rank Score1 Duzi 331 14 0.063072 Krokodil 290 20 -3.167373 PAN 3400 349 2 -1.835024 PAN 3471 335 11 1.668945 PAN 3497 330 15 1.081686 PAN 3515 332 13 0.818897 PAN 3623 320 19 4.102908 Sabie 333 12 1.711909 SST 806 336 9 0.18204
10 SST 8125 344 4 0.1525211 SST 8135 324 18 -1.1331412 SST 8154 338 7 0.3947113 SST 8155 329 16 -0.2555714 SST 835 340 6 -0.6254415 SST 843 349 1 -2.2401116 SST 866 345 3 -0.9639717 SST 875 327 17 -0.8233118 SST 877 335 10 -1.8499119 SST 884 336 8 0.4021620 SST 895 340 5 2.31504
Mean 333 Coefficient of variation (%) 4.80 LSDt(0,05) 12.90
Environment means and scores for falling number (s)
Entry Environment Falling number Rank Score1 Bergville (Britz) 315 2 2.009222 Bergville (Potgieter) 402 1 3.958233 Colenso 282 3 -5.96746
Mean 333 Coefficient of variation (%) 4.80 LSDt(0.05) 5.00
130
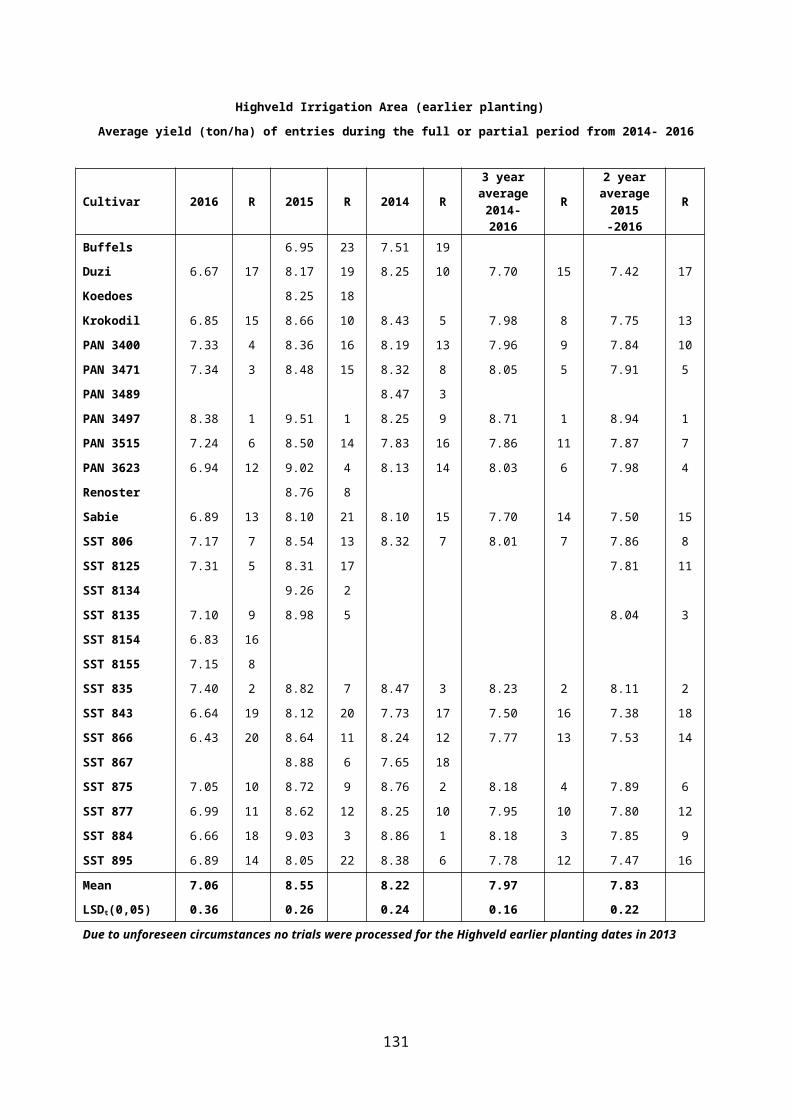
Duzi
Krokodil
PAN 3400
PAN 3471PAN 3497PAN 3515
PAN 3623
Sabie
SST 806SST 8125
SST 8135
SST 8154SST 8155
SST 835
SST 843
SST 866SST 875
SST 877
SST 884
SST 895Bergville Brits
Bergville Potgieter
Colenso
KwaZulu-Natal Irrigation Area - 2016
Falling number (s)
IPCA 1 sc
ore
4.00
2,00
0.00
-8,00
-4,00
280 433333
-6,00
6,00
-2,00
131
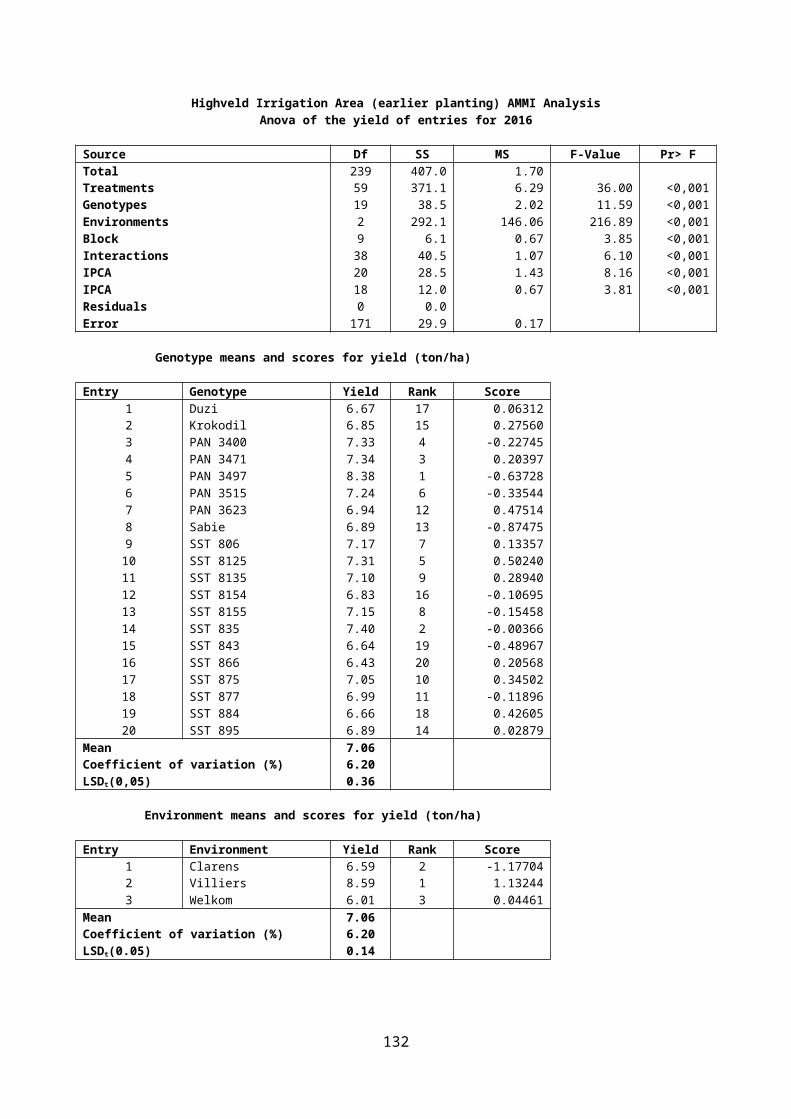
2016 Wheat cultivar adaptation trialKwaZulu Natal Irrigation Area
CultivarBergville (Britz) 2016-05-24
Yield Rank C.V. Hectolitre mass Rank Protein
content Rank Falling number Rank
Duzi 8.59 a 1 0.88 80.78 16 13.38 10 317 10
Krokodil 7.45 defg 13 8.67 82.03 9 12.34 19 275 20
PAN 3400 8.15 abcd 4 7.67 80.73 17 13.52 7 328 3
PAN 3471 7.52 cdefg 12 0.71 82.33 5 13.73 4 321 7
PAN 3497 5.55 i 20 6.68 83.28 1 12.89 16 310 15
PAN 3515 8.09 abcd 5 10.88 82.63 3 12.65 17 308 17
PAN 3623 7.71 bcdef 10 3.90 82.10 8 13.72 5 311 14
Sabie 6.51 h 19 14.61 79.98 19 14.07 3 316 12
SST 806 8.24 abc 3 5.28 83.20 2 12.61 18 312 13
SST 8125 7.97 abcde 8 6.68 82.20 7 13.10 14 330 2
SST 8135 8.07 abcd 6 8.36 72.13 20 13.21 11 292 19
SST 8154 7.70 bcdef 11 4.79 80.88 14 13.05 15 324 6
SST 8155 6.99 fgh 16 5.87 80.80 15 12.18 20 308 16
SST 835 7.97 abcde 9 6.87 82.23 6 13.39 9 316 11
SST 843 6.52 h 18 11.94 81.15 12 15.56 1 326 4
SST 866 6.81 gh 17 6.37 81.48 11 13.52 7 325 5
SST 875 7.14 fgh 15 2.96 82.50 4 13.19 12 303 18
SST 877 8.07 abcd 7 5.09 81.65 10 13.15 13 319 9
SST 884 8.36 ab 2 10.01 80.60 18 13.64 6 320 8
SST 895 7.28 efg 14 6.13 81.15 12 14.88 2 340 1
Mean 7.53 81.19 13.39 315 Coefficient of variation (%) 6.86 5.56 5.64 4.69
LSDt(0,05) 0.75 6.53 1.09 21.38
132
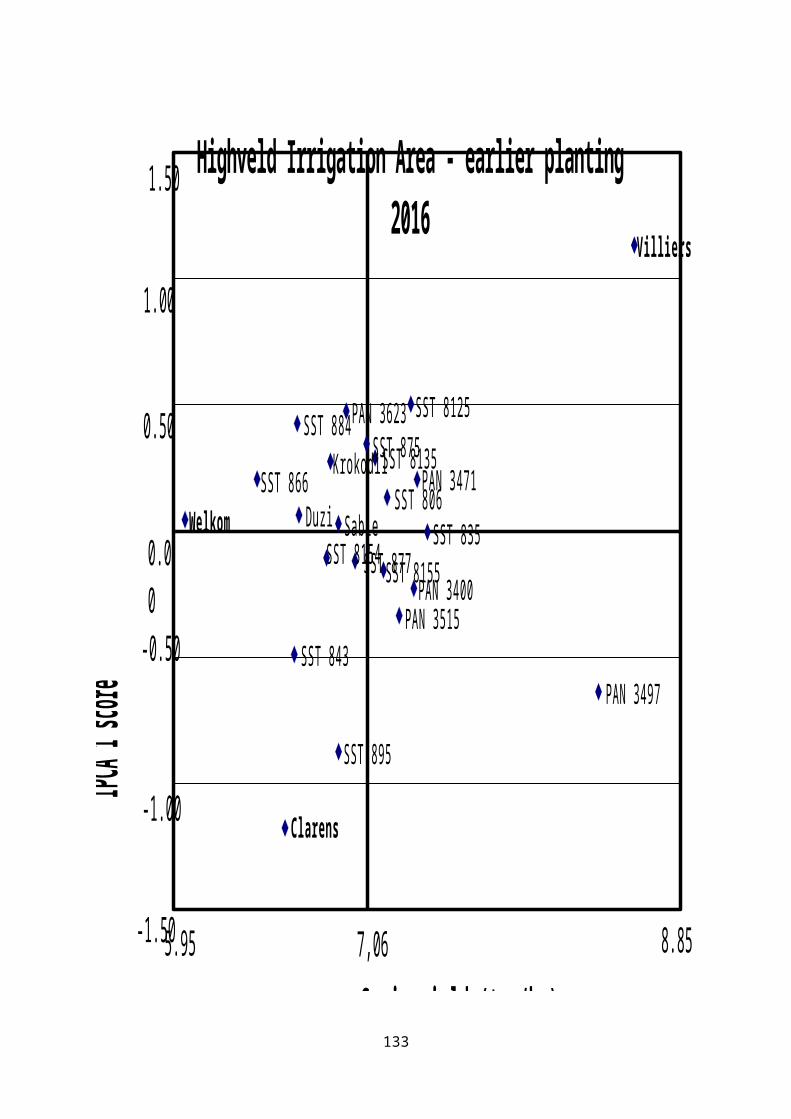
2016 Wheat cultivar adaptation trialKwaZulu Natal Irrigation Area
CultivarBergville (Potgieter) 2016-05-24
Yield Rank C.V. Hectolitre mass Rank Protein
content Rank Falling number Rank
Duzi 5.85 fghi 13 4.586 79.70 10 11.78 9 397 17
Krokodil 6.67 bcd 5 3.187 79.70 10 11.21 20 338 20
PAN 3400 6.91 bc 4 8.450 78.65 15 11.62 16 410 1
PAN 3471 5.53 hij 15 3.550 80.40 3 11.47 17 410 9
PAN 3497 5.37 ij 16 15.96 81.50 1 11.73 11 407 11
PAN 3515 7.11 b 2 6.884 79.90 6 11.28 19 410 1
PAN 3623 6.12 defg 9 10.28 79.90 6 12.17 4 406 14
Sabie 4.54 k 20 4.170 78.25 18 12.06 6 410 1
SST 806 5.76 ghi 14 6.710 80.00 5 11.64 15 410 1
SST 8125 6.36 cdef 7 0.789 79.05 14 11.74 10 410 1
SST 8135 6.59 bcde 6 6.080 79.60 12 11.67 13 398 16
SST 8154 7.89 a 1 6.575 79.90 6 12.38 3 406 12
SST 8155 4.99 jk 19 11.00 78.30 17 12.07 5 399 15
SST 835 5.36 ij 17 4.070 79.60 12 11.83 8 410 1
SST 843 6.06 efgh 11 10.79 80.95 2 13.89 1 410 1
SST 866 5.13 j 18 5.985 78.35 16 11.42 18 410 1
SST 875 6.35 def 8 4.453 79.85 9 11.68 12 397 17
SST 877 6.06 efgh 10 4.893 76.90 20 11.89 7 393 19
SST 884 5.86 fghi 12 3.513 78.15 19 11.67 13 406 12
SST 895 6.95 b 3 3.752 80.25 4 12.59 2 407 10
Mean 6.07 79.45 11.89 402 Coefficient of variation (%) 6.40 0.77 4.06 2.70
LSDt(0,05) 0.56 0.88 0.70 15.68
133
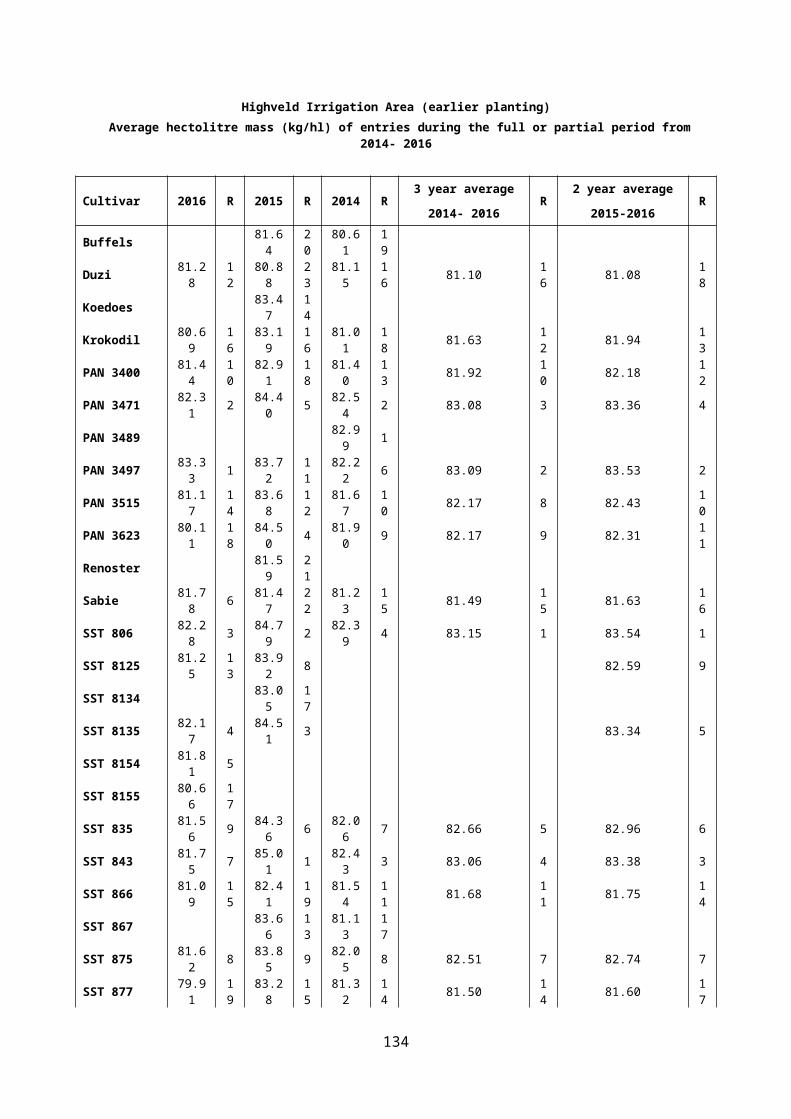
2016 Wheat cultivar adaptation trialKwaZulu Natal Irrigation Area
CultivarColenso 2016-06-14
Yield Rank C.V. Hectolitre mass Rank Protein
content Rank Falling number Rank
Duzi 6.03 ef 14 5.94 77.57 11 12.22 13 279 13
Krokodil 5.94 ef 16 3.49 77.25 13 11.45 20 256 19
PAN 3400 6.14 de 12 4.48 75.65 20 13.27 3 309 2
PAN 3471 6.89 ab 3 1.75 79.50 2 12.15 14 274 15
PAN 3497 6.94 a 2 4.50 78.97 3 12.14 15 274 16
PAN 3515 6.48 c 5 7.47 77.45 12 11.93 19 278 14
PAN 3623 6.61 bc 4 5.34 78.10 7 13.57 1 245 20
Sabie 5.51 gh 19 6.64 77.12 14 12.46 9 272 18
SST 806 6.44 cd 8 5.07 77.10 15 12.67 6 285 7
SST 8125 5.94 ef 15 5.00 77.60 10 12.34 11 291 6
SST 8135 6.96 a 1 6.16 78.80 4 12.80 4 282 10
SST 8154 6.46 c 7 6.21 78.77 5 12.55 7 285 8
SST 8155 5.51 gh 18 2.55 75.92 19 11.96 18 280 12
SST 835 6.35 cd 11 4.75 76.95 16 12.44 10 294 5
SST 843 6.03 ef 13 2.63 80.62 1 13.41 2 312 1
SST 866 5.73 fg 17 5.33 77.82 8 12.31 12 300 3
SST 875 5.31 h 20 3.10 76.60 17 12.11 16 282 11
SST 877 6.41 cd 9 4.51 76.15 18 12.52 8 294 4
SST 884 6.48 c 6 2.17 77.70 9 12.06 17 283 9
SST 895 6.35 cd 10 7.37 78.47 6 12.69 5 273 17
Mean 6.22 77.71 12.45 282 Coefficient of variation (%) 3.44 1.02 6.68 6.92
LSDt(0,05) 0.31 1.15 1.20 28.24
134