Embed Size (px)
Citation preview
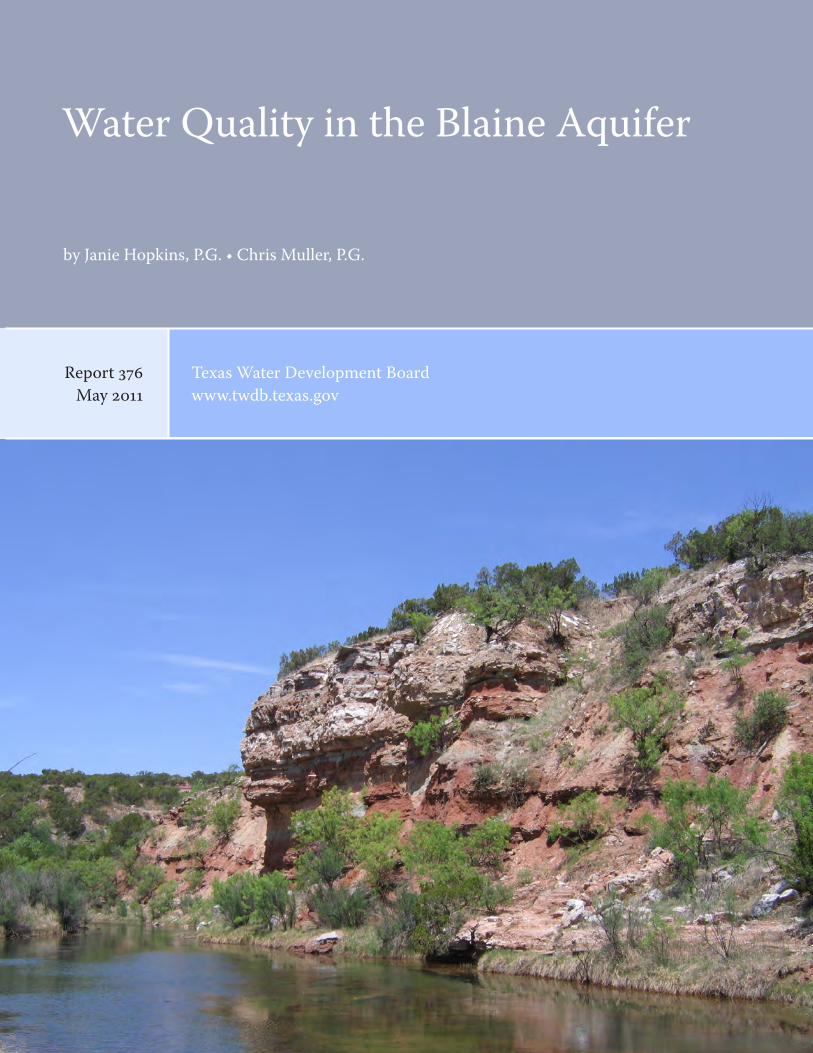
Water Quality in the Blaine Aquifer
Report 376May 2011
Texas Water Development Boardwww.twdb.texas.gov
by Janie Hopkins, P.G. • Chris Muller, P.G.

Texas Water Development Board
Report 376
Water Quality in the Blaine Aquifer of Texas
by Janie Hopkins, P.G. Chris Muller, P.G. May 2011
Geocientist Seal
The contents of this report (including figures and tables) document the work of the following Texas Licensed Geoscientists:
Janie Hopkins, P.G. No. 487
As program manager for groundwater monitoring, Ms. Hopkins conceived of the research project and the outline and wrote the report.
The seal appearing on this document was authorized on
April 27, 2011 by
Janie Hopkins
Chris Muller, P.G. No. 465
As specialist of the water quality monitoring program, Mr. Muller performed database queries for data tabulations and created all figures and tables.
The seal appearing on this document was authorized on
April 27, 2011 by
Chris Muller '\
Cover photo: Willow Creek outcrop of Blaine Formation redbeds and gypsum, King County, by Peter George, P.G.
Edited by Susann Doenges
11
iii
Texas Water Development Board
Edward G. Vaughan, Chairman, Boerne Thomas Weir Labatt III, Member, San Antonio
Joe M. Crutcher, Vice Chairman, Palestine Billy R. Bradford Jr., Member, Brownsville
Lewis H. McMahan, Member, Dallas Monte Cluck, Member, Gruver
Melanie Callahan, Interim Executive Administrator
The TWDB freely grants permission to copy and distribute its materials. The agency would appreciate acknowledgment.
Published and distributed by the
Texas Water Development Board P.O. Box 13231, Capitol Station
Austin, Texas 78711-3231
May 2011 Report 376
(Printed on recycled paper)

iv
This page is intentionally blank.
v
Table of Contents 1 Executive Summary ..................................................................................................................... 1 2 Introduction ............................................................................................................................... 2 3 Approach ............................................................................................................................... 4 4 Stratigraphy, lithology, composition, and depositional environment .......................................... 6 5 Chemistry and hydrology ............................................................................................................. 8
5.1 Characterization of Blaine Aquifer groundwater ................................................................ 10 5.1.1 Groundwater quality classification .................................................................................. 10 5.1.2 Dominant dissolved constituents ..................................................................................... 13 5.1.3 Total dissolved solids ....................................................................................................... 13 5.1.4 Chloride ........................................................................................................................... 17 5.1.5 Sulfate .............................................................................................................................. 19 5.1.6 Arsenic, selenium, nitrate, and gross alpha ..................................................................... 21 5.1.7 Iron and manganese ......................................................................................................... 27 5.1.8 Boron ............................................................................................................................... 30
6 Water quality changes over time ................................................................................................ 32 7 Conclusions ............................................................................................................................. 37 8 Acknowledgments...................................................................................................................... 38 9 References ............................................................................................................................. 39 List of Figures Figure 2-1 The Blaine Aquifer in Texas with state regional water planning boundaries. .............. 3 Figure 3-1 Water wells sampled in the Blaine Aquifer, 1988 through 2006. ................................. 5 Figure 4-1 Generalized Permian stratigraphy. ................................................................................ 6 Figure 5-1 Stiff diagrams illustrating hydrochemical facies and total dissolved solids for the Blaine Aquifer, 1988 through 2006. ............................................................................................. 15 Figure 5-2 Total dissolved solids in the Blaine Aquifer, 1938 through 2006............................... 16 Figure 5-3 Dissolved chloride in the Blaine Aquifer, 1988 through 2006 ................................... 18 Figure 5-4 Dissolved sulfate in the Blaine Aquifer, 1988 through 2006 ...................................... 20 Figure 5-5 Dissolved arsenic in the Blaine Aquifer, 1988 through 2006 ..................................... 23 Figure 5-6 Dissolved selenium in the Blaine Aquifer, 1988 through 2006. ................................. 24 Figure 5-7 Dissolved nitrate in the Blaine Aquifer, 1988 through 2006. ..................................... 25 Figure 5-8 Dissolved gross alpha in the Blaine Aquifer, 1988 thorugh 2006. ............................. 26 Figure 5-9 Dissolved iron in the Blaine Aquifer, 1988 through 2006 .......................................... 28 Figure 5-10 Dissolved manganese in the Blaine Aquifer, 1988 through 2006. ............................ 29 Figure 5-11 Dissolved boron in the Blaine Aquifer, 1988 through 2006. .................................... 31 Figure 6-1 Water wells sampled more than once in the Blaine Aquifer, 1988 through 2006.. .... 33 List of Tables Table 4-1 General geologic descriptions of Permian age stratigraphic units ................................. 7 Table 5-1 Water-bearing properties of Permian age stratigraphic units. ........................................ 9 Table 5-2 Groundwater classification system. .............................................................................. 11 Table 5-3 Samples exceeding primary and secondary drinking water standards.. ....................... 12 Table 6-1 Comparison of constituent concentration changes in Blaine Aquifer water ................ 34 Table 6-2 Summary of constituent decreases in Blaine Aquifer water ........................................ 36

vi
This page is intentionally blank.

1 Executive Summary The Blaine Aquifer, one of the 21 minor aquifers recognized in Texas, lies predominantly in a 20- to 35-mile-wide swath in the eastern portion of the Texas Panhandle. The aquifer extends from Wheeler County in the north to Nolan County in the south. Groundwater from the aquifer is almost exclusively used for irrigation of salt-tolerant crops. The sediments that formed the aquifer were deposited mainly in near-shore marine environments during the Permian Period and contain evaporitic minerals such as gypsum and halite. These minerals have influenced the water chemistry of the aquifer today. Groundwater in the Blaine Aquifer contains high levels of sulfate and chloride from the dissolution of gypsum and halite, respectively. Groundwater occurs in dissolution channels within the aquifer formation. Because of the irregular distribution of these channels, groundwater production from wells completed within the Blaine Aquifer varies greatly.
The Texas Water Development Board’s (TWDB) groundwater database (February, 2009) contains water quality information on 555 samples from wells in the Blaine Aquifer collected from 1938 through 2006. This report summarizes information from 73 analyzed water samples collected at 55 wells since 1988. Four chemical constituents with primary drinking water standards, or maximum contaminant levels, have concentrations in excess of their respective standards: arsenic, gross alpha (radionuclide particles), nitrate, and selenium. Arsenic occurs in excess of its maximum contaminant level in 5 percent of the analyses (two samples), gross alpha in 10 percent (two samples), nitrate in 15 percent (10 of 59 samples), and selenium in 17 percent (11 of 73 samples).
Numerous wells also contain dissolved constituents in excess of their secondary drinking water standards. Total dissolved solids exceed their standard in 97 percent of the samples, sulfate in 99 percent, chloride in 29 percent, iron in 13 percent, and manganese in 5 percent. With a median total dissolved solids concentration of 2,835 milligrams per liter, groundwater in the Blaine Aquifer is classified as slightly saline. This relatively high salinity content is the main factor limiting use of the water.
To compare water quality changes over time, we reviewed data for several of the major ions and dissolved solids from wells sampled from 1988 through 2006. As many as 11 wells sampled during this period show progressive decreases in total dissolved solids, nitrate, chloride, sulfate, sodium, and calcium. That is, these wells record a freshening of groundwater in parts of the aquifer.
Although slight decreases in chemical constituents have occurred in several wells, resulting in marginal improvement in water quality, overall the untreated groundwater from the Blaine Aquifer still is characterized as unacceptable for drinking. The groundwater is suitable mainly for irrigation of salt-tolerant crops, livestock, and certain industrial uses. The aquifer also holds potential for desalination projects because of the large volume of brackish water present and its proximity to high water demand areas of the state. Continuation of routine water quality analysis for major and trace elements, initiated in the early nineties, will make it possible to describe more accurately any changes in the water quality and to evaluate the potential of the groundwater for compliance with drinking water standards.
2
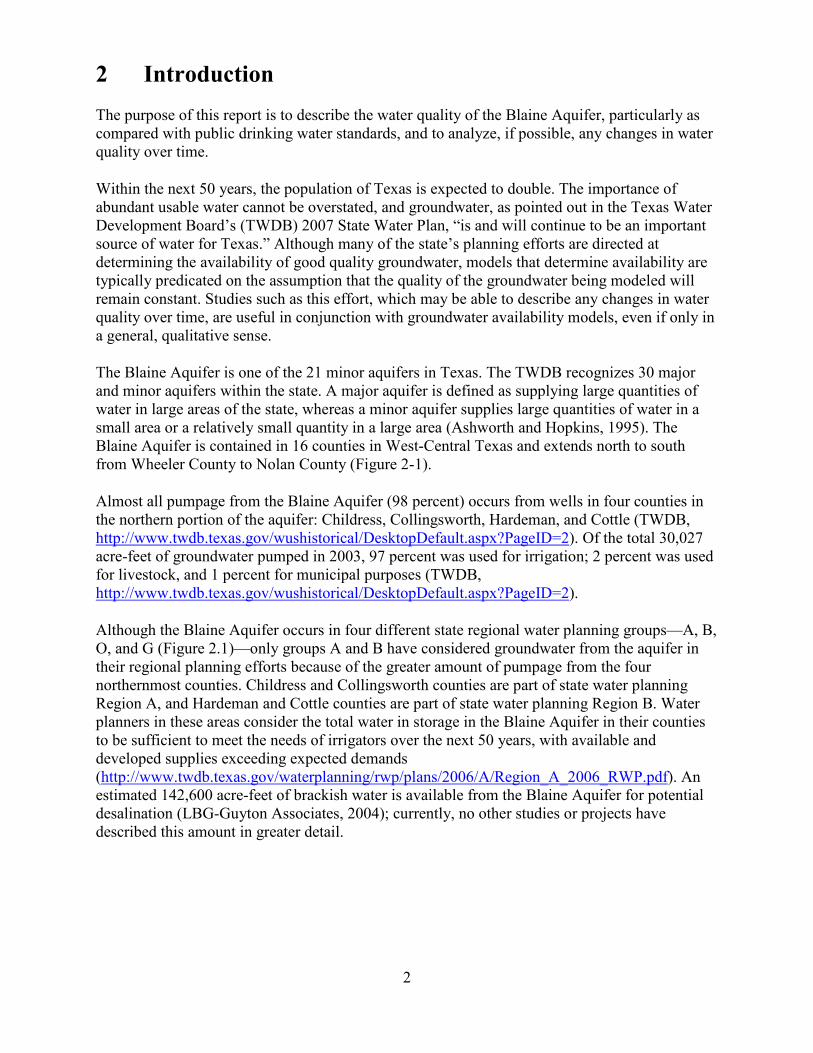
2 Introduction The purpose of this report is to describe the water quality of the Blaine Aquifer, particularly as compared with public drinking water standards, and to analyze, if possible, any changes in water quality over time.
Within the next 50 years, the population of Texas is expected to double. The importance of abundant usable water cannot be overstated, and groundwater, as pointed out in the Texas Water Development Board’s (TWDB) 2007 State Water Plan, “is and will continue to be an important source of water for Texas.” Although many of the state’s planning efforts are directed at determining the availability of good quality groundwater, models that determine availability are typically predicated on the assumption that the quality of the groundwater being modeled will remain constant. Studies such as this effort, which may be able to describe any changes in water quality over time, are useful in conjunction with groundwater availability models, even if only in a general, qualitative sense.
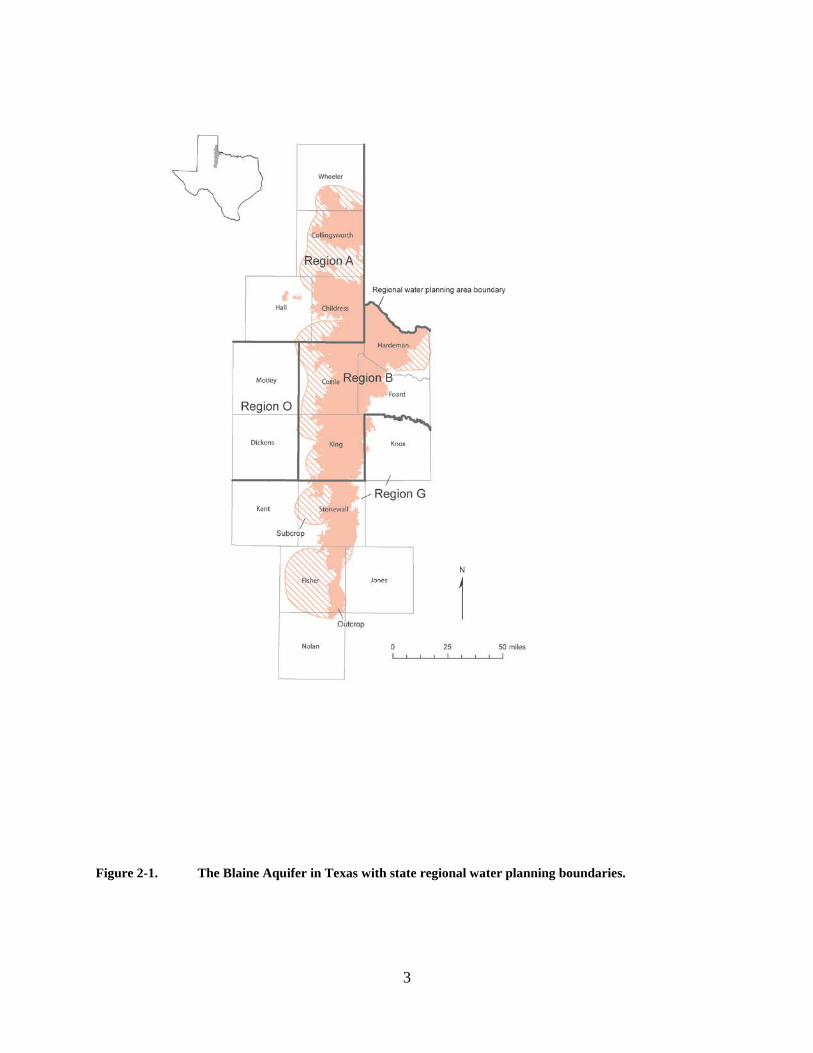
The Blaine Aquifer is one of the 21 minor aquifers in Texas. The TWDB recognizes 30 major and minor aquifers within the state. A major aquifer is defined as supplying large quantities of water in large areas of the state, whereas a minor aquifer supplies large quantities of water in a small area or a relatively small quantity in a large area (Ashworth and Hopkins, 1995). The Blaine Aquifer is contained in 16 counties in West-Central Texas and extends north to south from Wheeler County to Nolan County (Figure 2-1).
Almost all pumpage from the Blaine Aquifer (98 percent) occurs from wells in four counties in the northern portion of the aquifer: Childress, Collingsworth, Hardeman, and Cottle (TWDB, http://www.twdb.texas.gov/wushistorical/DesktopDefault.aspx?PageID=2). Of the total 30,027 acre-feet of groundwater pumped in 2003, 97 percent was used for irrigation; 2 percent was used for livestock, and 1 percent for municipal purposes (TWDB, http://www.twdb.texas.gov/wushistorical/DesktopDefault.aspx?PageID=2).
Although the Blaine Aquifer occurs in four different state regional water planning groups—A, B, O, and G (Figure 2.1)—only groups A and B have considered groundwater from the aquifer in their regional planning efforts because of the greater amount of pumpage from the four northernmost counties. Childress and Collingsworth counties are part of state water planning Region A, and Hardeman and Cottle counties are part of state water planning Region B. Water planners in these areas consider the total water in storage in the Blaine Aquifer in their counties to be sufficient to meet the needs of irrigators over the next 50 years, with available and developed supplies exceeding expected demands (http://www.twdb.texas.gov/waterplanning/rwp/plans/2006/A/Region_A_2006_RWP.pdf). An estimated 142,600 acre-feet of brackish water is available from the Blaine Aquifer for potential desalination (LBG-Guyton Associates, 2004); currently, no other studies or projects have described this amount in greater detail.
3
Figure 2-1. The Blaine Aquifer in Texas with state regional water planning boundaries.
4
3 Approach For this study, we used information from wells described in the TWDB groundwater database as completed in the Blaine Aquifer. This database contains 555 water quality records from Blaine wells sampled from 1938 to 2006, not all of which contain analyses for all constituents. To ensure the best data quality, however, we only included analyses from the database that met the following two standards:
First, to rely on the the most accurate chemical analyses, we used only analyses that were chemically balanced. Chemically balanced analyses are those in which the sum of positively charged cations (primarily calcium, magnesium, and potassium) is equal to the sum of the negatively charged anions (primarily chloride, sulfate, and nitrate). The groundwater database contains the formula for calculating the charge balance, defined as follows: (sum of cations – sum of anions)/(sum of cations + anions) × 100. If the charge balance is between –5 and 5 percent, the analysis is considered chemically balanced; otherwise, the sample is chemically unbalanced.
Second, to ensure consistently better analytical results, we only considered the results of analyses from 1988 forward, a time when the TWDB started collecting water quality samples using more rigorous sampling protocols. These sampling techniques, outlined in the TWDB sampling manual (TWDB, 2003), specify that temperature, conductivity, and pH must be stabilized before the water samples are collected. The samples are filtered and field tested for alkalinity, preserved as applicable, and kept chilled and delivered to the lab—all within appropriate holding times.
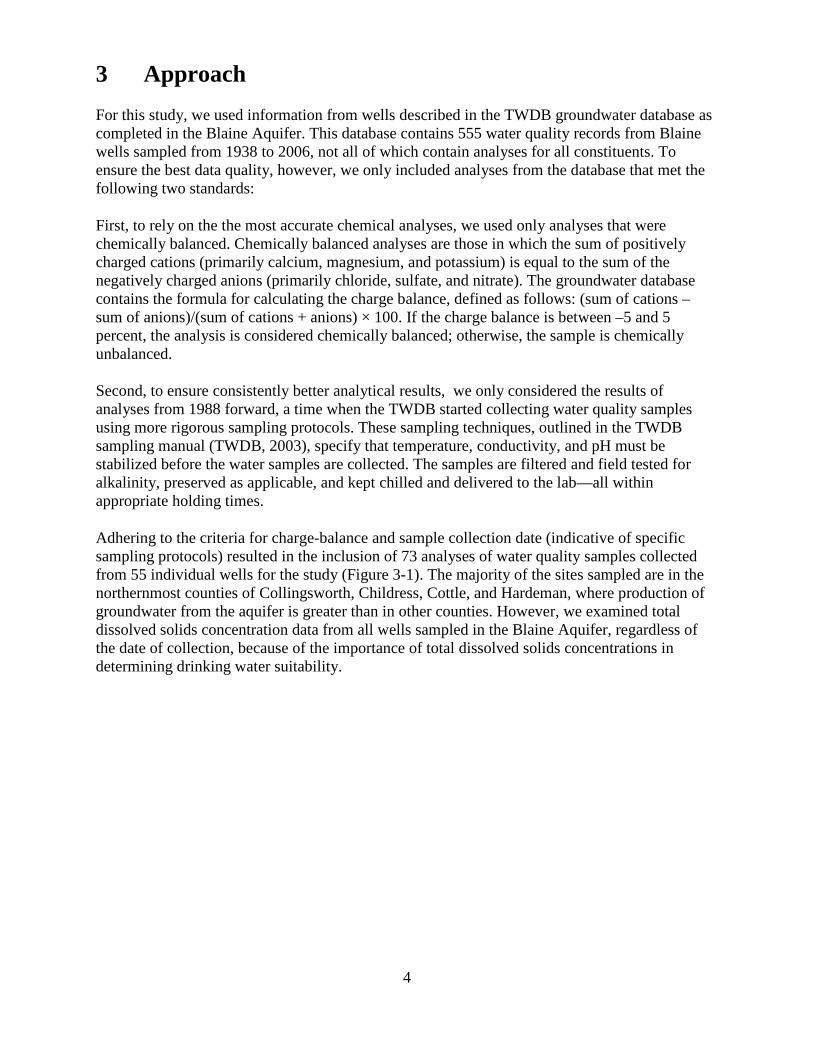
Adhering to the criteria for charge-balance and sample collection date (indicative of specific sampling protocols) resulted in the inclusion of 73 analyses of water quality samples collected from 55 individual wells for the study (Figure 3-1). The majority of the sites sampled are in the northernmost counties of Collingsworth, Childress, Cottle, and Hardeman, where production of groundwater from the aquifer is greater than in other counties. However, we examined total dissolved solids concentration data from all wells sampled in the Blaine Aquifer, regardless of the date of collection, because of the importance of total dissolved solids concentrations in determining drinking water suitability.
5
Figure 3.1. Wells sampled in the Blaine Aquifer, 1988 through 2006.
6
4 Stratigraphy, lithology, composition, and depositional environment
The Blaine Aquifer is part of the Pease River Group (Figure 4-1 and Table 4-1), deposited approximately 300 to 250 million years ago during the Permian Period of the Paleozoic Era (Ewing and others, 2004). The aquifer is confined by the overlying Dog Creek Shale and is underlain by the Flowerpot Shale, also part of the Pease River Group (Table 4-1).
The Blaine Aquifer is composed primarily of red silty shale and sandstone or dolomite interbedded with gypsum, halite, and anhydrite. The evaporite layers may range from 10 to 30 feet thick. Regionally, the formation is as much as 1,200 feet thick (LBG-Guyton Associates, 2003).
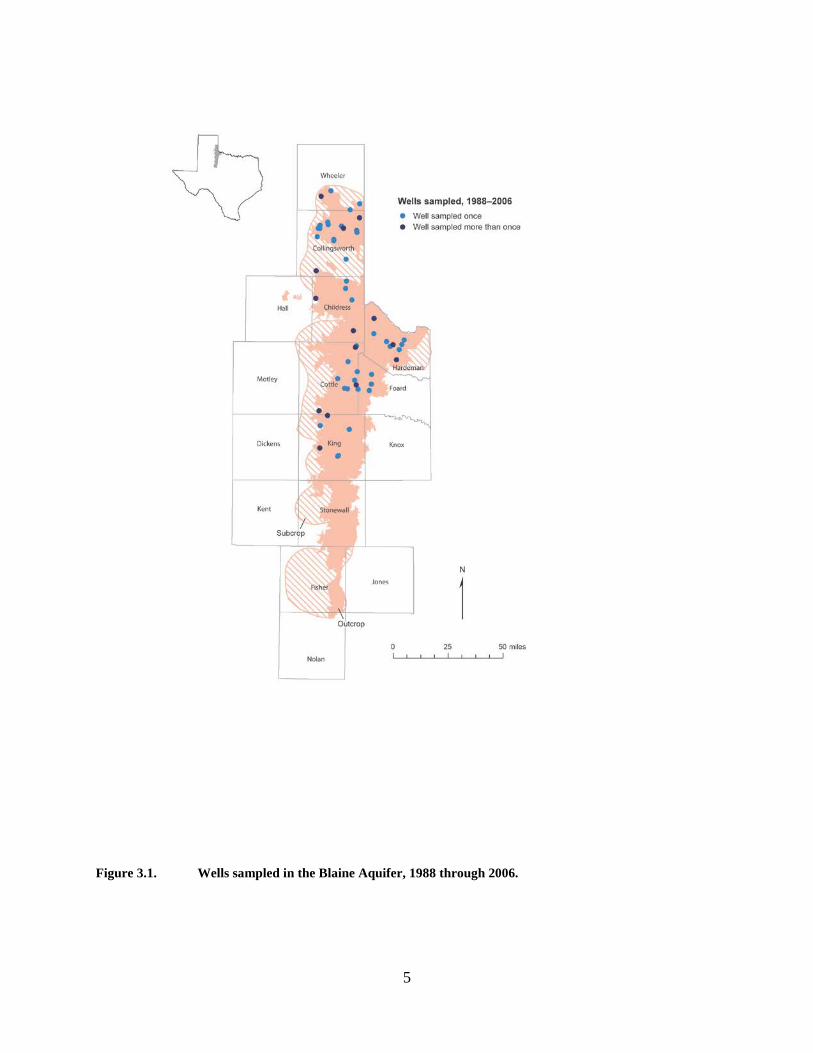
Deposition of red beds (sedimentary layers colored red owing to the presence of iron oxides) and evaporites (sedimentary rocks such as gypsum and halite that form as water evaporates from a lake or ocean) occurred when much of the southwestern United States was covered by a broad and shallow sea. The gypsum beds, along with minor amounts of dolomite (magnesium-rich limestone), originated from the shallow marine sea. In other areas, non-marine sandstone and mudstone (or shale) were deposited as stream and river sediments (Ewing and others, 2004). Westerly tilting caused by development of the Concho Arch (Price, 1979) has resulted in the westerly dip of the Permian strata (Figure 4-1). After deposition of sediments during the Late Permian and Triassic Periods, the area was elevated and extensively eroded (Gould, 1906). With a land surface dipping to the east, increasingly younger rocks are preserved from east to west (Ewing and others, 2004).
Figure 4.1. Schematic stratigraphic succession of Permian sediments in the study area showing regional dip of the Pease River Group containing Blaine Gypsum (Ewing and others, 2004).
7
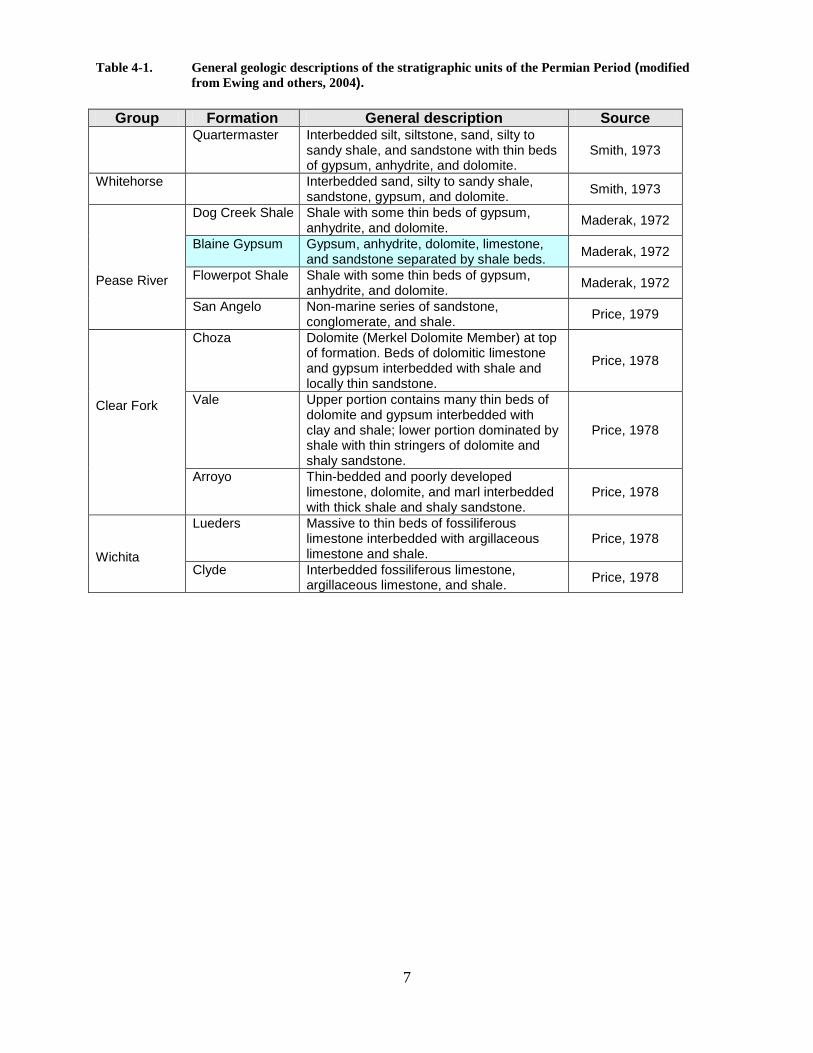
Table 4-1. General geologic descriptions of the stratigraphic units of the Permian Period (modified from Ewing and others, 2004).
Group Formation General description Source Quartermaster Interbedded silt, siltstone, sand, silty to
sandy shale, and sandstone with thin beds of gypsum, anhydrite, and dolomite.
Smith, 1973
Whitehorse Interbedded sand, silty to sandy shale, sandstone, gypsum, and dolomite. Smith, 1973
Pease River
Dog Creek Shale Shale with some thin beds of gypsum, anhydrite, and dolomite. Maderak, 1972
Blaine Gypsum Gypsum, anhydrite, dolomite, limestone, and sandstone separated by shale beds. Maderak, 1972
Flowerpot Shale Shale with some thin beds of gypsum, anhydrite, and dolomite. Maderak, 1972
San Angelo Non-marine series of sandstone, conglomerate, and shale. Price, 1979
Clear Fork
Choza Dolomite (Merkel Dolomite Member) at top of formation. Beds of dolomitic limestone and gypsum interbedded with shale and locally thin sandstone.
Price, 1978
Vale Upper portion contains many thin beds of dolomite and gypsum interbedded with clay and shale; lower portion dominated by shale with thin stringers of dolomite and shaly sandstone.
Price, 1978
Arroyo Thin-bedded and poorly developed limestone, dolomite, and marl interbedded with thick shale and shaly sandstone.
Price, 1978
Wichita
Lueders Massive to thin beds of fossiliferous limestone interbedded with argillaceous limestone and shale.
Price, 1978
Clyde Interbedded fossiliferous limestone, argillaceous limestone, and shale. Price, 1978
8
5 Chemistry and hydrology Post-depositional diagenetic events further modified the original Blaine Formation deposits. Diagenesis is considered to be all processes, especially chemical, that produce changes in sediments after their deposition but before their final lithification. Diagenesis occurs under low-temperature and low-pressure conditions involving such processes as cementation, reworking of sediments, replacement of sedimentary grains, crystallization of minerals, and leaching or dissolution of any part of the soluble minerals that result in changes to the hydraulic characteristics of the sediments. The dissolution process has been most influential in Blaine Aquifer water chemistry.
When precipitation falls on the land, some of the water infiltrates the ground and percolates down into the formation, a process also known as groundwater recharge. Recharge is especially important in the formation of an aquifer. As water moves through the ground, it dissolves or leaches minerals from soil and rock. The dissolved minerals are in the form of ions, or particles having either a negative charge (anions) or a positive charge (cations). The concentration of these ions determines the quality of the water.
Dissolution from the downward percolation of freshwater into the formation has been occurring for unknown periods of time in the millions of years after its deposition and during erosion of overlying, younger sediments. This dissolution has occurred particularly within the more soluble layers of evaporitic minerals. Dissolution from halite (NaCl), anhydrite (CaSO4), and gypsum (CaSO4·2H2O) has contributed to the high total dissolved solids concentrations in Blaine Aquifer water.
Groundwater in the Blaine Aquifer occurs primarily in dissolution channels and caverns within the beds of anhydrite and gypsum. Productivity of a well depends on the number and size of dissolution channels intersected by the wellbore. Because of the irregular distribution of dissolution channels within the formation, well yields in the Blaine Aquifer vary greatly (LBG-Guyton Associates, 2003) (Table 5-1), making predictions of productivity difficult in nearby wells or across the aquifer. Wells having relatively low production rates (less than 3 gallons per minute) may be close to wells having higher production rates (525 gallons per minute). Several wells may yield more than 1,000 gallons per minute, but most of the wells have yields of less than 10 gallons per minute (TWDB groundwater database, 2009).
Recharge to the Blaine Aquifer is through the infiltration of precipitation on the outcrop. Groundwater then moves downdip predominantly along dissolution channels in the gypsum, anhydrite, and halite beds (LBG-Guyton Associates, 2003). Groundwater discharge occurs in topographically low areas, contaminating rivers and tributaries that flow through the area and producing salt seeps and springs that tend to be very high in total dissolved solids (LBG-Guyton Associates, 2003). This salt water contamination of surface water courses from groundwater discharges has long been recognized as a problem in the area.
In general, the groundwater flows to the west toward the downdip or subcrop portion of the aquifer (Ewing and others, 2004). However, in Hardeman County the direction is reversed, and the groundwater flows downdip to the east (Maderak, 1973). Furthermore, the beds of gypsum
9
and dolomite are relatively impermeable in the subcropping portion of the aquifer. Groundwater movement in the deeper parts of the aquifer is therefore greatly reduced (Maderak, 1973). Groundwater movement is also influenced artificially by pumping wells, resulting in groundwater movement from all directions toward the centers of pumping and localized areas of depression in the water table (Smith, 1970).
The saturated thickness of the Blaine Aquifer reaches 300 feet, but much of this water is slightly to moderately saline. Fresh groundwater (containing less than 1,000 milligrams per liter total dissolved solids) from the Blaine is scarce. It is typically found in topographically high areas where the formation crops out and where recharge from precipitation has occurred, or possibly from overlying alluvium sediments in which the groundwater is less saline (LBG-Guyton Associates, 2003).
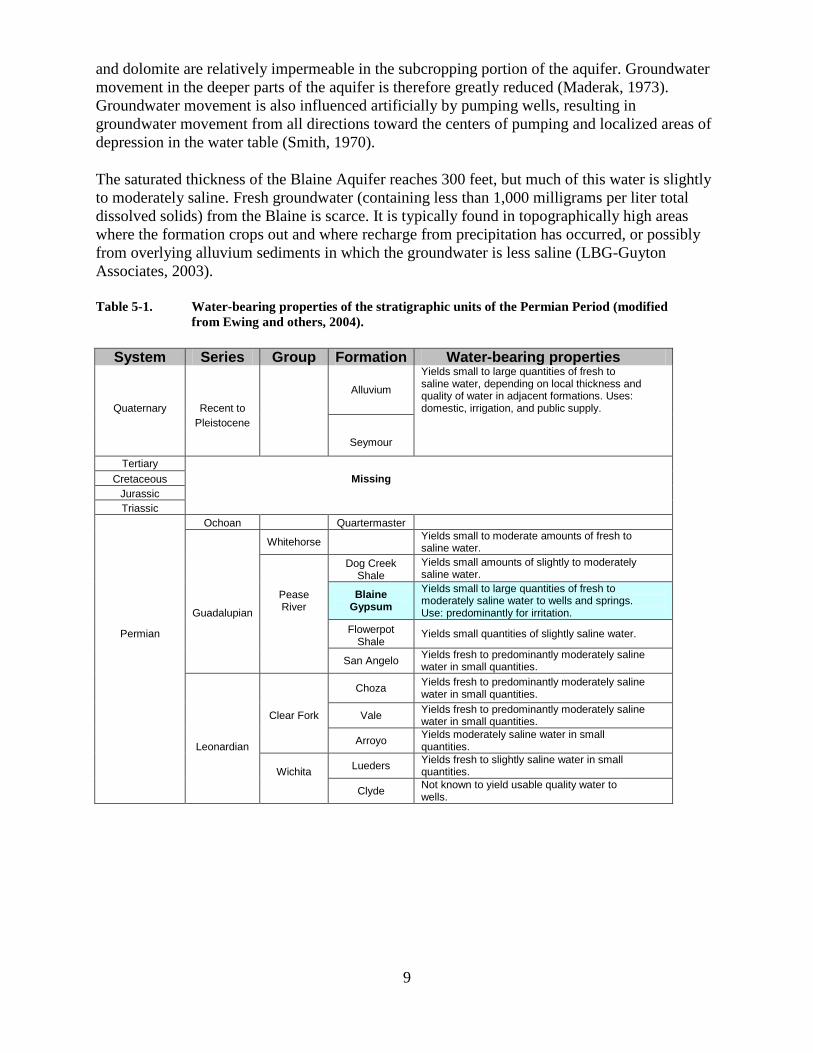
Table 5-1. Water-bearing properties of the stratigraphic units of the Permian Period (modified from Ewing and others, 2004).
System Series Group Formation Water-bearing properties
Quaternary Recent to
Alluvium
Yields small to large quantities of fresh to saline water, depending on local thickness and quality of water in adjacent formations. Uses: domestic, irrigation, and public supply.
Pleistocene
Seymour
Tertiary
Cretaceous Missing Jurassic Triassic
Ochoan Quartermaster
Whitehorse Yields small to moderate amounts of fresh to saline water.
Dog Creek
Shale Yields small amounts of slightly to moderately saline water.
Guadalupian
Pease River
Blaine Gypsum
Yields small to large quantities of fresh to moderately saline water to wells and springs. Use: predominantly for irritation.
Permian Flowerpot Shale
Yields small quantities of slightly saline water.
San Angelo Yields fresh to predominantly moderately saline water in small quantities.
Choza Yields fresh to predominantly moderately saline
water in small quantities.
Clear Fork Vale Yields fresh to predominantly moderately saline water in small quantities.
Leonardian Arroyo Yields moderately saline water in small quantities.
Wichita Lueders Yields fresh to slightly saline water in small quantities.
Clyde Not known to yield usable quality water to wells.
10
5.1 Characterization of Blaine Aquifer groundwater
Groundwater from any aquifer in the United States can be characterized with respect to drinking water standards and with respect to its dominant dissolved constituents. Although few of the sampled wells in this study produce water purely for drinking water purposes, characterizing Blaine Aquifer groundwater in relation to drinking water standards is appropriate and useful because it facilitates comparison of drinking water quality over time. Primary drinking water standards are legally enforceable standards that apply to public water supply systems. Secondary drinking water standards are non-enforceable guidelines regulating solutes that may affect the cosmetic quality—such as skin or tooth discoloration—or aesthetic quality—such as taste, odor, or color—of drinking water (Texas Commission on Environmental Quality, 2004). These primary and secondary drinking water standards are based on maximum contaminant levels documented in Title 30 of the Texas Administrative Code, Chapter 290 (Texas Commission on Environmental Quality, 2004). Characterizing groundwater in terms of dominant dissolved inorganic constituents is useful for comparing groundwater geographically from a chemical quality standpoint.
5.1.1 Groundwater quality classification
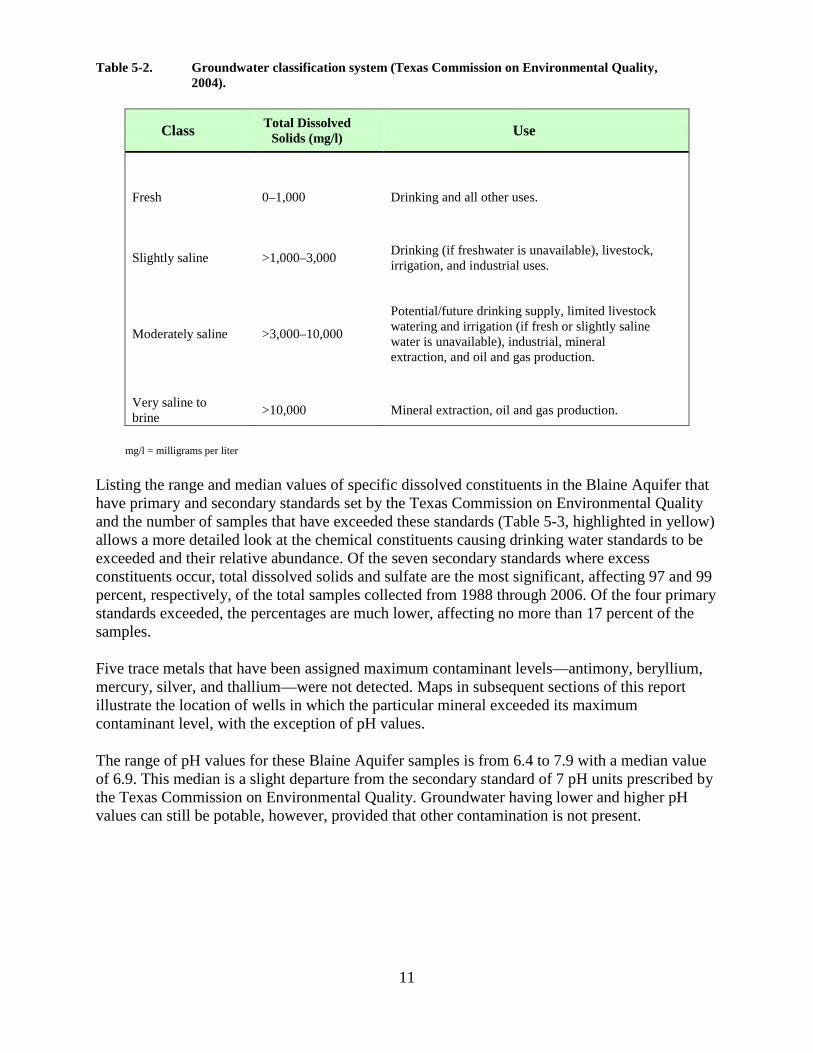
Total dissolved solids content is the main limiting factor determining the use of groundwater. These solids primarily consist of minerals dissolved from the host substrate or other contributing sources such as human-induced contamination. Four classes of groundwater quality exist according to dissolved solids content (as originally defined by Winslow and Kistler, 1956, and adopted by the Texas Commission on Environmental Quality, (Table 5-2)); this classification system is similar to that used by the U.S. Environmental Protection Agency at the national level. Blaine Aquifer groundwater is slightly to moderately saline using either Texas Commission on Environmental Quality or U.S. Environmental Protection Agency definitions.
11
Table 5-2. Groundwater classification system (Texas Commission on Environmental Quality, 2004).
Class Total Dissolved Solids (mg/l) Use
Fresh 0–1,000 Drinking and all other uses.
Slightly saline >1,000–3,000 Drinking (if freshwater is unavailable), livestock, irrigation, and industrial uses.
Moderately saline >3,000–10,000
Potential/future drinking supply, limited livestock watering and irrigation (if fresh or slightly saline water is unavailable), industrial, mineral extraction, and oil and gas production.
Very saline to brine >10,000 Mineral extraction, oil and gas production.
mg/l = milligrams per liter
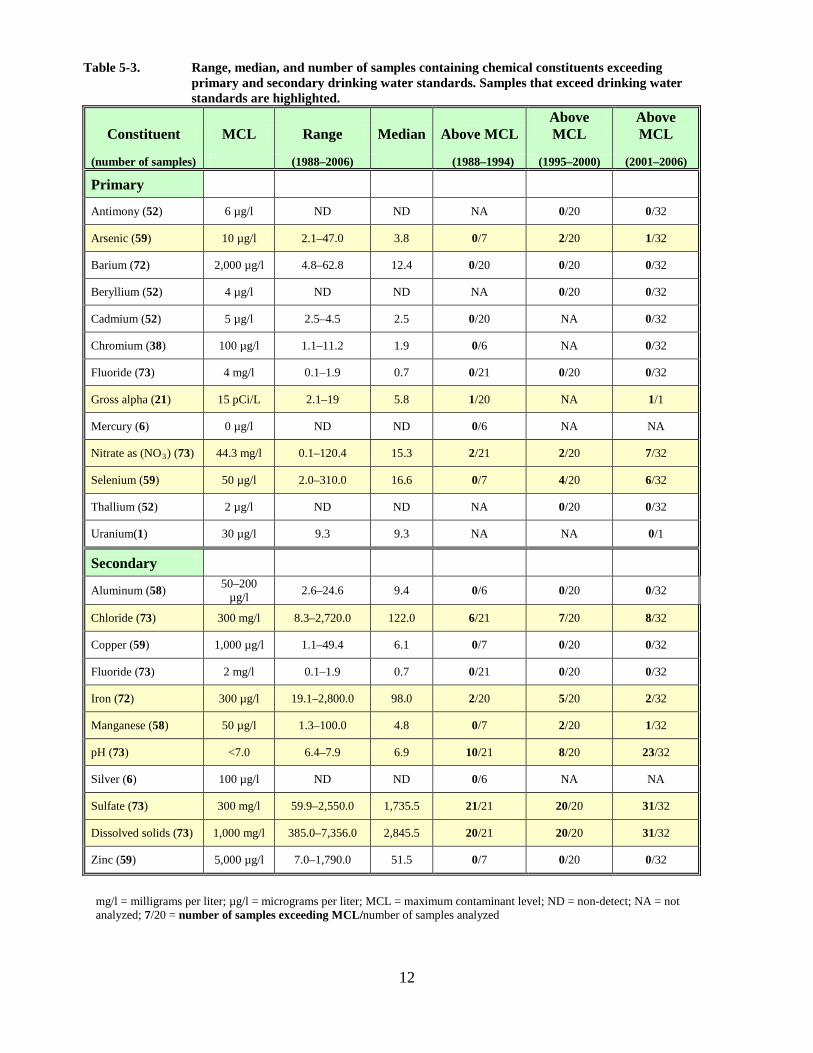
Listing the range and median values of specific dissolved constituents in the Blaine Aquifer that have primary and secondary standards set by the Texas Commission on Environmental Quality and the number of samples that have exceeded these standards (Table 5-3, highlighted in yellow) allows a more detailed look at the chemical constituents causing drinking water standards to be exceeded and their relative abundance. Of the seven secondary standards where excess constituents occur, total dissolved solids and sulfate are the most significant, affecting 97 and 99 percent, respectively, of the total samples collected from 1988 through 2006. Of the four primary standards exceeded, the percentages are much lower, affecting no more than 17 percent of the samples.
Five trace metals that have been assigned maximum contaminant levels—antimony, beryllium, mercury, silver, and thallium—were not detected. Maps in subsequent sections of this report illustrate the location of wells in which the particular mineral exceeded its maximum contaminant level, with the exception of pH values.
The range of pH values for these Blaine Aquifer samples is from 6.4 to 7.9 with a median value of 6.9. This median is a slight departure from the secondary standard of 7 pH units prescribed by the Texas Commission on Environmental Quality. Groundwater having lower and higher pH values can still be potable, however, provided that other contamination is not present.
12
Table 5-3. Range, median, and number of samples containing chemical constituents exceeding primary and secondary drinking water standards. Samples that exceed drinking water standards are highlighted.
Constituent MCL Range Median Above MCL Above MCL
Above MCL
(number of samples) (1988–2006) (1988–1994) (1995–2000) (2001–2006)
Primary
Antimony (52) 6 µg/l ND ND NA 0/20 0/32
Arsenic (59) 10 µg/l 2.1–47.0 3.8 0/7 2/20 1/32
Barium (72) 2,000 µg/l 4.8–62.8 12.4 0/20 0/20 0/32
Beryllium (52) 4 µg/l ND ND NA 0/20 0/32
Cadmium (52) 5 µg/l 2.5–4.5 2.5 0/20 NA 0/32
Chromium (38) 100 µg/l 1.1–11.2 1.9 0/6 NA 0/32
Fluoride (73) 4 mg/l 0.1–1.9 0.7 0/21 0/20 0/32
Gross alpha (21) 15 pCi/L 2.1–19 5.8 1/20 NA 1/1
Mercury (6) 0 µg/l ND ND 0/6 NA NA
Nitrate as (NO3) (73) 44.3 mg/l 0.1–120.4 15.3 2/21 2/20 7/32
Selenium (59) 50 µg/l 2.0–310.0 16.6 0/7 4/20 6/32
Thallium (52) 2 µg/l ND ND NA 0/20 0/32
Uranium(1) 30 µg/l 9.3 9.3 NA NA 0/1
Secondary
Aluminum (58) 50–200 µg/l 2.6–24.6 9.4 0/6 0/20 0/32
Chloride (73) 300 mg/l 8.3–2,720.0 122.0 6/21 7/20 8/32
Copper (59) 1,000 µg/l 1.1–49.4 6.1 0/7 0/20 0/32
Fluoride (73) 2 mg/l 0.1–1.9 0.7 0/21 0/20 0/32
Iron (72) 300 µg/l 19.1–2,800.0 98.0 2/20 5/20 2/32
Manganese (58) 50 µg/l 1.3–100.0 4.8 0/7 2/20 1/32
pH (73) <7.0 6.4–7.9 6.9 10/21 8/20 23/32
Silver (6) 100 µg/l ND ND 0/6 NA NA
Sulfate (73) 300 mg/l 59.9–2,550.0 1,735.5 21/21 20/20 31/32
Dissolved solids (73) 1,000 mg/l 385.0–7,356.0 2,845.5 20/21 20/20 31/32
Zinc (59) 5,000 µg/l 7.0–1,790.0 51.5 0/7 0/20 0/32
mg/l = milligrams per liter; µg/l = micrograms per liter; MCL = maximum contaminant level; ND = non-detect; NA = not analyzed; 7/20 = number of samples exceeding MCL/number of samples analyzed
13
5.1.2 Dominant dissolved constituents
Groundwater quality varies greatly throughout the Blaine Aquifer. Total dissolved solids content in the groundwater ranges from 385 to about 7,500 milligrams per liter, making most of the groundwater from the aquifer unsuitable for drinking water purposes except for a few wells in the recharge area that pump freshwater.
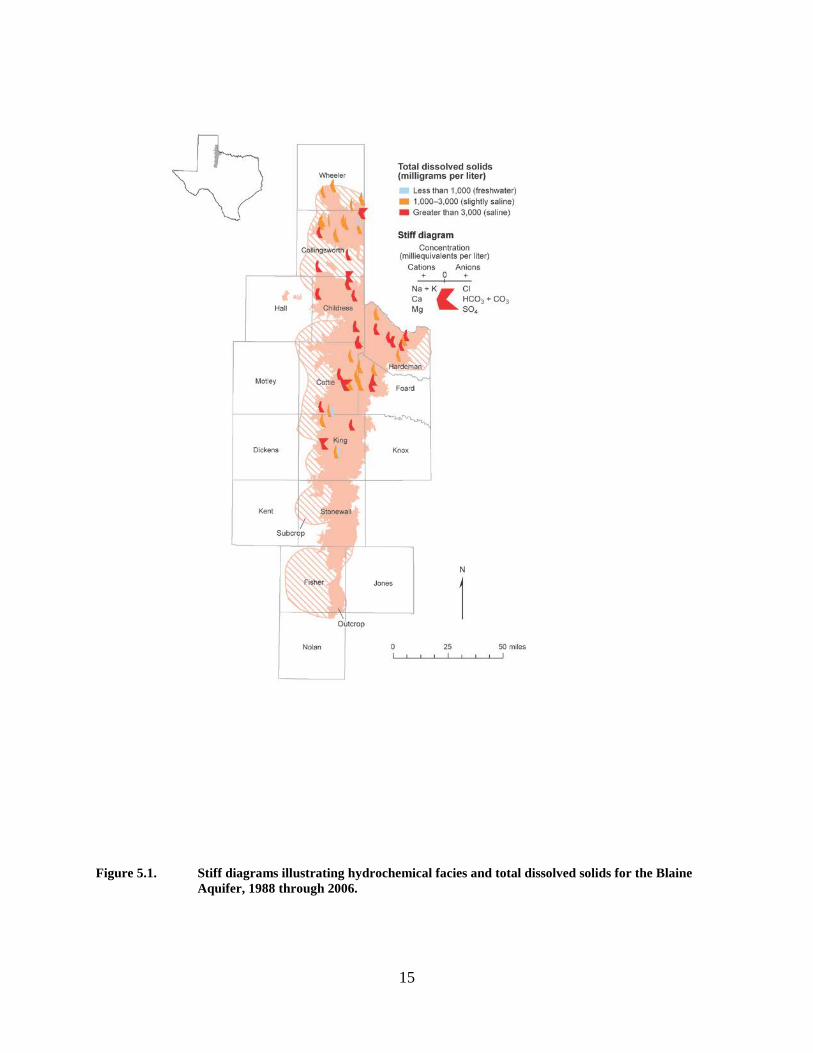
Groundwater in the aquifer is very hard and contains high chloride and sulfate. Hardness, as a physical/chemical measure of the water reported as calcium carbonate, represents the concentration of calcium, magnesium, and strontium and accounts for scaly buildup in pipes and water heaters. Water is considered hard when it contains 121 to 180 milligrams per liter of calcium carbonate and very hard when it contains more than 180 milligrams per liter. We plotted equivalent concentrations of the major cations (sodium, potassium, calcium, and magnesium) and anions (chloride, bicarbonate, and sulfate) on Stiff diagrams (Figure 5-1). The groundwater composition is dominated by calcium and sulfate and in some wells by chloride and sodium, as illustrated by the Stiff diagrams.
Water from samples collected over the past 50 years has also been documented as slightly saline to moderately saline, hard, almost always containing high sulfate, and often containing high chloride (Smith, 1970; Maderak, 1972; Price, 1978; TWC, 1989; Duffin and Beynon, 1992; Ashworth and Hopkins, 1995; LBG-Guyton Associates, 2004). Because most of the groundwater produced from the Blaine Aquifer is highly mineralized, it is primarily suitable only for irrigation of salt-tolerant crops and livestock.
5.1.3 Total dissolved solids
Total dissolved solids are the sum of all inorganic constituents that are dissolved in water. The median total dissolved solids concentration of 2,845 milligrams per liter reflects the slightly (to almost moderately) saline character of the Blaine Aquifer (Table 5-3). Total dissolved solids in 97 percent of the samples collected exceed the Texas Commission on Environmental Quality’s secondary standard for freshwater set at 1,000 milligrams per liter (Figure 5-1).
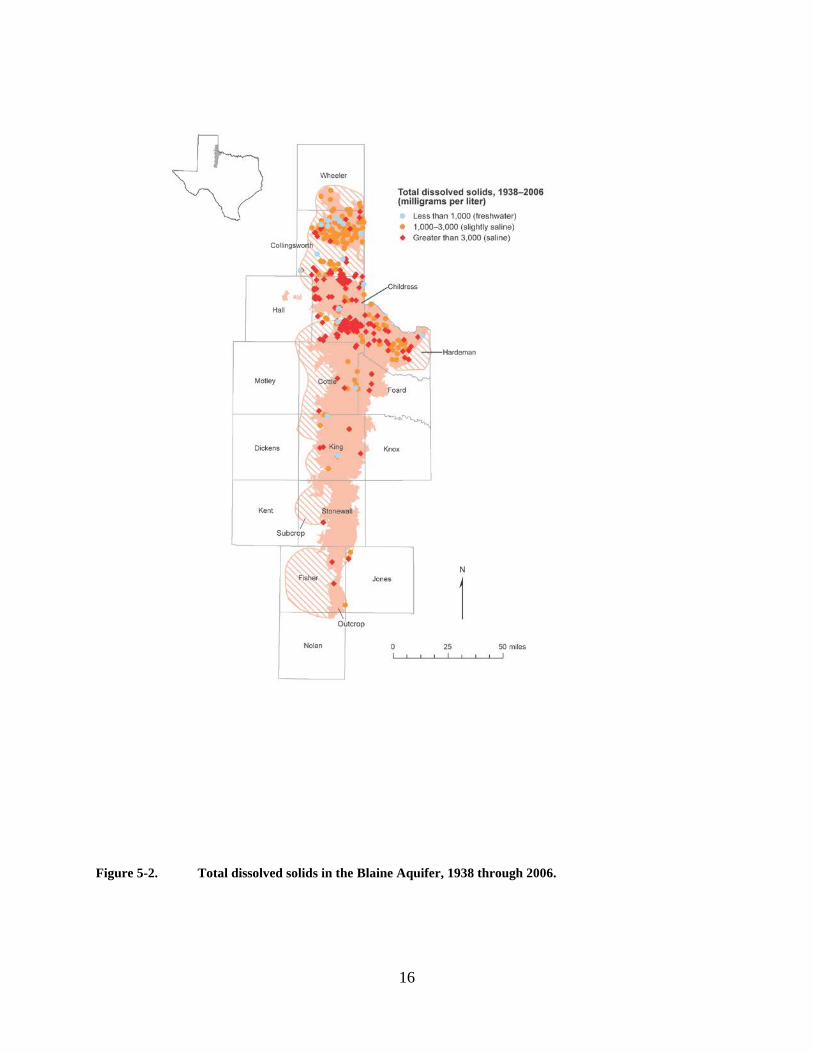
The TWDB groundwater database (2009) contains 468 water quality records with individual total dissolved solids analyses for the Blaine Aquifer. The northernmost outcrop portion of the aquifer in Collingsworth and Wheeler counties contains a larger percentage of wells where the maximum contaminant level is not exceeded, either during the most recent sampling (Figure 5-1) or during the entire period of documented sampling (Figure 5-2). One of the two wells having the most recently analyzed highest total dissolved solids value of 5,875 milligrams per liter, well 05-56-910, however, occurs in Collingsworth County. The other of these two wells, 22-30-101, which has 6,586 milligrams per liter total dissolved solids, is farther to the south in central-southwest King County. The high total dissolved solids concentrations in these wells are caused by high sodium and chloride, which may result from localized surface contamination or as a natural occurrence from well penetration of a halite source within or underlying the aquifer (Maderak, 1972; LBG-Guyton Associates, 2004).
14
Previous reports mention comparable ranges of total dissolved solids: from 700 to 7,000 milligrams per liter in Wheeler County (Maderak, 1972); 494 to 4,482 milligrams per liter in Collingsworth County (Smith, 1970); 1,000 to 6,000 milligrams per liter with most analyses between 2,500 and 3,500 milligrams per liter in Hardeman County (Maderak, 1972); and 1,000 to 10,000 milligrams per liter in that portion of the aquifer extending from Wheeler to Jones counties (Duffin and Beynon, 1992). In parts of Wheeler and Collingsworth counties, as the author noted in one of the oldest studies about the aquifer, “Permian red beds…contain appreciable amounts of mineral salts which in many cases are so abundant as to render it unfit for general uses” (Gould, 1906).
15
Figure 5.1. Stiff diagrams illustrating hydrochemical facies and total dissolved solids for the Blaine Aquifer, 1988 through 2006.
16
Figure 5-2. Total dissolved solids in the Blaine Aquifer, 1938 through 2006.
17
5.1.4 Chloride
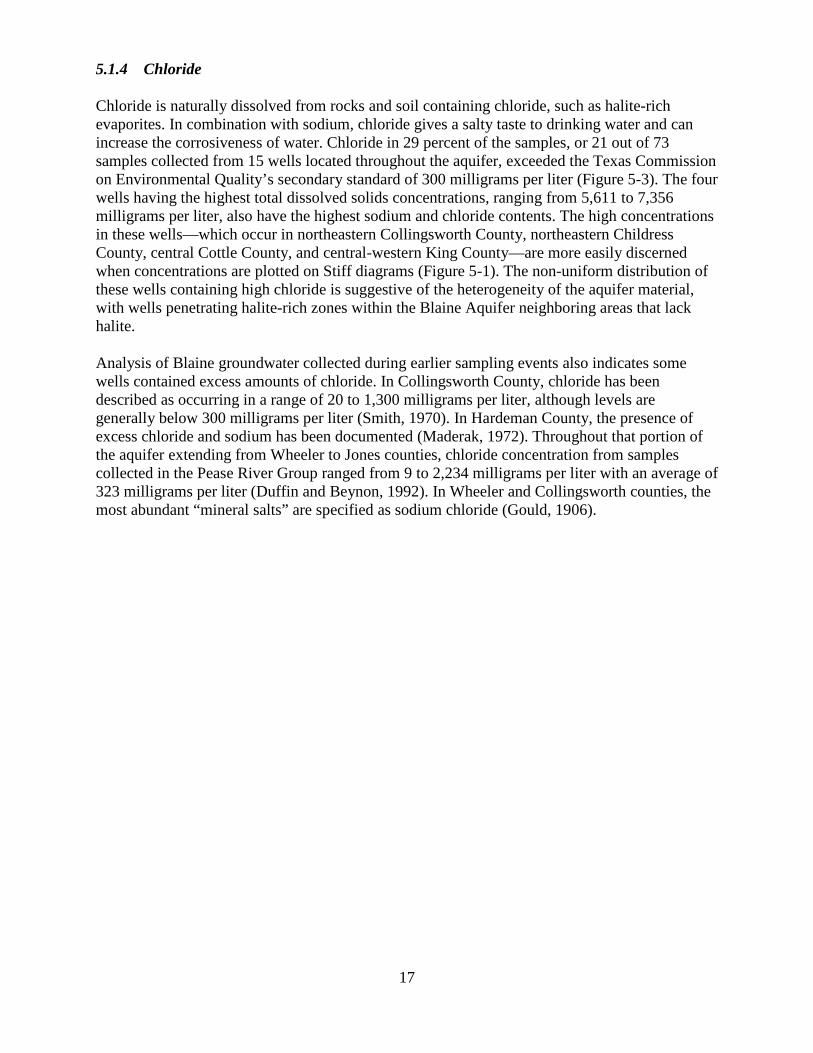
Chloride is naturally dissolved from rocks and soil containing chloride, such as halite-rich evaporites. In combination with sodium, chloride gives a salty taste to drinking water and can increase the corrosiveness of water. Chloride in 29 percent of the samples, or 21 out of 73 samples collected from 15 wells located throughout the aquifer, exceeded the Texas Commission on Environmental Quality’s secondary standard of 300 milligrams per liter (Figure 5-3). The four wells having the highest total dissolved solids concentrations, ranging from 5,611 to 7,356 milligrams per liter, also have the highest sodium and chloride contents. The high concentrations in these wells—which occur in northeastern Collingsworth County, northeastern Childress County, central Cottle County, and central-western King County—are more easily discerned when concentrations are plotted on Stiff diagrams (Figure 5-1). The non-uniform distribution of these wells containing high chloride is suggestive of the heterogeneity of the aquifer material, with wells penetrating halite-rich zones within the Blaine Aquifer neighboring areas that lack halite.
Analysis of Blaine groundwater collected during earlier sampling events also indicates some wells contained excess amounts of chloride. In Collingsworth County, chloride has been described as occurring in a range of 20 to 1,300 milligrams per liter, although levels are generally below 300 milligrams per liter (Smith, 1970). In Hardeman County, the presence of excess chloride and sodium has been documented (Maderak, 1972). Throughout that portion of the aquifer extending from Wheeler to Jones counties, chloride concentration from samples collected in the Pease River Group ranged from 9 to 2,234 milligrams per liter with an average of 323 milligrams per liter (Duffin and Beynon, 1992). In Wheeler and Collingsworth counties, the most abundant “mineral salts” are specified as sodium chloride (Gould, 1906).

18
Figure 5-3. Dissolved chloride in the Blaine Aquifer, 1988 through 2006. MCL = maximum contaminant level. The secondary drinking water standard MCL for chloride, set by the Texas Commission on Environmental Quality, is 300 milligrams per liter.
19
5.1.5 Sulfate
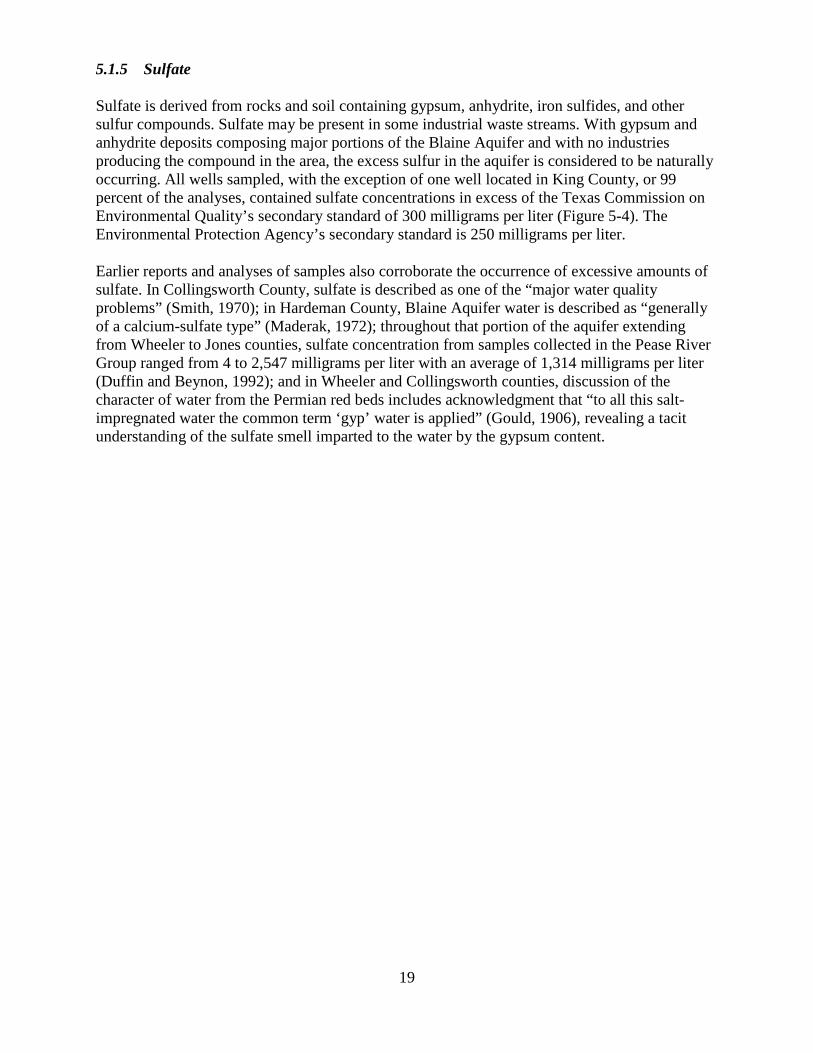
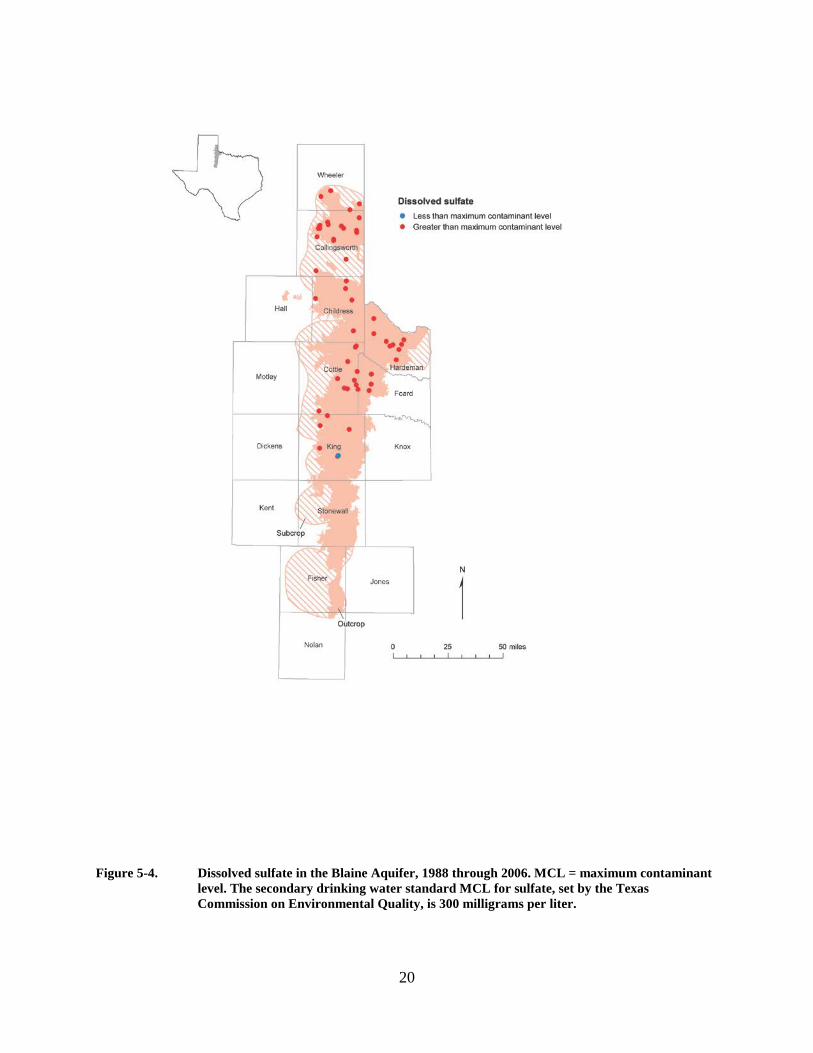
Sulfate is derived from rocks and soil containing gypsum, anhydrite, iron sulfides, and other sulfur compounds. Sulfate may be present in some industrial waste streams. With gypsum and anhydrite deposits composing major portions of the Blaine Aquifer and with no industries producing the compound in the area, the excess sulfur in the aquifer is considered to be naturally occurring. All wells sampled, with the exception of one well located in King County, or 99 percent of the analyses, contained sulfate concentrations in excess of the Texas Commission on Environmental Quality’s secondary standard of 300 milligrams per liter (Figure 5-4). The Environmental Protection Agency’s secondary standard is 250 milligrams per liter.
Earlier reports and analyses of samples also corroborate the occurrence of excessive amounts of sulfate. In Collingsworth County, sulfate is described as one of the “major water quality problems” (Smith, 1970); in Hardeman County, Blaine Aquifer water is described as “generally of a calcium-sulfate type” (Maderak, 1972); throughout that portion of the aquifer extending from Wheeler to Jones counties, sulfate concentration from samples collected in the Pease River Group ranged from 4 to 2,547 milligrams per liter with an average of 1,314 milligrams per liter (Duffin and Beynon, 1992); and in Wheeler and Collingsworth counties, discussion of the character of water from the Permian red beds includes acknowledgment that “to all this salt-impregnated water the common term ‘gyp’ water is applied” (Gould, 1906), revealing a tacit understanding of the sulfate smell imparted to the water by the gypsum content.
20
Figure 5-4. Dissolved sulfate in the Blaine Aquifer, 1988 through 2006. MCL = maximum contaminant level. The secondary drinking water standard MCL for sulfate, set by the Texas Commission on Environmental Quality, is 300 milligrams per liter.
21
5.1.6 Arsenic, selenium, nitrate, and gross alpha
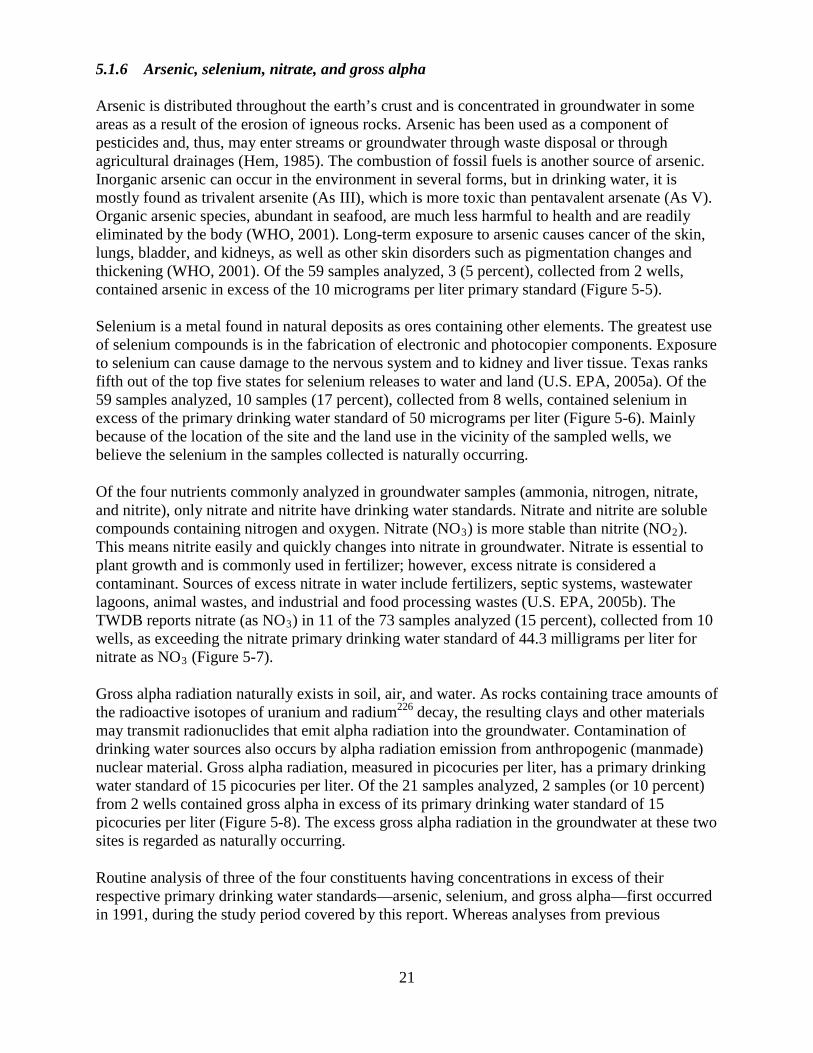
Arsenic is distributed throughout the earth’s crust and is concentrated in groundwater in some areas as a result of the erosion of igneous rocks. Arsenic has been used as a component of pesticides and, thus, may enter streams or groundwater through waste disposal or through agricultural drainages (Hem, 1985). The combustion of fossil fuels is another source of arsenic. Inorganic arsenic can occur in the environment in several forms, but in drinking water, it is mostly found as trivalent arsenite (As III), which is more toxic than pentavalent arsenate (As V). Organic arsenic species, abundant in seafood, are much less harmful to health and are readily eliminated by the body (WHO, 2001). Long-term exposure to arsenic causes cancer of the skin, lungs, bladder, and kidneys, as well as other skin disorders such as pigmentation changes and thickening (WHO, 2001). Of the 59 samples analyzed, 3 (5 percent), collected from 2 wells, contained arsenic in excess of the 10 micrograms per liter primary standard (Figure 5-5).
Selenium is a metal found in natural deposits as ores containing other elements. The greatest use of selenium compounds is in the fabrication of electronic and photocopier components. Exposure to selenium can cause damage to the nervous system and to kidney and liver tissue. Texas ranks fifth out of the top five states for selenium releases to water and land (U.S. EPA, 2005a). Of the 59 samples analyzed, 10 samples (17 percent), collected from 8 wells, contained selenium in excess of the primary drinking water standard of 50 micrograms per liter (Figure 5-6). Mainly because of the location of the site and the land use in the vicinity of the sampled wells, we believe the selenium in the samples collected is naturally occurring.
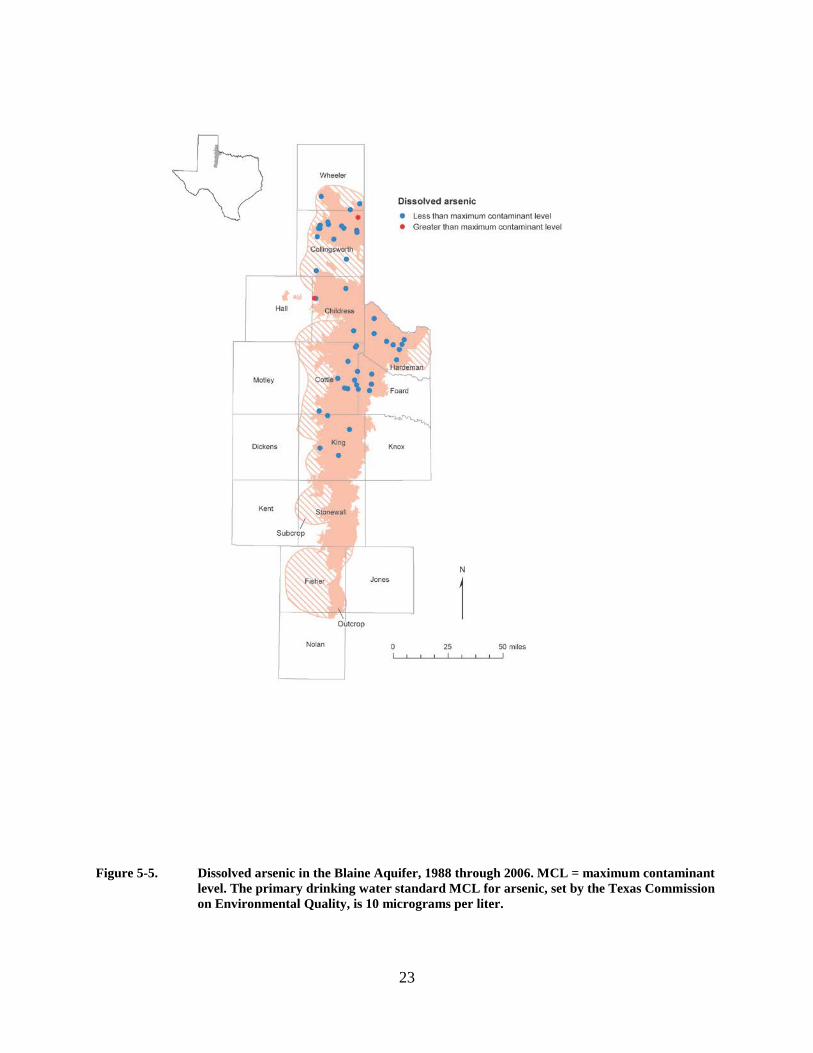
Of the four nutrients commonly analyzed in groundwater samples (ammonia, nitrogen, nitrate, and nitrite), only nitrate and nitrite have drinking water standards. Nitrate and nitrite are soluble compounds containing nitrogen and oxygen. Nitrate (NO3) is more stable than nitrite (NO2). This means nitrite easily and quickly changes into nitrate in groundwater. Nitrate is essential to plant growth and is commonly used in fertilizer; however, excess nitrate is considered a contaminant. Sources of excess nitrate in water include fertilizers, septic systems, wastewater lagoons, animal wastes, and industrial and food processing wastes (U.S. EPA, 2005b). The TWDB reports nitrate (as NO3) in 11 of the 73 samples analyzed (15 percent), collected from 10 wells, as exceeding the nitrate primary drinking water standard of 44.3 milligrams per liter for nitrate as NO3 (Figure 5-7).
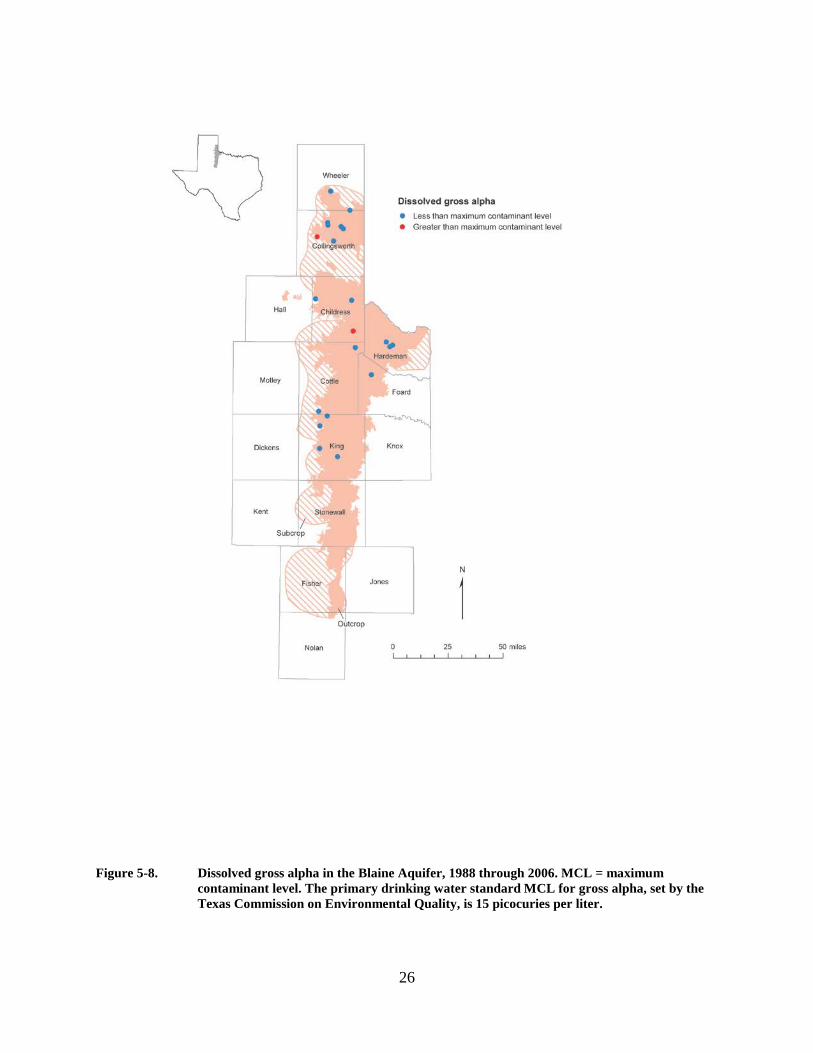
Gross alpha radiation naturally exists in soil, air, and water. As rocks containing trace amounts of the radioactive isotopes of uranium and radium226 decay, the resulting clays and other materials may transmit radionuclides that emit alpha radiation into the groundwater. Contamination of drinking water sources also occurs by alpha radiation emission from anthropogenic (manmade) nuclear material. Gross alpha radiation, measured in picocuries per liter, has a primary drinking water standard of 15 picocuries per liter. Of the 21 samples analyzed, 2 samples (or 10 percent) from 2 wells contained gross alpha in excess of its primary drinking water standard of 15 picocuries per liter (Figure 5-8). The excess gross alpha radiation in the groundwater at these two sites is regarded as naturally occurring.
Routine analysis of three of the four constituents having concentrations in excess of their respective primary drinking water standards—arsenic, selenium, and gross alpha—first occurred in 1991, during the study period covered by this report. Whereas analyses from previous

22
sampling events for major ions such as sulfate, chloride, nitrate, and dissolved solids reported results similar to the ones discussed for the current study period, analysis of these three trace elements must remain routine to determine if their concentrations are similar to results reported in this study.
23
Figure 5-5. Dissolved arsenic in the Blaine Aquifer, 1988 through 2006. MCL = maximum contaminant level. The primary drinking water standard MCL for arsenic, set by the Texas Commission on Environmental Quality, is 10 micrograms per liter.

24
Figure 5-6. Dissolved selenium in the Blaine Aquifer, 1988 through 2006. MCL = maximum contaminant level. The primary drinking water standard MCL for selenium, set by the Texas Commission on Environmental Quality, is 50 micrograms per liter.
25
Figure 5-7. Dissolved nitrate in the Blaine Aquifer, 1988 through 2006. MCL = maximum contaminant level. The primary drinking water standard MCL for nitrate, set by the Texas Commission on Environmental Quality, is 44.3 milligrams per liter.
26
Figure 5-8. Dissolved gross alpha in the Blaine Aquifer, 1988 through 2006. MCL = maximum contaminant level. The primary drinking water standard MCL for gross alpha, set by the Texas Commission on Environmental Quality, is 15 picocuries per liter.
27
5.1.7 Iron and manganese
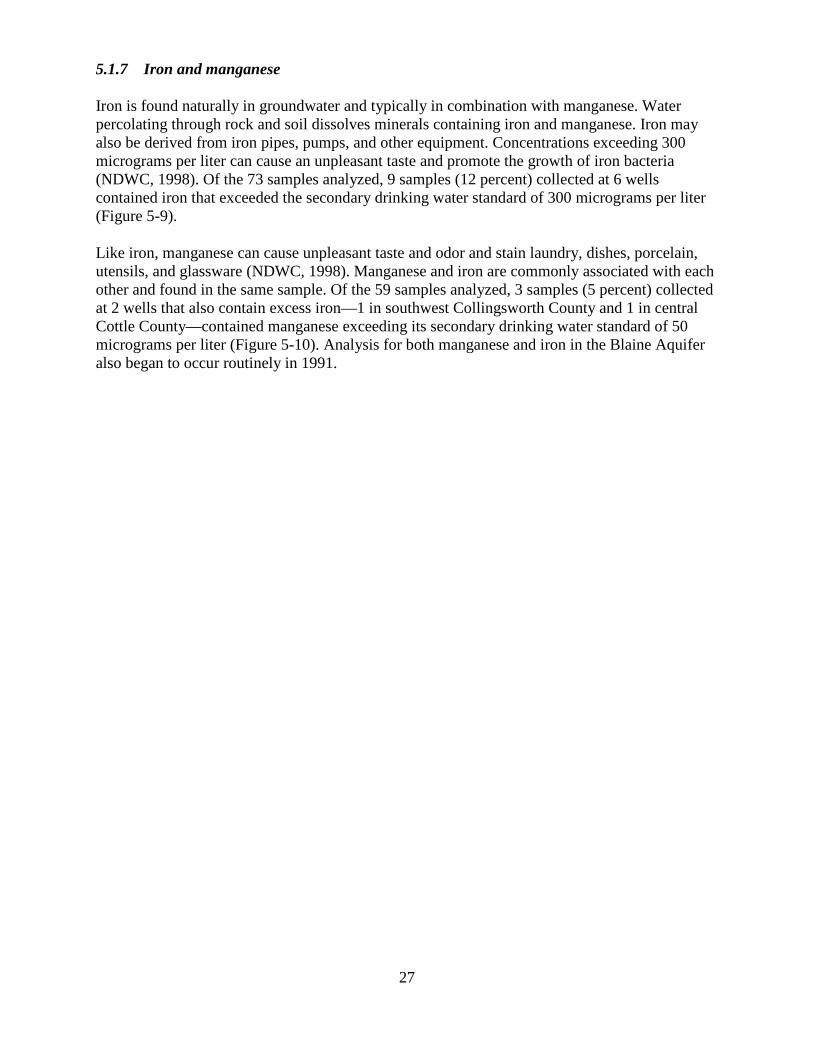
Iron is found naturally in groundwater and typically in combination with manganese. Water percolating through rock and soil dissolves minerals containing iron and manganese. Iron may also be derived from iron pipes, pumps, and other equipment. Concentrations exceeding 300 micrograms per liter can cause an unpleasant taste and promote the growth of iron bacteria (NDWC, 1998). Of the 73 samples analyzed, 9 samples (12 percent) collected at 6 wells contained iron that exceeded the secondary drinking water standard of 300 micrograms per liter (Figure 5-9).
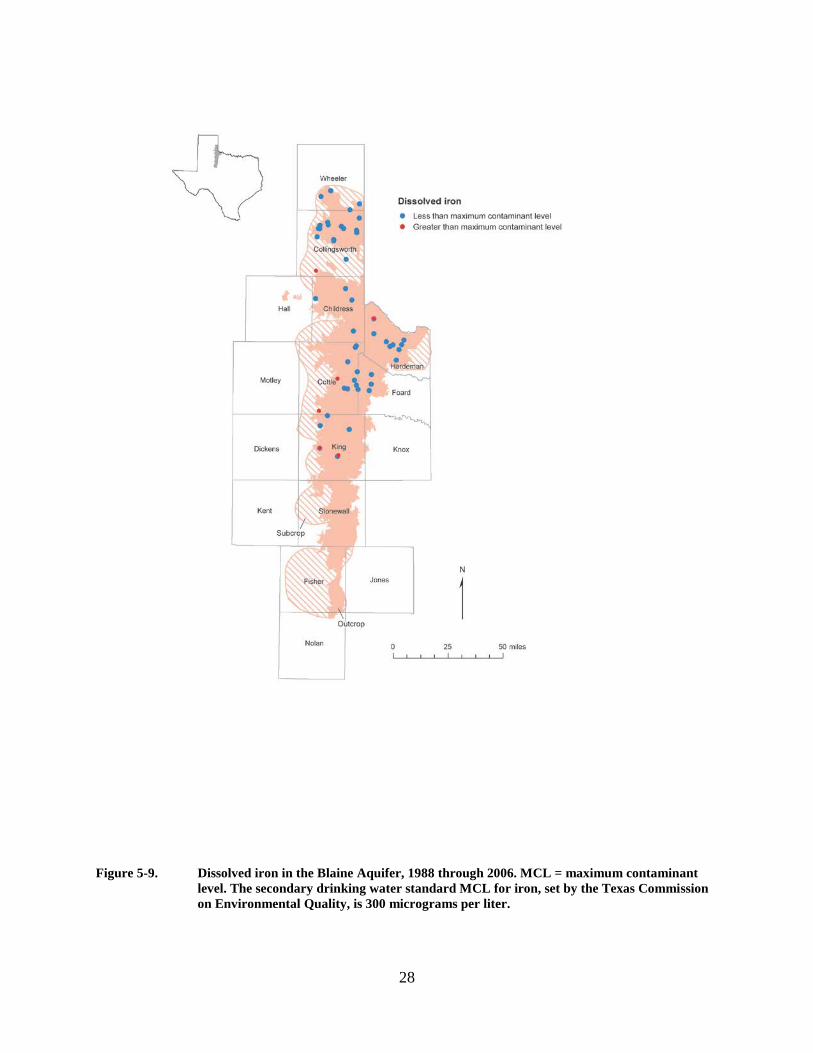
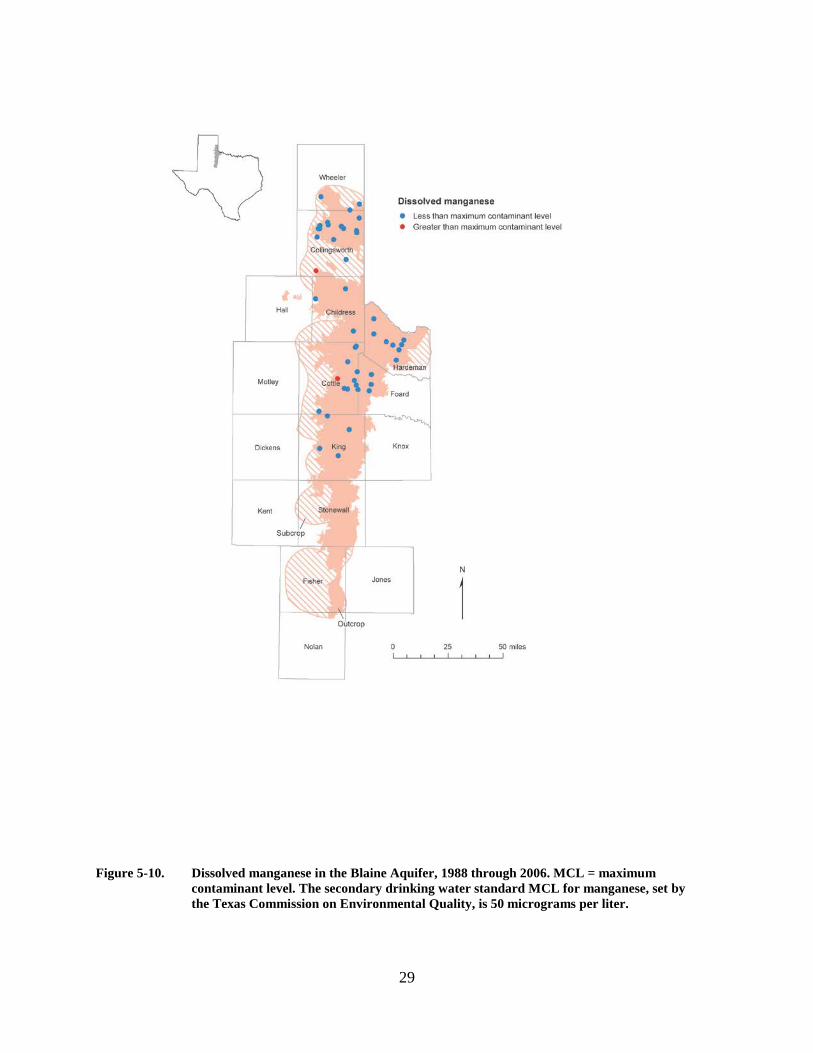
Like iron, manganese can cause unpleasant taste and odor and stain laundry, dishes, porcelain, utensils, and glassware (NDWC, 1998). Manganese and iron are commonly associated with each other and found in the same sample. Of the 59 samples analyzed, 3 samples (5 percent) collected at 2 wells that also contain excess iron—1 in southwest Collingsworth County and 1 in central Cottle County—contained manganese exceeding its secondary drinking water standard of 50 micrograms per liter (Figure 5-10). Analysis for both manganese and iron in the Blaine Aquifer also began to occur routinely in 1991.
28
Figure 5-9. Dissolved iron in the Blaine Aquifer, 1988 through 2006. MCL = maximum contaminant level. The secondary drinking water standard MCL for iron, set by the Texas Commission on Environmental Quality, is 300 micrograms per liter.
29
Figure 5-10. Dissolved manganese in the Blaine Aquifer, 1988 through 2006. MCL = maximum contaminant level. The secondary drinking water standard MCL for manganese, set by the Texas Commission on Environmental Quality, is 50 micrograms per liter.
30
5.1.8 Boron
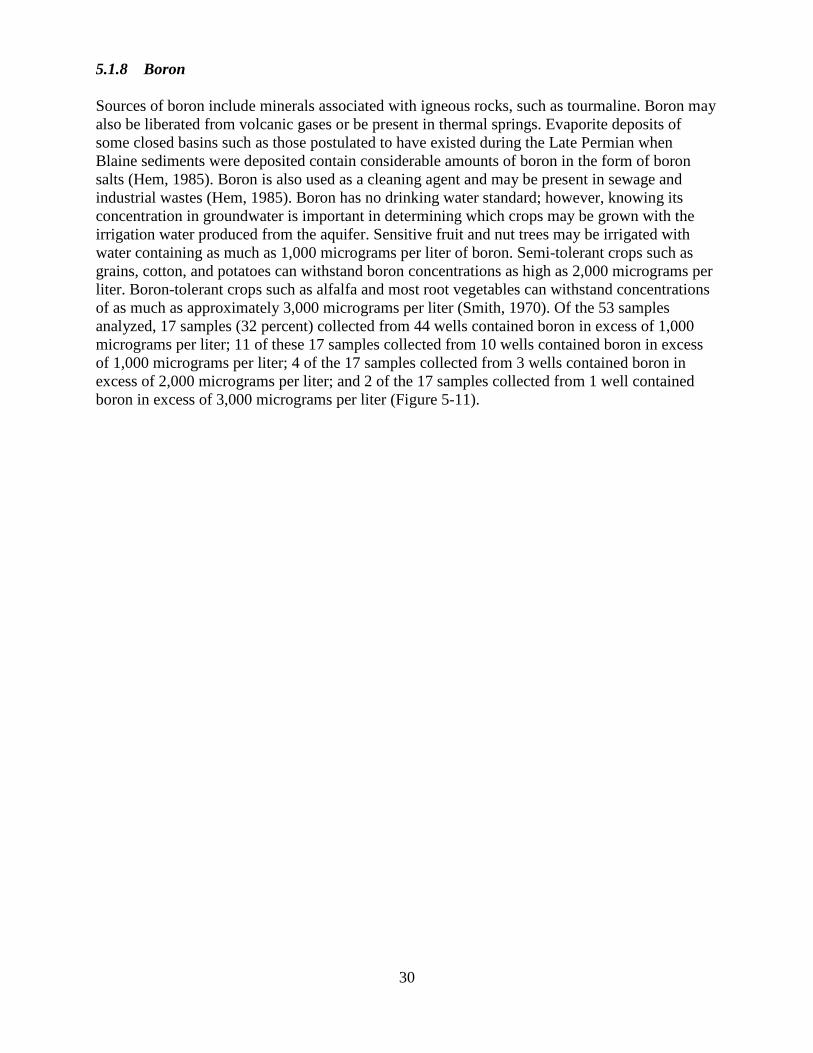
Sources of boron include minerals associated with igneous rocks, such as tourmaline. Boron may also be liberated from volcanic gases or be present in thermal springs. Evaporite deposits of some closed basins such as those postulated to have existed during the Late Permian when Blaine sediments were deposited contain considerable amounts of boron in the form of boron salts (Hem, 1985). Boron is also used as a cleaning agent and may be present in sewage and industrial wastes (Hem, 1985). Boron has no drinking water standard; however, knowing its concentration in groundwater is important in determining which crops may be grown with the irrigation water produced from the aquifer. Sensitive fruit and nut trees may be irrigated with water containing as much as 1,000 micrograms per liter of boron. Semi-tolerant crops such as grains, cotton, and potatoes can withstand boron concentrations as high as 2,000 micrograms per liter. Boron-tolerant crops such as alfalfa and most root vegetables can withstand concentrations of as much as approximately 3,000 micrograms per liter (Smith, 1970). Of the 53 samples analyzed, 17 samples (32 percent) collected from 44 wells contained boron in excess of 1,000 micrograms per liter; 11 of these 17 samples collected from 10 wells contained boron in excess of 1,000 micrograms per liter; 4 of the 17 samples collected from 3 wells contained boron in excess of 2,000 micrograms per liter; and 2 of the 17 samples collected from 1 well contained boron in excess of 3,000 micrograms per liter (Figure 5-11).
31
Figure 5-11. Dissolved boron in the Blaine Aquifer, 1988 through 2006. There are no drinking water standards for boron although plant sensitivities vary according to concentration. µg/l = micrograms per liter.
32
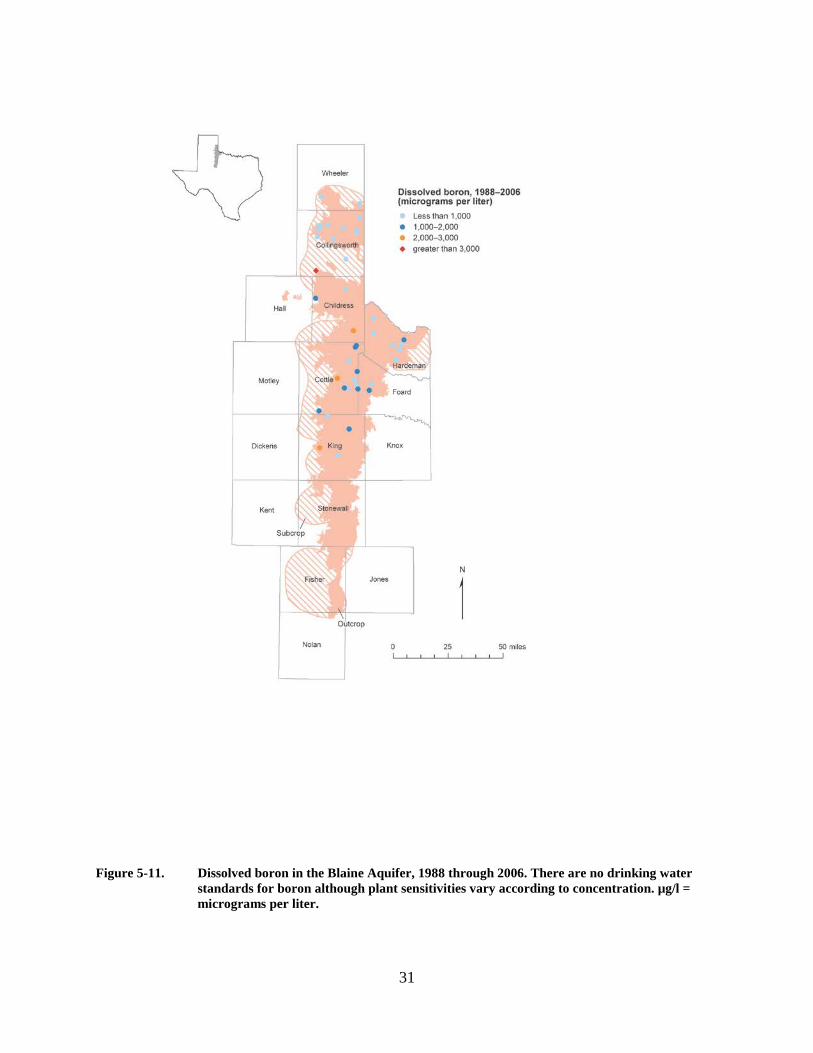
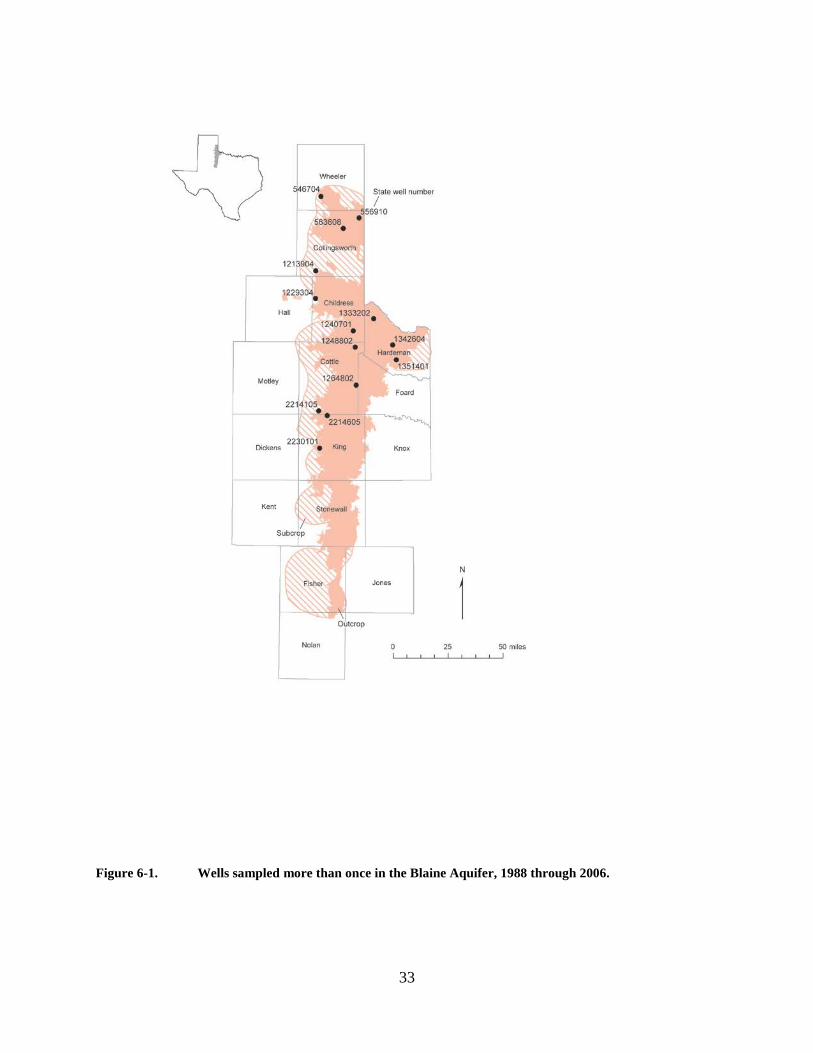
6 Water quality changes over time Of the 55 wells in the Blaine Aquifer with water quality analyses from 1988 through 2006, 14 were sampled more than once, 10 wells were sampled twice, and 4 wells were sampled three times (Figure 6-1). We compared analyses of four principal mineral constituents, one nutrient (nitrate), and total dissolved solids (Table 6-1) over time in these wells by comparing the constituent value of the most recent analysis, usually performed in 2004, with the earliest water quality analysis in the study period.
33
Figure 6-1. Wells sampled more than once in the Blaine Aquifer, 1988 through 2006.
34
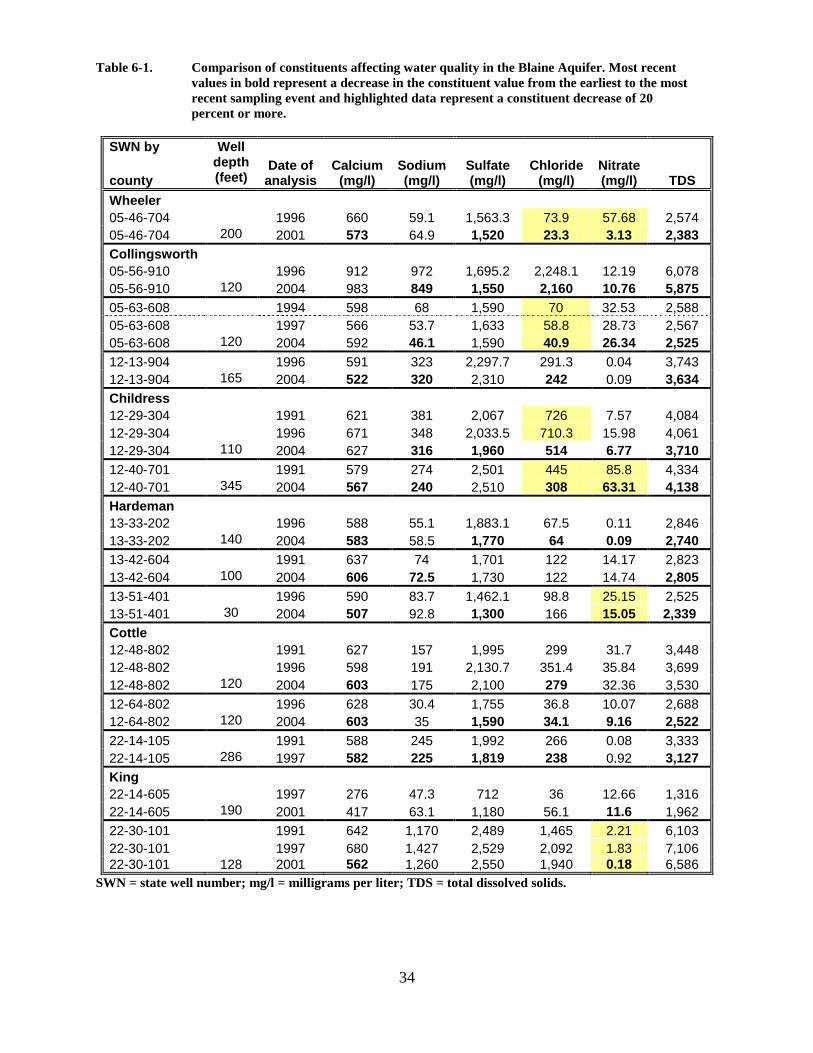
Table 6-1. Comparison of constituents affecting water quality in the Blaine Aquifer. Most recent values in bold represent a decrease in the constituent value from the earliest to the most recent sampling event and highlighted data represent a constituent decrease of 20 percent or more.
SWN by
county depth (feet)
Date of analysis
Calcium (mg/l)
Sodium (mg/l)
Sulfate (mg/l)
Chloride (mg/l)
Nitrate (mg/l) TDS
Wheeler 05-46-704 1996 660 59.1 1,563.3 73.9 57.68 2,574 05-46-704 200 2001 573 64.9 1,520 23.3 3.13 2,383 Collingsworth 05-56-910 1996 912 972 1,695.2 2,248.1 12.19 6,078 05-56-910 120 2004 983 849 1,550 2,160 10.76 5,875 05-63-608 1994 598 68 1,590 70 32.53 2,588 05-63-608 1997 566 53.7 1,633 58.8 28.73 2,567 05-63-608 120 2004 592 46.1 1,590 40.9 26.34 2,525 12-13-904 1996 591 323 2,297.7 291.3 0.04 3,743 12-13-904 165 2004 522 320 2,310 242 0.09 3,634 Childress 12-29-304 1991 621 381 2,067 726 7.57 4,084 12-29-304 1996 671 348 2,033.5 710.3 15.98 4,061 12-29-304 110 2004 627 316 1,960 514 6.77 3,710 12-40-701 1991 579 274 2,501 445 85.8 4,334 12-40-701 345 2004 567 240 2,510 308 63.31 4,138 Hardeman 13-33-202 1996 588 55.1 1,883.1 67.5 0.11 2,846 13-33-202 140 2004 583 58.5 1,770 64 0.09 2,740 13-42-604 1991 637 74 1,701 122 14.17 2,823 13-42-604 100 2004 606 72.5 1,730 122 14.74 2,805 13-51-401 1996 590 83.7 1,462.1 98.8 25.15 2,525 13-51-401 30 2004 507 92.8 1,300 166 15.05 2,339 Cottle 12-48-802 1991 627 157 1,995 299 31.7 3,448 12-48-802 1996 598 191 2,130.7 351.4 35.84 3,699 12-48-802 120 2004 603 175 2,100 279 32.36 3,530 12-64-802 1996 628 30.4 1,755 36.8 10.07 2,688 12-64-802 120 2004 603 35 1,590 34.1 9.16 2,522 22-14-105 1991 588 245 1,992 266 0.08 3,333 22-14-105 286 1997 582 225 1,819 238 0.92 3,127 King 22-14-605 1997 276 47.3 712 36 12.66 1,316 22-14-605 190 2001 417 63.1 1,180 56.1 11.6 1,962 22-30-101 1991 642 1,170 2,489 1,465 2.21 6,103 22-30-101 1997 680 1,427 2,529 2,092 1.83 7,106 22-30-101 128 2001 562 1,260 2,550 1,940 0.18 6,586
Well
SWN = state well number; mg/l = milligrams per liter; TDS = total dissolved solids.
35
The well having the greatest percentage decreases—well 05-46-704 in Wheeler County—contained lower nitrate and chloride concentrations of 94.6 and 68.5 percent, respectively, in the most recent analyses (2001; this well was not sampled during later events) and a decrease in total dissolved solids of 7.4 percent. This Wheeler County well and seven other wells in Collingsworth, Childress, Hardeman, and Cottle counties also underwent decreases in five of the six listed constituents. By contrast, well 22-14-605 in northern King County only decreased in one constituent, nitrate, by 8.4 percent, between 1997 and 2001. It also contains lower concentrations of total dissolved solids and other constituents than found in the majority of the wells listed, suggestive of communication or recharge from the fresher water in the overlying Seymour Aquifer. This is the only well of the 14 that directly underlies the Seymour Aquifer.
No substantial correlations appear to exist between the depths of the wells and the number of decreases in constituents or their relative amounts of decrease (Table 6.1). For example, the deepest well of the 14, Cottle County well 12-40-701 at a total depth of 335 feet below land surface, underwent decreases in five constituents: 30.8 percent in chloride, 26.2 percent in nitrate, 12.4 percent in sodium, 4.5 percent in total dissolved solids, and 2.1 percent in calcium. But Hardeman County well 13-51-401, the shallowest of the 14 wells at a total depth of 30 feet below land surface, also underwent decreases in four constituents: 40.2 percent in nitrate, 14.1 percent in calcium, 11.1 percent in sulfate, and 7.4 percent in total dissolved solids. The greatest percentage decrease of any one constituent, or 94.6 percent, in nitrate as noted above occurred in well 05-46-704 in Wheeler County, a 200-foot-deep well. The median depth of all 14 wells is 134 feet below land surface. The second highest decrease, also in nitrate of 91.9 percent, occurred in well 22-30-101 in King County, a 128-foot-deep well, although the overall decrease of 2.03 milligrams per liter is much smaller than the 54.6 milligrams per liter decrease in nitrate in the Wheeler County well.
The trends we noted in two or three water quality samples collected from 14 wells, or 25 percent of the total number of wells with water quality information during the study period, are too few samples spread over too large a geographic area to suggest a quantitatively defensible change in water quality of the Blaine Aquifer. However, using the data set from these 14 wells, we can make some general observations. Of the 84 possible comparisons in analyte concentrations from the earliest sampling event to the most recent, 55 constituents showed a decrease in concentration, 27 constituents showed an increase, and 2 constituents (sulfate in Collingsworth County well 05-63-608 and chloride in Hardeman County well 13-42-604) remained the same (Figure 6-1). Decreases in some mineral or ion concentrations with primary and secondary standards appear as follows and are summarized below (Table 6-2):
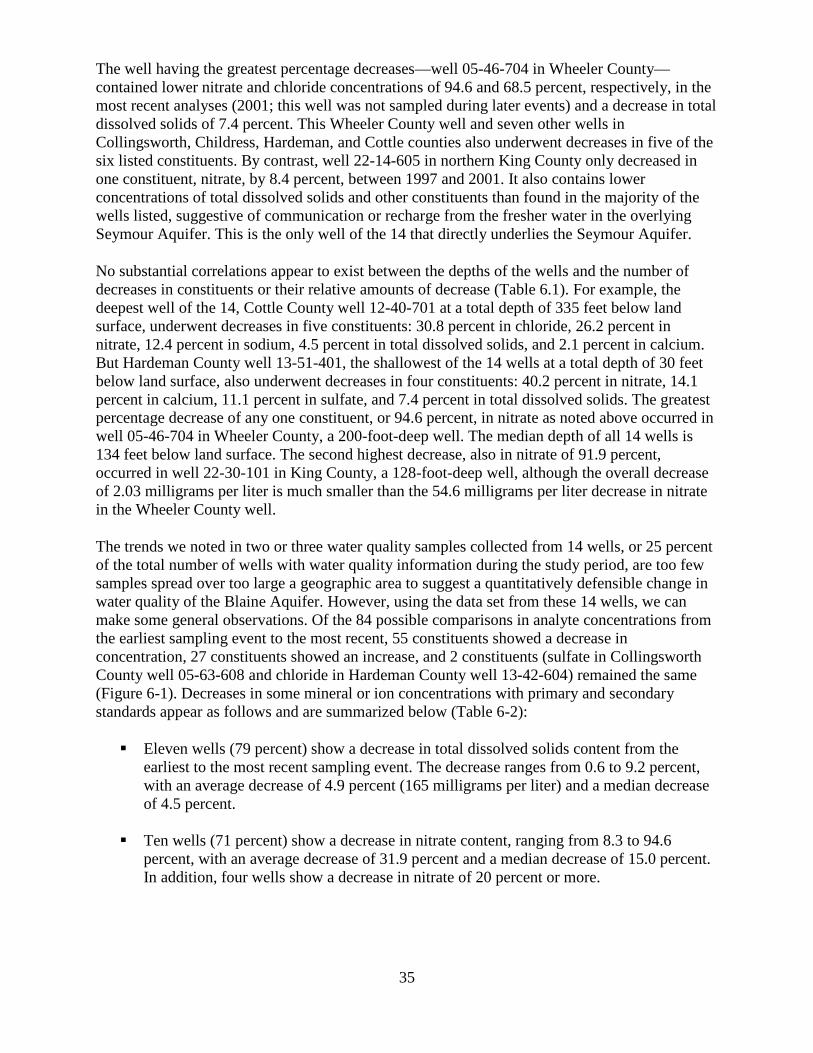
Eleven wells (79 percent) show a decrease in total dissolved solids content from the earliest to the most recent sampling event. The decrease ranges from 0.6 to 9.2 percent, with an average decrease of 4.9 percent (165 milligrams per liter) and a median decrease of 4.5 percent.
Ten wells (71 percent) show a decrease in nitrate content, ranging from 8.3 to 94.6 percent, with an average decrease of 31.9 percent and a median decrease of 15.0 percent. In addition, four wells show a decrease in nitrate of 20 percent or more.
36
Ten wells (71 percent) show a decrease in chloride content, ranging from 4.0 to 68.5 percent, with an average decrease of 22.1 percent and a median decrease of 13.7 percent. Four wells also show a decrease in chloride of 20 percent or more.
Seven wells (50 percent) show a decrease in sulfate content, ranging from 2.8 to 11.1 percent, with an average decrease of 7.4 percent and a median decrease of 8.6 percent.
Table 6-2. Summary of constituent decreases from water quality samples collected in 14 wells in the Blaine Aquifer. mg/l = milligrams per liter.
Analyte Wells with decreases
Average decrease
(mg/l) Average percent
decrease
Median decrease
(mg/l)
Median percent
decrease total dissolved solids 11 165.3 4.9 18.0 4.5 nitrate 10 9.6 31.9 1.7 15.0 chloride 10 1.7 22.1 24.0 13.7 sulfate 7 129.8 7.4 145.2 8.6 sodium 11 38.3 12.2 21.9 12.4 calcium 7 42.8 6.3 31.0 4.9
37
7 Conclusions The total dissolved solids content in groundwater in the Blaine Aquifer ranges widely from 385 to nearly 7,500 milligrams per liter. Only a handful of wells in the recharge areas have water quality that meets the secondary drinking water standards for total dissolved solids of less than 1,000 milligrams per liter. Most of the samples are slightly to moderately saline (greater than 1,000 to 10,000 milligrams per liter), primarily rendering the groundwater suitable only for use in irrigation of salt-tolerant crops. Of the 73 samples collected from 55 wells, 97 percent contained total dissolved solids exceeding the secondary drinking water standard of 1,000 milligrams per liter.
Constituents contributing to the high dissolved solids content include sulfate and chloride, found in excess of their secondary drinking water standards in 99 and 29 percent of the samples, respectively. A high calcium and magnesium content also contributes to the total dissolved solids and the hardness of the groundwater. Iron and manganese, although not as abundant, were also found in excess of their secondary standards in 13 and 5 percent, respectively, of the samples collected.
Blaine groundwater contains 3 trace constituents and 1 nutrient constituent that exceed their primary maximum contaminant levels: selenium in 17 percent of the sample population, gross alpha radionuclide particles in 10 percent, arsenic in 5 percent, and nitrate in 15 percent. With the exception of nitrate, the TWDB routinely began to sample for these constituents and other trace elements, primarily trace metals, from 1988 to the present.
Wells with multiple water quality measurements show a decrease in three inorganic constituents with secondary drinking water standards—total dissolved solids, chloride, and sulfate—in addition to calcium and sodium. The depth of the well does not show any correlation with decreases in constituents.
Despite limited decreases of select constituents in the groundwater over time, however, water quality in the aquifer remains less than ideal for drinking water purposes. With most of Blaine groundwater being slightly to moderately saline and hard, it is mainly suitable only for irrigation, livestock, and industrial uses. Trace elements such as arsenic and gross alpha occur in some wells in excess of their primary drinking water standards. A more refined knowledge of the abundance and location of constituents such as radionuclides and arsenic, both difficult and expensive to remove from drinking water supplies, will be essential to determine the feasibility of making greater use of this brackish groundwater supply.
38
8 Acknowledgments The TWDB appreciates the cooperation of the property owners in the study area for supplying information concerning their wells and allowing access to their property to sample for water quality. The authors are also particularly thankful to Radu Boghici, Ali Chowdhury, Sarah Davidson, Robert Mace, Susann Doenges, and Patricia Blanton for their crucial edits and to Sarah Davidson, Radu Boghici, and Mike Parcher for additional work on graphics.
39
9 References Ashworth, J.B., and Hopkins, J., 1995, Aquifers of Texas: Texas Water Development Board Report 345, 69 p.
Duffin, G.L., and Beynon, B.E., 1992, Evaluation of water resources in parts of the Rolling Prairies region of North-Central Texas: Texas Water Development Board Report 337, 93 p.
Ewing, J.E., Jones, T.L., Pickens, J.F., Chastain-Howley, A., Dean, K.E., and Spear, A.A., 2004, Groundwater availability model for the Seymour Aquifer: Contract Final Report: July 2004, 166 p.
Gould, C.N., 1906, The geology and water resources of the eastern portion of the Panhandle of Texas: U.S. Geological Survey Water-Supply Paper 154, 64 p.
Hem, J.D., 1985, Study and interpretation of chemical characteristics of natural water (3d ed.): U.S. Geological Survey Water-Supply Paper 2254, 264 p.
LBG-Guyton Associates, 2003, Brackish groundwater manual for Texas regional water planning groups: Contract report prepared for Texas Water Development Board, 224 p.
LBG-Guyton Associates, 2004, An evaluation of brackish and saline water resources in Region F: Contract report prepared for Region F Regional Planning Group, 63 p.
Maderak, M.L., 1972, Ground-water resources of Hardeman County, Texas: Texas Water Development Board Report 161, 45 p.
Maderak, M.L., 1973, Ground-water resources of Wheeler and eastern Gray counties, Texas: Texas Water Development Board Report 170, 67 p.
Muller, D.A., and Price, R.D., 1979, Groundwater availability in Texas—Estimates and projection through 2030: Texas Department of Water Resources Report 238, 77 p.
NDWC (National Drinking Water Clearinghouse), 1998, Tech brief—Iron and manganese removal: item #DWBLPE70, 4 p.
Price, R.D., 1978, Occurrence, quality, and availability of ground water in Jones County, Texas: Texas Water Development Board Report 215, 224 p.
Price, R.D., 1979, Occurrence, quality, and availability of ground water in Wilbarger County, Texas: Texas Water Development Board Report 240, 229 p.
Smith, J.T., 1970, Ground-water resources of Collingsworth County, Texas: Texas Water Development Board Report 119, 116 p.
40
Smith, J.T., 1973, Ground-water resources of Motley and northern Floyd counties, Texas: Texas Water Development Board Report 165, 66 p.
Texas Commission on Environmental Quality (Texas Commission on Environmental Quality), 2004, Drinking water standards governing drinking water quality and reporting requirements for public water systems: Title 30, Texas Administrative Code, Chapter 290, Subchapter F, RG-346, 86 p.
TGPC (Texas Groundwater Protection Committee), 2003, Texas groundwater protection strategy: Report AS-188, 101 p.
TWC (Texas Water Commission), 1989, Ground-water quality of Texas—An overview of natural and man-affected conditions: Report 89-01, 197 p.
TWDB (Texas Water Development Board), 2003, A field manual for groundwater sampling: Manual UM-51, 43 p.
TWDB (Texas Water Development Board), 2007, Water for Texas 2007: Texas Water Development Board State Water Plan, v. 2, 392 p.
TWDB (Texas Water Development Board), Historical Water Use Information, groundwater pumpage estimates, 2003: http://www.twdb.texas.gov/wushistorical/DesktopDefault.aspx?PageID=2.
U.S. EPA (U.S. Environmental Protection Agency), 2000, Technical fact sheet—Final rule for (non-radon) radionuclides in drinking water: EPA 815-F-00-013, 5 p.
U.S. EPA (U.S. Environmental Protection Agency), 2005a, Consumer fact sheet on selenium: http://www.epa.gov/ogwdw/pdfs/factsheets/ioc/selenium.pdf
U.S. EPA (U.S. Environmental Protection Agency), 2005b, Consumer fact sheet on nitrates/nitrites: http://www.epa.gov/ogwdw/pdfs/factsheets/ioc/nitrates.pdf
Winslow, A.G., and Kistler, L.R., 1956, Saline-water resources of Texas: U.S. Geological Survey Water-Supply Paper 1365, 105 p.
WHO (World Health Organization), 2001, Arsenic in drinking water: Fact sheet No. 210, 5 p.