Embed Size (px)
Citation preview

Investing for generations
Report & AccountsFor the year ended 31 December 2014

Our key facts as at 31 December 2014
Share Price
478.9p9.0%
Total Shareholder
Return
Overview Our business model and strategic priorities 2Performance Our Chief Executive provides an overview and answers questions about the Trust 4Portfolio Our investments, how they performed in the year and how they are selected 7Finance Our Chief Financial Officer discusses the financial performance for the year 24Investing for Generations Our sustainability strategy and how we applied it in 2014 32Governance Our Board and Committees and what they did in the year 38Remuneration Our approach to remuneration and how we reward our Directors for performance 48Financial Statements Our statutory accounts for the financial year 2014 68
Net Asset Value
546.8p8.1%
NAV Total Return
Total Dividend
Ordinary 9.834pSpecial 2.546p
+14.3%
Ongoing Charges Ratio
0.60% -20%

Introduction from the ChairI am delighted to present Alliance Trust’s 127th Annual Report.
In last year’s report and accounts we presented our Vision 2020 strategy setting out our aim of becoming the UK’s most trusted investment and savings business. As a Board we continuously scrutinise our progress against that strategy and evaluate all aspects of our business to ensure we have the right organisation and structure in place to achieve Vision 2020. We now report on progress during 2014 against those goals.
2014 was a year in which we delivered a Total Shareholder Return of 9.0% and an NAV Total Return of 8.1%, in each case placing us in the second quartile of our Peer Group. At the same time, we have also increased our total dividend by 14.3%, allowing us to continue our progressive dividend track record for the 48th consecutive year. We continue to focus on costs and partly as a result of this the Company’s Ongoing Charges Ratio reduced to 0.60% for the year. Our discount narrowed slightly, ending the year at 12.4%, and we maintained our ongoing buyback policy, repurchasing some 6.7m shares, representing 1.2% of shares in issue, over the course of the year.
We report on our performance against the key measures of success, covering both annual and longer-term performance. By focusing on the delivery of consistent and dependable performance, firmly in the second quartile, from year to year we aim to deliver returns for shareholders which will reach the top quartile over the longer term. The changes we have made to our investment team, together with the evolution of our distinctive investment strategy, give us confidence that we are on track and that we can meet the expectations and retain the trust of our shareholders. As a Board, that must remain our over-riding priority.
This year, for the first time, we also report more comprehensively on our sustainability strategy – Investing for Generations. This is the first step in a longer process towards integrated reporting. We believe providing information on our strategy and performance in this broader context is important as it is integral to long-term value creation for our shareholders. Our Chief Financial Officer, Alan Trotter, provides more detail on this on page 25.
We also report on the progress which our subsidiary businesses, Alliance Trust Savings and Alliance Trust Investments, have made during the year – we continue to believe that our investment in these businesses differentiates Alliance Trust from
other investment trusts and will deliver long-term value for our shareholders.
Towards the end of the year we welcomed Gregor Stewart to the Board as a new non-executive director. In addition to extensive experience as a financial professional, Gregor brings a broader knowledge of financial services which adds
to the existing skills represented around our Board table. Win Robbins stood down from the Board after the year end. We thank her for her contribution and wish her well for the future. I believe that the Board must possess a
diverse and complementary range of skills and experience if it is to be able to offer constructive challenge and perspective to management and this is evident from the profiles of my fellow directors.
Politically, 2014 was dominated by the referendum on Scottish independence and the decision by voters to remain within the United Kingdom. This was an unsettling period for many of our shareholders
and customers, particularly those in other parts of the UK, and inevitably we, along with other Scottish-based companies, were affected. While the debate over the extent of future devolution
continues, we would urge all participants to recognise that an extended period of uncertainty is not in the interests either of business or the economy as a whole and we remain ready
to act as necessary to protect our shareholders’ and customers’ interests.
I and my fellow Directors hope you will find the rest of this Annual Report interesting and informative. We thank you for your continuing support
of Alliance Trust.
Karin Forseke

2 | Alliance Trust PLC Report & Accounts 2014
Strategic Priorities
We set out below our Strategic Priorities and on the opposite page the Key Performance Indicators (KPIs) which we use to measure our progress.
We use KPIs to assess how the Company is performing in the short, medium and long term over a range of financial and business objective measures. These KPIs are embedded within our performance management processes and are the key tool we use to ensure that all of our people are fully aligned behind our strategic priorities and to allow us to measure progress against our Vision 2020 goals.
Our KPIs are also used by our Remuneration Committee in determining the rewards of our Executive Directors. You will find more detail in our Remuneration Report on pages 48 to 60 as to how their Corporate and Business targets are aligned to our KPIs.
Platform Purpose
People
Profile Performance
Purpose:Creating wealth and security for our investors
Performance:Delivering strong and sustainable investment performance
People:Making Alliance Trust an employer of choice
Profile:Raising awareness of Alliance Trust among our target market
Platform:Building a robust operating and control framework to support growth

Alliance Trust PLC Report & Accounts 2014 | 3
Indicators as at 31 December 2014 2013
Employee Engagement Index 88% 79%
Company Values Index 77% 72%
More detail can be found in our Investing for Generations section on pages 31 to 35.
Indicators as at 31 December 2014
Brand campaign effectiveness* +18%
* This is the average relative increase in brand awareness measured after the conclusion of advertising campaigns carried out in 2014.
Indicators as at 31 December 2014 1 Year 3 Year 5 Year
Ordinary Dividends* 3.0% 3.0% 3.8%
Total Dividends including special dividends* 14.3% 11.2% 8.7%
* Compound annual growth
Dividend Growth
Our key performance indicators
Indicators as at 31 December 2014 1 Year 3 Year 5 Year
Total Shareholder Return (TSR) 9.0% 50.3% 64.8%
Peer group rankings † (TSR) (quartile) 14/35 (2nd) 17/33 (Median) 15/32 (2nd)
Shareholder Return
Indicators as at 31 December 2014 2013 2012
Discount to Net Asset Value 12.4% 12.9% 15.6%
† Peer group is the Global Investment Trust sector.
Indicators as at 31 December 2014 1 Year 3 Year 5 Year
Net Asset Value (NAV) Total Return 8.1% 43.4% 53.0%
Peer group rankings (NAV) (quartile) 14/35 (2nd) 17/33 (Median) 18/32 (3rd)
We report on the performance of our investments including equities, our subsidiaries, private equity and mineral rights on pages 10 to 23.
Investment Return
Purpose
Performance
Platform
People
Profile
Indicators as at 31 December 2014 2013 2012
Company Expenses £20.8m £21.5m £18.7m
Ongoing Charges Ratio 0.60% 0.75% 0.67%
Company Expenses

4 | Alliance Trust PLC Report & Accounts 2014
Business Model
To create total shareholder return
What makes us distinctiveWhat we do
•Responsibleinvestment is fundamental to our investment process
•Focusonsustainable global themes
•Emphasisonstockselection
•Long-terminvestment in subsidiaries
We invest in:
•Globalequities
•FixedIncome
•Otherassetclasses
•Subsidiaryentities
Capital growth:
•Investment portfolio
•Investmentinsubsidiary entities
Income growth funded by:
•Dividendsand income from the Trust portfolio and investments in subsidiaries
Narrowing of discount:
•Through increased demand for our shares, generated through strong performance.
Asset Management
•AllianceTrustInvestments
Savings Platform
•AllianceTrustSavings
•Innovative products
•Rangeofsustainable investment choices
•Flatrate charging structure
•Transparent& competitive pricing
•Qualityof service
We offer:
•Equityandfixed income investment funds
•Institutionalinvestment solutions
We offer retail investors:
•InvestmentDealing Accounts
•ISAs
•SIPPs
AllianceTrust’sbusinessmodel,asaself-managedinvestmenttrust,isfocusedonmaximisingthe return on our shareholders’ investment while seeking to protect its value in more challenging economic conditions. Our aim is to deliver strong and sustainable investment performance for our shareholders over the longer term. We invest in a range of assets including asset management and savings platform subsidiaries to generate capital growth and dividend income. Through borrowing we can enhance returns when market conditions permit.

Alliance Trust PLC Report & Accounts 2014 | 5
How we implement our strategy
Our Priorities What we did in 2014
Purpose: Creating wealth and security for our investors
Many investors seek the creation of capital and preservation of wealth with income growth over the long term. Commentators believe global investment trusts are an ideal vehicle for this.
The uncertainties surrounding the outcome of the referendum on Scottish independence significantly impacted financial businesses in Scotland for both existing and potential customers.
Our total shareholder returns are consistently median or better across both short and long-term horizons. We are one of only four FTSE companies to have a 48 year record of consecutive dividend increases.
We have reduced our costs by 3% from 2013 and have announced further efficiency measures which we anticipate should reduce recurring costs by around a further 6% compared with 2013.
During 2014 we demonstrated our commitment to our shareholders and customers by stating we would do whatever was necessary to continue to service and protect their investments and savings wherever they were located.
Performance: Delivering strong and sustainable investment performance
Investors are increasingly looking for companies to be more aware of their impact on customers, employees, communities, suppliers and the environment as well as providing a good return.
Our NAV return was second quartile in the year and median over three years.
The discount to our NAV also impacts upon returns and we believe that above median investment performance drives a narrowing discount. The flexible buy back policy we introduced in 2011 has also helped to reduce our discount from 17.1% in 2011 to 12.4% at the end of 2014. A sustained narrowing of the discount delivers significant value to all shareholders.
Investing for Generations is our strategy which lays out our approach to sustainable investing and this can be found on pages 31 to 35.
People: Making Alliance Trust an employer of choice
Recruiting and retaining the best people is key to the success of every business.
We have introduced a development programme to allow future leaders to realise their potential.
By embedding our strategy in this way, we have seen an improvement in our peoples’ engagement and also the embedding of our culture and values in how they work.
Profile: Raising awareness of Alliance Trust
The investment trust sector in the UK is worth £122bn, of which the Global sector accounts for 20%.There has been a 31% increase in platform purchases of investment trusts in 2014.
Following the implementation of the Retail Distribution Review, and announced pension changes, investment trusts are set to become a more popular choice for long term investors.
During the year our advertising campaigns showed increased brand awareness of up to 21%.
Our savings platform, Alliance Trust Savings, is one of the top three UK distributors of investment trusts. Their assets under administration grew 19% against market growth of 13%.
Our asset management business is award winning and is one of the industry’s largest sustainable investors – with more than £1.6bn under management in its Sustainable Future funds and the first in the UK to offer a risk-profiled range of sustainable funds.
Platform: Building a robust operating and control environment to support growth
We have strengthened our investment operations by outsourcing our middle and back office functions to BNY Mellon.
The results
• NAVTotalReturn8.1%andTotalShareholderReturn9.0%,placingusinthesecondquartileofallGlobaltrustsoveroneyear.
• Totaldividendincreaseof14.3%,the48thconsecutiveyearofdividendincreases.
• OngoingChargesRatioreducedto0.60%.
• OurEmployeeEngagementIndexincreased11%intheyearandourCompanyValuesIndexby7%.
Our Vision 2020 strategy sets out how, by 2020, we aim to be the UK’s most trusted investment andsavingsbusinesswithamarket-leadingemphasisonsustainableinvestmentwhilstbeinganemployer of choice with an embedded sustainability record.

6 | Alliance Trust PLC Report & Accounts 2014
Today, Alliance Trust is in more robust health than it has been at any time in the last six years. This has not happened overnight, but is the result of the series of improvements that we have made over that time, not least the actions that we have taken in the last twelve months.
At the half year, we commented that the results for the first six months had been disappointing and this was always going to have a bearing on the results for the full year. However, I am pleased to report that the second half performance represents a complete contrast to the first; we reported an NAV Total Return of
0.3% in the first half, 7.8% in the second, making 8.1% for the full year. Our total shareholder return ranks median or above, relative to our peers, over six months, one,
three, five and seven years. Moreover, we have delivered top quartile annualised total dividend growth over the same periods. We know that this combination of capital growth
and a consistently rising dividend is an important differentiator for the Trust.
The portfolio is well positioned, and is being managed with a greater sense of purpose and focus. In September, we announced that we were merging the two equity teams employed by Alliance Trust and Alliance Trust Investments. We did this in order to unify the investment process and in so doing, we have improved the focus of the team and have been able to reduce costs. We appointed Peter Michaelis as Head of Equities and Simon Clements to be the lead manager of the equity portfolio of the Trust. They have worked together for 11 years and have been managing the Sustainable Future fund range for over four years. They joined us over two years ago and during that time, we have been able to fully assess their investment philosophy and process and to monitor the performance of their funds. I am confident that we have put the portfolio of the Trust into the hands of a team that has a proven process and a successful track record.
At the same time, we have continued to put the platform in place to ensure that all parts of the business can achieve the targets set for them as part of Vision 2020. In the case of the Trust, we have secured some of the most cost-effective, long-term, fixed-rate borrowings of any investment trust, which gives us certainty for a large part of our borrowing requirements out to 2029. During 2014 we developed Investing for Generations, our plan for achieving our 2020 Vision. This sets out how we will grow our business in a way that is responsible and ensures a sustainable future for our shareholders, customers and communities. The chart below shows how we have delivered both capital and income returns to our shareholders over the last 48 years.
We have strong foundations in place upon which we are building businesses that will consistently compete with the best in their sector. We remain committed to improving the processes we use across the business to drive enhancements to the shareholder, both by increasing revenue and reducing costs.
Over the next three pages I answer some of the questions we have been asked about the Trust and what we have done over the last financial year.
Katherine Garrett-Cox
Chief Executive
48 year shareholder returns
Dividend per Share (p) (right hand side)Total Return (left hand side) Capital Return (left hand side)
0
2,000
4,000
6,000
8,000
10,000
12,000
14†1211*0907050301999795939189878583817977757371690
10
20
Dividend per Share (p)Return rebased to 100 at 31 January 1968
* To 31 January 1968-2011 † To 31 December 2011-2014 Source: Alliance Trust

Alliance Trust PLC Report & Accounts 2014 | 7
Howdidourequityportfolioperform in 2014?We are reasonably pleased with the performance in the latter
part of the year, particularly given the back drop of the volatility
in global equity markets and the relatively poor start to the
period. We always strive to do more, but we are not prepared
to compromise the preservation of our shareholders’ capital or
the delivery of income required to fund the consistently rising
dividend. We are long-term investors and our total shareholder
return is in line with our peers building upon our steady
performance over the last few years. We recognise that we are
competing against other trusts and funds and want to deliver
returns that meet the expectations of our shareholders. In this
respect, the expectations of employees and shareholders are
closely aligned as 80% of our employees are also shareholders
in Alliance Trust. However, we would guard against fixating on
the returns between two specific dates. We look to invest for
the long-term and sometimes the stocks in which we invest are
temporarily out of favour with the market. We will continue to
hold such stocks so long as we remain confident that they will
generate superior returns for our shareholders over the lifetime
of our investment.
How did we achieve this return?The return has been achieved by being consistent in our
approach, even though what drove the market changed
significantly over the year. In the first half of the year, the market
favoured apparent value, in place of long-term fundamentals
which we have always preferred. At such times, our portfolio
is liable to underperform. In the early part of the year the
challenge was whether we should wait for the market to readjust
or whether we needed to consider that the market dynamics
had changed to such an extent that investment rationale for
the portfolio was undermined. We remained confident in the
quality of the portfolio that we held and we were vindicated in
our approach by the results in the latter months of the year. We
constantly review the investment rationale for each holding and
were satisfied that in most cases there was no cause for concern.
In October, we undertook a comprehensive review of the whole
portfolio and a number of changes were made, which reduced
the number of holdings from 84 to 74. These changes were
driven by the reassessment of the outlook for those stocks, not
by momentum. This has allowed us to put a larger proportion of
the portfolio into each holding and the positions in all but five
companies each equate to over 0.5% of the portfolio. The vast
majority of the companies in which we invest are held because
we expect them to deliver a combination of capital growth and
a sustainably rising dividend.
Why do we see sustainability as important for the Trust?We believe that Alliance Trust should be managed in a
sustainable way as this is the best way to deliver returns for our
shareholders over the long term. We provide detail of how we
do this on pages 31 to 35. Our belief is that companies that
fail to recognise their responsibilities to the wider community
are more likely to experience a negative event, which will
impact upon their share price.
We see sustainability as an important starting point for
identifying companies that will deliver returns to shareholders
over the long term. The vast majority of the Trust’s shares are
held by private individuals and many of them have held their
shares for decades. This makes it consistent for us to invest
with a long-term view in order to match our investors’ time
horizons. We look for companies that we expect to have staying
power, such that they will be a suitable investment for us for
years to come. Typically, such companies will manage their
resources carefully and will be led by a management team that
understand their responsibilities, not just to their investors, but
also to their other stakeholders, be they suppliers, employees or
the local communities in which they operate.
The reliability of the earnings progression of more sustainable
companies will help underpin the growth of the portfolio, help us
reduce trading costs and align the investment horizon of the
portfolio with those of our shareholders.
Does this approach restrict our ability to deliver investment returns?Far from being a restriction, it is an important advantage to
delivering consistently strong investment returns. By focusing
on companies with better quality management and better
growth prospects, we will enhance the returns we deliver
to our shareholders. The criteria we are looking for is high
quality management, good growth prospects and a supportive
regulatory environment. We are therefore less likely to be
invested in companies which manufacture products such
January to April 2014
Launchofgroup-wide brand campaign. Special Dividend declared.
Phase 1 of investment back office outsourcing goes live.

8 | Alliance Trust PLC Report & Accounts 2014
as munitions or tobacco. The Trust can invest in any listed
company, provided that the team satisfy themselves that
the potential damage that its products do to society or the
environment is more than offset by the approach taken by the
management to mitigate the worst effects of their products.
Is sustainability important for the long-term?Analysis suggests that this is a structural change in the
investment industry. We have seen a growing awareness
amongst investors, both institutional and private, that
shareholders should be taking their responsibilities as owners
more seriously. They are increasingly challenging company
management teams to recognise their responsibilities for their
supply chain and the way in which their products are made.
We have seen a sharp rise in the number of signatories to the
United Nations Principles for Responsible Investment (UNPRI),
whose first Principle is that “we will incorporate Environmental,
Social and Governance (ESG) issues into investment analysis and
decision making processes”. There are over 1,340 signatories
with combined assets under management of approximately $45
trillion. We have been signatories for a number of years and we
welcome the fact that the mind-set embodied in the UNPRI is
becoming mainstream.
What does sustainability mean for our dividend?We are very aware of the Trust’s dividend commitment and
are confident that we can continue to deliver on it. We have
increased the total dividend payout by 14.3%, making this the
48th consecutive year of increase. We have delivered top quartile
annualised total dividend growth over one, three, five and seven
years. We monitor our dividend projections very carefully and
are confident that we will continue to deliver the dividend and
dividend growth as required, without having to draw on reserves.
In addition to monitoring our dividend projections, we also
consider how the dividend we receive is generated. For example,
we do not hold any tobacco stocks, which have traditionally
distributed high levels of income, because they may not be able
to maintain these high levels of distribution in the future.
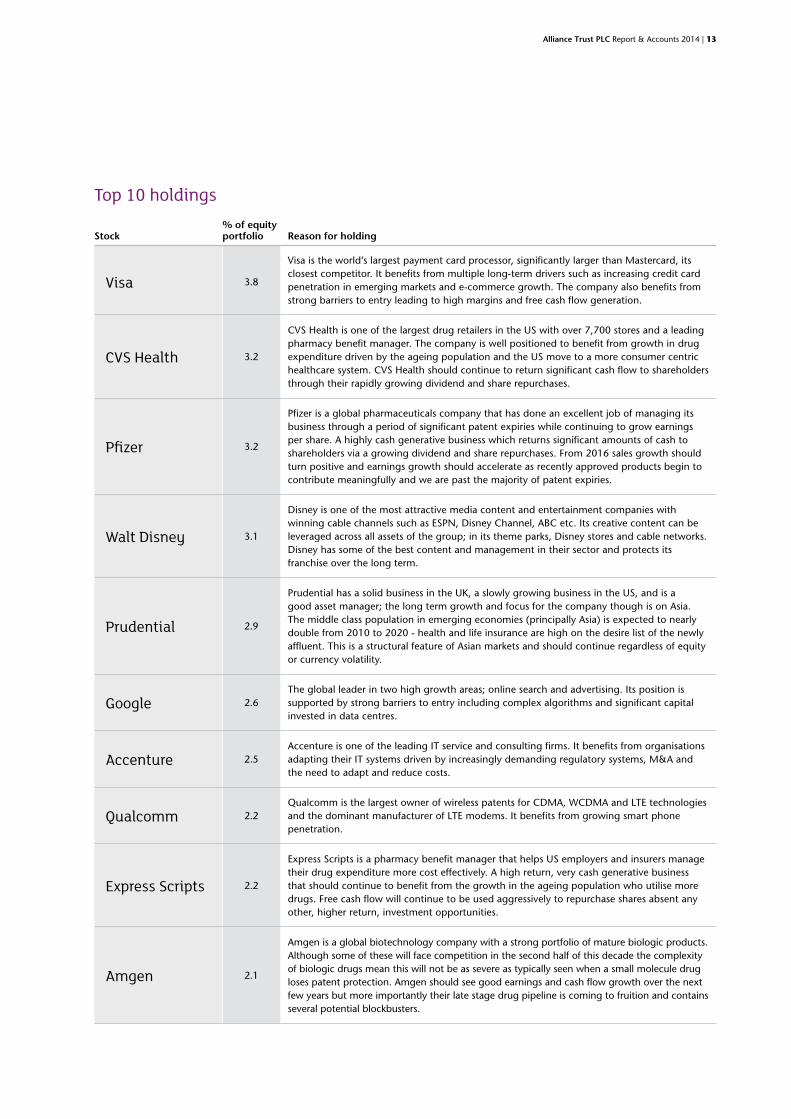
What about the performance of our other assets in the portfolio?We have seen significant positive contributions from our other
assets. The private equity portfolio is maturing as most of our
remaining investments were made prior to 2010. The remaining
portfolio is valued at £130m and we are confident that there is
significant potential uplift embedded in the remaining portfolio
which will be delivered as it continues to mature.
The other area where we have seen strong results is in the
Mineral Rights portfolio. These rights date back to the early days
of Alliance Trust, when it was a mortgage bank lending to farmers
in North America. We still own the mineral rights on various
plots across southern and central United States and we receive
a revenue stream from the oil and gas that is being extracted
from these plots. The development of shale gas technology has
enabled more land to be exploited and this has led to an uplift in
the income received. The increased revenue underpins the 127%
increase in the valuation of the mineral rights for 2014. However,
we expect that the current lower oil price will feed through into
lower valuations for these rights in 2015.
What progress has been made by Alliance Trust Savings in 2014?Alliance Trust Savings has navigated its way through some of
the most turbulent waters facing its industry for generations.
During this period our business has also been impacted by
the uncertainties surrounding the Scottish independence
referendum which led to some customers postponing important
investment decisions last year. We are delighted that platform
charging has finally become transparent as part of the Retail
Distribution Review, and in 2014 we have seen a 19% increase
in the assets we administer against a market rise of 13%. We
have seen inflows as customers recognise the benefit to them of
the flat-fee pricing structure.
There are three sources of income for Alliance Trust Savings:
transaction charges which were up as a result of a 10% increase
in the number of trades executed; account fees, which were
down, because the number of accounts we administer fell by
5%; net interest income, which is largely flat as interest rates
remain at very low levels. One factor in the fall in operating profit
was the number of customers, mostly with smaller balances,
who elected to close their accounts when we announced that
we were increasing the administration fees for ISAs and dealing
May to August 2014
Alliance Trust Cateran Yomp attracts over 560 entries.
Alliance Trust Investments launch range of Risk
Profiled funds.
Alliance Trust raises £100m of unsecured fixed term funding.

Alliance Trust PLC Report & Accounts 2014 | 9
accounts by 87% in February 2014. While we expected that some
customers might do so, we were confident that others would
transfer their accounts to us and overall we would be a beneficiary
of the greater transparency around platform pricing.
We are confident that we are well placed to benefit from the raft of changes that will alter the retail investment industry in the years ahead. The changes to pension rules and ISA limits announced by the Chancellor of the Exchequer in March 2014 are welcome as incentives to save are very important, particularly as we are increasingly encouraged to take responsibility for our own financial futures. We look forward to the implementation of the new pension rules because we believe that they offer greater freedom of choice for pensioners and we are confident that our pricing structure will appeal to a
number of the next generation of pensioners.
How did Alliance Trust Investments perform in 2014?Alliance Trust Investments has continued to generate net inflows
and is now managing £1.9bn of third party funds. By keeping
tight control over costs and growing the asset base we have
reduced the losses again this year. 80% of the funds we manage
which have a three year track record are ranked above median
relative to their peer group over that time. We have launched the
first ever range of risk-profiled Sustainable and Responsible funds
and are seeing inflows into our major fixed income funds – the
Monthly Income Bond Fund and the Dynamic Bond Fund.
What will happen in 2015 and what will the impact be on our portfolio?We invest primarily in companies, not in markets. We focus on understanding the business that these companies are in and assessing whether the market has not fully valued their unique propositions or position in their industry. These are subject to long-term trends which may only emerge over a number of years. As long-term investors it is the direction of travel that is of interest to us, we do not seek to predict short-term fluctuations. Most of the companies in which we invest are international in their outlook and political changes at a national level are likely to impact upon only part of their business, which makes them
more resilient against challenging domestic backdrops.
In terms of events which will make headlines in 2015, we have
an election in the UK in early May, with the prospect of another
referendum, this time on EU membership, creating uncertainty.
Whatever the outcome it will take time for any changes to
make a material difference to the profit and loss accounts of the
companies in which we invest. We believe that the reduction in
the rate of inflation in December 2014 to 0.5% will mean that
interest rates are going to remain low for longer. Commentators
have been predicting that interest rates in the UK will rise “next
year” for at least the last two years, there is a high probability
that they will be using the same words this time next year.
The US economy is regaining momentum while Europe, China
and Japan are all struggling to return to a more normalised
level of growth. Monetary policy will therefore become more
divergent globally over 2015. The US continues to recover, with
the employment and housing markets both contributing to
improving economic activity. Current expectations are that the
Federal Reserve will begin raising interest rates in the second
half of 2015. The strength in the US dollar looks set to continue,
whilst we believe underlying economic momentum will increase
over the first half of the year.
The European economy is struggling to recover from the
recession triggered by the sovereign debt crisis of 2011. The
breakage of the Swiss Franc’s peg to the Euro caused shock
waves across currency markets. Germany’s economy has slowed
as exports have struggled with a slowdown in China and
sanctions on Russia. Recovery in Europe’s periphery has stalled,
as a tough fiscal stance continues to hamper growth. Further
monetary easing from the European Central Bank worth €1.1trn
has been announced. The situation in Greece is of concern
to those governments and institutions that have a financial
exposure to the fall-out from an exit from the Euro. We do
not view this possible outcome as something that would result
in destabilisation of global markets or economies. The bigger
concern to us is the political precedent it may set for other
members of the Eurozone. In the event that Greece does leave
the Euro, it could lead to a reduced commitment to the European
ideal and possibly to the break up to the European Union.
In Asia, the Japanese economy is struggling to digest the
increase in sales tax in April 2014. Policy initiatives have been
successful in depreciating the Yen, but the Abe administration
has not yet implemented the crucial reforms necessary in areas
such as the labour market. The Chinese economy also continues
to slow, with a knock-on effect in demand for commodities.
The portfolio continues to invest in high quality, sustainable
companies that benefit from important structural shifts taking
place across the global economy.
September to December 2014
Investment team unified and portfolio restructured.
Phase 2 of investment back office outsourcing goes live.
Alliance Trust Savings wins Shares Award for best
customer service.

10 | Alliance Trust PLC Report & Accounts 2014
Portfolio Review
Market reviewAt the headline level, equity markets gained ground over 2014
with the MSCI All Country World Index finishing the year up
11.2%. However, this performance masked bouts of high
volatility, notably in October, and divergent trends in the world
economy. In Sterling terms, the MSCI USA returned over 20%,
while investors predominantly invested in the UK, will have seen
that the FTSE All-Share Index only returned a meagre 1.2%.
Of the major markets around the world, only the European
equity indices fared worse, returning 0.2% in 2014. By investing
globally, Alliance Trust provides UK investors with exposure to
these more vibrant markets.
The US market recorded a succession of all-time highs as the
economy gained momentum and investors were reassured
that the Federal Reserve would not raise interest rates until the
recovery had become fully entrenched. In contrast, European
markets struggled to make any headway as economic growth
faltered and the Euro weakened, while the spectre of deflation
returned in Japan where the authorities sanctioned large-scale
quantitative easing and the Yen fell back to a seven-year low.
Emerging markets were volatile and trailed the World Index
as the slowdown in China, geopolitical conflict in the Ukraine
and Middle East, and the prospect of higher US interest rates,
unsettled investors. There was a wide dispersion in returns
between sectors over 2014, with areas such as mining and oil
& gas hampered by the broad weakness of commodity markets
and a sharp decline in energy prices. A glut of supply and lower
Chinese imports saw the oil price record its biggest annual
decline since 2008.
The rotation away from companies with growth characteristics, to
which the portfolio tends to be exposed, was a feature of the first
half of the year as investors harboured concerns that valuations
had become too demanding in view of a subdued outlook for
earnings growth. As a result, the portfolio’s performance lagged
the MSCI All Country World Index over the period.
Portfolio ReviewDuring 2014, Alliance Trust delivered an NAV Total Return of
8.1% and a Total Shareholder Return of 9.0%, the difference
reflecting a narrowing of the discount to 12.4% from 12.9%
over the course of the year. The NAV total return included
a contribution of 2.1% from reinvested dividends. After a
relatively poor first six months the NAV return for the year was
just behind the weighted average return of the AIC Global
Investment Trust sector. The majority of the NAV return was
generated from investments in equities: on average over the
year, nearly 98% of net assets were invested in equities, with
an average total return of 6.9%. This was lower than the
11.2% return of the MSCI ACWI, mainly due to stock selection
in the first half of the year. The main features of global equity
markets in the second half of the year were the weak returns of
the energy and materials sectors, driven by commodity price
movements. We have been reducing our exposure to these
sectors as we prefer to invest in companies involved in the
production of more sustainable energy types. Health care and
information technology were the strongest performers, while
the US market was the strongest major developed market.
In September we announced that we were restructuring
our equity teams. Until that time, we had two teams, one
managing global equities and a second, managing our
Sustainable Future funds. We took the decision to merge
the resources of the two teams and unify the investment
process across all products, focusing on sustainability, business
fundamentals and valuation in order to identify companies
which will deliver returns to shareholders for years to come.
We now have a fully resourced, experienced, equity team of 12
individuals with a long and proven track record in managing
global equities. Simon Clements was appointed the lead
manager of the equity portfolio in September. He has worked
in fund management since 1998 and been managing global
equity funds since 2004. Members of the combined investment
team have been managing sustainable future funds for up
to 14 years, and have extensive expertise in this field. Of the
funds that they manage which have a three year track record,
80% have outperformed their peer group, which includes
unconstrained funds, over that time frame.
Following the restructuring of the team, we undertook a
review of the portfolio and made some changes, which
affected around 15% of the portfolio. The effect of this review
was that 19 holdings were sold and eight new positions were
created. A number of companies which are heavily exposed
to the oil price, such as oil services companies Seadrill and
Oceaneering, were sold and we have reduced our weight in
ENI and Total. Moreover, in the fourth quarter, performance
benefitted from improved performance from “growth”
companies relative to the overall market. The strength of the
Dollar, which rose against Sterling from over £/$1.71 in early
July to below £/$1.56 at year-end, boosted the returns of
MSCIindexreturns,inSterling,formajorequitymarketsin2014.
Source: Alliance Trust
%
0
5
10
15
20
25
MSCIEurope
FTSEAll-Share
MSCIJapan
MSCIAustralia
MSCISwitzer-
land
MSCIAC
World
MSCIHongKong
MSCIUSA

Alliance Trust PLC Report & Accounts 2014 | 11
Contribution Analysis (%)
Average Weight
Rate of Return
Contribution to Total Return
Equities 97.7 6.9 6.9
Fixed Income 6.6 5.1 0.4
Private Equity 4.3 10.5 0.5
Mineral Rights 0.5 126.6 0.6
Alliance Trust Savings 0.9 4.9 0.0
Alliance Trust Investments 0.4 62.4 0.3
Other Investments, Cash & Accruals 2.8 n/a 0.2
Gearing (cost of borrowing) -13.2 1.9 -0.3
Total 100.0 8.6 8.6
Expenses -0.7
Share Buy-backs 0.2
NAV Total Return 8.1
Discount Effect 0.9
Share Price Total Return 9.0
MSCI ACWI Total Return 11.2
Source: Alliance Trust and FactSet
the Trust’s dollar-denominated investments when measured
in Sterling. We added a number of stocks to the portfolio,
including German tyre manufacturer Continental AG and UK–
based specialty chemical group Johnson Matthey. Continental
is exposed to two key themes that will drive earnings over
the next few years – tightening emissions regulations and
road safety. Johnson Matthey’s Emission Control Technologies
division designs and manufactures catalysts used in vehicles
such as heavy duty diesel trucks to reduce pollution, and
revenues are being bolstered by tighter environmental
regulations, particularly in Europe. Disposals included French
oil services group Technip, as the weaker oil price reduces
capital spending by major energy producers. The NAV return
also included significant contributions from fixed income and
other assets.
The holding in the Monthly Income Bond Fund produced
an income yield of nearly 6% and a total return of 7.7%,
although the Dynamic Bond Fund had a return of -0.9%.
The performance of both funds was held back by their short
duration position during a year when global government bond
yields continued to fall. The total return from fixed income
was 5.1%. The aggregated gains from private equity, property,
mineral rights and subsidiaries were £43m, contributing 1.5%
to performance. The return from private equity was a strong
10.5%. The use of gearing of a constant £380m throughout
the year benefited performance, as we were able to generate
returns on all asset classes well in excess of our average
borrowing cost of 1.9%. Net gearing was 11.2% of net assets
at the end of the year.
Expenses of £20.8m reduced the NAV return by 0.7%. This
was a lower impact than in 2013, due to ongoing efficiency
management.
In total, 6.7 million shares were repurchased in 2014, equivalent
to 1.2% of the initial shares outstanding. The effect of
repurchasing shares at a discount was to add 0.2% to the NAV.
A notable feature of the results outlined above is the positive
contribution from each asset class, supported by the favourable
financial market conditions. This has not always been the case,
and indeed the Trust’s portfolio is structured in the expectation
that there will be periods when having a diversified portfolio
turns out to be helpful, for example with weak performance
of equity markets being offset by strong performance in fixed
income and other asset classes. This is important from a risk
management perspective.
Risk management is also a major consideration in the choice
of each company in which we invest. The focus on sustainable
investing, with careful consideration being given to a broad
range of factors including environmental impact and corporate
governance, is intended to mitigate risk. This is expected
to result in good overall risk-adjusted returns for the equity
portfolio and overall for the Trust.

12 | Alliance Trust PLC Report & Accounts 2014
Stock contribution
Top 10 contributorsStock Sector
Closing weight (%)
Return (%)
Contribution to return Activity
CVS Health Consumer Staples 3.2 44.7 1.07 increased
Visa Information Technology 3.8 25.3 0.89 increased
Walt Disney Consumer Discretionary 3.1 32.4 0.86 no change
Amgen Health Care 2.1 50.7 0.81 no change
Wells Fargo Financials 2.1 31.2 0.50 increased
Express Scripts Health Care 2.2 28.0 0.50 no change
Enterprise Products Partners Energy 1.8 19.4 0.44 no change
Accenture Information Technology 2.5 18.2 0.41 increased
AmerisourceBergen Health Care 1.4 37.7 0.41 no change
National Grid Utilities 2.1 22.0 0.40 increased
Bottom 10 contributorsStock Sector
Closing weight (%)
Return (%)
Contribution to return Activity
SAP Information Technology 1.5 -12.5 -0.19 increased
Volkswagen (Pref) Consumer Discretionary - -22.2 -0.22 sold
Rolls-Royce Industrials - -36.0 -0.23 sold
Samsung Electronics Information Technology - -13.4 -0.23 sold
Standard Chartered Financials - -28.4 -0.26 sold
Barclays Financials - -20.6 -0.26 sold
Seadrill Energy - -41.8 -0.31 sold
Noble Energy Energy 1.0 -25.4 -0.33 increased
Coach Consumer Discretionary - -28.9 -0.35 sold
Petrofac Energy 0.5 -45.3 -0.39 new holding
Of the top 10 positive contributors, six are among the largest holdings in the portfolio and a further three are in our top 20
holdings. We have maintained our position in many of them, and where we are particularly confident, we have increased our
exposure to these successful companies. We have not reduced our exposure to any of the companies which have generated the
most for the Trust in the year, because we are comfortable that they will continue to deliver returns to us.
By contrast, while we have completely sold seven of the companies which negatively impacted investment performance, in two
cases, Noble Energy and SAP, we have taken the opportunity to increase our positions because we believe that the fall in price is
driven by momentum and not by fundamentals. Consequently, this fall in price offered an opportunity to acquire additional shares
at an attractive valuation. We built a position in Petrofac in February 2014. It has suffered, in the short term, as a result of the fall in
the oil price, but we consider the valuation to be attractive in a challenging environment.
Alliance Trust PLC Report & Accounts 2014 | 13
Top 10 holdings
Stock% of equity portfolio Reason for holding
Visa 3.8
Visa is the world’s largest payment card processor, significantly larger than Mastercard, its closest competitor. It benefits from multiple long-term drivers such as increasing credit card penetration in emerging markets and e-commerce growth. The company also benefits from strong barriers to entry leading to high margins and free cash flow generation.
CVS Health 3.2
CVS Health is one of the largest drug retailers in the US with over 7,700 stores and a leading pharmacy benefit manager. The company is well positioned to benefit from growth in drug expenditure driven by the ageing population and the US move to a more consumer centric healthcare system. CVS Health should continue to return significant cash flow to shareholders through their rapidly growing dividend and share repurchases.
Pfizer 3.2
Pfizer is a global pharmaceuticals company that has done an excellent job of managing its business through a period of significant patent expiries while continuing to grow earnings per share. A highly cash generative business which returns significant amounts of cash to shareholders via a growing dividend and share repurchases. From 2016 sales growth should turn positive and earnings growth should accelerate as recently approved products begin to contribute meaningfully and we are past the majority of patent expiries.
Walt Disney 3.1
Disney is one of the most attractive media content and entertainment companies with winning cable channels such as ESPN, Disney Channel, ABC etc. Its creative content can be leveraged across all assets of the group; in its theme parks, Disney stores and cable networks. Disney has some of the best content and management in their sector and protects its franchise over the long term.
Prudential 2.9
Prudential has a solid business in the UK, a slowly growing business in the US, and is a good asset manager; the long term growth and focus for the company though is on Asia. The middle class population in emerging economies (principally Asia) is expected to nearly double from 2010 to 2020 - health and life insurance are high on the desire list of the newly affluent. This is a structural feature of Asian markets and should continue regardless of equity or currency volatility.
Google 2.6The global leader in two high growth areas; online search and advertising. Its position is supported by strong barriers to entry including complex algorithms and significant capital invested in data centres.
Accenture 2.5Accenture is one of the leading IT service and consulting firms. It benefits from organisations adapting their IT systems driven by increasingly demanding regulatory systems, M&A and the need to adapt and reduce costs.
Qualcomm 2.2Qualcomm is the largest owner of wireless patents for CDMA, WCDMA and LTE technologies and the dominant manufacturer of LTE modems. It benefits from growing smart phone penetration.
Express Scripts 2.2
Express Scripts is a pharmacy benefit manager that helps US employers and insurers manage their drug expenditure more cost effectively. A high return, very cash generative business that should continue to benefit from the growth in the ageing population who utilise more drugs. Free cash flow will continue to be used aggressively to repurchase shares absent any other, higher return, investment opportunities.
Amgen 2.1
Amgen is a global biotechnology company with a strong portfolio of mature biologic products. Although some of these will face competition in the second half of this decade the complexity of biologic drugs mean this will not be as severe as typically seen when a small molecule drug loses patent protection. Amgen should see good earnings and cash flow growth over the next few years but more importantly their late stage drug pipeline is coming to fruition and contains several potential blockbusters.

14 | Alliance Trust PLC Report & Accounts 2014
Portfolio Review
Allquotedequityholdingsasat31December2014Stock Country of listing Sector
% of quoted equities Value £m
Visa United States Information Technology 3.8 100.4
CVS Health United States Consumer Staples 3.2 86.0
Pfizer United States Health Care 3.2 84.7
Walt Disney United States Consumer Discretionary 3.1 84.0
Prudential United Kingdom Financials 2.9 76.6
Google United States Information Technology 2.6 69.0
Accenture United States Information Technology 2.5 68.0
Qualcomm United States Information Technology 2.2 59.4
Express Scripts United States Health Care 2.2 57.5
Amgen United States Health Care 2.1 57.1
Legal & General United Kingdom Financials 2.1 56.3
HSBC United Kingdom Financials 2.1 56.2
National Grid United Kingdom Utilities 2.1 55.8
Wells Fargo United States Financials 2.1 55.8
WPP United Kingdom Consumer Discretionary 2.1 55.6
Blackstone United States Financials 2.0 52.5
Swedbank Sweden Financials 1.9 50.4
Enterprise Products Partners United States Energy 1.8 48.7
Sanofi France Health Care 1.8 48.2
Danaher United States Industrials 1.6 43.9
Intesa Sanpaolo Italy Financials 1.6 43.7
Reckitt Benckiser United Kingdom Consumer Staples 1.5 40.6
SAP Germany Information Technology 1.5 39.2
Roche Switzerland Health Care 1.5 39.0
Friends Life United Kingdom Financials 1.4 37.8
Amerisourcebergen United States Health Care 1.4 36.2
Deutsche Post Germany Industrials 1.3 34.4
Toronto-Dominion Bank Canada Financials 1.3 33.8
Vodafone United Kingdom Telecommunication Services 1.3 33.4
Equinix United States Information Technology 1.2 32.4
GlaxoSmithKline United Kingdom Health Care 1.2 32.3
Continental Germany Consumer Discretionary 1.2 31.6
Delta Lloyd Netherlands Financials 1.2 30.8
Nasdaq United States Financials 1.1 30.2
Johnson Matthey United Kingdom Materials 1.1 30.1
Linear Technology United States Information Technology 1.1 29.3
Cadence Design Systems United States Information Technology 1.1 29.2
Henkel Germany Consumer Staples 1.1 28.9
Daikin Industries Japan Industrials 1.1 28.8
Praxair United States Materials 1.0 27.7
Diageo United Kingdom Consumer Staples 1.0 27.5
Unilever United Kingdom Consumer Staples 1.0 27.2
Novo-Nordisk Denmark Health Care 1.0 27.1
American Tower United States Financials 1.0 27.0
CSL Australia Health Care 1.0 27.0
Monsanto United States Materials 1.0 26.7
Roper Industries United States Industrials 1.0 26.7
Aberdeen Asset Management United Kingdom Financials 1.0 26.6
Intuitive Surgical United States Health Care 1.0 26.0
Schneider Electric France Industrials 1.0 25.7
Wisconsin Energy United States Utilities 1.0 25.7
BASF Germany Materials 1.0 25.7
Vtech Hong Kong Information Technology 1.0 25.5
Noble Energy United States Energy 0.9 25.3
Mitsui Fudosan Japan Financials 0.9 24.7
China Gas Hong Kong Utilities 0.9 24.6

Alliance Trust PLC Report & Accounts 2014 | 15
Cummins United States Industrials 0.9 23.9
Computershare Australia Information Technology 0.9 23.5
Grupo Financiero Banorte Mexico Financials 0.9 23.0
Humana United States Health Care 0.9 22.8
Total France Energy 0.8 22.5
Zurich Insurance Switzerland Financials 0.8 21.9
Spark New Zealand New Zealand Telecommunication Services 0.8 21.2
Eni Italy Energy 0.8 20.9
Schlumberger United States Energy 0.8 20.3
Perusahaan Gas Negara Indonesia Utilities 0.7 19.4
Melrose Industries United Kingdom Industrials 0.7 19.1
Bangkok Bank Thailand Financials 0.7 18.8
Charoen Pokphand Foods Thailand Consumer Staples 0.6 16.7
Cerner United States Health Care 0.6 15.9
Petrofac United Kingdom Energy 0.5 12.6
Ashmore Global Opportunities United Kingdom Financials 0.2 6.4
Komercni Banka Czech Republic Financials 0.2 5.9
Indivior United Kingdom Health Care 0.0 1.2
Rolls-Royce United Kingdom Industrials 0.0 0.1
100.0% Total value 2,670.6
Allquotedequityholdingsasat31December2014Stock Country of listing Sector
% of quoted equities Value £m
Fundsasat31December2014
Otherinvestmentsasat31December2014
Alliance Trust Investment FundsCountry of registration Value £m
Global Thematic Opportunities Fund United Kingdom 183.2
Monthly Income Bond Fund United Kingdom 122.9
Sustainable Future Pan-European Equity Fund Luxembourg 55.6
Dynamic Bond Fund United Kingdom 52.8
Sustainable Future Cautious Managed Fund United Kingdom 10.6
Sustainable Future Defensive Managed Fund United Kingdom 10.6
Total value 435.7
Investment Region Value £m
Private Equity United Kingdom / Europe 129.9
Alliance Trust Savings United Kingdom 31.6
Mineral Rights North America 29.9
Alliance Trust Investments United Kingdom 24.3
Property United Kingdom 12.5
Other United Kingdom 9.2
Total value 237.4
Totalinvestmentsasat31December2014Investment Value £m
Quoted equities 2,670.6
Funds 435.7
Other investments 237.4
Total value 3,343.7
Source: Alliance Trust
A full portfolio listing, similar to that displayed above, is available on a monthly basis on our website at http://investor.alliancetrust.co.uk/ati/investorrelations/list-of-stock-holdings.htm

16 | Alliance Trust PLC Report & Accounts 2014
Investment Process
While the Trust has always taken a long-term view of investing we have evolved and enhanced our investment process in the past year. We believe that companies which will be successful over the long term tend to have better quality management and this factor is often under-appreciated by the broader investment community. Over time, these positive characteristics become evident in the financial performance of these companies. By constructing portfolios of undervalued companies with strong business fundamentals and sustainable business models, we will
deliver strong investment returns.
Value driversSustainable development and responsible businesses practice are core to our process. Our process identifies companies with strong sustainability and ESG credentials and robust business fundamentals. It then integrates this assessment into in-depth analysis of valuations as part of the investment process. For each sector, the investment team identifies material environmental, social and governance (ESG) factors which affect financial prospects. Companies are assessed against sector-relevant factors. Longer term value drivers are identified through exposure to four key themes; Climate Change, Quality of Life, Sustainable Consumption and Resilience.
Investment themesThe investment team considers the extent to which potential
investments will benefit from exposure to four key investment
themes. The team expects that companies exposed to
these long-term persistent trends will enjoy superior growth
prospects. These themes provide support to the investment
case, but are not a prerequisite for an investment decision. The
Trust can, and will, also invest in companies where the team
consider that the strategy and quality of the management team
is not fully valued by the market, even though the stock is not a
beneficiary of one of these themes.
Investment selectionStocks need to meet all three elements of investment selection:
robust business fundamentals, attractive valuations and
sustainability to be considered for selection in the portfolio.
1.BusinessfundamentalsThe team assesses business fundamentals on the following metrics:
• Returns–ReturnonEquity(ROE)ishigherthantheirpeers,
driven by net income/sales or the asset turnover rather than
being driven by debt ratios.
• ReturnonCapital–Toexceedthecostofcapital.
• Resilience–CompaniesneedtobeabletosustaintheirROE.
Net debt must be stable and not excessive. Margins need to
be stable and predictable.
• QualityofEarnings–Freecashflowmustbesufficientto
drive growth forward and earnings and operational cash
flows should be highly correlated.
• Growth–Futuregrowthshouldcomefromgainsin
market share, or from new products or markets. The team
distinguishes between acquisition and organic-led growth.
Climate Change
QualityofLife
Sustainable Consumption
Resilience
Sectors: Transport, Energy, IT, Automotive, Construction
Sectors: Healthcare,FoodProducers, Education
Sectors: IT, Retail, Automotive, Finance,TestingCompanies
Sectors: Industrials, Utilities, Automotive, Transport, Chemicals
Every major economy has legislation in place to decarbonise and improve energy efficiency.
Lifestyle diseases account for more premature deaths than infectious diseases globally. Education drives economic success.
Population and affluence are increasing. To keep resource consumption and pollution levels stable, efficiency needs to improve rapidly.
Successful economies need to be robust and secure. Companies involved in protection, security and stability will flourish.
AttractiveValuation
SustainableCompanies
Robust BusinessFundamentals

Alliance Trust PLC Report & Accounts 2014 | 17
Expansion into new areas should not be at the expense of
overall returns.
• DividendIncome–Managementandshareholderinterests
should be aligned. There should be a stated and clear
progressive dividend policy, and the ability to generate free
cash flow.
Meetings with senior management and industry experts
form an important aspect of the assessment of the prospects
of the company.
2.IdentifyingsustainablecompaniesA Sustainability Matrix is used to identify companies aligned with
sustainable development. Companies are assessed and rated on:
i Product Sustainability – This assesses the extent to which
a company’s core business helps or harms society and/or
the environment. An A rating indicates a company whose
products or services contribute to sustainable development
(e.g. renewable energy). An E rating indicates a company
whose core business is in conflict with sustainable
development (e.g. tobacco).
ii Management Quality – This assesses whether a company
has appropriate structures, policies and practices in place for
managing its ESG risks and impacts. Management quality
in relation to the risks and opportunities represented by
potentially material ESG issues are graded from 1 (excellent)
to 5 (very poor).
3.ValuationanalysisEach stock is assessed relevant to its sector. Using a standard
template, consensus forecasts are flexed based to our own
research and assumptions, using independent research, company
meetings, site visits and sell-side analysis.
• Salesgrowth,EBITmarginsandfreecashflows,where
relevant, are forecast over one, two and three years.
• Sectorspecificratiosarecalculated,suchasPriceto
Earnings; Price to Free Cash Flows; Price to NAV.
• Theseratiosarecomparedtohistoricratiosforthecompany
and its industry sector; and to anticipated three year growth
in earnings or free cash flows.
• Oneyeartothreeyearpricetargetsarederived.An
integrated analysis is produced which provides consistency
and transparency and ensures that the Trust will only invest
in companies which have suitable ESG criteria, ethical
characteristics and are also undervalued by the market.
Portfolio constructionWhile we do not target a specific number of holdings, we
expect that the portfolio will contain between 60 and 80 equity
positions. We assume a holding period of at least three years for
any new positions. Risk and performance is measured against the
MSCI All Country World Index.
Stock selection and position sizes are based on three key
parameters:
1 Underlying volatility of the stock – stocks with higher
volatility will tend to have smaller active weights.
2 Strength of conviction – relative to the other stocks in the
portfolio.
3 The degree of diversification associated with the stock’s
position in the portfolio.
Risk managementDay-to-day responsibility for risk lies with the Portfolio Manager
and the Performance and Investment Risk team using industry
standard tools. The portfolio is also monitored by senior
management and Compliance, with the Performance and
Investment Risk team regularly meeting the portfolio manager
to ensure all risks in the portfolio are analysed, measured,
reported, and considered. Risk is measured on an absolute and
relative basis. A formal quarterly meeting is held between the
portfolio manager and the Performance and Investment Risk
team, where the portfolio is discussed in detail. The portfolio is
constructed with a view to managing the risk inherent in the
investments made. Assessment of management quality is a key
driver of this and our assessment includes our understanding of
their ability to take ESG factors into account. Good managers
will aim to minimise the long-term risks associated with their
business and manage it accordingly.
Sell disciplineThe investment team has a disciplined and systematic approach to
sales, based on one and three year price targets and will initiate a
sale when the price of a stock has attained its estimate of fair value
or when it loses its conviction in a particular stock due to a change
in the company’s product sustainability or business fundamentals.
31 2 4 5Product Rating
Best
Worst
Best Management Rating Worst
A Higher qualitymanagement,better growth
prospectsB
C
D
E

18 | Alliance Trust PLC Report & Accounts 2014
Business Drivers What we have done
Clients
Clients’ expectations of the industry and the products that they need are changing.
We have a range of equity and fixed income products to satisfy different needs and risk appetites. We manage a number of programmes targeting institutional and wholesale business including UK-wide roadshows and a website with educational content (www.investment-focus.co.uk).
Products
To be successful, managers must be able to innovate while still providing products that satisfy client needs.
During the year we created the UK’s first sustainable and responsible risk-profiled fund range. The risk profiling of funds means that financial advisers can more easily match the risk appetite of their client with the appropriate fund from the Sustainable Future range. The Sustainable Future Pan-European Equity Fund continues to be attractive to major European investors. We benefit from Alliance Trust Savings being a significant savings platform with knowledge of customer expectations.
People
There is always competition for the best people and ways must be found to attract and retain those with key skills.
We have a strong and experienced investment team who are committed and passionate about driving long term value for our clients.
Our reward structures encourage a high level of deferral into our own funds which ensures commitment and alignment with our clients and shareholders.
Technology
The pace of change is ever increasing and managers must be flexible and agile.
We continue to invest in market-leading investment management systems to ensure that we meet the needs of an ever-changing market.
Operating Platform
There is a need for a structure which is adaptable and scaled for growth.
We strengthened our investment middle and back office functions by outsourcing them to BNY Mellon delivering a single, scalable and cost effective solution.
Business Model
There will be continued downward pressure on fees.
We have recognised these changing market conditions and are operating with an average fee of 46 basis points.
The results
• Wehaveincreasedthirdpartyassetsundermanagementto£1.9bn.
• Wehavereducedourlossesby23%to£3.2m.
• Ourfundmanagerscontinuedtodeliverstronglong-terminvestmentreturns.
• Wehaveseengoodnetinflows,particularlyinourbondfunds.
• Wewonanawardforinnovationforourrisk-profiledfundrangefromInvestmentWeek.
AllianceTrustInvestmentsisaspecialistfundmanagementbusinessofferingopen-endedfundsandinvestment solutions.

Alliance Trust PLC Report & Accounts 2014 | 19
Financial performance
Net revenueAlliance Trust Investments’ 10% increase in net revenue was
mainly due to growth in assets under management including
£1.5m of income from Alliance Trust’s £436m seed capital
investment in Alliance Trust Investments funds. The average 46
basis points earned on third party assets increased slightly from
the prior year.
ExpensesExpenses reduced slightly from 2013. Alliance Trust
Investments’ share of the efficiency measures described on
page 25 amounts to £1m which will also benefit the results in
2015. The methodology used to charge shared service costs
between Alliance Trust Investments and Alliance Trust is also set
out on pages 25 and 26.
Net assetsNet assets at 31 December 2014 were £15.5m. During the year
Alliance Trust invested £2.2m in the business. The cumulative
capital investment in Alliance Trust Investments is £42.4m.
FairvalueGiven the achievement of net third party new business inflows
for the last three years, growth in the purchased SRI book of
business and the reduced losses of the business the Directors
considered it appropriate to change the methodology used
to value the investment in Alliance Trust Investments. This is
now valued as a third party asset management business rather
than a third party book of business. This means that we now
recognise value from future cash flows from new business in
our valuation methodology. The result is a 90% increase in fair
value to £24.3m.
Further detail is found in Note 23.8 on page 99.
Key Performance Indicators Yearto31December
Results2014
£m2013
£m
Net Revenue 10.1 9.2
Expenses (13.3) (13.4)
Loss before tax (3.2) (4.2)
2014
Operating loss
2013£3.2m
£4.2m
23%
Third party assets under management
20142013
£1.9bn
£1.8bn 6%
Fairvalue
20142013 90%
Third party net inflows
20142013
£88m
£74m
£24.3m
£12.8m
19%
Fundsabovemedianover3years
20142013
80%
89%
10%

20 | Alliance Trust PLC Report & Accounts 2014
The results
• Assetsunderadministrationrose19%to£6.4bnagainstmarketgrowthof13%.
• Wehavedeliveredanoperatingprofitof£0.2mbeforenon-recurringitems.
• Operatingprofitabilityintheyearislessthanhadbeenanticipateddueto: -competitoractivity;and -uncertaintiessurroundingScottishindependence.
• Customeraccountsfellby5%–howeverthechangeinourpricingmodelmakesusmoreattractivetothoseholdinginvestmentsover£50,000.
• WewonfourawardsincludingtheBestCustomerServiceawardfromSharesAwardsforthethirdconsecutiveyear.
Business Drivers What we have done
Clients
Clients are becoming more demanding of the service they expect from financial services providers.
Uncertainties surrounding the referendum on Scottish independence significantly impacted financial businesses in Scotland for both existing and potential clients.
We recognise that clients have individual needs. We reflect this in the products we offer, our competitive pricing model and in the different ways that we provide our service. The quality of our service is repeatedly recognised by customers.
We were prepared for the outcome of the referendum and continue to monitor the ongoing devolution debate.
Market
Commentators anticipate annual growth of over 20% until 2018. Changes announced in 2014 will markedly change the pension market. We expect the number of platforms in the UK to reduce significantly.
We will continue our marketing initiatives in both the direct and intermediary channels.
We believe that the market will move to fewer but larger platforms of which we are confident that Alliance Trust Savings will be one.
Products
To be successful, platforms must broaden investment choice and deliver added value. Innovation will be key.
Alliance Trust Savings is one of the top five direct platforms with a growing share of the intermediary market. It also provides a wide range of investment choice.
People
There is always competition for the best people and ways must be found to attract and retain those with key skills.
We have an experienced and stable team within our savings business. Their key focus is to deliver responsible and efficient service for our customers. We are proud of our customer service which has been recognised externally through industry awards.
Operating Platform
The pace of change is ever increasing with changing IT systems and applications being continually developed and adapted. There is a need for a structure which is adaptable and meets the requirements of an ever changing regulatory framework.
To improve our customer experience and to provide a system that is adaptable to change we are investing in new technology.
To simplify our business we had planned to relinquish our banking licence and move to the Client Money Regime adopted by most of our competitors. Following unforeseen regulatory change in 2014, we reconsidered that decision and decided to retain our banking licence. This resulted in an impairment charge in respect of the work undertaken in expectation of the change at a cost of £0.9m.
Business Model
There will be continued downward pressure on fees.
We strengthened our flat-fee structure with a more inclusive annual fee and guaranteed not to increase our charges until at least 2016.
Alliance Trust Savings is a savings platform business offering a range of investment and pension products.

Alliance Trust PLC Report & Accounts 2014 | 21
Financial performance
Net revenueNet revenue increased by 17%, reflecting the increase in our
annual fees at the start of 2014. Although we charge flat fees to
our customers, the basis point equivalent of our revenue, based
on our average assets under administration, was 21 basis points.
ExpensesExpenses increased 20% as we invested in our operations team
to deliver our Vision 2020 ambition. Alliance Trust Savings’
investment in new technology was £3.8m which was capitalised
as an intangible asset. In line with our accounting policy, the
asset will be depreciated over five years from the date the system
goes live for intermediaries, which is expected to be during
2015. Non-recurring Retail Distribution Review (RDR) marketing
expenditure, promoting the RDR readiness of our business,
largely ceased at the end of 2014, as planned, ahead of the
Financial Conduct Authority’s final phase of RDR which will be
fully in place by April 2016. The methodology used to charge
shared service costs between Alliance Trust Savings and Alliance
Trust is set out on pages 25 and 26.
Net assetsNet assets at 31 December 2014 were £21.9m. During the year
Alliance Trust invested £3.0m in the business. The cumulative
capital investment in Alliance Trust Savings is £55.8m.
FairvalueThe Directors have adopted the same policy as last year to value
the investment in Alliance Trust Savings. This results in an 18%
increase in fair value to £31.6m. Further detail is found in Note
23.8 on page 99.
Continuing operations2014
£m2013
£m
Net Revenue 12.8 10.9
Expenses (12.6) (10.5)
Operating profit* 0.2 0.4
Non-recurring RDR marketing and outsourcing expenditure (2.6) (2.0)
Impairment charge relating to retention of banking licence (0.9) -
Total loss before tax (3.3) (1.6)
* Excluding non-recurring RDR marketing expenditure, outsourcing expenditure and impairment charge relating to the decision to retain banking licence.
Assets under administration
20142013
£6.4bn
£5.4bn
Customer accounts
20142013
71,762
75,796
2014
Operating profit*
2013£0.2m
£0.4m
2014
Fairvalue
2013£31.6m
£26.7m
Number of trades
20142013
494,483
448,080
19%
10%
5%
46%
18%
* Excluding non-recurring RDR marketing expenditure, costs associated with outsourcing and impairment related to the decision to retain banking licence.
In addition, a provision of £0.4m has been made against the net gain of £6.7m on discontinued operations in 2013 relating to the former Full SIPP business.
Key Performance Indicators Yearto31December

22 | Alliance Trust PLC Report & Accounts 2014
Private equityWe have significant interests in seven externally managed
limited partnerships, largely mid market European buyout
funds. These limited partnerships invested in a total of 66
underlying investments at the end of 2014. We hold these
investments through two fund of fund limited partnerships.
We also have a number of small legacy direct investments in
companies and other limited partnerships. The oversight of
the private equity portfolio investments is undertaken by an in-
house manager with the day to day management of the legacy
direct investments and other limited partnerships undertaken
by an outsourced manager. The total committed to these assets
is £117m. The outstanding commitments of these investments
total £18.4m.
We decided to scale back our private equity business in 2011
and since then have been managing the portfolio in run off.
We do not intend to return to making large new private equity
commitments. However, we may from time to time consider
opportunistic non-listed investments which we believe will
deliver enhanced value for our shareholders over the long term
where we are unable to access such opportunities in the listed
equities arena. The investment must also meet our sustainable
investment criteria. During 2014 we made a $30 million
commitment to LeapFrog Financial Inclusion Fund II, of which
£5.8m was drawn during the year. The fund invests in the high
growth area of financial services in certain Asian and African
countries, with a particular focus on the insurance sector.
Our approach to valuing the private equity portfolio is consistent
with prior years and is in accordance with the private equity
industry’s valuation approach based on international private
equity valuation guidelines. As the commitments were made in
2008 and 2009 to our two fund of fund limited partnerships,
significant capital distributions are only now starting to be
received, with £22.7m distributed in 2014 (2013 £5.6m). The
Directors believe the fair value of our total fund of funds limited
partnership investments to be £108m at the year end, which
equates to a 1.3 times multiple of our original investment (2013:
1.1 times multiple). There have been six full exits of companies
held within these investments in 2014. These have delivered
an average gross multiple of 3.0 times our original investment
compared with one exit in 2013 at a multiple of 2.9 times. We
believe there is significant potential value in the fund of funds
limited partnership portfolio to be delivered as it matures.
PropertyAs reported last year, we disposed of 107 George Street, Edinburgh which was occupied by part of the team from Alliance Trust Investments. This necessitated a move to new offices and a decision was taken to lease, rather than to purchase, alternative premises, thereby reducing our exposure to movements in the commercial property market. We moved to our new office in November 2014. The one remaining direct property investment, Monteith House in Glasgow, saw a modest increase in value to £4.8m from £4.5m last year.
Our investment in the Impax Climate Property Fund Limited Partnership, which we have held since 2008, had a value at the end of the year of £7.3m after receiving distributions of £5.2m during the year. We also have an investment valued at £0.5m in
the CCC Seed Capital Limited Partnership.
Mineral rightsOur legacy mineral rights portfolio continues to deliver strong results, more than doubling in value in 2014, following a 48% increase in 2013. The portfolio consists of over 950 property interests mainly in Oklahoma and Texas but also in Idaho, Arkansas, Louisiana, Manitoba and Saskatchewan. We receive royalty income from the oil and natural gas that is extracted from these properties as well as lease bonuses. These legacy investments stem from the period when Alliance Trust’s principal activity was that of a mortgage bank focused on lending in North America.
We value these assets at fair value, in line with industry standard methodology, by applying externally derived multiples to the revenue received. We actively manage these assets with assistance from local US managers. This has resulted in a number of new leases being signed during 2014, in particular in Oklahoma, thereby increasing the valuation. The valuation has also benefited from the appreciation in the US dollar during the year.
Our 2014 income was not impacted by the more than 50% decline in the oil price during the second half of the year as our income is contracted well in advance. We would, however, expect this drop in oil price to potentially depress our mineral
rights income, and therefore valuation, in 2015.
Other Investments
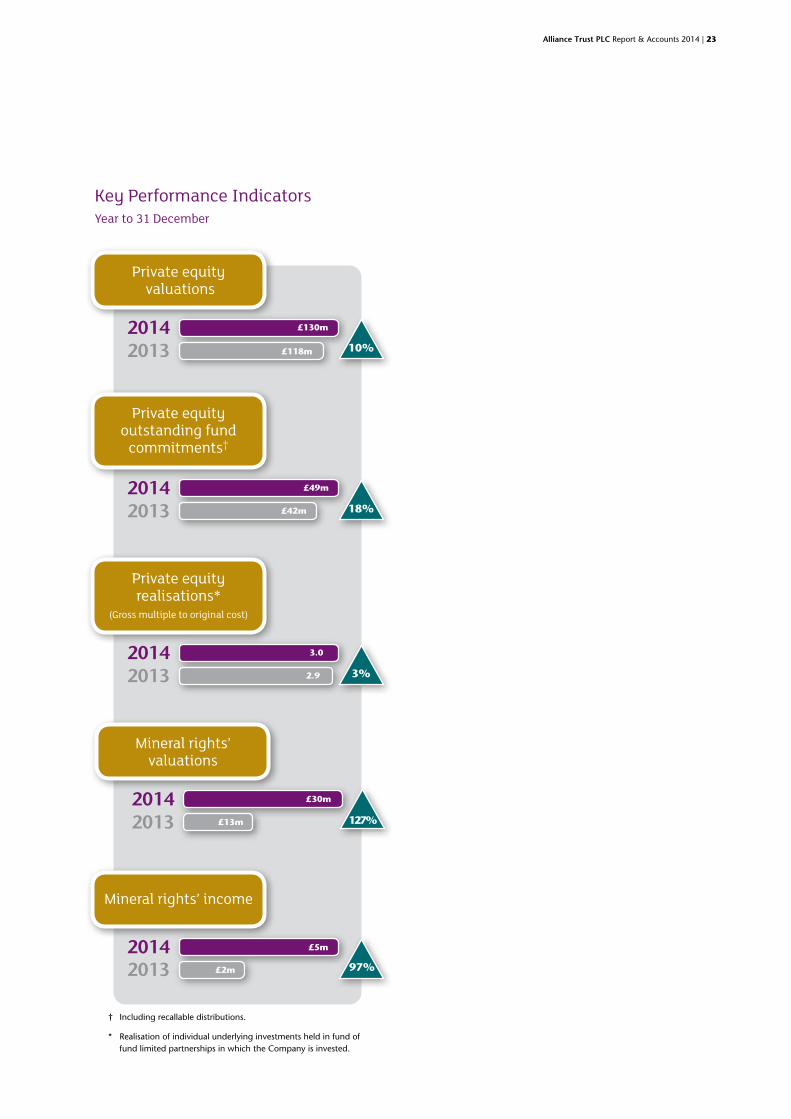
Alliance Trust PLC Report & Accounts 2014 | 23
Key Performance Indicators Yearto31December
Privateequity valuations
Privateequityoutstanding fund
commitments†
Mineral rights’ income
20142013
£5m
£2m
20142013 £42m
£49m
20142013 £118m
£130m
10%
18%
97%
Mineral rights’ valuations
£30m
£13m 127%
Privateequityrealisations*
(Gross multiple to original cost)
20142013 2.9
3.0
3%
† Including recallable distributions.
* Realisation of individual underlying investments held in fund of fund limited partnerships in which the Company is invested.
20142013

24 | Alliance Trust PLC Report & Accounts 2014
We made good progress during 2014 to deliver the financial and risk and control
framework necessary to drive our 2020 Vision.
We understand the importance of the dividend to shareholders at this time. Our
total dividend yield of 2.6% at the year end, makes us one of the highest yielding
companies in our peer group. The chart below shows how the growth in the
dividend has comfortably outstripped inflation over the last 48 years. In the last
five years, when interest rates have been running at 0.5%, our total dividend has
grown by an average of 8.7% per year.
We significantly reduced our costs whilst continuing to ensure we meet our current
and future regulatory responsibilities. Outsourcing of our middle and back office
investment process delivered a single, scalable and cost effective solution. It also ensured
that these services will develop in line with industry best practice.
We also took advantage of the current low interest rate environment by issuing £100m of unsecured fixed-rate long-term debt at
attractive rates, with our private placement debt issuance being three times oversubscribed.
We strive to continue to deliver clear and concise reporting. We have therefore reduced the length of our Annual Report this year.
By seeking to implement integrated reporting in future years we hope that our reporting will continue to benefit all
our stakeholders.
Alan Trotter
Chief Financial Officer
48 year dividend per share growth record
Ordinary Dividend (right hand side)
Dividend per share (pence)%
Special Dividend (right hand side)Ordinary DPS growth (left hand side) RPI increase (left hand side)
0
2
4
6
8
10
12
14
0
500
1,000
1,500
2,000
2,500
3,000
14†1211*090705030199979593918987858381797775737169
The growth in the ordinary dividend and RPI is rebased to 100 at 31 January 1968.
* To 31 January 1968-2011 † To 31 December 2011-2014 Source: Alliance Trust

Alliance Trust PLC Report & Accounts 2014 | 25
What dividend have we declared for 2014 and what guidance are we giving for 2015?The Company has distributed the net income earned from its
investment portfolio as dividends to shareholders, with the
excess above our minimum dividend guidance treated as a
special dividend, in line with our dividend policy. In 2014 this
has resulted in a 3% increase in the ordinary dividend and a
total dividend increase of 14.3%. Our fourth interim dividend of
2.4585p per share will be paid on 31 March 2015 with a special
dividend of 2.546p payable on 30 June 2015.
Included in the special dividend this year is £8m received from
Alliance Trust Finance. This subsidiary is no longer required and
we have started the process of winding it up. In line with our
dividend policy, its distributable reserves of £8m have been paid
to the Company. There are a further £8m of reserves which,
as part of the winding up process, will become distributable to
shareholders in due course.
In the absence of any unforeseen developments for 2015 we
expect to be able to recommend a 3% increase on the 2014
ordinary dividend to a total of 10.13p, payable quarterly.
Why have we changed the way we report our Group results?An amendment to accounting standard, IFRS 10 “Consolidated
Financial Statements”, became effective from 1 January 2014.
The Company is now categorised as an ‘investment entity’ and
is therefore required to value any investment in a subsidiary at
its fair value through the income statement in accordance with
IAS 39 Financial Instruments, unless the subsidiary provides
services that relate directly to the Company’s investment
activities. We reviewed all of the activities of our subsidiaries
and, other than Alliance Trust Services, which continues to be
consolidated in the accounts, all of the Company’s subsidiaries
are now valued at fair value through the income statement. The
Group Financial Statements on pages 68 to 104 therefore now
comprise the results of the Company and Alliance Trust Services
only, with prior year comparatives restated.
How do we calculate the Ongoing Charges Ratio (OCR)?The OCR is calculated as the recurring expenses of running
the Trust, divided by our average net assets over the year. We
have complied with the guidance issued by the Association
of Investment Companies and have excluded the expenses
incurred by the Company’s subsidiaries, as these do not relate
to running the investment company. In accordance with
the guidance, we have included in the OCR the appropriate
proportion of the ongoing charges of any underlying funds
which represent substantial investments, defined as more
than 5% of our portfolio. Our investment in Alliance Trust
Investments Global Thematic Opportunities Fund constitutes a
substantial investment.
What is integrated reporting?Integrated reporting is a way of showing how an organisation’s
strategy, governance, performance and prospects, in the
context of its external environment, lead to the creation of
value in the short, medium and long term. Companies that
have adopted integrated reporting embed non-financial
performance measures within their annual report, alongside
the more common financial performance measures, to show
how these add value for shareholders.
Each company is different, and should focus on those non-
financial matters which are material to its own business. We
have made our first steps towards integrated reporting within
this annual report, setting out how our investment process
assesses the sustainability of the companies in which we invest
and providing information on the measures which underpin
our Investing for Generations strategy. We will continue to
develop this in future years’ reports.
What are we doing to keep control of our expenses?This year we took a number of decisions which significantly
reduced our cost base, whilst continuing to ensure we deliver
on our 2020 Vision and meet our current and future regulatory
responsibilities. In September 2014 we announced £2m of
cost savings as a result of the reorganisation of the equity team
and associated support functions such as our former in-house
economic research team. We have also implemented further cost
savings from which we expect to save a further £1m per year.
We expect that the Company’s share of these combined savings
will amount to £2m, or 9% of 2013 expenses, of which £0.7m
has been achieved this year. The Company’s costs reduced by
3% as a result in 2014 to £20.8m. Our OCR reduced to 0.60%
in 2014 from 0.75%. We will continue to apply strict cost
controls across the business.
How do we recharge internal costs to our subsidiaries?Alliance Trust Investments earns fees on the capital invested by
the Trust in the funds it manages. The fees reflect market rates
payable to a seed capital investor. The Trust includes such fees in
its administration expenses. The Fixed Income team are charged
100% to Alliance Trust Investments. Prior to the restructure of

26 | Alliance Trust PLC Report & Accounts 2014
the SRI and Global Equity teams into a unified Equities team
in September 2014, the Global Equity team also managed the
equity portfolio of the Trust. The cost of the Global Equity team
was split between Alliance Trust Investments and the Trust
according to the average assets under administration during the
period. Following the reorganisation, the costs of the Equities
team were recharged between Alliance Trust Investments and the
Trust according to the same methodology. Both Alliance Trust
Investments and Alliance Trust Savings are also allocated a share
of indirect expenses according either to the subsidiaries’ service
usage or according to average headcount, as appropriate.
What is the cost of our buyback programme?In 2014 we repurchased 1.2% of our shares compared with
0.3% in 2013. Since the introduction of our flexible buyback
policy in 2011 the Company has bought back and cancelled
16.3% of its shares at a cost of £392m. This has contributed
to a reduction in volatility of the discount during a period
of turbulent market conditions and to a narrowing of the
discount from 17.1% to 12.4% since 2011. The Board remains
committed to the ongoing flexible use of buybacks, taking into
account the Company’s discount relative to the peer group.
Whilst we bought back 10% of our shares in 2011 during the
first year of our flexible buyback policy we stated at that time
we would not expect to maintain this level of buyback activity
in normal market conditions.
Whyhavewetakenoutlong-termdebt?In late July 2014 we issued £100m fixed rate 15 year unsecured
debt at 4.28% as we believe that this pricing is attractive and
is expected to enhance shareholder returns over the life of
the facility in line with the Company’s investment objective.
The average cost of borrowing for the Trust remains a very
competitive 2.2% at the year end.

Alliance Trust PLC Report & Accounts 2014 | 27
Risk
RiskManagementFrameworkThe Group has a Risk Management Framework that provides a
robust and comprehensive approach for the identification and
management of key risks facing the business.
The Framework helps in the assessment and management
of current and future risks. Principal Risk categories include
Strategic, Market, Operational and Regulatory & Conduct Risk.
The Risk Management Framework supports the ICAAP (Internal
Capital Adequacy Assessment Process) process, assisting in
determining the capital requirements of the Group.
Risk AppetiteRisk appetite statements have been approved by the Board and
provide the basis for the level of risk the Group is prepared to
accept. A suite of risk appetite metrics have been agreed and
activity is monitored against stated triggers and limits.
Risk Governance CommitteesThe Board Risk Committee comprises Non-Executive Directors,
with delegated responsibility from the Board to provide
oversight and challenge to the appropriateness of the risk
management framework and the forward looking risks facing
the Group.
The Risk Management Committee, chaired by the Chief
Financial Officer and comprising members of the senior
management of the Group, ensures that the key risks are
identified, monitored, assessed and controlled.
The Committees receive reports of Risk Exposures and Events, as
well as discussing any breaches of the agreed risk appetite.
Risk and Control Self Assessment (RCSA) The RCSA is the methodology that allows our business areas
to identify and assess risks, and define and perform quarterly
testing of controls. Individual risk and control owners are
assigned with explicit responsibility for the ongoing monitoring
and management of risks. This is reinforced through minimum
standards communicated via the Group Policy Framework.
Quarterly risk outlook workshops are undertaken to consider
and assess potential changes to the risk profile of the Group.
The risk function undertakes a review and challenge of the RCSA
and underlying evidence.
EffectivenessoftheRiskFunctionThe Risk and Compliance function is subject to regular review,
both in terms of resource and the appropriateness of the
skills that reside within the team. In addition, the Board Risk
Committee and Risk Management Committee are subject to
effectiveness reviews with improvements being identified and
implemented where required.
Riskuniverse
Riskappetite
Policies
Capital
Risk Management information
RiskManagement organisation
Embeddedrisk practices
Riskculture Compliance
RiskManagement
methodologies
Governance
Assess
Repo
rt
Mitig
ateMonitor
Identify
Risk Process

28 | Alliance Trust PLC Report & Accounts 2014
In common with other financial services organisations, our business model results in a number of inherent risks which are
continuously monitored and managed. The risks have been categorised as Strategic, Market, Operational and Regulatory &
Conduct Risks. The principal risks and their mitigants are noted below.
Principal Risks
Strategic Risks
RisksBuilding investment credibility is dependent on the performance of the portfolio. The ability to pay a steadily increasing dividend depends upon portfolio structure and income generation. The Trust may borrow for investment purposes and borrowing facilities may not be renewed. A lack of understanding of the Trust and its objectives could lead to a lack of demand and a widening of the discount to Net Asset Value. Political and economic uncertainty generates risk to achieving strategic objectives.
MitigantsWe regularly report and monitor the performance of the Trust and the income derived from investments. Borrowing levels and facilities require the prior approval of the Board. The Trust’s investment strategy has been widely communicated and meetings are also held with key institutional shareholders. We assess the implications of political and economic uncertainty and establish internal working groups to monitor potential risks as required.
Market Risks
RisksThe Trust currently invests primarily in equities and fixed income securities and its principal risks are therefore market related and include counterparty and market risk (currency, interest rate and other price risk). An explanation of these risks is included in Note 23 on pages 93 to 97. Over The Counter (OTC) derivatives are used in the fixed income funds managed by Alliance Trust Investments both for efficient portfolio management and for investment purposes. If investments fall in value, any borrowings will magnify the extent of this loss.
MitigantsThe Asset Allocation Committee meets at least quarterly to oversee the allocation of capital between and among the asset classes approved by the Board. Exposure to market risk is assessed through stress and scenario testing of the Group’s portfolios. Compliance with investment risk parameters and policies is also monitored and regularly reported. Counterparty/concentration limits are in place for all financial instruments including bank deposits and debt levels are regularly monitored and reported. The majority of the Trust’s investments are in quoted equities that are readily realisable.
Operational Risks
RisksFinancial services organisations are exposed to operational risk, as a consequence of operating in a complex financial environment. Key operational risks include the availability and reliability of our core systems, reliance on third party suppliers to deliver against service levels, processing failures, IT security issues (including cyber risk) and operational errors. These include dealing errors, administration breaches, loss of key personnel and failure to manage and deliver change initiatives.
MitigantsPolicies have been implemented to set direction on the management of all operational risks. Business Continuity plans are maintained and tested annually. Our supplier management framework controls risks from significant third party service providers. The Group operates an anti-financial crime policy and controls to minimise exposure to fraud, money laundering and market abuse. Our segregation of duties and oversight of controls mitigate against the risk of conflict of interest and process failures.
We manage projects rigorously under our Change Management Framework and robust IT security controls are in place.
The Group recognises the increasing risk of cyber attack against its services and data. Our systems and controls are rigorously assessed on an ongoing basis to ensure they remain appropriate to mitigate against the changing risks faced and include deployment of industry standard tools and processes.
Training modules have been developed and risk objectives embedded to ensure delivery of appropriate corporate culture behaviours.

Alliance Trust PLC Report & Accounts 2014 | 29
Regulatory and Conduct Risks
RisksThe Financial Services sector continues to experience significant regulatory change at national and international level.
During the year, Alliance Trust PLC has been approved by the FCA as a manager under the Alternative Investment Fund Manager Directive. The profile of conduct risk is ever increasing including the continued strengthening and evolution of the regulatory framework. Key aspects of conduct risks include the appropriateness of products and services, marketing campaigns and financial promotions, product design and development, complaint resolution, management of conflicts, and corporate culture.
MitigantsThe Group maintains a forward radar of forthcoming regulatory changes. We have a Change Management Framework to help deliver regulatory change. We have system based controls and monitoring systems to ensure compliance with relevant regulations.
Our responsibilities under AIFMD include the appointment of a Depositary who undertake verification activities and we monitor leverage against limits and gearing parameters which are agreed by the Board.
Customer outcome management information is reviewed at Board and Committee level, with actions taken to ensure the customer is at the heart of our business and includes an assessment of future business initiatives and risk outlook.
The Group operates a three tier line of defence. The key attributes of each line of defence are shown below.
1st line of defence
2nd line of defence
3rdline of defence
Business management are responsible for the identification and assessment of risks, understanding the risk return strategy and operating appropriate controls.
The Risk Management Committee, together with the risk function, provides challenge on the completeness and accuracy of risk assessments, risk reporting and the adequacy of mitigation plans.
Internal Audit and the Board Risk and Audit Committees provide independent and objective assurance on the robustness of the Risk Management Framework and the appropriateness and effectiveness of internal controls.
Keyattributes
• Promoteastrongriskcultureandsustainable risk-return thinking.
• Promoteastrongcultureofadhering to limits and managing risk exposures in accordance with the approved risk appetite and the associated policy requirements.
• Ownership,responsibilityandaccountability for identifying the risks arising from business activities.
• Ongoingmonitoringofinherentand identified risks.
• Governanceprocessincludescommittees who will review and monitor risks efficiently and effectively.
Keyattributes
• Overarchingriskoversightacrossall risk types.
• Understandaggregatedriskpositions and support in developing and advising on risk strategies.
• Objectiveoversightand challenge to the business areas and internal control framework used in the first line.
• TheRiskManagement Committee is supported by the monitoring, advisory and challenging activities of the Risk and Compliance function.
Keyattributes
• Independentassuranceontherobustness and application of the risk framework.
• Assesstheappropriatenessandeffectiveness of internal controls.
• TheBoardRiskCommitteeischaired and attended by Non-Executive Directors, providing independent oversight of the key activities of the business.
• TheInternalAuditfunctionprovides assurance to the Audit Committee.
• TheAuditCommitteereporttothe Board on effectiveness of internal control framework.

30 | Alliance Trust PLC Report & Accounts 2014
Alternative InvestmentFundManagers Directive (AIFMD)
Alliance Trust PLC obtained approval from the FCA as a Manager under the AIFMD on 18 July 2014. Although many of the requirements under the Directive were already covered by existing legislation or regulation and were reflected in the Trust’s established governance framework, our procedures, policies and practices have been updated to ensure full compliance with all AIFMD requirements. As part of the AIFMD authorisation, the Trust has appointed a Depositary whose responsibilities include verification of the investment portfolio assets and provide oversight of transactions, cash movements and valuation processes.
StrategicPriority:Platform
Scottish independence
A project was established to manage the potential impact on the Group of the outcome of the referendum on Scottish independence. This included participation in industry working groups and by direct interaction with UK and Scottish government representatives. This allowed us to develop mitigation plans to respond to the outcome of the referendum in order to provide continuity of service and to ensure that customer investments and savings were protected.
StrategicPriority:Purpose
LaunchofRiskProfiledFunds
Two new funds were created in Alliance Trust Investments. The funds have provided investors with a suite of five Risk Profiled Sustainable Investment Funds. The launch of the new funds followed a detailed and thorough new product implementation process which addressed the requirements of all business areas impacted.
StrategicPriority:Purpose
Regulatory developments
A number of regulatory initiatives were considered and/or implemented during the year. In addition to the approval of Alliance Trust PLC as an internally managed Alternative Investment Fund under AIFMD, other initiatives included compliance with regulatory changes such as European Market Infrastructure Regulations (EMIR), Capital Requirements Directive IV (CRDIV), the Client Asset Source Book (CASS) and Foreign Account Tax Compliance Act (FATCA). The Group also consider the implications of all future regulatory changes including Markets in Financial Instruments Directive (II) (MIFID II) and Undertakings for the Collective Investment in Transferable Securities V (UCITS V).
StrategicPriority:Platform
Outsourcing
During the year we successfully completed the outsourcing of our Fund Accounting and Middle Office functions to Bank of New York Mellon (BNYM) for our investment business. The outsourcing project was undertaken through our Change Management Framework, with appropriately skilled staff in place to oversee the service provided by BNYM.
StrategicPriority:Platform
The following are key initiatives and events which have influenced the risk profile of the Group during the year.
Changes to Risk Profile
Purpose:Creating wealth and security for our investors
Performance:Delivering strong and sustainable investment performance
People:Making Alliance Trust an employer of choice
Profile:Raising awareness of Alliance Trust among our target market
Platform:Building a robust operating and control framework to support growth
Platform Purpose
People
Profile Performance
Our Strategic Priorities

Alliance Trust PLC Report & Accounts 2014 | 31
Investing for Generations
“Investing for Generations” is our strategy for achieving our 2020 Vision. We are committed to growing our business in a way that
is responsible and ensures a sustainable future for our shareholders, customers and communities.
Investing responsibly and proactively managing our material environmental, social and governance risks and opportunities will
create lasting value for all our stakeholders. During 2014 we undertook a materiality assessment to update our understanding of
the issues that are most important to drive business performance and are of greatest interest to our stakeholders. As a result of
this process, we have identified five focus areas for our strategy; Responsible Investment, Customers, People, Community and the
Environment. We have set goals in each area and are in the process of developing a set of key non-financial performance indicators
against which we will report our progress annually within this report and on our website. We plan to report our baseline and first
complete year of data in next year’s report.
Our five key pillars Our priorities How we performed in 2014
Responsible Investment To grow the business by investing in a responsible manner
• Embedresponsibleinvestmentprocessesacrossthebusiness. This includes setting clear objectives to measure and reward responsible investment and integrating material ESG factors into our investment process.
• Collaborateandengagewiththecompaniesinwhich we invest.
• Promotemoreresponsibleinvestmentintheindustrybyengaging with industry bodies and communicating how it enhances value.
Company meetings at which we voted 94%
Customers To become the UK’s most trusted investment and savings business
• Promotestraightforwardandopencommunications.
• Deliversolutionstomeetourcustomers’needs.
• Measurecustomerperceptionandfeedback,usingresultsto drive on-going improvement.
• Provideresources,toolsandinformationtoimprovefinancial education of customers.
Our campaigns resulted in an average increase in brand awareness of 18%
People To empower our people to drive our 2020 strategy and the success of our business
• Promotesharedpurposeandcommonvaluestocreateapositive environment for success.
• Promoteinclusion,empowermentandastrongemployeevoice to help drive engagement.
• Linkour2020Visiontodevelopingandempoweringstrong leaders.
• Establishinnovationgroupstogeneratenewideasandsolve problems.
Engagement increased to 88% from 79% last year
Our values index increased to 77% from 72% last year
Community To be recognised as a force for good in our communities
• Shareourskillsandexpertisewithourlocalcommunities.
• Alignourvalueswiththoseofouremployees.
• Createactiveopportunitiesforouremployeestovolunteer.
• DonatetocharitablecausesthroughourStaffFoundationand support our employees in their fundraising efforts.
Funds raised and donated to charities over £52,000
Environment To demonstrate our commitment to combat the global challenge of climate change and protect the environment
• Shapetheexternaldebateonkeyenvironmentalissues.
• Setlongtermtargetstoreduceourownenvironmentalfootprint.
• Engageandcollaboratewithothersincludingouremployees and suppliers.
• Influencethecompaniesweinvestinandother investment agents.
We know the carbon footprint of the investments held in one third of our Sustainable Future equity funds.
CO2 emissions down 4%

32 | Alliance Trust PLC Report & Accounts 2014
Governance The Investing for Generations Forum is responsible for
overseeing and integrating sustainability within the business.
It is chaired by a member of the Executive Committee. During
2014 it met 20 times to set objectives and review progress,
key performance data and the implementation of standards.
Engaging with stakeholdersWe recognise that listening to our stakeholders and responding
to their relevant concerns is important to our long-term success.
We seek the views of stakeholders through processes such as
investor meetings and roadshows, customer surveys, employee
surveys and participation in industry forums. We also actively
engage with the management of companies that we invest in
on material environmental, social and governance (ESG) factors.
Ethical standardsAlliance Trust is committed to maintaining the highest ethical,
professional and legal standards. We have a comprehensive
set of policies which set out our approach to issues such
as whistleblowing, anti-bribery and health and safety. In
accordance with the Financial Reporting Council’s UK
Stewardship Code, we have published the Alliance Trust
Stewardship Policy Statement. This sets out how we discharge
our stewardship responsibilities as an integral part of our
investment philosophy. Our Stewardship Group, chaired
by the Chief Executive Officer, is responsible for overseeing
the implementation of the Code and reports directly to the
Executive Committee and Board.
Responsible investmentInvestors are much more aware of both how the returns they
receive are generated and of the long-term sustainability of the
business models upon which they rely.
In response to investor demand we launched two new funds to
our range; the Sustainable Future Cautious Managed Fund, and
the Sustainable Future Defensive Managed Fund.
During 2014 we made significant progress in integrating
responsible investment processes across our business. We
created a single equity investment team to manage both the
Alliance Trust equity portfolio and the Sustainable Future Funds.
We enhanced our investment process, that already analysed
business fundamentals and relevant ESG factors in assessing the
financial prospects of companies, to provide more focus on the
sustainability of that investment, further details are on pages 16
and 17. We have also continued to pursue an active voting policy.
In most cases we support management but we will engage
with them and ultimately vote against their recommendations
where we believe that their proposals are not in shareholders’
interests. In 2014 we voted at 98 company meetings, 94% of
meetings at which we were eligible to vote. For 36 of these
meetings (34%) we voted against, withheld or abstained on
one or more resolutions. These votes related to concerns about
matters including: board and committee independence and
effectiveness; non-pre-emptive securities issues; excessive or
opaque remuneration arrangements; and lack of transparency
about lobbying activities and fair business policies.
One of our priorities is to engage with the companies in which we
invest and the industry more broadly on responsible investment
issues. In 2014, our investment team, in collaboration with
others, undertook extensive engagement with clothing retailers
sourcing from Bangladesh, to promote human rights and more
sustainable business models. We also engaged with the banking
and pharmaceutical industries on sustainability issues. At the end
of 2014 we conducted a series of roadshows across the UK to
promote and seek views on responsible investment.
We are a signatory to the UN Principles for Responsible
Investment and one of our investment managers is Chair of
the PRI’s ESG Integration working group. We are also members
of the World Business Council for Sustainable Development.
Looking ahead, we are working to understand better the
Investing for Generations
Socialimpact:Creating a sustainable future
Independenceofthought:Challenging the norm
ConvictiontoInnovate:Improving the way we do business
RelationshipFocused:Building long-term alliances
ChampioningClarity:Being clear in our messages
Platform Purpose
People
Profile Performance
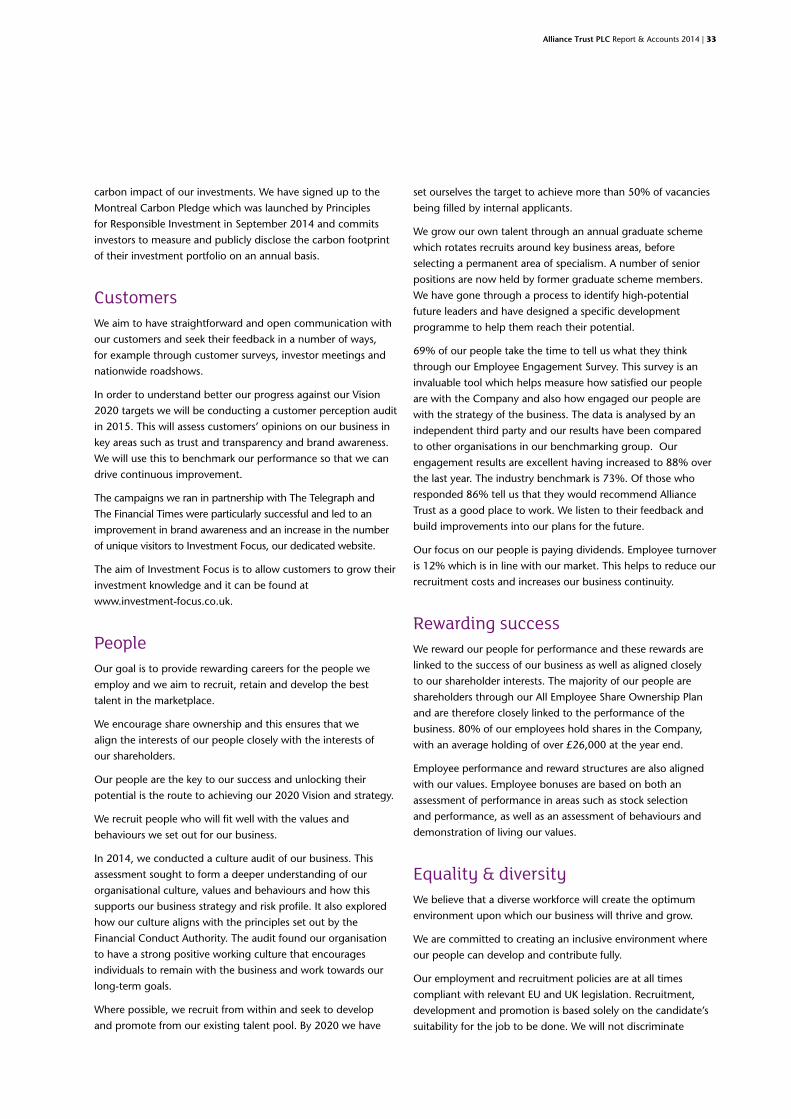
Alliance Trust PLC Report & Accounts 2014 | 33
carbon impact of our investments. We have signed up to the
Montreal Carbon Pledge which was launched by Principles
for Responsible Investment in September 2014 and commits
investors to measure and publicly disclose the carbon footprint
of their investment portfolio on an annual basis.
CustomersWe aim to have straightforward and open communication with
our customers and seek their feedback in a number of ways,
for example through customer surveys, investor meetings and
nationwide roadshows.
In order to understand better our progress against our Vision
2020 targets we will be conducting a customer perception audit
in 2015. This will assess customers’ opinions on our business in
key areas such as trust and transparency and brand awareness.
We will use this to benchmark our performance so that we can
drive continuous improvement.
The campaigns we ran in partnership with The Telegraph and
The Financial Times were particularly successful and led to an
improvement in brand awareness and an increase in the number
of unique visitors to Investment Focus, our dedicated website.
The aim of Investment Focus is to allow customers to grow their
investment knowledge and it can be found at
www.investment-focus.co.uk.
PeopleOur goal is to provide rewarding careers for the people we
employ and we aim to recruit, retain and develop the best
talent in the marketplace.
We encourage share ownership and this ensures that we
align the interests of our people closely with the interests of
our shareholders.
Our people are the key to our success and unlocking their
potential is the route to achieving our 2020 Vision and strategy.
We recruit people who will fit well with the values and
behaviours we set out for our business.
In 2014, we conducted a culture audit of our business. This
assessment sought to form a deeper understanding of our
organisational culture, values and behaviours and how this
supports our business strategy and risk profile. It also explored
how our culture aligns with the principles set out by the
Financial Conduct Authority. The audit found our organisation
to have a strong positive working culture that encourages
individuals to remain with the business and work towards our
long-term goals.
Where possible, we recruit from within and seek to develop
and promote from our existing talent pool. By 2020 we have
set ourselves the target to achieve more than 50% of vacancies
being filled by internal applicants.
We grow our own talent through an annual graduate scheme
which rotates recruits around key business areas, before
selecting a permanent area of specialism. A number of senior
positions are now held by former graduate scheme members.
We have gone through a process to identify high-potential
future leaders and have designed a specific development
programme to help them reach their potential.
69% of our people take the time to tell us what they think
through our Employee Engagement Survey. This survey is an
invaluable tool which helps measure how satisfied our people
are with the Company and also how engaged our people are
with the strategy of the business. The data is analysed by an
independent third party and our results have been compared
to other organisations in our benchmarking group. Our
engagement results are excellent having increased to 88% over
the last year. The industry benchmark is 73%. Of those who
responded 86% tell us that they would recommend Alliance
Trust as a good place to work. We listen to their feedback and
build improvements into our plans for the future.
Our focus on our people is paying dividends. Employee turnover
is 12% which is in line with our market. This helps to reduce our
recruitment costs and increases our business continuity.
Rewarding successWe reward our people for performance and these rewards are
linked to the success of our business as well as aligned closely
to our shareholder interests. The majority of our people are
shareholders through our All Employee Share Ownership Plan
and are therefore closely linked to the performance of the
business. 80% of our employees hold shares in the Company,
with an average holding of over £26,000 at the year end.
Employee performance and reward structures are also aligned
with our values. Employee bonuses are based on both an
assessment of performance in areas such as stock selection
and performance, as well as an assessment of behaviours and
demonstration of living our values.
Equality&diversityWe believe that a diverse workforce will create the optimum
environment upon which our business will thrive and grow.
We are committed to creating an inclusive environment where
our people can develop and contribute fully.
Our employment and recruitment policies are at all times
compliant with relevant EU and UK legislation. Recruitment,
development and promotion is based solely on the candidate’s
suitability for the job to be done. We will not discriminate

34 | Alliance Trust PLC Report & Accounts 2014
either before, or during, employment on the basis of gender,
sexual orientation, age, race, nationality, disability or political
or religious belief. Should one of our people become disabled
we will ensure that they do not suffer any discrimination and
we will make reasonable adjustments to allow them to continue
to have the same opportunities as any other member of our
workforce.
The table below provides the gender split at different levels
within the business at the year end.
CommunityOur goal is to support the communities in which we operate
and employee involvement is integral to this.
We established the Alliance Trust Staff Foundation as a Scottish
Charitable Incorporated Organisation in 2013 and have
supported local charities operating within Dundee, Edinburgh
and London.
In 2014 the Alliance Trust Staff Foundation donated £30,800
to local charities. Charities we supported included Breast Foot
Forward (supporting work on Breast Cancer), Streetwork
(working with the vulnerable in Edinburgh), The Baytree
Centre (a community support group in London), Dundee
Disabled Children’s Association (providing holidays for disabled
children), Links Park Community Trust (promoting sport and
health education in Montrose), Action for Children (helping
fund its Volunteer Mentoring Programme in Dundee) as well as
continuing to support the Brae Riding Centre for the Disabled.
Our employees actively participate in fundraising activities
and in 2014 collectively raised or donated over £52,000 for
charitable causes. This included the Cateran Yomp, a 54 mile
walk, with over 560 registered participants including 18 teams
from Alliance Trust, raising £66,000 for ABF the Soldier’s Charity
and £33,000 to the Alliance Trust Staff Foundation to support its
work in 2015.
We are increasingly moving towards skills-based volunteering.
This achieves greater impacts and helps develop and engage
our people. We support Pilotlight, which places business
professionals onto the Boards of charities, and some of our senior
team members are now working directly with local charitable
organisations. We ran two workshops in local Dundee schools,
helping to equip students with the necessary skills to secure
employment in the future.
Engaging with our value chainThe nature of our business means we have a relatively low
direct environmental impact compared to companies in some
other industries. We do however believe that we can play a
positive role in engaging our suppliers, business partners and
the companies that we invest in to help them improve their
environmental impact.
We have started to embed sustainability considerations into our
procurement decisions. Our sustainable procurement policy for
facilities-related contracts outlines our commitment to working
with responsible suppliers and includes our criteria for assessing
suppliers’ environmental performance. We have also integrated
environmental considerations into our newly updated business
supplier framework. As part of our commitment to the Montreal
Carbon Pledge we are exploring how to measure more of our
Scope 3 emissions – carbon emissions related to our investments.
EnvironmentAs part of our commitment to being a responsible business and
our strategy, Alliance Trust has in place policies and procedures
to address our own direct environmental impact. At our head
office in Dundee, we have an ISO 14001 certified environmental
management system. We are committed to managing our
day to day operations across all our locations in line with the
principles of good environmental management.
We are also committed to monitoring, reporting and
improving our environmental performance as evidenced by our
annual participation in the CDP (formerly Carbon Disclosure
Project) climate change programme. This year we achieved
a CDP climate change score of 89 (for disclosure) and B (for
performance), which is a significant improvement compared
to the prior year’s score of 74 C. We were also shortlisted as
a finalist in the Management Awards at the VIBES (Vision in
Business for the Environment of Scotland) Awards for 2014.
In line with mandatory reporting we disclose our Greenhouse
Gas (GHG) carbon emissions opposite. While Alliance Trust’s
own carbon footprint is relatively small, as a company we are
committed to doing our part to address the negative effects
of climate change. We have set ourselves a target to achieve
a 20% reduction in Scope 1 and 2 greenhouse gas emissions
per full-time employee by 2020, relative to 2013. This year
we have made good progress against that goal, achieving a
4.4% reduction as a result of our efforts in this area. Our Scope
3 emissions, associated predominantly with business-related
travel, have also improved with an 8.8% reduction this year
in absolute terms. The impact of business activities on climate
change is an increasingly important issue for many of our
stakeholders and we will continue to take steps to improve our
businesses’ performance in this area.
On other environmental aspects, we monitor paper, waste and
water consumption, and aim to send zero waste to landfill from
our Dundee head office.
Investing for Generations
Male Female
Board 4 (50%) 4 (50%)
Senior managers 45 (74%) 16 (26%)
Total workforce 125 (46%) 147 (54%)

Alliance Trust PLC Report & Accounts 2014 | 35
2014 2013
Scope 1 (direct emissions)
• Combustionoffuelandoperation of facilities
• Airconditioningrefrigerantloss
• Companyvehicleuse
190 211 Tonnes CO2e
Scope 2 (indirect emissions)
• Electricitypurchasedforownuse 535 489 Tonnes CO2e
Scope 3 (indirect emissions)
• Businesstravel
• Downstreamleasedassets592 649 Tonnes CO2e
Key Performance Indicator (KPI)
Scope 1 + 2 normalised to per full-time employee equivalent (FTE)
2.63 2.76 Tonnes CO2 per FTE
Investing for Generations
Mandatory disclosure of total Greenhouse Gas emissions data for the year ended31December2014We report here on all of the emission sources required under the Companies Act 2006 (Strategic Report and Directors’ Reports)
Regulations 2013. These sources fall within our consolidated financial statements. We do not have responsibility for any emission
sources that are not included in our consolidated financial statements.
We have used the GHG Protocol Corporate Accounting and Reporting Standard (revised edition) and emission factors from UK
Government’s GHG Conversion Factors for Company Reporting 2014. The emissions reported below have been verified by Carbon
Footprint Limited.
Details of our verification statements are available on our website at www.alliancetrust.co.uk/pdfs/CarbonActionVerificationStatement.pdf
Strategic ReportThe Strategic Report (pages 1 to 35 of this document) has
been approved by the Board and signed on its behalf by
Katherine Garrett-Cox, Chief Executive
5 March 2015

36 | Alliance Trust PLC Report & Accounts 2014
UK Europe North America
Asia Emerging markets
Geographical diversity This chart shows the regions or areas where our directors have worked or had managerial responsibilities
Directors
AppointmenttotheBoard2012
CommitteemembershipNomination (Chair)
KeyskillsandexperienceFinancial services sector and regulatory environment
Broad geographic, economic and political knowledge
Externalappointments• Non-ExecutiveDirectorof
Soya Group
• CouncilmemberoftheEuropean Council on Foreign Relations (ECFR)
Previousexperience• Non-ExecutiveDirector/
Deputy Chair of the Financial Services Authority (FSA)
• ChiefExecutiveOfficerof D Carnegie & Co AB
• ChiefOperatingOfficerof London International Financial Futures Exchange, (LIFFE)
• HeadofDistributionfor Westpac Banking Corporation’s Financial Markets Group in London
• DirectorofBusinessDevelopment for the OMLX Exchange in London
AppointmenttotheBoard2008
CommitteemembershipAudit (Chair) Nomination Risk Remuneration (appointed March 2015)
KeyskillsandexperienceFinancial services and actuarial sectors
Externalappointments• Non-ExecutiveDirectorof
the Board of Ecclesiastical Insurance Group
• ChairsthetrusteesoftheBOC pension scheme
Previousexperience• FinanceDirectorat
Standard Life
• Variousactuarial,financeand management positions within Standard Life
• ChairmanoftheStandardLife pension scheme
KarinForsekeChair
JohnHylandsNon-Executive Director
AppointmenttotheBoard2012
CommitteemembershipRemuneration (Chair) Nomination Risk
KeyskillsandexperienceRetail and consumer experience
Externalappointments• Non-ExecutiveDirectorof
Fuller, Smith and Turner
• Non-ExecutiveDirectorofHavelock Europa
• Non-ExecutiveDirectorofFenwick
• Non-ExecutiveDirectorofSteamer Trading
• ChairmanofDriltonand J Murphy & Sons
• ChairmanofArranAromatics
• PublicMemberof Network Rail
Previousexperience• ManagingDirector,EMEA,of
The Body Shop International
• ManagingDirectorofKwik-Fit
• GroupChiefExecutiveof Park Group
• ChiefExecutiveofVirginRetail Europe
AlastairKerrSenior Independent Director
Chair Non-ExecutiveDirectors

Alliance Trust PLC Report & Accounts 2014 | 37
AppointmenttotheBoard2012
CommitteemembershipRisk (Chair) Audit Remuneration
KeyskillsandexperienceAsset management and equity investment
Externalappointments• Non-ExecutiveDirectorof
British Empire Securities and General Trust
Previousexperience• HeadofGlobalEquities
at Goldman Sachs Asset Management
• SeniorPortfolioManagerof Fleming Continental European Investment Trust
• EuropeanEquitiesManagerat Robert Fleming Asset Management
SusanNobleNon-Executive Director
BankingInsuranceAsset managementRegulatory
AccountancyPensionsRetail
Female Male
Experience diversity This chart shows the sectors in which our directors have relevant skills and experience
AppointmenttotheBoard2007
KeyskillsandexperienceAsset management, equity investment and broad financial services
Externalappointments• MemberofSupervisory
Board of Deutsche Bank AG
Previousexperience• ChiefInvestmentOfficer
and Executive Director at Aviva Investors
• GroupChiefInvestmentOfficer and Chief Executive of Aberdeen Asset Management Limited
• InvestmentDirectoratHillSamuel Asset Management
AppointmenttotheBoard2010
KeyskillsandexperienceFinance and Accounting
Externalappointments• MemberofFinancial
Conduct Authority’s Markets Practitioner Panel
Previousexperience• GroupCorporate
Development Director at Legal and General
• SeniorfinanceroleswithStandard Life, Standard Life Bank and Royal Bank of Scotland
• CharteredAccountantwithErnst & Young
KatherineGarrett-CoxCBEChief Executive Officer
AlanTrotterChief Financial Officer
Gender diversity This chart shows the gender split of our board.
AppointmenttotheBoard2014
CommitteemembershipAudit
KeyskillsandexperienceFinance and Accounting Financial Services
Externalappointments• Professionaladviserto
international financial services groups
• HonoraryTreasurerforthecharity International Alert
Previousexperience• FinanceDirectorforthe
Insurance Division of Lloyds Banking Group
• MemberofLloydsBankingGroup’s Finance Board and Senior Asset & Liability Committee
• CharteredAccountant with and Partner of Ernst & Young
GregorStewartNon-Executive Director
Executive Directors

38 | Alliance Trust PLC Report & Accounts 2014
Corporate Governance
Good corporate governance is not about “box-ticking” – it
requires every board to consider the processes, controls and
limits within which their own company should operate, taking
account of its own specific characteristics. Boards then need
to define and work within a framework which is clear and
understandable to everyone involved in the management of
the company.
The following pages describe the work of the Board and also
of its various committees during 2014, with commentary from
the Chair of each committee.
In addition, both the management team and our regulated
subsidiaries, Alliance Trust Savings and Alliance Trust Investments
operate within parameters set by the Board. This ensures that
the Board retains control over key strategic decisions and has
control of the risk profile of the business. These are regularly
reviewed by the Board to ensure that they remain appropriate,
giving the Chief Executive and her management team, who
also act as the Boards of the regulated subsidiaries, the freedom
to develop the business and respond quickly to emerging
opportunities while not exposing shareholders to excessive risk.
At each Board meeting, the Board scrutinises KPI reports
covering all aspects of the business, including investment
and operational performance and customer outcomes. This
enables the Board to satisfy itself that good progress is being
made against the agreed business plan and allows it to take
early corrective action where required. In addition the Board
receives regular in-depth presentations from investment
managers and also from the Alliance Trust Savings and Alliance
Trust Investments management teams. These presentations
give the Board the opportunity to provide both support and
challenge to management across all areas of the business.
The Non-Executive Directors hold regular private sessions.
Some of these are also attended by the Chief Executive.
Compliance with UK Corporate Governance CodeI am pleased to confirm that we have complied with the UK
Corporate Governance Code September 2012 throughout
the period covered by this report. A revised Code was issued
in September 2014, applicable to reporting periods beginning
on or after 1 October 2014. The Company already reflects
many of its provisions in its practices. We also comply with
the principles of the AIC Code of Corporate Governance
issued in February 2013.
Karin Forseke Chair
Purpose of the BoardThe Board sets the long-term objectives of the Company
and approves its business plans and strategic direction. It is
responsible for ensuring that a framework of prudent controls
is in place to enable risk to be managed effectively. It provides
leadership and reviews business performance.
Details of the Board members can be found on pages 36 and 37.
The Board delegates certain decisions to committees comprising
Non-Executive Directors, Executive Directors or a combination
of these and management.
The areas of decision-making that the Board has reserved
to itself are:
• strategyandinvestmentpolicy
• newsubsidiarybusinessesandjointventures
• annualbudget
• approvaloftreasurypolicies,bankingcounterparties
and counterparty exposure limits
• Groupborrowinglimitsandthemaximumamounts
and nature of new bank borrowing facilities
• majorcontracts
• assetclassesinwhichanyGroupcompanymayinvest
• derivativeinstrumentswhichanyGroupcompanymayuse
• materialchangestogearingandthepercentagemix
of asset allocation by class and geography
• majorchangesinemploymentandremunerationstructures
• politicalandcharitabledonations
• anymateriallitigationorcivilproceedings
The Boards of its subsidiaries are required to seek endorsement
from the parent Board for any strategic decisions including:
• businessplansandannualbudgets
• approvalofdirectorsandofficers
• acquisitionordisposalofpartofanybusiness
• launchofnewormaterialchangestoexistingfunds
or products
• significantcontracts
Through the matters reserved to the Board, the powers of
individual Directors are restricted to the extent necessary to
ensure good governance.

Alliance Trust PLC Report & Accounts 2014 | 39
Decision taken
Strategy The Board held a strategy day in September at which it reviewed progress against the 2020 Vision which had been approved in 2013. The Board identified a number of key actions for management to progress including accelerating profitability of the subsidiaries, ensuring that potential future business environment changes were considered, and focus on costs and project management.
Investment performance
The Board receives regular investment presentations at which the Directors have the opportunity to challenge the managers on both the performance and risk profile of their portfolios. This year the Board agreed a restructure of the investment team which allowed the implementation of a single investment process and the reduction of the cost of managing the equity portfolio. The Board continues to consider the operation of its flexible buyback policy.
Business plansThe Board approved the business plans of the Company and the subsidiary companies. The Board challenged a number of assumptions made and agreed with management on a number of actions to be taken in support of the achievement of the agreed targets.
Dividend The Board considered the level of dividends to be paid and agreed to follow the policy set out in 2013 of maintaining a steadily rising dividend and paying out all of the current year’s earnings.
Regulatory matters
The Board approved the application to the FCA for authorisation as a manager under the Alternative Investment Fund Managers’ Directive (AIFMD), receiving approval in July 2014.
Scottish independence
The Board monitored the debate on Scottish independence closely and agreed to put in place plans to mitigate the impact of a vote in favour of independence. This included the setting up of new English subsidiaries and identifying the business framework that would be required to allow the business to operate under both Scottish and English jurisdictions.
Gearing The Board approved the replacement of banking facilities as they fell due for renewal and a 15 year £100m unsecured fixed-rate loan note issue to replace other approved borrowings.
Executive succession
The Board carried out a detailed review of executive succession plans. The Board approved the approach taken by management to assess the performance and potential of individuals and the development of a bespoke leadership development programme. This programme, which will be run in conjunction with Strathclyde University, will focus on collaborative learning and target potential future leaders within the Company.
Banking licence
The Board supported the proposed surrender of the banking licence of Alliance Trust Savings to simplify that business and move it to the client money regime adopted by most of its competitors. Unforeseen changes to the regulatory framework for pension scheme administrators caused a reconsideration of that change and the Board agreed that the banking licence would be retained until the impact of these changes had been fully assessed and implemented. The position will be reviewed in 2015.
FundchangesThe Board approved the launch by Alliance Trust Investments of two new funds, the Alliance Trust Sustainable Future Cautious Managed Fund and the Alliance Trust Sustainable Future Defensive Managed Fund. Together with three existing funds, this created the first risk-profiled range of Sustainable and Responsible Investment funds in the UK.
Key areas of focus in 2014

40 | Alliance Trust PLC Report & Accounts 2014
Board Committees
Key Management Committees
Subsidiary Boards
Equities Finance Risk
Subsidiaries
FixedIncome Legal Compliance
Mineral rights and Property
PrivateEquity InformationTechnology
ProjectManagement
Operations
Company Secretarial
Human Resources
Facilities
Asset Allocation
Alliance Trust Investments
Executive
Alliance Trust Savings
Authorisation
Risk Management Portfolio Oversight
Internal Audit
Board of Directors
Board Risk
Remuneration
Nomination
Audit
Corporate structureWe have a number of board and management committees to ensure good governance and management. The terms of reference of
the four committees reporting to the Board can be found at http://investor.alliancetrust.co.uk/ati/investorrelations/board.htm.
The chart below shows the main committees and reporting lines within the Group.
Chief Executive
Investor Relations
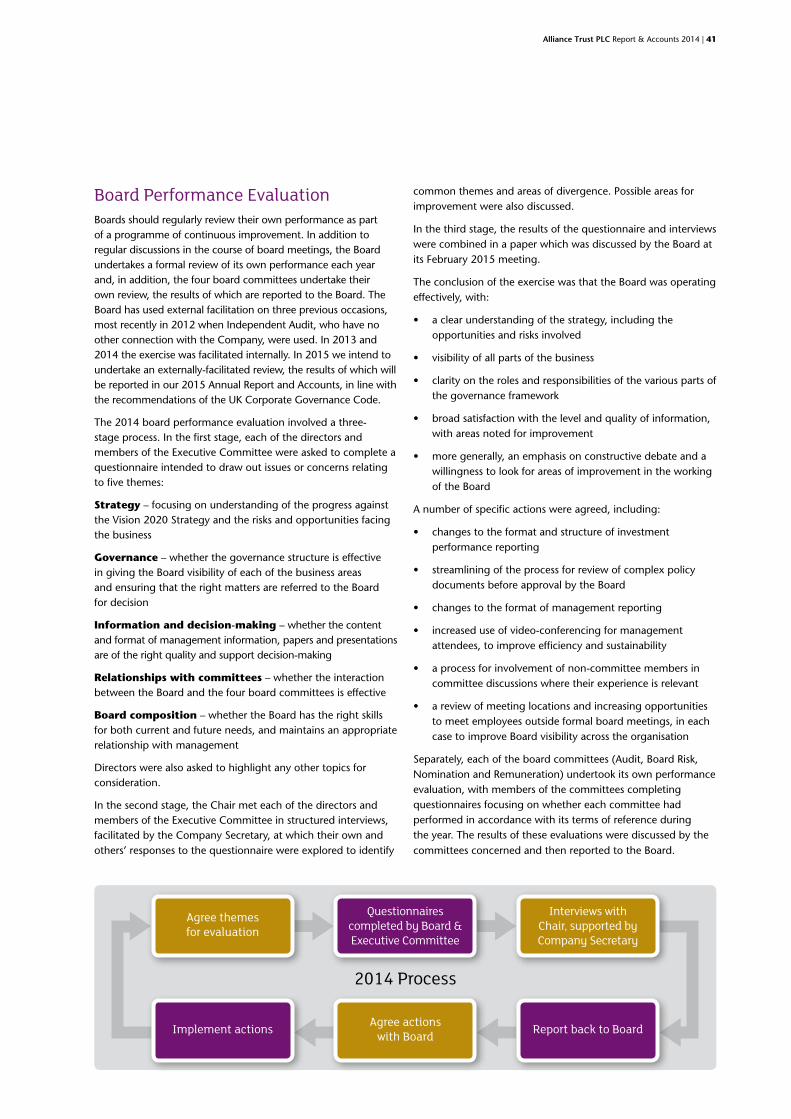
Alliance Trust PLC Report & Accounts 2014 | 41
Board Performance EvaluationBoards should regularly review their own performance as part of a programme of continuous improvement. In addition to regular discussions in the course of board meetings, the Board undertakes a formal review of its own performance each year and, in addition, the four board committees undertake their own review, the results of which are reported to the Board. The Board has used external facilitation on three previous occasions, most recently in 2012 when Independent Audit, who have no other connection with the Company, were used. In 2013 and 2014 the exercise was facilitated internally. In 2015 we intend to undertake an externally-facilitated review, the results of which will be reported in our 2015 Annual Report and Accounts, in line with the recommendations of the UK Corporate Governance Code.
The 2014 board performance evaluation involved a three-stage process. In the first stage, each of the directors and members of the Executive Committee were asked to complete a questionnaire intended to draw out issues or concerns relating to five themes:
Strategy – focusing on understanding of the progress against the Vision 2020 Strategy and the risks and opportunities facing the business
Governance – whether the governance structure is effective in giving the Board visibility of each of the business areas and ensuring that the right matters are referred to the Board for decision
Information and decision-making – whether the content and format of management information, papers and presentations are of the right quality and support decision-making
Relationships with committees – whether the interaction between the Board and the four board committees is effective
Board composition – whether the Board has the right skills for both current and future needs, and maintains an appropriate relationship with management
Directors were also asked to highlight any other topics for consideration.
In the second stage, the Chair met each of the directors and members of the Executive Committee in structured interviews, facilitated by the Company Secretary, at which their own and others’ responses to the questionnaire were explored to identify
common themes and areas of divergence. Possible areas for improvement were also discussed.
In the third stage, the results of the questionnaire and interviews were combined in a paper which was discussed by the Board at its February 2015 meeting.
The conclusion of the exercise was that the Board was operating effectively, with:
• aclearunderstandingofthestrategy,includingtheopportunities and risks involved
• visibilityofallpartsofthebusiness
• clarityontherolesandresponsibilitiesofthevariouspartsofthe governance framework
• broadsatisfactionwiththelevelandqualityofinformation,with areas noted for improvement
• moregenerally,anemphasisonconstructivedebateandawillingness to look for areas of improvement in the working of the Board
A number of specific actions were agreed, including:
• changestotheformatandstructureofinvestmentperformance reporting
• streamliningoftheprocessforreviewofcomplexpolicydocuments before approval by the Board
• changestotheformatofmanagementreporting
• increaseduseofvideo-conferencingformanagementattendees, to improve efficiency and sustainability
• aprocessforinvolvementofnon-committeemembersincommittee discussions where their experience is relevant
• areviewofmeetinglocationsandincreasingopportunitiesto meet employees outside formal board meetings, in each case to improve Board visibility across the organisation
Separately, each of the board committees (Audit, Board Risk, Nomination and Remuneration) undertook its own performance evaluation, with members of the committees completing questionnaires focusing on whether each committee had performed in accordance with its terms of reference during the year. The results of these evaluations were discussed by the committees concerned and then reported to the Board.
2014 Process
Agree themes for evaluation
Implement actions
Questionnaires completedbyBoard&Executive Committee
Agree actions with Board
Interviews with Chair, supported by Company Secretary
Report back to Board

42 | Alliance Trust PLC Report & Accounts 2014
Board Risk Committee
Wesetoutonpages27to30howthebusinessmanagesthekeyrisksthatimpactontheCompany.In this section we provide information on the main areas of focus of the Committee over the year. The Committee plays a significant role in monitoring how effective management is in managing risk in the business and provides a layer of challenge above that provided by the senior managers who are members of the Risk Management Committee. One of the main purposes of the Committee is to support initiatives intended to embed the Company risk culture within the Group. The Committee reviews and challenges the appropriateness of the Group Risk Appetite scorecards and management’s assessment of the future Risk Outlook impacting the Company. The table below summarises how the Committee has tackled this in the year highlighting key areas of focus.
Susan Noble Chair, Board Risk Committee
Decisions taken
Risk appetite The Committee recommended changing the approach in respect of some of Alliance Trust Savings measures to score the risks by relative, rather than absolute, values. This change was due to increased business volumes and was not intended to lead to a lessening of controls or appropriate risk monitoring.
Risk monitoring The Committee supported the ongoing development and refinement of risk monitoring.
Risk reporting The Committee has continued to refine and extend the level of risk reporting that it receives. Scores attributed to identified risks, which were regarded by the Committee as too high, were challenged and management tasked with mitigating the impact of the risks.
Investment risk The Committee recognised that how the investment managers operate their portfolio is a key risk and annually review the Group’s Investment Risk Process. In addition at each meeting a report is made by the Head of Performance and Investment Risk on the activities of the investment managers and the level of risk that they are adopting in the management of their portfolios.
Regulatory compliance
The Committee considered and recommended to the Board a number of submissions that were provided to the regulators. These included an Internal Capital Adequacy Assessment Process (which involves analysing the risks to the business and the level of capital required to reflect those risks), Recovery and Resolution Plan (which involves approving a plan to outline how the business will be managed under extreme stress scenarios) and an Individual Liquidity Systems Assessment (which involves approving the means by which Alliance Trust Savings maintains adequate levels of liquidity). The Committee regularly considers new legislation that will impact on the business and the risks associated with additional compliance requirements.
Business continuity
The Committee considered an annual report on the effectiveness of the arrangements that are in place to ensure that the business can continue to operate when faced with a number of challenging business issues. In the course of the year call cascades, an onsite recovery test and a crisis scenario exercise were held all of which demonstrated that there were effective processes and procedures in place to minimise the risk of business interruption.
Cyber riskThe Committee has continued to focus on the threat of cyber crime during the year. This included assessing industry developments on cyber security through technical updates from an external cyber security consultant and reports on IT Security, which provided updates on how cyber risks were being assessed and mitigated across the Group, at three Committee meetings.
Scottish independence referendum
This was one of the highest risks identified in 2014 and the Committee monitored developments throughout the year and had reports at each meeting from the project group, which comprised senior managers from across the business, on the preparations that were being made should there be a positive vote for Scottish independence. The Committee has continued to monitor the implications following the outcome of the referendum.
Key areas of focus in 2014

Alliance Trust PLC Report & Accounts 2014 | 43
Nomination Committee
Decisions taken
Non-ExecutiveDirector succession planning
The Committee discussed the need for recruitment of an additional Non-Executive Director as part of long-term succession planning for the Board. The Committee agreed a specification of the skills and experience that would be required against a pre-agreed matrix of necessary and preferred competencies and appointed Russell Reynolds to conduct a search for this appointment. Russell Reynolds has no other connection with the Company.
Re-electionofDirectors
Since 2011 each Director has been subject to annual re-election by shareholders. The Committee considered each continuing Director for their independence, contribution, commitment and availability of time and having concluded that each Director satisfied each of these criteria recommended their re-election.
Non-ExecutiveDirector appointment
The Committee considered a number of candidates for the role of Non-Executive Director against the previously agreed specification. The Board was satisfied that Gregor Stewart demonstrated the relevant skills required. On taking up the role of a Non-Executive Director Gregor Stewart was also appointed to the Audit Committee, given his financial experience.
Committee composition
Following the appointment of Gregor Stewart to the Board and the Audit Committee the Committee reviewed the membership of the different Board committees. John Hylands was appointed to the Remuneration Committee in March 2015.
Key areas of focus in 2014
We set out in this section the main areas of focus of the Committee over the year. The Committee’s roleistoassesstheskillsandexperienceofindividualdirectorsagainsttheskillsetrequiredtoensurethat the Board can provide effective direction and oversight of the Company’s strategy and operations. The Committee maintains a succession plan for future planned retirements and leads the search for replacements as and when necessary. We explain below the action we have taken this year and how the Committee has tackled its role highlighting both the key areas of focus and the decisions taken.
Karin Forseke Chair, Nomination Committee

44 | Alliance Trust PLC Report & Accounts 2014
Audit Committee
In this section we provide information on the main areas of focus of the Audit Committee over the year.ThemembersoftheCommitteeandtheirexperiencecanbefoundonpages36and37.TheCommittee plays a significant role in ensuring that the Company’s financial statements and those of other companies in the Group are properly prepared and that the systems of controls that are in place are effective and appropriate. We provide more detail on these matters on the next pages but the key areas of focus and the decisions taken are summarised in the table below.
Forthefirsttime,lastyear,wewererequiredspecificallytoconsiderwhetherourCompanyaccountswere,takenasawhole,fair,balancedandunderstandable,arequirementintroducedbyamendmentstothe UK Corporate Governance Code in 2012. The Code was further amended in September 2014 for future reporting periods and many of the new provisions are already reflected in the Company’s practices.
John Hylands Chair, Audit Committee
Decisions taken
Review of Annual and Interim Accounts
The Committee considered the content of the Interim Accounts and the Report and Accounts of the Company, including whether they were fair, balanced and understandable, before recommending their approval to the Board. In the course of their consideration the critical accounting policies and any changes to accounting policies were debated and agreed. The Committee also reviewed the Report and Accounts of Alliance Trust Savings and Alliance Trust Investments.
Internal Audit, External Audit and Compliance Plans
The Committee considered and approved the planned activities of the Internal Audit and Compliance functions along with the scope of the External Audit for the year. The Committee agreed to continue with the use of an external firm to provide additional specialist resource to supplement the Internal Audit and Compliance teams.
Effectiveness of Risk Management and Internal Control Systems
The Committee received reports from the Internal Audit and Compliance functions regularly during the course of the year. These reports covered progress in the delivery of the internal audit and compliance monitoring plans, actions arising from audits, and reviews of compliance with Client Asset regulatory obligations. These reports, together with the annual review of effectiveness of risk management and internal control systems, allowed the Committee to arrive at the conclusions on page 45. In preparation for the outsourcing of fund accounting to BNY Mellon, the Committee considered changes to the accounting process and approved the approach which had been proposed by management after satisfying itself that the changes were appropriate.
Significant accounting matters
The Committee considered and recommended to the Board a change in the methodology of valuing Alliance Trust Investments, details of which can be found on page 19. The impact of new accounting standards on the presentation of the Company accounts was considered and the approach agreed. The Committee agreed the accounting treatment of areas of expenditure within Alliance Trust Savings, more details of which can be found on page 21. The amortised cost valuation basis for a private placement of £100m of fixed rate notes was considered and approved.
External Auditor The Committee considered the independence and performance of the External Auditor before arriving at the conclusions on page 46.
IT and project controls
The Committee considered the results of a benchmarking exercise that had been carried out to assess the strength of IT Governance and IT management. A number of actions were identified to improve IT strategy and controls which have been addressed and a regular review of systems is now in place. The Committee also considered the implementation of the outsourcing of the investment back office function.
Internal Audit strategy
The Committee considered a change in strategy for Internal Audit to move from purely an assurance role to one which also included an advisory role. The Committee concluded that they wished to preserve the focus on assurance; however the advisory role could be adopted in specific cases where it could provide more timely constructive challenge to business initiatives.
UK Corporate Governance Code
The Committee considered early adoption of the amendments to the UK Corporate Governance Code published in September 2014. The Company already meets many of the new Code’s requirements; however it was agreed that affirming compliance should be deferred to next year by which time we intend to fully comply with the revised Code.
Key areas of focus in 2014

Alliance Trust PLC Report & Accounts 2014 | 45
Internal controlsThe Group has a clear governance structure for the control and monitoring of its business, including defined lines of responsibility and delegation of authority. The Group has a comprehensive system for reviewing, monitoring and reporting to the Board, including a detailed financial review against forecast.
The Board is responsible for determining its appetite for the level of risk it is willing to take in achieving its strategic objectives and for the Group’s risk management and internal control systems. The Audit and the Board Risk Committees assist the Board in fulfilling this responsibility through regular review of their effectiveness, including all material financial, operational and compliance controls.
The Board has an established ongoing process for the identification, evaluation and management of the significant risks faced by the Group. The Board Risk Committee regularly reviews this process, which is in accordance with the “Guidance on Risk Management, Internal control and Related Financial and Business Reporting” issued in September 2014.
The Group’s system of internal control is designed to facilitate effective and efficient operations and to ensure the assets of the Group and its customers are safeguarded, proper accounting records are maintained, and the financial information used within the business and for reporting to stakeholders is reliable. Any system of risk management and internal control is designed to manage, rather than eliminate, the risk of failure to achieve business objectives and can only provide reasonable assurance and not absolute assurance against regulatory breach, material misstatement or loss. The Audit Committee asked management to undertake a detailed review of the current arrangements for client assets as well as the implementation of outsourcing to ensure that appropriate controls were in place for current business and for any change in the regulatory regime for client assets.
From 18 July 2014, when the Company became authorised as a manager under the AIFMD, it appointed a Depositary, National Westminster Bank plc. The Depositary is responsible for the safekeeping of all custodial assets of the Company, ensuring its cash flows are properly monitored, for verifying and maintaining a record of all other assets of the Company and for the collection of income that arises from the Company’s assets. It is the duty of the Depositary to take reasonable care to ensure that the Company is managed in accordance with the FUND Sourcebook, the Company’s Articles of Association and the AIFMD.
Having carried out such procedures as the Depositary considers necessary to discharge their responsibilities as Depositary, it is their opinion, based on the information available to them and the explanations provided, that in all material respects the Company has been managed in accordance with the rules in the FUND sourcebook, the Articles of Association of the Company and as required by the AIFMD.
The Board Risk Committee reviews the effectiveness of the Group’s Risk Management Framework and reviews and challenges the results of the Group’s Risk and Control Self Assessment process
which considers the effectiveness of internal control in managing the significant risks to which the Group is exposed.
The Audit Committee regularly receives reports from the Group’s Compliance and Internal Audit functions and from the External Auditor which include details of all significant internal control issues relating to the Group. The Audit Committee provides independent oversight of Internal Audit and Compliance to ensure that they are providing the level of scrutiny expected by the Audit Committee and the Board. In arriving at their conclusions, and to allow reports to be made to them without management presence, the Audit Committee has private sessions with each of the Head of Internal Audit, Director of Compliance and the External Auditor during the year.
The Audit Committee performed an assessment for the purpose of this annual report, which considered all significant aspects of risk management and internal control arising during the period of the report, including the work of the Risk, Compliance and Internal Audit functions. The Audit Committee then reported its findings to the Board.
As a result of the annual review and the ongoing processes for review, monitoring and reporting of the Group’s internal controls, the Board did not identify any significant weaknesses or failings and remains satisfied with the effectiveness of the Group’s risk management and internal control systems.
Internal controls over financial reportingOne of the risks to the Group is Financial and Prudential
Reporting – the risk of adopting inappropriate accounting
policies and ineffective controls over financial and regulatory
reporting. The Group has a Financial Accounting Policy and
an Accounting Manual to enable the Group to comply with
all relevant accounting standards to ensure that the financial
statements provide a true and fair view.
This risk and the mitigating controls are assessed regularly by
management. Controls over the preparation of the consolidated
accounts include but are not limited to:
• Aformalreviewandsign-offoftheannualaccountsby
management including verification of any statements made;
• AdoptionofappropriateaccountingpoliciesbytheBoard;
• ReviewandapprovalofaccountingestimatesbytheBoard.
The Audit Committee also considered whether the
Annual Report, taken as a whole, was fair, balanced and
understandable, and provides the information necessary for
shareholders to assess the Company’s performance, business
model and strategy. In arriving at their conclusion that the
Annual Report satisfied this standard the Committee took
into account the process adopted in the preparation of the
document which included:
• TheinvolvementofExecutiveCommitteemembers,the
Company Secretary, the Head of Performance and Risk and

46 | Alliance Trust PLC Report & Accounts 2014
the Head of Investor Relations in regular drafting meetings;
• AllExecutiveCommitteemembersprovidesign-offonthe
draft issued to the Board for approval;
• Verificationofallfactualstatementscontainedwithinthe
narrative section of the Annual Report, with evidence
required from the author;
• Statementswhichcannotbeverified–typicallyopinions
or forward-looking statements – specifically brought to the
Audit Committee’s attention;
• Independentinternalreviewbyaseniormanagernot
involved in the preparation of the Annual Report.
The Audit Committee considered the steps outlined above and
the content of the document. After review the Committee were
satisfied, taking care to ensure that the narrative parts of the
Annual Report were consistent with the numerical disclosures
in the audited accounts, that the Annual Report satisfied the
required standard and recommended approval to the Board.
Significant areas of focusDuring the year Audit Committee considered a number of
significant matters set out below.
• TheCommitteewerepresentedwithadetailedpaperon
the implications of the new accounting standard, IFRS
10 Consolidated Financial Statements and the proposed
disclosures for inclusion in the financial statements. This was
discussed at length and agreed. The resulting conclusion
was that Alliance Trust met the definition to qualify as an
investment entity with only one subsidiary, Alliance Trust
Services Limited, continuing to be consolidated in the Group
results. All other subsidiaries are now all valued at fair value
through the Group income statement.
• Thevaluationmethodologyusedtovaluetheinvestments
in the subsidiaries and private equity investments can be
found in Note 23.8 on pages 98 and 99. The Committee
reviewed the initial valuation methodology and outputs
provided by management, including careful consideration of
the change in methodology recommended for Alliance Trust
Investments. The Committee challenged the initial valuations
and asked for further analysis on market multiples prior to the
final valuations of the subsidiaries being recommended to the
Board for approval.
• TheCommitteeconsideredtheimplementationandprogress
of the fund accounting and middle office outsourcing to BNY
Mellon. They required that an internal audit review of the
project be completed prior to the launch to validate project
governance, operational readiness and mitigation of key
project risks.
• Theimpairmentof£0.9mofcapitalisedcostsassociatedwith
the decision by Alliance Trust Savings not to proceed with
the transfer of the business to client money permissions due
to unforeseen regulatory change. The Committee discussed
this issue, assessed the impact of the regulatory changes on
the project and the assumptions that had been made before
concluding that a full impairment of the project cost incurred
to date was required.
• Thetreatmentofa£3.9minvestmenttodateinanew
platform for Alliance Trust Savings. The decision here was to
capitalise expenditure immediately but with no depreciation
charge being applied until the system was operative, this was
in line with our existing accounting policy. The expenditure
related to software and associated hardware required to
provide improved functionality and efficiencies.
Independence of AuditorThe Committee’s policy is to allow the audit firm to be
instructed to undertake non-audit work only where there is no
threat to independence. Any assignment must be approved
on behalf of the Committee by its Chair. Such assignments
are normally put out to tender. Last year £35,000 was paid to
the Auditor, mainly in respect of regulatory returns and work
on the audit of termination accounts for a number of Alliance
Trust Investments funds. Each year the Committee considers
the independence of the Auditor. It has done so this year and
confirms the Auditor’s independence.
Effectiveness of AuditorDuring the course of the year the audit engagement partner and
other members of the engagement team met with the Audit
Committee Chair and the Chief Financial Officer, both together
and separately. These meetings provide an opportunity for matters
relating to the conduct of the audit, including the performance of
the External Auditor, to be raised and addressed at the time.
Following completion of the external audit of the financial
statements for the period ended 31 December 2013 a
formal evaluation of the External Auditor’s effectiveness
was undertaken. The evaluation was facilitated by the Head
of Internal Audit and was conducted by way of a survey,
completed by Audit Committee members and members of
management within the businesses and the control functions.
The survey assessed the External Auditor’s performance against
the following criteria: independence and objectivity, audit
strategy, communication with management, and how the audit
was finalised.
The Audit Committee considered the results of the evaluation
and concluded that it was satisfied both with the performance
and with the independence of the External Auditor. No material
issues were identified.

Alliance Trust PLC Report & Accounts 2014 | 47
Tender of Audit During 2010 the Board carried out a tender exercise for the role of Auditor. The Committee decided that it would be appropriate to change Auditor and recommended the appointment of Deloitte LLP to the Board who in turn recommended their appointment to the members at the 2011 Annual General Meeting. Deloitte LLP were subsequently reappointed at the 2012, 2013 and 2014 AGMs and are proposed for reappointment in 2015. Deloitte LLP will change the audit partner every five years and the current partner, Calum Thomson, has been in the role for four years. The recommendation to reappoint Deloitte LLP is not automatic. In the course of the year the Chair of the Committee has met with the Auditor outwith the formal structure of Committee meetings. The Committee has considered the performance of the Auditor and is satisfied with the rigour that they apply to the audit process and have recommended the reappointment of Deloitte LLP for a further year.
The Committee has decided that it will put the role of Auditor out to tender at least every 10 years in accordance with the UK Corporate Governance Code and taking into account new rules from the Competition and Market’s Authority and the European
Commission which will come into force over the next few years.
Disclosure of information to AuditorThe Directors who held office at the date of approval of this Directors’ Report confirm that, so far as they are each aware, there is no relevant audit information of which the Auditor is unaware; and each Director has taken all steps they ought to have taken as a Director to make themselves aware of any relevant audit information and to establish that the Auditor is aware of that information.
Directors’ responsibilities statement The Directors are responsible for preparing the financial statements in accordance with applicable law and regulations.
Company law requires the Directors to prepare financial statements for each financial period. By law, the Directors are required to prepare the group financial statements in accordance with International Financial Reporting Standards (IFRSs) as adopted by the European Union (EU) and Article 4 of the IAS Regulation and have elected to prepare the parent company financial statements under IFRSs as adopted by the EU.
The financial statements are required by law and IFRSs as adopted by the EU to present fairly the financial position of the Company and the performance for that period; the Companies Act 2006 provides, in relation to such financial statements, that references in the relevant part of that Act to financial statements giving a true and fair view are references to their achieving a fair presentation.
In preparing the financial statements, the Directors are required to:
• selectsuitableaccountingpoliciesandthenapplythemconsistently;
• presentinformation,includingaccountingpolicies,inamanner that provides relevant, reliable, comparable and understandable information;
• provideadditionaldisclosureswhencompliancewiththespecific requirements in IFRSs are insufficient to enable users to understand the impact of particular transactions, other events and conditions on the entity’s financial position and financial performance; and
• makeanassessmentoftheCompany’sabilitytocontinueasa going concern.
The Directors are responsible for keeping proper accounting records that disclose with reasonable accuracy at any time the financial position of the Company and to enable them to ensure that its financial statements comply with the Companies Act 2006. They have general responsibility for taking such steps as are reasonably open to them to safeguard the assets of the Company and to prevent and detect fraud and other irregularities.
Under applicable law and regulations, the Directors are also responsible for preparing a Directors’ Report and a Strategic
Report that complies with that law and those regulations.
Going concernThe Group’s business activities are set out on pages 4 and 5 with the principal risks which could impact on performance set out on pages 28 and 29. The Group’s financial position and cash flows are set out on pages 68 to 72 along with an analysis of its borrowings in Note 15 on page 89. As regards going concern the Directors have considered both liquidity and solvency risks.
Liquidity is concerned with our ability to liquidate assets or access new sources of short-term funds in the time needed to meet our liabilities as they fall due. The majority of the Group’s assets are in listed securities on recognised stock exchanges which are readily realisable even in volatile markets. At 31 December 2014 we also had £170m of unused committed funding lines.
Solvency is concerned with our ability to meet our liabilities in full. This involves managing our capital by maintaining a business model which is capable of delivering over time a continuing economic return to our shareholders whilst absorbing the impact of any risks which crystallise. As at 31 December 2014 the Group’s total net assets were £3.0bn. Our investment policy restricts gearing to 30% of net assets at any given time (11% at 31 December 2014).
Sensitivities to market, credit, liquidity and gearing risk are set out in Note 23 on pages 93 to 99.
The Directors, who have reviewed the budgets, forecasts and sensitivities for the coming year, consider that the Group has adequate financial resources to enable it to continue in operational existence for the foreseeable future. Accordingly the Directors believe that it is appropriate to continue to adopt the going concern basis for preparing the financial statements.

48 | Alliance Trust PLC Report & Accounts 2014
Remuneration report
Decisions taken
Executive Directors’ remuneration
The Committee considered the awards to be made to the Chief Executive and Chief Financial Officer based on their performance against their agreed objectives and agreed the awards made as explained in more detail on pages 54 and 55.
The Committee also considered the salary and other benefits which the Executive Directors receive and decisions were taken having received data on the levels of pay for peer comparators from an external benchmarking specialist.
There is no change to the Executive Directors’ salaries for 2015.
Other Executive remuneration
The Committee considered recommendations made for the Remuneration Code staff and other senior managers and, after debate and changes, approved awards to those individuals. The Committee also considered and approved the performance conditions attaching to the LTIP arrangement and the individuals who would be granted awards under that arrangement.
AESOP awardThis year all full-time participants who were in the Plan for the full year will receive an award of shares, valued at £2,000. Part-time employees and those that joined the Plan part way through the year will receive a pro-rated award.
Long-termincentive arrangements
The Committee added a two year holding period to the Long-Term Incentive Plan with effect from 2015 grants. The malus and clawback clauses will extend throughout the new five year period.
Objectives The Committee discussed and agreed objectives for the Chief Executive and Chief Financial Officer for 2015.
Remuneration disclosures
The Committee considered the disclosures that are required to be made under the FCA’s Remuneration Code and the list of the individuals that might fall within that requirement and also under the future AIFMD disclosure requirements.
Key areas of focus in 2014
WepresenttheRemunerationReportfortheyearended31December2014.Thisreportisdividedinto two parts:
• Thefirstpartsetsoutclearlyhowrewardisalignedcloselytoourbusinessstrategy(thisisashortened summary of the Policy Report approved by shareholders in 2014), and
• AnImplementationReportwhichdetailsthepracticalapplicationofourpolicyin2014.
In this year’s Remuneration report we have worked hard to provide sufficient detail around our performanceandrewardoutcomesbutdoingsoinamoresimpleandtransparentmanner.Forthefirst time we have also outlined the measures we have set our Executive Directors in respect of 2015. These measures are closely aligned to our business strategy and designed to drive long term value creation for our shareholders. By disclosing them in advance we believe that this is an important tool by which our shareholders can hold us to account for future performance.
TheRemunerationCommittee,whosemembersaredetailedonpages36and37,havelistenedcarefully to the views of shareholders and to market sentiment and have added a two year holding periodtotheLongTermIncentivePlan.Thiscreatesalongertermfocusandstrongerretentionmeasure for the business.
I am pleased to recommend the resolution submitted for approval at the Annual General Meeting.
Alastair Kerr Chair, Remuneration Committee

Alliance Trust PLC Report & Accounts 2014 | 49
In this section, we provide a summary of our Remuneration Policy which was approved by our shareholders on 1 May 2014 and is unchanged. The full text of our approved policy can be found at http://investor.alliancetrust.co.uk/ati/investorrelations/literature.htm. We provide summary details of the payments that can be made under our Policy as it applies to our Non-Executive Directors on page 53 and to our Executive Directors over the next two pages.
The Committee reserves the right to make a payment outside the Policy in exceptional and unforeseen circumstances. The Committee would only use this right where it believes that this is in the best interests of the Company, and when it would be disproportionate to seek specific approval from a general meeting. Prior to the Annual General Meeting last year the Company clarified that this discretion will not be used in a recruitment situation, given the existing terms of the policy covering recruitment and promotion and that where the discretion is used to grant a variable or performance-related award, that award will be made within the terms of the policy on incentives. Any such payments will be fully disclosed on a timely basis and none have been made this year.
Remuneration strategyOur aim is to deliver strong and sustainable investment performance for our shareholders over the longer term. The route to achieving this is through our people.
Our remuneration strategy is designed to help us recruit the best talent and retain and motivate them to deliver our long- term business strategy. The driving principle behind our reward strategy is to link the delivery of strong performance closely to pay outcomes, thereby aligning the interests of directors and employees with those of shareholders and clients.
The remuneration packages of Executive Directors will be structured in such a way as to promote sound and effective risk management within the Company’s risk appetite. To ensure that our reward structures do not encourage excessive risk taking a clawback mechanism has been introduced to allow awards under our long-term incentive plan to be recovered in the exceptional event of: misstatement or misleading representation of performance; a significant failure of risk management and control; or serious misconduct of an individual.
Consideration of shareholder viewsWe regularly engage with our shareholders on all aspects of
performance and governance, including remuneration issues.
Alignment with our employees The Company regularly seeks the views of its employees and
specifically targets feedback on reward structures and whether
pay outcomes are fair and reasonable given the level of
responsibilities and contributions made throughout the year.
Feedback from our people is an important measure of success in
our reward strategy.
Our people are also shareholders in our business, as we actively
encourage share ownership, through our AESOP scheme and
partnership shares, which are matched in part by the Company.
We believe that encouraging share ownership not only gives our
people a voice, as shareholders of the business, but it aligns the
interests of our people with our external shareholders.
Summary Directors’ Remuneration Policy

50 | Alliance Trust PLC Report & Accounts 2014
Summary of Directors’ Remuneration Policy
To help recruit, retain and motivate high performing employees.
Reflects individual experience, role and importance of the individual to the business as a whole.
Reviewed annually with levels set to reflect individual responsibilities, level of experience and performance outturns.
A market benchmarking exercise will be undertaken each year to ensure that salaries remain around the median of the market level, for roles of similar size and complexity.
Salaries are reviewed annually and increases are effective from 1 April. It is our intention to target salaries around the market median of similar sized businesses.
Any increases will consider UK Retail Prices Index and market conditions and will typically be in line with increases offered to our wider population of employees.
Year on year increases are unlikely to be more than twice the rate of increase in the RPI.
To help recruit and retain employees.
To provide market competitive benefits which add a level of protection and preventative care for our people.
Benefits currently received by directors include:
• Paidholidays
• Lifeinsurance
• Travelinsurance
• Privatehealthinsurance
• Permanenthealthinsurance
• Subsistenceallowance
• Subscriptionstoprofessionalbodies or other relevant organisations
The Company provides a range of market benchmarked benefits. The costs of these benefits may change year on year due to external insurance costs.
Should we recruit a Director from overseas, flexibility will be retained to provide benefits which would typically have been provided in their country of origin. These may include school fees, and relocation costs.
Directors receive a cash payment of up to 25% of salary instead of a pension contribution.
To encourage and reward delivery of the Company’s strategic goals and to align the interests of directors closely with interests of shareholders and clients.
For Executive Directors, individual awards are currently assessed at least 50% against Corporate KPIs and no more than 50% against a set of business objectives linked to the Company strategy.
Executive Directors are required to defer at least 50% of any cash bonus into the LTIP.
The annual bonus is currently capped at 150% but the Committee have discretion to increase the maximum to 200% in future years.
The Committee can set different performance measures and/or targets provided that, in the opinion of the Committee, the proposed changes are not significant.
All employees can receive shares under a HMRC approved All Employee Share Ownership Plan dependent upon the performance of the business in each year and can elect to purchase up to the HMRC limit of partnership shares from pre-tax income each tax year.
If changes are contemplated, the Committee will consider consulting with our main shareholders.
Executive Directors
Base Salary Benefits Annual incentives
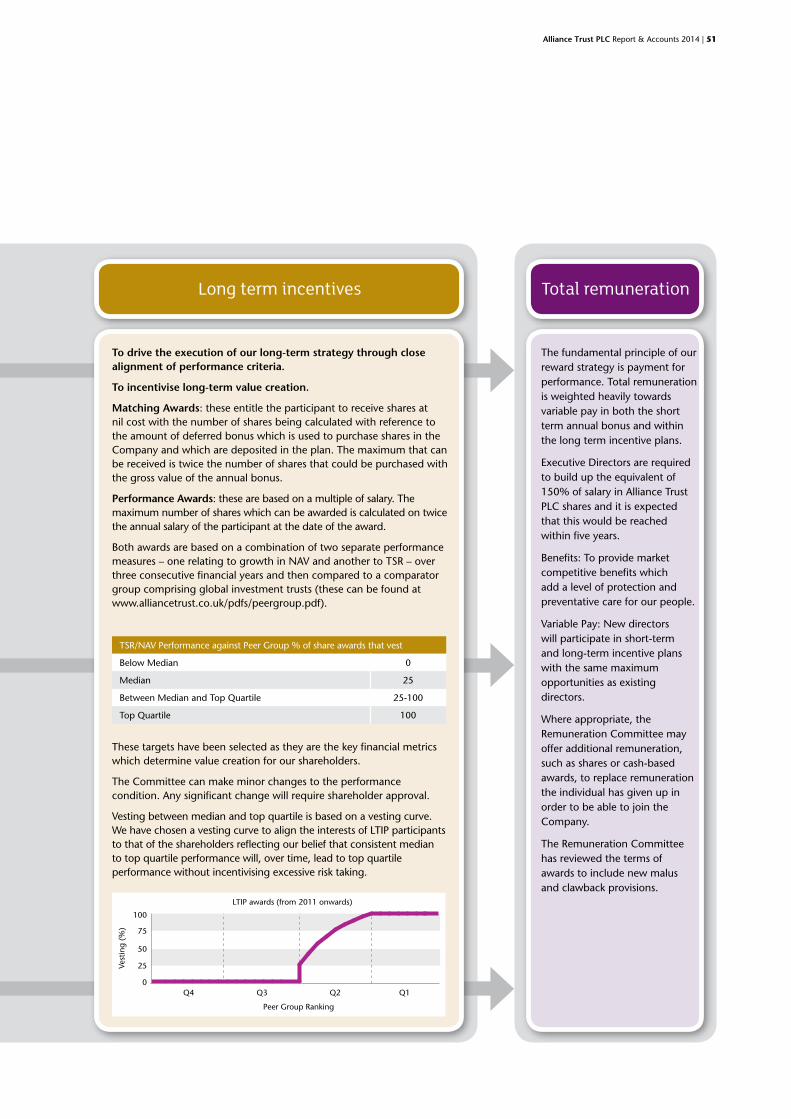
Alliance Trust PLC Report & Accounts 2014 | 51
The fundamental principle of our reward strategy is payment for performance. Total remuneration is weighted heavily towards variable pay in both the short term annual bonus and within the long term incentive plans.
Executive Directors are required to build up the equivalent of 150% of salary in Alliance Trust PLC shares and it is expected that this would be reached within five years.
Benefits: To provide market competitive benefits which add a level of protection and preventative care for our people.
Variable Pay: New directors will participate in short-term and long-term incentive plans with the same maximum opportunities as existing directors.
Where appropriate, the Remuneration Committee may offer additional remuneration, such as shares or cash-based awards, to replace remuneration the individual has given up in order to be able to join the Company.
The Remuneration Committee has reviewed the terms of awards to include new malus and clawback provisions.
To drive the execution of our long-term strategy through close alignment of performance criteria.
To incentivise long-term value creation.
Matching Awards: these entitle the participant to receive shares at nil cost with the number of shares being calculated with reference to the amount of deferred bonus which is used to purchase shares in the Company and which are deposited in the plan. The maximum that can be received is twice the number of shares that could be purchased with the gross value of the annual bonus.
Performance Awards: these are based on a multiple of salary. The maximum number of shares which can be awarded is calculated on twice the annual salary of the participant at the date of the award.
Both awards are based on a combination of two separate performance measures – one relating to growth in NAV and another to TSR – over three consecutive financial years and then compared to a comparator group comprising global investment trusts (these can be found at www.alliancetrust.co.uk/pdfs/peergroup.pdf).
These targets have been selected as they are the key financial metrics which determine value creation for our shareholders.
The Committee can make minor changes to the performance condition. Any significant change will require shareholder approval.
Vesting between median and top quartile is based on a vesting curve.We have chosen a vesting curve to align the interests of LTIP participants to that of the shareholders reflecting our belief that consistent median to top quartile performance will, over time, lead to top quartile performance without incentivising excessive risk taking.
LTIP awards (from 2011 onwards)
0
25
50
75
100
135791113151719212325272931
Peer Group Ranking
0
25
50
75
100
Vest
ing
(%)
Q1Q2Q3Q4
TSR/NAV Performance against Peer Group % of share awards that vest
Below Median 0
Median 25
Between Median and Top Quartile 25-100
Top Quartile 100
Longtermincentives Total remuneration

52 | Alliance Trust PLC Report & Accounts 2014
Payments on loss of office
Executive Directors’ Service ContractsThe Executive Directors have service contracts which may be
terminated on twelve months’ notice from the Company or
six months’ notice from the Director. The contracts contain
specific mitigation provisions should their contracts be
terminated. The mitigation provisions are structured to provide
monthly payments, during the notice period, against which
any income received during the period is offset. The monthly
payment would be based on current salary, pension allowance
and benefits. Service contracts do not contain a default
normal retirement age. A Director’s service contract may be
terminated without notice and without any further payment
or compensation, except for sums accrued up to the date of
termination, on the occurrence of certain events such as gross
misconduct.
Any share-based entitlements granted to an Executive Director
under the Group’s share plans will be determined based on the
relevant plan rules. The default position is that any outstanding
awards lapse on cessation of employment. However, in certain
prescribed circumstances, such as death, injury or disability,
redundancy, retirement or other circumstances at the discretion of
the Committee (taking into account the individual’s performance
and the reasons for their departure) ‘good leaver’ status can be
applied but individuals will wait until normal date of vesting and
awards will normally be pro-rated for length of service.
The rules of the Company’s Long-Term Incentive Plan contain
a change of control clause, which crystallises the share awards,
subject to pro-rating of awards within the three year cycle
based on days worked and to the participant giving up their
entitlement for replacement shares in any new company.
Date of contract
Notice from the
Company
Notice to the
CompanyProvision of
compensation
Katherine Garrett-Cox
20/04/07 Twelve months
Six months
Loss of office up to one year’s
salary, pension allowance
and benefits
Alan Trotter 01/02/10 Twelve months
Six months
Loss of office up to one year’s
salary, pension allowance
and benefits
In developing the above scenarios, the following assumptions have been made:
Illustration of the application of the Remuneration PolicyThe charts below illustrates the remuneration opportunity provided to each Executive Director at different levels of performance for 2015.
Fixed Cash Deferred
MaximumOn TargetMinimum MaximumOn TargetMinimum
Chief Financial Of�cerChief Executive Of�cer
0
500000
1000000
1500000
2000000
2500000
3000000
3500000
£1,312,968
£567,093
31%
43%100%
26%
£1,521,886
64%
20%
16%
48%20%32%
100%
£3,454,968
65%
16%
19%
£296,886
£621,511
Minimum On-target Maximum
Includes only payments to which the Director is contractually entitled including salary, allowances and benefits.
This is based on what a Director could receive if performance was in line with targets:
• Annualbonusespayoutat50%ofthemaximumfor on-target performance.
• Long-termincentiveplanperformanceattargetwould see approximately 33% of the award vesting.
100% of the Annual bonus.
100% vesting of Long-Term Incentive Awards assuming maximum matching awards based on full deferral of bonus.

Alliance Trust PLC Report & Accounts 2014 | 53
External directorshipsThe Company has a policy of permitting its Executive Directors
to hold one paid external directorship in another company
where this does not conflict with their duties to the Company.
Katherine Garrett-Cox became a member of the Supervisory
Board of Deutsche Bank AG in 2011 for which an annual fee is
payable and is retained by the Director. In 2014 she received
fees of €75,000 in respect of the previous year.
Non-Executive DirectorsEach Non-Executive Director’s appointment is governed
by written terms which are available for inspection at the
Company’s registered office and are also available at the Annual
General Meeting. Non-Executive Directors are appointed
subject to annual re-election at the Company’s AGM and their
appointment may be terminated at any time by notice given by
three quarters of the other Directors.
The current basic Non-Executive Director’s fee is £35,000.
The Articles of Association set a maximum of £224,000 on fees payable to directors. This does not include salary payments to Executive Directors, the Chair’s fee, fees paid for serving on or chairing Committees, or for other additional responsibilities.
In 2014 fees are paid for service on committees as follows:
Chair (no other fees are payable to the Chair) £120,000
Chair of Audit Committee £11,000
Chair of Remuneration Committee £7,500
Chair of Board Risk Committee £7,500
Chair of Nomination Committee nil
Senior Independent Director £5,000
Membership of Audit Committee £3,000
Membership of Remuneration Committee £3,000
Membership of Board Risk Committee £3,000
Membership of Nomination Committee nil

54 | Alliance Trust PLC Report & Accounts 2014
Implementation Report
50% Financial objectives Below threshold Above threshold Metrics
TSR against Global sector peer group for the financial year.
We were ranked 12th from 35 in our peer group resulting in an outcome of 87.4%.
NAV total return against Global sector peer group for the financial year.
We were ranked 11th from 35 in our peer group resulting in an outcome of 92.4%.
Dividend progression for the financial year.
Total dividend, including a special
dividend of 2.546p, rose by 14.3%.
Achieved in full.
Achievement of group cost budget for the financial year as approved by Board.
Including Alliance Trust Investments and Alliance Trust Savings.
Actual expenses 9.1% lower than budget.
Achieved in full.
Total 46.5% out of 50%
Financial objectives linked to delivering the Company’s long term strategy made up 50% of the total bonus award. The table below sets out in full the achievement against these objectives. 2014 represented a strong delivery against financial objectives and in total 46.5% was achieved from a possible 50%. These objectives apply to both Executive Directors.
Linking reward to delivering our strategy
Financialobjectives
The annual bonus comprises a series of financial and business objectives which are directly linked to the Company strategy.
The Remuneration Committee carefully selects each objective and reviews these annually to ensure they remain closely aligned with our business priorities.
The Committee gives equal weight to the financial objectives and the wider business objectives. This provides a balanced approach and ensures that Executive Directors remain equally focused on delivery of financial metrics alongside business development activities, leadership development and on ensuring the correct values and behaviours are embedded in the business.
The following bonuses in respect of the period ending 31 December 2014 were awarded and were payable after the period end:
Maximum as a % of Salary Bonus % of max
Katherine Garrett-Cox 150% £573,750 85%
Alan Trotter 100% £214,375 87.5%
AnnualBonus
There are two components to variable pay; firstly the annual bonus and, secondly, awards made under the Company’s Long-Term
Incentive Plan (LTIP) which was approved by shareholders in 2007.
Variable pay
Salary 1 April 2013 1 April 2014 Increase 1 April 2015
Katherine Garrett-Cox £425,250* £450,000* 2.3% no increase
Alan Trotter £225,000* £245,000* 2.2% no increase
*Car allowances of £15,000 were discontinued and incorporated into salary in 2014
During 2014 the Remuneration Committee
made the following salary changes:
Salary

Alliance Trust PLC Report & Accounts 2014 | 55
Business objectives Business objectives are set by the Remuneration Committee at the start of each performance year and will change annually to reflect business priorities. From these objectives we set out below some of the key measures. They are specific to the role of Chief Executive Officer and Chief Financial Officer.
Chief Executive Officer
The business objectives for the Chief Executive Officer, included driving fund performance across the Group, increasing brand awareness and developing a positive and risk controlled culture within the business. The Committee acknowledged a solid one year fund performance with an outstanding three year fund performance, a strong performance in developing the brand and an equally strong delivery of embedding an appropriate risk culture and shared sense of values within the business.
50% Key business objectives Below threshold Above threshold Metrics
Overall control of budgetary objectives of the Company.
Programme delivered to reduce costs within the Trust. Strong financial management delivered throughout 2014.
Creating a robust operating platform for the business.
Outsourcing project delivered which creates a scalable platform for development of our business.
Risk culture and shared values. Alignment with FCA Principles.
Assessment of culture and values, independently assessed by external consultancy, was significantly ahead of the financial services sector.
ChiefFinancialOfficerThe business objectives of the Chief Financial Officer (CFO) included the creation of a robust operating platform and maintaining a tight regulatory control structure for the business. The Committee commended the CFO on delivering strong fiscal governance and driving down costs within the Trust and on delivering the outsourcing project.
50% Key business objectives Below threshold Above threshold Metrics
Strong and consistent investment performance.
47% of funds on a one year basis and 80% on a three year basis performed at median or above against a target of 75%.
Successful brand campaigns and attracting new generations of investor.
Programme delivered an average increase in brand recognition of 18%.
Risk culture and shared values. Alignment with FCA Principles.
Assessment of culture and values, independently assessed by external consultancy, was significantly ahead of the financial services sector.
Financial objectives 46.5%/50%
Financial objectives 46.5%/50%
Business objectives 38.5%/50%
Business objectives 41%/50%
+
+
=
=
Total annual bonus 85%/100%
Total annual bonus 87.5%/100%
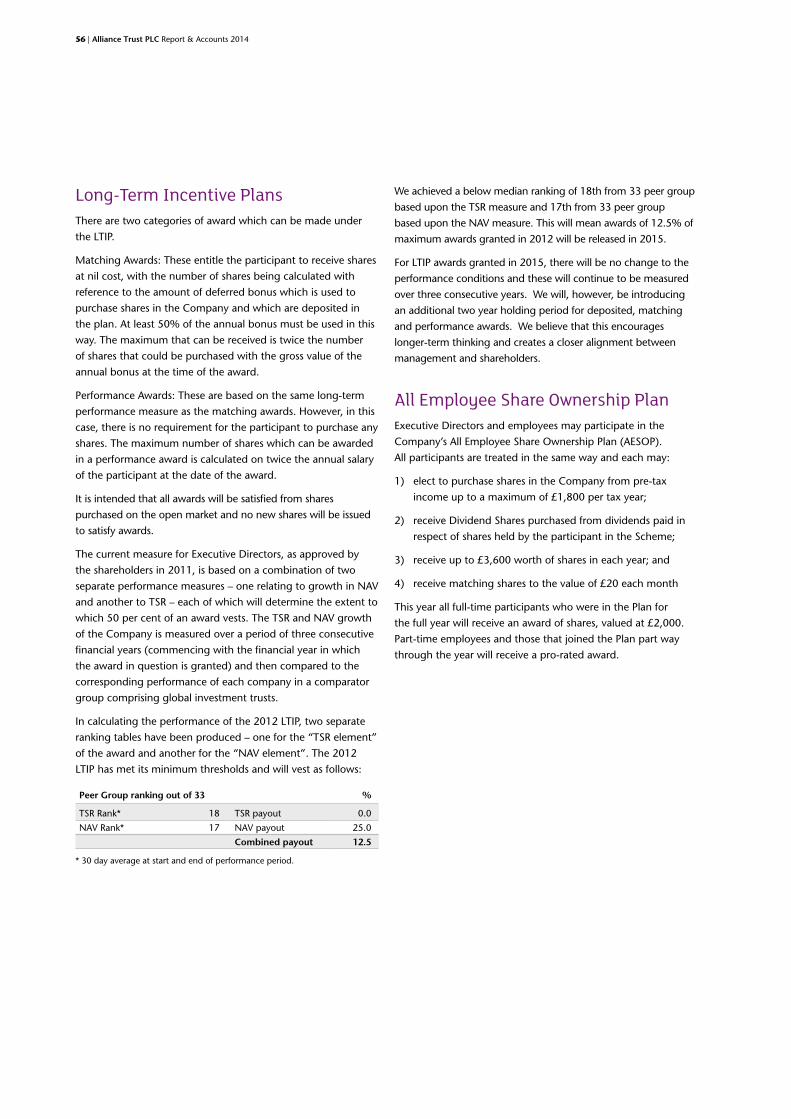
56 | Alliance Trust PLC Report & Accounts 2014
Long-TermIncentivePlansThere are two categories of award which can be made under
the LTIP.
Matching Awards: These entitle the participant to receive shares
at nil cost, with the number of shares being calculated with
reference to the amount of deferred bonus which is used to
purchase shares in the Company and which are deposited in
the plan. At least 50% of the annual bonus must be used in this
way. The maximum that can be received is twice the number
of shares that could be purchased with the gross value of the
annual bonus at the time of the award.
Performance Awards: These are based on the same long-term
performance measure as the matching awards. However, in this
case, there is no requirement for the participant to purchase any
shares. The maximum number of shares which can be awarded
in a performance award is calculated on twice the annual salary
of the participant at the date of the award.
It is intended that all awards will be satisfied from shares
purchased on the open market and no new shares will be issued
to satisfy awards.
The current measure for Executive Directors, as approved by
the shareholders in 2011, is based on a combination of two
separate performance measures – one relating to growth in NAV
and another to TSR – each of which will determine the extent to
which 50 per cent of an award vests. The TSR and NAV growth
of the Company is measured over a period of three consecutive
financial years (commencing with the financial year in which
the award in question is granted) and then compared to the
corresponding performance of each company in a comparator
group comprising global investment trusts.
In calculating the performance of the 2012 LTIP, two separate
ranking tables have been produced – one for the “TSR element”
of the award and another for the “NAV element”. The 2012
LTIP has met its minimum thresholds and will vest as follows:
We achieved a below median ranking of 18th from 33 peer group
based upon the TSR measure and 17th from 33 peer group
based upon the NAV measure. This will mean awards of 12.5% of
maximum awards granted in 2012 will be released in 2015.
For LTIP awards granted in 2015, there will be no change to the
performance conditions and these will continue to be measured
over three consecutive years. We will, however, be introducing
an additional two year holding period for deposited, matching
and performance awards. We believe that this encourages
longer-term thinking and creates a closer alignment between
management and shareholders.
All Employee Share Ownership PlanExecutive Directors and employees may participate in the
Company’s All Employee Share Ownership Plan (AESOP).
All participants are treated in the same way and each may:
1) elect to purchase shares in the Company from pre-tax
income up to a maximum of £1,800 per tax year;
2) receive Dividend Shares purchased from dividends paid in
respect of shares held by the participant in the Scheme;
3) receive up to £3,600 worth of shares in each year; and
4) receive matching shares to the value of £20 each month
This year all full-time participants who were in the Plan for
the full year will receive an award of shares, valued at £2,000.
Part-time employees and those that joined the Plan part way
through the year will receive a pro-rated award.
Peer Group ranking out of 33 %
TSR Rank* 18 TSR payout 0.0
NAV Rank* 17 NAV payout 25.0
Combined payout 12.5
* 30 day average at start and end of performance period.

Alliance Trust PLC Report & Accounts 2014 | 57
Advance disclosure of Executive Directors’ annual bonus measures for 2015
Chief Executive Officer
50% Financial objectives for Executive Directors Metrics
TSR against Global sector peer group for the financial year. To achieve median or above positioning relative to peer group.
NAV total return against Global sector peer group for the financial year.
To achieve median or above positioning relative to peer group.
Dividend progression for the financial year.To deliver an increase in our ordinary dividend of at least 3%.
To be achieved in full.
Achievement of group cost budget for the financial year as
approved by Board.
Including subsidiaries Alliance Trust Investments and Alliance Trust Savings.
We believe that these are commercially sensitive and we will
disclose the percentage achieved on a retrospective basis.
50% Key business objectives 2015 Metrics
Strong and consistent investment performance. 75% of funds to be performing at median or above.
Driving business growth and capitalising on market opportunities.
Assessment will be made on achievement of revenue and new business growth. We will disclose these retrospectively as they are commercially sensitive.
Risk culture and shared values. Alignment with FCA principles.
Successful brand campaigns and attracting new generations of investor.
Delivering an increase in brand awareness.
50% Key business objectives 2015 Metrics
Overall control of budgetary objectives of the Company.Assessment will be made on the actual achieved against the budget set.
Driving business growth and capitalising on market opportunities.
Assessment will be made on achievement of revenue and new business growth. We will disclose these retrospectively as they are commercially sensitive.
Risk culture and shared values. Alignment with FCA principles.
ChiefFinancialOfficer
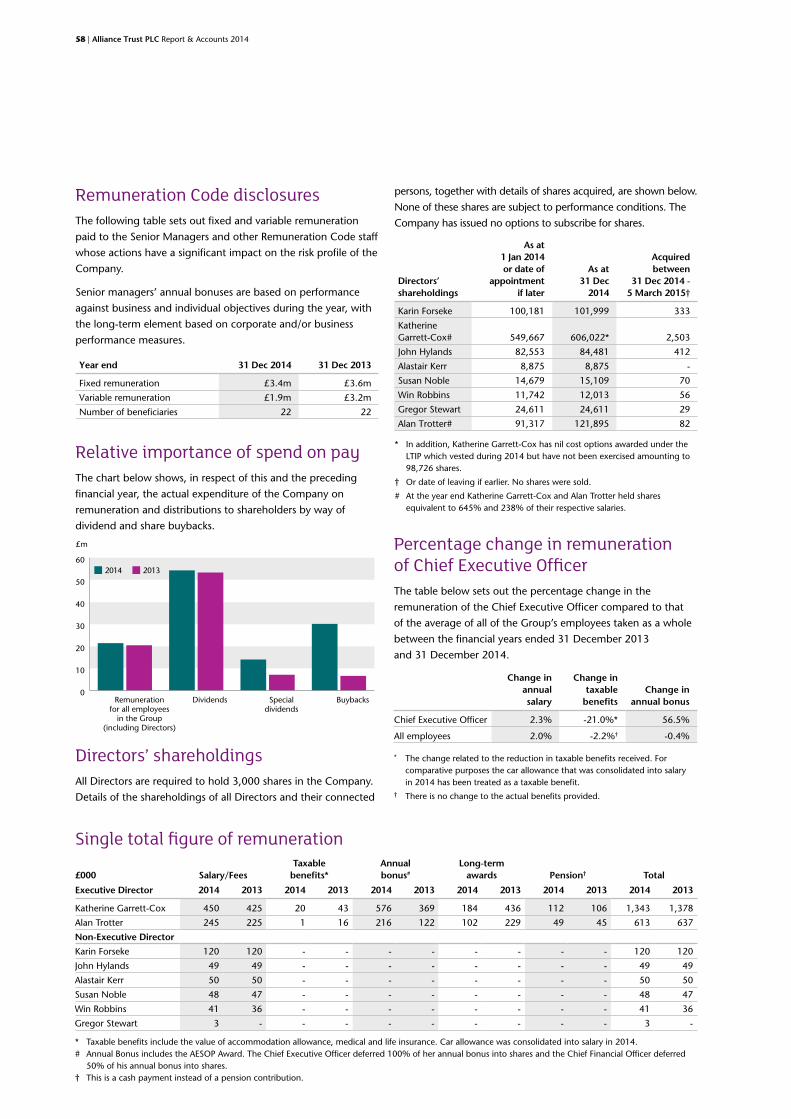
58 | Alliance Trust PLC Report & Accounts 2014
Remuneration Code disclosuresThe following table sets out fixed and variable remuneration
paid to the Senior Managers and other Remuneration Code staff
whose actions have a significant impact on the risk profile of the
Company.
Senior managers’ annual bonuses are based on performance
against business and individual objectives during the year, with
the long-term element based on corporate and/or business
performance measures.
Relative importance of spend on payThe chart below shows, in respect of this and the preceding
financial year, the actual expenditure of the Company on
remuneration and distributions to shareholders by way of
dividend and share buybacks.
Directors’ shareholdingsAll Directors are required to hold 3,000 shares in the Company.
Details of the shareholdings of all Directors and their connected
persons, together with details of shares acquired, are shown below.
None of these shares are subject to performance conditions. The
Company has issued no options to subscribe for shares.
Directors’ shareholdings
As at 1 Jan 2014 or date of
appointment if later
As at 31 Dec
2014
Acquired between
31 Dec 2014 - 5 March 2015†
Karin Forseke 100,181 101,999 333
Katherine Garrett-Cox# 549,667 606,022* 2,503
John Hylands 82,553 84,481 412
Alastair Kerr 8,875 8,875 -
Susan Noble 14,679 15,109 70
Win Robbins 11,742 12,013 56
Gregor Stewart 24,611 24,611 29
Alan Trotter# 91,317 121,895 82
* In addition, Katherine Garrett-Cox has nil cost options awarded under the LTIP which vested during 2014 but have not been exercised amounting to 98,726 shares.
† Or date of leaving if earlier. No shares were sold.
# At the year end Katherine Garrett-Cox and Alan Trotter held shares equivalent to 645% and 238% of their respective salaries.
Year end 31 Dec 2014 31 Dec 2013
Fixed remuneration £3.4m £3.6m
Variable remuneration £1.9m £3.2m
Number of beneficiaries 22 22
0
10
20
30
40
50
60
DividendsRemunerationfor all employees
in the Group(including Directors)
Specialdividends
Buybacks
2014 2013
£m
£000 Salary/FeesTaxable
benefits*Annual bonus#
Long-term awards Pension† Total
Executive Director 2014 2013 2014 2013 2014 2013 2014 2013 2014 2013 2014 2013
Katherine Garrett-Cox 450 425 20 43 576 369 184 436 112 106 1,343 1,378
Alan Trotter 245 225 1 16 216 122 102 229 49 45 613 637
Non-Executive Director
Karin Forseke 120 120 - - - - - - - - 120 120
John Hylands 49 49 - - - - - - - - 49 49
Alastair Kerr 50 50 - - - - - - - - 50 50
Susan Noble 48 47 - - - - - - - - 48 47
Win Robbins 41 36 - - - - - - - - 41 36
Gregor Stewart 3 - - - - - - - - - 3 -
* Taxable benefits include the value of accommodation allowance, medical and life insurance. Car allowance was consolidated into salary in 2014.# Annual Bonus includes the AESOP Award. The Chief Executive Officer deferred 100% of her annual bonus into shares and the Chief Financial Officer deferred
50% of his annual bonus into shares.† This is a cash payment instead of a pension contribution.
Single total figure of remuneration
Percentage change in remuneration of Chief Executive OfficerThe table below sets out the percentage change in the
remuneration of the Chief Executive Officer compared to that
of the average of all of the Group’s employees taken as a whole
between the financial years ended 31 December 2013
and 31 December 2014.
Change in annual salary
Change in taxable
benefitsChange in
annual bonus
Chief Executive Officer 2.3% -21.0%* 56.5%
All employees 2.0% -2.2%† -0.4%
* The change related to the reduction in taxable benefits received. For comparative purposes the car allowance that was consolidated into salary in 2014 has been treated as a taxable benefit.
† There is no change to the actual benefits provided.

Alliance Trust PLC Report & Accounts 2014 | 59
Performance graphThe graph below shows the TSR for holders of Alliance Trust PLC Ordinary Shares, measured against the MSCI All Country World
Index. We do not benchmark the Company’s performance against this index. However we are required by law to include a graph
showing the TSR for our shares against a broad equity index. As a global investment trust we have selected the MSCI All Country
World Index because, with over 2,000 large and mid-cap equities across more than 40 territories in developed and emerging
markets, it offers a useful reference point for comparison to the stocks in which we invest.
Chief Executive Officer remuneration 31 Jan 2010 31 Jan 2011 31 Dec 2011 31 Dec 2012 31 Dec 2013 31 Dec 2014
Single figure of remuneration £692,484 £700,232 £1,037,175 £1,800,326 £1,378,444 £1,342,859
Annual bonus (as percentage of maximum opportunity) 58.4% 50.0% 90.3% 81.5% 57.5% 85%
LTIP vesting (as percentage of maximum opportunity) 0% 0% 0% 51.7% 33.9% 12.5%
The table above shows the remuneration for the Director undertaking the role of Chief Executive Officer during each of the last six financial periods.
Resolution Votes for % Votes Against %Total
votes castVotes withheld
(abstentions)
Directors’ remuneration report (excluding remuneration policy) 180,311,078 93.80 11,918,409 6.20 192,229,487 2,431,383
Directors’ remuneration policy 171,460,998 89.22 20,716,232 10.78 192,177,230 2,499,192
Voting at Annual General MeetingAt the Annual General Meeting held on 1 May 2014, votes cast by proxy and at the meeting in respect of the Directors’ remuneration
report and Directors’ remuneration policy were as follows:
Audit statementThe tables on pages 52 to 60 together with the related footnotes have been audited by the Auditor whose report is on page 64.
External advisersThe Remuneration Committee, whose members are listed on pages 36 and 37, receives independent advice from Towers Watson.
Towers Watson abide by the Remuneration Consultants’ Code of Conduct, which requires them to provide objective and impartial
advice. Towers Watson were appointed by the Committee and they do not provide other services to the Group. Total fees charged
by Towers Watson for the year were £45,000.
* Rebased to 100 at 31 January 2009
† 11 months 31 January to 31 December 2011
Alliance Trust PLC MSCI All Country World Index80
120
160
200
240

60 | Alliance Trust PLC Report & Accounts 2014
Scheme and year of awardAt
1 Jan 14
Award granted in year
Awards vested in year
Awards lapsed in year
At 31 Dec 14
Market price of share on
date of award Vesting date
LTIP 11 April 2014 (Matching Award) - 160,086 - - 160,086 £4.537 11 April 2017
LTIP 11 April 2014 (Performance Award) - 187,458 - - 187,458 £4.537 11 April 2017
LTIP 16 April 2013 (Matching Award) 75,273 - - - 75,273 £4.336 16 April 2016
LTIP 16 April 2013 (Performance Award) 196,148 - - - 196,148 £4.336 16 April 2016
LTIP 2 May 2012 (Matching Award) 84,997 - - - 84,997 £3.6370 2 May 2015
LTIP 2 May 2012 (Performance Award) 233,846 - - - 233,846 £3.6370 2 May 2015
LTIP 31 May 2011 (Matching Award) 68,466 - 23,196 45,270 - £3.8150 31 May 2014
LTIP 31 May 2011 (Performance Award) 222,935 - 75,530 147,405 - £3.8150 31 May 2014
Scheme and year of awardAt
1 Jan 14
Award granted in year
Awards vested in year
Awards lapsed in year
At 31 Dec 14
Market price of share on
date of award Vesting date
LTIP 11 April 2014 (Matching Award) - 26,275 - - 26,275 £4.537 11 April 2017
LTIP 11 April 2014 (Performance Award) - 99,184 - - 99,184 £4.537 11 April 2017
LTIP 16 April 2013 (Matching Award) 38,256 - - - 38,256 £4.336 16 April 2016
LTIP 16 April 2013 (Performance Award) 103,782 - - - 103,782 £4.336 16 April 2016
LTIP 2 May 2012 (Matching Award) 52,112 - - - 52,112 £3.6370 2 May 2015
LTIP 2 May 2012 (Performance Award) 123,728 - - - 123,728 £3.6370 2 May 2015
LTIP 31 May 2011 (Matching Award) 35,320 - 11,482* 23,838 - £3.8150 31 May 2014
LTIP 31 May 2011 (Performance Award) 117,955 - 38,232* 79,723 - £3.8150 31 May 2014
Long-TermIncentivePlanAwardsThis table provides detail of awards made to our Executive Directors under the Long-Term Incentive Plan in the year ended 31 December
2014 and earlier years. All awards are subject to performance conditions as described on page 56. If the minimum performance condition
is met 12.5% of the awards detailed in the table below will vest.
KatherineGarrett-Cox
Alan Trotter
* Reduced to recover shares vested from the 2010 award which had been incorrectly calculated.
ApprovalThe Remuneration Report including the Implementation Report, comprising pages 48 to 60, has been approved by the Board and
signed on its behalf by
Alastair Kerr Chair, Remuneration Committee
5 March 2015

Alliance Trust PLC Report & Accounts 2014 | 61
Other governance matters
Directors’ and Officers’ indemnificationThe Company provides insurance (maximum payable £22m
in aggregate) for legal action brought against its Directors as
a consequence of their position. In addition separate deeds of
indemnity have been agreed with each Director indemnifying
them as permitted by company law. The indemnity and insurance
does not extend to cover claims brought by the Company itself
which are upheld by the Courts, nor to criminal fines or penalties.
Access to adviceAll Directors have access to independent professional advice if necessary.
Relationship with shareholdersAll Directors normally attend the AGM where they have the
opportunity to meet shareholders. Meetings also take place
throughout the year with major and institutional shareholders, such
meetings normally being attended by the Chair or Chief Executive.
All Directors receive reports from our public relations advisers and
our corporate broker as an additional way for them to capture the
views of our major shareholders on a non-attributable basis.
In addition to these meetings and reports, the Company hosted
two investor forums during the year where individual shareholders
had the opportunity to meet Directors and senior managers.
Almost 500 shareholders, customers of Alliance Trust Savings and
their guests attended these meetings.
Investment Trust StatusHM Revenue and Customs have confirmed that Alliance Trust has
investment trust status for all financial periods from 1 January 2012.
AlternativeInvestmentFund Managers DirectiveThe Company has been approved by the Financial Conduct
Authority as a manager under the Directive.
The Company has appointed National Westminster Bank Plc as its
Depositary under the Directive for the purpose of strengthening
the arrangements for the safe custody of assets.
Regulatory disclosures, including the Company’s Investor
Disclosure Document, are provided on the Company’s website
at http://investor.alliancetrust.co.uk/ati/investorrelations/AIFMD-
disclosures.htm.
Director developmentEvery new director receives an individually tailored induction.
The Board as a whole received updates on corporate governance,
risk and business issues during the year and specific training on
regulatory matters such as the ICAAP (Internal Capital Adequacy
Assessment Process) and CASS (Client Assets).
Statement of Investment Objective and PolicyAllianceTrustisaself-managedinvestmentcompany with investment trust status. Our objective is to be a core investment for investors seeking increasing value over the long term. We have no fixed asset allocation benchmark and we invest in a wide range of asset classes throughout the world to achieve our objective. Our focus is to generate a real return for shareholders over the medium to long term by a combination of capital growth and a rising dividend.
We pursue our objective by:
• Investinginbothquotedandunquotedequitiesacross
the globe in different sectors and industries;
• Investinginternationallyinfixedincomesecurities;
• Investinginotherassetclassesandfinancial
instruments, either directly or through investment
vehicles; and
• Investinginsubsidiariesandassociatedbusinesses
which allow us to expand into other related activities.
We are prepared to invest any proportion of the total
corporate capital in any of the above asset classes,
subject only to the restrictions imposed on us by the
regulatory or fiscal regime within which we operate.
However, we would expect equities to comprise at least
50% of our portfolio. Changes to the asset allocation will
be dependent upon attractive investment opportunities
being available.
Where market conditions permit, we will use gearing of
not more than 30% of our net assets at any given time.
We can use derivative instruments to hedge, enhance
and protect positions, including currency exposures.

62 | Alliance Trust PLC Report & Accounts 2014
Re-electionofDirectorsDetails of the current Directors can be found on pages 36 and 37. Gregor Stewart was appointed during the year and his appointment falls to be confirmed by shareholders at the Annual General Meeting.
The Board has decided that, in line with the UK Corporate Governance Code, all of the Directors will be subject to re- election every year.
The individual performance of each Director and their ongoing suitability for election or re-election was considered and endorsed by the Nomination Committee. All are recommended for election or re-election at the forthcoming Annual General Meeting. Each of our Directors has confirmed that they remain committed to their role and have sufficient time available to
meet what is expected of them.
Name Designation Appointed
Karin Forseke Chair 01/03/12
Katherine Garrett-Cox Chief Executive Officer 01/05/07
John Hylands Non-Executive Director 22/02/08
Alastair Kerr Non-Executive Director 01/10/12
Susan Noble Non-Executive Director 11/07/12
Win Robbins* Non-Executive Director 14/02/13
Gregor Stewart Non-Executive Director 01/12/14
Alan Trotter Chief Financial Officer 01/02/10
* Resigned 19 February 2015
Major shareholdersAs at 4 March 2015 the Company had received notifications from shareholders holding an interest in more than 3% of the voting rights
of the ordinary shares in issue of the Company. The disclosures, updated to reflect known changes in holdings, are:
The largest shareholder in the Company is the nominee company for Alliance Trust Savings which holds its shares on behalf of over
22,000 clients.
Shareholder Nature of interest Number of shares
DC Thomson & Company Limited and John Leng & Company Limited Shares 30,475,000 (5.51%)
Elliott International, LP, Liverpool Limited PartnershipShares 28,051,891 (5.07%)
Contract for difference over shares 38,914,597 (7.04%)
Alliance Trust Savings Nominees Limited 134,793,884 (24.37%)
Board and Committee attendancesIn addition to the scheduled Board and Committee meetings below, the Board and Committees met on a number of other
occasions to consider matters arising between the scheduled meetings. Meetings are structured over two days and take place six
times a year. This allows our Directors to have greater oversight of all parts of the Group.
Meeting attendances Board Audit Remuneration Nomination Board Risk
Director Actual Possible Actual Possible Actual Possible Actual Possible Actual Possible
Karin Forseke 6 6 - - - - 2 2 - -
Katherine Garrett-Cox 6 6 - - - - - - - -
John Hylands 6 6 5 5 - - 2 2 4 4
Alastair Kerr 6 6 - - 4 4 2 2 4 4
Susan Noble 6 6 5 5 4 4 - - 4 4
Win Robbins 6 6 5 5 4 4 - - - -
Gregor Stewart 1 1 1 1 - - - - - -
Alan Trotter 6 6 - - - - - - - -

Alliance Trust PLC Report & Accounts 2014 | 63
Share capital and waiver of dividendsThe Company’s issued share capital as at 31 December 2014
comprised 553,359,146 Ordinary 2.5p shares of which
1,131,837 have been acquired by the Trustee of an Employee
Benefit Trust (‘the Trustee’) with funds provided by the Company
in connection with its employee share plans. The Trustee has
elected to waive all dividends payable in respect of those
shares. The Trustee holds a further 353,966 shares deposited by
recipients of awards under the LTIP. Each Ordinary share of the
Company is entitled to one vote but the Trustee does not vote in
respect of the shares held by it on behalf of the Company.
In the course of the year the Company acquired and cancelled
6,735,000 shares at a total consideration, before costs and
charges, of £30m.
There are no preference shares or shares held in treasury.
Agreement in respect of voting rights There are no agreements in respect of voting rights.
Share buyback authorityAt the last AGM the shareholders renewed the authority for the
repurchase of up to 14.99% of the issued shares. This authority
falls to be renewed at the next AGM. The Company made use
of this provision during the course of the year as detailed above.
The Company will, as part of the authority being sought, declare
its intention that any shares bought back under the authority will
be cancelled.
Conflicts of interestThe Directors have previously provided details of all interests
which potentially could cause a conflict of interest to arise.
The unconflicted Directors in each case noted the declarations
by the Directors of their other interests and confirmed that
at that time none of the interests disclosed were reasonably
likely to give rise to a conflict. An annual review of all interests
was undertaken as part of the year end process and this was
considered by the Board in February 2015. Procedures are
in place to allow Directors to request authority should it be
required outwith the normal Board meeting schedule.
Annual General Meeting In addition to formal business, the Chief Executive will present
on business developments and there will be the opportunity for
questions to be put to the other Directors. This year, in addition
to the normal business there will be proposals to confirm the
notice period for convening general meetings other than Annual
General Meetings and to renew the share buyback authority.
Greenhouse gas (GHG) emissionsOur mandatory disclosure of total GHG emissions data for the
year ended 31 December 2014 can be found on page 35. We
report there on all of the emission sources required under the
Companies Act 2006 (Strategic Report and Directors’ Reports)
Regulations 2013. These sources fall within our consolidated
financial statements. We do not have responsibility for any
emission sources that are not included in our consolidated
financial statements.
We have used the GHG Protocol Corporate Accounting and
Reporting Standard (revised edition) and emission factors
from UK Government’s GHG Conversion Factors for Company
Reporting 2014. The emissions reported have been verified
by Carbon Footprint. Please find details of our verification
statements on our website at www.alliancetrust.co.uk/pdfs/
CarbonActionVerificationStatement.pdf
Report of Directors and Responsibility StatementThe Report of the Directors, including the Directors’
responsibility and going concern statements on pages
38 to 47 and 61 to 63 of the Annual Report and
Accounts has been approved by the Board.
We confirm that to the best of our knowledge:
• thefinancialstatements,preparedinaccordance
with International Financial Reporting Standards as
adopted by the European Union, give a true and fair
view of the assets, liabilities, financial position and
profit or loss of the Company and the undertakings
included in the consolidation taken as a whole;
• theStrategicReportincludesafairreviewofthe
development and performance of the business and
the position of the Company and the undertakings
included in the consolidation taken as a whole,
together with a description of the principal risks and
uncertainties that they face; and
• theAnnualReportandfinancialstatements,takenas
a whole, are fair, balanced and understandable and
provide the information necessary for shareholders
to assess the Company’s performance, business
model and strategy.
Karin Forseke Katherine Garrett-Cox
Chair Chief Executive
5 March 2015 5 March 2015

64 | Alliance Trust PLC Report & Accounts 2014
Independent Auditor’s report to the members of Alliance Trust PLCOpinion on financial statements of AllianceTrustPLCIn our opinion the financial statements:
• giveatrueandfairviewofthestateoftheGroup’sandof
the Parent Company’s affairs as at 31 December 2014 and
of the Group’s profit and the Parent Company’s profit for
the year then ended;
• havebeenproperlypreparedinaccordancewith
International Financial Reporting Standards (IFRSs) as
adopted by the European Union; and
• havebeenpreparedinaccordancewiththerequirements
of the Companies Act 2006 and, as regards the Group
financial statements, Article 4 of the IAS Regulation.
The financial statements comprise the Group and Parent Company balance sheets, the Group and Parent Company income statements, the Group and Parent Company statements of comprehensive income, the Group and Parent Company statements of changes in equity, the Group and Parent Company statements of cash flows, and the related notes 1 to 27. The financial reporting framework that has been applied in their preparation is applicable law and IFRSs as adopted by the
European Union.
Going concernAs required by the Listing Rules we have reviewed the directors’ statement on page 47 that the Group is a going concern. We confirm that:
• wehaveconcludedthatthedirectors’useofthegoing
concern basis of accounting in the preparation of the
financial statements is appropriate; and
• wehavenotidentifiedanymaterialuncertaintiesthatmay
cast significant doubt on the Group’s ability to continue as
a going concern.
However, because not all future events or conditions can be predicted, this statement is not a guarantee as to the Group’s ability to continue as a going concern.
Our application of materialityWe define materiality as the magnitude of misstatement in the financial statements that makes it probable that the economic decisions of a reasonably knowledgeable person would be changed or influenced. We use materiality both in planning the scope of our audit work and in evaluating the results of our work.
We determined materiality for the Group to be £30.2 million, which is approximately 1% of net assets.
This is a change of approach from 2013, where materiality of £86.4 million was based on 3% of Net Assets. We have
changed the percentage applied to align more closely with other comparable companies.
We agreed with the Audit Committee that we would report to the Committee all audit differences in excess of £603,900 (2013: £1.7 million), as well as differences below that threshold that, in our view, warranted reporting on qualitative grounds. We also report to the Audit Committee on disclosure matters that we identified when assessing the overall presentation of the financial statements.
An overview of the scope of our auditOur Group audit was scoped by obtaining an understanding of the Group and its environment, including Group-wide controls, and assessing the risks of material misstatement at the Group level. Our Group audit scope included the audit of all subsidiaries and these were subject to a full scope audit for the year ended 31 December 2014. Audits were performed for local statutory purposes at a local materiality level calculated by
reference to the scale of the business concerned.
Our assessment of risks of material misstatementThe assessed risks of material misstatement described below are those that had the greatest effect on our audit strategy, the allocation of resources in the audit and directing the efforts of the engagement team.
The Audit Committee has requested that while not required under International Standards on Auditing (UK and Ireland), we include in our report any significant findings in respect of these assessed risks of material misstatement.
Last year our report included one other risk which is not included in our report this year: risk of management override of internal control. Whilst we still consider this to be a significant risk, it is not considered to have had the greatest effect on our audit strategy, the allocation of resources in the audit and directing the efforts of the engagement team.
The description of risks below should be read in conjunction with the significant issues considered by the Audit Committee discussed on page 46.
Our audit procedures relating to these matters were designed in the context of our audit of the financial statements as a whole, and not to express an opinion on individual accounts or disclosures. Our opinion on the financial statements is not modified with respect to any of the risks described below, and we do not express an opinion on these individual matters.

Alliance Trust PLC Report & Accounts 2014 | 65
RiskHow the scope of our audit responded to the risk Findings
Valuationandownershipoflistedinvestments
Listed investments represent the most significant number on the balance sheet and are the main driver of the Group’s performance. Listed investments represented 91% of total assets of the Group at 31 December 2014 (see notes 9 and 23).
There is a risk that the prices quoted in respect of the listed investments held by the Group may not be reflective of fair value.
Valuation was assessed by understanding the design and implementation of key controls around listed investments and by the testing of 100% of the valuations of listed investments directly with independent pricing sources. Any differences over 1% were investigated further.
We did not identify any differences that exceeded 1% between the prices used by the Group for valuing its listed investments and the independent pricing sources used in our testing.
There is a risk over the recording and custody of listed investments, and whether listed investments recorded are the property of the Group.
We reviewed the SSAE16 controls report to understand the controls in place at the custodian over the ownership of investments. We have also assessed whether the service auditors were professionally competent and that the scope of the controls tested were appropriate to give us assurance over the risk identified.
We tested ownership of 100% of listed investments by confirming the holdings at year end with the independent custodian and reconciling the confirmation to the Group’s accounting records. Any differences were investigated further.
No findings were identified from our testing performed on the SSAE16 controls report.
No findings were identified from our testing of the custodian confirmation.
Valuationofunlistedinvestments
Unlisted investments are valued using methodologies agreed by management and there are key inputs to the valuation calculations which reflect management’s judgement (see note 23). There is a risk that the application of an inappropriate valuation methodology and/or the use of inappropriate assumptions could result in the valuation of unlisted investments being materially misstated.
We tested the design and implementation of controls around the valuation of unlisted investments. In addition we tailored our substantive testing to reflect the different categories of unlisted investments held in the portfolio (see note 23). This testing included reviewing and challenging management’s valuations for a sample of unlisted investments, focusing on the appropriateness of the valuation methodology and assumptions used within the calculations (e.g. cash flow projections; growth projections; discount rate used).
Investments in subsidiaries
We found that the assumptions used in the valuation of the investments in subsidiaries were within a reasonable range and that the methodology applied was appropriate in all material respects. We noted that there was a balanced spread of values within an acceptable range.
Private Equity
We found instances where management had used an incorrect price within their valuation for two private equity investments. We assessed the impact of these errors and concluded that they did not result in a significant difference in the determination of fair value or the overall results recognised. If the correct prices had been used, the net asset position of the Group would be approximately £1.1m lower at 31 December 2014 which we have reported to the audit committee.
Mineral rights
No findings were identified from our testing performed.
66 | Alliance Trust PLC Report & Accounts 2014
Opinion on other matters prescribed by the Companies Act 2006In our opinion:
• thepartoftheDirectors’RemunerationReporttobeaudited has been properly prepared in accordance with the Companies Act 2006; and
• theinformationgivenintheStrategicReportandtheDirectors’ Report for the financial year for which the financial statements are prepared is consistent with the
financial statements.
Mattersonwhichwearerequired to report by exception
AdequacyofexplanationsreceivedandaccountingrecordsUnder the Companies Act 2006 we are required to report to you if, in our opinion:
• wehavenotreceivedalltheinformationandexplanations
we require for our audit; or
• adequateaccountingrecordshavenotbeenkeptbythe
parent company, or returns adequate for our audit have not
been received from branches not visited by us; or
• theparentcompanyfinancialstatementsarenotin
agreement with the accounting records and returns.
We have nothing to report in respect of these matters.
Directors’remunerationUnder the Companies Act 2006 we are also required to report if in our opinion certain disclosures of directors’ remuneration have not been made or the part of the Directors’ Remuneration Report to be audited is not in agreement with the accounting records and returns. We have nothing to report arising from these matters.
CorporateGovernanceStatementUnder the Listing Rules we are also required to review the part of the Corporate Governance Statement relating to the company’s compliance with ten provisions of the UK Corporate Governance Code. We have nothing to report arising from our review.
OurdutytoreadotherinformationintheAnnualReportUnder the International Standards on Auditing (UK and Ireland), we are required to report to you if, in our opinion, information in the annual report is:
• materiallyinconsistentwiththeinformationintheaudited
financial statements; or
• apparentlymateriallyincorrectbasedon,ormaterially
inconsistent with, our knowledge of the Group acquired in
the course of performing our audit; or
• otherwisemisleading.
In particular, we are required to consider whether we have identified any inconsistencies between our knowledge acquired during the audit and the directors’ statement that they consider the annual report is fair, balanced and understandable and whether the annual report appropriately discloses those matters that we communicated to the audit committee which we consider should have been disclosed. We confirm that we have not identified any such inconsistencies or misleading statements.
RiskHow the scope of our audit responded to the risk Findings
ApplicationofIFRS10
IFRS 10 Consolidated Financial Statements, incorporating Investment Entities (Amendments to IFRS 10, IFRS 12 and IAS 27), became effective on 1 January 2014. As disclosed in note 2 the impact of this new accounting standard has had a significant impact on determining the entities which are required to be consolidated within the Group’s financial statements.
There is a risk that management have not fully considered the impact of this new accounting standard which could result in the consolidated financial statements not being prepared in accordance with IFRS 10.
We have reviewed and challenged management’s consideration of the impact of IFRS 10 including their assessment of whether Alliance Trust plc has met the criteria of an investment entity and their subsequent application of investment entities exception to consolidation.
We have tested the consolidation process to assess whether the conclusions reached have been appropriately applied in the preparation of the consolidated financial statements. In addition we have assessed the adequacy of the disclosures presented within the financial statements resulting from the implementation of IFRS 10.
No findings were identified from our testing performed.

Alliance Trust PLC Report & Accounts 2014 | 67
Respective responsibilities of directors and auditorAs explained more fully in the Directors’ Responsibilities Statement, the directors are responsible for the preparation of the financial statements and for being satisfied that they give a true and fair view. Our responsibility is to audit and express an opinion on the financial statements in accordance with applicable law and International Standards on Auditing (UK and Ireland). Those standards require us to comply with the Auditing Practices Board’s Ethical Standards for Auditors. We also comply with International Standard on Quality Control 1 (UK and Ireland). Our audit methodology and tools aim to ensure that our quality control procedures are effective, understood and applied. Our quality controls and systems include our dedicated professional standards review team and independent partner reviews.
This report is made solely to the Company’s members, as a body, in accordance with Chapter 3 of Part 16 of the Companies Act 2006. Our audit work has been undertaken so that we might state to the Company’s members those matters we are required to state to them in an auditor’s report and for no other purpose. To the fullest extent permitted by law, we do not accept or assume responsibility to anyone other than the Company and the Company’s members as a body, for our audit work, for this
report, or for the opinions we have formed.
Scope of the audit of the financial statementsAn audit involves obtaining evidence about the amounts and disclosures in the financial statements sufficient to give reasonable assurance that the financial statements are free from material misstatement, whether caused by fraud or error. This includes an assessment of: whether the accounting policies are appropriate to the Group’s and the Parent Company’s circumstances and have been consistently applied and adequately disclosed; the reasonableness of significant accounting estimates made by the directors; and the overall presentation of the financial statements. In addition, we read all the financial and non-financial information in the annual report to identify material inconsistencies with the audited financial statements and to identify any information that is apparently materially incorrect based on, or materially inconsistent with, the knowledge acquired by us in the course of performing the audit. If we become aware of any apparent material misstatements or inconsistencies we consider the implications for our report.
Calum Thomson (Senior statutory auditor) for and on behalf of Deloitte LLP Chartered Accountants and Statutory Auditor London, United Kingdom
5 March 2015

68 | Alliance Trust PLC Report & Accounts 2014
Financial statements
Consolidated income statement for the year ended 31 December 2014
Year to December 2014
Restated
Year to December 2013
£000 Note Revenue Capital Total Revenue Capital Total
Revenue
Income 3 110,117 - 110,117 103,399 - 103,399
Profit on fair value designated investments - 163,584 163,584 - 415,851 415,851
Profit on investment property - 284 284 - 211 211
Total revenue 110,117 163,868 273,985 103,399 416,062 519,461
Administrative expenses 4 (34,056) (1,154) (35,210) (33,529) (1,388) (34,917)
Finance costs 5 (3,575) (4,163) (7,738) (3,059) (3,137) (6,196)
Gain on disposal of other fixed assets - - - - 14 14
Gain on revaluation of office premises - 240 240 - - -
Foreign exchange losses - (2,752) (2,752) - (15,189) (15,189)
Profit before tax 72,486 156,039 228,525 66,811 396,362 463,173
Tax 6 (3,666) - (3,666) (6,100) (100) (6,200)
Profit for the year 68,820 156,039 224,859 60,711 396,262 456,973
All profit for the year is attributable to equity holders of the parent.
All comparative information, including relevant notes, have been restated to reflect the implementation of Investment Entities (Amendmentsto IFRS 10, IFRS 12 and IAS 27). Refer to note 2 (Basis of accounting) for full details.
Earnings per share attributable to equity holdersof the parent
Basic (p per share) 8 12.39 28.10 40.49 10.85 70.79 81.64
Diluted (p per share) 12.37 28.04 40.41 10.81 70.59 81.40
Consolidated statement of comprehensive income
Year to December 2014
Restated
Year to December 2013
£000 Revenue Capital Total Revenue Capital Total
Profit for the year 68,820 156,039 224,859 60,711 396,262 456,973
Items that will not be reclassified subsequently to profitor loss:
Defined benefit plan net actuarial loss - (1,506) (1,506) - (875) (875)
Retirement benefit obligations deferred tax - 301 301 - 96 96
Other comprehensive loss - (1,205) (1,205) - (779) (779)
Total comprehensive income for the year 68,820 154,834 223,654 60,711 395,483 456,194
All total comprehensive income for the year is attributable to equity holders of the parent.
All comparative information, including relevant notes, have been restated to reflect the implementation of Investment Entities (Amendmentsto IFRS 10, IFRS 12 and IAS 27). Refer to note 2 (Basis of accounting) for full details.

69 | Alliance Trust PLC Report & Accounts 2014
Company income statement for the year ended 31 December 2014
Year to December 2014 Year to December 2013
£000 Note Revenue Capital Total Revenue Capital Total
Revenue
Income 3 95,707 - 95,707 89,994 - 89,994
Profit on fair value designated investments - 163,587 163,587 - 415,851 415,851
Profit on investment property - 284 284 - 211 211
Total revenue 95,707 163,871 259,578 89,994 416,062 506,056
Administrative expenses 4 (19,714) (1,090) (20,804) (20,219) (1,294) (21,513)
Finance costs 5 (3,575) (4,163) (7,738) (3,059) (3,137) (6,196)
Gain on disposal of other fixed assets - - - - 14 14
Gain on revaluation of office premises - 240 240 - - -
Foreign exchange losses - (2,752) (2,752) - (15,189) (15,189)
Profit before tax 72,418 156,106 228,524 66,716 396,456 463,172
Tax 6 (3,666) - (3,666) (6,100) (100) (6,200)
Profit for the year 68,752 156,106 224,858 60,616 396,356 456,972
All profit for the year is attributable to equity holders of the parent.
Earnings per share attributable to equity holdersof the parent
Basic (p per share) 8 12.38 28.11 40.49 10.83 70.80 81.63
Diluted (p per share) 12.35 28.05 40.40 10.80 70.60 81.40
Company statement of comprehensive income
Year to December 2014 Year to December 2013
£000 Revenue Capital Total Revenue Capital Total
Profit for the year 68,752 156,106 224,858 60,616 396,356 456,972
Items that will not be reclassified subsequently to profitor loss:
Defined benefit plan net actuarial loss - (1,506) (1,506) - (875) (875)
Retirement benefit obligations deferred tax - 301 301 - 96 96
Other comprehensive loss - (1,205) (1,205) - (779) (779)
Total comprehensive income for the year 68,752 154,901 223,653 60,616 395,577 456,193
All total comprehensive income for the year is attributable to equity holders of the parent.
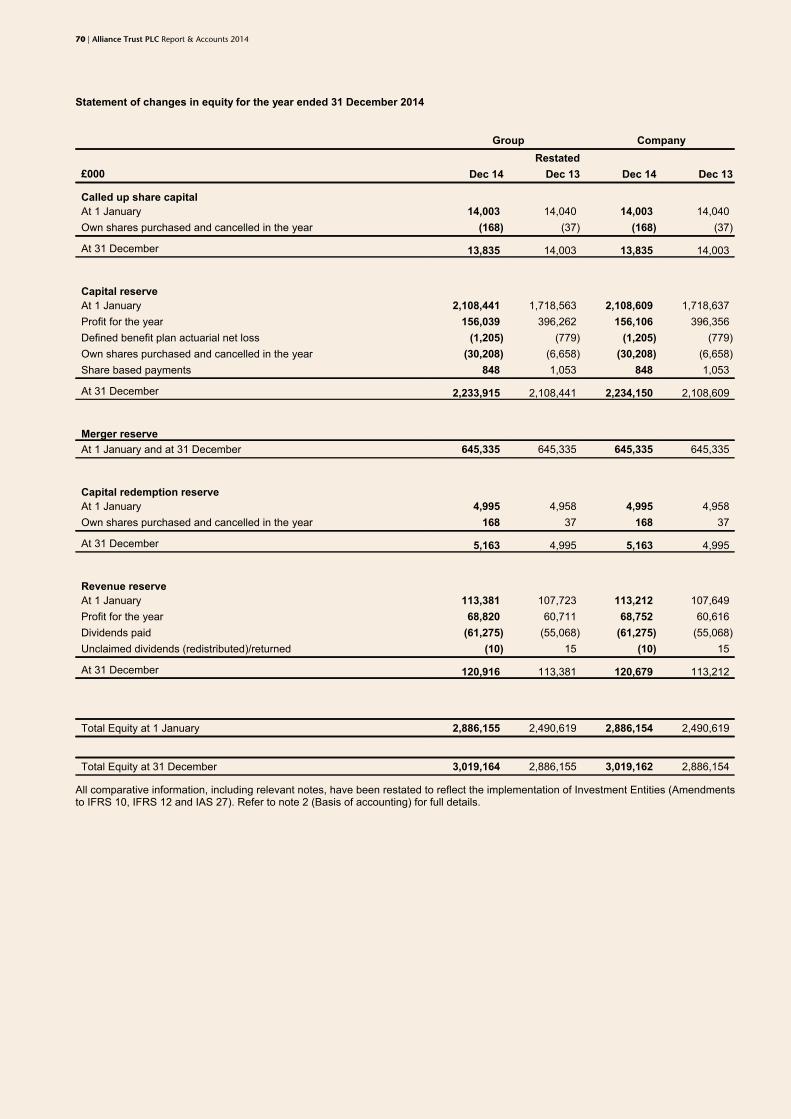
70 | Alliance Trust PLC Report & Accounts 2014
Statement of changes in equity for the year ended 31 December 2014
Group Company
£000 Dec 14
Restated
Dec 13 Dec 14 Dec 13
Called up share capital
At 1 January 14,003 14,040 14,003 14,040
Own shares purchased and cancelled in the year (168) (37) (168) (37)
At 31 December 13,835 14,003 13,835 14,003
Capital reserve
At 1 January 2,108,441 1,718,563 2,108,609 1,718,637
Profit for the year 156,039 396,262 156,106 396,356
Defined benefit plan actuarial net loss (1,205) (779) (1,205) (779)
Own shares purchased and cancelled in the year (30,208) (6,658) (30,208) (6,658)
Share based payments 848 1,053 848 1,053
At 31 December 2,233,915 2,108,441 2,234,150 2,108,609
Merger reserve
At 1 January and at 31 December 645,335 645,335 645,335 645,335
Capital redemption reserve
At 1 January 4,995 4,958 4,995 4,958
Own shares purchased and cancelled in the year 168 37 168 37
At 31 December 5,163 4,995 5,163 4,995
Revenue reserve
At 1 January 113,381 107,723 113,212 107,649
Profit for the year 68,820 60,711 68,752 60,616
Dividends paid (61,275) (55,068) (61,275) (55,068)
Unclaimed dividends (redistributed)/returned (10) 15 (10) 15
At 31 December 120,916 113,381 120,679 113,212
Total Equity at 1 January 2,886,155 2,490,619 2,886,154 2,490,619
Total Equity at 31 December 3,019,164 2,886,155 3,019,162 2,886,154
All comparative information, including relevant notes, have been restated to reflect the implementation of Investment Entities (Amendmentsto IFRS 10, IFRS 12 and IAS 27). Refer to note 2 (Basis of accounting) for full details.

71 | Alliance Trust PLC Report & Accounts 2014
Balance sheet as at 31 December 2014
Group Company
£000 Note Dec 14
Restated
Dec 13
Restated
Dec 12 Dec 14 Dec 13
Non-current assets
Investments held at fair value 9 3,338,832 3,214,386 2,633,918 3,338,910 3,214,461
Investment property held at fair value 9 4,830 4,525 9,120 4,830 4,525
Property, plant and equipment: 9 -
Office premises 4,365 4,125 4,125 4,365 4,125
Other fixed assets 467 249 157 467 249
Intangible assets 11 1,032 814 320 1,032 814
Pension scheme surplus 25 5,197 5,079 4,305 5,197 5,079
Deferred tax asset 12 1,039 1,015 990 1,039 1,015
3,355,762 3,230,193 2,652,935 3,355,840 3,230,268
Current assets
Outstanding settlements and otherreceivables 13 15,492 21,177 14,045 17,013 21,344
Recoverable overseas tax 995 985 - 995 985
Withholding tax debtor - - 1,006 - -
Corporation tax debtor - - 100 - -
Cash and cash equivalents 44,102 27,225 35,561 40,685 25,236
60,589 49,387 50,712 58,693 47,565
Total assets 3,416,351 3,279,580 2,703,647 3,414,533 3,277,833
Current liabilities
Outstanding settlements and other payables 14 (11,984) (7,877) (7,678) (10,168) (6,131)
Tax payable (3,991) (3,991) (3,991) (3,991) (3,991)
Bank loans 15 (280,000) (380,000) (200,000) (280,000) (380,000)
(295,975) (391,868) (211,669) (294,159) (390,122)
Total assets less current liabilities 3,120,376 2,887,712 2,491,978 3,120,374 2,887,711
Non-current liabilities
Unsecured fixed rate loan notes 15 (100,000) - - (100,000) -
Deferred tax liability 12 (1,039) (1,015) (990) (1,039) (1,015)
Finance leases 27 - (110) (102) - (110)
Amounts payable under long term InvestmentIncentive Plan (173) (432) (267) (173) (432)
(101,212) (1,557) (1,359) (101,212) (1,557)
Net assets 3,019,164 2,886,155 2,490,619 3,019,162 2,886,154
Equity
Share capital 16 13,835 14,003 14,040 13,835 14,003
Capital reserve 17 2,233,915 2,108,441 1,718,563 2,234,150 2,108,609
Merger reserve 17 645,335 645,335 645,335 645,335 645,335
Capital redemption reserve 17 5,163 4,995 4,958 5,163 4,995
Revenue reserve 17 120,916 113,381 107,723 120,679 113,212
Total Equity 3,019,164 2,886,155 2,490,619 3,019,162 2,886,154
All net assets are attributable to equity holders of the parent. All comparative information, including relevant notes, have been restated toreflect the implementation of Investment Entities (Amendments to IFRS 10, IFRS 12 and IAS 27). Refer to note 2 (Basis of accounting) forfull details.
Net Asset Value per ordinary share attributable to equity holders of the parent
Basic (£) 18 £5.47 £5.17 £4.45 £5.47 £5.17
Diluted (£) £5.46 £5.15 £4.44 £5.46 £5.15
The financial statements were approved by the Board of Directors and authorised for issue on 5 March 2015.
They were signed on its behalf by:
Karin Forseke Katherine Garrett-Cox
Chair Chief Executive

72 | Alliance Trust PLC Report & Accounts 2014
Cash flow statement for the year ended 31 December 2014
Group Company
£000 Dec 14
Restated
Dec 13 Dec 14 Dec 13
Cash flows from operating activities
Profit before tax 228,525 463,173 228,524 463,172
Adjustments for:
Gains on investments (163,868) (416,062) (163,871) (416,062)
Foreign exchange losses 2,752 15,189 2,752 15,189
Scrip dividends 256 - 256 -
Depreciation 183 169 183 169
Amortisation of intangibles 333 154 333 154
Gains on revaluation of office premises (240) - (240) -
Share based payment expense 848 1,053 848 1,053
Interest 7,738 6,196 7,738 6,196
Movement in pension scheme surplus (1,323) (1,553) (1,323) (1,553)
Operating cash flows before movements in working capital 75,204 68,319 75,200 68,318
Decrease/(Increase) in receivables 735 (2,139) (619) (2,280)
(Decrease)/Increase in payables (1,859) 747 (1,929) 1,125
Net cash flow from operating activities before income taxes 74,080 66,927 72,652 67,163
Taxes paid (3,676) (6,080) (3,676) (6,080)
Net cash inflow from operating activities 70,404 60,847 68,976 61,083
Cash flows from investing activities
Proceeds on disposal at fair value of investments through profit andloss 1,013,121 1,075,550 1,013,121 1,075,550
Purchases of fair value through profit and loss investments (965,415) (1,240,658) (965,415) (1,240,658)
Purchase of plant and equipment (401) (261) (401) (261)
Purchase of other intangible assets (551) (648) (551) (648)
Foreign exchange losses on foreign exchange contracts - (13,993) - (13,993)
Net cash inflow/(outflow) from investing activities 46,754 (180,010) 46,754 (180,010)
Cash flows from financing activities
Dividends paid - Equity (61,275) (55,068) (61,275) (55,068)
Unclaimed dividends (redistributed)/returned (10) 15 (10) 15
Purchase of own shares (30,208) (6,658) (30,208) (6,658)
New bank loans and unsecured fixed rate loan notes raised 100,000 180,000 100,000 180,000
Repayment of borrowing (100,000) - (100,000) -
Interest payable (6,036) (6,266) (6,036) (6,266)
Net cash (outflow)/inflow from financing activities (97,529) 112,023 (97,529) 112,023
Net cash increase/(decrease) in cash and cash equivalents 19,629 (7,140) 18,201 (6,904)
Cash and cash equivalents at beginning of year 27,225 35,561 25,236 33,336
Effect of foreign exchange rate changes (2,752) (1,196) (2,752) (1,196)
Cash and cash equivalents at end of year 44,102 27,225 40,685 25,236
All comparative information, including relevant notes, have been restated to reflect the implementation of Investment Entities (Amendmentsto IFRS 10, IFRS 12 and IAS 27). Refer to note 2 (Basis of accounting) for full details.
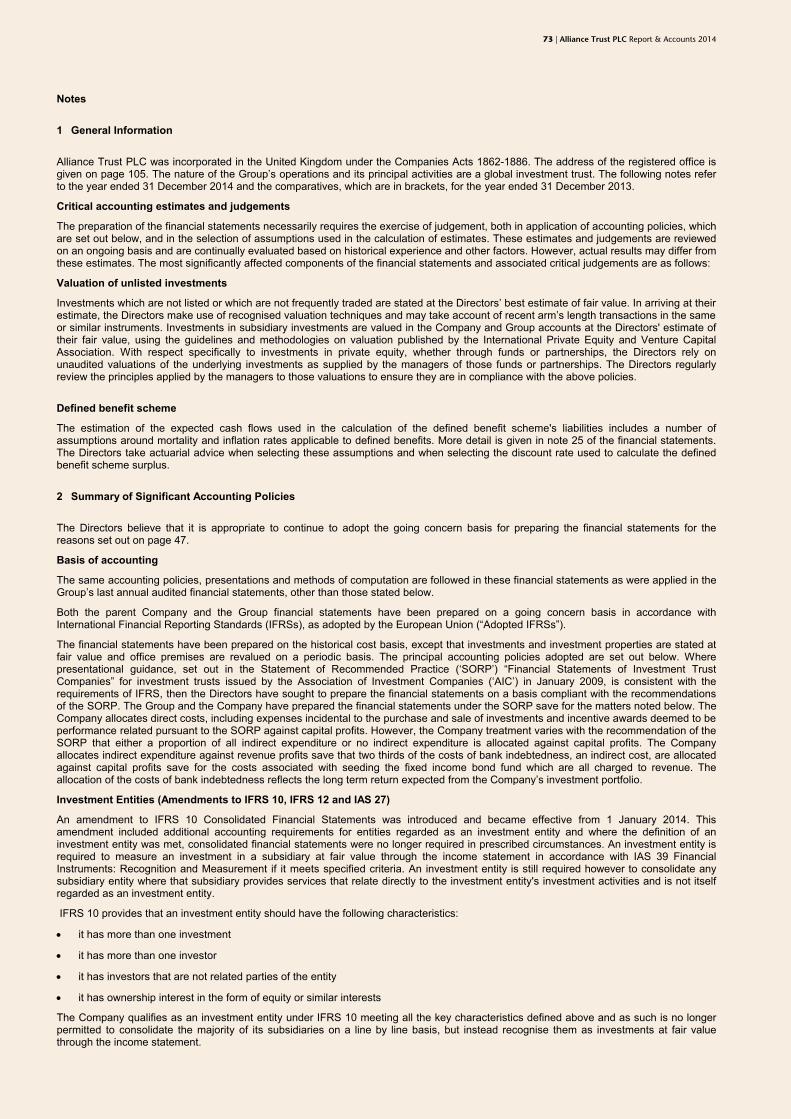
73 | Alliance Trust PLC Report & Accounts 2014
Notes
1 General Information
Alliance Trust PLC was incorporated in the United Kingdom under the Companies Acts 1862-1886. The address of the registered office isgiven on page 105. The nature of the Group’s operations and its principal activities are a global investment trust. The following notes referto the year ended 31 December 2014 and the comparatives, which are in brackets, for the year ended 31 December 2013.
Critical accounting estimates and judgements
The preparation of the financial statements necessarily requires the exercise of judgement, both in application of accounting policies, whichare set out below, and in the selection of assumptions used in the calculation of estimates. These estimates and judgements are reviewedon an ongoing basis and are continually evaluated based on historical experience and other factors. However, actual results may differ fromthese estimates. The most significantly affected components of the financial statements and associated critical judgements are as follows:
Valuation of unlisted investments
Investments which are not listed or which are not frequently traded are stated at the Directors’ best estimate of fair value. In arriving at theirestimate, the Directors make use of recognised valuation techniques and may take account of recent arm’s length transactions in the sameor similar instruments. Investments in subsidiary investments are valued in the Company and Group accounts at the Directors' estimate oftheir fair value, using the guidelines and methodologies on valuation published by the International Private Equity and Venture CapitalAssociation. With respect specifically to investments in private equity, whether through funds or partnerships, the Directors rely onunaudited valuations of the underlying investments as supplied by the managers of those funds or partnerships. The Directors regularlyreview the principles applied by the managers to those valuations to ensure they are in compliance with the above policies.
Defined benefit scheme
The estimation of the expected cash flows used in the calculation of the defined benefit scheme's liabilities includes a number ofassumptions around mortality and inflation rates applicable to defined benefits. More detail is given in note 25 of the financial statements.The Directors take actuarial advice when selecting these assumptions and when selecting the discount rate used to calculate the definedbenefit scheme surplus.
2 Summary of Significant Accounting Policies
The Directors believe that it is appropriate to continue to adopt the going concern basis for preparing the financial statements for thereasons set out on page 47.
Basis of accounting
The same accounting policies, presentations and methods of computation are followed in these financial statements as were applied in theGroup’s last annual audited financial statements, other than those stated below.
Both the parent Company and the Group financial statements have been prepared on a going concern basis in accordance withInternational Financial Reporting Standards (IFRSs), as adopted by the European Union (“Adopted IFRSs”).
The financial statements have been prepared on the historical cost basis, except that investments and investment properties are stated atfair value and office premises are revalued on a periodic basis. The principal accounting policies adopted are set out below. Wherepresentational guidance, set out in the Statement of Recommended Practice (‘SORP’) “Financial Statements of Investment TrustCompanies” for investment trusts issued by the Association of Investment Companies (‘AIC’) in January 2009, is consistent with therequirements of IFRS, then the Directors have sought to prepare the financial statements on a basis compliant with the recommendationsof the SORP. The Group and the Company have prepared the financial statements under the SORP save for the matters noted below. TheCompany allocates direct costs, including expenses incidental to the purchase and sale of investments and incentive awards deemed to beperformance related pursuant to the SORP against capital profits. However, the Company treatment varies with the recommendation of theSORP that either a proportion of all indirect expenditure or no indirect expenditure is allocated against capital profits. The Companyallocates indirect expenditure against revenue profits save that two thirds of the costs of bank indebtedness, an indirect cost, are allocatedagainst capital profits save for the costs associated with seeding the fixed income bond fund which are all charged to revenue. Theallocation of the costs of bank indebtedness reflects the long term return expected from the Company’s investment portfolio.
Investment Entities (Amendments to IFRS 10, IFRS 12 and IAS 27)
An amendment to IFRS 10 Consolidated Financial Statements was introduced and became effective from 1 January 2014. Thisamendment included additional accounting requirements for entities regarded as an investment entity and where the definition of aninvestment entity was met, consolidated financial statements were no longer required in prescribed circumstances. An investment entity isrequired to measure an investment in a subsidiary at fair value through the income statement in accordance with IAS 39 FinancialInstruments: Recognition and Measurement if it meets specified criteria. An investment entity is still required however to consolidate anysubsidiary entity where that subsidiary provides services that relate directly to the investment entity's investment activities and is not itselfregarded as an investment entity.
IFRS 10 provides that an investment entity should have the following characteristics:
it has more than one investment
it has more than one investor
it has investors that are not related parties of the entity
it has ownership interest in the form of equity or similar interests
The Company qualifies as an investment entity under IFRS 10 meeting all the key characteristics defined above and as such is no longerpermitted to consolidate the majority of its subsidiaries on a line by line basis, but instead recognise them as investments at fair valuethrough the income statement.

74 | Alliance Trust PLC Report & Accounts 2014
2 Summary of Significant Accounting Policies
Significant judgements and assumptions in respect of Investment Entities (Amendments to IFRS 10, IFRS 12 and IAS 27)
In previous years, the Alliance Trust Group comprised the Company, 19 wholly owned subsidiaries and an ICVC company in which theCompany held over 50% of the share capital and effectively had control over the fund as it had the power to govern the financial andoperating policies of the fund and as such benefit from its activities. The Investment Entity standard states that if an investment entity has asubsidiary that provides investment-related services or activities, either directly or through a subsidiary, and it is not itself regarded as aninvestment entity, it shall consolidate that subsidiary.
The results that are therefore presented as the 'Consolidated Group', following adoption of Investment Entities (Amendments to IFRS 10,IFRS 12 and IAS 27) are the results of the Company ('Alliance Trust PLC') and Alliance Trust Services Limited ('ATSL'). ATSL is requiredto be consolidated as it provides services that directly relate to the investment activities of the Company however it is not itself aninvestment entity. All other subsidiaries within the Group will be valued at fair value through the income statement as they do not provideservices that relate directly to the investment activities of the Company or they are themselves regarded as an investment entity.
The following subsidiaries have not been consolidated into the Group results and have been valued at fair value through the incomestatement:
NameShares
heldCountry of
incorporation Principal Activity
Alliance Trust Savings Limited ('ATS') Ordinary Scotland Provision and administration ofinvestment and pension products
Alliance Trust Savings (England) Limited ('ATS (England)') Ordinary England Inactive
Alliance Trust (Finance) Limited ('ATF') Ordinary Scotland Asset holding
AT2006 Limited ('AT2006') Ordinary Scotland Intermediate holding company
Second Alliance Trust Limited ('SATL') Ordinary Scotland Inactive
Second Alliance Leasing Limited ('SAL') Ordinary Scotland Inactive
Alliance Trust Real Estate Partners (GP) Limited ('ATREP GP') Ordinary Scotland Real estate general partner
Alliance Trust Real Estate Partners LP ('ATREP LP') - Scotland Limited partnership
Alliance Trust Investments Limited ('ATI') Ordinary Scotland Investment management
Alliance Trust Investments (England) Limited ('ATI (England)') Ordinary England Inactive
Alliance Trust Equity Partners (Holdings) Limited ('ATEP') Ordinary Scotland Intermediate holding company
Alliance Trust Equity Partners Limited ('ATEPL') Ordinary Scotland Investment management
Albany Venture Managers GP Limited ('AVMGP') Ordinary Scotland Private equity general partner
Alliance Trust (PE Manco) Limited ('AT PE Manco') Ordinary Scotland Inactive
ATEP 2008 GP Limited ('ATEP 2008GP') Ordinary Scotland Private equity general partner
ATEP 2009 GP Limited ('ATEP 2009GP') Ordinary Scotland Private equity general partner
Allsec Nominees Limited Ordinary Scotland Nominee
Alliance Trust Savings Nominees Limited Ordinary Scotland Nominee
Alliance Trust Investment Funds ICVC ('ATIF') Ordinary Scotland UK domiciled Open Ended InvestmentCompany
The following table summarises the key adjustments made to the consolidated balance sheet on implementation of the new accountingpolicies:
£000
Balance as at
Dec 12
Impact of changein accounting
policy
Restatedbalance as at
Dec 12
Balance as at
Dec 13
Impact of changein accounting
policy
Restatedbalance as at
Dec 13
Investments at fair valuethrough profit and loss 2,731,162 (88,124) 2,643,038 3,321,630 (102,719) 3,218,911
Total assets 3,212,481 (508,834) 2,703,647 3,852,743 (573,163) 3,279,580
Total liabilities (725,578) 512,550 (213,028) (971,357) 577,932 (393,425)
Net assets 2,486,903 3,716 2,490,619 2,881,386 4,769 2,886,155
Revenue reserve 68,202 39,521 107,723 68,034 45,347 113,381
The effect on the consolidated income statement was as follows:
£000
Balance as at
Dec 12
Impact of changein accounting
policy
Restatedbalance as at
Dec 12
Balance as at
Dec 13
Impact of changein accounting
policy
Restatedbalance as at
Dec 13
Total revenue 325,761 (47,240) 278,521 536,588 (17,127) 519,461
Administrative expenses (42,859) 24,198 (18,661) (47,233) 12,316 (34,917)
Profit for the year 249,645 7,802 257,447 455,571 1,402 456,973
All comparative group information, including primary statements and relevant notes (notes 3,4,5,6,8,9,11,12,13,14,15,16,17,18,20,21,22,23,24 and 26), have been restated.

75 | Alliance Trust PLC Report & Accounts 2014
2 Summary of Significant Accounting Policies
The impact of adopting Investment Entities (Amendments to IFRS 10, IFRS 12 and IAS 27) is the deconsolidation of assets, liabilities,income and expenses of the subsidiary entities which were previously consolidated on a line by line basis. Prior to the adoption of theInvestment Entities standard, the subsidiaries were consolidated on a line by line basis and appropriate consolidation adjustments wereprocessed including eliminating the investments in the subsidiary as fully owned by the Company. Investments in subsidiaries are nowincluded within the investments held at fair value line of the balance sheet with movements recognised through the income statement.
Apart from IFRS 10 Consolidated Financial Statements the same accounting policies, presentations and methods of computation arefollowed in these financial statements as were applied in the Group’s last annual audited financial statements.
Adopted IFRSs
Amendments to the following IFRS's were applicable for the year ended 31 December 2014;
IFRS 10, IFRS 12 and IAS 27 Exemption to prepare consolidated financial statements for Investment Entities (Investment Entities Amendments)
IAS 32 Amendments to financial assets and liabilities disclosures and right to set off
IAS 36 Amendments to disclosures in relation to recoverable amounts of non-financial assets
IAS 39 Amendments to disclosures in relation to hedge accounting.
IFRS's not yet applied
The following standards and interpretations which have been endorsed by the European Union but are not effective for the year ended 31December 2014 and have not been applied in preparing the financial statements but are relevant to the financial statements of the Groupand the Company:
IFRS 9 Financial Instruments
IFRS 15 Revenue from Contracts with Customers
IFRS 11 Accounting for Acquisitions of Interests in Joint Ventures
IAS 16 and IAS 38 Clarification of Acceptable Methods of Depreciation and Amortisation
IAS 19 Defined Benefit Plans: Employee Contributions
IAS 27 Equity Method in Separate Financial Statements
IFRS 10 and IAS 28 Sale or Contribution of Assets between an Investor an Investor and its Associates or Joint Venture
Annual Improvements Cycles Amendments to various standards as part of Annual Improvement Cycle to IFRSs cycle.
Any required changes will be applicable to the financial statements of the Company and Group for the year ended 31 December 2015 andfuture years and are expected to impact the Company and Group’s accounting for financial assets and liabilities and the disclosuresthereof.
The Directors do not believe that the adoption of the standards listed above will have a material impact on the financial statements of theCompany or the Group in future years.
Basis of consolidation
As noted in the Basis of Accounting policy, the retrospective application of the 'Investment Entities' exemption from consolidation requiredby IFRS 10 has resulted in certain subsidiaries being recorded at fair value through the income statement. They are included within the'Investments held at fair value' on the Consolidated Balance Sheet as they are no longer consolidated on a line by line basis.
The Group results incorporate the Company and Alliance Trust Services Limited as it acts as a payment agent and employer for all entitieswithin the corporate structure and as such provides services that relate directly to the investment activities of the Company. All intra-grouptransactions, balances, income and expenses with the entity are eliminated on consolidation.
Presentation of income statement
In order to reflect the activities of an investment trust more accurately, and in accordance with guidance issued by the Association ofInvestment Companies ("AIC"), supplementary information which analyses the income statement between items of a revenue and capitalnature have been presented alongside the income statement. Net capital returns are not distributed by way of a dividend.
Revenue recognition
Dividend income from investments is recognised when the shareholders’ rights to receive payment have been established, normally the ex-dividend date.
Where the Group has elected to receive its dividends in the form of additional shares rather than cash, the amount of cash dividendforegone is recognised as income. Any excess in the value of shares received over the amount of cash dividend foregone is recognised asa capital gain in the income statement.
Rental income from investment property and income from mineral rights is recognised on a time-apportioned basis.
Interest income is accrued on a time-apportioned basis, by reference to the principal outstanding and at the effective interest rateapplicable, which is the rate that exactly discounts estimated future cash receipts through the expected life of the financial asset to thatasset’s net carrying amount.
Special dividends receivable are treated as repayment of capital or as income depending on the facts of each particular case.
Underwriting commission is recognised as earned.
Expenses connected with rental income and mineral rights are included as administrative expenses.

76 | Alliance Trust PLC Report & Accounts 2014
2 Summary of Significant Accounting Policies
Foreign currencies
Transactions in currencies other than Sterling are recorded at the rates of exchange applicable to the dates of the transactions. At eachbalance sheet date, monetary items and non-monetary assets and liabilities that are stated at fair value and are denominated in foreigncurrencies are retranslated at the rates prevailing on the balance sheet date. Gains and losses arising on retranslation are included ascapital net profit or loss for the year where investments are classified as fair value through profit or loss.
Expenses
All expenses are accounted for on an accruals basis. In respect of the analysis between revenue and capital items presented within theincome statement, all expenses have been presented as revenue items except as follows:
Expenses which are incidental to the acquisition of an investment are included within the cost of that investment.
Expenses which are incidental to the disposal of an investment are deducted from the disposal proceeds of that investment.
Annual bonus and Incentive Plan costs which relate to the achievement of investment manager performance objectives and total
shareholder return and net asset value performance objectives are allocated against capital profits and those that relate to the
achievement of other corporate targets or job performance objectives against revenue profits save for those costs associated with the
fixed income bond fund which are all allocated to revenue costs.
The Directors have determined to allocate two thirds of the cost of bank indebtedness incurred to finance investment against capital
profits with the balance being allocated against revenue profits save for those costs associated with the fixed income bond fund which
are all allocated to revenue costs.
Operating leases
Charges for operating leases are debited to the income statement on an accruals basis. Note 26 “Operating lease commitments” disclosesthe commitments to pay charges for leases expiring within 1 year, between 2-5 years and over 5 years.
Share based payments
The Group operates two share based payment schemes, the All Employee Share Ownership Plan (AESOP) and the Long Term IncentivePlans (LTIP). The cost of the AESOP is recognised as a revenue cost in the year. The fair value of options granted to employees under theLTIP is recognised as staff costs, with a corresponding increase in equity, over the year in which the employees become unconditionallyentitled to the options. The amount recognised as an expense may be adjusted to reflect the actual number of share options that vest. Forshare based compensation schemes settled by the Company a recharge equal to the cost during the year is made to subsidiarycompanies.
Investment incentive plan
The Equity Annual Incentive Plan is a discretionary plan for members of the investment team. It consists of matching awards which arebased upon the proportion of annual bonus set aside in the scheme by the participants either in the form of cash or shares in the fundswhich they manage. The awards are settled in cash at the end of a three year performance period subject to meeting predefinedperformance targets.
Pension costs
Employer contributions to pension arrangements for staff are charged to revenue costs.
Contributions in respect of the defined benefit pension scheme are calculated by reference to actuarial valuations carried out for theTrustees at intervals of not more than three years, and represent a charge to cover the accrued liabilities on a continuing basis.
Actuarial gains and losses are recognised in full in the statement of comprehensive income in the year in which they occur.
Taxation
The Company carries on its business as an investment trust and conducts its affairs so as to qualify as such under the provisions ofSections 1158 and 1159 of the Corporation Tax Act 2010.
The tax expense predominantly represents the sum of the withholding tax suffered on foreign dividends.
The tax currently payable is based on taxable profit for the year. Taxable profit differs from net profit as reported in the income statementbecause it excludes items of income or expense that are taxable or deductible in other years and it further excludes items that are nevertaxable or deductible. The Group’s liability for current tax is calculated using tax rates that have been enacted or substantively enacted bythe balance sheet date.
In line with the recommendations of the SORP, the allocation method used to calculate tax relief on expenses presented against capitalreturns in the supplementary information in the income statement is the ‘marginal basis’. Under this basis, if taxable income is capable ofbeing offset entirely by expenses presented in the revenue return column of the income statement, then no tax relief is transferred to thecapital return column.
Deferred tax liabilities are generally recognised for all taxable temporary differences and deferred tax assets are recognised to the extentthat it is probable that taxable profits will be available against which deductible temporary differences can be utilised. Such assets andliabilities are not recognised if the temporary differences arise from the initial recognition of goodwill or from the initial recognition (otherthan in a business combination) of other assets and liabilities in a transaction that affects neither the tax profit nor the accounting profit.
Deferred tax liabilities are recognised for taxable temporary differences arising on investments in subsidiaries and associates and interestsin joint ventures, except where the Group is able to control the reversal of the temporary difference and it is probable that the temporarydifference will not reverse in the foreseeable future.
The carrying amount of deferred tax assets is reviewed at each balance sheet date and reduced to the extent that it is no longer probablethat sufficient taxable profits will be available to allow all or part of the asset to be recovered.

77 | Alliance Trust PLC Report & Accounts 2014
2 Summary of Significant Accounting Policies
Deferred tax is calculated at the tax rates that are expected to apply in the year when the liability is settled or the asset is realised. Deferredtax is charged or credited in the income statement, except when it relates to items charged or credited directly to equity, in which case thedeferred tax is also recorded within equity.
Deferred tax assets and liabilities are offset when there is a legally enforceable right to set off current tax assets against current taxliabilities and where they relate to income taxes levied by the same taxation authority and the Group intends to settle its current tax assetsand liabilities on a net basis.
Neither the Company or the Group recognise deferred tax assets or liabilities on capital profits or losses on the basis that the investmenttrust status of the Company means no tax is due on the capital profits or losses of the Company.
Financial instruments
Financial assets and financial liabilities are recognised on the Group’s balance sheet when the Group becomes a party to the contractualprovisions of the instrument. The Group will only offset financial assets and financial liabilities if it has a legally enforceable right of set offand intends to settle on a net basis.
Derivative financial instruments
The Group’s activities expose it primarily to the financial risks of changes in market prices, foreign currency exchange rates and interestrates. Derivative transactions which the Group may enter include interest rate futures and swaps.
Derivative financial instruments are initially recorded at fair value on the date on which the derivative contract is entered into and aresubsequently remeasured at fair value. The fair value of the forward currency contract is calculated by reference to current forwardexchange rates for contracts of similar maturity dates. Changes in fair value of derivatives financial instruments are recognised in theIncome Statement. The effective portion of change in the fair value of derivatives that are designated and qualify as cash flow hedges isrecognised in other comprehensive income. The gain or loss relating to the ineffective portion is recognised immediately in profit or loss.
Investments
Investments are recognised and derecognised on the trade date where a purchase or sale is made under a contract whose terms requiredelivery within the timeframe established by the market concerned, and are initially measured at cost, including transaction costs.
Investments, which include collective investment schemes, are principally designated as fair value through profit and loss upon initialrecognition (not including transaction costs). Listed investments are measured at subsequent reporting dates at fair value, which is eitherthe bid price or the last traded price, depending on the convention of the exchange on which the investment is quoted.
Investments in property are initially recognised at cost and then valued at fair value based on an independent professional valuation at thereporting date, with changes in fair value recognised through the income statement. Disposals of investment property are recognised whencontracts for sale have been exchanged and the sale has been completed.
Investments which are not listed or which are not frequently traded are valued at the Directors' best estimate of fair value. In arriving at theirestimate, the Directors make use of recognised valuation techniques and may take account of recent arm's length transactions in the sameor similar instruments.
Investments in subsidiary companies are valued in the Company’s accounts at the Directors’ estimate of their fair value, using theguidelines and methodologies on valuation published by the International Private Equity and Venture Capital Association. For investmentsin private equity, the Directors make use of unaudited valuations of the underlying investments as supplied by the managers of thoseprivate equity funds. The Directors regularly review the principles applied by those managers to ensure they are in compliance with theCompany’s policies.
Valuation of mineral rights, included in unlisted investments is based upon the gross income received from the asset in the previous twelvemonths multiplied by appropriate factors for gas and oil. Mineral rights are included in unlisted investments.
Foreign exchange gains and losses for fair-value designated investments are included within the changes in its fair value.
Cash and cash equivalents
Cash and cash equivalents are defined as short term, highly liquid investments that are readily convertible to known amounts of cash.
Other receivables
Other receivables do not carry any interest and are stated at their nominal value as reduced by appropriate allowances for estimatedirrecoverable amounts.
Office premises
Office premises are valued annually by chartered surveyors on the basis of market value in accordance with the RICS Appraisal andValuation Standards. No depreciation has been charged on these assets as, in the opinion of the Board, any provision for depreciationwould be immaterial.
Intangible assets
The external costs associated with the development and procurement of significant technology systems are capitalised where it is probablethat the expected future economic benefit of that system will flow to the entity. They are stated at cost less accumulated amortisation. Onthe completion of each project amortisation is charged so as to write off the value of these assets over periods up to five years.
Other fixed assets
Other fixed assets are held at cost less accumulated depreciation, which is charged to write off the value of the asset over three to fiveyears.

78 | Alliance Trust PLC Report & Accounts 2014
2 Summary of Significant Accounting Policies
Impairment
At each balance sheet date, the Group reviews the carrying amounts of its intangible assets to determine whether there is any indicationthat those assets have suffered an impairment loss. If any such indication exists, the recoverable amount of the asset is estimated todetermine the extent of any impairment loss (if any).
If the recoverable amount of an asset is estimated to be less than its carrying amount, the carrying amount of the asset is reduced to therecoverable amount. An impairment loss is recognised immediately in the income statement, unless the relevant asset is carried at a re-valued amount, in which case the reversal of the impairment is treated as a revaluation decrease.
Financial liabilities and equity
Financial liabilities and equity instruments are classified according to the substance of the contractual arrangements entered into. An equityinstrument is any contract that evidences a residual interest in the assets of the Group after deducting all of its liabilities.
Unsecured fixed rate loan notes and bank borrowings
Interest-bearing bank loans and overdrafts are recorded at the proceeds received, net of direct issue costs. Finance charges, includingpremiums payable on settlement or redemption and direct issue costs, are accounted for through the income statement on an accrualsbasis using the effective interest rate method and are added to the carrying amount of the instrument to the extent that they are not settledin the year in which they arise.
Unsecured fixed rate loan notes are recorded at the proceeds received. After initial recognition, they are subsequently measured atamortised cost using the effective interest method. Finance charges are accounted for through the income statement on an accruals basisusing the effective interest rate method.
Other payables
Other payables are not interest bearing and are stated at their nominal value.
Buy backs and cancellation of shares
The costs of acquiring own shares for cancellation, together with any associated trading costs, are written back to distributable reserves.Share capital is reduced by the nominal value of the shares bought back with an equivalent entry made to the capital redemption reserve.
Realised and unrealised capital reserves
A description of each of the reserves follows:
Capital reserve
The following are recorded through this reserve:
• Gains and losses on realisation of investments
• Changes in fair value of investments
• Realised exchange differences of a capital nature
• Purchases of shares by the Trustee of the Employee Benefit Trust
• Amounts recognised in relation to share based payments which are capital in nature
• Amounts by which other assets and liabilities valued at fair value differ from their book value
• Buy back and cancellation of own shares
• Amounts recognised in relation to the defined benefit pensions scheme
Revaluation reserve
This reserve is used to record changes in the valuation of the office premises. A downward revaluation in office premises is charged to theincome statement to the extent that there is no earlier upward revaluation in this reserve for those premises.
Merger reserve
This reserve was created as part of the arrangements for the acquisition of the assets of SATL.
Capital redemption reserve
This reserve was created on the cancellation and repayment of the Company’s preference share capital. Further movements in this reservereflects the nominal value of the buy back and cancellation of a portion of the share capital of the Company.
Revenue reserve
Net revenue profits and losses of the Company and its subsidiaries and the fair value costs of share based payments which are revenue innature are recorded within this reserve, together with the dividend payments made by the Company.

79 | Alliance Trust PLC Report & Accounts 2014
3 Revenue
An analysis of the Group's and Company's revenue is as follows:
Group Company
£000 Dec 14
Restated
Dec 13 Dec 14 Dec 13
Income from investments *
Listed dividends - UK 18,110 22,275 18,110 22,275
Unlisted dividends - UK - 78 - 78
Distributions from Collective Investment Schemes 12,442 14,132 12,442 14,132
Unlisted dividends - Subsidiaries 8,000 1,000 8,000 1,000
Listed dividends - Overseas 51,600 49,010 51,600 49,010
Unlisted dividends - Overseas - 39 - 39
Interest on fixed income securities - 397 - 397
Scrip dividends 256 - 256 -
90,408 86,931 90,408 86,931
Other income
Property rental income 710 646 710 646
Mineral rights income 4,548 2,303 4,548 2,303
Deposit interest 32 105 26 105
Recharged costs** 14,419 13,414 15 9
19,709 16,468 5,299 3,063
Total income 110,117 103,399 95,707 89,994
Investment income comprises
Listed UK 30,552 36,407 30,552 36,407
Listed Overseas 51,600 49,049 51,600 49,049
Unlisted 8,000 1,078 8,000 1,078
Other 256 397 256 397
90,408 86,931 90,408 86,931
* Designated at fair value through profit and loss on initial recognition.
** ATSL acts as paymaster company and as such the staff costs for the two trading businesses, ATS and ATI, are included in therecharged costs figure noted above as these are recharged by ATSL.
4 Profit before tax is stated after charging the following administrative expenses:
Group
Restated
Group
£000
Dec 14
Revenue
Dec 14
Capital
Dec 14
Total
Dec 13
Revenue
Dec 13
Capital
Dec 13
Total
Staff costs 19,014 1,154 20,168 18,221 1,388 19,609
Social security costs 2,351 - 2,351 2,492 - 2,492
Pension credit - defined benefit scheme* (124) - (124) (149) - (149)
Pension costs - defined contribution scheme 1,710 - 1,710 1,677 - 1,677
22,951 1,154 24,105 22,241 1,388 23,629
ATSL acts as paymaster company and as such the staff costs for the two trading businesses, ATS and ATI, are included in the staff costsfigure noted above and are then recharged by ATSL to the appropriate entity.
Auditor's remuneration
Fee payable to the auditor for the audit of the Company'sannual accounts 69 - 69 57 - 57
Fee payable to the auditor for subsidiary audits 17 - 17 13 - 13
Total audit fees 86 - 86 70 - 70

80 | Alliance Trust PLC Report & Accounts 2014
4 Profit before tax is stated after charging the following administrative expenses:
All other services 4 - 4 18 - 18
Total non-audit fees 4 - 4 18 - 18
Fees payable to the Company's auditor in respect ofassociated pension schemes audit 3 - 3 3 - 3
Total pension audit fees 3 - 3 3 - 3
Total remuneration 93 - 93 91 - 91
Operating lease charges
Land and buildings 81 - 81 114 - 114
Other 23 - 23 36 - 36
Total operating lease charges 104 - 104 150 - 150
Other administrative costs 10,908 - 10,908 11,047 - 11,047
Total administrative costs 34,056 1,154 35,210 33,529 1,388 34,917
Company Company
£000
Dec 14
Revenue
Dec 14
Capital
Dec 14
Total
Dec 13
Revenue
Dec 13
Capital
Dec 13
Total
Staff costs 7,588 1,090 8,678 7,947 1,294 9,241
Social security costs 993 - 993 1,242 - 1,242
Pension credit - defined benefit scheme* (124) - (124) (149) - (149)
Pension costs - defined contribution scheme 682 - 682 717 - 717
9,139 1,090 10,229 9,757 1,294 11,051
Auditor's remuneration
Fee payable to the auditor for the audit of the Company'sannual accounts 69 - 69 57 - 57
Total audit fees 69 - 69 57 - 57
All other services 4 - 4 8 - 8
Total non-audit fees 4 - 4 8 - 8
Fees payable to the Company's auditors in respect ofassociated pension schemes Audit 3 - 3 3 - 3
Total pension audit fees 3 - 3 3 - 3
Total remuneration 76 - 76 68 - 68
Operating lease charges
Land and buildings 81 - 81 114 - 114
Other 23 - 23 36 - 36
Total operating lease charges 104 - 104 150 - 150
Other administrative costs 10,395 - 10,395 10,244 - 10,244
Total administrative costs 19,714 1,090 20,804 20,219 1,294 21,513
*As a result of the closure of the defined benefit scheme to future accrual in the period ended 31 December 2011, the Company and theGroup benefited from a gain to the Income Statement.
As a result of the implementation of Investment Entities (Amendments to IFRS 10, IFRS 12 and IAS 27) which is fully explained in thebasis of accounting note, the Group financial statements no longer include all of the subsidiary entities and as such does not include allaudit fees incurred. In addition to the audit fees paid by the company and consolidated group disclosed above, fees payable to thecompany's auditors for the audit of the non-consolidated subsidiaries amounted to £165,000 (£155,000), with audit related services forthese entities amounting to £31,000 (£34,000).
Total audit fees of £252,000 (£225,000), non-audit fees of £35,000 (£52,000) and fees payable in respect of associated pension schemesof £3,000 (£3,000) were paid to Deloitte LLP. Total remuneration paid to Deloitte LLP amounted to £290,000 (£280,000).
Total Directors’ remuneration was £2.3m (£2.3m). Further details are given on pages 49 to 53. In the year the Group employed an averageof 254 (225) full-time and 14 (12) part-time staff, excluding Directors. The average full time equivalents in the year was 264 (233).
Ongoing charges ratio (OCR) of the Company amounted to 0.60% (0.75%) of the average net assets. Including capital incentives, OCR ofthe Company amounted to 0.64% (0.80%) of the average net assets.
The cost of insured benefits for staff including Executive Directors is included in staff costs.

81 | Alliance Trust PLC Report & Accounts 2014
5 Finance costs
Group
Restated
Group
£000
Dec 14
Revenue
Dec 14
Capital
Dec 14
Total
Dec 13
Revenue
Dec 13
Capital
Dec 13
Total
Bank loans and unsecured fixed rate loan notes 3,575 4,163 7,738 3,059 3,137 6,196
Total finance costs 3,575 4,163 7,738 3,059 3,137 6,196
Company Company
£000
Dec 14
Revenue
Dec 14
Capital
Dec 14
Total
Dec 13
Revenue
Dec 13
Capital
Dec 13
Total
Bank loans and unsecured fixed rate loan notes 3,575 4,163 7,738 3,059 3,137 6,196
Total finance costs 3,575 4,163 7,738 3,059 3,137 6,196
Finance costs include interest of £1.8m (Nil) on the £100m 4.28% unsecured fixed rate loan notes which were drawn down in July 2014 for15 years.
6 Taxation
Group
Restated
Group
£000
Dec 14
Revenue
Dec 14
Capital
Dec 14
Total
Dec 13
Revenue
Dec 13
Capital
Dec 13
Total
UK corporation tax at 21.5% (23.25%) (10) - (10) (19) - (19)
Prior year adjustment (21) - (21) 1 - 1
Overseas taxation 3,396 - 3,396 6,022 100 6,122
3,365 - 3,365 6,004 100 6,104
Deferred taxation 301 - 301 96 - 96
Tax expense for the year 3,666 - 3,666 6,100 100 6,200
Corporation tax is calculated at the average rate of 21.5% (23.25%) of the estimated assessable profit for the year. Taxation for otherjurisdictions is calculated at the rates prevailing in the respective jurisdictions. The charge for the year can be reconciled to the profit perthe income statement as follows:
Group
Restated
Group
£000
Dec 14
Revenue
Dec 14
Capital
Dec 14
Total
Dec 13
Revenue
Dec 13
Capital
Dec 13
Total
Profit before tax 72,486 156,039 228,525 66,811 396,362 463,173
Tax at the average UK corporation tax rate of 21.5%(23.25%) 15,584 33,548 49,132 15,534 92,154 107,688
Non taxable income (16,687) - (16,687) (16,681) - (16,681)
Losses on investments not taxable - (35,232) (35,232) - (96,738) (96,738)
Prior year adjustment (21) - (21) 1 - 1
Foreign exchange adjustments - 592 592 - 3,532 3,532
Effect of changes in tax rates - - - (79) - (79)
Effect of overseas tax 3,396 - 3,396 6,022 100 6,122
Deferred tax assets not recognised 1,424 977 2,401 1,574 780 2,354
Fair value movement in office premises - (52) (52) - - -
Adjustments arising on the difference betweentaxation and accounting treatment of income andexpenses (141) (18) (159) (159) 250 91
Expenses not deductible for tax purposes 122 185 307 76 22 98
Expense relief for overseas tax (11) - (11) (188) - (188)
Tax expense for the year 3,666 - 3,666 6,100 100 6,200

82 | Alliance Trust PLC Report & Accounts 2014
6 Taxation
Company Company
£000
Dec 14
Revenue
Dec 14
Capital
Dec 14
Total
Dec 13
Revenue
Dec 13
Capital
Dec 13
Total
UK corporation tax at 21.5% (23.25%) (10) - (10) (19) - (19)
Prior year adjustment (21) - (21) 1 - 1
Overseas taxation 3,396 - 3,396 6,022 100 6,122
3,365 - 3,365 6,004 100 6,104
Deferred taxation 301 - 301 96 - 96
Tax expense for the year 3,666 - 3,666 6,100 100 6,200
Corporation tax is calculated at the average rate of 21.5% (23.25%) of the estimated assessable profit for the year. Taxation for otherjurisdictions is calculated at the rates prevailing in the respective jurisdictions. The charge for the year can be reconciled to the profit perthe income statement as follows:
Company Company
£000
Dec 14
Revenue
Dec 14
Capital
Dec 14
Total
Dec 13
Revenue
Dec 13
Capital
Dec 13
Total
Profit before tax 72,418 156,106 228,524 66,716 396,456 463,172
Tax at the average UK corporation tax rate of 21.5%(23.25%) 15,570 33,563 49,133 15,511 92,176 107,687
Non taxable income (16,673) - (16,673) (16,658) - (16,658)
Losses on investments not taxable - (35,232) (35,232) - (96,738) (96,738)
Prior year adjustment (21) - (21) 1 - 1
Foreign exchange adjustments - 592 592 - 3,532 3,532
Effect of changes in tax rates - - - (79) - (79)
Effects of overseas tax 3,396 - 3,396 6,022 100 6,122
Deferred tax assets not recognised 1,226 977 2,203 1,120 780 1,900
Fair value movement in office premises - (52) (52) - - -
Adjustments arising on the difference betweentaxation and accounting treatment of income andexpenses 57 (18) 39 295 250 545
Expenses not deductible for tax purposes 122 170 292 76 - 76
Expense relief for overseas tax (11) - (11) (188) - (188)
Tax expense for the year 3,666 - 3,666 6,100 100 6,200
7 Dividends
£000 Dec 14 Dec 13
Fourth interim dividend for the year ended 31 December 2012 of 2.3175p per share - 12,974*
First interim dividend for the year ended 31 December 2013 of 2.387p per share - 13,367
Second interim dividend for the year ended 31 December 2013 of 2.387p per share - 13,368
Third interim dividend for the year ended 31 December 2013 of 2.387p per share - 13,344
Fourth interim dividend for the year ended 31 December 2013 of 2.387p per share 13,338* -
First interim dividend for the year ended 31 December 2014 of 2.4585p per share 13,658 -
Second interim dividend for the year ended 31 December 2014 of 2.4585p per share 13,581 -
Third interim dividend for the year ended 31 December 2014 of 2.4585p per share 13,577 -
54,154 53,053
Special dividend for the year ended 31 December 2012 of 0.36p per share - 2,015
Special dividend for the year ended 31 December 2013 of 1.282p per share 7,121* -
61,275 55,068

83 | Alliance Trust PLC Report & Accounts 2014
7 Dividends
We also set out below the total dividend payable in respect of the financial year, which is the basis on which the requirements of Section1158/1159 of the Corporation Tax Act 2010 are considered.
£000 Dec 14 Dec 13
First interim dividend for the year ended 31 December 2013 of 2.387p per share - 13,367
Second interim dividend for the year ended 31 December 2013 of 2.387p per share - 13,368
Third interim dividend for the year ended 31 December 2013 of 2.387p per share - 13,344
Fourth interim dividend for the year ended 31 December 2013 of 2.387p per share - 13,338*
First interim dividend for the year ended 31 December 2014 of 2.4585p per share 13,658 -
Second interim dividend for the year ended 31 December 2014 of 2.4585p per share 13,581 -
Third interim dividend for the year ended 31 December 2014 of 2.4585p per share 13,577 -
Fourth interim dividend for the year ended 31 December 2014 of 2.4585p per share 13,577 -
54,393 53,417
Special dividend for the year ended 31 December 2013 of 1.282p per share - 7,121*
Special dividend for the year ended 31 December 2014 of 2.546p per share 14,060 -
68,453 60,538
* 31 December 2012 and 31 December 2013 figures have been adjusted to reflect share buy backs.
8 Earnings per share
The calculation of the basic and diluted earnings per share is based on the following data:
Group
Restated
Group
£000
Dec 14
Revenue
Dec 14
Capital
Dec 14
Total
Dec 13
Revenue
Dec 13
Capital
Dec 13
Total
Ordinary shares
Earnings for the purposes of basic earnings pershare being net profit attributable to equity holdersof the parent 68,820 156,039 224,859 60,711 396,262 456,973
Number of shares
Weighted average number of ordinary shares for thepurpose of basic earnings per share 555,308,405 559,789,087
Weighted average number of ordinary shares for thepurpose of diluted earnings per share 556,548,721 561,389,625
Company Company
£000
Dec 14
Revenue
Dec 14
Capital
Dec 14
Total
Dec 13
Revenue
Dec 13
Capital
Dec 13
Total
Ordinary shares
Earnings for the purposes of basic earnings pershare being net profit attributable to equity holdersof the parent 68,752 156,106 224,858 60,616 396,356 456,972
Number of shares
Weighted average number of ordinary shares for thepurpose of basic earnings per share 555,308,405 559,789,087
Weighted average number of ordinary shares for thepurpose of diluted earnings per share 556,548,721 561,389,625
The diluted figure is the weighted average of the entire number of shares in issue.
To arrive at the basic figure, the number of shares has been reduced by 1,131,837 (1,338,233) ordinary shares held by the Trustee of theEmployee Benefit Trust. During the year the Trustee increased its holding by Nil (Nil) shares. 206,396 (431,985) shares were transferredfrom the Employee Benefit Trust to participants in the Long Term Incentive Plans in satisfaction of awards.
IAS 33.41 requires that shares should only be treated as dilutive if they decrease earnings per share or increase the loss per share.
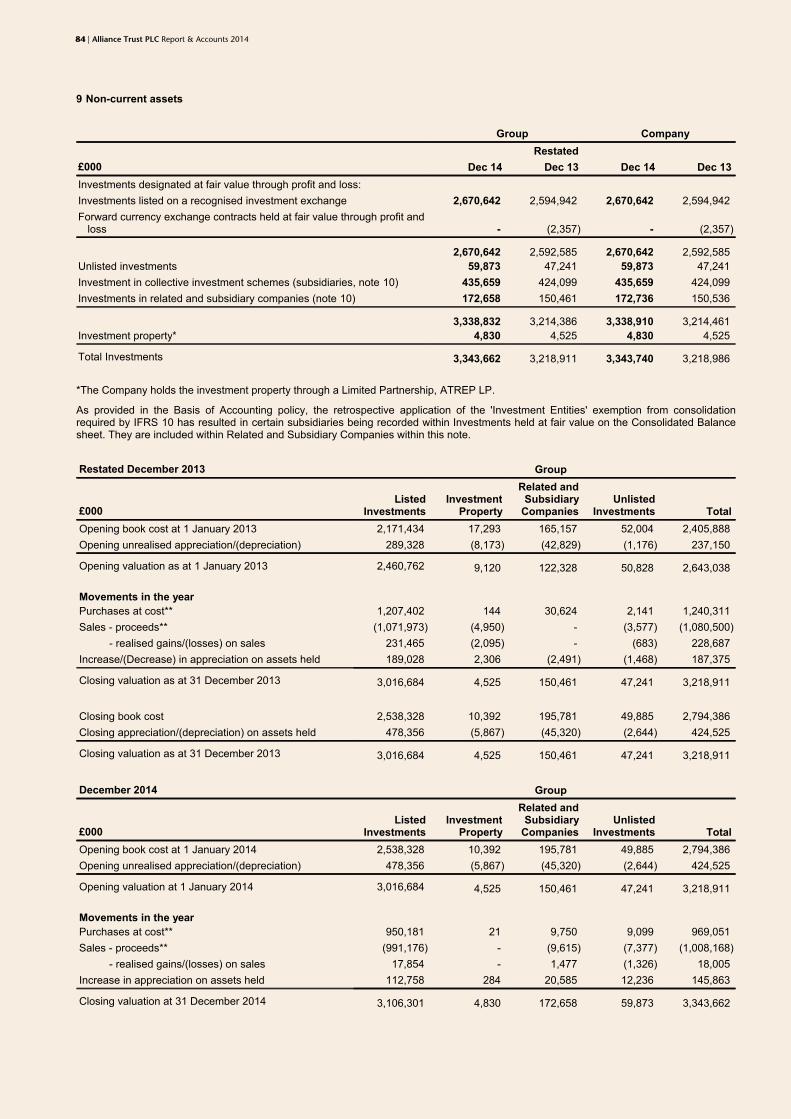
84 | Alliance Trust PLC Report & Accounts 2014
9 Non-current assets
Group Company
£000 Dec 14
Restated
Dec 13 Dec 14 Dec 13
Investments designated at fair value through profit and loss:
Investments listed on a recognised investment exchange 2,670,642 2,594,942 2,670,642 2,594,942
Forward currency exchange contracts held at fair value through profit andloss - (2,357) - (2,357)
2,670,642 2,592,585 2,670,642 2,592,585
Unlisted investments 59,873 47,241 59,873 47,241
Investment in collective investment schemes (subsidiaries, note 10) 435,659 424,099 435,659 424,099
Investments in related and subsidiary companies (note 10) 172,658 150,461 172,736 150,536
3,338,832 3,214,386 3,338,910 3,214,461
Investment property* 4,830 4,525 4,830 4,525
Total Investments 3,343,662 3,218,911 3,343,740 3,218,986
*The Company holds the investment property through a Limited Partnership, ATREP LP.
As provided in the Basis of Accounting policy, the retrospective application of the 'Investment Entities' exemption from consolidationrequired by IFRS 10 has resulted in certain subsidiaries being recorded within Investments held at fair value on the Consolidated Balancesheet. They are included within Related and Subsidiary Companies within this note.
Restated December 2013 Group
£000Listed
InvestmentsInvestment
Property
Related andSubsidiary
CompaniesUnlisted
Investments Total
Opening book cost at 1 January 2013 2,171,434 17,293 165,157 52,004 2,405,888
Opening unrealised appreciation/(depreciation) 289,328 (8,173) (42,829) (1,176) 237,150
Opening valuation as at 1 January 2013 2,460,762 9,120 122,328 50,828 2,643,038
Movements in the year
Purchases at cost** 1,207,402 144 30,624 2,141 1,240,311
Sales - proceeds** (1,071,973) (4,950) - (3,577) (1,080,500)
- realised gains/(losses) on sales 231,465 (2,095) - (683) 228,687
Increase/(Decrease) in appreciation on assets held 189,028 2,306 (2,491) (1,468) 187,375
Closing valuation as at 31 December 2013 3,016,684 4,525 150,461 47,241 3,218,911
Closing book cost 2,538,328 10,392 195,781 49,885 2,794,386
Closing appreciation/(depreciation) on assets held 478,356 (5,867) (45,320) (2,644) 424,525
Closing valuation as at 31 December 2013 3,016,684 4,525 150,461 47,241 3,218,911
December 2014 Group
£000Listed
InvestmentsInvestment
Property
Related andSubsidiary
CompaniesUnlisted
Investments Total
Opening book cost at 1 January 2014 2,538,328 10,392 195,781 49,885 2,794,386
Opening unrealised appreciation/(depreciation) 478,356 (5,867) (45,320) (2,644) 424,525
Opening valuation at 1 January 2014 3,016,684 4,525 150,461 47,241 3,218,911
Movements in the year
Purchases at cost** 950,181 21 9,750 9,099 969,051
Sales - proceeds** (991,176) - (9,615) (7,377) (1,008,168)
- realised gains/(losses) on sales 17,854 - 1,477 (1,326) 18,005
Increase in appreciation on assets held 112,758 284 20,585 12,236 145,863
Closing valuation at 31 December 2014 3,106,301 4,830 172,658 59,873 3,343,662

85 | Alliance Trust PLC Report & Accounts 2014
9 Non-current assets
December 2014 Group
£000Listed
InvestmentsInvestment
Property
Related andSubsidiary
CompaniesUnlisted
Investments Total
Closing book cost 2,515,187 10,413 197,393 50,281 2,773,274
Closing appreciation/(depreciation) on assets held 591,114 (5,583) (24,735) 9,592 570,388
Closing valuation as at 31 December 2014 3,106,301 4,830 172,658 59,873 3,343,662
December 2013 Company
£000Listed
InvestmentsInvestment
Property
Related andSubsidiarycompanies
UnlistedInvestments Total
Opening book cost as at 1 January 2013 2,171,434 17,293 165,157 52,004 2,405,888
Opening unrealised appreciation/(depreciation) 289,328 (8,173) (42,754) (1,176) 237,225
Opening valuation as at 1 January 2013 2,460,762 9,120 122,403 50,828 2,643,113
Movements in the year
Purchases at cost** 1,207,402 144 30,624 2,141 1,240,311
Sales - proceeds** (1,071,973) (4,950) - (3,577) (1,080,500)
- realised gains/(losses) on sales 231,465 (2,095) - (683) 228,687
Increase/(Decrease) in appreciation on assets held 189,028 2,306 (2,491) (1,468) 187,375
Closing valuation as at 31 December 2013 3,016,684 4,525 150,536 47,241 3,218,986
Closing book cost 2,538,328 10,392 195,781 49,885 2,794,386
Closing appreciation/(depreciation) on assets held 478,356 (5,867) (45,245) (2,644) 424,600
Closing valuation as at 31 December 2013 3,016,684 4,525 150,536 47,241 3,218,986
December 2014 Company
£000Listed
InvestmentsInvestment
Property
Related andSubsidiarycompanies
UnlistedInvestments Total
Opening book cost as at 1 January 2014 2,538,328 10,392 195,781 49,885 2,794,386
Opening unrealised appreciation/(depreciation) 478,356 (5,867) (45,245) (2,644) 424,600
Opening valuation as at 1 January 2014 3,016,684 4,525 150,536 47,241 3,218,986
Movements in the year
Purchases at cost** 950,181 21 9,750 9,099 969,051
Sales - proceeds** (991,176) - (9,615) (7,377) (1,008,168)
- realised gains/(losses) on sales 17,854 - 1,477 (1,326) 18,005
Increase in appreciation on assets held 112,758 284 20,588 12,236 145,866
Closing valuation as at 31 December 2014 3,106,301 4,830 172,736 59,873 3,343,740
Closing book cost 2,515,187 10,413 197,393 50,281 2,773,274
Closing appreciation/(depreciation) on assets held 591,114 (5,583) (24,657) 9,592 570,466
Closing valuation as at 31 December 2014 3,106,301 4,830 172,736 59,873 3,343,740
** Expenses incidental to the purchase or sale of investments are included within the purchase cost or deducted from the sale proceeds.These expenses amount to £1.4m (£3.0m) for purchases and £1.3m (£1.9m) for sales.
The investment properties were valued as at 31 December 2014 by DTZ on the basis of market value. The valuation was in accordancewith RICS Appraisal and Valuation Standards. The historic cost of the investment property is £10.7m (£10.7m).
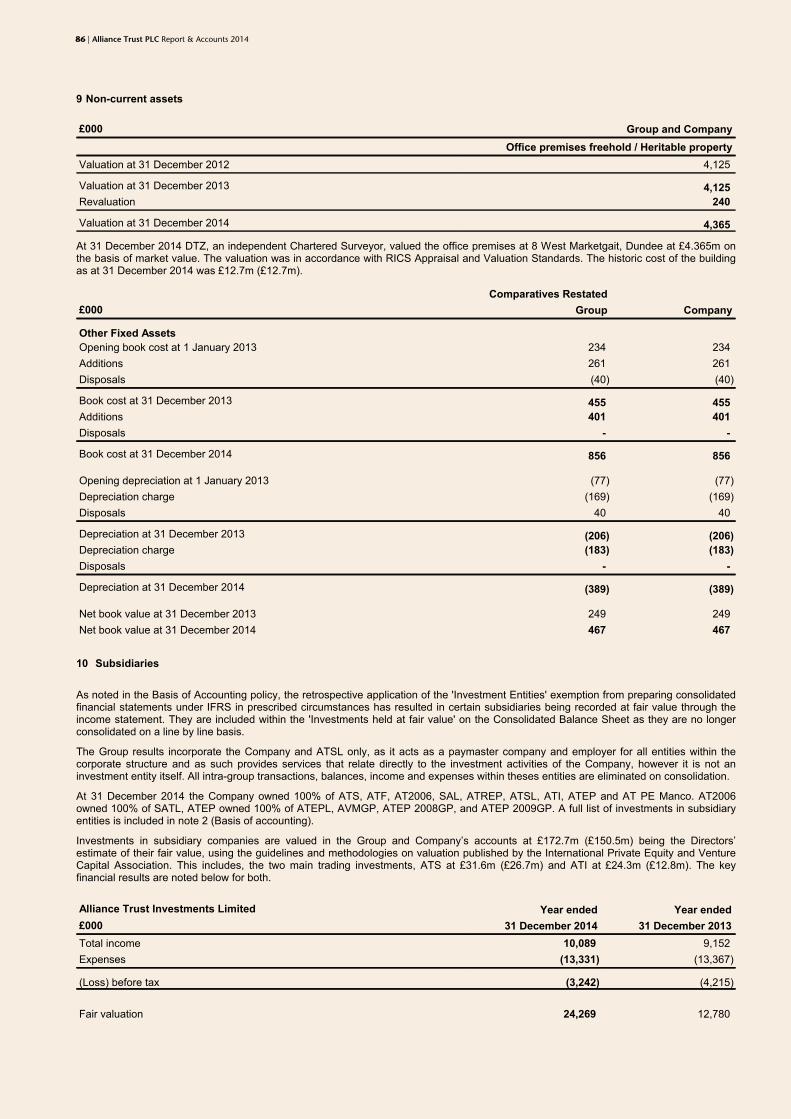
86 | Alliance Trust PLC Report & Accounts 2014
9 Non-current assets
£000 Group and Company
Office premises freehold / Heritable property
Valuation at 31 December 2012 4,125
Valuation at 31 December 2013 4,125
Revaluation 240
Valuation at 31 December 2014 4,365
At 31 December 2014 DTZ, an independent Chartered Surveyor, valued the office premises at 8 West Marketgait, Dundee at £4.365m onthe basis of market value. The valuation was in accordance with RICS Appraisal and Valuation Standards. The historic cost of the buildingas at 31 December 2014 was £12.7m (£12.7m).
£000
Comparatives Restated
Group Company
Other Fixed Assets
Opening book cost at 1 January 2013 234 234
Additions 261 261
Disposals (40) (40)
Book cost at 31 December 2013 455 455
Additions 401 401
Disposals - -
Book cost at 31 December 2014 856 856
Opening depreciation at 1 January 2013 (77) (77)
Depreciation charge (169) (169)
Disposals 40 40
Depreciation at 31 December 2013 (206) (206)
Depreciation charge (183) (183)
Disposals - -
Depreciation at 31 December 2014 (389) (389)
Net book value at 31 December 2013 249 249
Net book value at 31 December 2014 467 467
10 Subsidiaries
As noted in the Basis of Accounting policy, the retrospective application of the 'Investment Entities' exemption from preparing consolidatedfinancial statements under IFRS in prescribed circumstances has resulted in certain subsidiaries being recorded at fair value through theincome statement. They are included within the 'Investments held at fair value' on the Consolidated Balance Sheet as they are no longerconsolidated on a line by line basis.
The Group results incorporate the Company and ATSL only, as it acts as a paymaster company and employer for all entities within thecorporate structure and as such provides services that relate directly to the investment activities of the Company, however it is not aninvestment entity itself. All intra-group transactions, balances, income and expenses within theses entities are eliminated on consolidation.
At 31 December 2014 the Company owned 100% of ATS, ATF, AT2006, SAL, ATREP, ATSL, ATI, ATEP and AT PE Manco. AT2006owned 100% of SATL, ATEP owned 100% of ATEPL, AVMGP, ATEP 2008GP, and ATEP 2009GP. A full list of investments in subsidiaryentities is included in note 2 (Basis of accounting).
Investments in subsidiary companies are valued in the Group and Company’s accounts at £172.7m (£150.5m) being the Directors’estimate of their fair value, using the guidelines and methodologies on valuation published by the International Private Equity and VentureCapital Association. This includes, the two main trading investments, ATS at £31.6m (£26.7m) and ATI at £24.3m (£12.8m). The keyfinancial results are noted below for both.
Alliance Trust Investments Limited
£000
Year ended
31 December 2014
Year ended
31 December 2013
Total income 10,089 9,152
Expenses (13,331) (13,367)
(Loss) before tax (3,242) (4,215)
Fair valuation 24,269 12,780

87 | Alliance Trust PLC Report & Accounts 2014
10 Subsidiaries
Alliance Trust Savings Limited
£000
Year ended
31 December 2014
Year ended
31 December 2013
Total income 12,831 10,930
Continuing expenses (12,609) (10,518)
Profit on continuing operations before tax 222 412
Non-recurring expenses (3,524) (2,047)
(Loss) on continuing operations including non-recurring expenses before tax (3,302) (1,635)
Discontinued expenses (441) (1,243)
Gain on sale of Full SIPP/SASS businesses - 6,668
(Loss)/Profit before tax (3,743) 3,790
Fair valuation 31,573 26,708
The fair valuation represents the Directors' view of the amount for which the subsidiaries could be exchanged between knowledgeablewilling parties in an arm's length transaction. This does not assume that the underlying business is saleable at the reporting date or thatthe Company has any current intention to sell the subsidiary business in the future.
The Directors have used several valuation methodologies as described in the guidelines to arrive at their best estimate of fair value,including discounted cash flow calculations, revenue and earnings multiples and recent market transactions where available. Note 23.8provides further information on the valuation methodologies applied.
The Company has invested in the sub-funds of Alliance Trust Investment Funds ICVC (‘ATIF’), a UK domiciled Open Ended InvestmentCompany (OEIC), two sub-funds in Alliance Trust Sustainable Future ICVC ('ATSF'), a UK domiciled Open Ended Investment Company(OEIC), and in a sub-fund of Luxcellence, a Luxembourg domiciled Société d’Investissement à Capital Variable (SICAV). As at 31December 2014 the Company held the following proportions of each fund. The value of the shares held by the Company is also givenbelow:
Dec 14
Proportion %
Dec 14
Value £000
Dec 13
Proportion %
Dec 13
Value £000
ATIF - Monthly Income Bond Fund 37 122,887 50 165,257
ATIF - Global Thematic Opportunities Fund 99 183,152 97 205,492
ATIF - Dynamic Bond Fund 60 52,850 88 53,350
ATSF - Sustainable Future Cautious Managed Fund 97 10,600 - -
ATSF - Sustainable Future Defensive Managed Fund 98 10,600 - -
Luxcellence - Alliance Trust Sustainable Future Pan-European Equity Fund 50 55,570 - -
- 435,659 - 424,099
11 Intangible assets
Comparatives Restated
Group Company
£000 Technology systems Technology systems
Opening book cost at 1 January 2013 2,537 2,537
Additions 648 648
Book cost at 31 December 2013 3,185 3,185
Additions 551 551
Impairment (1,654) (1,654)
Book cost at 31 December 2014 2,082 2,082
Opening amortisation at 1 January 2013 (2,217) (2,217)
Amortisation (154) (154)
Amortisation at 31 December 2013 (2,371) (2,371)
Amortisation (333) (333)
Impairment 1,654 1,654
Amortisation as at 31 December 2014 (1,050) (1,050)
Carrying amount as at 31 December 2013 814 814
Carrying amount as at 31 December 2014 1,032 1,032
Amortisation is included within administrative expenses in the income statement.

88 | Alliance Trust PLC Report & Accounts 2014
12 Deferred tax
The following are the major deferred tax liabilities and assets recognised by the Group and Company and movements thereon during thecurrent and prior reporting period:
Group (Comparatives Restated)
£000
Retirementbenefit
obligations
AcceleratedTax
Depreciation Losses Foreign Tax Other Total
At 1 January 2013 - (liability)/asset (990) - 990 - - -
Income statement - deferred tax credit 209 - 154 - - 363
Income statement - deferred tax charge (330) - (129) - - (459)
Equity - deferred tax credit 175 - - - - 175
Equity - deferred tax charge (79) - - - - (79)
At 31 December 2013 - (liability)/asset (1,015) - 1,015 - - -
Income statement - deferred tax credit - - 24 - - 24
Income statement - deferred tax charge (325) - - - - (325)
Equity - deferred tax credit 301 - - - - 301
At 31 December 2014 - (liability)/asset (1,039) - 1,039 - - -
At the balance sheet date, the Group had unused tax losses of £40.8m (£31.1m) available for offset against future profits.
There are unrecognised deferred tax assets of £8.2m (£6.2m) in relation to unused tax losses and £0.2m (£0.1m) in relation to fixed assetsand other timing differences.
The Directors have not recognised the deferred tax asset due to uncertainty over the timing of future profits.
Company
£000
Retirementbenefit
obligations
AcceleratedTax
Depreciation Losses Foreign Tax Other Total
At 1 January 2013 - (liability)/asset (990) - 990 - - -
Income statement - deferred tax credit 209 - 154 - - 363
Income statement - deferred tax charge (330) - (129) - - (459)
Equity - deferred tax credit 175 - - - - 175
Equity - deferred tax charge (79) - - - - (79)
At 31 December 2013 - (liability)/asset (1,015) - 1,015 - - -
Income statement - deferred tax credit - - 24 - - 24
Income statement - deferred tax charge (325) - - - - (325)
Equity - deferred tax credit 301 - - - - 301
At 31 December 2014 - (liability)/asset (1,039) - 1,039 - - -
At the balance sheet date, the Company had unused tax losses of £37.9m (£29.1m) available for offset against future profits.
There are unrecognised deferred tax assets of £7.6m (£5.8m) in relation to unused tax losses and £0.2m (£0.1m) in relation to fixed assetsand other timing differences.
The Directors have not recognised the deferred tax asset due to uncertainty over the timing of future profits.
13 Outstanding settlements and other receivables
Group Company
£000 Dec 14
Restated
Dec 13 Dec 14 Dec 13
Sales of investments awaiting settlement - 4,950 - 4,950
Dividends receivable 4,636 5,123 4,636 5,123
Other income receivable 459 306 459 306
Amounts due from subsidiary companies 7,270 9,093 9,183 9,480
Other debtors 3,127 1,705 2,735 1,485
15,492 21,177 17,013 21,344
The Directors consider that the carrying amount of other receivables approximates to their fair value.

89 | Alliance Trust PLC Report & Accounts 2014
13 Outstanding settlements and other receivables
Of the amounts due from subsidiary companies, £7.3m (£9.1m) for the Group and £9.2m (£9.5m) for the Company, £7.1m is due aftermore than one year relating to a perpetual subordinated loan from the Company to ATS. In January 2015 the ATS Board approved, subjectto regulatory approval, repayment of the subordinated loan and the Company Board agreed to use the loan repayment proceeds tosubscribe to additional share capital in ATS.
14 Outstanding settlements and other payables
Group Company
£000 Dec 14
Restated
Dec 13 Dec 14 Dec 13
Purchases of investments awaiting settlement 3,892 - 3,892 -
Amounts due to subsidiary companies 624 1,582 664 1,167
Other creditors 5,252 6,295 3,396 4,964
Interest payable 2,216 - 2,216 -
11,984 7,877 10,168 6,131
The Directors consider that the carrying amount of other payables approximates to their fair value.
15 Bank loans and unsecured fixed rate loan notes
Bank loans Group Company
£000 Dec 14
Restated
Dec 13 Dec 14 Dec 13
Bank loans repayable within one year 280,000 380,000 280,000 380,000
Analysis of borrowings by currency:
Bank loans - sterling 280,000 380,000 280,000 380,000
The weighted average % interest rates payable:
Bank loans 1.49% 1.81% 1.49% 1.81%
The Directors estimate the fair value of the borrowings to be:
Bank loans 280,000 380,000 280,000 380,000
Unsecured fixed rate notes Group Company
£000 Dec 14 Dec 13 Dec 14 Dec 13
Unsecured fixed rate loan notes 100,000 - 100,000 -
The effective interest rate payable:
Unsecured fixed rate loan notes 4.30% -% 4.30% -%
£100m of unsecured fixed loan notes were drawn down in July 2014, over 15 years at 4.28%. The fair value at 31 December 2014 was£110.2m.
The total weighted average % interest rate 2.23% 1.81% 2.23% 1.81%
16 Share capital
Group Company
£000 Dec 14
Restated
Dec 13 Dec 14 Dec 13
Allotted, called up and fully paid:
- 553,359,146 ordinary shares of 2.5p each 13,835 14,003 13,835 14,003
The Company has one class of ordinary share which carries no right to fixed income.
The Employee Benefit Trust holds 1,131,837 (1,338,233) ordinary shares, acquired by its Trustee with funds provided by the Company.During the year the Trustee increased its holding by Nil (Nil) shares. 206,396 (431,985) shares were transferred from the Employee BenefitTrust to participants in the Long Term Incentive Plans in satisfaction of awards.

90 | Alliance Trust PLC Report & Accounts 2014
16 Share capital
Group Company
£000 Dec 14
Restated
Dec 13 Dec 14 Dec 13
Ordinary shares of 2.5p each
Opening share capital 14,003 14,040 14,003 14,040
Share buy backs (168) (37) (168) (37)
Closing share capital 13,835 14,003 13,835 14,003
Capital Management Policies and Procedures
The capital of the Company is managed in accordance with its investment policy in pursuit of its investment objective, both of which aredetailed on page 61. This is undertaken by the Asset Allocation Committee within parameters set by the Board.
The Group, Company and the remaining financial services subsidiary investments comply with the capital requirements of their relevantregulators, including the Capital Requirements Directive and the Alternative Investment Fund Managers Directive.
17 Reserves
Group (Comparatives Restated)
£000Share
CapitalCapital
ReserveMerger
Reserve
CapitalRedemption
ReserveRevenueReserve Total
Net assets at 31 December 2012 14,040 1,718,563 645,335 4,958 107,723 2,490,619
Dividends - - - - (55,068) (55,068)
Unclaimed dividends returned - - - - 15 15
Profit for the year - 396,262 - - 60,711 456,973
Own shares purchased (37) (6,658) - 37 - (6,658)
Defined benefit plan net actuarial loss - (779) - - - (779)
Share based payments - 1,053 - - - 1,053
Net assets at 31 December 2013 14,003 2,108,441 645,335 4,995 113,381 2,886,155
Dividends - - - - (61,275) (61,275)
Unclaimed dividends redistributed - - - - (10) (10)
Profit for the year - 156,039 - - 68,820 224,859
Own shares purchased (168) (30,208) - 168 - (30,208)
Defined benefit plan net actuarial loss - (1,205) - - - (1,205)
Share based payments - 848 - - - 848
Net assets at 31 December 2014 13,835 2,233,915 645,335 5,163 120,916 3,019,164
Company
£000Share
CapitalCapital
ReserveMerger
Reserve
CapitalRedemption
ReserveRevenueReserve Total
Net assets at 31 December 2012 14,040 1,718,637 645,335 4,958 107,649 2,490,619
Dividends - - - - (55,068) (55,068)
Unclaimed dividends returned - - - - 15 15
Profit for the year - 396,356 - - 60,616 456,972
Own shares purchased (37) (6,658) - 37 - (6,658)
Defined benefit plan net actuarial loss - (779) - - - (779)
Share based payments - 1,053 - - - 1,053
Net assets at 31 December 2013 14,003 2,108,609 645,335 4,995 113,212 2,886,154
Dividends - - - - (61,275) (61,275)
Unclaimed dividends redistributed - - - - (10) (10)
Profit for the year - 156,106 - - 68,752 224,858
Own shares purchased (168) (30,208) - 168 - (30,208)
Defined benefit plan net actuarial loss - (1,205) - - - (1,205)
Share based payments - 848 - - - 848
Net assets at 31 December 2014 13,835 2,234,150 645,335 5,163 120,679 3,019,162
The reserves distributable by way of a dividend are £120.7m (£113.2m) which is represented by the revenue reserve as it is policy to onlypay dividends out of revenue reserves. Capital reserves can be distributed by way of a dividend. Share buy backs are funded throughrealised capital reserves.

91 | Alliance Trust PLC Report & Accounts 2014
18 Net Asset Value per Ordinary Share
The calculation of the net asset value per ordinary share is based on the following:
Group Company
£000 Dec 14
Restated
Dec 13 Dec 14 Dec 13
Equity shareholder funds 3,019,164 2,886,155 3,019,162 2,886,154
Number of shares at year end - Basic 552,227,309 558,755,913 552,227,309 558,755,913
Number of shares at year end - Diluted 553,359,146 560,094,146 553,359,146 560,094,146
The diluted figure is the entire number of shares in issue.
To arrive at the basic figure, the number of shares has been reduced by 1,131,837 (1,338,233) shares held by the Trustee of the EmployeeBenefit Trust. During the year the Trustee increased its holding by Nil (Nil) shares. 206,396 (431,985) shares were transferred from theEmployee Benefit Trust to participants in the LTIP in satisfaction of awards.
19 Segmental Reporting
Alliance Trust PLC has identified a single operating segment, the investment trust which aims to maximise our shareholder's returns. Theaccounting policies of the operating segment, which operates in the UK, are the same as those described in the summary of significantaccounting policies. Alliance Trust PLC evaluates performance based on the total profit before tax which is shown in the Company IncomeStatement on page 69.
20 Related Party Transactions
Transactions between the Company and ATSL are eliminated on consolidation.
Other subsidiaries within the Corporate Group may purchase goods or services for other entities within the Group and recharge these costsdirectly to the appropriate entity to which the costs relate to.
There are no other related parties other than the members of the Corporate Group.
During the year the following amounts were reimbursed/(repaid) between ATSL and other entities as it acts as paymaster and employer forall corporate entities.
£000
Year ended
31 December 2014
Year ended
31 December 2013
Paid by Alliance Trust (the Company) 21,450 19,210
Paid to Alliance Trust (the Company) (11,699) (13,116)
9,751 6,094
Paid by Alliance Trust Savings Limited 20,913 15,179
Paid to Alliance Trust Savings Limited (478) (332)
20,435 14,847
Paid by Alliance Trust Investments Limited 16,639 13,590
Paid to Alliance Trust Investments Limited (180) (509)
16,459 13,081
Paid by Alliance Trust Equity Partners (Holdings) Limited 32 196
Paid to Alliance Trust Equity Partners (Holdings) Limited (8) (60)
24 136
Paid by Alliance Trust Equity Partners Limited 63 -
Paid to Alliance Trust Equity Partners Limited (10) -
53 -
Paid by Alliance Trust (Finance) Limited 4,001 4,002
Paid to Alliance Trust (Finance) Limited (6,000) (4,000)
(1,999) 2
Paid by Alliance Trust Real Estate Partners LP 240 320
Paid to Alliance Trust Real Estate Partners LP (16) (11)
224 309
Transactions with key management personnel
Details of the Executive and Non Executive Directors are disclosed on pages 36 to 37. Their remuneration and other compensationincluding pension cost is summarised below.
For the purpose of IAS 24 ‘Related Party Disclosures, key management personnel comprise the members of the Executive Committee (theChief Executive and senior management) plus the Non Executive Directors of the Company.

92 | Alliance Trust PLC Report & Accounts 2014
20 Related Party Transactions
Group Company
£000 Dec 14
Restated
Dec 13 Dec 14 Dec 13
Total emoluments 2,952 3,145 2,410 2,265
Payments to former key management personnel - 341 - -
Post retirement benefits 68 84 43 11
Equity compensation benefits 730 669 730 669
3,750 4,239 3,183 2,945
21 Analysis of change in net cash/(debt)
Group (Comparatives Restated)
£000 Dec 12 Cash flowExchange
gains Dec 13 Cash flowExchange
gains Dec 14
Cash and cash equivalents 35,561 (7,140) (1,196) 27,225 19,629 (2,752) 44,102
Bank loans and unsecured fixed rateloan notes (200,000) (180,000) - (380,000) - - (380,000)
Net (debt)/cash (164,439) (187,140) (1,196) (352,775) 19,629 (2,752) (335,898)
Company
£000 Dec 12 Cash flowExchange
gains Dec 13 Cash flowExchange
gains Dec 14
Cash and cash equivalents 33,336 (6,904) (1,196) 25,236 18,201 (2,752) 40,685
Bank loans and unsecured fixed rateloan notes (200,000) (180,000) - (380,000) - - (380,000)
Net (debt)/cash (166,664) (186,904) (1,196) (354,764) 18,201 (2,752) (339,315)
22 Financial commitments
Financial commitments as at 31 December 2014, which have not been accrued, for the Group and the Company totaled £48.9m (£41.8m).
These were in respect of uncalled subscriptions in investments structured as limited partnerships (LP) of which £48.9m (£41.8m) relates toinvestments in our private equity portfolio. These LP commitments, which can include recallable distributions received, may be called atany time up to an agreed contractual date. The Company may choose not to fulfil individual commitments but may suffer a penalty should itdo so, the terms of which vary between investments.
A maturity analysis of the expiry dates of these LP commitments is presented below:
Group and Company
£000 Dec 14
Restated
Dec 13
< 1 year 215 215
1-5 years 29,792 27,308
5-10 years 18,882 14,280
48,889 41,803
The Company has provided letters of comfort in connection with banking facilities made available to certain of its subsidiaries. TheCompany provided letters to ATS and ATI confirming ongoing support for at least 12 months from the date the annual financial statementswere signed, to make sufficient funds available if needed to enable them to continue trading, meet commitments and not to seekrepayment of any amounts outstanding.
On 25 March 2011 the Company granted a floating charge of up to £30.0m over its listed investments to the Trustees of the Alliance TrustCompanies Pension Fund.

93 | Alliance Trust PLC Report & Accounts 2014
23 Financial instruments and Risk
The Strategic Report details the Company’s approach to investment risk management on pages 17 and 27 to 30 and the accountingpolicies on pages 73 to 78 explain the basis on which currencies and investments are valued for accounting purposes.
The Directors are of the opinion that the fair values of financial assets and liabilities of the Group are not materially different to their carryingvalues.
Capital Risk Management
The Group manages its capital to ensure that entities in the Group and the Company will be able to continue as a going concern whilemaximising the return to stakeholders through the optimisation of the use of debt and equity balances. The Group's and Company’s overallstrategy remains unchanged from the year ended 31 December 2013.
The capital structure of the Group and the Company consists of debt, which includes the borrowings disclosed in Note 15, cash and cashequivalents and equity attributable to equity holders of the Company comprising issued capital, reserves and retained earnings asdisclosed in Note 17 to the financial statements.
The Board reviews the capital structure of the Company and the Group on an at least semi-annual basis. The Group and the Companyhave decided that net gearing should at no time exceed 30% of the net assets of either the Group or the Company.
Group Company
£000 Dec 14
Restated
Dec 13 Dec 14 Dec 13
Debt (380,000) (380,000) (380,000) (380,000)
Cash and cash equivalents 44,102 27,225 40,685 25,236
Net (debt)/cash (335,898) (352,775) (339,315) (354,764)
Net (debt)/cash as % of net assets (11.1)% (12.2)% (11.2)% (12.3)%
Risk management policies and procedures
As an investment trust the Company invests in equities, investment property, private equity, financial instruments and its subsidiarybusinesses for the long term in order to achieve the investment objectives set out on page 61. In pursuing these objectives the Company isexposed to a variety of risks that could result in a reduction in the Company’s net assets or a reduction in the profits available for paymentas dividends.
The principal financial instruments at risk comprise those in the Company’s investment portfolio and this note addresses these risks below.The Group has certain additional risks, and these are detailed in the appropriate sections below.
These risks and the Directors’ approach to managing them are set out below under the following headings: market risk (comprisingcurrency risk, interest rate risk, and other price risk), credit risk, liquidity risk, and gearing risk.
The Group has a risk management framework in place which is described in detail on pages 27 to 30. The objectives, policies andprocesses for managing the risks, and the methods used to measure the risks have not changed from the previous accounting year.
23.1 Market Risk
Market risk embodies the potential for both losses and gains and includes currency risk (see note 23.2), interest rate risk (see note 23.3)and other price risk (see note 23.4). Market risk is managed on a regular basis by the Asset Allocation Committee. The purpose of thisexecutive committee is to manage the capital of the Company within parameters set by the Directors on investment and asset allocationstrategies and risk.
The Company’s strategy on investment risk is outlined in our statement of investment objectives and policy on page 61.
Details of the investment portfolio at the balance sheet date are disclosed on pages 10 to 15.
23.2 Currency Risk
Some of the Group’s assets, liabilities and transactions are denominated in currencies other than its functional currency of Sterling.Consequently the Group is exposed to the risk that movements in exchange rates may affect the Sterling value of those items.
The Group’s currency holdings and gains/losses thereon are reviewed regularly by the Directors, and the currency risk is managed on aregular basis by the Asset Allocation Committee within parameters set by the Directors on investment and asset allocation strategies andrisk. The Group enters into forward exchange contracts to cover specific foreign currency exposure.
The currency exposure for overseas investments is based on the quotation currency of each holding, while the currency exposure for netmonetary assets is based on the currency in which each asset or liability is denominated. At the reporting date the Group and Companyhad the following exposures:

94 | Alliance Trust PLC Report & Accounts 2014
23 Financial instruments and Risk
23.2 Currency Risk
Group and Company
Currency Exposure Restated
£000
Overseasinvestments
Dec 14
Net monetaryassets
Dec 14
Totalcurrencyexposure
Dec 14
Overseasinvestments
Dec 13
Net monetaryassets
Dec 13
Totalcurrencyexposure
Dec 13
US dollar 1,328,147 5,560 1,333,707 1,168,156 266 1,168,422
Euro 418,567 2,110 420,677 353,747 856 354,603
Yen 53,519 - 53,519 67,523 - 67,523
Other non-sterling 377,814 205 378,019 431,307 29 431,336
2,178,047 7,875 2,185,922 2,020,733 1,151 2,021,884
Sensitivity analysis
If Sterling had strengthened by 5% (5%) relative to all currencies, with all other variables held constant, the income statement and the netassets attributable to equity holders of the parent would have decreased by the amounts shown below. The analysis is performed on thesame basis for the year ended 31 December 2013. The revenue return impact is an estimated figure for 12 months based on the cashbalances at the reporting date.
Group Company
£000 Dec 14
Restated
Dec 13 Dec 14 Dec 13
Income Statement
Revenue return (2,688) (2,164) (2,688) (2,164)
Capital return (108,377) (101,037) (108,377) (101,037)
Net Assets (111,065) (103,201) (111,065) (103,201)
A 5% (5%) weakening of Sterling against the above currencies would have resulted in an equal and opposite effect on the above amounts,on the basis that all other variables remain constant.
23.3 Interest Rate Risk
The Group is exposed to interest rate risk in a number of ways. A movement in interest rates may affect the fair value of investments infixed interest rate securities, income receivable on cash deposits and interest payable on variable rate borrowings.
The Company finances part of its activities through borrowings at levels which are approved and monitored by the Board. The possibleeffects on fair value and cash flows as a result of an interest rate change are taken into account when making investment or borrowingdecisions.
The following table details the Group’s and Company’s exposure to interest rate risks for bank and loan balances:
Group Company
£000 Dec 14
Restated
Dec 13 Dec 14 Dec 13
Exposure to floating interest rates
Cash at bank 44,102 27,225 40,685 25,236
Bank loans repayable within one year (280,000) (380,000) (280,000) (380,000)
(235,898) (352,775) (239,315) (354,764)
Sensitivity analysis
If interest rates had decreased by 0.25% (0.25%), with all other variables held constant, the income statement result and the net assetsattributable to equity holders of the parent would have decreased by the amounts shown below. The revenue return impact is an estimatedfigure for the year based on the cash balances at the reporting date.
Group Company
£000 Dec 14
Restated
Dec 13 Dec 14 Dec 13
Income statement
Revenue return 266 250 274 255
Capital return 344 633 344 633
Net Assets 610 883 618 888

95 | Alliance Trust PLC Report & Accounts 2014
23 Financial instruments and Risk
23.3 Interest Rate Risk
If interest rates had increased by 0.25% (0.25%) with all other variables held constant, the income statement result and net assetsattributable to equity holders of the parent would have decreased by the amounts shown below.
Group Company
£000 Dec 14
Restated
Dec 13 Dec 14 Dec 13
Income statement
Revenue return (246) (249) (254) (254)
Capital return (344) (633) (344) (633)
(590) (882) (598) (887)
23.4 Other Price Risk
Other price risk is the risk that the value of a financial instrument will fluctuate as a result of changes in market prices (other than thosearising from currency risk or interest rate risk), whether caused by factors specific to an individual investment or its issuer, or by factorsaffecting all instruments traded in that market.
As the majority of the Group’s financial assets are carried at fair value with fair value changes recognised in the income statement, allchanges in market conditions will directly affect gains and losses on investments and net assets.
The Directors manage price risk by having a suitable investment objective for the Company. The Board reviews this objective andinvestment performance regularly. The risk is managed on a regular basis by the Asset Allocation Committee within parameters set by theDirectors on investment and asset allocation strategies and risk.
Concentration of exposure to other price risks
A listing of the Company’s equity investment portfolio is shown on pages 14 to 15. The largest amount of equity investments by value is inNorth America, with significant amounts also in Asia, Europe and the UK. It also shows the concentration of investments in various sectors.
The following table details the Group’s exposure to market price risk on its quoted and unquoted equity investments:
Group Company
£000 Dec 14
Restated
Dec 13 Dec 14 Dec 13
Investments at fair value through Profit & Loss
Listed 2,670,642 2,594,942 2,670,642 2,594,942
Foreign exchange contracts - (2,357) - (2,357)
Unlisted 59,873 47,241 59,873 47,241
Investments in Collective Investment Schemes 435,659 424,099 435,659 424,099
Investments in Related and Subsidiary Companies 172,658 150,461 172,736 150,536
Investment Property 4,830 4,525 4,830 4,525
3,343,662 3,218,911 3,343,740 3,218,986
The Company holds the investment property through a subsidiary Limited Partnership, ATREP LP.
Sensitivity analysis
92.9% (93.7%) of the Company’s investment portfolio is listed on stock exchanges. If share prices had decreased by 10% with all othervariables remaining constant, the income statement result and the net assets attributable to equity holders of the parent would havedecreased by the amounts shown below. The analysis for last year assumed a share price decrease of 10%.
Group Company
£000 Dec 14
Restated
Dec 13 Dec 14 Dec 13
Income statement
Revenue return - - - -
Capital return (310,630) (301,669) (310,630) (301,669)
Net Assets (310,630) (301,669) (310,630) (301,669)
A 10% increase (10% increase) in share prices would have resulted in a proportionate equal and opposite effect on the above amounts, onthe basis that all other variables remain constant.
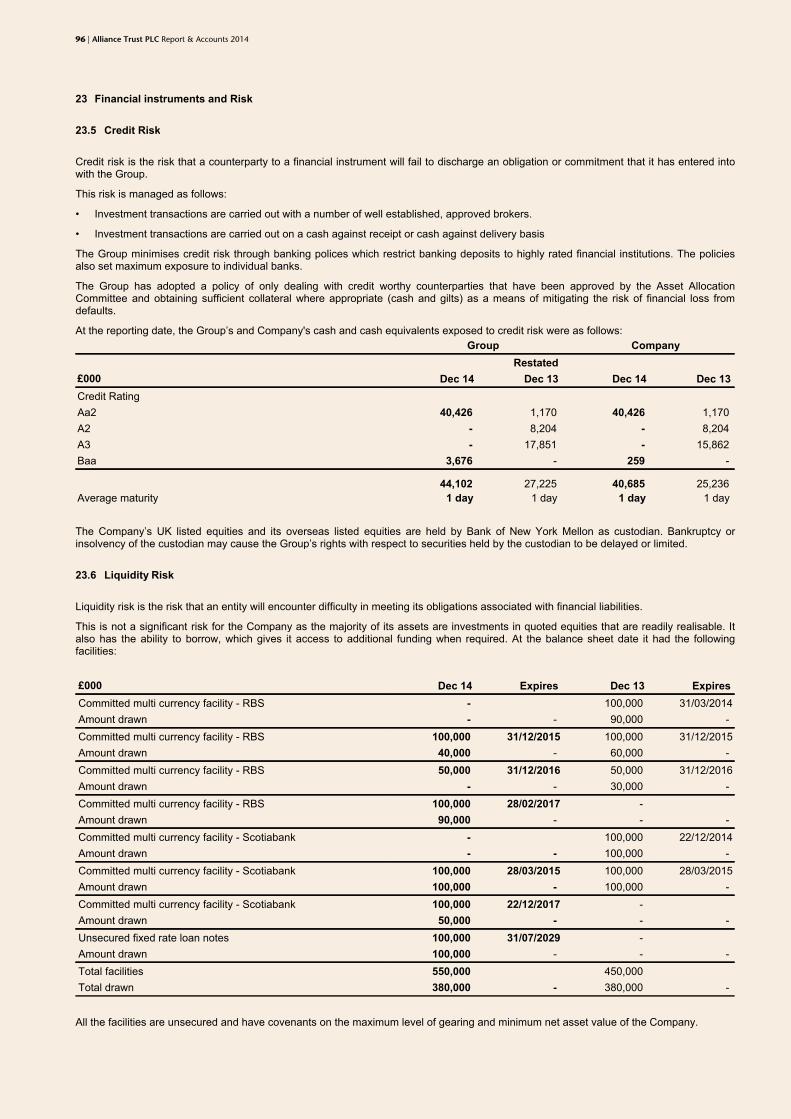
96 | Alliance Trust PLC Report & Accounts 2014
23 Financial instruments and Risk
23.5 Credit Risk
Credit risk is the risk that a counterparty to a financial instrument will fail to discharge an obligation or commitment that it has entered intowith the Group.
This risk is managed as follows:
• Investment transactions are carried out with a number of well established, approved brokers.
• Investment transactions are carried out on a cash against receipt or cash against delivery basis
The Group minimises credit risk through banking polices which restrict banking deposits to highly rated financial institutions. The policiesalso set maximum exposure to individual banks.
The Group has adopted a policy of only dealing with credit worthy counterparties that have been approved by the Asset AllocationCommittee and obtaining sufficient collateral where appropriate (cash and gilts) as a means of mitigating the risk of financial loss fromdefaults.
At the reporting date, the Group’s and Company's cash and cash equivalents exposed to credit risk were as follows:
Group Company
£000 Dec 14
Restated
Dec 13 Dec 14 Dec 13
Credit Rating
Aa2 40,426 1,170 40,426 1,170
A2 - 8,204 - 8,204
A3 - 17,851 - 15,862
Baa 3,676 - 259 -
44,102 27,225 40,685 25,236
Average maturity 1 day 1 day 1 day 1 day
The Company’s UK listed equities and its overseas listed equities are held by Bank of New York Mellon as custodian. Bankruptcy orinsolvency of the custodian may cause the Group’s rights with respect to securities held by the custodian to be delayed or limited.
23.6 Liquidity Risk
Liquidity risk is the risk that an entity will encounter difficulty in meeting its obligations associated with financial liabilities.
This is not a significant risk for the Company as the majority of its assets are investments in quoted equities that are readily realisable. Italso has the ability to borrow, which gives it access to additional funding when required. At the balance sheet date it had the followingfacilities:
£000 Dec 14 Expires Dec 13 Expires
Committed multi currency facility - RBS - 100,000 31/03/2014
Amount drawn - - 90,000 -
Committed multi currency facility - RBS 100,000 31/12/2015 100,000 31/12/2015
Amount drawn 40,000 - 60,000 -
Committed multi currency facility - RBS 50,000 31/12/2016 50,000 31/12/2016
Amount drawn - - 30,000 -
Committed multi currency facility - RBS 100,000 28/02/2017 -
Amount drawn 90,000 - - -
Committed multi currency facility - Scotiabank - 100,000 22/12/2014
Amount drawn - - 100,000 -
Committed multi currency facility - Scotiabank 100,000 28/03/2015 100,000 28/03/2015
Amount drawn 100,000 - 100,000 -
Committed multi currency facility - Scotiabank 100,000 22/12/2017 -
Amount drawn 50,000 - - -
Unsecured fixed rate loan notes 100,000 31/07/2029 -
Amount drawn 100,000 - - -
Total facilities 550,000 450,000
Total drawn 380,000 - 380,000 -
All the facilities are unsecured and have covenants on the maximum level of gearing and minimum net asset value of the Company.

97 | Alliance Trust PLC Report & Accounts 2014
23 Financial instruments and Risk
23.7 Gearing Risk
This is the risk that the movement in the fair value of the assets of the Company is amplified by any gearing that the Company may have.The exposure to this risk and the sensitivity analysis is detailed below.
Group Company
£000 Dec 14
Restated
Dec 13 Dec 14 Dec 13
Investments after gearing 3,343,662 3,218,911 3,343,740 3,218,986
Gearing (380,000) (380,000) (380,000) (380,000)
Investments before gearing 2,963,662 2,838,911 2,963,740 2,838,986
Sensitivity analysis
If net assets before gearing had decreased by 10%, with all other variables held constant, the income statement result and the net assetsattributable to equity holders of the parent would have further decreased by the amounts shown below. The analysis for last year assumeda net assets before gearing decrease of 10%.
Group Company
£000 Dec 14
Restated
Dec 13 Dec 14 Dec 13
Income Statement
Revenue return - - - -
Capital return (38,000) (38,000) (38,000) (38,000)
Net Assets (38,000) (38,000) (38,000) (38,000)
A 10% increase (10% increase) in net assets before gearing would have resulted in an equal and opposite effect on the above amounts, onthe basis that all other variables remain constant.
23.8 Hierarchical Valuation of Financial Instruments
The Group refines and modifies its valuation techniques as markets develop. While the Group believes its valuation techniques to beappropriate and consistent with other market participants, the use of different methodologies or assumptions could result in differentestimates of fair value at the balance sheet date. Financial instruments excludes the Investment Property.
The table below analyses financial instruments carried at fair value, by valuation method. The different levels have been defined as follows:
Level 1 Quoted prices (unadjusted) in active markets for identical assets or liabilities
Level 2 Inputs other than quoted prices included within level 1 that are observable for the asset or liability, either directly (that is, as prices) or indirectly (that is, derived from prices)
Level 3 Inputs for the asset or liability that are not based on observable market data (that is, unobservable inputs)
The following table analyses the fair value measurements for the Group's and Company's assets and liabilities measured by the level in thefair value hierarchy in which the fair value measurement is categorised at 31 December 2014. All fair value measurements disclosed arerecurring fair value measurements.
Group valuation hierarchy fair value through profit and loss
As at 31 December 2014
Restated
As at 31 December 2013
£000 Level 1 Level 2 Level 3 Total Level 1 Level 2 Level 3 Total
Listed investments 3,106,301 - - 3,106,301 3,019,041 - - 3,019,041
Foreign exchangecontracts - - - - - (2,357) - (2,357)
Unlisted investments
Private equity - - 137,679 137,679 - - 127,890 127,890
Alliance Trust Savings - - 31,573 31,573 - - 26,708 26,708
Alliance Trust Finance - - 8,865 8,865 - - 16,837 16,837
Alliance TrustInvestments - - 24,269 24,269 - - 12,780 12,780
Mineral rights - - 29,891 29,891 - - 13,192 13,192
Other - - 254 254 - - 295 295
3,106,301 - 232,531 3,338,832 3,019,041 (2,357) 197,702 3,214,386

98 | Alliance Trust PLC Report & Accounts 2014
23 Financial instruments and Risk
23.8 Hierarchical Valuation of Financial Instruments
Company valuation hierarchy fair value through profit and loss
As at 31 December 2014 As at 31 December 2013
£000 Level 1 Level 2 Level 3 Total Level 1 Level 2 Level 3 Total
Listed investments 3,106,301 - - 3,106,301 3,019,041 - - 3,019,041
Foreign exchangecontracts - - - - - (2,357) - (2,357)
Unlisted investments
Private equity - - 137,679 137,679 - - 127,890 127,890
Alliance Trust Savings - - 31,573 31,573 - - 26,708 26,708
Alliance Trust Finance - - 8,865 8,865 - - 16,837 16,837
Alliance TrustInvestments - - 24,269 24,269 - - 12,780 12,780
Mineral rights - - 29,891 29,891 - - 13,192 13,192
Other - - 332 332 - - 370 370
3,106,301 - 232,609 3,338,910 3,019,041 (2,357) 197,777 3,214,461
There have been no transfers of recurring measurements during the year between Levels 1, 2 and 3.
Fair Value Assets in Level 1
The quoted market price used for financial investments held by the Group is the current bid price. These investments are included withinLevel 1 and comprise equities, bonds and exchange traded derivatives.
Fair Value Assets in Level 2
The fair value of financial instruments that are not traded in an active market (for example, over-the-counter derivatives) is determined byusing valuation techniques. These valuation techniques maximise the use of observable market data where it is available and with minimalreliance on entity specific estimates.
Fair Value Assets in Level 3
Level 3 valuations are reviewed at least annually by the Valuation Committee who are assigned responsibility by the Board of Alliance TrustPLC. The Valuation Committee considers the appropriateness of the valuation models, inputs, using the various valuation methods inaccordance with the Group's valuation policy. The Committee will determine the appropriateness of any valuation of the underlying assets.
The following table shows the reconciliation from the beginning balances to the ending balances for fair value measurement in Level 3 ofthe fair value hierarchy.
£000 Group Company
Dec 14
Restated
Dec 13 Dec 14 Dec 13
Balance at 1 January 197,702 173,156 197,777 173,231
Net gain /(loss)from financial instruments at fair value through profit orloss 32,821 (3,959) 32,824 (3,959)
Purchases at cost 18,849 32,765 18,849 32,765
Sales proceeds (16,992) (3,577) (16,992) (3,577)
Realised gain/(loss)on sale 151 (683) 151 (683)
Balance at 31 December 232,531 197,702 232,609 197,777
Investments in subsidiary companies (Level 3) are valued in the Company’s accounts at £172.7m (£150.5m) being the Directors' estimateof their fair value, using the guidelines and methodologies on valuation published by the International Private Equity and Venture CapitalAssociation. This includes ATS at £31.6m (£26.7m), ATI at £24.3m (£12.8m) and ATF at £8.9m (£16.8m). This represents the Directors'view of the amount for which the subsidiaries could be exchanged between knowledgeable willing parties in an arm's length transaction.This does not assume that the underlying business is saleable at the reporting date or that the Company currently has any intention to sellthe subsidiary business in the future. The Directors have used several valuation methodologies as prescribed in the guidelines to arrive attheir best estimate of fair value including discounted cash flow calculations, revenue and earnings multiples and recent market transactionswhere available.

99 | Alliance Trust PLC Report & Accounts 2014
23 Financial instruments and Risk
23.8 Hierarchical Valuation of Financial Instruments
The following key assumptions are relevant to the fair valuation of our investment in our subsidiary companies, and are consistent with prioryears:
• Alliance Trust Savings - This is valued as a trading business. A discounted cash flow, revenue multiple and an earnings before interest tax depreciation and amortisation multiple approach have been adopted.
• Alliance Trust Investments - This is valued as a trading business. Given ATI has achieved positive net inflows for 3 years and its losses are reducing, it has in 2014 been valued as a trading business rather than a book of
business. Both a discounted cashflow and revenue multiple valuation approach have been adopted.
• Alliance Trust Finance - This is valued using the value of cash held by the entity.
The multiples applied in valuing our subsidiaries are derived from comparable companies sourced from market data.
Mineral rights are carried at fair value and are valued in the Company’s accounts at £29.9m (£13.2m) being the Directors' estimate of theirfair value, using the guidelines and methodologies on valuation published by the Oklahoma Tax Commission and for non-producingproperties, the Lierle US Price Report.
The table below details how an increase or decrease in the respective input variables would impact the valuation disclosed for the relevantLevel 3 assets.
£000
Investment
Fair Value
at Dec 14 Valuation Method Unobservable inputs Input
Input
sensitivity +/-
Change in
valuation +/-
Alliance Trust Savings 31,573 Average of discounted cash flow DCF Discount rate 15% 1% (1,000)/1000
methodology and comparable Revenue multiple 2.5 1 4,500/(4,500)
trading multiples. EBITDA multiple 11.6 1 900/(900)
Alliance Trust Investments 24,269 Average of discounted cash flow DCF Discount rate 15% 1% (1,400)/1,400
methodology and comparable Revenue multiple 2.6 1 4,600/(4,600)
trading multiples.
Mineral Rights 29,891 Oklahoma Tax Commission Revenue multiple - gas 7 1 2,000/(2,000)
multiples and Lierle US Price Revenue multiple - oil 4 1 1,200/(1,200)
report (for non-producing Revenue multiple - 4 1 1,800/(1,800)
properties). products/condensate
Average bonus 1.2 0.5 1,800/(1,800)
multiple non-producing
The change in valuation disclosed in the above table shows the direction an increase or decrease in the respective input variables wouldhave on the valuation result. For Alliance Trust Savings, an increase in the revenue and EBITDA multiple or a decrease in the discount ratewould lead to an increase in the estimated value. For Alliance Trust Investments, an increase in the revenue and a decrease in thediscount rate would lead to an increase in the estimated value. For Mineral rights, an increase in the revenue multiple and average bonusmultiple would lead to an increase in the estimated value.
Private equity investments, both fund-to-fund and direct included under Level 3, are valued in accordance with the International PrivateEquity and Venture Capital Valuation Guidelines issued in September 2009. Unlisted investments in private equity are stated at thevaluation as determined by the Valuation Committee based on information provided by the General Partner. The General Partner’s policy invaluing unlisted investments is to carry them at fair value. The General Partner will generally rely on the fund's investment manager’s fairvalue at the last reported period, rolled forward for any cashflows. However if the General Partner does not feel the manager is reflecting afair value they will select a valuation methodology that is most appropriate for the particular investments in that fund and generate a fairvalue. In those circumstances the General Partner believes the most appropriate methodologies to use to value the underlying investmentsin the portfolio are:
• Price of a recent investment
• Multiples
• Net assets
• Industry valuation benchmarks
An entity is not required to create quantitative information to comply with this disclosure requirement if quantitative unobservable inputs arenot developed by the entity when measuring fair value (for example, when an entity uses prices from prior transactions or third-party pricinginformation without adjustment). Alliance Trust PLC receives information from the General Partner on the underlying investments which issubsequently reviewed by the Valuation Committee. Where Alliance Trust PLC does not feel that the valuation is appropriate, anadjustment will be made.
Unsecured fixed rate loan notes are initially recognised at a carrying value equivalent to the proceeds received net of issue costsassociated with the borrowings. After initial recognition, unsecured fixed rate loan notes are subsequently measured at amortised costusing the effective interest rate method. The effective rate of interest is 4.30%.
No interrelationships between unobservable inputs used in the above valuations of Level 3 investments have been identified.

100 | Alliance Trust PLC Report & Accounts 2014
24 Share Based Payments
The Group operates two share based payment schemes:
All Employee Share Ownership Plan ('AESOP')
Employees may receive up to £3,000 of shares annually under the terms of the AESOP. This amount is pro rated for part time employees.Individuals receive these shares free of all restrictions after a period of 5 years. For the year ended 31 December 2014 awards of £2,000(£2,000) per person will be made. The maximum cost of all awards for the year will be £435,000 (£139,000). The charge to the incomestatement in the year was £462,000 (£104,000).The total costs for the AESOP for all staff will be borne by the Company for the year ended31 December 2014 as the award is based on key performance metrics and criteria relating to the Company. On this basis the AESOP costhas not been recharged to subsidiary companies.
Long Term Incentive Plan ('LTIP')
The LTIP is a discretionary plan for Executive Directors and senior managers. It comprises two elements: first it provides for the grant ofmatching awards based on the proportion of annual bonus applied by participants in the purchase of shares in the Company and held bythe Employee Benefit Trust; and second it provides for the grant of performance awards. Both awards, granted over shares in theCompany, vest either in full or in part at the end of the three year performance period subject to meeting pre-defined targets.
In the year ended 31 December 2014, participating employees applied a proportion of their annual cash bonuses for the year ended 31December 2013 to purchase 108,007 (106,557) shares of Alliance Trust PLC at a price of £4.55 (£4.34) per share. Matching awards of upto 296,695 (213,264) shares and performance awards of up to 705,417 (728,314) were granted.
Matching awards and performance awards made during the year were valued at £498,000 (£356,000) and £1,184,000 (£1,216,000)respectively.
The fair value of awards granted during the year was calculated using a binomial methodology. The assumptions used were a share priceof £4.49 (£4.30), share price volatility of 14% (16%) based on a long term average (3 year weekly average), dividend yield of 2.38%(2.47%), a risk free interest rate of 0.92% (0.22%) and forfeiture of Nil (Nil).
In addition to this, an extraordinary award was made in December 2014 to purchase 37,796 shares of Alliance Trust PLC at a price of£4.63. This award was made on the same terms as performance awards granted under LTIP. Based on the assumptions referred to in thepreceding paragraph, this award was valued at £65,000,
The cumulative charge to the income statement during the year for the cost of the LTIP awards referred to above was £793,000(£886,000). In addition, during the year a £55,000 debit (£167,000 debit) was recognised in the income statement in relation to equalisationof amounts carried forward from the prior year. These charges related to the Company only.
In accordance with IFRS 2 the costs of matching and performance awards for each plan are expensed over the three year performanceperiod.
These costs are only adjusted if certain vesting conditions are not met, for example if a participant leaves before the end of the three yearvesting period.
Movements in options
Movements in options granted under the LTIP are as follows:
Group
December 2014
Restated
Group
December 2013
£000Number of
optionsWeighted average
exercise priceNumber of
optionsWeighted average
exercise price
Outstanding at 1 January 3,083,341 £0.00 3,106,306 £0.00
Granted during year 1,039,908 £0.00 941,578 £0.00
Exercised during year (210,588) £0.00 (436,308) £0.00
Forfeited during year (255,572) £0.00 (29,432) £0.00
Expired during year (744,919) £0.00 (498,803) £0.00
Outstanding at 31 December 2,912,170 £0.00 3,083,341 £0.00
Exercisable at 31 December 98,726 £0.00 Nil £0.00
The weighted average remaining contractual life of the options outstanding at 31 December 2014 was 539 days (572 days).
The weighted average exercise price of the options is Nil (Nil) as any options which vest at the end of the performance period are satisfiedby shares held on behalf of the Company by the Trustee of the Employee Benefit Trust.
The 2013 opening balance has been updated to include individual matching awards totalling 61,990 which were made in 2010 and 2012.2,271 of these shares were exercised in 2013 and the remaining 59,719 will vest in 2015.

101 | Alliance Trust PLC Report & Accounts 2014
25 Pension Scheme
The Group sponsors two pension arrangements. The following disclosures apply to both the Group and the Company.
The Alliance Trust Companies’ Pension Fund (the ‘Scheme’) is a funded defined benefit pension scheme which was closed to futureaccrual on 2 April 2011.
Employees, other than Executive Directors, received contributions into their own Self Invested Personal Pension provided by ATS totaling£1.7m (£1.6m).
The disclosures which follow relate to the Scheme.
Participating Employer
ATSL is the sole Participating Employer and its pension obligations are guaranteed by the Company.
Valuation and Contributions
The last full actuarial valuation of the Scheme was carried out by a qualified independent actuary as at 1 April 2012 although for thepurpose of these calculations the results of the 1 April 2012 valuation have been updated on an approximate basis to 31 December 2014.Valuations are on the projected unit credit method.
The contribution made by the Company over the financial year was £1.5m (£1.5m).
Risks
The Scheme typically exposes the Group to risks such as:
- Investment risk: The Scheme holds some of its investments in asset classes, such as equities, which have volatile market values and,while these assets are expected to provide the best returns over the long term, any short-term volatility could cause additional funding to berequired if a deficit emerges.
- Interest rate risk: The Scheme's liabilities are assessed using market rates of interest to discount the liabilities and are therefore subject toany volatility in the movement of the market rate of interest. The net interest income or expense recognised in profit or loss is alsocalculated using the market rate of interest.
- Inflation risk: A significant proportion of the benefits under the Scheme are linked to inflation. Although the Fund's assets are expected toprovide a good hedge against inflation over the long term, movements over the short term could lead to a deficit emerging.
- Mortality risk: In the event that members live longer than assumed the liabilities may turn out to have been understated originally, and adeficit may emerge if funding has not been adequately provided for the increased life expectancy.
Reconciliation of opening and closing balances of the present value of the defined benefit obligation
£000 31 December 2014 31 December 2013
Defined benefit obligation at start of year 33,907 30,311
Interest 1,492 1,334
Actuarial gains 4,123 2,848
Benefits paid (739) (586)
Defined benefit obligation at end of year 38,783 33,907
The Group has no unfunded pension obligations.
Reconciliation of opening and closing balances of the fair value of plan assets
£000 31 December 2014 31 December 2013
Fair value of assets at start of year 38,986 34,616
Interest income 1,716 1,543
Actuarial gains 2,617 1,973
Contributions by employer 1,500 1,500
Benefits paid (739) (586)
Administration costs (100) (60)
Fair value of assets at end of year 43,980 38,986

102 | Alliance Trust PLC Report & Accounts 2014
25 Pension Scheme
Total credit recognised in the income statement
£000 31 December 2014 31 December 2013
Interest on Scheme liabilities 1,492 1,334
Interest Income (1,716) (1,543)
Operating cost 100 60
Total credit (124) (149)
Gains/(Losses) recognised in the statement of comprehensive income
£000 31 December 2014 31 December 2013
Difference between expected and actual return on the Scheme assets:
Amount 2,617 1,973
Percentage of Scheme assets 6% 5%
Experience gains/(losses) arising on the Scheme liabilities:
Amount 10 (41)
Percentage of present value of Scheme liabilities -% -%
Effects of changes in the financial assumptions underlying the present value ofthe Scheme liabilities:
Amount (4,446) (2,748)
Percentage of present value of Scheme liabilities 11% (8)%
Effects of changes in the demographic assumptions underlying the presentvalue of the Scheme liabilities:
Amount 313 (59)
Percentage of present value of Scheme liabilities 1% -%
Total amount recognised in statement of comprehensive income:
Amount (1,506) (875)
Percentage of present value of Scheme liabilities 4% (3)%
Assets
£000 31 December 2014 31 December 2013 31 December 2012
Equities 22,395 15,813 17,906
Bonds 21,251 21,983 16,474
Other 334 1,190 236
43,980 38,986 34,616
The assets are held independently of the assets of the Group in funds managed by ATI and Legal & General. None of the fair values of theassets shown above include any of the Group’s own financial instruments or any property occupied by, or other assets used by, the Group.
Actual return on the Scheme assets
The actual return on the Scheme assets over the year ended 31 December 2014 was a gain of 5% (gain of 2%).
Assumptions
% 31 December 2014 31 December 2013 31 December 2012
Retail Price Index Inflation 3.00 3.40 2.90
Consumer Price Index Inflation 2.10 2.50 2.40
Rate of discount 3.50 4.40 4.40
Allowance for pension in payment increases of RPI(subject to a maximum increase of 5% p.a.) 2.90 3.30 2.80
Allowance for revaluation of deferred pension of RPI(subject to a maximum increase of 5% p.a.) 2.10 2.50 2.40

103 | Alliance Trust PLC Report & Accounts 2014
25 Pension Scheme
Assets
Statutory revaluation has used the Consumer Price Index (CPI) for the last four years rather than the Retail Price Index (RPI) which waspreviously used.
We have assumed that the long term CPI assumption is 0.9% lower than the corresponding RPI assumption. The mortality assumptions,adopted at 31 December 2014, follow the S1PA table, using 90% of the base table with CMI_2013 mortality projections with improvementsubject to 1% minimum to the annual improvements. The assumptions imply the following life expectancy from age 65.
The weighted average duration of the defined benefit obligation is around 24 years.
Mortality assumptions
31 December 2014
Years
31 December 2013
Years
Male currently age 45 at 65 24.2 24.5
Female currently age 45 at 65 26.6 26.9
Male currently age 65 22.9 23.1
Female currently age 65 25.3 25.4
Sensitivities
An estimate of the sensitivities regarding the principal assumptions used to measure the Scheme’s liabilities are set out below.
Assumption Change in assumption
Increase
Estimated impact onscheme liabilities
(Decrease)/Increase
Change in assumption
Decrease
Estimated impact onscheme liabilities
Increase/(Decrease)
Discount rate 0.1% (£876,000) 0.1% £903,000
RPI 0.1% £581,000 0.1% (£569,000)
CPI 0.1% £328,000 0.1% (£324,000)
Age of member 1 year (£1,066,000) 1 year £1,054,000
£000 31 December 2014 31 December 2013 31 December 2012
Present value defined benefit obligation 38,783 33,907 30,311
Fair value of Scheme assets 43,980 38,986 34,616
Surplus in Scheme 5,197 5,079 4,305
The cumulative amount of actuarial gains and losses recognised in the statement of comprehensive income of the Company sinceadoption of IAS19 is a loss of £3.6m (£3.5m).
All actuarial gains and losses are recognised immediately.
Best estimate of contributions to be paid to scheme for the year ending 31 December 2015
The Scheme closed to accrual on 2 April 2011. The Company paid contributions in the year of £1.5m in line with the recovery plan andthese will be paid annually until 2016 and then, subject to company agreement, they will continue to be paid until 2026 as set out under theScheme's secondary funding objective.
Amounts for the current and previous years
£000 Dec 14 Dec 13 Dec 12 Dec 11 Jan 11
Fair value of assets 43,980 38,986 34,616 31,781 29,033
Defined benefit obligation 38,783 33,907 30,311 28,631 28,187
Surplus in Scheme 5,197 5,079 4,305 3,150 846
Experience adjustment on Scheme liabilities 10 (41) 546 (374) 409
Experience adjustment on Scheme assets 2,617 1,973 383 575 1,733
Effects of changes in the demographic and financialassumptions underlying present value of the Schemeliabilities (4,133) (2,807) (1,334) (968) 935

104 | Alliance Trust PLC Report & Accounts 2014
26 Operating lease commitments
As at 31 December 2014 the Group and Company had total future minimum lease payments under non cancellable operating leases asfollows:
31 December 2014
Restated
31 December 2013
Group
£000Land andbuildings Other
Land andbuildings Other
Lease commitments due
< 1 year - 6 280 35
Between 2-5 years 956 8 - 31
After 5 years 2,084 - - -
31 December 2014 31 December 2013
Company
£000Land andbuildings Other
Land andbuildings Other
Lease commitments due
Within 1 year - 1 280 -
Between 2-5 years 956 8 - 15
After 5 years 2,084 - - -
27 Finance lease commitments
As at 31 December 2014 the Group and Company had total future minimum lease payments under finance leases as follows:
31 December 2014
Group and Company
£000 Minimum lease paymentsPresent value of minimum
lease payments
Due within 1 year 110 1
Due in 2-5 years - -
110 1
Less finance charges allocated to the future periods 109
Present value of minimum lease payments 1

Alliance Trust PLC Report & Accounts 2014 | 105
IncorporationAlliance Trust PLC is incorporated in Scotland with the
registered number 1731.
The Company’s Register of Members is held at
Computershare Investor Services PLC, Leven House, 10 Lochside Place, Edinburgh Park, Edinburgh EH12 9DF
GeneralEnquiriesIf you have an enquiry about the Company, or wish to receive a
paper copy of our Annual Report, please contact the Company
Secretary at our registered office:
8 West Marketgait, Dundee DD1 1QN Tel: 01382 321000 Fax: 01382 321185 Email: [email protected]
For security and compliance monitoring purposes telephone
calls may be recorded.
Investor RelationsOur Director of Investor Relations can be contacted at our
registered office (detailed above).
Our website www.alliancetrust.co.uk contains information about
the Company, including daily share price and net asset value.
RegistrarsOur registrars are:
Computershare Investor Services PLC PO Box 82, The Pavilions, Bridgwater Road, Bristol BS99 7NH
Change of address notifications and registration enquiries for
shareholdings registered in your own name should be sent
to the Company’s registrars at the above address. You should
also contact the registrars if you would like the dividends on
shares registered in your own name to be sent to your bank
or building society account. You may check your holdings and
view other information about Alliance Trust shares registered in
your own name at www.computershare.com.
Data ProtectionThe Company is a data controller as defined under the
Data Protection Act 1998. Information received from or about
shareholders or investors (for example from a stockbroker),
whether by telephone or in writing, by fax or by any other
electronic or digital means of communication may be processed.
Information held on the Company’s Register of Members is,
by law, information to which the public may, for a proper
purpose, have access and the Company cannot prevent any
person inspecting it or having copies of it for such purpose, on
payment of the statutory fee.
Annual Report and Electronic CommunicationsWe only send paper Annual Reports to shareholders who
have asked us to do so. All shareholders receive notices of our
meetings and information on how to access our Annual Report.
Shareholders can opt to receive all notifications electronically by
going to www.alliancetrust.co.uk/ec.htm which will provide a
link to our registrars’ website.
TaxationIf you are in any doubt about your liability to tax arising
from a shareholding in the Company you should seek
professional advice.
Income TaxDividends paid by the Company carry a tax credit at 10% of the gross dividend. Dividends are paid net of the tax credit.
If you hold your shares in your own name, the tax voucher which you need for your tax records will be sent to the address we have for you on the register maintained by Computershare. The Registrar will send a consolidated tax voucher to members after the final dividend during the tax year is paid.
If your dividends are received by a nominee, such as your stockbroker’s nominee, you must contact that person for the tax voucher. If you invest in the Company through Alliance Trust Savings, it will automatically supply you with a consolidated income tax voucher for income received for you in the Investment Dealing Account.
Capital Gains TaxFor investors who purchased shares prior to 31 March 1982, the cost of those shares for capital gains tax purposes is deemed to be the price of the share on that date. The market value of each Alliance Trust PLC ordinary 25p share on that date was £2.85 which, when adjusted for the split on a 10 for 1 basis on 21 June 2006, gives an equivalent value of £0.285 per share. The market value of each Second Alliance Trust PLC ordinary 25p share on 31 March 1982 was £2.35. Holders of Second Alliance Trust PLC shares received 8.7453 ordinary 2.5p shares for each 25p ordinary share they held on 20 June 2006 and are treated as though they acquired these shares at the same time and at the same cost as the Second Alliance Trust shares they previously
held. This gives an equivalent value of £0.269 per share.
Information for shareholders

106 | Alliance Trust PLC Report & Accounts 2014
Share investmentAlliance Trust PLC invests primarily in equities and fixed income
and aims to generate capital growth and a progressively rising
dividend from its portfolio of investments.
Alliance Trust currently conducts its affairs so that its shares
can be recommended by IFAs to ordinary retail investors in
accordance with the FCA’s rules in relation to non-mainstream
investment products and intends to continue to do so for the
foreseeable future.
The shares are excluded from the FCA’s restrictions which apply
to non-mainstream investment products because they are
shares in an investment trust.
The shares in Alliance Trust may also be suitable for institutional
investors who seek a combination of capital and income return.
Private investors should consider consulting an independent
financial adviser who specialises in advising on the acquisition of
shares and other securities before acquiring shares.
Investors should be capable of evaluating the risks and merits of
such an investment and should have sufficient resources to bear
any loss that may result.
RisksIf you wish to acquire shares in the Company, you should take
professional advice as to whether an investment in our shares is
suitable for you. You should be aware that:
• Investmentshouldbemadeforthelongterm.
• Thepriceofasharewillbeaffectedbythesupplyand
demand for it and may not fully represent the underlying
value of the assets of the Company. The price generally
stands below the net asset value of the Company (‘at a
discount’) but it may also stand above it (‘at a premium’).
Your capital return will depend upon the movement of the
discount/premium over the period you own the share, as well
as the capital performance of the Company’s own assets.
• TheassetsownedbytheCompanymayhaveexposure
to currencies other than Sterling. Changes in market
movements and in rates of exchange may cause the value
of your investment to go up or down.
• Pastperformanceisnotaguidetothefuture.Whatyouget
back will depend on investment performance. You may not
get back the amount you invest.
Bogus telephone callsWe have become aware of a numbers of telephone calls being
made to shareholders wherein the caller offers to buy the
recipient’s shares at a price significantly above the current
market price. We suspect that these calls are bogus and to that
end we have alerted the Financial Conduct Authority (FCA)
of the names of the companies involved. We are prohibited
from advising shareholders on whether to buy or to sell shares
in Alliance Trust PLC, but recommend that if you wish to sell
your shares you only deal with a financial services firm that is
authorised by the FCA.
Annual General MeetingThe 127th Annual General Meeting of the Company will be
held at 11.00am on Wednesday 29 April 2015 at the Gardyne
Theatre, Dundee and Angus College, Gardyne Road, Dundee
DD5 1NY. The Notice of Meeting, detailing the business of the
meeting, is sent to all shareholders.
FinancialcalendarProposed dividend payment dates for the financial year to
31 December 2015 are on or around:
• 30June2015(includingspecialdividend)
• 30September2015
• 31December2015
• 31March2016
• 30June2016
Investor forumsWe are pleased to announce that we will be holding two
investor presentations during 2015:
Details of these and future events can be found at
http://investor.alliancetrust.co.uk/ati/investorrelations/agm.htm
and
http://investor.alliancetrust.co.uk/ati/investorrelations/investor-
forum.htm
Date Venue
Wednesday
29 April 2015
Gardyne Theatre, Dundee, following
the Annual General Meeting
Tuesday
29 September 2015
Pullman London St Pancras, Euston
Road, London

Alliance Trust PLC Report & Accounts 2014 | 107
Company Financial Performance
A nine year record of the Company’s Financial Performance is provided below. Prior to the financial year ended 31 January 2007
there were two trusts, The Alliance Trust and The Second Alliance Trust, and the figures are therefore not directly comparable. This
explains why we have only shown a nine year record. From 2015, we will display a 10 year record.
Nine year record
Assets £m As at31 Jan
200731 Jan
200831 Jan
200931 Jan
201031 Jan
201131 Dec
201131 Dec
201231 Dec
201331 Dec
2014
Total assets 2,844 2,894 2,211 2,704 3,268 2,676 2,702 3,478 3,415
Loans 0 (159) (50) (160) (339) (249) (200) (380) (380)
Net assets 2,832 2,699 2,123 2,513 2,895 2,400 2,491 2,886 3,019
Net asset value (p)
NAV per share 421.5 402.3 316.8 377.7 439.0 405.8 444.9 516.5 546.8
NAV return on 100p – 9 years* 153.2
Share price (p)
Mid-market price per share 365.5 338.0 268.0 313.0 364.0 342.8 375.3 450.1 478.9
Share price High 380.7 386.2 353.7 337.0 377.9 392.7 383.5 464.2 481.1
Share price Low 316.2 321.2 218.0 233.0 293.5 310.2 337.0 375.3 426.0
Total shareholder return on 100p – 9 years* 160.0
Gearing/net cash (%)
Gearing - 5 - 5 11 7 7 12 11
Net cash 7 - 11 - - - - - -
Year ended 31 January 11 mths Year ended 31 December
Revenue 2007 2008 2009 2010 2011to 31 Dec
2011 2012 2013 2014
Profit after tax £52.5m £61.5m £69.5m £61.1m £63.8m £61.9m £55.6m £60.6m £68.8m
Earnings per share# 8.66p 9.17p 10.37p 9.14p 9.67p 9.87p 9.74p 10.83p 12.38p
Dividends per share 7.575p 7.90p 8.00p 8.15p 8.395p 9.00p 9.27p 9.55p 9.83p
Special Dividend - - 0.50p - - - 0.36p 1.28p 2.546p
Performance (rebased at 31 Jan 2007) As at
31 Jan 2007
31 Jan 2008
31 Jan 2009
31 Jan 2010
31 Jan 2011
31 Dec 2011
31 Dec 2012
31 Dec 2013
31 Dec 2014
NAV per share 100 95 75 90 104 96 106 123 130
Mid-market price per share 100 92 73 86 100 94 103 123 131
Earnings per share 100 106 120 106 112 117 112 125 143
Dividends per share (excluding special) 100 104 106 108 111 119 122 126 130
Year ended 31 January 11 mths Year ended 31 December Cost of running the Company 2007 2008 2009 2010 2011
31 Dec 2011 2012 2013 2014
Administrative Expenses £10.1m £15.0m £16.8m £16.0m £17.0m £16.0m £18.7m £21.5m £20.8m
Ongoing charges (excluding capital incentives***) 0.36% 0.42% 0.60% 0.64% 0.53% 0.56%** 0.67% 0.75% 0.60%
Capital incentives 0.02% 0.03% 0.07% 0.05% 0.07% 0.04% 0.04% 0.05% 0.04%
Ongoing charges (including capital incentives***) 0.38% 0.45% 0.67% 0.69% 0.60% 0.60%** 0.71% 0.80% 0.64%
* Source: Morningstar UK Ltd
# 2007 is not adjusted for Second Alliance Trust income prior to merger in June 2006
** Administrative expenses have been annualised given the financial reporting period was for 11 months, except for incentives which were on an actual basis
*** The AIC’s recommended methodology for the calculation of an Ongoing Charges figure states that for self-managed companies costs relating to compensation schemes which are linked directly to investment performance should be excluded from the calculation of the principal Ongoing Charges figure.

Alliance Trust PLC 8 West Marketgait Dundee DD1 1QN
Tel +44 (0)1382 321000 Email [email protected]
www.alliancetrust.co.uk
Contact